charts inflation report 2/06. 1 monetary policy assessments and strategy
TRANSCRIPT

ChartsInflation Report 2/06
1 Monetary policy assessments and strategy

Chart 1.1 CPI and indicators of underlying inflation. 12-month change. Per cent. Jan 02 – May 06
-2
0
2
4
6
2002 2003 2004 2005 2006-2
0
2
4
6
Weighted median1)
CPI-ATE3)
Trimmed mean2)
1) Estimated on the basis of 146 sub-groups of the CPI. 2) Price changes accounting for 20% of the weighting base are eliminated. 3) CPI-ATE: CPI adjusted for tax changes and excluding energy products. A further adjustment is made for the estimated effect of reduced maximum day-care rates from January 2006.
Sources: Statistics Norway and Norges Bank
CPI
-2
0
2
4
6
2002 2003 2004 2005 2006-2
0
2
4
6
Highest indicator
Lowest indicator
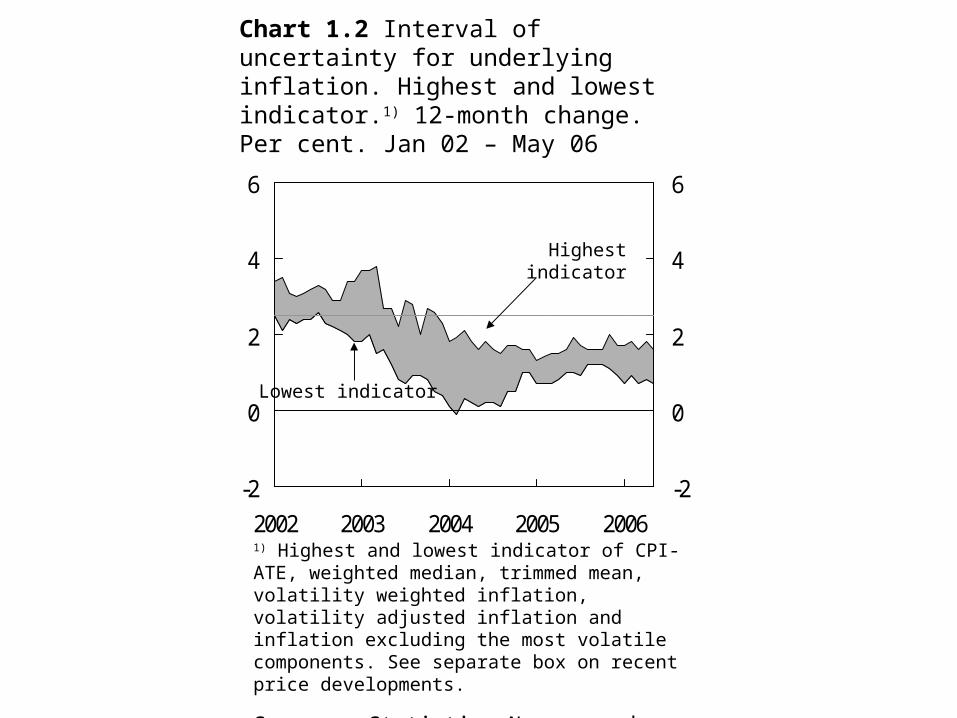
Chart 1.2 Interval of uncertainty for underlying inflation. Highest and lowest indicator.1) 12-month change. Per cent. Jan 02 – May 06
1) Highest and lowest indicator of CPI-ATE, weighted median, trimmed mean, volatility weighted inflation, volatility adjusted inflation and inflation excluding the most volatile components. See separate box on recent price developments.
Sources: Statistics Norway and Norges Bank

Chart 1.3 3-month real interest rate1) and the neutral real interest rate in Norway. Per cent. Quarterly figures. 96 Q1 – 06 Q2
0
1
2
3
4
5
6
1996 1998 2000 2002 2004 20060
1
2
3
4
5
6
Interval for neutral real interest rate
Real interest rate
1) 3-month money market rate deflated by inflation measured by CPI-ATE.
Source: Norges Bank

Chart 1.4 CPI. Moving 10-year average1) and variation2). Per cent. Annual figures. 1980 – 20053)
0
2
4
6
8
10
12
14
1980 1985 1990 1995 2000 20050
2
4
6
8
10
12
14
CPI
Inflation target
1) The moving average is calculated 7 years back and 2 years ahead. 2) The band around the CPI is the variation in the average period, measured by +/- one standard deviation.3) Projections for 2006 – 2007 in this Report form the basis for this estimate.
Sources: Statistics Norway and Norges Bank

Chart 1.5a The sight deposit rate in the baseline scenario with fan chart. Per cent. Quarterly figures. 04 Q1 – 09 Q4
0
1
2
3
4
5
6
7
8
2004 2005 2006 2007 2008 20090
1
2
3
4
5
6
7
830% 50% 70% 90%
Source: Norges Bank

Chart 1.5b Import-weighted exchange rate (I-44)1) in the baseline scenario with fan chart. Quarterly figures. 04 Q1 – 09 Q4
70
80
90
100
110
2004 2005 2006 2007 2008 200970
80
90
100
11030% 50% 70% 90%
1) A rising curve denotes a weaker krone exchange rate. It is assumed that strengthening by a certain percentage is just as likely as weakening by the same percentage.
Source: Norges Bank

Chart 1.5c Projected CPI-ATE1) in the baseline scenario with fan chart. 4-quarter change. Per cent. 04 Q1 – 09 Q4
0
1
2
3
4
2004 2005 2006 2007 2008 20090
1
2
3
430% 50% 70% 90%
1) CPI-ATE: CPI adjusted for tax changes and excluding energy products. A further adjustment is made for the estimated effect of reduced maximum day-care rates from January 2006. Other measures of underlying inflation are shown in Chart 1.1.
Sources: Statistics Norway and Norges Bank

-2
-1
0
1
2
3
2004 2005 2006 2007 2008 2009-2
-1
0
1
2
3
Chart 1.5d Estimated output gap in the baseline scenario with fan chart1). Per cent. Quarterly figures. 04 Q1 – 09 Q4
30% 50% 70% 90%
1) Uncertainty surrounding the current situation is not taken into account in the calculation. See box in Inflation report 3/05.
Source: Norges Bank

Chart 1.5e Projected CPI in the baseline scenario with fan chart. 4-quarter change. Per cent. 04 Q1 – 09 Q4
0
1
2
3
4
2004 2005 2006 2007 2008 20090
1
2
3
430% 50% 70% 90%
Sources: Statistics Norway and Norges Bank
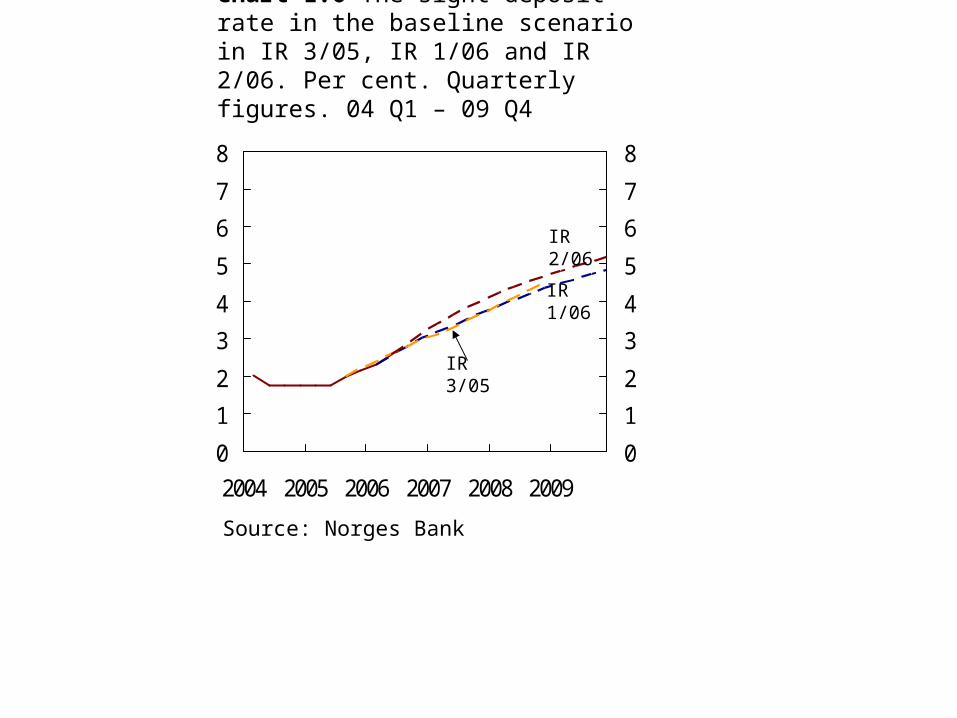
Chart 1.6 The sight deposit rate in the baseline scenario in IR 3/05, IR 1/06 and IR 2/06. Per cent. Quarterly figures. 04 Q1 – 09 Q4
0
1
2
3
4
5
6
7
8
2004 2005 2006 2007 2008 20090
1
2
3
4
5
6
7
8
Source: Norges Bank
IR 1/06
IR 2/06
IR 3/05
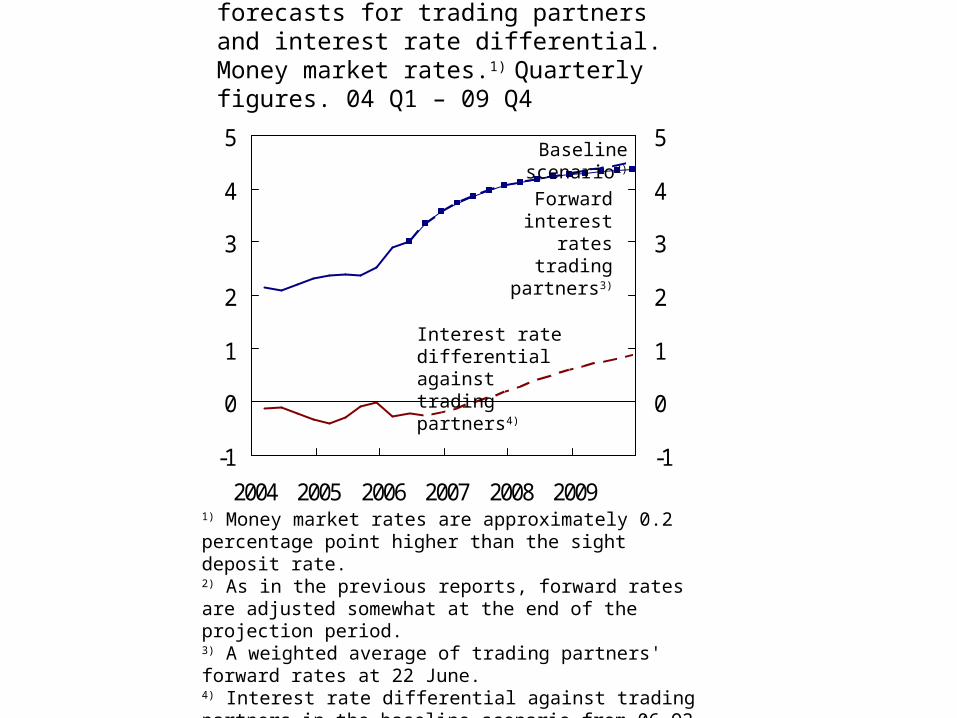
Chart 1.7 Interest rate forecasts for trading partners and interest rate differential. Money market rates.1)
Quarterly figures. 04 Q1 – 09 Q4
-1
0
1
2
3
4
5
2004 2005 2006 2007 2008 2009-1
0
1
2
3
4
5
1) Money market rates are approximately 0.2 percentage point higher than the sight deposit rate. 2) As in the previous reports, forward rates are adjusted somewhat at the end of the projection period.3) A weighted average of trading partners' forward rates at 22 June.4) Interest rate differential against trading partners in the baseline scenario from 06 Q2 (broken line). Source: Norges Bank
Interest rate differential against trading partners4)
Baseline scenario2)
Forward interest rates trading
partners3)

0
2
4
6
8
10
12
1987 1991 1995 1999 2003 2007100
120
140
160
180
200
220
240
Chart 1.8 Projections of household interest burden1)
and debt burden2). Per cent. Annual figures. 1987 - 2009
Debt burden (right-hand scale)
Interest burden (left-hand scale)
1) Interest expenses after tax as a percentage of disposable income less estimated reinvested dividends, less return on insurance claims and plus interest expenses.2) Loan debt as a percentage of disposable income less estimated reinvested dividends, less return on insurance claims.
Sources: Statistics Norway and Norges Bank

Chart 1.9 Projected CPI-ATE1) and output gap in the baseline scenario. Quarterly figures. Per cent. 04 Q1 – 09 Q4
-2
-1
0
1
2
3
-2
-1
0
1
2
3
2004 2005 2006 2007 2008 2009
CPI-ATE
Output gap
1) CPI-ATE: CPI adjusted for tax changes and excluding energy products. A further adjustment is made for the estimated effect of reduced maximum day-care rates from January 2006.
Sources: Statistics Norway and Norges Bank

Chart 1.10 Expected consumer price inflation 2 years ahead. Employee/employer organisations and experts1) . Per cent. Quarterly figures. 02 Q2 – 06 Q2
0
1
2
3
4
Jun-02 Jun-03 Jun-04 Jun-05 Jun-060
1
2
3
4
1) Employees in financial industry, macroanalysts and academics.
Source: TNS Gallup
Experts (red line)
Employer organisations (blue line)
Employee organisations (yellow line)

Chart 1.11a Sight deposit rate in the baseline scenario and in the alternatives with lower (yellow line) and higher (red line) inflation. Per cent. Quarterly figures. 04 Q1 – 09 Q4
0
1
2
3
4
5
6
7
8
2004 2005 2006 2007 2008 20090
1
2
3
4
5
6
7
830% 50% 70% 90%
Source: Norges Bank
Higher inflation
Lower inflation

Chart 1.11b Projected CPI-ATE1) in the baseline scenario and in the alternatives with lower (yellow line) and higher (red line) inflation. 4-quarter change. Per cent. 04 Q1 – 09 Q4
0
1
2
3
4
2004 2005 2006 2007 2008 20090
1
2
3
430% 50% 70% 90%
1) CPI-ATE: CPI adjusted for tax changes and excluding energy products. A further adjustment is made for the estimated effect of reduced maximum day-care rates from January 2006.
Sources: Statistics Norway and Norges Bank
Higher inflation
Lower inflation
-2
-1
0
1
2
3
2004 2005 2006 2007 2008 2009-2
-1
0
1
2
3
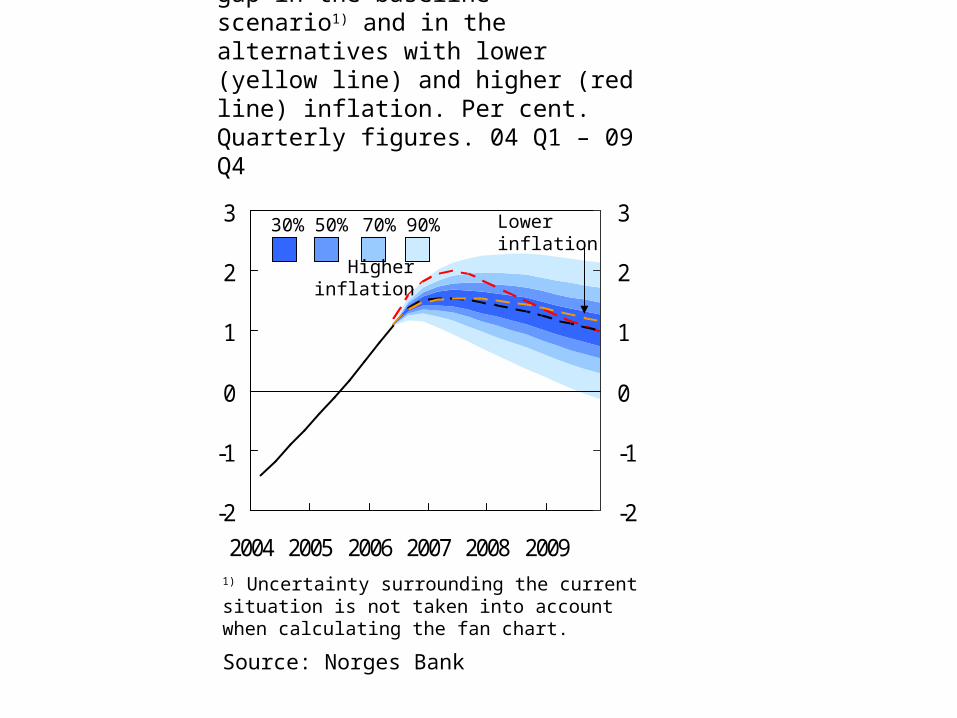
Chart 1.11c Estimated output gap in the baseline scenario1) and in the alternatives with lower (yellow line) and higher (red line) inflation. Per cent. Quarterly figures. 04 Q1 – 09 Q4
30% 50% 70% 90%
1) Uncertainty surrounding the current situation is not taken into account when calculating the fan chart.
Source: Norges Bank
Higher inflation
Lower inflation
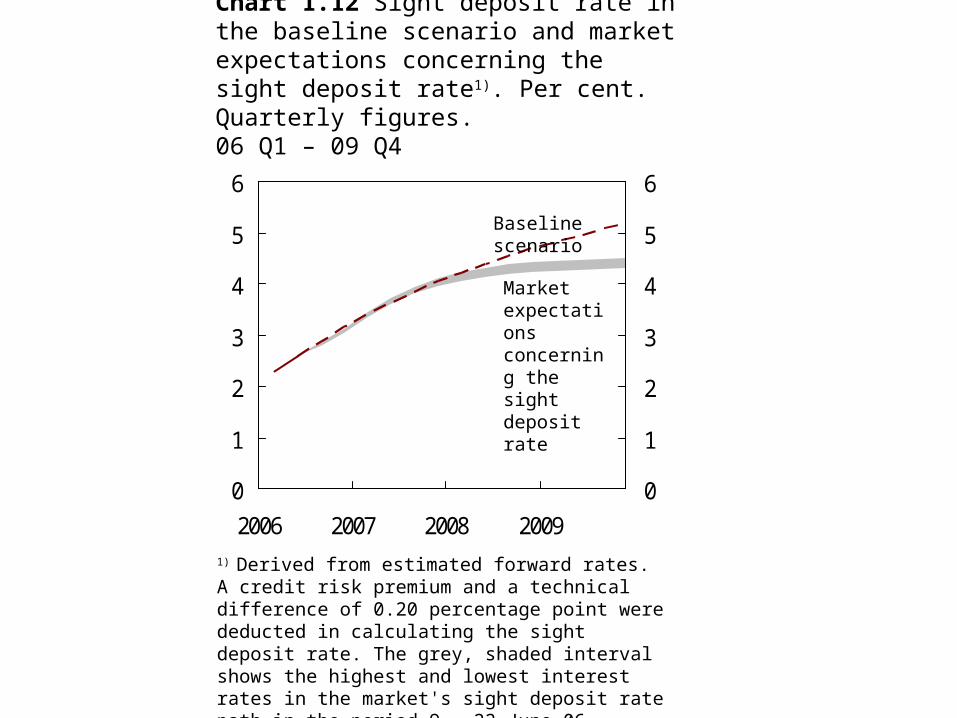
Chart 1.12 Sight deposit rate in the baseline scenario and market expectations concerning the sight deposit rate1). Per cent. Quarterly figures. 06 Q1 – 09 Q4
0
1
2
3
4
5
6
2006 2007 2008 20090
1
2
3
4
5
6
Baseline scenario
1) Derived from estimated forward rates. A credit risk premium and a technical difference of 0.20 percentage point were deducted in calculating the sight deposit rate. The grey, shaded interval shows the highest and lowest interest rates in the market's sight deposit rate path in the period 9 – 22 June 06.
Source: Norges Bank
Market expectations concerning the sight deposit rate

Chart 1.13 Sight deposit rate, Taylor rule, growth rule and rule with external real interest rates. Per cent. Quarterly figures. 00 Q1 – 06 Q2
0
2
4
6
8
2000 2001 2002 2003 2004 2005 20060
2
4
6
8Taylor rate (blue line)
Sight deposit rate (red line)
Growth rule(yellow line)
Source: Norges Bank
Rule with external interest rates
(green line)
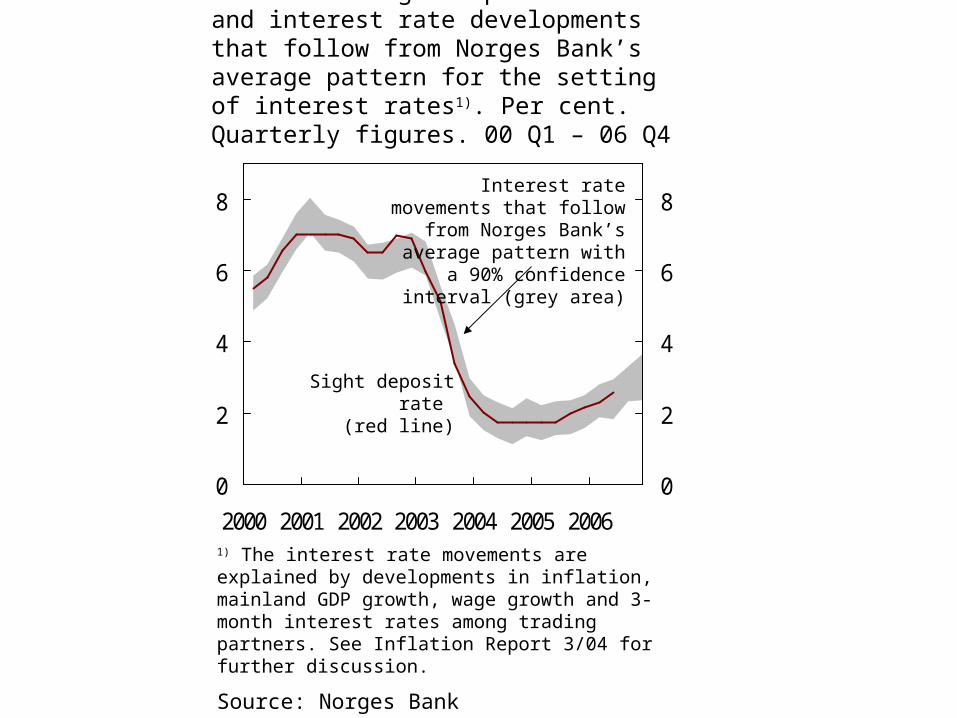
Chart 1.14 Sight deposit rate and interest rate developments that follow from Norges Bank’s average pattern for the setting of interest rates1). Per cent. Quarterly figures. 00 Q1 – 06 Q4
0
2
4
6
8
2000 2001 2002 2003 2004 2005 20060
2
4
6
8
1) The interest rate movements are explained by developments in inflation, mainland GDP growth, wage growth and 3-month interest rates among trading partners. See Inflation Report 3/04 for further discussion.
Source: Norges Bank
Interest rate movements that follow from Norges Bank’s average
pattern with a 90% confidence interval (grey area)
Sight deposit rate (red line)

0
2
4
6
8
2003 2004 2005 20060
2
4
6
8
Chart 1 Interval for the sight deposit rate at the end of each strategy period and actual developments. Daily figures. Per cent. 1 Jan 03 – 22 Jun 06
1/03
Sight deposit rate
2/03
3/031/04
Strategy period
2/04 1/053/04
Source: Norges Bank
3/02
2/05 3/051/06

2 International conditions
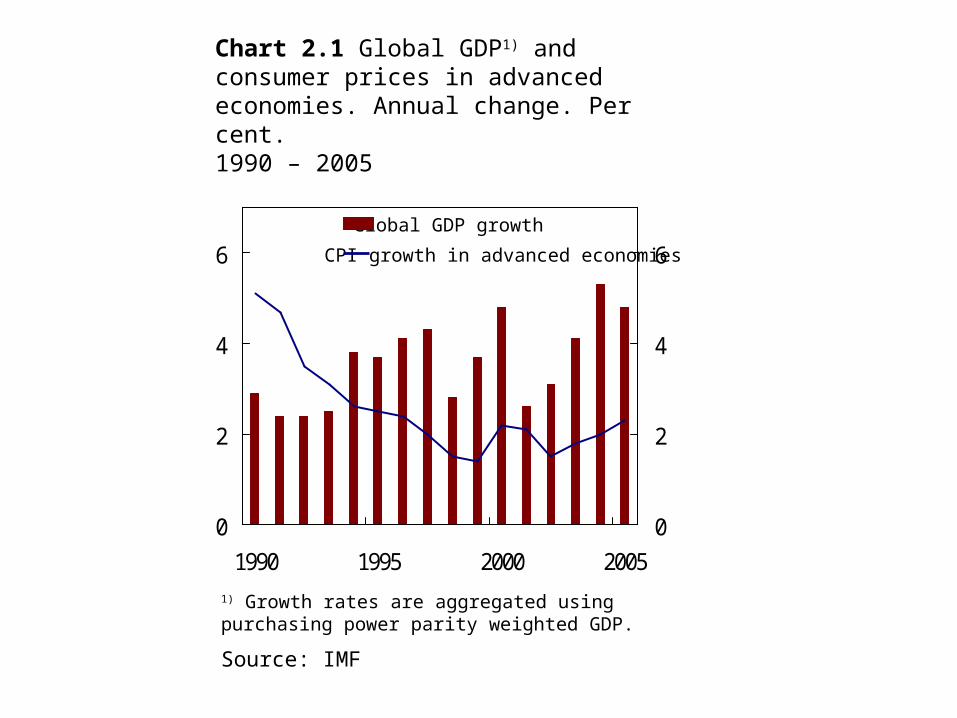
Chart 2.1 Global GDP1) and consumer prices in advanced economies. Annual change. Per cent. 1990 – 2005
0
2
4
6
1990 1995 2000 20050
2
4
6
1) Growth rates are aggregated using purchasing power parity weighted GDP.
Source: IMF
Global GDP growth
CPI growth in advanced economies

Chart 2.2 International trade1) as a share of GDP. 5-year moving average. Annual figures. 1970 – 2005
0
20
40
60
1970 1980 1990 20000
20
40
60
1) Sum of imports and exports.
Source: IMF
Emerging economies
Industrial countries

Chart 2.3 GDP growth in the US, the euro area and Japan. Seasonally adjusted quarterly growth. Volume. Per cent. 03 Q1– 06 Q1
-2
-1
0
1
2
3
2003 2004 2005 2006-2
-1
0
1
2
3
US
Euro area
Sources: EcoWin and Norges Bank
Japan

20
30
40
50
60
70
1995 1998 2001 2004-30
-20
-10
0
10
20
Chart 2.4 Business sentiment indicators for manufacturing. Seasonally adjusted diffusion indices. Monthly figures. Jan 95 – May 06
Euro area,(right-hand scale)
Source: EcoWin
US, (left-hand scale)
Japan, (left-hand scale)
Germany, (right-hand scale)

Chart 2.5 Commodity prices and inflation. Commodity price index 2000 = 100. 12-month change in CPI. Per cent. Monthly figures. Jan 89 – May 06
0
2
4
6
1989 1992 1995 1998 2001 200480
110
140
170
The Economist’s commodity price index, (right-hand scale)
CPI growth in OECD countries, excl. high inflation countries1), (left-hand scale)
1) Excluded countries are Turkey, Czech Republic, Hungary andSouth Korea.
Sources: EcoWin, OECD and Norges Bank

Chart 2.6 Core inflation.1) 12-month change. Per cent. Jan 02 – Apr 06
0
1
2
3
2002 2003 2004 2005 20060
1
2
3
US
Sweden
Euro area
UK
1) US: CPI excl. food and energy. Euro area, UK and Sweden: CPI excl. energy, food, alcohol and tobacco.
Sources: EcoWin and Norges Bank

Chart 2.7 House prices in the US.Median price in USD. 12-month change. Jan 03 – Apr 06
-5
0
5
10
15
20
2003 2004 2005 2006-5
0
5
10
15
20
Sources: EcoWin and Norges Bank
Existing homes
New homes

0
100
200
300
400
500
2001 2002 2003 2004 2005 20060
100
200
300
400
500
Copper
Zinc
Sources: EcoWin and Norges Bank
Chart 2.8 Spot metal prices in USD. Indices, Week 1 2001 = 100. Weekly figures. Week 1 2001 – week 25 2006
Nickel
Aluminium

80
100
120
140
160
180
Jan 06 Mar 06 May 06 Jul 0680
100
120
140
160
180
Fresh farmed salmon, Norwegian
Aluminium
Sources: EcoWin and Norges Bank
Chart 2.9 Commodity prices in USD. Indices, 2 Jan 06 = 100. Daily and weekly figures. 2 Jan 06 – 22 Jun 06
The Economist’s commodity price index for metal industrials
Nickel
Brent Blend

Chart 2.10 Price index1) for export of non-ferrous metals2) from Norway in USD and NOK. 2001 = 100. Quarterly figures. 01 Q1 – 06 Q23)
50
100
150
200
250
2001 2002 2003 2004 2005 200650
100
150
200
250
USD
NOK
1) Norges Bank’s estimates are based on the world market prices. 2) Aluminium, nickel, copper and zinc.3) Projections for 2006 Q2 are based on information in the period to 22 June.
Sources: EcoWin, Statistics Norway and Norges Bank

Chart 2.11 Oil price (Brent Blend) in USD per barrel. Daily figures. 2 Jan 03 – 22 Jun 06. Futures prices from 10 Mar and 22 Jun 06. Monthly figures. Apr 06 – Dec 08
20
40
60
80
2003 2004 2005 2006 2007 200820
40
60
8022 June 06
Sources: EcoWin, Reuters and Norges Bank
10 March 06 (IR 1/06)

Chart 2.12 Petrol stocks in the US. In million barrels. Weekly figures. Week 1 2003 – week 24 2006
180
190
200
210
220
230
Jan Mar May Jul Sep Nov180
190
200
210
220
230
2006
Source: Energy Information Administration (EIA)
2005
2004
2003

Chart 2.13 Crude oil prices (Brent Blend) and prices for Norwegian natural gas exports. USD per barrel oil-equivalent. Monthly figures. Jan 03 – Jun 061)
0
20
40
60
80
2003 2004 2005 20060
20
40
60
80
Oil
Natural gas, average of Statoil and Hydro
1) The oil price in June is the average price up to and including 22.
Sources: Reuters, Statoil, Hydro and Norges Bank

0
2
4
6
2004 2005 2006 2007 2008 20090
2
4
6
Chart 2.14 Interest rate expectations. Actual developments and expected key rates on 10 Mar and 22 Jun 06.1) Daily and quarterly figures. 1 Jan 04 – 1 Jan 10
Norway
Sweden
UK
Euro area
USA
1) Broken lines show expectations on 22 June 2006. Dotted lines show expectations on 10 March 2006. Expectations are based on interest rates in the money market and interest rate swaps.
Sources: Reuters and Norges Bank
3
4
5
Jan 06 Mar 06 May 063
4
5
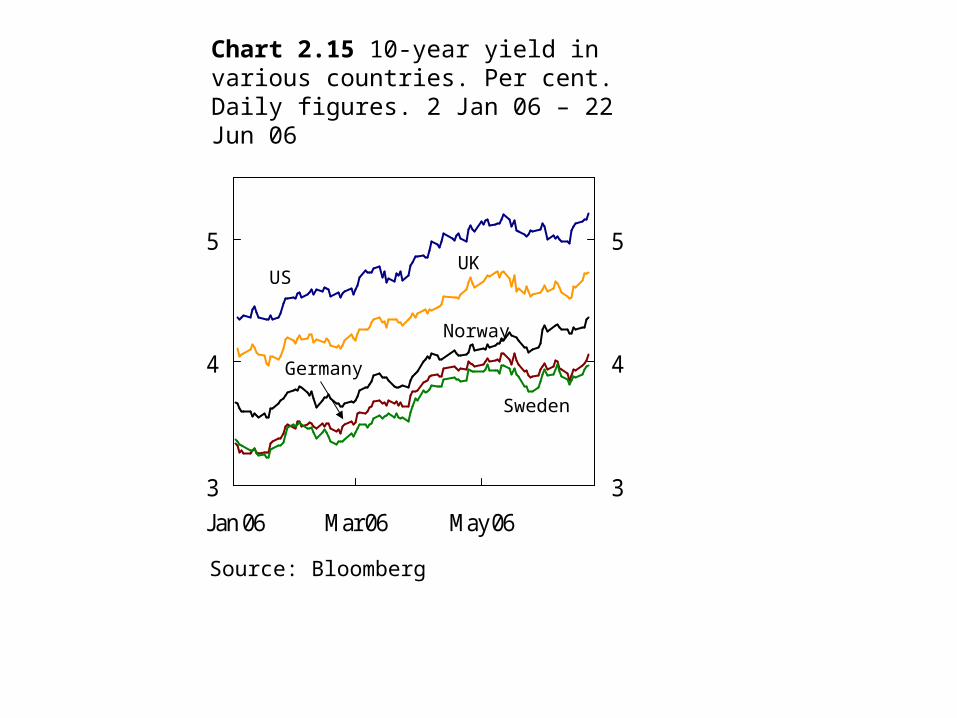
Chart 2.15 10-year yield in various countries. Per cent. Daily figures. 2 Jan 06 – 22 Jun 06
US
Sweden
UK
Germany
Norway
Source: Bloomberg

2
4
6
8
10
1996 1998 2000 2002 2004 20062
4
6
8
10
Chart 2.16 10-year yield in various countries. Per cent. Weekly figures. Week 1 1996 – Week 25 2006
US
Sweden
UK
Germany
Norway
Source: Bloomberg

50
200
350
500
650
1996 1998 2000 2002 2004 200650
200
350
500
650
Benchmark index,OSEBX
Financial
Industrals2)
ICT1)
Energy
1) Average of IT and telecommunications indices. 2) Average of industrials and materials indices.
Sources: Bloomberg and Norges Bank
Chart 2.17 Developments in some sub-indices on the Oslo Stock Exchange. 2 Jan 96 = 100.Daily figures. 2 Jan 96 – 22 Jun 06

Chart 2.18 International equity indices. 1 Jan 05 = 100. Daily figures. 3 Jan 05 – 22 Jun 06
90
110
130
150
170
190
Jan 05 Jul 05 Jan 06 Jul 0690
110
130
150
170
190
Sources: EcoWin and Norges Bank
Europe Stoxx
US S&P 500
Norway OSEBX
Japan Topix

Chart 2.19 Periods of large declines in the benchmark index on the Oslo Stock Exchange 2003 – 2006. Peak in the period (date at curve) = 100. Development 30 business days before/after peak
75
85
95
105
-30 -15 0 15 3075
85
95
105
Sources: EcoWin and Norges Bank
08 Mar 04
11 May 06
04 Sep 0303 Oct 05

Chart 2.20 3-month interest rate differential and import-weighted exchange rate (I-44).1) Monthly figures. Jan 02 – Dec 09
85
88
91
94
97
100
1032002 2004 2006 2008
-1
0
1
2
3
4
5
1) A rising curve denotes a stronger krone exchange rate.
Sources: Reuters and Norges Bank
I-44,(left-hand scale)
Weighted interest rate differential, (right-hand scale)22 June 06
10 March 06

-15
-10
-5
0
5
10
15
1985 1990 1995 2000 2005-15
-10
-5
0
5
10
15
Chart 2.21 Real exchange rates (relative consumer prices and labour costs in a common currency). Deviation from average 1970 – 2005. Annual figures. Per cent. 1985 – 20061)
Relative prices
Relative labour costs in manufacturing
1) Average nominal exchange rate (TWI), consumer price inflation and wage growth in 2006 are based on the baseline scenario in IR 2/06.
Sources: Statistics Norway, Technical Reporting Committee on Income Settlements, Ministry of Finance and Norges Bank

Chart 2.22 Foreign banks’ net accumulated purchases of NOK (billions) and import-weighted exchange rate (I-44).1) Weekly figures. Week 40 2005 – week 25 2006
88
90
92
94
Oct 05 Dec 05 Feb 06 Apr 06 Jun 060
20
40
60
80
100
1) A rising curve denotes a stronger krone exchange rate.
Source: Norges Bank
I-44,(left-hand scale)
Purchases of NOK, (right-hand scale)

3 Developments in the Norwegian economy

Chart 3.1 Mainland GDP. Seasonally adjusted, annualised quarterly growth. Per cent. 02 Q1 – 06 Q1
-9
-6
-3
0
3
6
9
02 Q1 03 Q1 04 Q1 05 Q1 06 Q1-9
-6
-3
0
3
6
9
Sources: Statistics Norway and Norges Bank
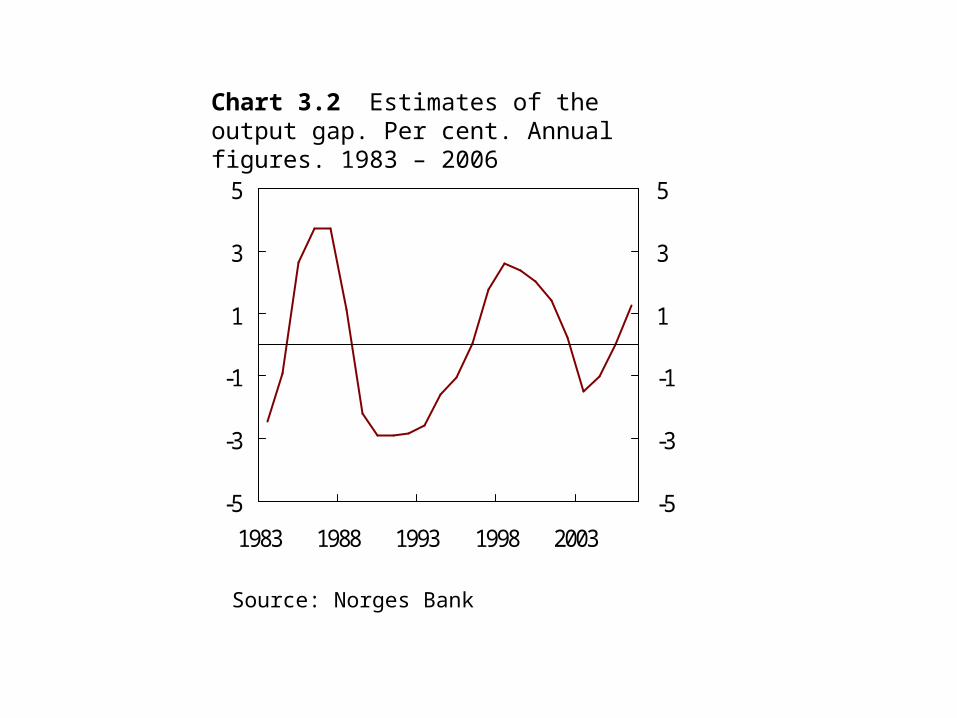
-5
-3
-1
1
3
5
1983 1988 1993 1998 2003-5
-3
-1
1
3
5
Chart 3.2 Estimates of the output gap. Per cent. Annual figures. 1983 – 2006
Source: Norges Bank

0
3
6
9
12
1983 1988 1993 1998 20030
3
6
9
12
1) Share of companies reporting that labour shortage is a production constraint.
Source: Statistics Norway
Chart 3.3 Business climate index. Labour shortages in manufacturing.1) Smoothed. Per cent. Quarterly figures. 83 Q1 – 06 Q1
98
101
104
107
110
-3 0 3 6 9 12 15 18 2198
101
104
107
110
Sources: Statistics Norway and Norges Bank
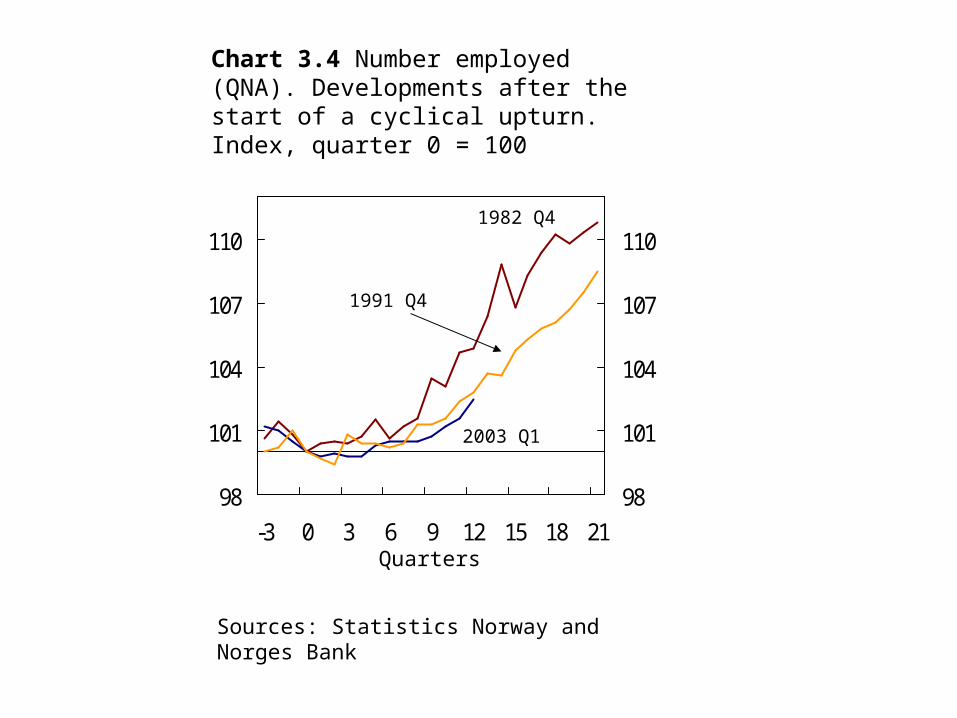
Chart 3.4 Number employed (QNA). Developments after the start of a cyclical upturn. Index, quarter 0 = 100
Quarters
2003 Q1
1982 Q4
1991 Q4

-5
-3
-1
1
3
5
1990 1993 1996 1999 2002 2005-5
-3
-1
1
3
5
Chart 3.5 Employment and labour force. Percentage deviation from trend.1) Quarterly figures. 90 Q1 – 06 Q1
1) Trend calculated using HP-filter. See Staff Memo 2005/2(www.norges-bank.no) for further information.
Sources: Statistics Norway and Norges Bank
Labourforce
Employed persons (LFS)

Chart 3.6 Number of registered foreign workers from new EU accession countries. In thousands
0
3
6
9
12
2005 Q1 2006 Q10
3
6
9
12
Source: Central Office – Foreign Tax Affairs

50
75
100
125
150
1996 1998 2000 2002 2004 200650
75
100
125
150
Chart 3.7 Unemployed. LFS unemployment, registered unemployment and persons on ordinary labour market programmes. In thousands. Seasonally adjusted. Monthly figures. Jan 96 – May 06
Sources: Statistics Norway and the Directorate of Labour
Registered unemployed and on labour market programmes
LFS unemployment
Registered unemployed

-6
-3
0
3
6
2002 2003 2004 2005 2006-6
-3
0
3
6
Chart 3.8 CPI-ATE.1) Total and by supplier sector.2) 12-month change. Per cent. Jan 02 – May 06
1) CPI-ATE: CPI adjusted for tax changes and excluding energy products. A further adjustment is made for the estimated effect of reduced maximum day-care rates from January 2006.2) Norges Bank’s calculations.
Sources: Statistics Norway and Norges Bank
Goods and services produced in Norway
CPI-ATE
Imported consumer goods

Chart 3.9 CPI and indicators of underlying inflation. 12-month change. Per cent. Jan 02 – May 06
-2
0
2
4
6
2002 2003 2004 2005 2006-2
0
2
4
6
Weighted median1)
CPI-ATE3)
Trimmed mean2)
1) Estimated on the basis of 146 sub-groups of the CPI. 2) Price changes accounting for 20 per cent of the weighting base are eliminated. 3) CPI-ATE: CPI adjusted for tax changes and excluding energy products. A further adjustment is made for the estimated effect of reduced maximum day-care rates from January 2006.
Sources: Statistics Norway and Norges Bank
CPI

-4
0
4
8
2002 2003 2004 2005 2006-4
0
4
8
Chart 3.10 Changes in prices for goods and services produced in Norway. By supplier sector. Adjusted for taxes. 12-month change. Per cent. Jan 02 – May 06
Sources: Statistics Norway and Norges Bank
Services with wages as a dominant factor
House rents
Goods produced in Norway Other services

Chart 3.11 CPI and CPI-ATE.1) 12-month change. Per cent. Jan 02 – Dec 062)
-2
0
2
4
6
2002 2003 2004 2005 2006-2
0
2
4
6
1) CPI-ATE: CPI adjusted for tax changes and excluding energy products. A further adjustment is made for the estimated effect of reduced maximum day-care rates from January 2006.2) Projections for period Jun 06 – Dec 06.
Sources: Statistics Norway and Norges Bank
CPI-ATE
CPI

Chart 3.12 CPI-ATE1) and estimates of the output gap.2) Per cent. Quarterly figures. 00 Q1 – 06 Q43)
-2
0
2
4
2000 2002 2004 2006-2
0
2
4
CPI-ATE
Output gap
1) CPI-ATE: CPI adjusted for tax changes and excluding energy products. A further adjustment is made for the estimated effect of reduced maximum day-care rates from January 2006.2) Quarterly figures for the output gap have been derived from annual figures.3) Projections for period 06 Q2 – 06 Q4.
Sources: Statistics Norway and Norges Bank

Chart 3.13 Real growth in household disposable income1) and consumption. Per cent. Annual figures. 1990 – 20092)
-2
0
2
4
6
8
1990 1993 1996 1999 2002 2005 2008-2
0
2
4
6
8
1) Adjusted for estimated reinvested share dividends since 2001.2) Projections for period 2006 – 2009.
Sources: Statistics Norway and Norges Bank
Real income growth
Real growth in consumption

-15
-10
-5
0
5
10
1980 1985 1990 1995 2000 2005-15
-10
-5
0
5
10Saving ratio
Net lending
1) Adjusted for estimated reinvested share dividends since 2001. 2) Projections for period 2006 – 2009.
Sources: Statistics Norway and Norges Bank
Chart 3.14 Household saving ratio and net lending as a share of disposable income.1) Annual figures. 1980 – 20092)
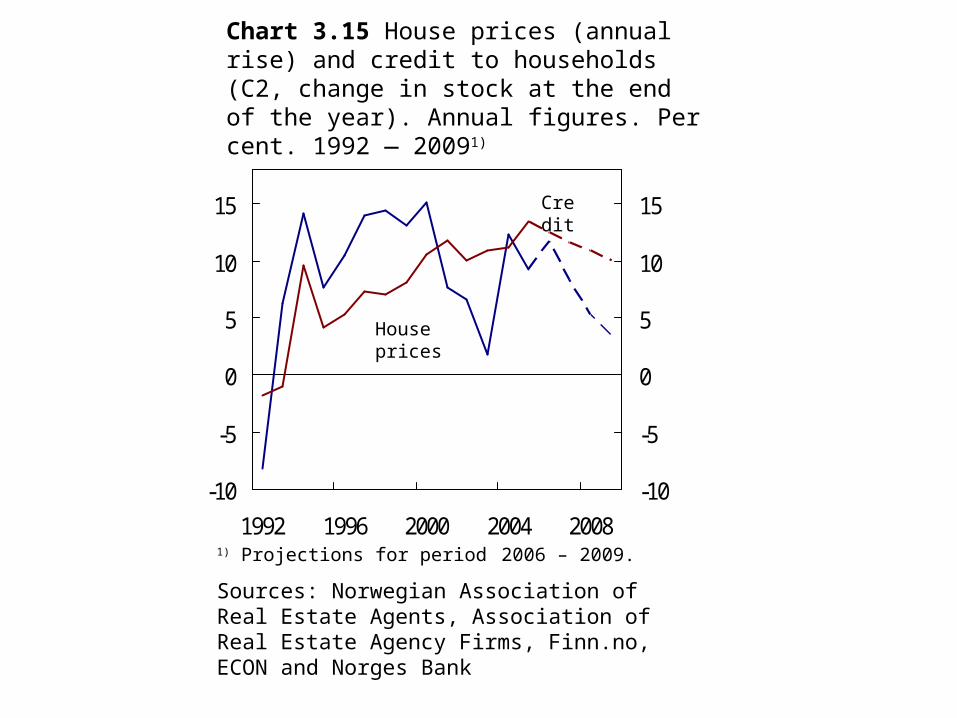
1) Projections for period 2006 – 2009.
Sources: Norwegian Association of Real Estate Agents, Association of Real Estate Agency Firms, Finn.no, ECON and Norges Bank
-10
-5
0
5
10
15
1992 1996 2000 2004 2008-10
-5
0
5
10
15
Chart 3.15 House prices (annual rise) and credit to households (C2, change in stock at the end of the year). Annual figures. Per cent. 1992 ― 20091)
House prices
Credit
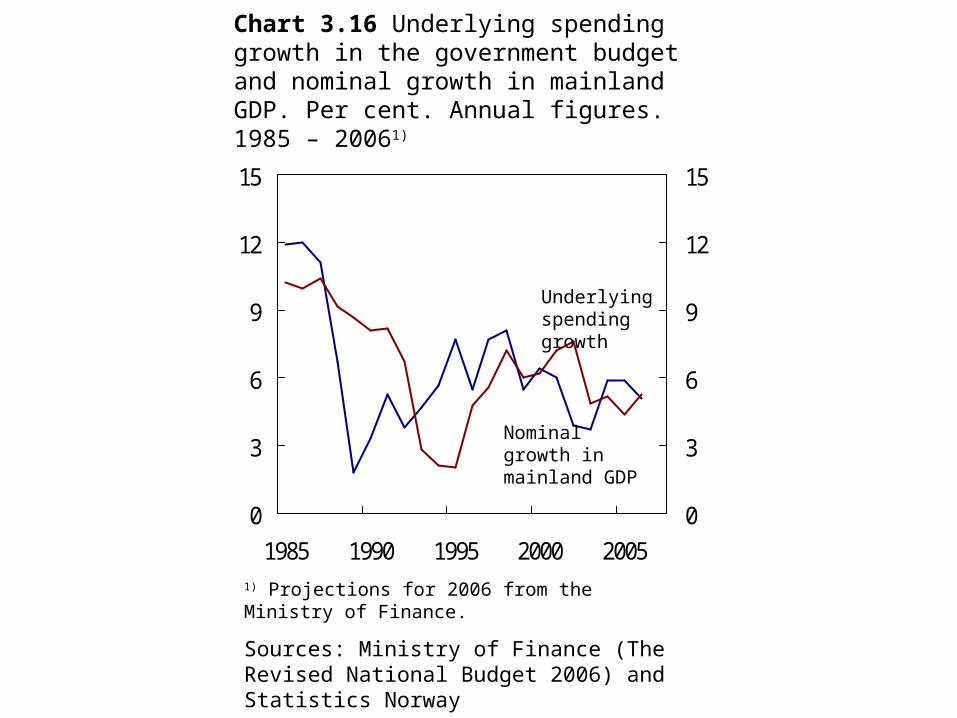
Chart 3.16 Underlying spending growth in the government budget and nominal growth in mainland GDP. Per cent. Annual figures. 1985 – 20061)
0
3
6
9
12
15
1985 1990 1995 2000 20050
3
6
9
12
15
1) Projections for 2006 from the Ministry of Finance.
Sources: Ministry of Finance (The Revised National Budget 2006) and Statistics Norway
Underlying spending growth
Nominal growth in mainland GDP

Chart 3.17 Expected real return on the Government Pension Fund – Global. In billions of 2006-NOK. Annual figures. 2001 – 2009
0
30
60
90
120
2001 2003 2005 2007 20090
30
60
90
120Premium for forward priceExpected real return (RNB 2006)Structural, non-oil deficit
Sources: Ministry of Finance (The Revised National Budget 2006) and Norges Bank

Chart 3.18 Investment in oil and gas recovery incl. pipeline transport. Investment level in billions of NOK (constant 2003-prices) and annual growth in per cent. 1995 – 20091)
-30
-15
0
15
30
50
60
70
80
90
100
1995 1998 2001 2004 20071) Projections for period 2006 – 2009.
Sources: Statistics Norway and Norges Bank
Investment level, (right-hand scale)
Annual growth,(left-hand scale)

-5
5
15
25
2002 2003 2004 2005 2006-5
5
15
25
Chart 3.19 Credit to enterprises1) and enterprises’ liquid assets.2) 12-month change. Per cent. Jan 02 – Apr 06
1) Total credit to non-financial enterprises in mainland Norway (C3). As a result of a change in the foreign component in C3, the figures presented here have been considerably revised on earlier versions, see http://www.norges-bank.no/front/statistikk/en/k3/ for further information.2) Non-financial enterprises’ liquid assets (M2).
Source: Norges Bank
C3
M2

75
80
85
90
1983 1988 1993 1998 200375
80
85
90
Average
Sources: Statistics Norway and Norges Bank
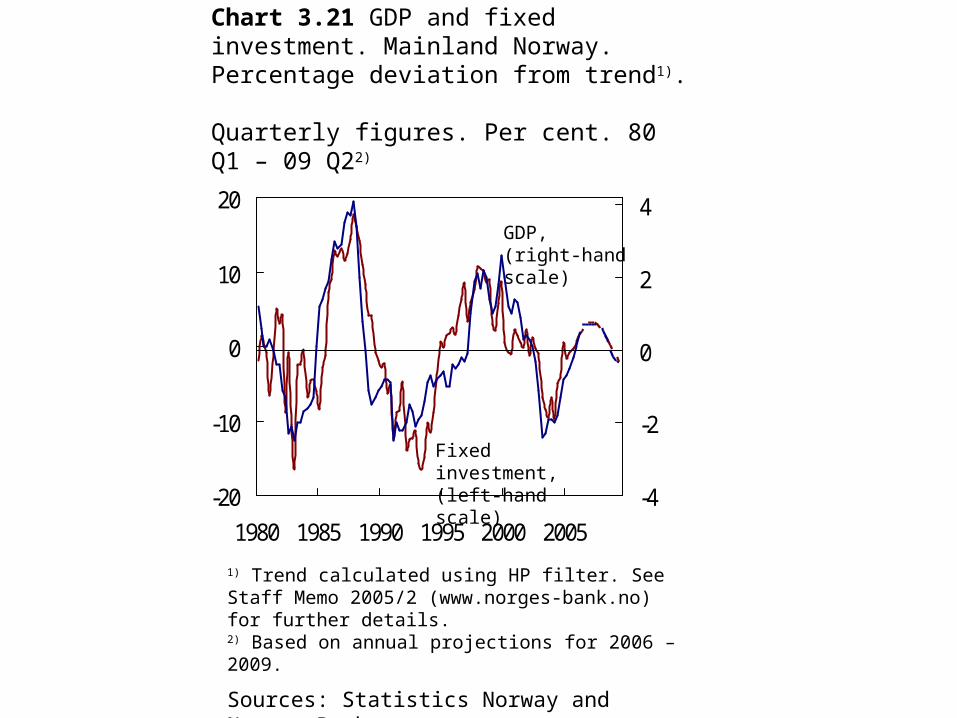
Chart 3.20 Capacity utilisation rate in manufacturing. Trend. Per cent. Quarterly figures. 83 Q1 – 06 Q1
-20
-10
0
10
20
1980 1985 1990 1995 2000 2005-4
-2
0
2
4
Fixed investment, (left-hand scale)
GDP,(right-hand scale)
1) Trend calculated using HP filter. See Staff Memo 2005/2 (www.norges-bank.no) for further details.2) Based on annual projections for 2006 – 2009.
Sources: Statistics Norway and Norges Bank
Chart 3.21 GDP and fixed investment. Mainland Norway. Percentage deviation from trend1). Quarterly figures. Per cent. 80 Q1 – 09 Q22)

Chart 3.22 Sickness absence in person-days for employees self-certified or certified by a doctor, for employees aged 16 - 69. In per cent of scheduled person-days. Quarterly figures. 00 Q2– 06 Q1
5
6
7
8
9
10
2000 2002 2004 20065
6
7
8
9
10
Source: Statistics Norway
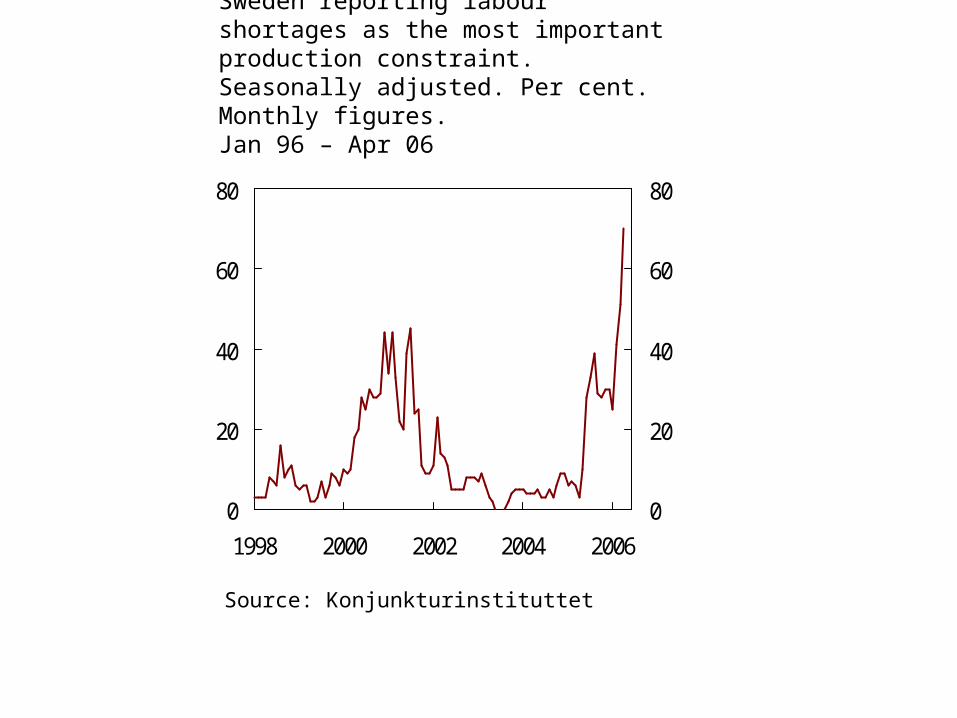
Chart 3.23 Share of companies in the construction sector in Sweden reporting labour shortages as the most important production constraint. Seasonally adjusted. Per cent. Monthly figures. Jan 96 – Apr 06
0
20
40
60
80
1998 2000 2002 2004 20060
20
40
60
80
Source: Konjunkturinstituttet

Chart 3.24 Change in employment on previous year. Per cent. Unemployment1) as a percentage of labour force. Annual figures. 1980 – 20092)
-4
-2
0
2
4
0
2
4
6
8
1980 1985 1990 1995 2000 2005
1) LFS unemployment.2) Projections for 2006 – 2009.
Sources: Statistics Norway and Norges Bank
LFS unemployment rate (right-hand scale)
Number employed (left-hand scale)

Chart 3.25 Annual wage growth1) and LFS unemployment rate. Per cent. Annual figures. 1993 – 20092)
0
2
4
6
1993 1997 2001 2005 20090
2
4
6
Unemployment rate
Annual wage growth
1) Average for all groups. Including estimated cost of increase in number of vacation days and introduction of mandatory occupational pension. 2) Projections for period 2006 – 2009.
Sources: Technical Reporting Committee on Income Settlements, Statistics Norway and Norges Bank

0
1
2
3
4
5
1993 1996 1999 2002 2005 2008-4
-2
0
2
4
1) Projections for period 06 Q2 – 09 Q4.2) An adjustment is made for the estimated effect of reduced maximum day-care rates from January 2006.
Sources: Statistics Norway and Norges Bank
Chart 3.26 Domestic inflation (4-quarter growth ) and level of output gap (lagged 4 quarters). 93 Q1 – 09 Q41)
Output gap, (right-hand scale)
Domestic inflation2), (left-hand scale)

Chart 3.27 CPI-ATE.1) Total and by supplier sector.2) 12-month change. Per cent. Jan. 02 – Dec 093)
-6
-3
0
3
6
2002 2004 2006 2008-6
-3
0
3
6
1) CPI-ATE: CPI adjusted for tax changes and excluding energy products. A further adjustment is made for the estimated effect of reduced maximum day-care rates from January 2006.2) Norges Bank’s calculations.3) Projections for period Jun 06 – Dec 09.
Sources: Statistics Norway and Norges Bank
Goods and services produced in Norway
CPI-ATE
Imported consumer goods
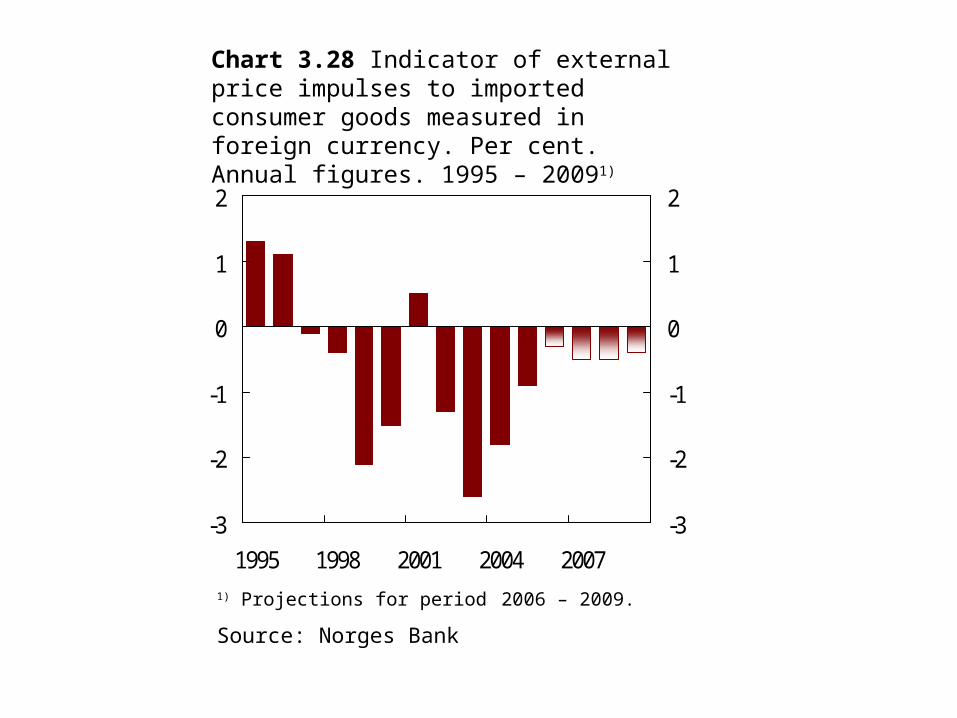
Chart 3.28 Indicator of external price impulses to imported consumer goods measured in foreign currency. Per cent. Annual figures. 1995 – 20091)
1) Projections for period 2006 – 2009.
Source: Norges Bank
-3
-2
-1
0
1
2
-3
-2
-1
0
1
2
1995 1998 2001 2004 2007
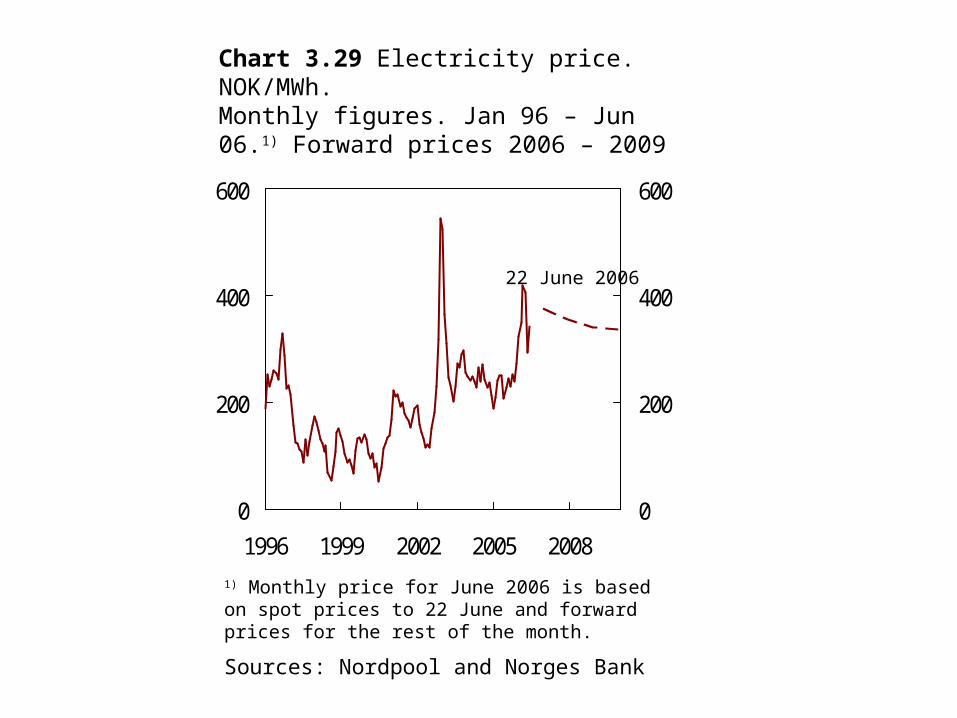
Chart 3.29 Electricity price. NOK/MWh. Monthly figures. Jan 96 – Jun 06.1) Forward prices 2006 – 2009
0
200
400
600
1996 1999 2002 2005 20080
200
400
600
1) Monthly price for June 2006 is based on spot prices to 22 June and forward prices for the rest of the month.
Sources: Nordpool and Norges Bank
22 June 2006

Chart 3.30 CPI and CPI-ATE.1) 12-month change. Per cent. Jan 02 – Dec 092)
-2
0
2
4
6
2002 2004 2006 2008-2
0
2
4
6
1) CPI-ATE: CPI adjusted for tax changes and excluding energy products. A further adjustment is made for the estimated effect of reduced maximum day-care rates from January 2006.2) Projections for period Jun 06 – Dec 09.
Sources: Statistics Norway and Norges Bank
CPI-ATE
CPI

Boxes

Money, credit and prices - a monetary cross-check

-5
0
5
10
15
20
1960 1970 1980 1990 2000-5
0
5
10
15
20
Chart 1 Consumer prices (CPI) and money supply (M2). Computed trend growth. 4-quarter growth. Per cent. 61 Q1 – 06 Q1
Sources: Statistics Norway and Norges Bank
M2
CPI

0
400
800
1200
1600
1993 1997 2001 20050
400
800
1200
1600
Chart 2 Money supply (M2) and loans to the public by private banks. In billions NOK. Monthly figures. Jan 93 – Apr 06
Source: Norges Bank
M2
Loans to the public by private banks

Recent price developments

-2
0
2
4
6
2002 2003 2004 2005 2006-2
0
2
4
6
CPI-ATE
CPI
Chart 1 CPI and CPI-ATE.1) 12-month change. Per cent. Jan 02 – May 06
1) CPI-ATE: CPI adjusted for tax changes and excluding energy products. A further adjustment is made for the estimated effect of reduced maximum day-care rates from January 2006.
Sources: Statistics Norway and Norges Bank

-6
-3
0
3
6
2002 2003 2004 2005 2006-6
-3
0
3
6
Goods and services produced in Norway
Imported consumer goods
CPI-ATE
Chart 2 CPI-ATE.1) Total and by supplier sector.2) Historical inflation and projections IR 1/06 (broken line). 12-month change. Per cent. Jan 02 – May 06
1) CPI-ATE: CPI adjusted for tax changes and excluding energyproducts. A further adjustment is made for the estimated effect of reduced maximum day-care rates from January 2006.2) Norges Bank’s calculations.
Sources: Statistics Norway and Norges Bank
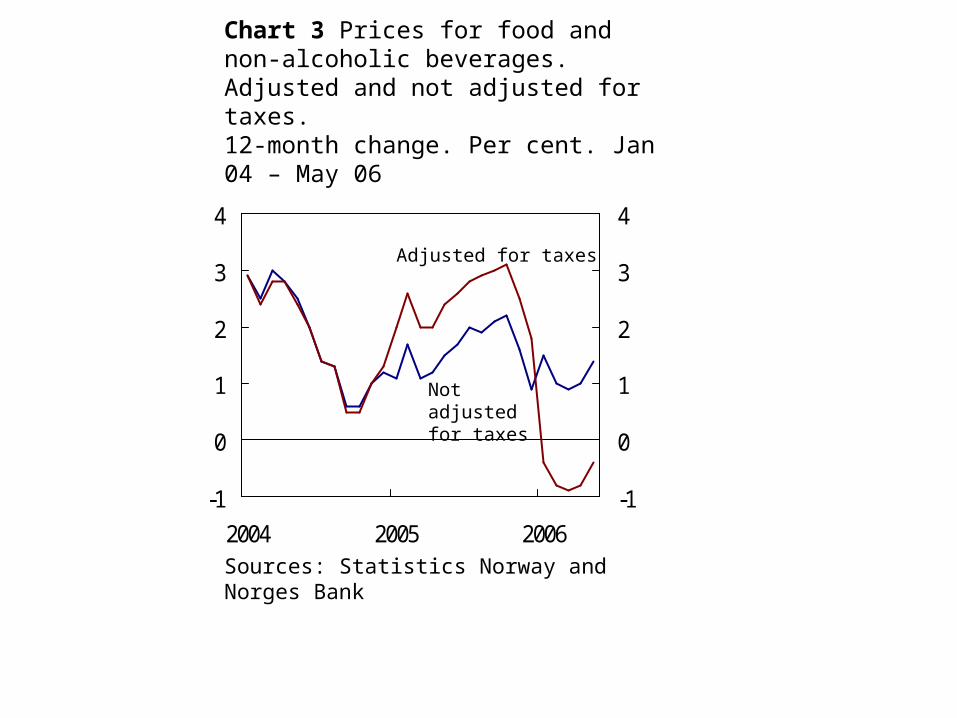
-1
0
1
2
3
4
2004 2005 2006-1
0
1
2
3
4
Adjusted for taxes
Not adjusted for taxes
Chart 3 Prices for food and non-alcoholic beverages. Adjusted and not adjusted for taxes.12-month change. Per cent. Jan 04 – May 06
Sources: Statistics Norway and Norges Bank

-4
-2
0
2
4
6
2002 2003 2004 2005 2006-4
-2
0
2
4
6
Services with wages as a dominant price factor
Other services
1) CPI-ATE: CPI adjusted for tax changes and excluding energy products.
Source: Statistics Norway
Chart 4 Groups of services in CPI-ATE.1) 12-month change. Per cent. Jan 02 – May 06

85
90
95
100
105
2002 2003 2004 2005 200685
90
95
100
105
Chart 5 Prices for imported consumer goods from External Trade Statistics. Index, 2000 = 100. Quarterly figures. 02 Q2 – 06 Q1
Sources: Statistics Norway and Norges Bank

0
2
4
6
1993 1996 1999 2002 20050
2
4
6
CPI-ATE
Chart 6 CPI and CPI-ATE1). 10-year moving average. 12-month change. Per cent. Jan 93 – May 06
1) CPI-ATE: CPI adjusted for tax changes and excluding energyproducts.
Sources: Statistics Norway and Norges Bank
CPI

-2
0
2
4
6
2001 2002 2003 2004 2005 2006-2
0
2
4
6
Weighted median1)
CPI-ATE3)
Trimmed mean1,2)
Volatility weighted4)
Chart 7 Various indicators of underlying inflation. 12-month change. Per cent. Jan 01 – May 06
1) Estimated on the basis of 146 sub-groups of the CPI.2) Price changes accounting for 20% of the weigh basis are eliminated.3) CPI-ATE: CPI adjusted for tax changes and excluding energy products.4) Estimated on the basis of 96 sub-groups of the CPI.
Sources: Statistics Norway and Norges Bank
Excluding the most volatile4)
Volatility adjusted4)

-2
0
2
4
6
2001 2002 2003 2004 2005 2006-2
0
2
4
6
Highest indicator
Lowest indicator
Chart 8 Interval of uncertainty for underlying inflation. Highest and lowest indicator.1) 12-month change. Per cent. Jan 01 – May 06
1) Highest and lowest indicator of CPI-ATE, weighted median, trimmed mean, volatility weighted inflation, volatility adjusted inflation and inflation excluding the most volatile components, see Chart 7.
Sources: Statistics Norway and Norges Bank

The projections in Inflation Report 1/06 and 2/06
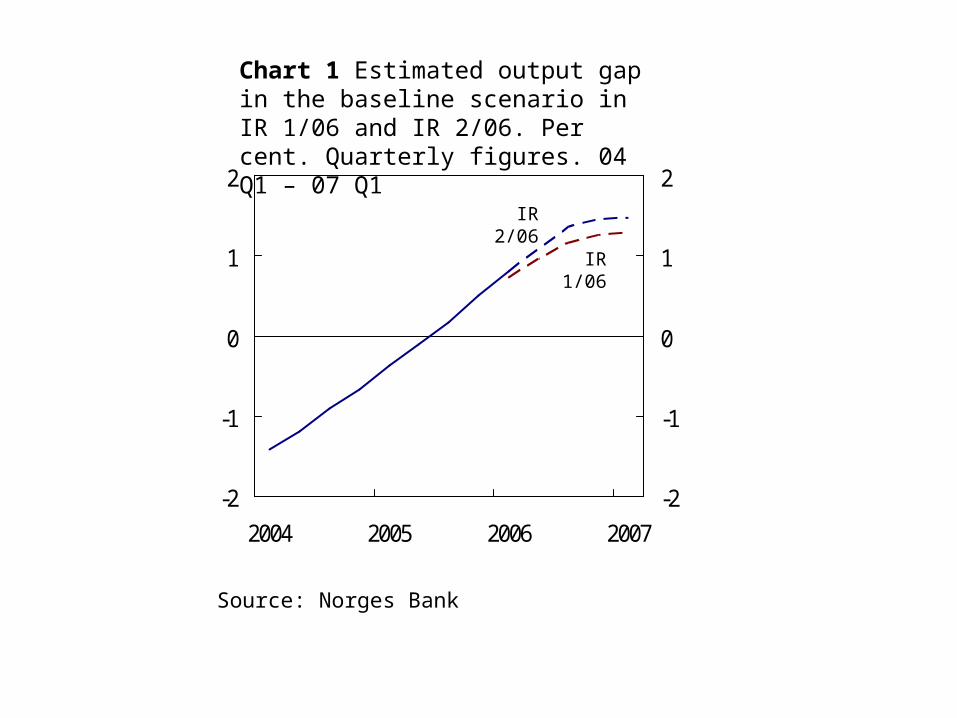
-2
-1
0
1
2
-2
-1
0
1
2
2004 2005 2006 2007
Source: Norges Bank
IR 2/06
IR 1/06
Chart 1 Estimated output gap in the baseline scenario in IR 1/06 and IR 2/06. Per cent. Quarterly figures. 04 Q1 – 07 Q1

-4
-2
0
2
4
Jul 04 Jan 05 Jul 05 Jan 06-4
-2
0
2
4
1) CPI-ATE: CPI adjusted for tax changes and excluding energy products. A further adjustment is made for the estimated effect of reduced maximum day-care rates from January 2006.2) Norges Bank's calculations.
Sources: Statistics Norway and Norges Bank
Goods and services produced in Norway
CPI-ATE
Imported consumer goods
Chart 2 CPI-ATE.1) Total and by supplier sector.2) Actual inflation and projections from IR 1/06. 12-month change. Per cent. Jul 04 – May 06

Chart 3 Sight deposit rate in the baseline scenario in IR 1/06 with fan chart and sight deposit rate in the baseline scenario in IR 2/06 (red line). Per cent. Quarterly figures. 04 Q1 – 09 Q4
0
1
2
3
4
5
6
7
8
2004 2005 2006 2007 2008 20090
1
2
3
4
5
6
7
830% 50% 70% 90%
Source: Norges Bank

Chart 4 Import-weighted exchange rate (I-44)1) in the baseline scenario in IR 1/06 with fan chart and I-44 in the baseline scenario in IR 2/06 (red line). Quarterly figures. 04 Q1 – 09 Q4
70
80
90
100
110
2004 2005 2006 2007 2008 200970
80
90
100
11030% 50% 70% 90%
1) A rising curve denotes a weaker krone exchange rate. It is assumed that strengthening by a certain percentage is just as likely as weakening by the same percentage.
Source: Norges Bank

-2
-1
0
1
2
3
2004 2005 2006 2007 2008 2009-2
-1
0
1
2
3
Chart 5 Estimated output gap in the baseline scenario in IR 1/06 with fan chart1) and output gap in the baseline scenario in IR 2/06 (red line). Per cent. Quarterly figures. 04 Q1 – 09 Q4
30% 50% 70% 90%
1) Uncertainty surrounding the current situation isnot taken into account in the calculation.
Source: Norges Bank

Chart 6 Projected CPI-ATE1) in the baseline scenario in IR 1/06 with fan chart and CPI-ATE in the baseline scenario in IR 2/06 (red line). 4-quarter change. Per cent. 04 Q1 – 09 Q4
0
1
2
3
4
2004 2005 2006 2007 2008 20090
1
2
3
430% 50% 70% 90%
1) CPI-ATE: CPI adjusted for tax changes and excluding energy products. A further adjustment is made for the estimated effect of reduced maximum day-care rates from January 2006. Other measures of underlying inflation are shown in a separate box.
Sources: Statistics Norway and Norges Bank

0
1
2
3
4
0
1
2
3
4
Chart 7 Mainland GDP. The last two projections published for 2006. Percentage rise
Nov May Mar Jun JunMarSN1)FIN1) NBCF
JunFeb
1) Statistics Norway and The Ministry of Finance have reduced their mainland GDP projection by respectively 0.3 and 0.4 percentage point due to lower electricity production.
Sources: Amendment to 2006 budget, Revised National Budget 2006, Economic Survey 1/2006 and 3/2006, Inflation Report 1/06 and 2/06, Consensus Forecasts February 2006 and June 2006

Chart 8 CPI-ATE.1) The last two projections published for 2006. Percentage rise
0.0
0.5
1.0
1.5
2.0
2.5
0.0
0.5
1.0
1.5
2.0
2.5
Mar Jun JunMarNov MaySNFIN NB
1) CPI-ATE: CPI adjusted for tax changes and excluding energy products. A further adjustment is made in Norges Bank’s projections for the estimated effect of reduced maximum day-care rates from January 2006.
Sources: Amendment to 2006 budget, Revised National Budget 2006, Economic Survey 1/2006 and 3/2006, Inflation Report 1/06 and 2/06, Consensus Forecasts February 2006 and June 2006

Foreign labour in Norway
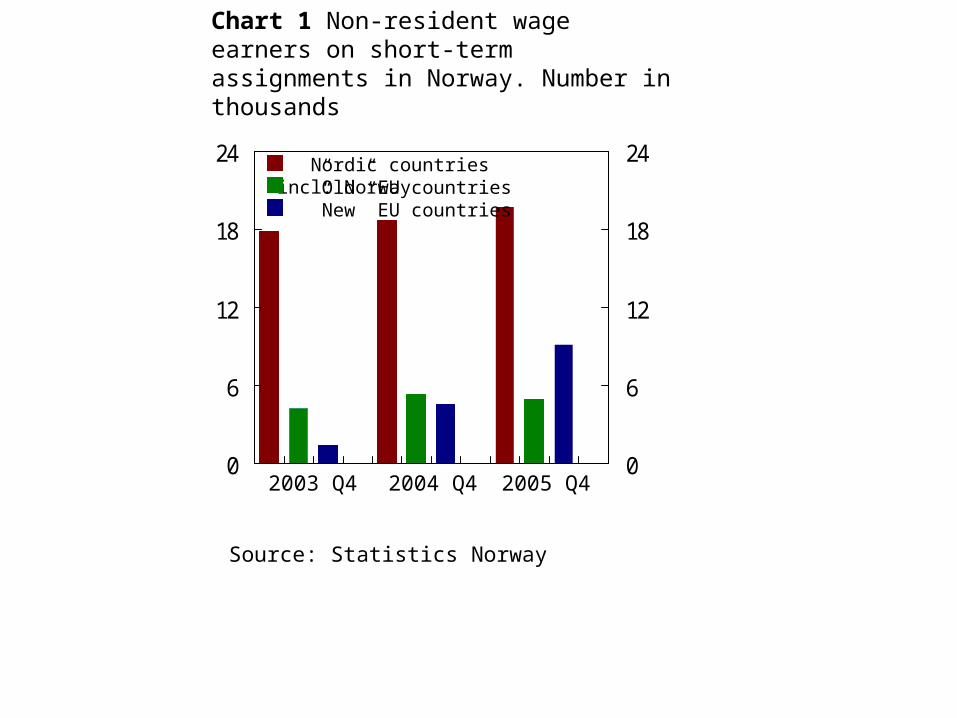
0
6
12
18
24
0
6
12
18
24
Chart 1 Non-resident wage earners on short-term assignments in Norway. Number in thousands
Source: Statistics Norway
2003 Q4 2004 Q4 2005 Q4
Nordic countries incl. Norway ”Old” EU countries ”New” EU countries

Short term forecast for mainland GDP in Norway

2
3
4
5
Mar 04 Sep 04 Mar 05 Sep 052
3
4
5
Chart 1 GDP mainland Norway. Actual and projections 05 Q2 – 05 Q4. 4-quarter growth. Per cent. Seasonally adjusted.
1) Monthly indicators model
Sources: Statistics Norway and Norges Bank
50%
MI1)
BVARQNA VAR
ARIMA
IR 2/05

Chart 2 GDP mainland Norway. Projections for period 06 Q2 – 06 Q4. 4-quarter growth. Per cent. Seasonally adjusted.
1) Monthly indicators model
Sources: Statistics Norway and Norges Bank
50%
2
3
4
5
Mar 05 Sep 05 Mar 06 Sep 062
3
4
5
MI1)
BVARQNA
VARARIMA
IR 2/06
Regional network

Annex I
Regional network

Chart 1 Norges Bank’s regional network. Growth in demand and production. Index.1) Oct 02 – May 06
-5
-3
-1
1
3
5
Oct 02 Oct 03 Oct 04 Oct 05-5
-3
-1
1
3
5Suppliers to petroleum industry
Export industry
All industries
Building and construction
1) The scale runs from -5 to +5, where -5 indicates a large fall and +5 indicates strong growth. See article ”Norges Bank’s regional network” in Economic Bulletin 3/05 for further information.
Source: Norges Bank

Chart 2 Capacity utilisation. Regional network. Share reporting that they have some or considerable difficulty in accommodating an increase in demand. Per cent. Jan 05 – May 06
0
20
40
60
80
Jan 05 Jul 05 Jan 060
20
40
60
80
Source: Norges Bank
Building and construction
Total
Services

Annex II
Charts

0
2
4
6
8
10
1995 1996 1997 1998 1999 2000 2001 2002 2003 2004 2005 20060
2
4
6
8
10
Source: Norges Bank
Sight deposit rate
3-month money market rate
Chart 1 Norwegian interest rates. 3-month money market rate, sight deposit rate and 10-year government bond yield. Monthly figures. Jan 95 – May 06
10-year government bond yield

0
2
4
6
8
1995 1996 1997 1998 1999 2000 2001 2002 2003 2004 2005 20060
2
4
6
8
Euro area 1)
US
Japan
Chart 2 3-month interest rates in the US, the euro area and Japan. Monthly figures. Jan 95 – May 06
1) Theoretical ECU rate up to and including December 1998.
Source: EcoWin

0
2
4
6
8
10
1995 1996 1997 1998 1999 2000 2001 2002 2003 2004 2005 20060
2
4
6
8
10
Sources: EcoWin and Norges Bank
UK
Sweden
Chart 3 3-month interest rates in the UK, Sweden and among trading partners. Monthly figures. Jan 95 – May 06
Trading partners

85
90
95
100
105
110
115
1995 1996 1997 1998 1999 2000 2001 2002 2003 2004 2005 200685
90
95
100
105
110
115
Import-weighted exchange rate, I-44 (1995 = 100)
Trade-weighted exchange rate index, TWI (1990 = 100)
Chart 4 Trade-weighted exchange rate index (TWI) and import-weighted exchange rate (I-44).1) Monthly figures. Jan 95 – May 06
1) A rising curve denotes a weaker krone exchange rate.
Source: Norges Bank

5
6
7
8
9
10
1995 1996 1997 1998 1999 2000 2001 2002 2003 2004 2005 200660
70
80
90
100
110
1) A rising curve denotes a weaker krone exchange rate.
Source: Norges Bank
NOK/EUR(left-hand scale)
NOK/SEK,(right-hand scale)
Chart 5 Bilateral exchange rates.1) Monthly figures. Jan 95 – May 06
NOK/USD,(left-hand scale)

0
5
10
15
20
1997 1998 1999 2000 2001 2002 2003 2004 2005 20060
5
10
15
20
1) As a result of a change in the foreign component in C3, the figures presented here have been considerably revised on earlier versions, see http://www.norges-bank.no/front/statistikk/en/k3/ for further information.
Source: Norges Bank
Credit to households
C2
Chart 6 The credit indicator (C2), credit to households and total credit to the non-financial private sector and municipalities, mainland Norway (C3)1). 12-month rise. Per cent. Jan 97 – Apr 06
C3 Mainland Norway