charts - savi.org · select charts tab to create a bar chart, select bar as the chart type by...
TRANSCRIPT
www.savi.org
Charts
[email protected] 317.278.9212 1
How do I Create a Bar Chart? How do I Create a Pie Chart? How do I Print a Chart? How do I Save a Chart? What are the Chart Options?
How do I Create a Bar Chart?
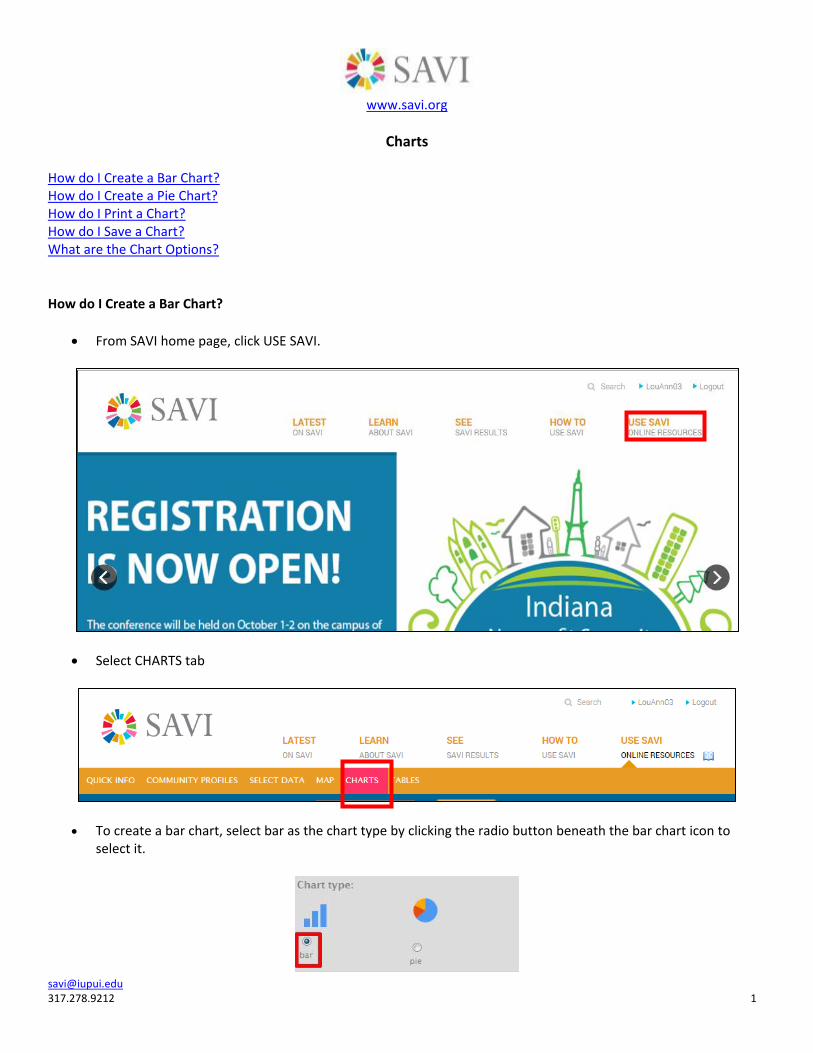
From SAVI home page, click USE SAVI.
Select CHARTS tab
To create a bar chart, select bar as the chart type by clicking the radio button beneath the bar chart icon to select it.
www.savi.org
Charts
[email protected] 317.278.9212 2
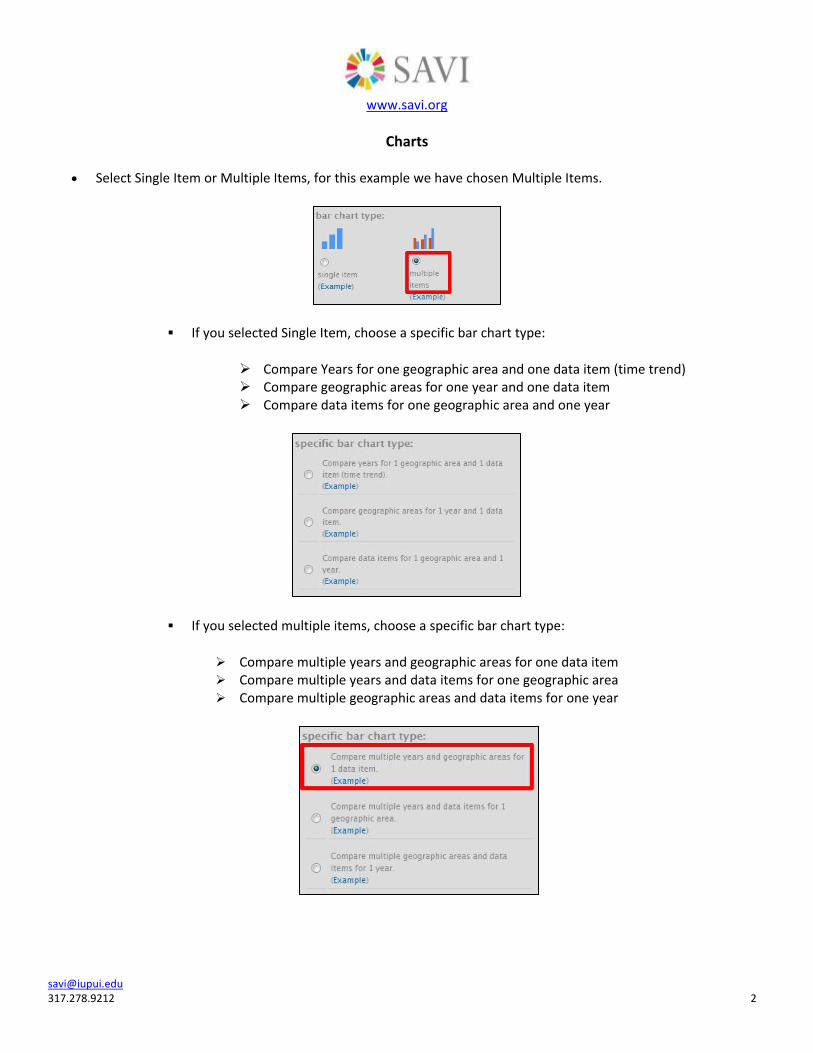
Select Single Item or Multiple Items, for this example we have chosen Multiple Items.
If you selected Single Item, choose a specific bar chart type:
Compare Years for one geographic area and one data item (time trend) Compare geographic areas for one year and one data item Compare data items for one geographic area and one year
If you selected multiple items, choose a specific bar chart type:
Compare multiple years and geographic areas for one data item Compare multiple years and data items for one geographic area Compare multiple geographic areas and data items for one year
www.savi.org
Charts
[email protected] 317.278.9212 3
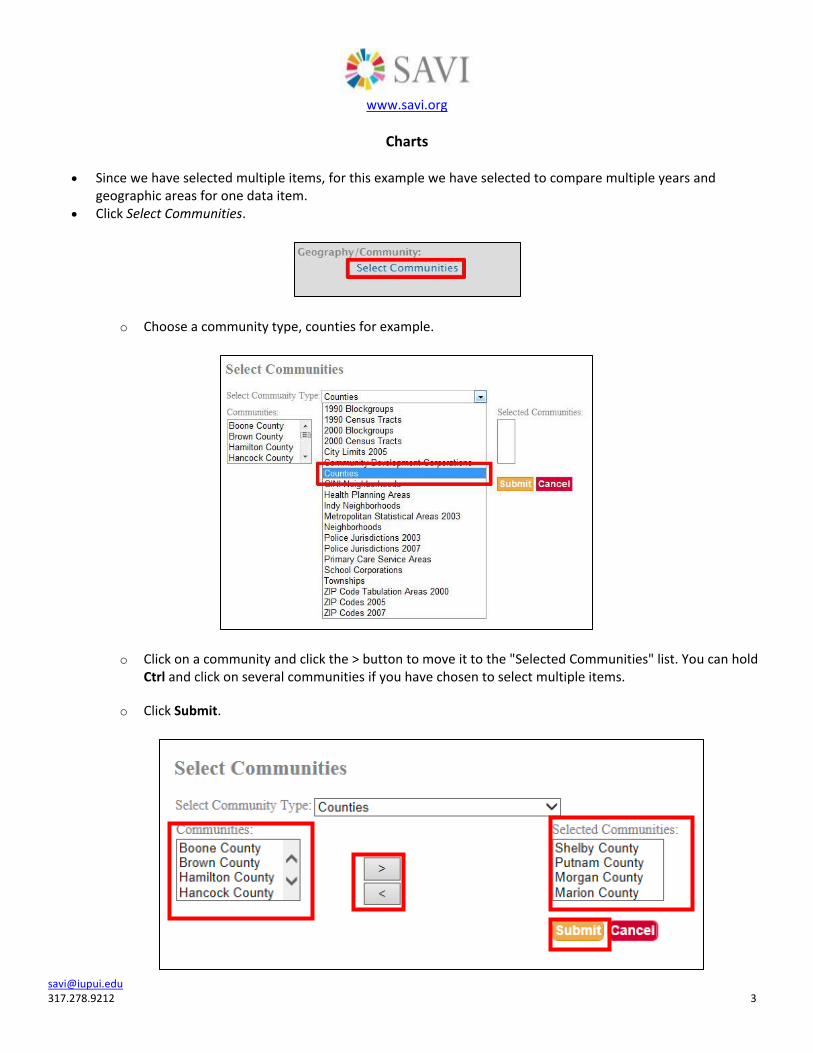
Since we have selected multiple items, for this example we have selected to compare multiple years and geographic areas for one data item.
Click Select Communities.
o Choose a community type, counties for example.
o Click on a community and click the > button to move it to the "Selected Communities" list. You can hold Ctrl and click on several communities if you have chosen to select multiple items.
o Click Submit.
www.savi.org
Charts
[email protected] 317.278.9212 4
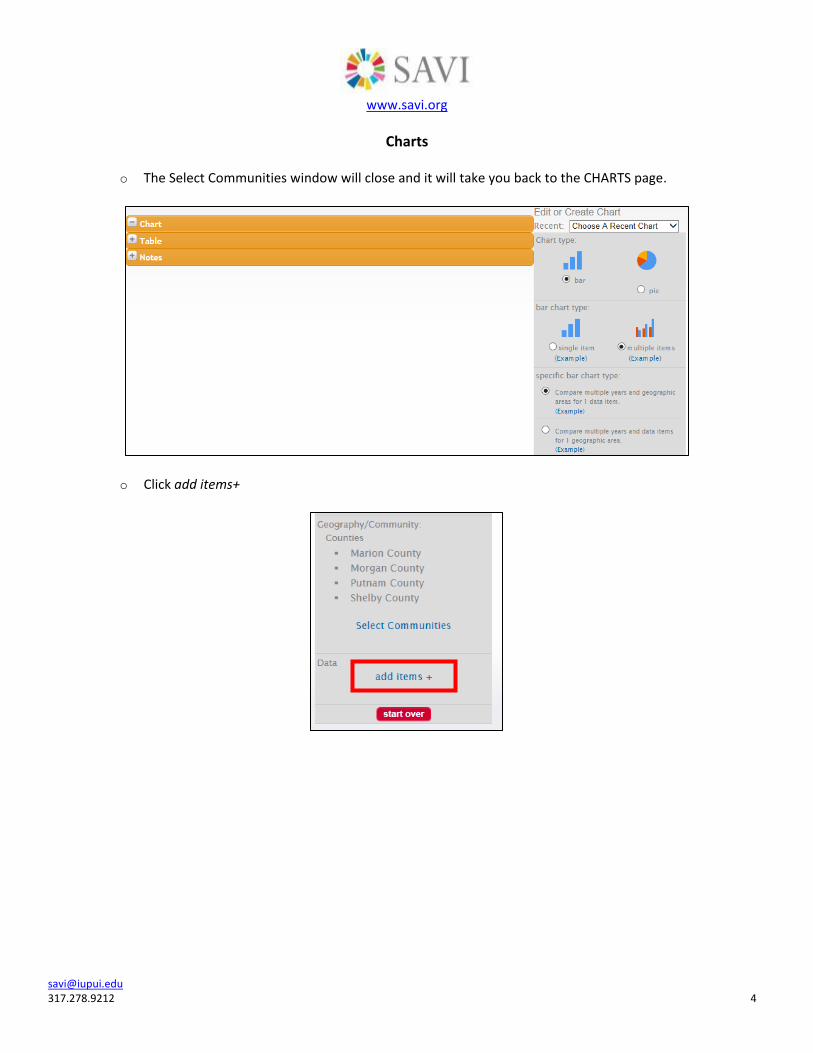
o The Select Communities window will close and it will take you back to the CHARTS page.
o Click add items+
www.savi.org
Charts
[email protected] 317.278.9212 5
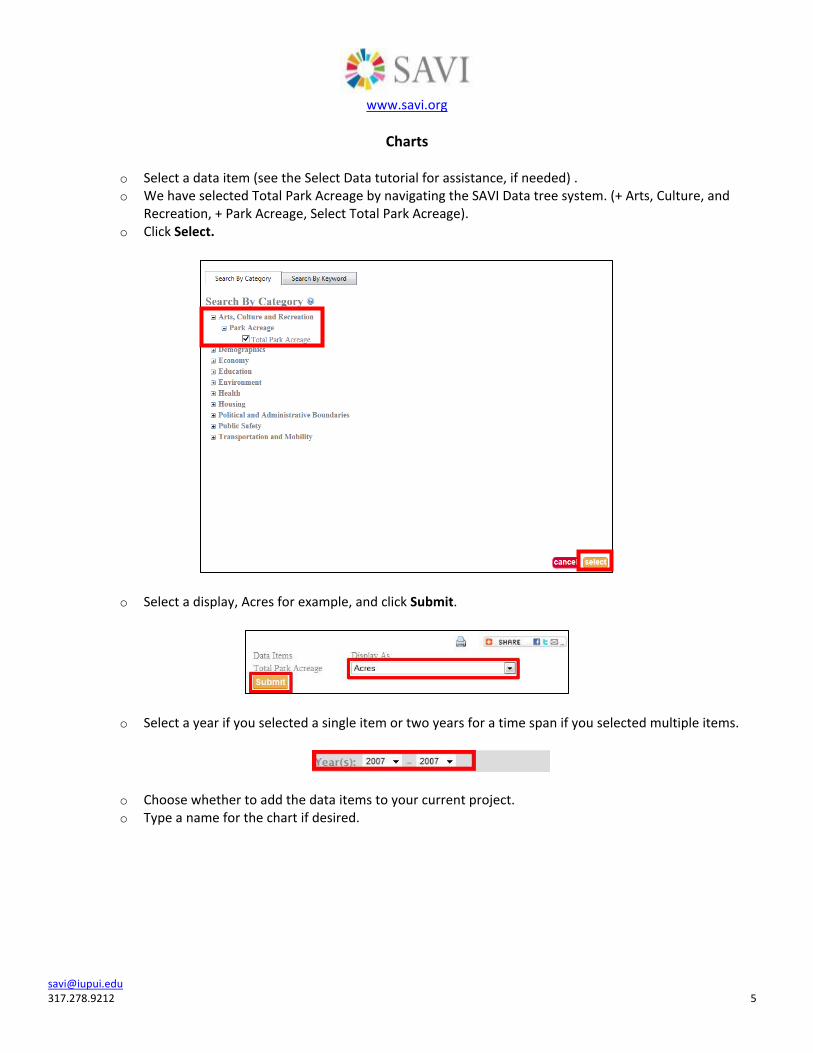
o Select a data item (see the Select Data tutorial for assistance, if needed) . o We have selected Total Park Acreage by navigating the SAVI Data tree system. (+ Arts, Culture, and
Recreation, + Park Acreage, Select Total Park Acreage). o Click Select.
o Select a display, Acres for example, and click Submit.
o Select a year if you selected a single item or two years for a time span if you selected multiple items.
o Choose whether to add the data items to your current project. o Type a name for the chart if desired.
www.savi.org
Charts
[email protected] 317.278.9212 6
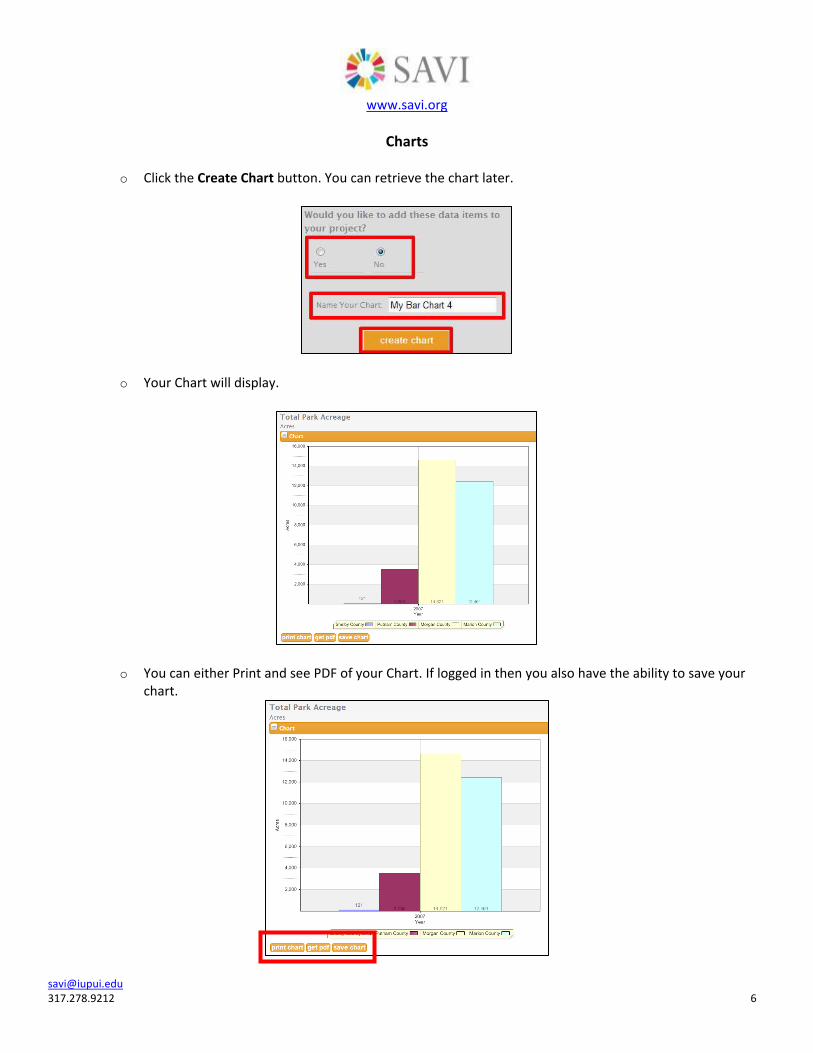
o Click the Create Chart button. You can retrieve the chart later.
o Your Chart will display.
o You can either Print and see PDF of your Chart. If logged in then you also have the ability to save your chart.
www.savi.org
Charts
[email protected] 317.278.9212 7
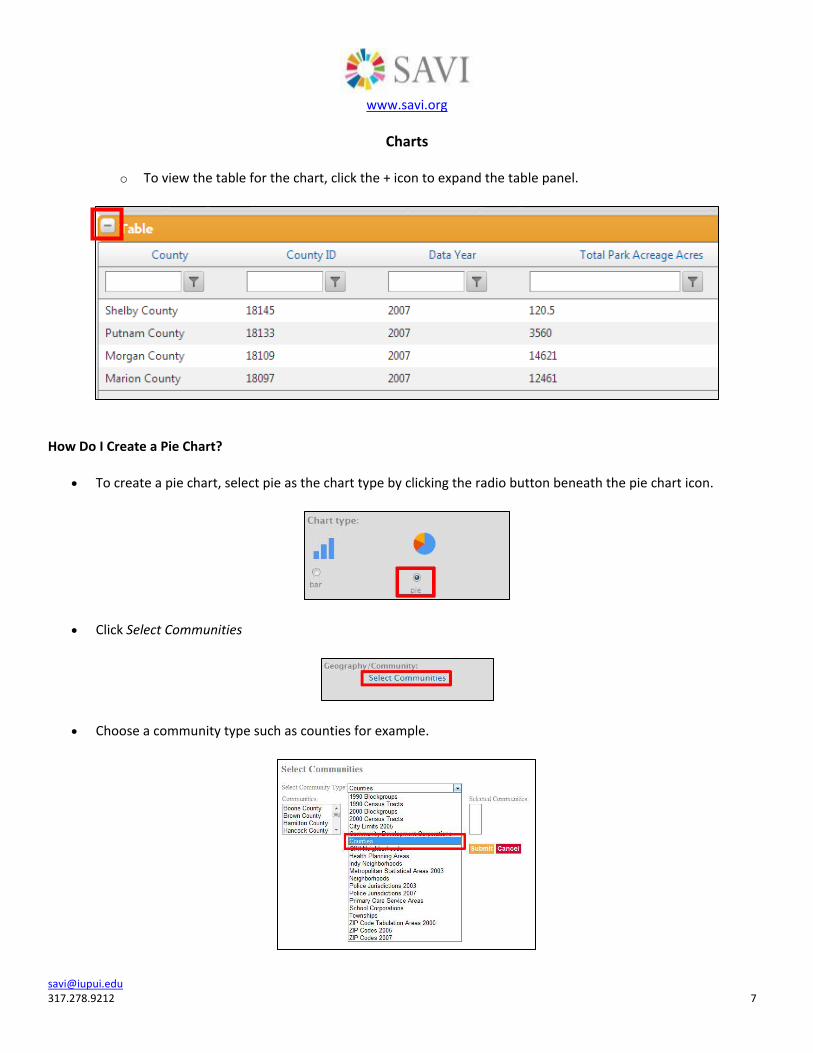
o To view the table for the chart, click the + icon to expand the table panel.
How Do I Create a Pie Chart?
To create a pie chart, select pie as the chart type by clicking the radio button beneath the pie chart icon.
Click Select Communities
Choose a community type such as counties for example.
www.savi.org
Charts
[email protected] 317.278.9212 8
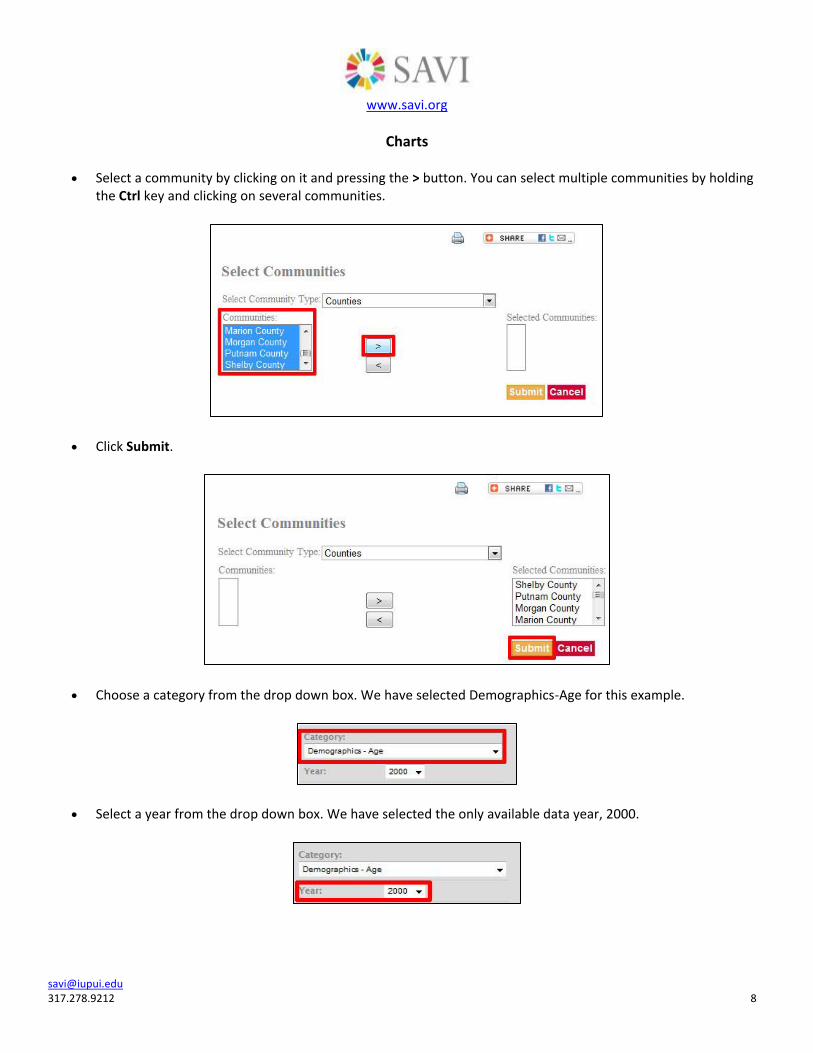
Select a community by clicking on it and pressing the > button. You can select multiple communities by holding the Ctrl key and clicking on several communities.
Click Submit.
Choose a category from the drop down box. We have selected Demographics-Age for this example.
Select a year from the drop down box. We have selected the only available data year, 2000.
www.savi.org
Charts
[email protected] 317.278.9212 9
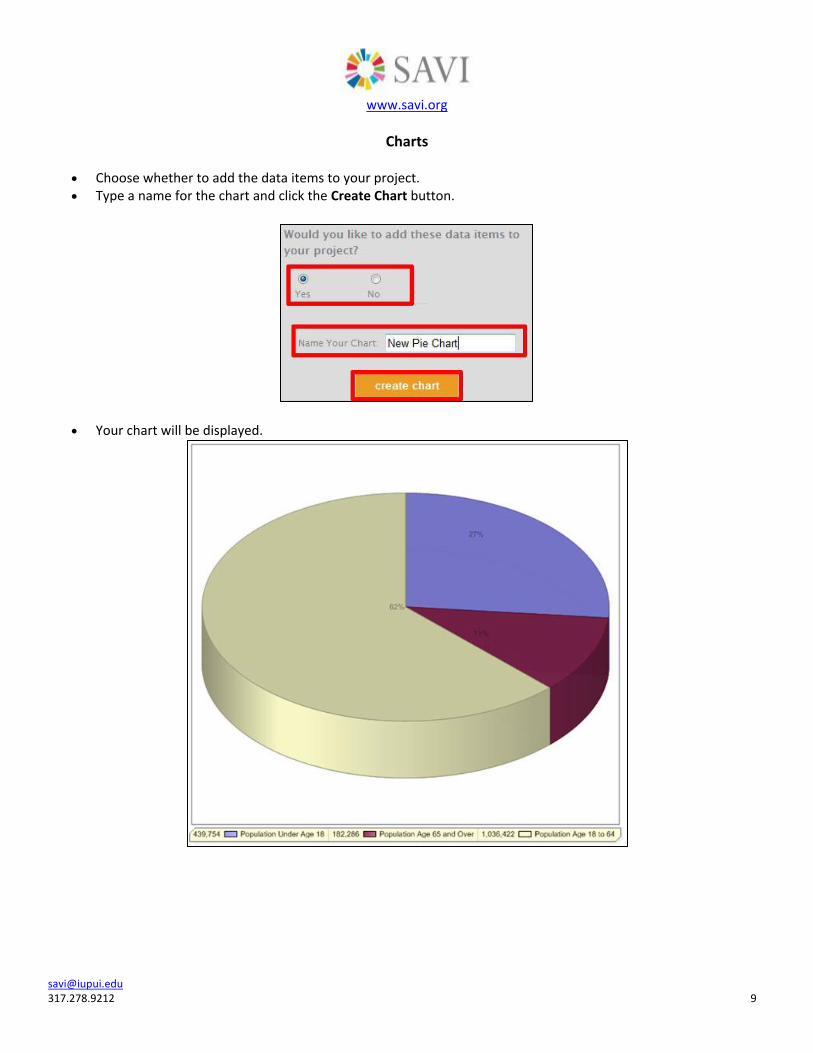
Choose whether to add the data items to your project. Type a name for the chart and click the Create Chart button.
Your chart will be displayed.
www.savi.org
Charts
[email protected] 317.278.9212 10
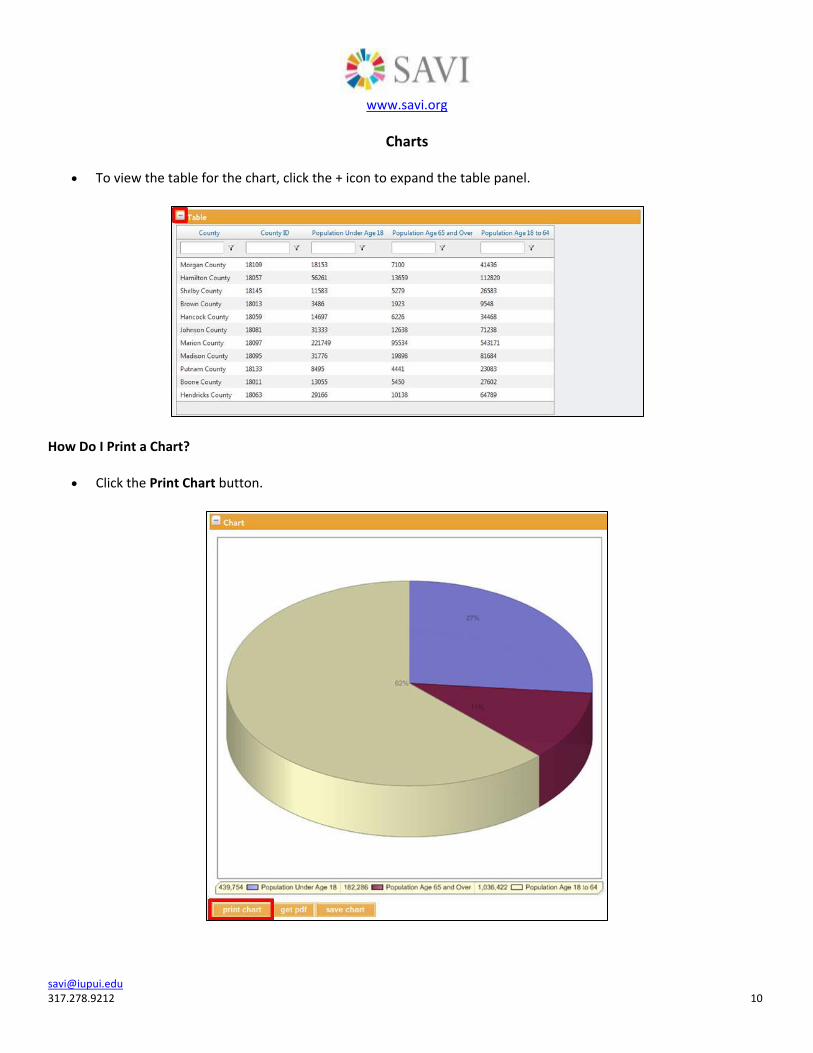
To view the table for the chart, click the + icon to expand the table panel.
How Do I Print a Chart?
Click the Print Chart button.
www.savi.org
Charts
[email protected] 317.278.9212 11
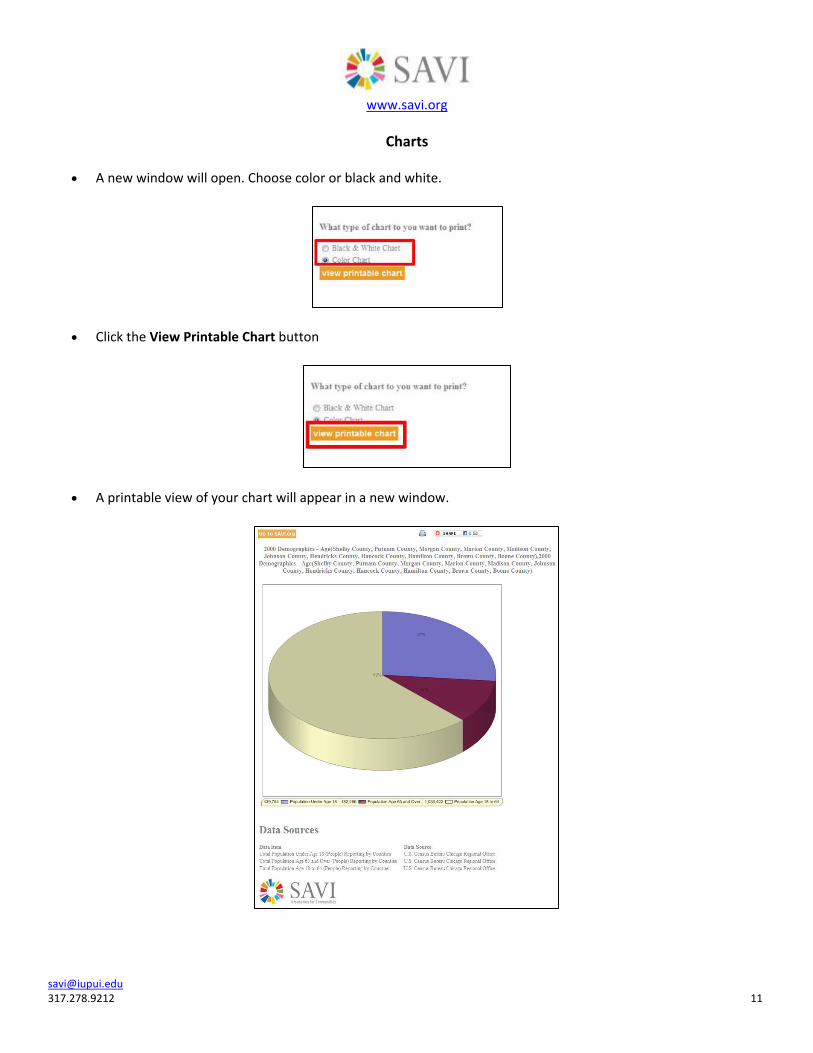
A new window will open. Choose color or black and white.
Click the View Printable Chart button
A printable view of your chart will appear in a new window.
www.savi.org
Charts
[email protected] 317.278.9212 12
Click file then click print. Select your personal printing preferences. Note: the printing process may differ depending on your browser or operating system. If the print dialogue does
not automatically display, click File then click print. If the File menu is not visible, press the Ctrl + P keys to display the print dialogue.
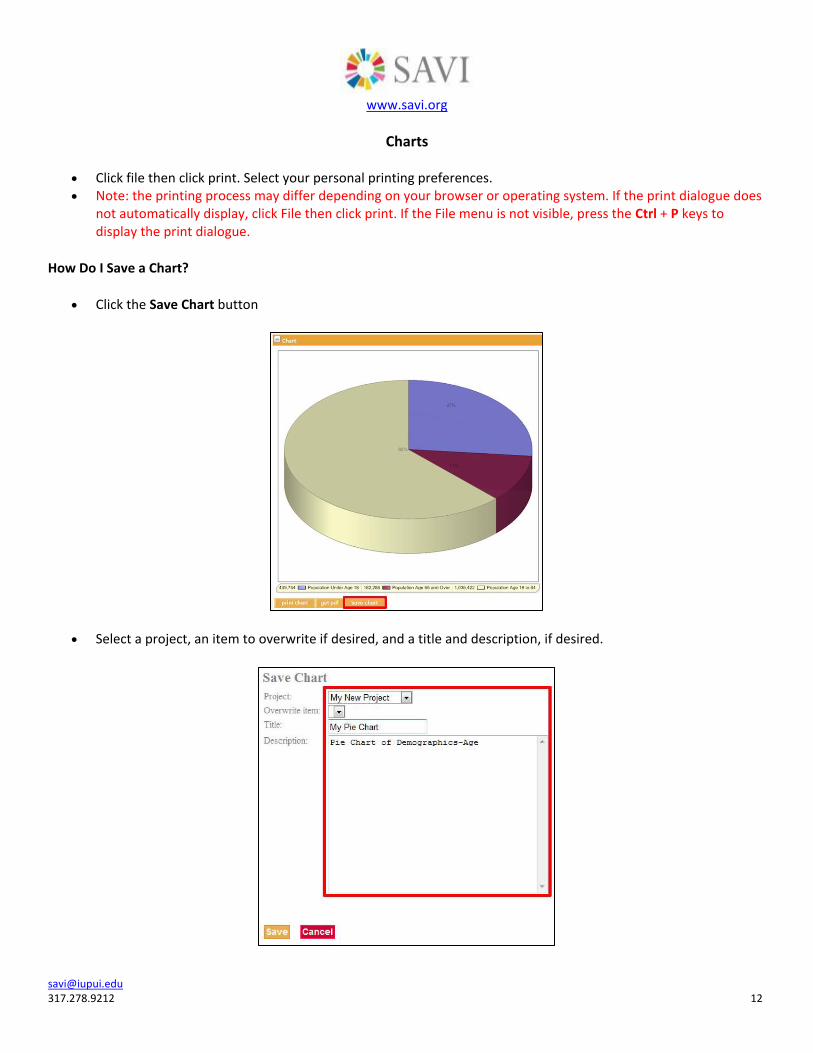
How Do I Save a Chart?
Click the Save Chart button
Select a project, an item to overwrite if desired, and a title and description, if desired.

www.savi.org
Charts
[email protected] 317.278.9212 13
Click the Save button
The chart will be saved to your project
What are the Chart Options?
Pie Chart Options o If you have created a pie chart, the following options are available: chart type, chart labels, and chart
comparison.
www.savi.org
Charts
[email protected] 317.278.9212 14
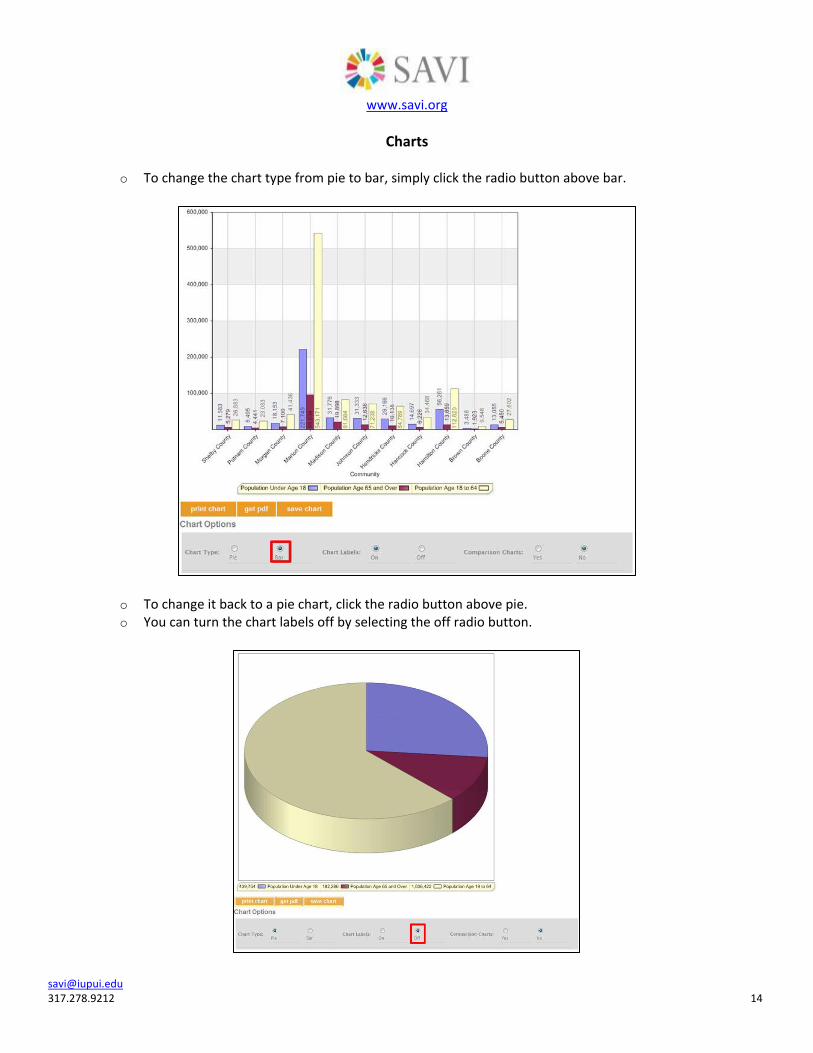
o To change the chart type from pie to bar, simply click the radio button above bar.
o To change it back to a pie chart, click the radio button above pie. o You can turn the chart labels off by selecting the off radio button.
www.savi.org
Charts
[email protected] 317.278.9212 15
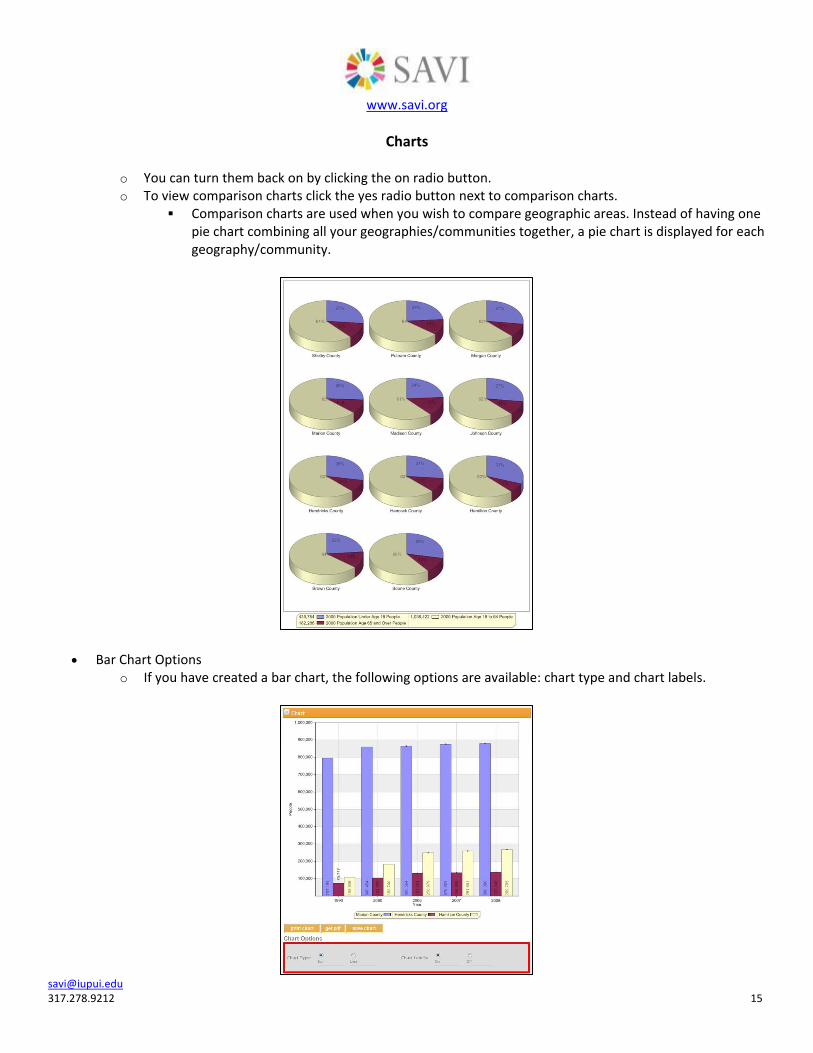
o You can turn them back on by clicking the on radio button. o To view comparison charts click the yes radio button next to comparison charts.
Comparison charts are used when you wish to compare geographic areas. Instead of having one pie chart combining all your geographies/communities together, a pie chart is displayed for each geography/community.
Bar Chart Options o If you have created a bar chart, the following options are available: chart type and chart labels.
www.savi.org
Charts
[email protected] 317.278.9212 16
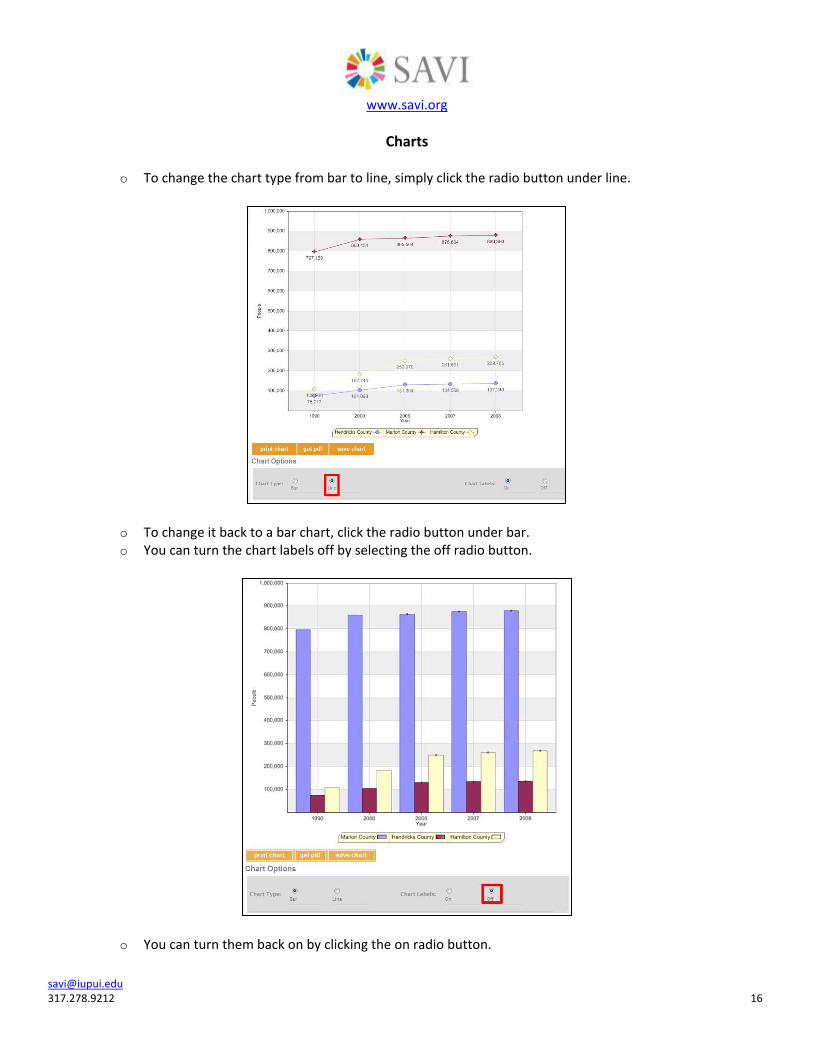
o To change the chart type from bar to line, simply click the radio button under line.
o To change it back to a bar chart, click the radio button under bar. o You can turn the chart labels off by selecting the off radio button.
o You can turn them back on by clicking the on radio button.