chatacterization of time-independent properties of formed
TRANSCRIPT

• -
I
ORNL/TM-6609
Characterization of Time-IndependentProperties of Formed and Welded Pipe
for Breeder Reactor Applications
J. W. McEnerneyV. K. Sikka
CENTRAL RESEARCH LIBRARYCIRCULATION SECTION
4500N ROOM 17 5
LIBRARY LOAN COPYDO NOT TRANSFER TO ANOTHER PERSON
If you wish someone else to see thisreport, send in name with report andthe library will arrange a loan.
OAK RIDGE NATIONAL LABORATORYOPERATED BY UNION CARBIDE CORPORATION • FOR THE DEPARTMENT OF ENERGY

Printed in the United States of America. Available from
the Department of Energy,Technical Information Center
P.O. Box 62, Oak Ridge, Tennessee 37830Price: Printed Copy $6.50; Microfiche $3.00
This report was prepared as an account of work sponsored by an agency of the UnitedStatesGovernment. Neither the United States Government nor any agency thereof, norany of their employees, contractors, subcontractors, or their employees, makes anywarranty, express or implied, nor assumes any legal liability or responsibility for anythird party's use or the results of such use of any information, apparatus, product orprocess disclosed in this report, nor represents that its use by such third party wouldnot infringe privately owned rights.

Contract No. W-7405-eng-26
METALS AND CERAMICS DIVISION
ORNL/TM-6609
Distribution
Category UC-79b,-h,-k
CHARACTERIZATION OF TIME-INDEPENDENT PROPERTIES OF
FORMED AND WELDED PIPE FOR BREEDER REACTOR APPLICATIONS
J. W. McEnerney V. K. Sikka
Date Published: April 1979
OAK RIDGE NATIONAL LABORATORY
Oak Ridge. Tennessee 37830operated by
UNION CARBIDE CORPORATION
for the
DEPARTMENT OF ENERGY


CONTENTS
ABSTRACT 1
1. INTRODUCTION 2
2. DESCRIPTION OF THE FIVE FORMED AND WELDED PIPES 5
3. ECONOMIC EVALUATION 12
4. DESCRIPTION OF THE FORMING AND WELDING PROCESS 13
5. NONDESTRUCTIVE EVALUATION 21
5.1 Dimensional Evaluation 21
5.2 Determination of Weld Ferrite Number 33
5.3 Radiographic Inspection 34
6. DESTRUCTIVE EVALUATION 35
6.1 Sectioning of Pipes 356.2 Metallographic Characterization 366.3 Ferrite Evaluation 53
7. MECHANICAL PROPERTY CHARACTERIZATION 67
7.1 Test Procedure 69
7.2 Data 70
7.3 Engineering Stress-Strain Curves 707.4 Comparison of Weld Properties with Upper and Lower Bounds for the
Wrought Material 707.5 Comparison of Weld Properties with Base-MetalProperties 757.6 Comparison between GTA (E-13) and SA (H-22) Welded Pipes 847.7 Estimate of Residual Cold Work in the Base Metal and Weld 85
7.8 Role of Carbon and Nitrogen on Tensile Properties 877.9 Stress-Strain Behavior (up to 5% Strain) 917.10 Photographs of Tensile-Tested Specimens 927.11 Summary of Mechanical Property Characterization 108
8. CONCLUSIONS 109
ACKNOWLEDGMENTS 110
REFERENCES 110
in

CHARACTERIZATION OF TIME-INDEPENDENT PROPERTIES OF
FORMED AND WELDED PIPE FOR
BREEDER REACTOR APPLICATIONS*
J. W. McEnerney V. K. Sikka
ABSTRACT
Five commercially available large-diameter, thin-wall, formed and welded pipes were procured tocharacterize their time-independent properties for breeder reactor applications. The pipes were0.91-m-OD by 12.77-mm-wall by 1.83-m-long type 316 stainless steel with solution-annealedlongitudinal seam welds made by the gas tungsten-arc (GTA) or submerged-arc (SA) processes withtypes 16-8-2 or 316 stainless steel, or with no filler metal. A comparison between the pipe used for theFast-Flux Test Facility (FFTF) and these pipes showed the latter to be less expensive.
Nondestructive evaluation of the pipes included dimensional characterization, determination ofweld ferrite number, and radiographic inspection. The dimensional evaluation indicated that themajority of the pipes did not fully comply with the commercial specifications for which they wereprocured. Based upon this evaluation, a recommendation is made that direct measurements in therestrained condition should be used to characterize pipe ends for weld fitup. Three of the five pipeshad a magnetically determined weld ferrite number of zero, while the other two had values ofapproximately 4 or less.
Destructive evaluation of the pipes included metallographic characterization and ferrite contentdetermination. The metallographic characterization included evaluation of both macro- andmicrostructural details. The macrostructural analysis highlighted the differences that can occurbetween welds made by the same process. In addition, it revealed some end discontinuities which werenot detected by the normal inspection techniques. The microstructural analysis indicated that thewelds contained mixed substructures which ranged from dendritic to cellular. The ferrite evaluationindicated that values obtained by calculation of the ferrite number from chemical analysis can bedeceptive due to the effects of solution annealing and is also dependent upon dilution eifects and theinclusion of nitrogen in analyses for GTA welds. A difference was shown to exist betweenmagnetically determined ferrite number and optically determined ferrite content. A good correlationwas shown between destructively and nondestructively determined ferrite number based uponmagnetic permeability measurements.
Tensile testing of base-metal and weldment specimens in the as-received condition was performedat room temperature, 427, 538, and 649°C, while reannealed specimens were tested at roomtemperature and 649°C. Significant differences were shown to exist between the stress-strain curves ofthe base metal and weld. A comparison of weldment properties with scatter bands of eight wroughtheats showed that yield strength (YS) was comparable, but ultimate tensile strength (UTS), uniform,and total elongation and reduction in area had values which fell outside the scatter band. Directcomparison of the weldment and base-metal properties of the pipes showed the same trend as indicated above. A comparison of a pipe welded by GTA and one welded by SA showed the latter to beweaker. Based upon models which predict creep and stress-rupture properties for base metal fromUTS, the weldments are predicted to be weaker than the base metal, with GTA better than SA. Anevaluation of the residual cold work in the pipes indicates that YS is more affected than UTS, with thewelds generally having higher levels of residual stress than the base metal. The effect of this residualstress on elevated-temperature properties is not considered to be significant. Carbon and nitrogen areshown to play an important role in determining the YS and UTS of the base metal and weld. Weshowed that it is possible to predict the stress-strain behavior for both the base metal and weld, usingbase-metal constants. However, for accurate prediction of weld behavior, a modified steady-statestrain-hardening constant is needed. Photographs of the tensile-tested transverse weld specimensshowthat the weld is the weakest link, because this was the location of all failures.
*Work performed under DOE/RRT 189a OH103, Piping and Fittings Development.

1. INTRODUCTION
In current United States1'2 designs for breeder reactors (BR), primary and intermediate coolantsystems operate at high temperature and low pressure and utilize sodium as the heat transfer medium. Due
to this medium, operating temperatures in the creep range, and potentially rapid thermal transients, design
considerations for BR primary and intermediate coolant piping are significantly different than for
light-water reactors (LWR).
Figure 1 shows a schematic diagram of one of the three loops in the Clinch River Breeder Reactor Plant
(CRBRP) heat transport system. Since the CRBRP was designed as an intermediate step toward a
commercial BR,1 the design considerations applicable to its primary and intermediate sodium coolantsystems should be generic of loop systems. The schematic of the CRBRP heat transport system shows that
the hot leg of the primary sodium systemwilloperate at about 535°C, while the hot leg of the intermediatesodium system will operate at about 500°C. Both of these operating temperatures are within the creeprange and therefore exceed temperatures for which allowable stress values are given in ASME Code, Section
III, Division 1.3
ASME Code Case N47, formerly Code Case 1592,4 provides rules for materials, design, fabrication, andinspection. This code case considers time-dependent material properties and guards against time-dependent
rupture modes such as creep rupture, creep fatigue, and gross distortion due to ratchetting. The design of
components is based upon the control of both load and deformation. Because of the potential for reduced
ductility and strain concentration in weldments, Code Case N-47 limits the calculated strain for the weld
region to one-half the values permitted for the base metal. However, base material properties are used in the
PRIMARY
SODIui PUMP
— PRIMARY SODIUM SYSTEM
INTERMEDIATE SODIUM SYSTEM
STEAM SYSTEM
ORNL-OWG 78- 11326
2?^1F TO TURBINE_». GENERATOR
- STEAM DRUM
V — ' —r, , , y 468°F FROM HIGHY__^z_
FROM HIGF
PRESSUREFEEDWATER
HEATERS
P-W-: l^-EVAPORATORS
i ^^ j65I°F
• RECIRCULATION
PUMP
Fig. 1. Schematic diagram of one of three loops in the Clinch River Breeder Reactor Plant heat transport system,showing the primary and intermediate sodium circuits and portions of the steam circuit (ref. 1).

design of weldments. In addition, time-dependent metallurgical structure changes are considered, forexample, by limiting the amount of delta ferrite in austenitic stainless steel welds.
Figure 2 shows the primary and portions of the intermediate sodium pipingsystemin one of the threeloops in the CRBRP. The hot-leg piping for both the primary and intermediate sodium systems will be type316 stainless steel, while the cold leg will be type 304 stainless steel. Type 316 stainless steel was selectedfor the hot-leg piping in both the CRBRP and the FFTF because of its superior elevated-temperatureproperties.2,5 However, the use of sodium as the cooling medium imposes additional material and designrequirements. The sodium can cause interstitial transfer (decarburization) and mass transfer (corrosion) tooccur on the inside surface of the austenitic stainless steel pipe.2 To account for the interstitial transfer,high-carbon or H-grade materials are used to assure that a specified minimum level of carbon is present atthe end-of-life. Additional material is used to provide an allowance for mass transfer.
Because of potentially rapid thermal transients and the low operating pressure in BR primary andintermediate sodium systems, thin-walled piping (9.5 mm for FFTF and 12.7 mm for CRBRP) is used to
reduce the thermal stress gradient across the wall thickness. The control of wall thicknessvariations is alsoimportant in reducing thermal stress gradients. Code Case N47 specifically cautions the designer that since
dimensional standards for piping components do not control the maximum wall thickness, additional
controls may have to be imposed when significant thermal transients are anticipated.
Because of the high thermal output and low operating pressure of BRs, large-diameter piping will be
required to provide the necessary coolant flow. The FFTF utilized 0.71-m-OD primary coolant piping.Figure 2 shows that the CRBRP primary hot-leg piping from the reactor to the primary sodium pump is
I 1 PRIMARY SODIUM SYSTEM
^m INTERMEDIATE SODIUM SYSTEM
SODIUM EXITS INTERMEDIATEHEAT EXCHANGER AT 50CTC (932*F)FLOW RATE: 1.86 m*/i (3942 ftVmin)
DESIGN PRESSURE 2 24 MN/rrf (325 psi}
SODIUM ENTERS REACTORFROM INTERMEDIATE
HEAT EXCHANGER
AT 385*C <725*F)DESIGN PRESSURE1.38 MN/m' (200 psi)
SODIUM
EXITS REACTOR
AT 535°C (995°F>FLOW RATE
2 1 mVs (4450 HVmin
DESIGN PRESSURE
ORNL-DWG 76-47368
1 REACTOR VESSEL
TYPE 304 STAINLESS STEELWALL THICKNESS - 63.5 mm (- Tt, in )HEIGHT 17.4 m (57 ft)DIAMETER 6 1 m (20 It)
2 SODIUM FROM REACTOR TO PRIMARYPUMP (HOT LEG)
TYPE 316 STAINLESS STEEL PIPINGDIAMETER 914 mm (36 in.)WALL THICKNESS 12 7 mm {0 5 in )
4 SODIUM FROM PRIMARY PUMP TOINTERMEDIATE HEAT EXCHANGER (MOT
LEG)TYPE 316 STAINLESS STEEL PIPINGDIAMETER 610 mm (24 in )
WALL THICKNESS 12 7 mm (0 5 in )
6 SODIUM FROM INTERMEDIATE HEAT
EXCHANGER TO REACTOR (COLD LEG)TYPE 304 STAINLESS STEEL PIPING
DIAMETER 610 mm (24 in )WALL THICKNESS 12 7 mm (0 5 in )
7 SODIUM FROM INTERMEDIATE HEAT
EXCHANGER TO SUPERHEATER
TYPE 316 STAINLESS STEEL PIPINGDIAMETER 610 mm (24 in.)WALL THICKNESS 12 7 mm (0 5 in )
6 SOOIUM FROM INTERMEDIATE SODIUM
PUMP TO HEAT EXCHANGER
TYPE 304 STAINLESS STEEL PIPINGDIAMETER 610 mm (24 m)
WALL THICKNESS 12 7 mm (0 5 in )
Fig. 2. Primary and portions of intermediate sodium piping system in one of the three loops in the Clinch RiverBreeder Reactor Plant (ref. 5).

0.91 m in outside diameter. Commercial-size BRs have been projected to have piping which could range
from 0.91 to 1.32 m in outside diameter. The combination of the large diameter and the thin wall
introduces problems in both the manufacturing of the pipe and the shop and field fabrication. The methods
used to manufacture this pipe must provide good dimensional control to reduce variations in wall thickness
and diameter. Tight control of the wall thickness is primarily necessary because of the previously discussed
effects of thermal transients. Diametral and wall thickness control are important for fitup during shop and
field welding. The need for diametral control is also important because circumferential and axial bending
stresses can be produced in out-of-round pipe due to internal pressure.6'7 These stresses are classified aspeak and are only considered in the fatigue analysis.7 In addition to dimensional control, themanufacturing and fabrication techniques must provide base-metal and weldment properties which are
adequate for the service conditions. However, it is also important that the cost of the piping be minimized
to enable a commercial BR to be economically competitive.
The FFTF utilized hot-extruded and -worked and hot-extruded and -machined pipe to achieve the
integrity required for its primary and intermediate sodium coolant systems. The starting material in both of
these manufacturing processes was a heavy-walled, hot-extruded pipe section. In the former process, the
hot-extruded pipe was reduced to the desired thickness and diameter by performing several cold-working
sequences with intermediate anneals. The cold reduction is accomplished by a rotary point extrusion
process in which rotating rollers or stationary rollers with a rotating preform move axially over the inside or
outside surface, applying both reduction and extrusion forces. This process provides tight dimensional
control of the piping as shown by dimensional data for two sections of FFTF primary coolant piping (Table
1). In addition, extensive mechanical properties characterization of the FFTF extruded and worked piping
by Hanford Engineering Development Laboratory (HEDL) has demonstrated10 its acceptable tensile,creep-rupture, and fatigue crack propagation properties. The FFTF extruded and machined pipe was
manufactured by machining the extruded pipe to the final dimensions. Dimensional control would
therefore be expected to be inherently good. Earlier tensile and stress-rupture testing at HEDL11 indicatedthat the strength and ductility of extruded and worked pipe were slightly superior to those of extruded and
machined pipe.
Although the two methods for manufacturing the FFTF sodium piping provided high-quality pipe with
good dimensional control, the costs were relatively high. Because of these high costs, several different
manufacturing methods are being evaluated for follow-on BR sodium coolant systems. These additional
methods include forming and welding, centrifugally casting and working, and hot extruding.
A program is in progress at ORNL to characterize large-diameter, thin-wall austenitic stainless steel pipe
made by various fabrication methods. As part of this program, five lengths of formed and welded pipe were
procured from several commercial suppliers. Pipes manufactured by this process were chosen for
Table 1. Dimensional evaluation of two FFTF 0.71-m-OD X 9.53-mm-wall X 4.57-m-long
(28 in. X 0.375 in. X 15 ft) hot-extruded and -worked pipe sections
Attained tolerance" [in. (mm)] Required tolerance" [in. (mm)](ref. 8) (ref. 9)
Wall thickness -0.001 to +0.008 (-0.025 to +0.203) ±0.047 (±1.194)
Inside diameter -0.023 to +0.020 (-0.584 to ±0.508) ±0.031 (±0.787)
Inside diameter ovality 0.009 to 0.026 (0.229 to 0.660) 0.062 max (1.575)
Camber (max in 10 ft) 0.100 (2.540) 0.125 (3.175)
"Dimensions given in English units to facilitate comparison with existing specifications.

characterization because they would be representative of a common commercial method for manufacturing
pipe in the United States. In addition, this process has a wide range of size capability, limited only byavailable plate. Since the forming and welding process is generally considered to be one of the mosteconomical methods for manufacturing large-diameter, thin-wall pipe, it has been strongly considered forcommercial BR sodium coolant applications. The potential disadvantagesof the process are that the ability
to control dimensions may not be adequate, and since the pipe is a nonhomogeneous material, separate
analytical treatment of the base metal and weldment may be required.
The purpose of this report is to characterize the time-independent properties of the five formed andwelded pipes which were procured. Additional work is in progress to characterize their time-dependent
properties.
2. DESCRIPTION OF THE FIVE FORMED AND WELDED PIPES
The five formed and welded pipes were procured between August 1976 and February 1977, in
accordance with modified ASME code material specifications. The plate used to form the pipes wasmanufactured in accordance with SA-240, type 316,12 while the pipes were manufactured in accordancewith SA-35813 and SA-312.14 The pipes were manufactured and certified in accordance with therequirements of ASME Code, Section III, Division 1, Class 1ls or 2.16 Each of the pipe sections was 1.83m long, with wall thickness and outside diameter prototypic of the CRBRP (0.91-m OD by 12.77-mmwall). Table 2 provides a summary of the identification, material specifications, code class, welding process,filler metal, final heat treatment, and hydrostatic test pressure for these pipes. ORNL modifications to theASME code material specifications were used to incorporate additional requirements imposed by RDTstandards and to obtain material suitable for BR sodium coolant piping applications. Table 3 lists the
additional requirements imposed by the ORNL specifications. Several of the fabricators took exception tosome of the requirements in both the ASME code and ORNL specifications. These exceptions are shown inTable 4. Although some additional requirements were specified, the five pipes can be considered to be
representative of commercially available large-diameter, thin-wall formed and welded pipe. Therefore, the
exceptions taken, as shown in Table 4, reflect the commercial practice of the individual fabricators.However, it also must be recognized that since the procurement was small, certain aspects of the
manufacturing will not be totally representative of large orders.
Table 2. Fabrication information for formed and welded 1.83-m-long by 0.91-m-OD by 12.70-mm-wall pipesof type 316 stainless steel
Identification
ASME Code,
Section II,material specifications
ASME Code,
Section III,
class
Welding
process
Filler
metal
Final heat
treatment*2Hydrostatic
test
Temperature
(°C)Time
(hr)
pressure
Plate Pipe (MPa)
E-13 SA-2406 SA-358C 1 GTA with both hot
and cold wire additions
16-8-2 1060 0.5 2.76
F-14 SA-2406 SA-358C 1 GTA with cold
wire additions
16-8-2 1066 0.2
(min)
3.10
G-15 SA-2406 SA-358C 1 GTA with cold wire
addition and SA
316 1093 0.5
G-16 SA-2406 SA-312d 2 Autogenous GTA None 1038-1066 0.5
H-22 SA-2406 SA-358C 1 SA 16-8-2 1066 0.8 3.45
"Followed by water quench.6With additional requirements per specification ORNL MET-WB-MS-3 (ref. 17).'With additional requirements per specification ORNL MET-WB-MS-2 (ref. 18).dWith additional requirements per specification ORNL MET-WB-MS^I (ref. 19).
GTA = gas tungsten-arc.
SA = submerged-arc.

Table 3. Additional requirements imposed by ORNL specifications
Additional requirements
1. Minimum carbon content of
0.04%
2. Heat treatment of plate andfinished pipe to be solution
annealed at 1038 to 1079°C
followed by water quench orother rapid cooling; ASTMA-262, practice H corrosiontest required to verify ade
quacy of cooling rate
3. Ultrasonic examination of the
starting plate by angle and
straight beam
4. Specific surface finish re
quirements for plate andfinished pipe
5. Radiographic examination
of welds at two different
angles at least 30°, butnot more than 150°, apart
ORNL specifications (ASME code specification)
MET-WB-MS-3 MET-WB-MS-2 MET-WB-MS4
(SA-240) (SA-358) (SA-312)
Table 4. Fabricator's exceptions to the requirementsof the ASME code and ORNL specifications
ASME code
Identification and ExceptionsORNL specifications
F-13 SA-240, SA-358, MET-WB-MS-3, None
and MET-WB-MS-2
1-14 SA-240, SA-358, MET-WB-MS-3, None
and MET-WB-MS-2
G-15 SA-240, SA-358, MET-WB-MS-3, 1. The tolerance on the
and MET-WB-MS-2 outside diameter was ±1.0%
instead of 0.57c
2. The range of temperaturefor heat treatment of the
plate was 1093 to 1121°Cinstead of 1038 to 1079°C;the temperature for the
heat treatment of the fin
ished pipe was 1093°C instead of 1038 to 1079°C
3. Hydrostatic test was not
performed
G-16 SA-240, SA-312, MET-WB-MS-3, Same as pipe G-15and MET-WB-MS-4
H-22 SA-240, SA-358, MET-WB-MS-3, The temperature forand MET-WB-MS-2 the heat treatment of the plate
was 1038°C minimum instead of
1038 to 1079°C
Figures 3 through 7 show front andendviews of the five pipes witha close-up of one of the ends of thelongitudinal seam weld. The ASME code plate can be seen on the pipes in Figs. 4(a) and 1(b). The personshown standing in Fig. 5(a) provides a good perspective of the overall size of the pipe. Theweld end crosssection can be seen in Figs. 3(c), 4(c), and 5(c) as a result of the pickling operation. However, it cannot beseen in Fig. 6(c) due to grinding, and in Fig. 7(c) due to machining. Internal and/or external surfacegrinding marks can be seen on all five pipes.

Fig. 3. Pipe E-13, type 316 stainless steel formed and welded pipe, GTA welded with type 16-8-2 filler metal,0.91-mOD by 12.7-mm wall by 1.83-m length, (a) Front view showing dimensional inspection grid, (ft) end view with diametralinspection locations, (c) close-up of weld end.

ORNL PHOTO 6037-76
Fig. 4. Pipe F-14, type 316 stainless steel formed and welded pipe, GTA welded with type 16-8-2 filler metal, 0.91-mOD by 12.7-mm wall by 1.83-m length, (a) Front view showing dimensional inspection grid, (b) end view with diametralinspection locations, (c) close-up of weld end.

ORNL-PHOTO 6107-76
OAK RIDGE NATIONAL LABORATORY
wr.Wto I
Fig. 5. Pipe G-15, type 316 stainless steel formed and welded pipe, GTA and SA welded with type 316 filler metal,0.91-m OD by 12.7-mm wall by 1.83-m length, (a) Front view showing dimensional inspection grid, (b) end view withdimensional inspection locations, (c) close-up of weld end.

10
Fig. 6. Pipe G-16, type 316 stainless steel formed and welded pipe, autogenously GTA welded, 0.91-m OD by12.7-mm wall by 1.83-m length, (a) Front view showing dimensional inspection grid, (b) end view with diametral inspection locations, (c) close-up of weld end.

Fig. 7. Pipe H-22, type 316 stainless steel formed and welded pipe, SA welded with type 16-8-2 filler metal, 0.91-mOD by 12.7-mm wall by 1.83-m length, (a) Front view showing dimensional inspection grid, (b) end view with diametralinspection locations, (c) close-up of weld end.

12
3. ECONOMIC EVALUATION
As a part of the procurement of the five formed and welded pipes, the fabricators were also requested
to bid on the cost per unit length for the manufacturing of 30.48 m, to be supplied in five 6.10-m lengths,
of the same type of pipes as described in Table 2. Two optional requirements were specified for
manufacturing this pipe. Only three of the four fabricators were requested to bid on the 30.48 m of pipe
with the two optional requirements. The fabricator of pipe H-22 was asked to bid without the optional
requirements. The first optional requirement specified that the inside diameter of the pipe be controlled to
a maximum of 35.09 in.* at any point as measured by an inside micrometer, caliper, or equivalent. The
second optional requirement included the requirement of the first option and added that the
inside-diameter ovality within 0.30 m from each end should be controlled to 0.030 in. maximum (i.e., the
difference between the maximum and minimum inside diameters cannot exceed 0.030 in.). The purpose of
requesting bids on 30.48 m of pipe with these additional dimensional control requirements was to obtain
more meaningful economic data on piping representative of that which would be required for BRs.
The three fabricators that were asked to bid on the optional requirements would not agree to meet
these requirements. However, the fabricator of pipe F-14 did agree to tighten the ovality requirement from
1% to 0.5% of the outside diameter. This increased dimensional control also applied to the 1.83-m length of
pipe which was procured.
Table 5 shows the quotations that were received from the various fabricators for both the 1.83 and
30.48 m of pipe. These quotations indicate that there is a wide degree of variation between different
Table 5. Summary of quotations3 for type 316 stainless steel formed and welded pipe
Fabricator ASME Code, Section II, ASME Code Section III, WeldingQuotation ($/m)
code pipe specification class process 1.83-m
length30.48-m
length
E SA-358 1 GTA 3807 No response
F SA-358 1 GTA 4954 2008
G (distributor 1) SA-358 1 GTA or
SA
4482 No response
G (distributor 2) SA-358 1 GTA or
SA
5154 3648
G (distributor 1) SA-312 2 GTA 3245 No response
G (distributor 2) SA-312 2 GTA 5154 3648
H SA-358 1 SA 6762 4029
"Quotations made between March and June of 1976 for 1.83 and 30.48 m of 0.91-m-OD by 12.70-mm-wall pipe.
fabricators and even between different distributors for the same fabricator. As expected, these quotations
show that the price per unit length of pipe decreases as the total length of the order increases. Because the
FFTF primary hot-leg piping was smaller in diameter and wall thickness and was purchased approximately
four years earlier, it is impossible to make a direct cost comparison. However,an estimated comparison can
♦All dimensions which deal with dimensional tolerance control will be given in English units to facilitate comparisonwith existing specifications.

13
be made by adjusting the price of the FFTF pipe to account for these differences. The adjustments made to
the cost per unit length of the FFTF primary hot-leg pipe (0.71-m-OD by 9.53-mm-wall) are:
1. Multiply the original unit cost by the ratio of the cross-sectional area of 0.91-m-OD by 12.70-mm-wall
pipe to 0.71-m-OD by 9.53-mm-wall pipe to account for differences in material.
2. Add 30% of the original unit cost to the value determined in item 1 to account for additional
manufacturing costs.
3. Multiply the value obtained in item 2 by a compound interest factor to account for 7% inflation per
year for four years.
Table 6 shows a comparison of the costs for FFTF piping and formed and welded pipe prototypic of
CRBRP, using the adjustment calculation outlined above. In addition, after normalizing both costs in terms
of 1976 dollars, they were both adjusted to indicate the cost in 1978. Because several assumptions were
utilized, the cost comparisons shown in Table 6 are subject to some degree of error. However, these
comparisons do indicate that the use of formed and welded pipe has the potential for significantly lowering
the material cost per unit length. The specific cost for formed and welded pipe would still be a function of
the requirements imposed for a particular BR and would therefore vary accordingly.
Although the preceding evaluation has indicated that formed and welded pipe is economically desirable,
a thorough investigation of its other characteristics is necessary before identifying it as a favorable method.
The refusal of three manufacturers to bid on pipe with increased dimensional control is indicative of an area
of weakness for this manufacturing method.
Table 6. Comparison of costs for FFTF piping" andformed and welded pipe prototypic of CRBRP
Piping1974 cost 1976 cost 1978 cost
($/m) ($/m) ($/m)
FFTF" 16026 4218C 4809d
Formed and welded 2008-4029* 2289-4593dprototypic of CRBRP
a0.71-m-OD by 9.53-mm-wall, type 316H stainless steel, hot-extruded and-worked pipe.
6Bechtel Power Corporation purchase order No. 8776-M-106AC (ref. 20).cObtained by adjusting the 1974 cost as follows: (1) multiply 1974 cost by
the ratio of CRBR'P/FFTF pipe cross-sectional area (X 1.71); (2) add 30% ofthe 1974 cost to item 1; (3) multiply item 2 by the compound interest factorto account for 7% inflation per year for four years (X 1.31).
^Obtained by adjusting the 1976 cost as follows: Multiply by the compound interest factor to account for 7% inflation per year for two years (X1.14).
eObtained from Table 5.
4. DESCRIPTION OF THE FORMING AND WELDING PROCESS
Forming and welding of plate is a common commercial method for producing pipe in the United States.
Plate can either be formed into a cylinder with a longitudinal seam, or it can be wound such that it has a
spiral seam which follows a helical path along the pipe. Figure 8 shows a schematic representation of
formed and welded pipes with longitudinal and spiral seams. The spiral winding of plate into pipe is limited

14
ORNL-DWG 78-11327
WELD
WELD
Fig. 8. Schematic representation of formed and welded pipe with (a) longitudinal seam, (b) spiral seam.
to thin plate or sheet. In addition, the uniformity of the spiral seam can be difficult to control if camber or
bowing is present.21 Because of these limitations, spiral-wound pipe has not been utilized for nuclearapplications. This discussion will therefore concentrate on formed and welded pipe with a longitudinalseam.
The first consideration in making formed and welded pipe is the starting plate. The size of formed and
welded pipe is usually only limited by the size of the available plate. Generally the size limitation would be
a function of the desired diameter and length of the pipe (i.e., as the diameter increased, the available
length would decrease). However, for heavy-wall thicknesses, ingot yield capacity at the rolling mill mightalso become a limiting factor. Wall thickness might also be limited by the forming capability of themanufacturer, although hot forming can essentially remove this Umitation. In general, the diameter is the

15
most flexible dimension, followed by wall thickness and length. Since the forming operations during themanufacturing of the pipe are not designed to appreciably affect the wall thickness, the plate rolling-milloperations determine the control of this dimension. Such factors as roll crown and type of finishingoperation (hot or cold) determine the mill's capability to control the wall thickness. Generally the mills areaccustomed to manufacturing plate in accordance with specifications which only limit the minimum wallthickness. By aiming the rolling operations to produce a heavier wall thickness than that required, theadverse effects of crowning canbe avoided while stillcomplying with the requirements. Obviously, it is noteconomically advantageous for the mill to supply plate that is significantly thicker than the minimumrequirement. It is also possible to pay a premium price to obtain plate with a greater degree of thicknesscontrol.
For ASME Code, Section III, Class 1 material,22 the plate is ultrasonically inspected prior to beingformed into a cylinder. Thisoperationwould usually be performed by the material supplier.
The first operation that the pipe manufacturer would perform is to gas or plasma-arc cut or shear theplate to the required blank size, which is generally determined by the length and mean circumference(circumference taken at the midpoint of the thickness) of the pipe to be manufactured.23 However, forgreater dimensional control, the exact location of neutral bending axis is used to calculate thecircumference and thereby establish the blank size.23 For example, it is reported23 that during coldforming, the neutral axis shifts inward approximately 26% from the mean plate thickness. During hotforming, the effects of botha shift in the neutral axis and thermal expansion must be accounted for if tightdimensional control is required.23
Once the blank is cut to the required size, the next operation is to prepare the twoedges to be welded.This edge preparation involves imparting the desired weld joint configuration and is usually performed bygas or plasma-arc cutting or planing. Figure 9 shows some of the typical weld joint configurations, withwelding passes superimposed,which would be used.
(a)
(c)
\2\
/1
(d)
ORNL-DWG 78-11328
/>-^±
kb)
(e)
Fig. 9. Typical weld joint configurations for longitudinal seam welds with welding passes superimposed; (a) squartbutt, (b) single V-groove on ID, (c) single V-groove on OD, (d) single U-groove on OD, (e) double V-groove. The outsidesurface of the pipe is up in all cases.

16
The first operation for forming plate into a cylindrical shape is normally crimping the edges to bewelded.24 Crimping consists in bending the edges to the proper radius so that there will not be a flatsurface near the longitudinal seam. Figure 10 shows a plate with both endscrimped andready for forming.Crimping of the plate is usually performed on a press or rolls.24 However, not all plate is necessarilycrimped before forming into a cylinder. Pipes which are not crimped would be expected to contain somedegree of flatness near the longitudinal seam.
ORNL-DWG 78-11329
INSIDE OF CYLINDER
OUTSIDE OF
CYLINDER
Fig. 10. Typical plate with both ends crimped and ready for forming.
After the plate has been crimped, the next operation is the roll or press forming of the plate into acylinder. Roll forming is generally used for short, heavy-wall pipe sections, while press forming is used forlonger, thinner-wall sections. Press forming is preferred for high-production-rate mills,whereas roll formingis more suited for smaller production runs with frequent size changes. Roll forming is usually performedwith three forming rolls. The three-roll forming machines can be either of two basic types: pinch roll orpyramid roll.23 Figure 11, as adopted from ref. 23, shows schematic diagrams of cylinders being rollformed in a conventional pinch-roll, shoe-type pinch-roll, and a pyramid-roll machine. The pinch-rollmachine can provide greater dimensional control and cover a wider range of thicknesses than the pyramidroll.23 The shoe-type pinch roll can reduce fattening effects on noncrimped plate and is suited for largerproduction runs of agiven size cylinder.23 However, it islimited in size capability and can only be used forcold forming. The conventional pinch-roll machine is therefore themostlikely equipment to be utilized forroll-forming BR piping.
Press forming is generally accomplished by a process referred to as"U-ing andO-ing." While the initialportion of the forming operation could be performed with a semicylindrical ram ana rocker dies or byincremental three-point bending on an open-gap press, the forming principles are the same in both cases.

17
DRIVE ROLL
(<7>
WORKPIECE
(6)
BENDING ROLL
FRONT <^c=0
(c)
ORNL-DWG 78-11330
WORKPIECE
BENDING ROLL
REAR
BENDING ROLL
REAR
WORKPIECE
<n REAR
DRIVE ROLLS
Fig. 11. End view of cylinders being roll formed in various types of machines; (a) conventional pinch-roll machineforming an initially crimped plate, (b) shoe-type pinch-roll machine forming a noncrimped plate, (<•) pyramid-roll machineforming an initially crimped plate.
Figure 12 shows schematic diagrams of the end view of cylinders being press formed by U-ing and O-ing,
with the initial forming operation being performed with rocker dies and three-point bending. The U-ingand
0-ing fabrication technique is used for high-production-rate operations where a largenumber of pipesof thesame size are to be produced. The use of the semicylindrical ram and rocker dies would provide the
capability for higher production rates; however, there would be restrictions on the thicknessof the plate tobe formed. Although the three-point incremental bending technique would not enable as high a production
rate, it would be capable of bending heavier plate. With either technique, the plate to be bent would be
crimped prior to forming. As shown in Fig. 12, the initial sequence of operations forms the plate into aU-shape, and then the final sequence forms a cylindrical O-shape. The forming operation is normally
performed cold.

ORNL-DWG 78-11331
w^y/^A
{a)
UW/ZA
Fig. 12. End view of cylinders being press formed by U-ing and 0-ing; (a) initial forming operation performed with asemicylindrical ram and rocker dies, (ft) initial operation performed by three-point bending on an open-gap press.
Once the plate has been formed into a cylindrical shape, the next sequence of operations could take
several possible paths. For one path the longitudinal seam between the two butted edges may be cleaned
and tack welded. This would enable storage of unwelded cylinders with minimization of shape distortion.
The cleaning operation would normally be performed by either shot blasting or grinding. As an alternate
path, the longitudinal seam might be cleaned and welded without utilizing a tack weld. The decision to use
tack welds would be a function of the joint design and storage requirements. If a joint design is used which
would require removal of the material in the vicinity of the tack weld, then the treatment of the tack weld
would be simplified because of its complete removal. In this situation the quality of the tack weld would
not be a concern, although the cost penalty for utilizing it would be present. Figure 13 shows some typical
joint designs which would totally remove the tack weld. Although the joint designs shown in Fig. 9(c), (d),and (e) might use tack welds, the ability to totally remove them would be reduced because of the smallamount of base metal present on the lands. However, tack welds can be incorporated in the final weld if
qualified procedures are followed and proper controls exercised over the operation. This again, however,adds to the cost. If tack welding is performed, it would be done with the cylinder clamped in a tacking
press, which would align the two edges of the longitudinal seam. An additional operation which might be

(a)
(b)
OUTSIDE
SURFACE
4^INSIDE
SURFACE
OUTSIDESURFACE
INSIDE
SURFACE
£>
19
TACK WELD
TACK WELD
ORNL-DWG 78-11332
AREA GOUGED CUT
OR GROUND
Fig. 13. Typical joint designs which would totally remove tack welds; (a) square butt, (ft) single V-groove on insidesurface.
performed at this time is the placement of runoff tabs at the endsof the longitudinal seam. Since these tabswould be welded to the ends, they would in effect act as tack welds. It is therefore likely that runoff tabs
would be used prior to any welding if tack welds are being used. However, if tack welds are not being used,then runoff tabs might be added after aninitial welding pass is made.24 The purpose of the runoff tab is tolocate arc starting and stopping defects outside of the longitudinal seam weld.
Welding of the longitudinal seam can be accomplished using various welding processes, depositionsequences, and welding equipment. Generally three welding processes would most likely be considered formaking the longitudinal seam weld. These would be GTA, SA, and gas metal-arc (GMA). The first twoprocesses are used more frequently. Each process, of course, has inherent characteristics which make itmore desirable in certain situations. In addition, there are variations within a process cateogry such as GTA
with hot- or cold-wire additions or without filler metal (autogenous). The GTA process with hot- or
cold-wire additions would probably be selected instead of SA for longitudinal seam welding of austeniticstainless steel pipe to be used at BRprimary coolant system operating temperatures. Thisisbased upon theresults of stress-rupture tests which have shown that SA welds typically have lower times to rupture (tr)than do GTA welds.25 The higher tr values for GTA welds are probably due to the lower heat input, whichproduces a finer weld structure. However, the GTA process also provides an as-deposited weld compositionwhich is different than that for the SA processfor a given initial filler metal composition. This is of coursedue to the slag-metal reactions which occur in the SA process. The Westinghouse Electric CorporationAdvanced Reactors Division (WARD) CRBRP equipment specification for welded pipe26 currentlyexcludes the use of SA welds with type 16-8-2 filler metal.
Generally the deposition sequence would be such that a weld pass would be made on the inside surfaceof the seam first. This would allow further work such as gouging and/or inspection to be done from the
outside surface, where there is more access. In addition, the inside welding would probably be limitedto a

20
single pass to reduce the time spent working in a low-access situation. The weldingequipment to make the
inside weldwould utilize a welding head mounted on a long boom to enable traversing the full length of thepipe. The welding done from the outside surface would probably be multiple pass, depending upon thejoint design. The equipment for the welding head would be simpler because the pipe could easily be moved
past it. However, the boom used for the inside weldingcould also be used on the outside. Other techniques
could also be used such as welding the outside first or welding the inside and outside at the same time with
staggered arcs. Various methods for aligning the seamweldand for trackingand guiding the progress of thewelding arc are used. These might include television cameras to enable an operator to make adjustments, orcommercially available guidance probes. An integral part of the welding operation might also be theinspection of the weld preparation prior to the start of welding and the inspection of the root of aback-gouged area prior to deposition of further passes.
After welding, the seam weld may be either roll planished or ground to provide the desired surfacecontour. The roll planishing would involve a roll forging-type operation which might be done cold or hot(i.e., just after welding). In addition to providing the desired surface contour, the roll planishing might alsoresult in refinement of the weld structure.
Inspection of the completed longitudinal seam weld would be made by radiography. This radiographicinspection is performed before the final heat treatment13 so that if repair welding is required, reheattreatment would not be necessary. The radiographic examination would therefore be followed by a cycle ofrepair and surface conditioning and additional radiographic examination if necessary. In addition, therunoff tabs would probably be removed at this time.
The next operation would be the heat treatment of the pipe, which would be solution annealed at
typically 1038 to 1093°C and then rapidly cooled. The cooling rate required to rapidly pass through thesensitization range (510 to 788°C)27 would of course be a function of thickness. However, for the thin-wallBR piping, an air quench may be sufficient, although water quenching or spraying will probably be
employed. The water quenching operation would generally consist of heating the pipe in a horizontalposition, transporting it from the furnace in the horizontal position, and then rolling it into a quench tank.Although heat treatment in the horizontal position can cause diametral distortion, especially inlarge-diameter pipe, final sizing operations are expected to correct any deviation. In addition, the use of"spiders" near the ends of the pipe can reduce distortion. The use of a symmetrical water spray as the pipeemerges from a horizontal traveling-bed furnace may reduce quench distortion. However, this operationwould still be subject to distortion at the solution annealing temperature and therefore might still requirespiders. Vertical heat treatment facilities are not readily available and can alsolimit the length of pipebeingproduced.
After heat treatment, the pipe is usually sized and straightened. Depending upon the technique used tosize the pipe, hydrostatic testing may be performed as a part of the sizing operation. The sizing of the pipeis usually limited to approximately 0.3 m on each end, whereas the straightening operation is normallyperformed over the entire length. The two techniques used to size the pipe are expansion or die forming.The die-forming technique utilizes an O-ing die as shown in Fig. 12.The pipe ends are placed in the die, anda press forces the pipe to conform to the circular shape of the die. During this press forming the pipe isplastically deformed. When the pipe is released from the die, there is some degree of elastic springback. Theamount of deformation used to size the pipe must therefore account for the elastic recovery. Since thistechnique rounds the pipe from the outside, it wouldbe expected to provide greatercontrol of the outsidediameter than of the inside diameter.
The expansion technique is performed by either hydrostatically expanding against retaining jackets ormechanically expanding by a mandrel. Sizing by hydrostatic expansion is performed by forcing mandrels

into each of the pipe ends and pressurizing the body with water.24 The mandrels expand the ends to thedesired inside diameter, while the body is expanded against retaining jackets which control the outside
diameter. Hydrostatic expansion also produces some degree of plastic deformation. After the sizingoperation is completed, the water pressure can be reduced to enable the hydrostatic test to be performed.The hydrostatic expansion technique would provide sizing over the entire length of the pipe. However,
because of the different techniques used at the body and the ends, the sized dimensions of these two areas
would be expected to be different. Mechanical expansion is normally performed by a segmented and
expandable cylindrical element.24 The expandable element expands the inside diameter of the pipe to meetthe desired dimensions. The amount of deformation imparted to achieve the desired dimensions would
again have to account for elastic recovery.
Straightening of the pipe would normally be performed using either diesor rolls. Sizing by hydrostaticexpansion or other techniques if incrementally applied along the length of the pipe can be used to bothround and straighten. The amount of straightening which is allowed without reannealing is usuallylimited.
Although the primary goal of sizing and straightening is to obtain the required dimensional control,these operations are also used indirectly to cold work the pipe and therefore improve its mechanicalproperties. This is analogous to the cold-roll planishing of the longitudinal weld seamto both condition thesurface and improve its mechanical properties. Therefore, "annealed" pipe will normally be slightly coldworked. In addition, the amount of cold work is not uniform throughout the pipe, therefore creating some
variability in mechanical properties.
If the hydrostatic test is not being performedas a part of the sizing and straightening operations, then itwill probably be performed before these operations. As shown in Table 2, the hydrostatictest pressure forthe pipes being evaluated was typically 3 to 4 MPa. This stress is well within the elastic range and thereforewould not cause any permanent deformation. However, depending upon the equipment used to performthe hydrostatic test, the plugging of the pipe ends may cause distortion,which would make it desirable tosize the ends after the test.
The final operations which would be performedon the pipe are end preparation and cleaning. The firststep involved in end preparation would be the facing of the ends to assure that they are perpendicular tothe axis of the pipe. Once the ends are faced, the desired joint preparation for circumferential welding
would be machined. The final cleaning of the pipe would normally be accomplished by either pickling in
HF-HNO3 or blasting with shot or sand.
5. NONDESTRUCTIVE EVALUATION
The nondestructive evaluation of the pipe consisted of three separate examinations, which involved
dimensional characterization, determination of weld ferrite number, and radiographic inspection. The
purpose of the dimensional characterization was to determine whether formed and welded pipe was capableof meeting the requirementsfor BR piping. The determination of the weld ferrite number was performed toenable comparison of nondestructive with destructive techniques. The radiographic inspection was
performed on a selected numberof the pipesas an overcheck of the manufacturers' examination.
5.1 Dimensional Evaluation
In order to establish a standard procedure for dimensionally characterizing the five pipes, an inspection
grid system was utilized. A schematic version of this grid system can be seen in Fig. 14, while Figs. 3through 7 show the pipes with the actual grid points marked on them.The grid was constructed using fivediametral planes (Dl through D5) and seven planes perpendicular to the pipe axis (A through G). Thepoints of intersection of these planes on the inside and outside surfaces of the pipes formed the grid system.

LONGITUDINAL
SEAM WELD
22
ORNL-DWG 78-11333
Fig. 14. Schematic sketch of dimensional inspection grid used to characterize the pipe.
After the grid points were located on the outside surface, ultrasonic techniques were used to locate thecorresponding points on the inside surface. Diameters Dl through D5 were located 38.10 mm on either side
of the weld centerline to enable detection of distortion in the weld region. The remaining diameters werelocated at 45° increments from Dl. The planes perpendicular to the pipe axis were located at 0.3-mintervals along the length of the pipe. The following measurements were made on eachof the pipes, usingthe previously described grid system:
1. Five inside and outside diameters were measured with a micrometer at each of seven planes perpendicular to the pipe axis.
2. The outside circumference was measured with a tape measure at each of the seven planes perpendicularto the pipe axis.
3. The wall thickness wasmeasured using ultrasonicback reflection at each of the 70 points of intersectionbetween the five diametral planesand the seven planesperpendicular to the pipe axis.
4. Camber measurements were made by placing a straightedge on the outside surface of the pipe alignedwith each of the ten linesof intersection between the five diametral planesand outside surface.Withthestraightedge in contact with the pipe, the distance between it and the pipe surface was measured foreach of the grid points along the line of intersection.

23
The dimensional measurements described above were evaluated in terms of three considerations: (1)how well the five pipes conform to their applicable manufacturing specifications; (2) how the pipescompare with the WARD requirements for CRBRP pipe; (3) which measurement techniques most adequately represent the dimensional condition of the pipe. The comparison with commercial specifications isimportant because it provides an indication of the capability of manufacturers offormed and welded pipeto meet a given specification. The comparison with the WARD requirements for CRBRP pipe can providesome indication of how much different commercial formed and welded pipe is from that required for BRapplications. The evaluation of various measurement techniques provides an opportunity to rate theirability to characterize prototypic components.
Table 7 compares the measured dimensions of the five pipes and the requirements ofSA-35813 andSA-31214 as specified in A530.28 All measurements were made immediately after the pipes were removedfrom their shipping containers. Both SA-358 and SA-312 base their major dimensional requirements aroundoutside diameter and wall thickness. The dimensional requirements apply throughout the length of thepipe. The OD requirements of SA-358 use an average OD calculated from circumference measurements inconjunction with a measured ovality, while SA-312 uses a directly measured OD, which inherently includesOD ovality limits. The method used by SA-358 will allow individual OD measurements to exceed theaveraged limit and yet not exceed the ovality requirement. This situation cannot occur when the SA-312requirement is used. The wall thickness requirement for both SA-358 and SA-312 is based upon a minimum
Table 7. Comparison of dimensional evaluation of formed and welded pipes with SA-358 and SA-312 requirements[nominal pipe dimensions 0.91-m OD by 12.7-mm wall by 1.83-m length (36 in. by 0.5 in. by 6 ft)]
Measurements (in.)a
Wall thickness* Outside diameter Ovality'' Camber-'
Pipemin max av Calculated' Measured min max av min max av
min max av min max av
K-13* 0.53 0.54 0.53 36.05 36.09 36.06 35.83 36.18 36.01 0.21 0.35 0.25 1/64 1/16 3/64
1-14" 0.49 0.52 0.51 35.93 36.01 35.97 35.70 36.15 35.96 0.25 0.45 0.33 1/32 5/64 3/64
G-161' 0.50 0.52 0.51 36.07 36.11 36.09 35.88 36.21 36.03 0.09 0.29 0.19 1/64 5/64 3/64
G-15' 0.50 0.53 0.52 36.05 36.15 36.12 35.68 36.31 36.03 0.21 0.62 0.32 3/64 19/64 1/8
H-22* 0.61 0.65 0.64 35.97 36.11 36.05 35.88 36.13 36.01 0.04 0.09 0.07 1/16 9/64 1/8
SA-35 8 requirements:
0.49 35.82 36.18 0.36 5/64'
SA-312 requirements as specified in A530:
0.44 35.97 36.19 Reasonably straight
"To convert to millimeters, multiply by 25.4. (Dimensions given in inches to facilitate comparison with existing specifications).Italicized values exceed specifications.
*Kight measurements, at 45° increments around the circumference, were made every 0.30 m(12 in.).•^Calculated from circumference measurements made every 0.30 m (12 in.).dFive measurements, one on each side of weld and three at 45° increments from the weld, were made every 0.30 m(12 in.).^Calculated from differences between major and minor OD measurements at planes every 0.30 m (12 in.)./Fight measurements of the maximum camber, with a 1.83-m (6-ft) straightedge in contact with the pipe surface, were made at 45
increments around the pipe circumference.
#Pipe E-13 GTA welded with type 16-8-2 filler metal, dimensions toSA-358."Pipe 1-14, GTA welded with type 16-8-2 filler metal, dimensions to SA-358 except maximum ovality on ends 0.5% OD [4.6 mm (0.18
'Pipe G-16, GTA welded without filler metal, dimensions to SA-312 as specified in A530 except ±1% of OD [±9.1 mm (0.36 in.)].'Pipe G-15! SA-GTA welded with type 316 filler metal, dimensions to SA-358 except ±1% OD [9.1 mm (0.36 in.)].*Pipe H-22 SA welded with type 16-8-2 filler metal, dimensions to SA-358.'The SA-358 camber allowance is given as 3.2 mm (1/8 in.) max in 3m(10 ft); when it is scaled down for 1.8 m(6 ft) the maximum is about
2 mm (5/64 in.).

24
without any maximum specified. The absence ofa maximum wall thickness requirement results in the platespecification controlling the tolerance. The italicized measurements in Table 7 indicate dimensions thatexceed the tolerance allowed bythe applicable specification. It should be noted thatonly pipe E-13 met allspecified dimensional requirements. The manufacturer of pipe F-14 narrowed the ovality tolerance on theends from 1% to 0.5% of the OD. However, the pipe failed to meet even the original 1%0D requirement.The manufacturer of pipes G-15 and G-l6 broadened the tolerance from ±0.5% to ±1% OD for G-15 andfrom +4.8 -0.76 mm to ±1% OD for G-16. Pipe G-16 met the broadened OD tolerance but exceeded theoriginal requirement. Pipe G-15 met the original OD requirement but failed to meet the ovality requirement. In addition, pipe G-15 exceeded the camber allowance. Although pipe H-22 exceeded the camberallowance, itsovality was greatly improved compared with the other four pipes.
The foregoing analysis indicates that the dimensional control of formed and welded pipe fabricated tocurrent commercial specifications typically does not rigorously meet the requirements. In addition, theexceptions taken by one of the manufacturers indicate that in some cases it is normal practice not toattempt to meet the dimensional requirements. It also appears to be common practice to meet dimensionalrequirements on the ends of the pipe and not in the body. This is of course due to the sizing operationbeing performed on the ends and not the body, as previously discussed. However, the small amount ofpipethat was procured for this evaluation may notaccurately represent larger orders.
Before comparing the dimensional measurements of the pipes to the requirements of the WARDCRBRP specification for welded pipe, it is appropriate to examine the chronological sequence of changeswhich occurred to the dimensional requirements in this specification. Because this sequence of changesoccurred during the procurement process, it provides a good indication ofwhat the manufacturers' exceptions were to the given requirements. In addition, since design analyses had to be performed in some casesto justify these revisions, the final requirements should represent the most liberal dimensional tolerancesallowed by current design rules.
Table 8 shows the chronological sequence of dimensional requirements for 0.91-m-OD pipe in WARDCRBRP specification E-953094.26 The current revision of specification E-953094 (revision 4) bases its
Table 8. Chronological sequence ofdimensional requirements for0.91-m-OD pipe inWARD CRBRP specification E-95 3094 (ref. 26)
Revision, date Wall thickness(in.)
Inside diameter
(in.)Inside diameter
ovality (in.)Camber
Rev. 0, 8/76 0.47 to 0.56 at any pointmeasured by ultrasonicreflection
34.97 to 35.03 at resized ends;34.82 to 35.18 over body; althoughno measurement technique is specified, direct measurement is implied
Fnd requirement included ovality,therefore 0.06 max ovality atends; 1% of ID over body; although no measurement techniqueis specified, direct measurement is implicit
1/8 in. over 10-ft
span measured with10-ft straightedgein contact with
pipe surface
Rev. 1, 12/76 No change No change No change No change
Rev. 2, 2/77 0.45 to 0.58, no measurement
technique specified35.03 to 35.09 within 3 in. of ends,measurement can be made either bycalculation using circumference and
1% of average ID3 for ends; 1%of the chosen nominal ID for
body
Same as Rev. 0
average wall thickness or by averageof four direct measurements;" thevendor is to choose a nominal ID
for the body within the rangeof 35.92 to 35.20 in. and then applya tolerance of ±0.5% to the chosen
nominal, the measurement technique isthe same as that for the ends
No change
The acceptance limits remained thesame as Rev. 2; however, the measure
ment technique was changed to allowonly the average of four direct
measurements with the pipe restrainedto as nearly as possible a circularshape
Rev. 3,4/77 No change
Rev. 4, 10/77 0.45 to 0.58, no measurementtechnique specified
No change
The acceptance limit remained thesame as Rev. 2; however, the measure
ment is now specified to be madein the unrestrained condition
No change
Same as Rev. 0
Although Rev. 2 did not specify it, the intent was that ID measurements were to be made in the restrained condition, while ovality measurements were tbe made unrestrained (ref. 31).

25
major dimensional requirements on the inside diameter and wall thickness. The ID requirements use end
and intermediate plane acceptance limits, which incorporate both ID and ovality measurements. The ID
measurements are to be made with the pipe restrained to as nearly as possib1e a circular shape. The ID
requirement is checkedagainst the average of four direct measurements spaced 45° apart. The pipe ends are
required to be measured within 76.2 mm from the end, while no requirement is placed on the location or
frequency of the body measurement. The ovality measurements are to be made with the pipe unrestrained.
The ovality requirement is checked against the difference between the maximum and minimum measure
ments described above. A restrained ID limit is used to simulate the conditions present during the fitup for
welding. An unstrained ovality requirement is utilized to limit the maximum amount of rounding that willneed to be applied for fitup. The acceptance limits at the resized ends are narrow to improve circumferen
tial weld joint fitup and thereby reduce residual stress caused by alignment. The intermediate-plane accept
ance limits are comparable with the OD tolerance range on the present commercial specifications, except
that they are averaged direct measurements rather than indirect determination from circumference measure
ments. The wall thickness requirement for E-953094 uses both a minimum and a maximum requirement.
As previously mentioned, SA-358 and SA-312 do not have a maximum wall thickness requirement and
therefore depend upon the plate specification. The maximum plate thickness requirements of SA-24012 asspecified in A-48029 allow between 1.5 and 2.3 mmoverthe nominal 12.77 mm,depending upon the platewidth. In addition, the plate thickness is checked only up to 76.2 mm in from the edge, thereby enabling
roll crown effects to cause undetected thickness increases in the center of the plate.
Table 8 shows that the WARD acceptance limits and/or measurement techniques were changed during
the piping procurement process for wall thickness, inside diameter, and inside diameter ovality. The accept
ance range for the wall thickness was broadened (0.47—0.56 to 0.45—0.58 in.), which resulted from the
fabricators' inability to accurately control plate thickness as previously discussed. WARD had to perform
additional stress analyses to establish that an increased wall thickness would not be detrimental.49'50 This
analysis evaluated the effect of the heavier wall thickness on fatigue damage resulting from postulated
thermal transients. In addition, the decreased wall thickness had to be evaluated in terms of its effect on
fitup for welding. With the decrease in the allowable as-manufactured pipe wall thickness, the margin
between it and the minimum allowable as-fabricated thickness was reduced from 0.03 in. to 0.01 in. (ref.
30). This decreased margin means that there is a greater chance that counterboring during fitup will exceed
the minimum wall thickness. This situationis acknowledged in the WARD shop fabrication specification30by allowing weld buildup to compensate for the decreased base-metal thickness.
The ID requirements changed in two ways. First, the nominal ID for both the end and intermediate
planes has been shifted. In the case of the end ID, the shift was made to facilitate fitup with other
components.31 However, the provision to enable the vendor to select a "nominal inside diameter of thebody of the pipe away from the ends"32 within a specified range indicatesthe reluctanceof manufacturersof formed and welded pipe to commit to specific body dimensional requirements. This again relates to the
fact that it is not common practice to size the body region. Although there was a shift in nominal ID for
both the end and intermediate planes, the actual tolerance for each region did not shift. The second change
that occurred involved the measurement techniques. Whereas ID requirements were initially to be checked
by direct measurement, averaged direct measurements or values calculated from wall thickness and circum
ference were next allowed, followed by use of only the averaged measurements. In addition, the direct
measurements were to be made in the restrained condition. The change from direct to averaged measure
ments for acceptance indicates that the manufacturers are concerned that several different effects (such as
handling and gravity) can alter the as-sized dimensions. This is further verified by the requirement to make
these measurements in the restrained condition. The philosophy behind making the measurements in the

26
restrained condition is that it shows whether or not a pipe will be capable of being rounded within the
acceptance limits for weld fitup. Since fitup for welding is normally performed in a restrained condition, it
is more significant to evaluate the pipe in this condition. The use of averaged instead of direct measure
ments will be discussed in a later section. However, Table 8 does indicate that the use of an average ID
calculated from wall thickness and circumference was eliminated. This is probably due to the fact that this
averaging technique had the possibility of allowing too large a local deviation.
The end ID ovality requirement initially appears to have experienced the greatest change. This require
ment changed from 0.06 in. maximum, with no measurement technique specified, to 1% of the average
inside diameter (M).35 in.) in the unrestrained condition. However, it could be argued that since the initial
ovality requirement was included in the ID, this measurement could have been made in the restrained
condition (because no technique was specified) and therefore would be comparable with the later unre
strained ovality requirement in conjunction with a restrained ID requirement having a range of 0.06 in. In
any event, this situation again indicates that the manufacturers generally felt that the tight end require
ments for fitup could not be met without restraining the pipe. This again relates to concern about various
effects altering the as-sized dimensions.
By comparing the dimensional evaluation of the five pipes procured in this program with the WARD
CRBRP specification E-953094, it will be possible to some extent to see why the changes in the dimen
sional requirements had to be made. However, before examining this comparison, it is important to note
that all measurements were made without restraining the cross section. This, of course, prevents an accurate
comparison with the ID requirements. In addition, since the nominal ID for the WARD pipe was shifted,
this further detracts from the ability to compare the inside diameter. Table 9 shows the comparison
Table 9. Comparison of dimensional evaluation of formed and welded pipes with WARD CRBRP specification E-953094[nominal pipe dimensions 0.91-m OD by 12.7-mm wall by 1.83-mm length (36 in. by 0.5 in. by 6 ft)j
Wall
Measurements (in. f
Pipe thickness*Ends''
Inside diameter II) <:ivality
min
Camber1-'Body''
min
Ends''
max av min
0.20
Body-'
max
0.22
min max av max
min max av min max av
1-1 3" 0.53 0.54 0.53 34.81 35.11 14. 96 34.80 35.02 34.92 0.23 0.35 0.28 0.22 1/64 1/16 3/64
1-14' 0.49 0.52 0.51 34.68 35.13 34.94 34.70 35.10 34.93 0.28 0.45 0.34 0.32 0.37 0.34 1/32 5/64 3/64
V.-](4 0.50 0.52 0.51 34.88 35.20 35.112 34.86 35.13 34.98 0.10 0.28 0.19 0.10 0.27 0.18 1/64 5/64 3/64
(i-15* 0.50 0.53 0.52 34.65 35.30 34.9K 34.88 35.25 35.03 0.21 0.65 0.35 0.23 0.37 0.29 3/64 / 9/6,4 1/8
H-22' 0.61 0.65 0.64 34.62 34.81 34. 71 34.71 34.78 34.74 0.02 0.05 0.04 0.05 0.06 0.05 1/16 9/64 1/8
WARD 1-95 3094 rcquinements:
0.45 0.5 8 35.03"' 34.88"1- n 0.35 0.35 5/64"
35.09 35.24
aTo convert to millimeters, multiply by 25.4 (dimensions given in inches to facilitate comparison with existing specifications). Italicized values exceed thespecifications. AH measurements made without restraining the cross section.
I.ight measurements, at 45° increments around circumference, were made every 0.30 in (12 in.).cl''ive measurements, one on each side of weld and three at 45° increments from the weld, were made at each end and 0.30 m (1 2 in.) from each end.
I ive measurements, one on each side of weld and three at 45" increments from the weld, were made at three center locations 0.30 m (12 in.) apart.^Calculated from differences between major and minor ID for end planes and planes 0.30 m (12 in.) from each end.-'Calculated from differences between major and minor ID for three center planes 0.30 in (12 in.) apart.^I.ight measurements of the maximum camber with a 1.83-m (6-ft) straightedge in contact with pipe surface were made at 45" increments around the pipe
circumference.
''Pipe l.-l3. GTA welded with type 16-8-2 filler metal, dimensions to SA-358.'Pipe 1-14, GTA welded with type 16-8-2 filler metal, dimensions to SA-358 except maximum ovality on ends 0.5% OD [4.6 mm (0.1 8 in.)].'Pipe G-16, GTA welded without filler metal, dimensions to SA-31 2 as specified in A530 except ±1% OD [±9.1 mm (0.36 in.) |.*Pipe G-15.SA-GTA welded with type 316filler metal, dimensions to SA-358 except±1% OD (±9.1 mm (0.36in.)].Tipe H-22, SA welded with type 16-8-2 filler metal, dimensions to SA-358. Note that the ID values are low because of the heavy wall thickness.
"M'.ntered in the average column because limits are based upon average of measured values."These limits were obtained by applying ±0.5% to the midpoint (35.06 in.) of the range of nominal body inside diameters that the vendor can choose from."The camber allowance is given as 3.2 mm (1/8 in.) max in 3 m (10 ft); when it is scaled down for 1.8 m (6 ft) the maximum is about 2 mm (5/64 in.).

27
between the dimensional evaluation of the pipes and the WARD requirements. The wall thickness measure
ments in Table 9 show that four of the five pipes met the original tighter tolerance range, while the fifth
exceeded both the tighter and broadened ranges because it was intentionally made from heavier plate,
which typifies the fact that the manufacturers of commercial pipe are accustomed to working with only a
minimum wall thickness requirement. The results in Table 9 might tend to suggest that formed and welded
pipe could meet the original tighter wall thickness requirements. However, the changes made to the CRBRP
specification during the procurement process indicate that the manufacturers would not accept the tighter
tolerance range.
Direct comparison of the ID measurements with the WARD requirements shown in Table 9 is not valid
as previously discussed. However, it can generally be concluded that manufacturers should not have a
problem meeting the body ID requirements as evidenced by four of the five pipes meeting the requirement.
This is because the tolerance on this requirement is the same as the current commercial specification which
they are accustomed to meeting. Although all five pipes failed to meet the end ID requirement, this
situation could be greatly altered if measurements were made in the restrained condition.
The ID ovality appears to be the area for greatest concern as evidenced by the comparison in Table 9.
Since this measurement is specified to be in the unrestrained condition, it provides a realistic comparison.
Two of the five pipes failed to meet the requirement in both the end and body regions, and a third was on
the borderline for the end region. However, it is important to point out that one pipe had excellent ovality
control and was able to meet the original tighter tolerance on both the ends and body.
Based upon the foregoing analyses of dimensional considerations and earlier discussions of BR design
requirements, it is apparent that two aspects of the dimensional control of the pipe are the most important.
These are wall thickness and end inside diameter and ovality. The control of body diameter and ovality
becomes important if pipe must be cut to a smaller length in the field, therefore requiring weld fitup in a
body region. The discussion has indicated that wall thickness tolerances have been broadened to enable
formed and welded pipe to meet the requirement. It is beyond the scope of this report to examine the
justification for increasing the maximum allowable wall thickness. The relationship between lowering the
allowable thickness and fitup for welding has already been discussed. However, it is important to examine
the various techniques which can be used to characterize pipe ends for weld fitup.
A detailed examination of the ends of the five pipes was performed to determine the effectiveness of
averaging direct ID measurements and calculating the ID from circumference and average wall thickness as
compared with direct measurements. Table 10 shows the dimensional data which were used to make this
Table 10. Dimensional data for the ends of the five rolled and welded pipes
Average-
end plane
wall thickness
Measurements3
PipeI
measured
Znd plane
inside diameters''End plane
outside
circumference
End plane
inside diameter
ovality
End plane
average inside
diameter''
End plane
calculated inside
Dl D2 D3 D4 D5 diameter''
E-13 0.528 35.086 34.855 34.828 35.054 35.033 113.250 0.258 34.971 34.993
0.532 35.112 34.940 34.766 34.960 35.040 113.375 0.346 34.964 35.024
1-14 0.510 35.055 35.042 35.772 34.904 35.035 113.125 0.283 34.962 34.989
0.507 35.132 34.853 34.684 34.856 35.093 112.875 0.448 34.924 34.915
G-15 0.504 34.677 35.299 35.051 35.025 34.649 113.250 0.650 34.940 35.041
0.512 34.886 35.093 34.875 34.995 34.863 113.437 0.230 34.942 35.084
(i-16 0.501 35.164 35.009 35.038 35.022 35.162 113.375 0.155 35.079 35.086
0.507 34.975 35.012 35.196 34.994 34.969 113.375 0.227 35.029 35.074
H-22 0.627 34.717 34.665 34.686 34.696 34.711 113.125 0.05 2 34.695 34.755
0.636 34.653 34.627 34.615 34.625 34.666 113.000 0.051 34.637 34.697
^All measurements are in inches and were made within 1 in. of the pipe end without restraining the cross section.''The average of eight ultrasonic measurements.'Dl and D5 were 1.5 in. on each side of weld centcrline; D2, D3, and D4 were 45° increments from Dl.^The average of the five measured inside diameters.('The inside diameter is calculated from the outside circumference and average thickness.

28
comparison. As previously mentioned, the WARD specifications require that end ID measurements are to
be made "when the cross section is restrained to as nearly as possible a circular shape." Since there is no
specific requirement on this restrained circularity, it is assumed that ovality could range from 0 to 0.35 in.
(1% maximum allowable). As shown in Table 10, the ovalitieson the ten ends evaluated ranged from 0.051to 0.650 in. with an average of 0.270 in. Therefore, while these data were not taken in a restrained
condition, they are representative of a portion of the range of possible restrained circular conditions.
Eliminating data from ends for which the ovality exceeded 0.350 in. leaves a data base of eight ends with an
ovality range of 0.051 to 0.346 in. with an average of 0.200 in.
Table 11 provides a comparison of averaged and calculated ID with directly measured values for the
eight ends with acceptable ovality. The comparison is made by showing the maximum deviations that
Table 11. Comparison of averaged and calculated inside diameterwith directly measured values
Measurements"
Pipe or elbow Maximum deviation of
average ID from direct
measurements
Maximum deviation of
calculated ID from
direct measurements'7
End plane
ID
ovalityd
E-13 -0.115
+0.143
-0.093
+0.165
0.258
-0.148
+0.198
-0.088
+0.258
0.346
F-14 -0.093
+0.190
-0.066
+0.252
0.283
G-15 -0.151
+0.079
-0.009
+0.221
0.230
G-16 -0.085
+0.070
-0.078
+0.077
0.155
-0.167
+0.060
-0.122
+0.105
0.227
H-22 -0.022
+0.030 +0.038
0.052
-0.029
+0.022 +0.082
0.051
"All measurements are in inches.
Maximum positive and negative deviation between average inside diameter and directmeasurements in Table 10.
cMaximum positive and negative deviation between calculated inside diameter anddirect measurements in Table 10.
dReported ovality from Tables 1 and 2.
occurred between these two techniques and the direct measurements. Figures 15 and 16 showplots of thesemaximum deviations vs the unrestrained ID ovality. A linear regression analysis was used to fit the data in
these figures to linear equations of the form y = a + mx. The Unear equation along with the coefficient ofdetermination, r2, is shown on each line. The equations for Fig. 15 should have intersected the y axis atzero, because with no ovality there should be no deviation between actual measurements and the average.The failure to intersect the y axis at zero is probably due to the low coefficients of determination (r2 =0.0671 and 0.793, with r2 = 1 indicating perfect fit) which establish the degree of data fit. It is not

29
OBML-DWO 78-11334
(A) PREDICTED MAXIMUM ALLOWABLE RESTRAINED OVALITYNEEDED TO PREVENT A OEVIATION FROM EXCEEDING
THE IT-ARD FIT-UP ALLOWANCE FOR CONCENTRIC
CENTER LINES (0.031 in.)
.*|) PREDICTED MAXIMUM ALLOWABLE RESTRAINED OVALITYNEEDED TO PREVENT A DEVIATION FROM EXCEEDING
THE W-ARD FIT-UP ALLOWANCE FOR OFFSET CENTERLINES (0.050 in.)
UNRESTRAINED ID OVALITY
Fig. 15. Plot of maximum deviation of average inside diameter from direct measurements vs unrestrained insidediameter ovality.
| -0.15
ORNL-DWG 78-11333
4>A) PREDICTED MAXIMUM ALLOWABLE RESTRAINED OVALITYNEEDED TO PREVENT A DEVIATION FROM EXCEEDINGTHE tf-ARO FIT-UP ALLOWANCE FOR CONCENTRICCENTER LINES (0.031 in.)
"*B) PREDICTED MAXIMUM ALLOWABLE RESTRAINED OVALITY "NEEDED TO PREVENT A DEVIATION FROM EXCEEDING
THE tf-ARO FIT-UP ALLOWANCE FOR OFFSET CENTERLINES (0.050 in.)
UNRESTRAINED ID OVALITY
Fig. 16. Plot of maximum deviation of calculated inside diameter from direct measurements vs unrestrained insidediameter ovality.

30
expected that the equations for Fig. 16 should intersect the y axis at zero because of the use of average wallthickness to make the calculation of ID. However, the degree of data fit is also poor in Fig. 16 (r2 = 0.446and 0.763). Although the linear regression analysis for the data in Figs. 15 and 16 has been shown to besubject to some error, the following general conclusions can be drawn:
1. As ovality increases within the acceptable limits, significant deviations can occur between averaged orcalculated ID and directly measured values.
2. The calculated ID valueshave a tendency to be larger than the average or directly measured values.
3. The predicted maximum allowable restrained ovalitiesneeded to prevent a deviation from exceeding theWARD fitup allowances are relatively low.
These conclusions indicate that unless the pipe is restrained to very nearly a circular shape during measure
ment, the use of either averaged or calculated ID acceptance limits can allow deviations from the actual
measurements which could exceed weld fitup requirements. Deviations that occur during fitup for weldingmay have to be corrected by specialalignment procedures, counterboring, or weld buildup, depending uponthe situation. Based upon the above considerations, it is therefore recommended that direct ID measure
ments made in the restrained condition be used as acceptance limits.
There are additional data available for four of the pipes which show the relationships between unre
strained and restrained end measurements, and between restrained end measurements and radial mismatch
during weld fitup. These measurements were made by Idaho National Engineering Laboratory (INEL) on0.6-m (2-ft) sections from the ends of four of the pipes(pipe identification numbers E-13, F-14, G-15,andG-16) as shown in Fig. 17. This work at INEL was part of a welding technology development program
PLANE "A"
ORNL-DWG 78-11339
SENT TO INEL FOR
GIRTH WELDING STUDY
LONGITUDINAL
SEAM WELD
WELDMENT SECTION
Fig. 17. Sectioning plan for all pipes.
LONGITUDINALSEAM WELD
PLANE G

31
which was evaluating joint preparation, alignment, and orbital welding techniques for BR piping.51 Table12 shows a comparison between pipe end OD ovality in unrestrained and restrained conditions. The
restrained measurements were made using an internal lineup clamp to expand the inside surface to a round
condition. The ovality data shown in Table 12 were obtained from the difference between the maximum
and minimum of four OD measurements taken at 45° intervals at the end(s) of the pipe section. Measure
ments were made on the original pipe ends, remachined original ends, and an end which was in the body of
the as-received pipe.52 The data in Table 12 demonstrate that alignment equipment can round pipe tonearly a circular shape even when the unrestrained condition has excessive ovality (maximum of 0.436 in.).
However, it must also be noted that the restrained ovalities varied from 0.022 to 0.082 in. and that in one
case the internal rounding expansion increased the amount of ovality (0.060 to 0.082 in.). Using the latest
tolerance range for end ID shown in Table 8 (0.060 in.), it must be realized that the additive effect of the
difference in average pipe diameters and ovality must be accounted for to ensure that radial mismatch
during weld fitup does not exceed the WARD allowance for concentric centerlines (0.031 in., ref. 30).
Table 12. Comparison between pipe end outside diameterovality in unrestrained and restrained conditions"
Pipe end End outside diameter ovality (in.)
identification Unrestrained Restrained
E-13 0.184 0.052
(original end)
E-13 0.182 0.068
(remachined
original end)
E-13 0.193 0.075
(2nd remachined
original end)
F-14 0.436 0.050
(original end)
F-14 0.277 0.047
(original body)
G-15 0.060 0.082
(original end)
G-15 0.093 0.044
(remachined
original end)
G-15 0.123 0.043
(2nd remachined
original end)
G-16 0.143 0.022
(original end)
G-16 0.149 0.022
(remachined
original end)
Measurements made at INEL (refs. 51, 52).

32
Table 13 provides comparisons between restrained pipe end OD measurements and radial mismatchduring fitup for four welds. Columns A and B in Table 13 provide the restrained ovality and averagediameter based upon four OD measurements taken at 45° intervals. Column C provides the differencebetween the average diameters of the two ends being joined for each weld. Since the maximum tolerancerange on ID is 0.060 in., the maximum difference between the outside diameters of two pipe ends beingjoinedwould not be much greater. Therefore, the welds with column C values exceeding 0.060 in. are notexpected. Column D provides the maximum radial mismatch potential. There is a separate value for eachend which isone-half the sum of the ovality of the end and the difference between the average diameters ofthe two ends. Since the column D mismatch potential represents the worst possible condition, significantlyimproved fitups can be obtained if the geometries of the ends are similar. Welds 2 and 3 in Table 13 show
examples of predicted maximum radial mismatches (column D) closely predicting the actual radial mismatch (column E). The actual radial mismatch measurements are the "differences in the height of the rootfaces as measured with a depth micrometer from the outside surface of the pipe."51 These fitup measurements were made with the two pipe ends butted together, using the internal lineup clamp to round theinside surface. In addition, welds 2 and 3 exceed the fitup allowance. Welds 4 and 5 show examples ofpredicted mismatchesgenerallybeing much greater than the actual.
The fitup analysis described above indicates that there is a need to check ovality in the restrainedcondition as a part of the acceptance limit. The best way to do this is to use direct ID measurements madein the restrained condition. By specifying an acceptance range for ID measurements (four taken at 45°intervals), both the average diameter and ovalitywillbe controlled.
Weld
No.
Table 13. Comparison between restrained pipe end outside diameter measurements andradial mismatch during fitup for welding*2
Identification
of pipe ends
being joined
1-13 <or'P>™lend)
1-14(originalend)
(remachined
1-13 originalend)
(remachined
G-15 originalend)
1-14(original
body)
(remachined
G-16 originalend)
I-I 3
G-15
(2nd remachined
original end)
(2nd remachined
original end)
A
Ovality of
restrained
end outside
diameter (in.)
0.044
0.075
B
Average
restrained end
outside
diameter (in.)
35.986
36.016
Dc
DifferenceMaximum e
Actual
between
average endmismatch
potential
radial
mismatch
outside (A + C\ measurements
diameters (in.) (—)(,„ (in.)
0.1000.090
0.049
0.147 0.048
0.099 0.001
0.027
0.041 0.009
0.015
0.013 0.038
0.029 0.069
0.0730.028
0.012
0.098 0.001
0.060
0.043
0.022
0.022
0.018
0.019
0.009
"Measurementsmadeat INEL (refs. 51, 52).Note: Italicized numbers in column E indicate those which exceed the WARD fitup allowance for concentric centerlines (0.031 in.,
ref. 30).

33
5.2 Determination of Weld Ferrite Number
Magnetic permeability measurements* were made on the inside and outside surfaces along the length ofthe welds in each pipe to determine the ferrite number (FN). It is important to note that the currentmagnetic permeability techniques (Ferritescope and Magnagauge) for measuring FN are not applicable tosolution-annealed welds such as those present in the five pipes. This is because the calibration standardswere only established for as-deposited welds,33 although some allowance is made for cast material. However, sincethese were the only standardizedtechniquesavailable, they were employed.Three measurementswere made across the width of the welds at 0.3-m intervals along the length. The locations for the
measurements correspond to the intersection with the weld of the seven planes perpendicular to the pipeaxis (A through G) shown in Fig. 14. The three measurements were averaged to determine the FN for eachlocation. Measurements of less than 0.1 FN were not reported. All of the measurements for pipes G-15,
G-16, and H-22 were less than 0.1 FN, with mostbeing zero. Therefore, no measurements are reported forthese pipes, and the welds are assumed to have an FN of zero. Figure 18 shows the FN variation along thelength of the welds in pipes E-13 and F-14. Because of the low ferrite content in the weld in E-13,base-metal dilution effects have not caused much of a difference between inside and outside measurements.
♦Magnetic permeability measurements made with Twin City Testing Corp. Ferritescope, type FE8e2, model B, withprobe type KF. Calibration was performed in accordance with AWS A4.2-74 (ref. 33), using TeledyneMcKay weldmetalsecondary standards.
3
ORNL-DWG 78- 11336
| i i I IPIPE E-13
2
1
INSIDE SURFACE ^OUTSIDE SURFACE
—-t>— 8J : <^- =¥
INSIDE SURFACEO
C D E
LOCATION ALONG LENGTH OF WELD
-O—
_L
Fig. 18. Ferrite numbervariation alongthe lengthof the welds in pipesE-13 and F-14.

34
In fact, the normal trend for the inside surface (or root) of the weld to have a lower FN because of dilution
is reversed. The FN is very uniform along both the inside and outside surfaces of pipe E-13. The plot forpipe F-14 clearly shows the expected effect of dilution on FN (i.e., the more diluted inside surface or root
has a lower FN). Although the FN of the weld inside surface was relatively uniform, the outside surfaceexhibited some degree of variability. This variation could be the result of local variations in dilution. The
results shown in Fig. 17 will be compared later with destructively determined values.
5.3 Radiographic Inspection
The welds in four of the five pipes were examined radiographically to verify compliance with therequired quality levels. In addition, the manufacturer's radiographs from the pipe which was not reradio-graphed were reviewed. As shown in Table 3, the pipes manufactured in accordance with SA-358 (E-13,F-14, G-15, and H-22) had the additional requirement to radiographically examine the welds at twodifferent angles at least 30° apart but not more than 150°. The intent of this requirement is to facilitateaccurate characterization of defects which might be oriented such that their size could appear smaller ornonexistant if examined by a single radiograph at a criticalangle. The welds in pipesF-14, G-15,and G-16were reradiographed 25° from perpendicular on each side of the weld as shown in Fig. 19. No rejectable
ORNL-DWG 78-11337
X-RAY SOURCE X-RAY SOURCE
WELD WELD
VX-RAY FILM X-RAY FILM
Fig. 19. Orientations between x-ray source and weld used for the radiographic examination of the welds in pipes F-14,G-15, and G-16.
defects were observed in the welds in either pipe F-14 or G-15. However, pipe G-16had one rejectable line
grouping of porosity. The defects appeared to be at the root of the outer pass. Discussions with the
manufacturers indicated that their radiographs revealed the porosity, but it was not interpreted as beingrejectable. Since both ORNL radiographs showed the same rejectable grouping of defects, it was concluded
that the double-angle technique was not responsible for exposing the defects. The discrepancy wasattributed to the ORNL radiographs having greater sensitivity than required.
To further evaluate the double-angle technique, the weld in pipe H-22was reradiographed such that thex rays penetrated approximately normal to the planes of the weld bevels as shown in Fig. 20. In addition,

X- RAY SOURCE
WELD AREA WITH
ORIGINAL BEVELSHOWN
X-RAY FILM
35
X-RAY SOURCE
WELD AREA WITH
ORIGINAL BEVELSHOWN
X-RAY FILM
ORNL-DWG 78-11338
X-RAY SOURCE
WELD AREA
WITH ORIGINAL
BEVEL SHOWN
Fig. 20. Orientations between x-ray source and weld used for the radiographic examination of the welds in pipe H-22.
the weld was also radiographed with the x rays perpendicular to the weld. No rejectable defects were
observed in any of the views.
Pipe E-13 was the one that wasnot reradiographed at ORNL. However, the manufacturer's radiographswere reviewed at ORNL, and no rejectable defects were observed.
6. DESTRUCTIVE EVALUATION
6.1 Sectioning of Pipes
In order to provide a uniform method for destructively evaluating the five pipes, a standard sectioning
plan was established. Figure 17 shows the sectioning plan used on all of the pipes; each pipe had threesections removed for further evaluation. The base-metal and weldment sections were further processed at
ORNL to provide specimens for metallographic examination and mechanical properties testing, while a0.6-m section from each end was sent to INEL for use in a girth welding study, as previously described.
Figures 21 and 22 showthe specimen removal plan for the base-metal and weldment sections. It shouldbe noted that the removal of specimens from the pipes has been coordinated with the dimensional inspection grid shown in Fig. 14. The metallographic specimens shown in Fig. 21 were located where planes A
ORNL-DWG 78-11341
SPECIMEN IDENTIFICATION KEY
SPECIMEN
DESCRIPTION
CIRCUMFERENTIAL BASE
METAL TENSILE/CREEP
AXIAL BASE METALTENSILE/CREEP
SPECIMEN
NUMBER
38 TO 43
44 TO 49
Fig. 21. Specimen removal from weldment section.

36
ORNL-DWG 78-11340
LONGITUDINAL SEAM WELD.
SPECIMEN
DESCRIPTION
METALLOGRAPHIC
LONGITUDINAL WELDMENT
TENSILE/CREEP
TRANSVERSE WELDMENTTENSILE/CREEP
LONGITUDINAL WELDMENTFATIGUE
TRANSVERSE WELDMENT
FATIGUE
THERMAL AGING
1, 10, 19, 26, 37
2,4, 6, 11,13,15,20, 22,24, 29,31,33
3,5,7, 12, 14,16,21,23, 25, 30, 32,34
8,17,26, 35
9,18, 27, 36
R-l, R-2, R-3, R-4
Fig. 22. Specimen removal from base-metal section.
through E intersect the weld. This was done so that the nondestructively determined ferrite measurements
made at these locations could be directly compared with those obtained by destructive examination. Inaddition, the various types of specimens were equally distributed over the length of the weldment sectionto prevent any localized conditions from biasing the data.
6.2 Metallographic Characterization
As shown in Fig. 21, five metallographic specimens were removed from the weld in each pipe. All of the
specimens from each pipe were given a macroscopic examination, while only one was examined for micro-
structural details. Figures 23 through 27 show typical macroetched cross-sectional views of the welds and
sketches of joint design and weldingpasssequence. The cross-sectional views of the welds in pipes E-13 andF-l 4 highlight the variation that can occur between different manufacturersusing the samewelding process.Both of these welds were made with the GTA process, except that pipe E-13 had a combination of hot- andcold-wire additions, while pipe F-14 was all cold-wire additions. Although the wall thickness was the same
in both cases, the weld in pipe E-13had six passes, while F-14 had only three. As a result, the large bead inF-14 had a coarser columnar grain structure. This structural difference could lead to differences in mechani
cal properties. The large passes used in pipes G-15 and G-16 also have coarse grain structure, which couldlead to a variation in mechanical properties. Although the weld in pipe H-22 wasmade by the submerged-arc welding process, which hasa high heat input, the structure of the weld does not appear to be too coarsein relation to the other welds. Two interesting situations were revealed during the examination of themacroetched specimens, one of which from the end of pipeG-16 is shown in Fig. 28. This specimen showedthat there apparently was a gap between the longitudinal seam welds made from the outside and inside
surfaces. A weld, which was likely to have beenautogenous GTA, was used to fuse this gap. In making thisweld, two arc strikes were created, with one of the strikes and the weld containing crater cracks. Figure 6(c) shows this end as it was received from the manufacturer. It can be seen that grinding performed on theend has concealed this condition. Figure 29 shows the macroetched specimen from the end of pipe H-22.

37
ORNL-DWG 77-12351
. OUTSIDESURFACE-^ (.OSCILLATED COLD-
WIRE GTAW
2.COLD-WIRE GTAW
3. HOT-WIRE GTAW
4.OSCILLATED HOTWIRE GTAW
5.OSCILLATED HOTWIRE GTAW
Fig. 23. (a) Typical macroetched cross-sectional view of GTA weld in pipe E-13, 7X, 50 HC1-10 HN03-5 H2SO„etchant. (b) Joint design and welding pass sequence (Reduced 30%).
ORNL-DWG 77-12354
1. COLD-WIRE GTAW
2.COLD-WIRE GTAWTRAILING PASS 1
BY 0.10 TO 0.15m
3. COLD-WIRE GTAW
Fig. 24. (a) Typical macroetched cross-sectional view of GTA weld in pipe F-14, 7X, 50 HC1-10 HN03-5 H2S04etchant. (b) Joint design and welding pass sequence (Reduced 45%).

38
'OUTSIDE SURFACE
ORNL-DWG 77-12353
1. COLD-WIRE GTAW
2. COLD-WIRE GTAW
3. SAW
Fig. 25. (fl) Typical macroetched cross-sectional view of SA-GTA weld in pipe G-15, 7X, 50 HQ-10 HN03-5 H2S04etchant. (b) Joint design and welding pass sequence (Reduced 40%).
.OUTSIDE SURFAC
-'.
OUTSIDE SURFACE
ORNL-DWG 77-12352
1.AUTOGENOUS GTAW
2.AUT0GEN0US GTAW
3. AUTOGENOUS GTAW
Fig. 26. (a) Typical macroetched cross-sectional view of autogenous GTA weld in pipe G-16, 7X 50 HQ-10 HN03 -5H2 SO„ etchant. (b) Joint design and welding pass sequence (Reduced 50%).

39
ORNL-DWG 78-11342
-OUTSIDE SURFACE
(/>) 7K
.OUTSIDESURFACE
Fig. 27. (fl) Typical macroetched cross-sectional view of SA weld in pipe H-22, 5X, 50 HQ-10 HN03-5 H2S04etchant. (b) Joint design and welding pass sequence (Reduced 50%).
OUTSIDE SURFACE
CRATER CRACK
ARC STRIKE AND RESULTANTCRATER CRACK ON END PLANE
ARC STRIKE FROMOUTER SURFACE
Y-l43855
WELD USED TO APPARENTLY FUSE A GAPBETWEEN THE LONGITUDINAL SEAM WELDSMADE FROM THE INSIDE AND OUTSIDE SURFACES
Fig. 28. Macroetched cross-sectional view of the end of pipe G-16, showing arc strikes and GTAweld used to fuse anapparent gap between the seam welds, 6X, 50 HQ-10 HN03 -5 H2S04 etchant(Reduced 49%).

40
OUTSIDE SURFACE^ REPAIR WELD
150773
REPAIR WELD'
Fig. 29. Macroetched cross-sectional view of the end of pipe H-22, showing repair welds, 6X 50 HQ-10 HN03H2SO„ etchant (Reduced 37%).
This specimen showed that two repair welds were performed on the end. This welding may have been
related to repairing conditions which resulted from the removal of the runoff tab. However, the repair on
the outside surface could be a wash pass used to achieve a surface finish. The conditions shown in Figs. 28
and 29 highlight the fact that discontinuities can be present in the weld ends. The presence of the crater
cracks shown in Fig. 28 suggests that it is prudent to require a surface inspection, such as dye penetrant, of
the pipe ends prior to girth welding.
Figures 30 through 32 show the typical microstructures of the weld, heat-affected zone (HAZ), and
base metal for pipe E-13. Figure 33 shows a typical cross section of the weld region in pipe E-13 with the
results of diamond pyramid hardness (DPH) traverses through the weld, HAZ, and base metal. As previously
described from the macroetched specimens, the dendritic structure of the weld is fairly fine. In addition,
only the HAZ appears to be significantly coarsened at the center of the weld. The base-metal structure is
uniform except for a narrow coarsened band at the inner surface. The results of the DPH traverses are in
good agreement with the microstructures, except that the measurement of the base metal at the inner
surface appears to be high because it was not located in the coarsened band.
Figures 34 through 36 show the typical microstructures of the weld, HAZ, and base metal for pipe
F-14. Figure 37 shows a typical cross section of the weld region in pipe F-14 with the results of DPH
traverses through the weld, HAZ, and base metal. The dendritic structure of the weld is coarser than that
for pipe E-13; the DPH values for the weld are also correspondingly lower for F-14 as compared with E-13.
The HAZ for F-14 is coarsened throughout the thickness; the DPH traverse through the HAZ verifies this.
The base-metal structure is relatively uniform. The coarser structures seen in the weld and HAZ of pipe
F-14 are the result of the higher heat input used.
Figures 38 through 40 show the typical microstructures of the weld, HAZ, and base metal for pipe
G-15. Figure 41 shows a typical cross section of the weld region in pipe G-15 with the results of DPH
traverses through the weld, HAZ, and base metal. The weld in G-15 has a coarse cellular-dendritic structure.

oo-
0X UJ
noo
o
•o
o 0o-
w
-L (ft)'
00-r- Li")
C\J
0-0
0-ID
in
2, , CO P
41
:>:l-V--:^
"•V^fi1**"."•>• =5*' v-il
• ••* $%&•* - **-.-•' z
Fig. 30. Typical microstructure of weld in pipe E-13, etchant 50 HNO3-50 H20 applied electrolytically, 100X; (a)outside surface, (b) center, (c) inside surface.

-~o
o
qXuj
Sou
oo-
o
-o
ci
1 (ft).-*
0
- A ^J •
\ {to
CO-o
. O
OCM
-"Oo
.
O xoo 5 to s«
o
d
1 (c)
42
t
'.....".": "^
Fig. 31. Typical microstructure of fusion zone boundary and HAZ in pipe E-13, etchant 50 HNO3-50 H,0 appliedelectrolytically, 100X; (a) outside surface, (6) center, (e) inside surface.

43
"^ (a)
7 —
(ft)
Fig. 32. Typical microstructure of base metal in pipe E-13, etchant 50 HNO3-50 H,0 applied electrolytically, 100X;(a) outside surface, (b) center, (c) inside surface.

rm=] EH n^n ram
™h mp jhe am me eeb
1 cm155.9^ ,• 165.1,
Fig. 33. Typical cross section of weld area in pipe E-13 showing the results of DPH traverses through the weld, HAZ, and base metal.
*>*.

o
-o
o
(a)
45
:>• '..'-r ;
— 'i
o<>-f- m j
oo r
oo- o >.10
CM r._ "° 4
COz
O R
cn'i
'%/%&£& tiff fM& iffii $&&4f- *AJ:hkhYi50"5«$•$""• m:i hmH^h-^yr. -•--, •\i hfeof/; *>>>/£/ //7:;- ./«i », : '•'• , •' - & ' •-" f-/^\^fi™ fM'W/ VI, -Jdis*S a* if%Uf+ fAhftfr<. -J
•l / 'i > T ,' '•' 5 ! tf •'i/jj -. 1 u/i . i •• ^i?( '; •--',• ! 'stti&,?/h4 H;,i H*-WU ift&JJ?:J{'
iU ' ( " ' ' '•• ' ', ' l V r " '" ' ".,'' ' K"
» . \\ 'i , : ':Y. '. --: •". * : \, , •. '; hlT'-P, ' .* •• !•• ;•'•'./••'-' ' ' -" 1! *•"<''• 1
- ,\ ' \. :! )• '. •'• ,i :••', ^i
i^rfcB^&M^
C ///; I I
m Vtl
# t.,»•
° '-7k'/ /i •^•-fV
Fig. 34. Typical microstructure of the weld in pipe F-14, etchant 50 HNO3-50 H20 applied electrolytically, 100X;(a) outside surface, (b) center, (c) inside surface.

oo-
o- o
oo-
'O
b
oxiU
Sou
o
-o
ci
(")
0>< LUcrgiuOu
oO-i
oo-
oo-
org itjOU
oo-
(A)
46
U/ •
r.<< ru -<r
-,<• '•'-v-''•--'•• 5 r 5>
\ - . Z ' ••"• ' .-• Y150998* ' '•-*. * • • . .'• l
Mt. -'• •, ^ ' K ,_'\ •- ;'•"•«'' -.."''' * ,*
X-Ty' •>'.' •-••'•;I •' '"."•" - ••••'•
' „-'*^.'- • .
"""•.-•."''* '"; "•-'.''r' i'.
- ' {< .. • ' "
V -'•"*'• *'
• A -'
-~L'/-;'-
—;:
' ^*^?"..—..
—:p^T *
fjr+rfr
tern.
Fig. 35. Typical microstructure of the fusion zone boundary and HAZ in pipe F-14, etchant 50 HNO3-50 H,0applied electrolytically, 100X: (fl) outside surface, (b) center, (c) insidesurface.

od
z„ -0XUJq;OI,,oo
(a)
qXuj
ceO IyOO
(ft)
47
Fig. 36. Typical microstructure of the base metal in pipe F-14, etchant 50 HN03100X; (a) outside surface, (b) center, (c) inside surface.
i
-50 HjO applied electrolytically,

143.5 148.)
130.3
1397
151.6 139.7 j
150.2
158.9 161.91 cm
143.5- ill6 j5L(
'"' ". '' •• •'"''.'• •:-' •{HE \.
CZZI ••••}; •'•', >"••'.:,jEE Eg .aEE 'Bee. '.
Fig. 37. Typical cross section of the weld in pipe F-14 showing the results of DPH traverses through the weld, HAZ, and base metaL

49
2 S -rl
•s .4 fi
.A,
i '"'. jiii '5' : i '•/,-.' •'ill Si»--f
& *
if) ff.(a) 'y'
o',
<)-N LO
CM
o_o
o- o
Ci>
oCM *
_ ~o *
too
. CO '
;ox50 u
(ft)
a1?• 'I '• i
oo-
oo-
V . • * ' %. > • - i •« v . • ^ ' " *.
v^**<*.•••••? •' '•'•-'*•••' •. '-.
* • " . . •
(c)
-I.J. :• *••. # -i'•III :»'"•*•
v
»<*":'".:Y150986
-_—-—. ""•" ** ••"•• •c= «j
-**» ..& ,." ' "* I1'
.,••» ,* ",.- "' -
*
j. ,.el' i "r; ' .^-^-^r^
•9, , " ' '• •* i*:_?
•^i"
.-. • —Mil , , • ,j ^
• •»-"-—*»® • ;. '.*• »•*« V"^ £P—; />-lLlu
™J ^ •«•• ..•«,- " *!. "• ,t
.."-J ~f»*»
s*^^w**"* ^,<**",,">', ". '• ~'*\ •
-A^ ."^i*' * Y1 50987
Fig. 38. Typical microstructure of weld in pipe G-15, etchant 50 HNO3-50 H,0 applied electrolytically, 100X; (a)outside surface, (6) center, (c) inside surface.

oG-f
oo-
o
in °z„ c/>
crOi0oo
o
'Po
o-
(ft)
50
-W^>bs
.
» -; /- •"•-
„/
--- p C ~"~- j5.
Y150989
/
/
'
1'" ' \
'" .--^• .---.
'*-"
/--/.,^-r^—v-
; _'l *"• .../ - tf^K^
- - -~ *" "": . . . %"V
• *'-—•-• .
" 7"— •« .'> '^X'-""'; kj<
Cf
Fig. 39. Typical microstructure of fusion zone boundary and HAZ in pipe G-15, etchant 50HNO3-50 H,0 appliedelectrolytically, 100X; (a) outside surface,(6) center, (c) insidesurface.

oo-
oXuccgx
oon
0X ujk9 xuOO
oo-
8-0
o
-o
o
-Tod
oXujorOi
51
V—
ZJ
(')y
.-
(ft)
I Yl 50993
o
o-
o .
'O. •"
, ' .. "_ 5* --- -
_: '• -:" \ ' ••--#«
-♦- T-— " J ~
. -7 __\7_'j;=V J __ .-. .. L /
_- i '-- " -~l;/-~ ',:••• :~-: -... "*-j £~^ <) '" ./' • ' ~ "-„_ .. — .
--
,"^l£ £&. -1; '•j-'.S A ~" -, •
~) 1
Fig. 40. Typical microstructure of base metal in pipe G-15, etchant 50 HN03 -50 H2O applied electrolytically, 100X;(a) outside surface, (b) center, (c) inside surface.

V GEES
FITS EEB EB mst BJE E2J
E33 EE23 nroEi
1 cm
Fig. 41. Typical cross section of weld in pipe G-15 showing the results of DPH traverses through the weld, HAZ, and base metaL

53
The structure in the center of the weld was coarser as confirmed by the hardness traverse. In general, the
weld structrue was much coarser than that of either E-13 or F-14. The HAZ appears to have experienced a
greater degree of coarsening at the inside surface and center.The epitaxial growthof individual fusion zonegrains from the base metal is more clearly observable than on the microstructures for either E-13 or F-14.The structure of the base metal does not correspond well with the hardness traverse. The microstructure
indicates coarser grains at the inside and outside surfaces than at the center, while the hardness measure
ments indicate almost the opposite.
Figures 42 through 44 show the typical microstructures of the weld, HAZ, and base metal for pipeG-16. Figure 45 shows a typical cross section of the weld region in pipe G-16 with the results of DPHtraverses through the weld, HAZ, and base metal. The weld has a coarse cellular-dendritic structure as was
present in G-15. The weld structure at the inside surface appears to be the most coarse.The weld structure
is columnar at the inside and outside surfaces, while it is relatively equiaxed at the center. The growth from
the base metal into the fusion zone is again epitaxial as was the case in G-15. The coarsening of the HAZ
appears to be most pronounced at the inside surface. This is because of the large heat input used to make
the weld on the inside surface. The hardness values correlate with this conclusion. The base-metal structure
was coarser on the inside and outside surfaces than it was at the center. This is the same variation seen in
pipe G-15, because the plate used for both pipes was from the same heat of steel. The lack of correlation
with the hardness measurements is also the same as reported for pipe G-15.
Figures 46 through 48 show the typical microstructures of the weld, HAZ, and base metal for pipeH-22. Figure 49 shows a typical cross section of the weld region in pipe H-22 with the results of DPHtraverses through the weld, HAZ, and base metal. The inside surface of the weld has a fine dendritic
structure. The structure of the center and outside surface of the weld is considerably different than that of
the inside. This is probably due to the fact that the flux used to make the inside weld and that used to
make the two outside welds were different (Lincoln 860 was used for the inside and Arcos S-l 1 was used
for the outside two). The hardness traverse indicates that the outside passwasstronger. Epitaxialgrowth ismore clearly observable at the fusion zone boundary at the center of the weld than at the boundary nearthe outside and inside surfaces. The HAZ appears to be most coarse near the outside surface. However, the
hardness traverse does not agree with this conclusion.This is probably due to the fact that the outside weld
pass had the highest heat input. The structure of the base metal is generally coarser than that for the otherfour pipes. The structure at the center of the base metal was finer than that at either the outside or theinside surfaces. However, the hardness traverse does not agree with this conclusion.
The above evaluation highlights the fact that the structure of a weldment is extremely variable, with
significant variations occurring within the same weld, within welds made by the same process, and withinwelds made from the same filler material. Several programs are in progress at ORNL to study the relation
ship between weld structure and properties. It is beyond the scope of this report to make such complexcorrelations because of the limited number of welds tested. However, a later section will characterize the
mechanical properties of the five weldments in the pipes.
6.3 Ferrite Evaluation
The ferrite content of the welds from pipes E-13, F-14, G-15, G-16, and H-22 has been destructively
examined. Table 14 shows the vendor and ORNL overcheck chemical analyses. There are some differences
between these analyses that affect the ferrite content calculation. Table 15 lists the weld ferrite numbers
calculated with the DeLong diagram34 from both vendor and overcheck chemical analyses, measured bymagnetic permeability,33 and the area percentage of ferrite determined by quantitative television microscope (QTM) analysis of specimens etched to identify the ferrite phase. It is again important to note that

54
\\ \ «' > *#-j -i .• - «f"l •V5\to >••••
I
(a) W-.w^.vm'V^V- .WsifTrt ilv\ vtnv >f>;V-;>
oo-
8- o
qXlUtrgx0oo
oo-
(ft)
»»..,,o
iVift t.
rJ •• .7***—- ...--^"•' - •- ••*-y" " Y150978..- - '^ ' . ^ * ' - "••.)* V
, -'•"""' *. , • . ' ' • ~ /'-•"• - • >* . „. rf '- ?«- -- •-—- *
M. /"' ~^v."'""^ *£>•** v • . - '-•'-.' '. "" - \ f-v- ^ ,. •••" ". -. --.-v.
C" •-.. " • ** .. -:.V ' • .s-v*." ,„ • v --—.
' T" > ..--'," b- '* . »V ' • '--«*; - „,', t4*'t*" -" '-••:• ••• i
t^2*tS '--^• '-__
•~••' i -..
'• _^jf .,..,-" *-rt' ^} :- „. ' -l. •• *7° 3cto^^T"J"rr '•*••*'; F'
: : ,.J.-- *^—«3«w-
•' ,v. •:''. - -/ •• . .v*"^*^. •&' sJ
T ..', ft- ^,
'.- V ',v *•- '• ; *2 ;—, -&•' j^v**^
. .^ -.„».
—'
•• '"*T* , •'
T-•;(' "j?~ ' >
Fig. 42. Typical microstructure of weld in pipe G-16, etchant 50 HNO3-50 H,0 applied electrolytically, 100X; (fl)outside surface, (b) center, (c) inside surface.

55
o x UJcrOi
f-L (a)
-"O
d
)X UJ-O I
s-"V
\
"VAX. "*7
^~»'""**** *"""
3&T^ *
--
•s*/*- t
-r :
~- !," *
\,"_ V
(ft)
""<•& ^-; ~y t\
ii. ' •'•: ^" >y - ' • s •,
^ .1 « . ' i\
V
*«•>_..'' ~-^-,..„' ;•
Fig. 43. Typical microstructure of the fusion zone boundary and HAZ in pipe G-16, etchant 50 HNO3-50 H,0applied electrolytically, 100X; (a) outside surface, (ft) center, (c) inside surface.

oo-
(a)
oo-
d ,
0X UJ 4.or2 x 5
,1,-
(ft)
qXLjJ
Sou
56
| Y150982
I \l»&s-22
\ \J~_.—i 1 : •y\
/
/f'-
1._/ -•'
; ^
Fig. 44. Typical microstructure of base metal in prpe G-16,etchant 50 HN03-50 HjO applied electrolytically, 100X;I outside surface, (b) center, (c) inside surface.
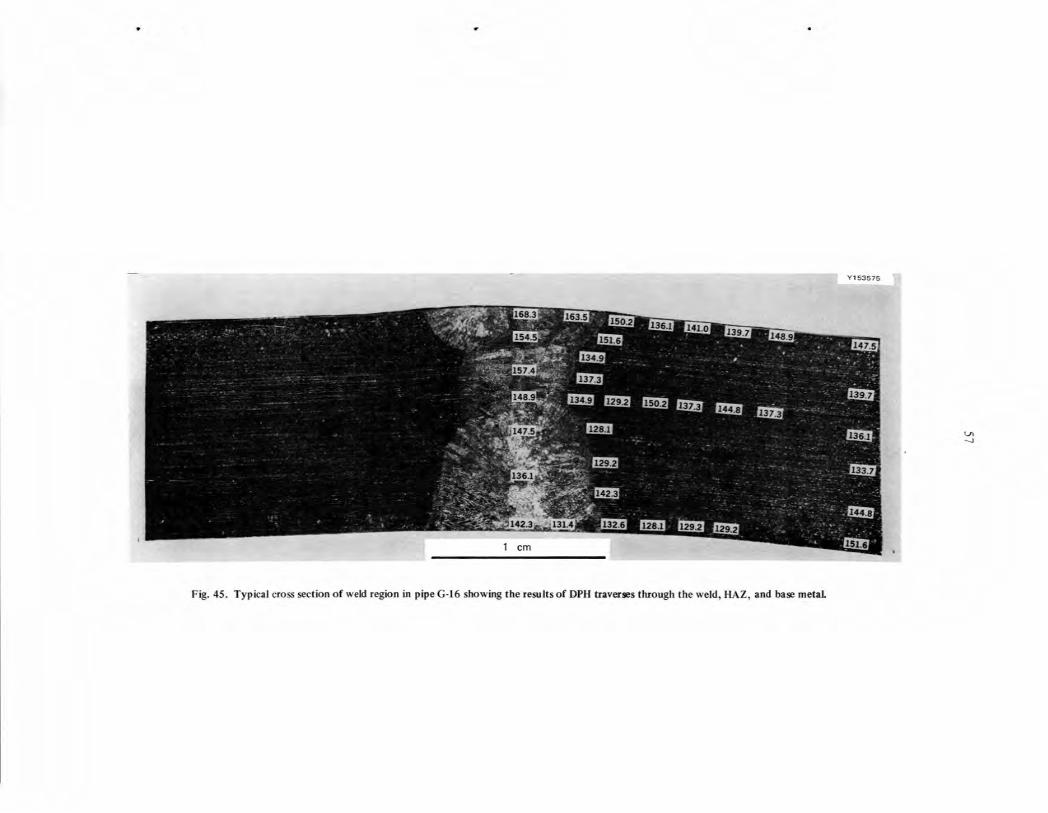
™ RIBPP-;:. EE EB Q3B {SB Km r«^
nag gai ish >m&1 cm
Fig. 45. Typical cross section of weld region in pipe G-16 showing the results of DPH traverses through the weld, HAZ, and base metaL

58
•"•• '•/•'-.--• •'-•'' -"\. '•
•?.v-k, \(a)
Y151355
(ft)
'- . <<
•£? . W« Y151356
' •'" A .-"'':-":"•'••' il- '-•••'• -; •'•-"• '" ••' :-'"''\ •' •' '-'.'7'- •••*'•.'•-.•: •:,-.••• :.<•-;?•;• '•'•.;•.••• ••' '.'•'..;• ' • .•:'•
•-^•.•v?^:4V^^-:.. '̂̂ •',:'•'-•.-.>•••••' :'V/ V.'f.-''.'<:- "'• *L- .* T* B' * - * i '»j » r ' ' t't m • •» _-1. • * -.' /
*• ;' - * .-:-• >' 'X •- -• ft.•Jfl .« - -* •- • •»•• . .-1
• ' , ' "• j? •' •'..'-- • - '"'- "• "....'. .-•- -jj- • „ ... . •.. « •• -•-;':'-'•*'..,
- *T wtfr ,£ .•• - • • • - • • i_ • • ••/•
•;, •.,j'": •••*-••»'.' ;jr;. ••'').',' ''••• '••• # •''-•'-'.-"'
OO-
-"Od
• o X30 o
8- o
o-o
o-l d
qXuj
Sou
o
-o
0
Fig. 46. Typical microstructure of weld in pipe H-22, etchant 50 HNO3-50 H,0 applied electrolytically, 100X; (a)outside surface, (b) center, (c) inside surface.

59
(ft)
\
m
N9~v-
-rf^-afc—.
Y151358
"4~~^ i °.' o-
v~*• .J UJOx UJaoxSoo-- z5
-o
-o
o do-CM
lO^ O
O -o
o- d
/ .->*A
. .o- o
Qx. ui
cjO o
o
-o
d
Fig. 47. Typical microstructure of fusion zone boundary and HAZ in pipe H-22, etchant 50 HNO3-50 H,0 appliedelectrolytically, 100X; (a) outside surface, (ft) center, (c) inside surface.

60
I^^U^^m^SL^^^^CtaYI^KJGO
' - '^' _J-y\
' SJjJ > ' •/ .
,_-Mr- xr • \
(a) ' 2> _ •" "\ - p " ** '
-_o
in °oxui0:2 ISoo
op-
o-o
o-\ 6
Of i s- y •
(ft)
\
-M1
Vt^\ \ • /
/
s
i.
/
Y151361
JOO-N CO
C\J
• ' O~o
o- dcO
o
_ "O/
ind
z... inOx UJ
* SoxSoo
—-
Fig. 48. Typical microstructure of basemetal in pipe H-22, etchant 50 HN03-50 H2 0 applied electrolytically, 100X;(a) outside surface, (6) center, (c) inside surface.

1>
Fig. 49. Typical cross section of weld area in pipe H-22 showing the results of DPH trareraes through the weld, HAZ, and base metal.

62
Table 14. Chemicalanalysesof formed and welded pipes
Pipe LocationContent (wt %)
C Mn P S Si Ni Cr Mo V Nb Ti Co Cu Al B N
Vendor analysis
E-13 Plate 0.074 1.78 0.020 0.012 0.91 11.48 17.18 2.01Weld 0.060 1.66 0.012 0.012 0.49 10.79 16.43 2.00
F-14 Plate 0.043 1.68 0.031 0.008 0.61 11.10 17.55 2.08Weld 0.040 1.68 0.027 0.010 0.48 11.31 17.94 2.18
G-15 Plate 0.055 1.63 0.025 0.024 0.45 12.10 16.40 2.15Weld 0.055 1.58 0.026 0.025 0.46 12.20 16.40 2.20
G-16 Plate 0.058 1.72 0.025 0.024 0.46 12.20 16.70 2.32Weld 0.051 1.65 0.025 0.024 0.42 12.20 16.30 2.17
H-22 Plate 0.053 1.82 0.020 0.012 0.50 13.30 16.65 2.28Weld 0.060 1.65 0.024 0.019 0.55 10.06 15.33 2.04
Overcheck analysis*1
E-13 Plate 0.066 1.63 0.032 0.009 0.58 11.29 16.09 2.85 0.06 <0.01 0.01 0.17 0.22 0.01 0.001 0.039Weld 0.053 1.57 0.014 0.014 0.49 9.42 16.18 1.95 0.04 <0.01 0.01 0.06 0.13 <0.01 0.001 0.041
F-14 Plate 0.048 1.67 0.022 0.009 0.52 11.18 17.85 2.00 0.08 <0.01 0.01 0.21 0.19 <0.01 0.001 0.056Weld 0.026 1.57 0.020 0.009 0.51 11.62 17.88 2.08 0.08 <0.01 0.01 0.18 0.17 <0.01 0.001 0.037
G-15 Plate 0.064 1.57 0.029 0.026 0.47 12.63 16.39 2.19 0.05 0.01 0.03 0.22 0.26 <0.01 0.003 0.074Weld 0.051 1.50 0.026 0.021 0.53 12.68 16.19 2.17 0.05 0.01 0.02 0.23 0.27 <0.01 0.002 0.059
G-16 Plate 0.064 1.46 0.027 0.025 0.52 12.67 16.20 2.15 0.05 0.01 0.02 0.22 0.26 <0.01 0.003 0.083Weld 0.055 1.46 0.027 0.023 0.49 12.67 16.33 2.15 0.05 0.01 0.02 0.22 0.27 <0.01 0.002 0.062
H-22 Plate 0.057 1.84 0.030 0.018 0.60 13.17 16.37 2.21 0.07 <0.01 0.01 0.08 0.45 <0.01 0.002 0.076Weld 0.055 1.72 0.025 0.021 0.53 9.83 15.14 2.06 0.04 <0.01 0.01 0.08 0.21 <0.01 0.002 0.044
aSpectrographs chemical analysis performed by Combustion Engineering, Chattanooga, Tenn. Weld metal was analyzed in region where dilution effectswere minimized.
Table 15. Ferritecontent of formed and welded pipes
Location
Ferrite numberMeasured
PipeCalculated
vendor"
Calculated
overcheck6Measuredc
ferrited(area %)
E-13 Outside
Center
Inside {'} H0.1-0.2
0.1-0.3
0.2-0.4
1.6
1.3
2.4
F-14 Outside
Center
Inside H H3.2-4.8
2.4-2.8
0.6-1.2
7.2
5.8
1.8
G-15 All 0 0 0 0
G-16 All 0 0 0 0
H-22 All 0 0 0 0
"Calculated from Delong diagram, using vendor chemical analysis shown inTable 14 and assuming 0.06% N.
"Calculated from Delong diagram, using overcheck chemical analysis shown inTable 14.
cMagnetic permeability measurements made with Twin City Testing Corp.Ferritescope, type FE8e2, model B, with probe type KF. Calibration was performed in accordance with AWS A4.2-74, usingTeledyne McKay weld metal secondary standards. Measurements were made on five specimens sectioned at 0.3-mintervals along the weld.
Quantitative television microscope analysis was made on one specimen perpipe, which was etched with 15gK3 Fe(CN)6 -15 gKOH-100 ml H2 Oat 98°C toidentify the ferrite phase. The area percentage of ferrite was averaged for six0.150-mm2 areas at the outside, center, and inside of the weld.

63
the diagram34 and magnetic permeability33 techniques are not applicable to solution-annealed welds. Inaddition, it would be expected that measured values should not agree too well with calculated values. Thisis again due to the effects of solution annealing.
Although the vendor chemical analysis of the weld from pipe E-13 predicts a zeroferrite number, theovercheck chemical analysis, magnetic permeability measurements, and metallographic examination indicated ferrite. Thisdiscrepancy is due to the use of an assumed nitrogen content (0.060% assumed vs 0.041%actual) and a higher reported nickel content (10.79% vs 9.42%) for the vendor analysis. This raised thenickel equivalent and therefore decreased the predicted ferrite content. Figure 50 shows the typical ferritemorphology of the weld in pipe E-13 nearthe outside surface, center, and inside surface. The fine globularferrite morphology shown in Fig. 50 isa result of the lowchemical potential for ferrite formation, the highcooling rates achieved by the previously described small-bead deposition sequence, and the solution heattreatment. These photomicrographs indicate no apparent significant difference in the ferrite morphology orcontent across the thickness of the weld. Figure 51 shows a continuous QTM scan across the weld thick
ness. This scanverifies the relative consistency of the ferrite content. The QTM ferrite measurement and theferrite content predicted by overcheck chemical analysis unexpectedly agree fairly well. The differencebetween the QTM measurements of ferrite percentage and the magnetic permeability measurements offerrite number is probably partially related to variation in the ferrite etching technique and the sensitivityadjustment of the QTM equipment. However, the reported33 change in magnetic response of solution-heat-treated welds may also be involved.
The difference between the ferrite numbers calculated from vendor and overcheck chemical analyses for
the weld in pipe F-14 is again due to the use of an assumed nitrogen content (0.06% assumed vs 0.037%actual) and a higher carbon content (0.040% vs 0.026%) for the vendor analysis, which raised the nickelequivalent and therefore decreased the predicted ferrite content. Figure 52 shows typical ferrite morphology in the weld in pipe F-14 near the outside surface, center, andinside surface. Thevariation in the ferritemorphology across the weld thickness can be related to the previously described weld bead deposition. Thelarge, high-heat-input bead deposited from the outside produced a coarser ferrite morphology at the weldoutside surface and center than on the inside surface. Figure 53 shows a continuous QTM scan across theweld thickness. The variation in ferrite content shown by this scan is typical of a single-groove joint. Fromthe inside surface (root) of the weld to approximately one-third of the thickness, the ferrite content islowbecause of dilution of the weld metal with the fully austenitic base metal. However, as the outside surface
(face) of the weld is approached, the dilution decreases and the ferrite content increases until it levels offatthe maximum ferrite potential. The QTM ferrite measurements and the ferrite content predicted by over-check chemical analysis are again in unexpectedly good agreement. There is again a deviation between theferrite content as measured by magnetic permeability and QTM. The previously discussed reasons for the
discrepancy again apply.
The weld in pipe G-15 had a calculated ferrite number of zero, using both vendor and overcheckchemical analyses, as shown in Table 14. This agrees with both the magnetic permeability measurementsand the QTM analysis of the etched microstructure. However, a Delong diagram ferrite number of 7 ispredicted from the chemical analysis of the filler wire, shown in Table 16.There are several reasons for thedifference between the predicted ferrite number for the filler wire and the deposited weld. One reason isthat the vendor chemical analysis of the filler wire did not report the nitrogen content, and therefore itseffect as an austenite former could not be accounted for. A comparison of Tables 14 and 16 also showsachromium content of 19.42% in the filler wire vs 16.40% for vendor and 16.19% for overcheck analyses of
the deposited weld. This change in chromium content has a significant effect on the ferrite numbercalculation. The change in chromium content can be explained by dilution effects and some losses duringwelding. In addition, the pickup of nitrogen during welding increases the austenite forming potential.

64
-i Y145047
S
(a) » • #
* I
(A)*-.'
•-°5
(c)
Fig. 50. Typical fetrite morphology to the GTA weM in pipe E-13. The outside surface is to the left in all photomicrographs. Etchant 15 g K3Fe(CN)6-15 g KOH-100 ml H,0 at 98°C. 500X. (a) Near outside surface, (ft) nearmidthickness, (c) near inside surface.

<LLI
CC
<
oo
rr
rr
24
18
12
65
ORNL-DWG 77-17568
AVERAGE 1.5%
0 -j i i i i i i i i i • i -j i i i i i i i i 'it'
INSIDE
SURFACEDISTANCE (0.40-mm STEPS) OUTSIDE
SURFACE
Fig. 51. Typical ferrite content variation across the thickness of the GTA weld in pipe E-13. Measured by quantitativetelevisionmicroscope analysis of a specimen etched with 15 g K3Fe(CN)6-15 g KOH-100 ml H20 at 98°C to identify theferrite phase. Butted fields with an area 0.150 mm2 were examined across the weld thickness.
The autogenous weld in pipe G-l 6 also had a calculated ferrite number of zero from both vendor and
overcheck chemical analyses, as shown in Table 15. This is as expected since the base metal was fullyaustenitic. Both magnetic permeability measurements and QTM analysis of the etched microstructure
confirmed the absence of ferrite.
Table 15 shows that the weld in pipe H-22 had both calculated and measured values which indicated no
ferrite present. The situation with this weld is somewhat similar to that in G-15. Table 17 shows the vendor
chemical analysis for the bare filler wire used to weld pipe H-22. Analyses were made on samples of thebare filler wire which were removed from the wire spool before and after welding. The Delong diagram34predicts a ferrite number of approximately 2, using the analyses shown in Table 17. The reason for the
difference between the predicted ferrite number for the bare fillerwireand the deposited weld is again due
to changes in chemical composition. A comparison of Tables 14 and 17 shows a nickel content of 6.70% in
the bare filler wire vs 10.06%for the vendor and 9.83% for the overcheck analyses of the depositedweld.
This change has the effect of greatly decreasing the calculated ferrite number. Although there were other
differences in the chemical content betweenthe filler wire and the deposited weld,the change in the nickelcontent had the greatest effect. The change in nickel content probably resulted from dilution effects.

66
\ • •
-f *•->
> '•*>
\
.1 cV
w i •
7V
-?/•
(6) M . -c
r v.
\ \ •»
•
>
f
V «>/y
v V i> z
: .~\ -'/us
?• -y v ^ ^ \ ' 1 « „* \°
X • \ Y146045
I I y[r:> '• -Jim
(I ' -'- - J I
• j* • • • , »»
*• *
• 7. '— *./..
Y146046
* »<•-«, _
t ' „*# « - • S"
1o
oo
d
*
; '* » o( y
• :i:
(f\
• *
°c>
z
* *\ « .* # o
•\ o
t
• 1 • -8
•*»• •:o
«.V*
•« <& ^ *
/,
i /,
(c)':. '• •«..;*./
-
V
* /
A/
Fig. 52. Typical ferrite morphology in the GTA weld in pipe F-14. The outside surface is to the left in all photomicrographs. Etchant 15 g K3Fe(CN)6-15 g KOH-100 ml H20 at 98°C. 500X. (a) Near outside surface, (ft) nearmidthickness, (<?) near inside surface.

24
cc
S 18
Oo
cc
ccLU
12
6 -
0
INSIDE
SURFACE
67
AVERAGE 4.9%
i i i i i _i i i i_ i ' ' ' i
DISTANCE (0.40-mm STEPS)
ORNL-DWG 77-17569
j i i i i i_
OUTSIDE
SURFACE
Fig. 53. Typical ferrite content variation across the thickness of the GTA weld in pipe F-14. Measured by quantitativetelevision microscope analysis of a specimen etched with 15 g K3Fe(CN)6-15 g KOH, 100 ml H20 at 98°C to identify theferrite phase. Butted fields with an area of 0.15 mm2 were examined across the weld thickness.
In an earlier section, the results of a nondestructive evaluation of the ferrite content of the five welds
were reported. Comparing the results of the destructive evaluation performed in this section with those of
the nondestructive examination will provide some measure of the capability of the nondestructive technique to characterize the ferrite content of the welds. Table 18 shows a comparison of nondestructivemeasurements made on the inside and outside surfaces of the pipe and destructive measurements made
across the thickness of specimens sectioned from the weld as shown in Fig. 21. The sectioned specimenscorrespond to the locations where the nondestructive measurements were made. The results shown in Table
18 indicate that there is generally good agreement between the nondestructive and destructive ferrite
measurements. As previously discussed, the differences between the magnetically determined and QTM
measurements could be related to several factors. It can be concluded that a nondestructive techniqueprovides an adequate means of generally characterizing the ferrite content of solution-annealed longitudinalseam welds in formed and welded pipe.
7. MECHANICAL PROPERTY CHARACTERIZATION
As a part of mechanical property characterization, tensile tests were performed on all five pipes.Eighttests were conducted in the base-metal region of each pipe, four in the circumferential(C)and four in the
axial direction (A). Eight additional tests were conducted in the weld-metal region of each pipe, four in the

68
Table 16. Vendor chemical analysis offiller wire used to weld pipe G-15
„ ^ ContentElement . ^ „.
(wt%)
_, . ContentElement . x „.
(wt %)
C 0.06
Mn 1.68
P 0.025
S 0.008
Si 0.36
Cr 19.42
Ni 13.02
Mo 2.34
Table 17. Vendor chemical analysis of bare fillerwire used to weld pipe H-22
ElementContent (wt %)
Before welding After welding
C 0.08 0.07
Mn 1.51 1.54
P 0.012 0.014
S 0.021 0.023
Si 0.20 0.20
Ni 6.70 6.78
Cr 14.48 14.41
Mo 1.85 1.82
Table 18. Comparison of nondestructive and destructivemeasurements of the ferrite content
Pipe
No.Location
Nondestructivelydetermined
Destructively determined
(FN)fl (FN)" (Area)6
E-13 Outside 0.1-0.4 0.1-0.2 1.6
Center 0.1-0.3 1.3
Inside 0.1-0.4 0.2-0.4 2.4
F-14 Outside 2.8-4.5 3.2-4.8 7.2
Center 2.4-2.8 5.8
Inside 0.6-1.4 0.6-1.2 1.8
G-15 All 0 0 0
G-16 All 0 0 0
H-22 All 0 0 0
"Magnetic permeability measurements made with Twin City Testing Corp.Ferritescope, type FE8e2, model B, with probe type KF. Calibration was performed in accordance with AWS A4.2-74, using Teledyne McKay weld metalsecondary standards. Measurements were made on five specimens sectioned at0.3-m intervals along the weld.
"Quantitative television microscope analysis was made on one specimen perpipe, which was etched with 15 g K3Fe(CN)6 -15 g KOH-100 ml H20 at 98°C toidentify the ferrite phase. The area percentage of ferrite was averaged for six0.150-mm2 areas at the outside, center, and inside of the weld.

69
longitudinal weld direction (L) and the four in transverse weld direction (7).The transverse weld specimenshad a composite of weld metal, HAZ, and base metal in the gage length, while the longitudinal specimenswere generally all weld metal except for a few which had some composite areas. In order to sort out thechemistry and straightening effect on tensile properties, we reannealed (laboratory annealed) eight specimens from each of the pipes, four from the base metal (two axial and two circumferential) and four fromthe weld-metal region (two longitudinal and two transverse). The reannealing treatment consisted of holding the tensile specimens at 1065°C for 0.5 hr followed by air cooling. The annealing treatment wasperformed in a tubular furnace backfilled with argon gas. The test specimen and the sectioning procedureare illustrated in Fig. 54.
ORNL-DWG 78-15718
(2.7 DIAM (FINISHED)
19 DIAM (ROUGH
CENTERS PERMISSIBLEMAX 3.97 DIAM X 3.97 DEEP
NOTE:
DIMENSIONS ARE IN mm
SPECIMEN
CENTERED VERTICALLY
LOCATION OF TRANSVERSE WELD SPECIMENS
ORNL-DWG 77-12699
ORNL-DWG 781308
6.35-I3NC-2A(TYP)
£„=FROM 25 TO 38m"id GREATER THAN D.
SPECIMEN CENTERED
IN WELD
LOCATION OF LONGITUDINAL WELD SPECIMENS
Fig. 54. Tensile test specimen design and itslocation and removal from blanks containing welds.
7.1 Test Procedure
Tensile tests were run on a 44-kN-capacity (10,000-lb) Instron Universal testing machine at a constantcrosshead speed to give a nominal strain rate of 0.002 mm/sec (0.004 in./min). Strains measured byaveraging extensometers and loads from cells in the load train were obtained for the first 0.05 strain, while

70
crosshead displacement vs load was graphed simultaneously and monitored continuously to rupture. The
yield strength values were obtained from the extensometer chart (by the 0.2% offset method), and ultimate
tensile strength was obtained from the load deflection chart. The total elongation values were measured
from 25.4-mm gage marks on the gage section of the specimen.
7.2 Data
The tensile properties of the base metal and weld of the pipes in the as-received condition are sum
marized in Table 19. Tensile properties in the laboratory-annealed (reannealed) condition are summarizedin Table 20. These tables also include the values of engineering toughness, which is the area under the curveup to maximum load.
7.3 Engineering Stress-Strain Curves
The engineering stress-strain curves for axial base-metal and longitudinal weld specimens are comparedat room temperature, 427, 538, and 649°C in Figs. 55 through 59. These figures show that significantdifferences exist between the stress-strain curves of the base and the weld metal,with the most noticeabledifferences being in yield, ultimate tensile strength, and total elongation. The extent of the differencebetween the weld and base metal depends on the filler metal and the welding procedure. This point will beillustrated in detail in a later section of this report.
7.4 Comparison of Properties with Upper and Lower Bounds for the Wrought Material
The tensile properties of the base metal and weld of the pipes were compared with the upper and lowerbounds (expected ±2 standard error of estimate) derived from ORNL data35 on eight heats of wroughtmaterial. Plots showing the comparisons are presented in Figs. 60 through 64.These figures also include theminimum property curves computed by the ratio method.36 The following observations can be made fromthese figures.
0.2% yield strength. The base metal showed essentially the same yield strength values in both circumferential and axial directions [Fig. 60(a)]. The scatter in data reflects slight heat-to-heat variation betweenvarious plates used in making the pipe (this will be discussed again in a later section). The base-metal regionyield strength values of all pipes were close to or slightly below the average for the wrought material data.The corresponding yield strength values of the weld of all five pipes were slightly higher than those of thebase metal [Fig. 60(b)]. However, there was more variation in the weld data than in the base-metal data.
The weld in pipe G-15 (cold wire GTA and SA with type 316 filler metal) showed maximum anisotropy atroom temperature, 538, and 649°C. At 427°C, the weld showed the same values in both the longitudinaland transverse directions. The autogenous GTA weld (G-16) and the SA weld with type 16-8-2 filler metal(H-22) showed isotropic yield strength values at all four test temperatures. The GTA weld with both hot-and cold-wire additions of type 16-8-2 filler metal (E-13) showed the same room-temperature yield strengthvalues for both longitudinal and transverse directions. However, the longitudinal values at all higher temperatures were greater than the corresponding transverse values.
Among the five welds investigated, E-13 and F-14 were theonly ones with a similar welding process andfiller metal. Acomparison of yield strength values for these welds showed that E-13 had consistently highervalues than F-14 at room temperature, 427, and 538°C. However, at 649°C, these strength differences wererelatively small. The higher values of the E-13 weld are a result of its higher C + N content of 0.094% ascompared with 0.063% for the F-14weld. This point will be explained in more detail in a later section.
Ultimate tensile strength. The base metal ofall five pipes showed UTS values close to or slightly belowthe upper bound for the wrought material [Fig. 61(a)]. Significantly lower values at 649°C are due to a

Tab
le19
.T
ensi
lepr
oper
ties
of
five
form
edan
dw
elde
dpi
pes
oft
ype
316
stai
nles
sst
eeli
nth
eas
-rec
eive
dco
ndit
ion
Tes
t«w
ere
per
form
edat
ano
min
alst
rain
rate
of0
.00
4/m
in
Test
Str
ess
[MPa
(km
Elo
ngat
ion
(%)
Red
ucti
on
Eng
inee
ring
tou
gh
nes
sT
est
Sp
ecim
enO
rien
tati
on
tem
pera
ture
(°C
)(°
F)
Pro
po
rtio
nal
lim
it
Yie
ld
Ten
sil
eU
nif
orm
1in
.o
fare
a
(%)
(™)
/ft-
lb\
0.0
2%
0.2
%y
Pip
eE
-l3
base
met
al
18
56
9E
-13
-38
C2
57
76
5(9
.4)
16
3(2
3.7
)2
59
(37
.6)
61
0(8
8.4
)6
6.1
98
3.5
57
8.4
53
63
43
87
18
57
0E
-l3
44
A2
57
71
23
(17
.8)
18
6(2
6.9
)2
59
(37
.5)
60
5(8
7.7
)6
7.0
27
9.2
07
7.0
73
64
43
95
18
57
1E
-13
-39
C4
27
80
07
9(1
1.4
)1
24
(28
.0)
16
8(2
4.3
)5
27
(76
.4)
33
.46
46
.70
59
.04
15
41
85
6
18
57
2E
-l3
45
A4
27
80
07
0(1
0.2
)1
16
(16
.8)
•1
56
(22
.6)
51
6(7
4.9
)3
7.2
64
9.3
56
6.2
81
61
19
45
18
57
3E
-13
40
C5
38
10
00
67
(9.7
)1
05
(15
.2)
13
9(2
0.2
)4
81
(69
.7)
42
.61
55
.45
69
.33
17
42
10
01
85
74
E-1
3-4
6A
53
81
00
08
4(1
2.2
)1
12
(16
.3)
14
1(2
0.4
)4
85
(70
.4)
40
.21
51
.41
59
.59
16
41
98
5
18
57
5E
-l3
41
C6
49
12
00
77
(11
.1)
13
6(1
9.7
)1
72
(25
.0)
33
2(4
8.1
)2
0.2
34
5.8
56
9.8
36
88
24
18
57
6E
-l3
47
A6
49
12
00
81
(11
.7)
10
2(1
4.8
)1
34
(19
.4)
31
1(4
5.1
)2
9.6
97
5.9
07
0.5
08
91
06
9
Pip
eF
-14
base
met
al
18
57
8F
-14
-38
C2
57
71
40
(20
.3)
19
3(2
8.0
)2
52
(36
.6)
59
3(8
6.0
)6
4.1
77
8.0
08
2.8
03
43
41
47
18
57
9F
-14
44
A2
57
71
21
(17
.5)
19
4(2
8.1
)2
53
(36
.7)
60
3(8
7.4
)6
2.2
07
9.6
07
8.4
73
38
40
90
18
58
0F
-14
-39
C4
27
80
08
4(1
2.2
)1
15
(16
.7)
14
8(2
1.4
)4
90
(71
.1)
38
.47
44
.80
70
.50
15
81
91
4
18
58
1F
-14
-45
A4
27
80
06
2(9
.0)
11
5(1
6.6
)1
43
(20
.7)
49
4(7
1.7
)3
5.1
84
7.5
06
1.1
21
47
17
80
18
58
2F
-14
-40
C5
38
10
00
61
(8.8
)8
8(1
2.8
)1
19
(17
.3)
44
6(6
4.7
)4
9.1
95
3.3
05
8.1
0a
19
12
31
2
18
58
3F
-14
-46
A5
38
10
00
28
(4.1
)6
4(9
.3)
11
7(1
7.0
)4
45
(64
.6)
41
.36
51
.45
58
.91
a1
57
18
91
18
58
4F
-14
-41
C6
49
12
00
50
(7.3
)8
4(1
2.2
)1
18
(17
.1)
30
8(4
4.7
)2
9.1
27
3.9
07
1.3
78
41
01
1
18
58
5F
-14
47
A6
49
12
00
42
(6.1
)8
4(1
2.2
)1
21
(17
.6)
30
9(4
4.8
)2
7.2
16
9.6
57
1.3
87
99
57
Pip
eG
-15
base
met
al
18
55
9G
-15
-38
C2
57
71
07
(15
.5)
17
4(2
5.2
)2
66
(38
.6)
61
9(8
9.7
)5
4.0
56
7.2
07
5.7
83
05
36
91
18
56
0G
-15
44
A2
57
71
16
(16
.8)
22
6(3
2.8
)2
82
(40
.9)
63
2(9
1.7
)5
1.6
56
1.8
06
2.8
73
01
36
39
18
56
1G
-15
-39
C4
27
80
07
4(1
0.7
)1
10
(16
.0)
16
2(2
3.5
)5
38
(78
.0)
43
.42
68
.21
23
72
86
0
18
56
2G
-15
45
A4
27
80
09
5(1
3.8
)1
26
(18
.2)
15
5(2
2.4
)5
45
(79
.1)
41
.64
47
.72
51
.68
19
32
32
8
18
56
3G
-15
-40
C5
38
10
00
73
(10
.6)
11
5(1
6.7
)1
50
(21
.8)
50
8(7
3.7
)3
4.9
64
1.9
06
6.4
11
51
18
19
18
56
4G
-15
-46
A5
38
10
00
59
(8.6
)1
06
(15
.3)
14
1(2
0.4
)5
12
(74
.3)
40
.62
48
.75
52
.10
17
72
14
0
18
56
5G
-15
-41
C6
49
12
00
71
(10
.3)
99
(14
.4)
13
7(1
9.8
)3
63
(52
.7)
26
.78
56
.65
57
.60
91
10
96
18
56
6G
-15
-47
A6
49
12
00
87
(12
.6)
11
0(1
6.0
)1
35
(19
.5)
36
2(5
2.5
)3
0.0
56
0.0
05
0.9
51
02
12
34
Pip
eG
-16
base
met
al
18
65
8G
-16
-38
C2
57
71
26
(18
.2)
18
3(2
6.6
)2
41
(34
.9)
60
5(8
7.8
)5
7.1
37
5.0
57
9.1
13
13
37
77
18
65
9G
-16
44
A2
57
71
41
(20
.5)
21
3(3
0.9
)2
59
(37
.6)
60
1(8
7.1
)5
8.9
67
6.3
06
5.5
43
23
39
06
18
66
0G
-16
-39
C4
27
80
07
2(1
0.4
)1
12
(16
.3)
15
7(2
2.7
)5
38
(78
.0)
40
.63
48
.35
57
.95
18
22
20
4
18
66
1G
-16
45
A4
27
80
07
1(1
0.3
)1
12
(16
.3)
15
2(2
2.0
)5
32
(77
.2)
43
.38
49
.25
52
.98
19
52
35
11
86
62
G-1
6-4
0C
53
81
00
06
8(9
.8)
11
7(1
6.9
)1
54
(22
.3)
49
4(7
1.6
)3
8.1
74
1.8
05
8.6
31
54
18
57
18
66
3G
-16
46
A5
38
10
00
70
(10
.2)
11
4(1
6.5
)1
38
(20
.0)
48
6(7
0.5
)4
2.0
74
8.8
55
5.7
71
73
20
91
18
66
4G
-16
41
C6
49
12
00
70
(10
.2)
10
1(1
4.7
)1
31
(19
.0)
36
1(5
2.3
)2
9.4
15
2.0
05
6.2
69
81
17
9
18
66
5G
-16
47
A6
49
12
00
76
(11
.0)
10
4(1
5.2
)1
30
(18
.9)
35
1(5
0.9
)2
8.9
75
6.0
05
3.9
99
41
14
0
'ip
eH
-22
Bas
em
eta
l
19
14
1H
-22
-38
C2
57
79
3(1
3.5
)2
29
(33
.2)
33
6(4
8.8
)6
10
(88
.5)
43
.40
63
.65
76
.13
24
93
01
2
19
14
2H
-22
44
A2
57
71
41
(20
.5)
22
6(3
2.8
)3
00
(43
.5)
60
0(8
7.0
)5
4.0
37
0.3
27
4.5
22
99
36
13
19
14
3H
-22
-39
C4
27
80
09
4(1
3.6
)1
51
(21
.9)
19
4(2
8.1
)5
33
(77
.3)
39
.35
44
.24
58
.96
18
22
20
0
19
14
4H
-22
45
A4
27
80
09
4(1
3.6
)1
42
(20
.6)
17
8(2
5.8
)5
19
(75
.3)
43
.23
47
.77
57
.52
19
22
31
61
91
45
H-2
24
0C
53
81
00
09
3(1
3.5
)1
41
(20
.5)
17
9(2
5.9
)4
74
(68
.8)
39
.22
45
.23
60
.19
16
11
94
91
91
46
H-2
24
6A
53
81
00
07
0(1
0.2
)1
20
(17
.4)
16
6(2
4.1
)4
90
(71
.0)
42
.53
48
.64
60
.28
17
92
16
31
91
47
H-2
24
1C
64
91
20
06
3(9
.1)
11
7(1
6.9
)1
65
(23
.9)
35
4(5
1.4
)2
5.7
14
5.5
05
1.0
58
51
03
21
91
48
H-2
24
7A
64
91
20
05
9(8
.6)
10
8(1
5.6
)1
56
(22
.6)
34
1(4
9.4
)2
7.6
74
5.2
14
2.3
68
91
07
6
Pipe
E-l
3w
eld
met
al
18
38
9E
-13
-2L
25
77
14
1(2
0.4
)2
14
(31
.1)
28
3(4
1.1
)5
94
(86
.1)
63
.41
74
.32
75
.60
34
04
10
6
18
39
0E
-13
-3T
25
77
11
2(1
6.3
)1
92
(27
.9)
28
3(4
1.0
)6
03
(87
.5)
49
.88
57
.90
74
.30
27
43
31
3
18
39
1E
-13
-11
L4
27
80
01
18
(17
.1)
16
0(2
3.2
)2
04
(29
.6)
46
3(6
7.1
)3
4.2
84
1.3
55
8.0
71
42
17
10
18
39
2E
-l3
-12
T4
27
80
01
10
(15
.9)
15
3(2
2.2
)1
83
(26
.6)
46
0(6
6.7
)2
5.8
23
1.1
06
2.7
31
04
12
62
18
39
3E
-l3
-20
L5
38
10
00
85
(12
.3)
13
5(1
9.5
)1
83
(26
.6)
41
4(6
0.0
)3
2.0
64
0.4
24
9.0
8a
11
61
40
71
83
94
E-l
3-2
1T
53
81
00
01
05
(15
.2)
13
2(1
9.1
)1
68
(24
.4)
42
8(6
2.0
)2
5.5
03
0.0
15
6.2
19
61
16
01
83
95
E-l
3-2
9L
64
91
20
07
3(1
0.6
)1
13
(16
.4)
15
5(2
2.5
)2
86
(41
.5)
25
.55
62
.00
63
.85
72
86
51
83
96
E-l
3-3
0T
64
91
20
06
6(9
.5)
10
9(1
5.8
)1
39
(20
.2)
30
3(4
3.9
)1
9.6
73
3.1
06
1.2
35
76
92
Pip
eF
-14
wel
dm
eta
l
18
40
9F
-14
-2L
25
77
92
(13
.4)
16
7(2
4.2
)2
46
(35
.6)
55
4(8
0.3
)4
5.2
45
8.5
57
8.2
42
21
26
74
18
41
0F
-14
-3T
25
77
12
2(1
7.7
)1
88
(27
.2)
26
6(3
8.5
)5
44
(78
.9)
35
.49
47
.25
68
.02
17
92
16
41
84
11
F-1
4-1
1L
42
78
00
93
(13
.5)
12
7(1
8.4
)1
72
(24
.9)
44
8(6
5.0
)3
0.9
33
9.1
05
2.9
0a
12
31
48
21
84
12
F-1
4-1
2T
42
78
00
80
(11
-6)
12
4(1
8.0
)1
66
(24
.1)
44
8(6
5.0
)2
6.3
93
2.5
04
6.5
2a
10
01
20
71
84
13
F-1
4-2
0L
53
81
00
08
3(1
2.0
)1
29
(18
.7)
17
0(2
4.6
)4
03
(58
.4)
16
.69
27
.50
64
.57
63
76
11
84
14
F-1
4-2
1T
53
81
00
04
8(7
.0)
10
4(1
5.1
)1
54
(22
.3)
40
8(5
9.1
)2
5.5
53
4.2
05
9.1
2"
91
10
97
18
41
5F
-14
-29
L6
49
12
00
48
(7.0
)9
1(1
3.2
)1
35
(19
.5)
27
2(3
9.5
)2
2.1
06
0.5
56
3.7
7°
58
70
61
84
16
F-1
4-3
0T
64
91
20
09
4(1
3.6
)1
15
(16
.7)
15
4(2
2.3
)2
91
(42
.2)
15
.38
38
.15
60
.58a
45
53
9
Pip
eG
-15
wel
dm
eta
l
18
51
7G
-15
-2L
25
77
17
0(2
4.6
)2
61
(37
.9)
32
5(4
7.1
)5
58
(80
.9)
29
.65
46
.50
68
.26
16
41
97
81
85
18
G-1
5-3
T2
57
71
43
(20
.7)
21
2(3
0.7
)2
65
(38
.4)
53
3(7
7.3
)3
0.6
53
8.9
06
1.3
41
51
18
23
18
51
9G
-15
-11
L4
27
80
09
0(1
3.1
)1
35
(19
.6)
17
5(2
5.4
)4
68
(67
.9)
34
.60
40
.05
55
.51
13
81
67
11
85
20
G-1
5-1
2T
42
78
00
86
(12
.4)
13
4(1
9.4
)1
74
(25
.2)
45
0(6
5.3
)2
3.9
72
9.2
55
5.3
09
51
14
61
85
21
G-1
5-2
0L
53
81
00
07
1(1
0.3
)1
17
(16
.9)
17
5(2
5.4
)4
50
(65
.3)
35
.50
40
.95
50
.12
13
91
67
51
85
22
G-1
5-2
1T
53
81
00
07
6(1
1.0
)1
12
(16
.3)
14
8(2
1.5
)4
28
(62
.1)
28
.57
34
.70
51
.29
10
51
26
51
85
23
G-1
5-2
9L
64
91
20
08
4(1
2.2
)1
19
(17
.3)
16
2(2
3.5
)3
30
(47
.8)
23
.42
34
.40
49
.06
74
89
51
85
24
G-1
5-3
0T
64
91
20
06
5(9
.4)
10
4(1
5.1
)1
43
(20
.8)
32
5(4
7.1
)1
8.7
32
9.8
04
9.0
95
87
05
Pip
eG
-16
wel
dm
eta
l
18
64
7G
-16
-2L
25
77
11
7(1
7.0
)1
79
(25
.9)
24
8(3
6.0
)5
23
(75
.9)
46
.03
61
.10
67
.90
22
12
67
51
86
48
G-1
6-3
T2
57
71
23
(17
.8)
18
8(2
7.3
)2
43
(35
.2)
50
7(7
3.5
)2
5.7
83
8.9
26
8.7
61
20
14
53
18
64
9G
-16
-11
L4
27
80
07
0(1
0.2
)1
14
(16
.5)
15
7(2
2.8
)4
47
(64
.8)
34
.00
43
.95
58
.72
12
91
56
11
86
50
G-1
6-1
2T
42
78
00
77
(11
.2)
11
7(1
7.0
)1
47
(21
.3)
42
3(6
1.3
)2
4.3
13
1.9
55
4.4
7a
87
10
53
18
65
1G
-16
-20
L5
38
10
00
65
(9.4
)1
08
(15
.6)
14
4(2
0.9
)4
19
(60
.7)
37
.64
44
.00
55
.68
13
31
60
91
86
52
G-1
6-2
1T
53
81
00
09
0(1
3.1
)1
17
(17
.0)
14
3(2
0.7
)4
03
(58
.5)
23
.05
28
.65
59
.29
81
97
91
86
53
G-1
6-2
9L
64
91
20
07
8(1
1.3
)1
04
(15
.1)
13
8(2
0.0
)3
19
(46
.2)
28
.81
39
.80
51
.11
819
82
18
65
4G
-16
-30
T6
49
12
00
79
(11
.5)
10
0(1
4.5
)1
32
(19
.2)
31
9(4
6.2
)1
8.6
83
0.7
05
1.1
2a
56
67
6
Pip
eH
-22
wel
dm
eta
l
19
13
3H
-22
4L
25
77
87
(15
.6)
21
7(3
1.5
)2
96
(42
.9)
57
1(8
2.8
)5
6.2
76
4.4
05
9.9
52
89
34
91
19
13
4H
-22
-16
T2
57
71
56
(22
.6)
22
6(3
2.8
)2
75
(39
.9)
55
5(8
0.5
)4
3.1
04
8.3
35
3.6
12
19
26
45
19
13
5H
-22
-6L
42
78
00
59
(8.6
)1
13
(16
.4)
16
6(2
4.1
)4
46
(64
.7)
34
.39
42
.06
49
.78
13
31
60
51
91
36
H-2
2-7
T4
27
80
06
2(9
.0)
12
8(1
8.5
)1
70
(24
.7)
45
4(6
5.9
)2
8.5
43
2.9
24
4.0
21
10
13
33
19
13
7H
-22
-13
L5
38
10
00
70
(10
.2)
11
0(1
6.0
)1
48
(21
.4)
38
1(5
5.3
)3
2.6
33
6.4
14
2.5
31
11
13
36
19
13
8H
-22
-25
T5
38
10
00
90
(13
.1)
12
7(1
8.4
)1
55
(22
.5)
42
5(6
1.7
)2
9.3
13
1.4
63
7.6
91
08
13
07
19
13
9H
-22
-20
L6
49
12
00
46
(6.6
)9
3(1
3.5
)1
39
(20
.1)
26
1(3
7.8
)2
2.4
34
1.8
84
1.6
75
76
80
19
14
0H
-22
-34
T6
49
12
00
63
(9.1
)9
7(1
4.0
)1
40
(20
.3)
29
6(4
2.9
)1
6.4
52
5.7
84
6.6
04
75
64
"Spe
cim
enm
easu
red
sepa
rate
ly.

72
Table 20. Tensile properties of five formed andwelded pipes of type 316 stainless steelin the reannealed (laboratory-annealed) conditionThe reannealing wasperformedat 1065°Cfor 0.5 hr; tests were performedat a normal strain rate of 0.004/min
Stress [MPa (ksi)]Reduction
of areaTest Specimen Orientation Proportional YieldElongation yyo)
imit 0.02% 0.2%Tensile Uniform 1 in.
(%)
Base metal, room temperature
19535 E-13-42 C 119 (17.2) 171 (24.8) 220 (31.9) 590 (85.5) 62.15 72.29 81.8519537 E-13-48 A 120 (17.4) 188 (27.2) 228 (33.0) 597 (86.6) 65.38 80.71 75.2819539 F-14-42 C 135 (19.6) 185 (26.9) 222 (32.2) 585 (84.8) 62.83 74.10 82.6719541 F-14-48 A 166 (24.1) 203 (29.4) 222 (32.2) 589 (85.4) 68.80 82.54 78.8219543 G-15-42 C 154 (22.3) 219 (31.7) 250 (36.2) 623 (90.4) 60.64 71.05 78.0919545 G-15-48 A 160 (23.2) 203 (29.5) 258 (37.4) 624 (90.5) 55.40 67.78 62.9919547 G-16-42 C 107 (15.5) 192 (27.8) 241 (34.9) 604 (87.6) 52.53 62.87 76.8319549 G-16-48 A 140 (20.3) 193 (28.0) 247 (35.8) 608 (88.2) 58.37 72.97 64.7319551 H-22-42 C 145 (21.1) 218 (31.6) 246 (35.7) 584 (84.7) 50.93 68.59 73.7219553 H-22-48 A 134 (19.4) 208 (30.1)
Base metal
252
649°C
(36.6) 603 (87.5) 53.55 71.28 74.01
19536 E-13-43 C 74 (10.8) 90 (13.1) 106 (15.5) 310 (44.9) 29.61 72.40 76.0519538 E-13-49 A 57 (8.2) 92 (13.4) 106 (15.4) 323 (46.9) 31.54 70.00 69.7519540 F-14-43 C 80 (11.6) 91 (13.2) 103 (15.0) 301 (43.6) 30.14 67.73 70.9819542 F-14-49 A 41 (5.9) 78 (11.3) 97 (H.l) 302 (43.8) 31.59 59.43 68.9819544 G-15-43 C 50 (7.3) 101 (14.6) 126 (18.3) 359 (52.1) 28.46 45.38 52.3319546 G-15-49 A 70 (10.1) 105 (15.3) 128 (18.6) 359 (52.1) 30.43 51.30 51.2019548 G-16-43 C 66 (9.6) 93 (13.5) 117 (17.0) 350 (50.8) 31.09 56.83 56.6719550 G-16^19 A 59 (8.6) 92 (13.4) 119 (17.3) 340 (49.3) 28.07 55.28 53.9219552 H-22-43 C 67 (9.7) 88 (12.8) 119 (17.2) 340 (49.3) 27.92 50.75 46.5219554 H-22^19 A 66 (9.5) 99 (14.3) 117 (16.9) 339 (49.1) 29.31 51.72 41.45
Weld metal, room temperature
19587 E-13-6 L 127 (18.4) 179 (26.0) 230 (33.4) 590 (85.5) 71.42 83.46 82.0219588 E-13-7 T 105 (15.2) 177 (25.6) 232 (33.6) 592 (85.8) 67.40 70.89 82.4019591 F-14-6 L 106 (15.4) 160 (23.2) 207 (30.0) 553 (80.2) 62.06 76.65 77.0319592 F-14-7 T 124 (18.0) 153 (22.2) 210 (30.5) 543 (78.8) 46.98 58.63 80.6019595 G-15-6 L 157 (22.7) 208 (30.1) 250 (36.2) 547 (79.3) 39.38 48.68 63.9719596 G-15-7 T 168 (24.3) 203 (29.4) 238 (34.5) 552 (80.1) 38.84 47.31 64.7919599 G-16-6 L 205 (29.7) 256 (37.1) 302 (43.8) 553 (80.2) 49.70 66.42 68.6219600 G-16-7 T 145 (21.1) 202 (29.3) 236 (34.2) 538 (78.0) 33.41 43.03 68.7019603 H-22-22 L 136 (19.7) 187 (27.1) 222 (32.2) 545 (79.0) 56.09 62.21 58.1219604 H-22-23 T 114 (16.5) 185 (26.9) 234 (34.0) 532 (77.2) 34.88 42.33 67.14
Weld metal, 649°C
19589 E-13-15 L 71 (10.3) 88 (12.7) 105 (15.2) 281 (40.7) 26.67 55.68 61.9719590 E-13-16 T 69 (10.0) 92 (13.4) 110 (16.0) 296 (42.9) 23.18 35.01 64.2019593 F-14-15 L 70 (10.2) 86 (12.5) 104 (15.1) 263 (38.2) 24.51 55.41 73.2519594 F-14-16 T 42 (6.1) 77 (11.2) 91 (13.2) 276 (40.0) 21.58 39.24 71.2319597 G-15-15 L 74 (10.8) 113 (16.4) 143 (20.7) 320 (46.4) 22.88 32.81 55.7019598 G-15-16 T 59 (8.6) 96 (13.9) 118 (17.1) 315 (45.7) 22.37 31.43 47.2019601 G-16-15 L 60 (8.7) 102 (14.8) 128 (18.6) 303 (44.0) 27.81 41.70 42.6819602 G-16-16 T 66 (9.5) 94 (13.7) 114 (16.5) 301 (43.6) 19.95 29.84 56.6319605 H-22-31 L 48 (7.0) 82 (11.9) 117 (17.0) 264 (38.3) 24.05 44.33 49.0619606 H-22-32 T 71 (10.3) 92 (13.4) 112 (16.2) 280 (40.6) 18.20 25.65 51.65
lower strain rate (0.002 mm/sec) used in the present investigation as compared withthe strain rate of 0.017mm/sec used for the wrought material.53 The base metal from all five pipes showed isotropic UTS values.The base metal in pipe F-14 was weaker than in other pipes at all test temperatures. The weld UTS valuesfor all five pipes were below the lower bound for the wrought material. Some of the values even fell belowthe ratio method minimum curve (a method used in determining minimum values for ASME code cases).
At room temperature, UTS values for the weld showed more scatter than those for the correspondingbase metal. However, at high temperature, the scatter in the base metal and weld appeared the same. Acomparison of UTS values for the similar welds E-13 and F-14 showed consistently higher values for E-13than for F-14.

100
73
ORNL-DWG 78-118
ROOM TEMPERATURE
E-13
BASE METAL AXIAL
WELD METAL LONGITUDINAL
20 40 60 80 100
ENGINEERING STRAIN (%)
Fig. 55. Comparison of engineering stress-strain curvesk for the base- and weld-metal regions of pipe E-13 of type 316stainless steel.
700
ORNL-DWG 78-117
ROOM TEMPERATURE
F-14
-BASE METAL AXIAL
-WELD METAL LONGITUDINAL
20 40 60 80 100
ENGINEERING STRAIN (%)
Fig. 56. Comparison of engineering stress-strain curves for the base- and weld-metal regions of pipe F-14 of type 316stainless steel.

74
700ORNL-DWG 78-116
600 —— /
//
,,--"""V7 ROOM TEMPERATURE
/ \
a /\-\y42i°c
1 l///\ \
f I-\ ^538°C
'—.
N\
\
- 649 ° C "\
G-15
BASE METAL AXIAL
1 1 1 1 1
400
Oz
DCuj 300
Oz
200
100
20 40 60 80 100
ENGINEERING STRAIN (%l
120
Fig. 57. Comparison of engineering stress-strain curves for the base- and weld-metal regions of pipe G-15 of type 316stainless steel.
700
600
100
ORNL-DWG 78-115
ROOM TEMPERATURE
G-16
BASE METAL AXIAL
WELD METAL LONGITUDINAL
20 40 60 80 100 120
ENGINEERING STRAIN (%)
Fig. 58. Comparison of engineering stress-strain curves for the base- and weld-metal regions of pipe G-16 of type 316stainless steel.

75
ORNL-DWG 78-157
ROOM
TEMPERATURE
WELD METAL LONGITUDINAL
BASE METAL AXIAL
H-22
20 40 60 80 100 120
ENGINEERING STRAIN (%)
Fig. 59. Comparison of engineering stress-strain curvesfor the base- and weld-metal regions of pipe H-22of type 316stainless steel.
Uniform elongation. The base metal of all five pipes showed uniform elongation values close to average
for the wrought material [Fig. 62(a)] . The weld values not only showedlarge scatter in the data, but severalof them fell below the lower bound for the wrought material [Fig. 62(b)]. Some of the values even fell
below the ratio method minimum. The transverse values were generally lower than the longitudinal values.
Total elongation. The base metal of all five pipes showed total elongation values from close to averageto slightly above the upper bound for the wrought material [Fig. 63(a)]. The weld values showed large
scatter [Fig. 63(b)]. Several transverse values fell below the lower bound for the wrought material. Theweld in pipe G-15 (cold wire GTA and SA with type 316 filler metal) gave the most isotropic and highest
values of total elongation.
Reduction of area. The base metal of all five pipes showed reduction of area within the range observed
for the wrought material [Fig. 64(a)]. The circumferential values were generally higher than the axialvalues. The base-metal values from pipes G-15, G-16, and H-22 showed lower reduction-of-area values at
649°C than did the other pipes. The reduction-of-area data for the weldshowedslightly more scatter thandid the base metal. A significant amount of weld values fell below the lower bound for the wrought
material.
7.5 Comparison of Weld Properties with Base-Metal Properties
One of the convenient ways of comparing weld properties with the base-metal properties is to plot one
against the other on a linear scale. The line of slope unity through the origin will represent a weld with thesame properties as those of the base metal. Divergence from this line indicates deviation of these properties

76
XI-
zLU
CCI-(/)
Q
_lLJ
>-
6«cm
E-13 BASE ! ° C.1 • A
F-14 BASE j° ^360
0
G-15 BASE | °^G-16 BASE ^ CAH-22 BASE J*^
280 _JJ
D
UPPER BOUmT~^
200
vRATIO METHOD , ,
120 -
\\MINIMUMt 2 t
— « 4_^
LOWER BOUND^-~-^^
ZLn(a)
1 1 ! I
ORNL-DWG 77-15873R
200 400 600 0 200
TEST TEMPERATURE (°C)
400 600
Fig. 60. Comparison of 0.2% yield strength values of base-and weld-metal regions of five formed and welded pipes oftype 316 stainless steel with upper and lower bound curves for wrought material, (a) Base metal, (b) weld. Minimum valuecurves based on the ratio technique are also included.
800
-- 600
i
h-o
LU
orh-co
lu 400_j
enzLU
H
LU\-< 200
-
*\\UPPER BOUND
svvj_0WER B0UN[
0D^<\RATIO METHMINIMUM
—
E-13 BASE° c. A
#V'
F-14 BASE» C
« A
- G-15 BASEo C
• A
G-16 BASE» C' A
—
H-22 BASE0 C• A
(a)1
ORNL-DWG 77-15871R
~8\
^^- r^— ife~~- • ^
_ E-13 WELD *j V^i1 * 1 i 1F-14 WELD I !ji *
- G-15 WELD I ' VI D T
G-16 WELD ' ^~ H-22 WELD j' \i
(b) \200 400 600 0 200
TEST TEMPERATURE PC)
400 600
Fig. 61. Comparison of ultimate tensile strength values of base- and weld-metal regions of five formed and weldedpipes of type 316 stainless steel with upper and lower bound curves for wrought material, (a) Base metal, (b) weld.Minimum value curves based on the ratio technique are also included.

100
80
E
z
o
77
ORNL-DWG 77-15870R
P 60-j
-
E-13 BASE
F-14 BASE
° c
• A
" C» A
G-15 BASE° C• A
8
A
G-16 BASE
H-22 BASE
' C
' A
0 C
♦ A
• \ UPPER
v BOUND ^>0
f fLOWER
AO
D
nJ—
XBOUND^
RATIO METHODMINIMUM
{a)I
,
!
_ E-13 WELD | *jF-14 WELD j ' jG-15 WELD | " V
I <> T
— G-16 WELD | " T• H-22 WELD j' ^
A\ m. • \\ —•——* >
-» \ A aX '
* 1\
{b) i i i i i i
40tr
oLU
20
200 400 600 0 200
TEST TEMPERATURE PC)
400 600
Fig. 62. Comparison of uniform elongation values of base- and weld-metal regions of five formed and welded pipes oftype 316 stainless steel with upper and lower bound curves for wrought material, (a) Base metal, (b) weld. Minimum valuecurves based on the ratio technique are also included.
100
80
6«
60 -
E-13 BASE ° ^F-14BASE * C.
o ' A
-g. G-15 BASE \",C* .cG-16 BASE , ~
D\ I 0 Cf>\ H-22BASE|,^
•
A
*
s^*
\ UPPER BOUND $A
0
V
-V LOWER BOUND
-RATIO METHOD MINIMUM
(0)
<
zo_l
LU
_l
o
40
20
200 400 600 0 200
TEST TEMPERATURE PC)
ORNL-DWG 77-15872R
400 600
Fig.63. Comparison of total elongationvaluesof base- and weld-metalregionsof five formed and welded pipesof type316 stainless steel with upper and lower bound curves for wrought material, (a) Base metal, (b) weld. Minimum valuecurves based on the ratio technique are also included.

100
80
<
<
o
o
i-o3Q
60
40
20
78
A ^"**---^.^UPPER BOUND
1T
A
Do •
»
•A
1 .
V
,•— T
LOWER BOUND
-
E-13 BASE I ° C.I • A
♦
- F-14 BASE *^
-
G-15 BASE JI ^G-16 BASE I ^
- H-22 BASE jI £(a)
1 1 1 1
ORNL-DWG 77-15874R
-
A
8
>o
f
A
8 >
— ♦A 00
♦ ♦
E- 13 WELD• L
° T
i L
0
-
1-
G
G
-14 WELD
-15 WELD
-16 WELD
a T
• L
° T
' L
' T
-
H -22 WELD♦ L
0 T
(b)I 1 I 1
200 400 600 0 200
TEST TEMPERATURE PC)
400 600
Fig. 64. Comparison of reduction-of-area values of base- and weld-metal regions of five formed and welded pipes oftype 316 stainless steel with upper and lower bound curves for wrought material, (a) Base metal, (b) weld.
from the ideal behavior (equal property behavior). Figures 65 through 69 show the plots of weld yield,
ultimate tensile strength, and uniform elongation vs the corresponding base-metal properties. These plots
include data for both the as-received and reannealed conditions. The following observations can be made
about the properties of the weld in each pipe.
E-13 (GTA with hot- and cold-wire additions of type 16-8-2). The C + N contents of the base metaland weld of this pipe were 0.105 and 0.094% respectively. The weld had a ferrite number of 0.1 to 0.4.
Figure 65(a), (b), and (c) shows that GTA weld E-13 is characterized by the following properties:
1. Weld yield strength is higher than that of the base metal.
2. Weld ultimate tensile strength is lower than that of the base metal.
3. Weld uniform elongation is lower than that of the base metal.
4. Reannealing for 0.5 hr at 1065°C makes the yield strength of the base metal and the weld comparable.
5. Reannealing treatment has only a small effect on the ultimate tensile strength of the base metal and theweld.
F-14 (GTA with cold-wire addition of type 16-8-2). The C + N contents of the base metal and weld of
this pipe were 0.104 and 0.063%respectively. This weld had an FN of 0.6 to 4.8 as comparedwith only 0.1
to 0.4 for the weld in E-13. Figure 66(a), (b), and (c) shows that GTA weld F-14 is characterized by thefollowing properties:
1. Weld yield strength at room temperature is essentially the same as that of the base metal. At higher testtemperature, the weld yield strength was higher than that of the base metal.

79
ORNL-DWG 78-11343
320 -
1 1 1 1 1 /
/ ~
280 •/ "240
/
200
A
/
1608
/
/LINE OF EQUAL YIELD STRENGTH
120
/
t
/
1
Iff)
III!
— t- 500 —
1 1 I 1 '/— J -
//
/ »o
/ ••/
— /» °/ Aa
/LINE OF EQUAL STRENGTH
/ 1 1 1 1(«)
120 160 200 240 280 320
BASE METAL YIELD STRENGTH (MPa)
20 30 40 50 60 70
BASE METAL UNIFORM ELONGATION (%)
Ul2 200
100 200 300 400 500 600
BASE METAL ULTIMATE TENSILE STRENGTH (MPa)
PIPE: E-13
WELDING PROCESS:GTA
FILLER METAL: 16-8-2
HEAT-TREATMENT: 1065"C/0.5hr
SYMBOLS : o CIRCUMFERENTIAL OR TRANSVERSE
a AXIAL OR LONGITUDINAL
OPEN SYMBOLS-AS-RECEIVED
CLOSED SYMBOLS-REANNEALED
Fig. 65. Plot of weld tensile properties as a function of base-metal properties for pipe E-13 of the type 316 stainlesssteel; (a) yield strength, (b) ultimate tensile strength, (c) uniform elongation. These data are for tests in the temperaturerange room temperature to 649°C.
2. Weld ultimate tensile strength is lower than that of the base metal at all test temperatures.
3. Weld uniform elongation is significantly lower than that of the base metal. The transverse weld speci
mens showed more deviation from line of equal elongation than did the longitudinal specimens.
4. Reannealing made the weld yield strength equal to or slightly below the base-metal yield strength.
5. Reannealing has only a small effect on the ultimate tensile strength of the base metal and the weld.
G-15 (cold wire GTA and SA with type 316 stainless steel). The C + N contents of the base metal and
weld of this pipe were 0.138 and 0.110% respectively. The weld had an FN of zero. Figure 67(a), (b) and
(c) shows that this weld is characterized by the following properties:
1. The longitudinal weld yield strength is higher than that of the base metal at all four test temperatures.
However, the transverse weld yield strength is the same as the base-metal yield strength at all test
temperatures.

:320 -
1 i i i
/
./
/ -
- A -
/
4_
AA
/LINE OF EQUAL YIELD/ STRENGTH
CO 7/
(o)
/• i \ i 1 1 1
^200
<t-UJ
2 160
o
_*UJ
80
3 70 -
0 120 160 200 240 280 320 3
BASE METAL YIELD STRENGTH (MPa)
-
1 1 1 1 1 I /
/ A
-
/line of equal/ elongation —
s °
/ * °— / a •
' o a te)
1 1 1 1 1 1
* 20 —
20 30 40 50 60 70
BASE METAL UNIFORM ELONGATION (?.)
80
ORNL-^DWG 78—11344
2 600
i i 1 1
XHOzu
a: 500H(/)
-
/
UJ_J
(/>
g400 /;-t- /UJ
<
p 300
3
/
/8>-
-I
< /LINE OF EQUAL STRENGTH
w 200
a_iUJ
_ /
// i 1 1 1
It)
1
100 200 300 400 500
BASE METAL ULTIMATE TENSILE STRENGTH
600
(MPa)
PIPE: F-14
WELDING PROCESS: GTA
FILLER METAL: 16-8-2
HEAT-TREATMENT: 1066°C/0 2hr
SYMBOLS : o CIRCUMFERENTIAL OR TRANSVERSE
a AXIAL OR LONGITUDINAL
OPEN SYMBOLS-AS-RECEIVED
CLOSED SYMBOLS-REANNEALEO
Fig. 66. Plot of weld tensile properties as a function of base-metal properties for pipe F-14 of type 316 stainless steel;(a) yield strength, (ft) ultimate tensile strength, (c) uniform elongation. These data are for tests in the temperature rangeroom temperature to 649°C.
2. Weld ultimate tensile strength (for both longitudinal and transverse specimens) is significantly lower
than the base-metal ultimate tensile strength at all test temperatures. The longitudinal weld specimens
appear to show slightly higher ultimate tensile strength as compared with transverse weld specimens.
3. Weld uniform elongation is 5 to 6% lower than that of the base metal at higher temperatures. At room
temperature, the weld-metal uniform elongation is 15 to 20% lower than that of the base metal.
4. Reannealing made the weld yield strength equal to or slightly below the base-metal yield strength.
5. Reannealing has only a small effect on the ultimate tensile strength and uniform elongation of the basemetal and the weld.

81
320
I l I I I I
A J-
280 / -
240
//•
200 /line OF EQUAL YIELO
/ STRENGTHA AO /
160
>y/120
//•
I I I I I I
<<7)
£zo
80 280 320 360
BASE METAL YIELD STRENGTH (MPa)
70
! 1 ! 1 1 /
60 -
50 -
40
*A
A
0
•—
30
"
S °A
20o
1 1 1 1
(c)
1
20 30 40 50 60 70 80
BASE METAL UNIFORM ELONGATION (%)
ORNL-DWG 78-11345
600
/X
to
500/
/ A 0
/ o400 /
—
300
/LINE OF equal strength
-
200
- // I I I
(A)
100 200 300 400 500 600
BASE METAL ULTIMATE TENSILE STRENGTH
PIPE : G-15
WELDING PROCESS: GTA
FILLER METAL: 316
HEAT-TREATMENT: 1093"C/0.5hr
SYMBOLS : o CIRCUMFERENTIAL OR TRANSVERSE
a AXIAL OR LONGITUDINAL
OPEN SYMBOLS-AS-RECEIVED
CLOSED SYMBOLS-REANNEALED
Fig. 67. Plot of weld tensile properties as a function of base-metal properties for pipe G-15 of type 316 stainless steel;(a) yield strength, (ft) ultimate tensile strength, (c) uniform elongation. These data are for tests in the temperature rangeroom temperature to 649°C.
G-16 (autogenous GTA). The C + N contents of the base metal and weld of this pipe were 0.147 and
0.117% respectively. The weld had an FN of zero. Figure 68(a), (b) and (c) shows that this weld has the
following properties:
1. The weld yield strength for this pipe is the same as the base-metal yield strength.
2. Weld ultimate tensile strength is lower than that of the base metal at all four test temperatures.
3. Weld uniform elongation for transverse specimens is significantly lower than that of the base metal. The
longitudinal weld uniform elongation is also lower than that of the base metal, but to a much lesser
extent.
4. Reannealing has only a small effect on yield, ultimate tensile strength, and uniform elongation.

82
360
_320
a.
2
*280
-
1 iii i i /
/ ~/
/
/'/
/LINE OF EQUAL YIELD STRENGTH
y/<£>
* ?
/(a)
1 1 1 1 1
200 -
120
80
80 120 160
BASE M
200 240 280 320
ETAL YIELD STRENGTH (MPa)
80
_ 70
zo
60
'50
I I I I I I /
-
/line of equal-/ elongation
A —
A
' A •
0o
0
/ I I I I
(C)
I I
20 -
20 30 40 50 60 70
BASE METAL UNIFORM ELONGATION (%)
80
0RNL-DW6 78-11S46
o
a.
2 600 _
i i 1 1
V-XHO
z/
/
/
A
<r 500 / O _
UJ_1
tn
S 400 / * °/ °
-
ULTIMATEO
o
z ^ A0
-
-J /LINE OF EQUAL STRENGTH
UJ
2 200 / -
Q_lUJ
inn
/
V 1 1 1 1 1
100 200 300 400 500 600
BASE METAL ULTIMATE TENSILE STRENGTH (MPa)
PIPE: G-16
WELDING PROCESS: GTA
FILLER METAL: NONE
HEAT - TREATMENT : 1038 - 1066°C /0 5 hr
SYMBOLS : o CIRCUMFERENTIAL OR TRANSVERSE
A AXIAL OR LONGITUDINAL
OPEN SYMBOLS-AS-RECEIVED
CLOSED SYMBOLS-REANNEALED
Fig. 68. Plot of weld tensile properties as a function of base-metal properties for pipe G-16 of type 316 stainlesssteel;(a) yield strength, (ft) ultimate tensile strength, (c) uniform elongation. These data are for tests in the temperature rangeroom temperature to 649° C.
H-22 (SA with type 16-8-2 filler metal). The C + N contents of the base metal and weld of this pipewere 0.133 and 0.099% respectively. The weld had an FN of zero. Figure 69(a), (b), and (c) shows that this
weld metal has the following properties:
1. This is the only weld (among the five studied) whose yield strength is lower than that of the base metal.
2. The weld ultimate tensile strength is significantly less than that of the base metal.
3. The elevated-temperature uniform elongation of the weld is lower than that of the base metal. At room
temperature they appear to be the same.
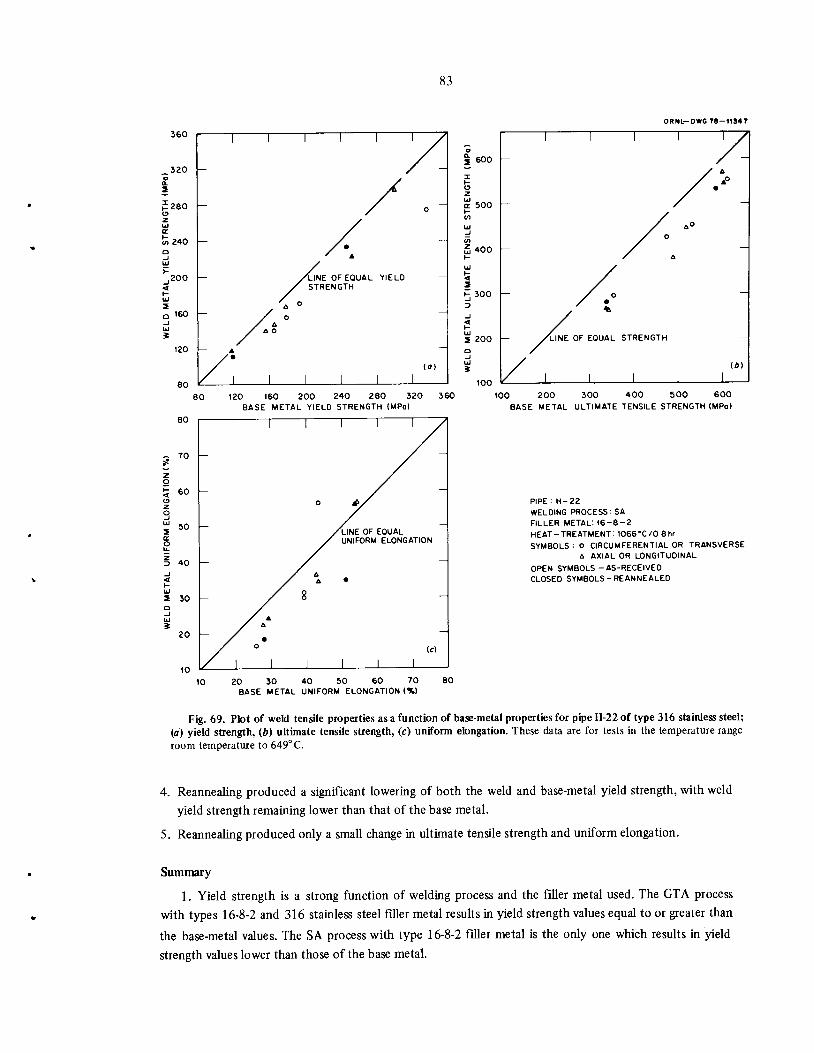
83
360
320
:280 —
a:
Si 240
,200<t-UJ
2
160
120
80
LINE OF EQUAL YIELDSTRENGTH
<»)
80 120 160 200 240 280 320
SE METAL YIELO STRENGTH (MPa)
360
BA
80
- 70 --
I I I I I I /
-
o */
/line of equaluniform elongation
• A/ A •
—
/ A
8 —
/ A
' •O
I I I
(c)
I I I
60 —
50 —
30 —
20 —
10
10 20 30 40 50 60 70BASE METAL UNIFORM ELONGATION (%)
80
ORNL-DWG 78-11S47
600
I I I I
/ AA°
•
500
/ °400
/ A
300 / o/ •
. 4i
-
200
/
/LINE OF EQUAL STRENGTH
I I I I
(A)
I
100 200 300 400 500
BASE METAL ULTIMATE TENSILE STRENGTH
600
(MPa)
PIPE : H-22
WELDING PROCESS: SA
FILLER METAL: 16-8-2
HEAT-TREATMENT: 1066"C/08hr
SYMBOLS : o CIRCUMFERENTIAL OR TRANSVERSEA AXIAL OR LONGITUDINAL
OPEN SYMBOLS-AS-RECEIVED
CLOSED SYMBOLS-REANNEALEO
Fig. 69. Plot of weld tensile properties as a function of base-metal propertiesfor pipe H-22of type 316 stainless steel;(a) yield strength, (ft) ultimate tensile strength, (c) uniform elongation. These data are for tests in the temperaturerangeroom temperature to 649° C.
4. Reannealing produced a significant lowering of both the weld and base-metal yield strength, with weldyield strength remaining lower than that of the base metal.
5. Reannealing produced only a small change in ultimate tensilestrength and uniform elongation.
Summary
1. Yield strength is a strong function of welding process and the filler metal used. The GTA processwith types 16-8-2 and 316 stainless steel filler metal results in yield strength values equal to or greater than
the base-metal values. The SA processwith type 16-8-2 filler metal is the only one which results in yield
strength values lower than those of the base metal.

84
2. Ultimate tensile strength of the weld is always lower than that of the base metal. The extent of
lowering is influenced by the welding process and the filler metal. Once again, the SA process produces thegreatest difference between the base-metal values and weld values.
3. The uniform elongation (one measure of ductility) is generally lower for the weld as compared withthe base metal. Among the two weld orientations studied, transverse specimens generally produced lowervalues than did the longitudinal specimens.
7.6 Comparison between GTA (E-13) and SA (H-22) Welded Pipes
The welds in pipes E-13 and H-22 were deposited using type 16-8-2 filler metal with resultant C + Nlevels of 0.094 and 0.099% respectively. The weld in pipe E-13 had an FN of 0.1 to 0.4, while the weld inpipe H-22 had an FN of zero. These welds therefore provide a reasonable database for comparing the GTAand SA processes. However, it must be noted that the comparison isonlyvalid for the specific parametersused to make each weld. In order to compare these processes, we have plotted SA properties (H-22) as afunction of GTA properties (E-13) in Fig. 70.The following comments can be made from this figure.
H-22
1 1VERSUS E-13
I
'/320
(SA) (GTA)
0 LONGITUDINAL/_
a TRANSVERSE° s
280
/LINE OF EQUAL240
•
YIELD —
STRENGTH
200—
160/" o
/ o
s °
120
I I i
(<7)
I I
GTA WELD METAL (E-13) YIELD STRENGTH (MPo)
T
10 20 30 40 50 60 70 80
GTA WELO METAL (E-13) UNIFORM ELONGATION (%)
ORNL-DWG 7B-H34S
100 200 300 400 500 600
GTA WELD METAL (E-13) ULTIMATE TENSILE STRENGTH (MPo)
Fig. 70. Plot of SA weld tensile properties for pipes H-22 and E-13 of type 316 stainless steel; (a) yield strength, (6)ultimate tensile strength, (c) uniform elongation. These data are for tests in the temperature range room temperature to649° C.

85
1. SA yield strength values are lower than GTA values at elevated temperatures. At room temperature they
appear to be the same. The reannealed values for the two welds were the same at both room and high
temperature.
2. The ultimate tensile strength of the SA weld is lower than that of the GTA weld at all test temperatures.
Reannealed values maintained the same trend.
3. The uniform elongation (UE) of the SA weld is lower than that of the GTA weld, except at the testing
temperatures of 538 and 427°C, where the situation is reversed. Reannealing did not affect elevated-temperature UE, while room-temperature values appeared to change significantly.
From what has been presented in Figs. 65 through 70 we can state that for the SA welded pipe, both
plastic flow and failure will be controlled by the weld as compared with the GTA welded pipes, where the
flow will be controlled by the base metal and the failure by the weld metal. The control of failure by the
weld will become obvious from the photographs of tensile-tested specimens to be shown in a later section.
7.7 Estimate of Residual Cold Work in the Base Metal and Weld
As previously discussed, formed and welded pipes will typically have some level of residual cold work
due to straightening. To estimate the amount of residual cold work in the pipes, we have plotted the 0.2%
yield strength of the as-received material (Table 19) as a function of its valuesin the reannealed condition.These values are plotted in Fig. 71 for tensile tests performed at room temperature and649°C. The linearbounds for these values are indicated by lines on Fig. 71. This figure indicates that as-received yield strength
of both the base metal and weld can be linearly related to the reannealed yield strength. The following
expression can be used to describe the linear relationship which is representedby the linear bound lines on
Fig. 71:
SyAR =A+BSyRA ,
400
350
5 300 -
u 250a.
-i 200 —
150
I 100
BASE METALo CIRCUMFERENTIAL
A AXIAL
50 100 150 200 250 300
REANNEALED YIELD STRENGTH (MPo)
350
350 —
| 300
|200
150
100
(1)
ORNL-DWG 78-11S49
WELD METAL
o LONGITUDINAL
A TRANSVERSE
RESIDUAL STRESS RANGE
— 6—68 MPa
(0.9-9.9 Ksi)
50 100 150 200 250 300
REANNEALED YIELD STRENGTH (MPa)
Fig. 71. Plot of as-received yield strength as a function of reannealed yield strength for five pipes;(a) base-metal, (ft)weld. These data are at room temperature and 649° C. Lines represent linear bounds for the data.

86
where
SyAR = 0.2% yield strengthin the as-received condition,
SyRA = 0.2% yield strengthin the reannealed (laboratory-annealed) condition,
A, B = constants.
Previouswork37 has shown that ^4 and B can be expressed as
A=S0AR -S0RA yJdRAldAR , (2)
B=JdRAldAR , (3)
where
dAR = as-received grain size,
dRA = reannealed grain size,
S0AR = frictional stress in the as-received condition,
S0RA = frictional stress in the reannealed condition when grain size remains unaltered or for reannealing,
A=SAR -S0RA , (4)
B=l. (5)
The constant A in Eq. (4) is the difference in frictional stresses opposing the dislocation movement in the
as-received and reannealed condition and is therefore indicative of the residual stress. Since the constant A
in Eq. (1) represents the intersection with the ordinate, residual stress values can be obtained from Fig. 71
from the intersection of the linear bound lines with the ordinate. The value of residual stress for the base
metal of the five pipes is in the range of 5 to 58 MPa (0.7 to 8.4 ksi) [Fig. 71(a)], while for the weld it
varies from 6 to 68 MPa (0.9 to 9.9 ksi) [Fig. 71(6)]. Figure 71(a) and (b) suggests that in general the
residual cold work is slightly more in the weld than in the base metal of the formed and welded pipe.
However, the base-metal specimens are not necessarily representative of all base-metal regions. Our previous
work38 on 711 X 10 mm type 316 stainless steel hot extruded and worked pipe gave a residual stress valueof 8 MPa (1.2 ksi). Thus it appears that the formed and welded pipe contains more residual stress in the
as-received condition than was observed in the hot extruded and worked pipe.
The yield strength relationship of Eq. (1) with constants given by Eqs. (4) and (5) is extended to the
UTS data in Fig. 72(a) and (b). This figure showsa decrease of 0.28 MPa (0.4 ksi) in UTS of the base metal
and 6 to 43 MPa (0.7 to 6.2 ksi) for the weld. These changesin UTSare relatively small as compared withthe decreases in yield strength [Fig. 71(a) and (b)].
Previously published work39-41 has shown that the elevated-temperature UTS at the creep test temperature is a pretty good index for estimating creep and creep-rupture behavior of wrought austenitic
stainless steels. This result when extended to the welds in the formed and welded pipe yields the following
observations:
1. The consistently lower ultimate tensile strength of the weld as compared with the base metal may
produce lower creep rupture life for the weld as compared with the base metal.

87
800
1 700
! 600 —
,500 —
1-400 —
J, 1°°
'/
BASE METAL
0 CIRCUMFERENTIAL
A AXIAL
, , CHANGE IN ULTIMATE TENSILE,/ STRENGTH ON REANNEALING
— 0-28 MPa(0-4 ksi)
Iff)
0 100 200 300 400 500 600 700
REANNEALED ULTIMATE TENSILE STRENGTH (MPa)
800
700
, 500
<2
h300
ORNL-DWG 78-11350
WELD METALo LONGITUDINAL
A TRANSVERSE
//£
CHANGE IN ULTIMATE TENSILESTRENGTH ON REANNEALING-0-43 MPo
(0.9—6.2 ksi)
(A)
100 200 300 400 500 600 700
REANNEALED ULTIMATE TENSILE STRENGTH (MPa)
Fig. 72. Plot of as-received ultimate tensile strength as a function of reannealed ultimate tensile strength for five pipes;(a) base-metal, (ft) weld. These data are at room temperature and 649"C.
2. Of the welding processes investigated, the SA weld may produce the lowest creep-rupture properties.The GTA process is expected to yield better properties.
3. The decrease in ultimate tensile strength on reannealing is expected to produce small decreases in thecreep-rupture properties of both the base metal and weld.
Based on tensile and creep correlation, it appears that creep failure of the formed and welded pipe willalso be controlled by the weld. This point willbe illustrated by photographsof creep-rupture specimens inanother report.42
7.8 Role of Carbon and Nitrogen on Tensile Properties
Carbon and nitrogen are the two elements recognized43-45 in controlling the yield and UTS ofaustenitic stainless steels. Because of the wide range of C + N values that can be obtained from current
commercial specifications, these elements play an important role in heat-to-heat variation in mechanical
properties. It is the purpose of this section to demonstrate this variation and to compare the data from the
five pipes against the currently available relationships between strength and C + N levels. One set of suchcorrelations was developed by Sooand Horton45 and isgiven by the following equations:
Yield strength (SyAR), ksi
SyAR =88.474 +211.640 (C +N) - 0.2067/(C +N) - 6.7627/1/2 +0.1117/ ;
standard deviation = 2.806 ksi
[valuefor297<7/<977K(75-1300°F)] ,
where
(C + N) is in wt % ,
T is test temperature in K.
(6)

Ultimate tensile strength (Sw4^), ksi
SuAR =8.563-461.665 (C +N) +1064.1 547/"1/2 +2.7227(C +N) -2.330 X10~37/2 (C +N) , (7)
standard deviation = 6.458 ksi
[value for 297 < T < 977 K (75-1300°F)] .
The superscript AR in Eqs. (6) and (7) indicates that these correlations were developed for data onmaterial in the as-received condition.
The above equations are valid for C + N < 0.10 wt %, but the authors45 suggest that at roomtemperature, 593, and 704°C, the range of validity may be increased to 0.167, 0.141, and 0.141 respectively. These equations were derived from base-metaldata and thus may not be applicable to welds.
Base-metal comparisons. The comparison of experimental yield strength data on the base metal of thefive pipes with the predicted values from Eq. (6) is shown in Fig.73. Parts (a) and (b) show comparisons atroom temperature for data in as-received and reannealed conditions respectively. Parts (c) and (d) showsimilar comparisons for data at 649°C. The corresponding comparisons for UTS data are shown in Fig. 74.
150 —
50 —
250
S 506
o L-
T T~ T"
ROOM TEMPERATURE
AS-RECEIVED BASE METAL
o CIRCUMFERENTIAL
A AXIAL
(o>
J I i I i L0.08 0.12
C + N («1%)
~~> i i r
AS-RECEIVED
649'C
0.04 0.08 0.12
C + N (wl?.)
Q16
ORNL-DWG 78-H351
400I I I I I 1 1 1
ROOM TEMPERATURE
350-
REANNEALED-
300 - ^^ -
250-
&*S8 "
200—
150-
100-
50
I I I I I
(/>i
1 i 1
S 50d
0.08 0.12
C+N (wt%)
-
1 1 1
REANNEALED
649'C
[ 1
-
- £%. ^"^
-
1 1 1 i i I i
(</i
l
0.04 0.08 0.12
C+N (wT%)
0.16
Fig. 73. Plot of yield strength as a function of the C + N content for the base metal of the five pipes. At roomtemperature; (a) as-received condition, (ft) reannealed condition. At 649°C; (c) as-received condition, (d) reannealedcondition. The solid line is predicted by ref. 45.

89
At room temperature, both the as-received and reannealed data showed the trend of increasing yieldstrength with increasing C + N [Fig. 73(a) + (b)]. However, the as-received data showed significantly morescatter than did the reannealed data. The greater scatter in as-received data is probably a consequence ofvarying degrees of residual cold work from straightening operations performed on these pipes (see theprevious section for more details). When the residual cold work is removed by reannealing, the trend ofincreasing yield strength with C + N becomes more consistent with the slope of the predicted line [Fig.73(b)]. Note, however, that the reannealed values are significantly below the predicted line, because thelatter was derived from the data in the as-received condition.
The yield strength data at 649°C again shows more scatter in the as-received as compared with thereannealed condition [Fig. 73(c) + (d)]. Boththe. predicted and experimental values show that C + Ndependence of yield strength is much less at 649°C than observed at room temperature. The reannealedvalues are again below the predictedline [Fig. 73(d)] but have a similar slope.
Figure 74 shows that the observed UTS dependence on C+Nis generally less than the predicted line atroom temperature and at 649°C. The values for as-received and reannealed specimens are comparable atboth test temperatures. The data follow the trend of increasing UTS with increasing C+ N.
Weld comparisons. Figure 75(a) and (b) shows that at room temperature both as-received and reannealed yield strength for the weld increases with increasing C + N content. The as-received data againshow more scatter than the reannealed data. Furthermore, the as-received data tend to fall above and the
_l 600
=i 500
400
J - 350
UJ *
< Z
IS
200
1 1 1 1 1
ROOM TEMPERATURE
i i 1
BASE METAL AS-RECEIVED
o CIRCUMFERENTIAL-
A AXIAL
—
jSa—
^/v
S^ oA 8
-
- ^y -
1 1
(o)
0.08 0.12
C+N (wl%)
0.16
-
I I I I I
J__---"—• o
I
o
A
oA
I
-
BASE METAL AS-RECEIVED649 *C
I I I I I I I
(e)
I
0.04 0.08 0.12
c+n (wtr.)
0.16
ORNL-DWG 78-11392
1 1 1 | 1 1 1 1
_ ROOM TEMPERATURE
I700BASE METAL REANNEALED _
X1-o
2650
y*UJ
-J 600tnzuj
I-
' A 60
u 550
<2
^500
1 1 1 1 1 1 1 1
(Zip
2iUi£l-
ujf 300>S<z2uso:
^<"250
0.08 0.12
C+N (wt%)
0.16
I I I I I
A
I I
OA
I
•«=—' *-
BASE METAL REANNEALED649 *C
I I I I I I I
(<?)
I
0.08 0.12
C+N (wt %)
Fig. 74. Plot of ultimate tensile strength asa function of the C + N content for the base metal of the five pipes. Atroom temperature; (a) as-received condition, (ft) reannealed condition. At 649°C; (c)as-received condition, (d) reannealedcondition. The solid line is predicted by ref. 45.

400
350
2
F 250
ROOM TEMPERATURE
AS-RECEIVED
WELD METAL
o LONGITUDINAL
A TRANSVERSE
100 —
50 —
J L0.04 0.08 0.12
C+N <«!%)
(o)
I I I
AS-RECEIVED
I I | I I
—
649-C-
-
A
0
o
a6
0
A -
-
I I I I I I I I
100 —
50
0.04 0.08 0.12
C+N (wt 1.)
90
ORNL-DWG 78-11353
350 —
1 I 1 1
ROOM TEMPERATURE'
1 !
—
REANNEALED
WELD METAL -
—
o ^
eeA
A
-
^*~
-
-
-
-
-
1 1 1 1 i 1 i l
2
I 250
l- 200 —
100
50 —
0.04
0.08 0.12
C + N (wt%)
0.08 0.12
C+N (wl%)
Fig. 75. Plot of yield strength asa function of C+N content for the weld of the five pipes. At room temperature; (a)as-received condition, (ft) reannealed condition. At 649°C; (c) as-received condition, (d) reannealed condition. The solidline is predicted by ref. 45.
reannealed data below the predicted line. The reannealed data in Fig. 75(6) show that the predicted line[Eq. (6)], which uses entirely base-metal data, predicts a correct slope for the yield strength dependence onC + N of the weld.
The observations made for room-temperature data [Fig. 75(a) and (b)] are also true for data at 649°C[Fig. 75(c) and (d). Note again that the yield strength dependence on C + N is relatively much weaker at649°C than at room temperature.
Figure 76(a) and (b) shows that at room temperature the experimental data on UTS experience adramatic deviation in slope from the predicted line. The as-received data [Fig. 76(a) show an increase inUTS up to 0.095% C + N followed by a rapid drop in value at higher values of C + N. The reannealed data[Fig. 76(6)] also increase to 0.095% C + N and then drop. However, the values do not continue to decreaseas did the as-received values. The reasons* for the behavior of the as-received and reannealed data are notclear at present.
"Probably results from the anisotropy of the weld and the influence of martensite formation after a certain C + N level.

91
en
ZUJh-
m 500
2
^ 450
400
1 I l T"ROOM TEMPERATURE
WELD METAL
AS-RECEIVED
0.08 0.12
C + N (wt%l
\n 350 -
-
1 1 1
AS-RECEIVED
649 "C
1 1 1 1
A
O
AA
O
O
8OA
-
1 1 1 1 1 1 i
(C)
1
300
0.08 0.12
C + N (wl%)
0.16
2 650
xHO
56ooa:
10
u
J 550CrtzUit-
uj 500
<
2
3 450
400
ORNL-DWG 78-11354
1 1 1 1
ROOM TEMPERATURE
1 1 1
WELD METAL
REANNEALED
- ^^A O
A
8°A
-
——
1 1 1 1 I 1 i
(Z»
10.04 0.08 0.12
C+N (wt%)
1 1 I 1a.
2
H 400 _ REANNEALED649 °C
zUJ
a:
to 350—
ui
8
£ 300 A 8 —
t-
u A0 A
< O O
2 250 —
_j id)3
1 1 1 1 1 l 1
0.04 0.08 0.12
C + N (wl%)
Fig. 76. Plot of ultimate tensile strength as a function of C + N content for the weld of the five pipes. At roomtemperature; (a) as-received condition, (ft) reannealed condition. At 649°C; (c) as-received condition, (d) reannealedcondition. The solid line is predicted by ref. 45.
At 649°C, the trend of increasing UTS with C + N content is again apparent. However, the experimentaluse of base-metal data. It is interesting to note that the two pipes with the highest C + N (G-15 and G-16)and UTS have stress-rupture lives (tests still in progress) that are currently as much as five times greater than
for tests completed on the other pipes.
In summary, Figs. 73 through 76 have shown that the observed variations in the yield and UTS of the
base metal and weld (except the room-temperature UTS of the welds) are related to the variation in C + N
content. It therefore appears that these elements should be controlled within specific ranges to ensure that
minimum property requirements can be obtained. The effect of C + N variation on the UTS is considered to
bemore important because of its relationship39-41 with creep and creep-rupture behavior.
7.9 Stress-Strain Behavior (up to 5% Strain)
The monotonic stress-strain behavior (up to 5% strain) of austenitic stainless steel can be described by
JPL
Cpe„
1+Pe„ p(8)

92
where
C = measure of strength level and, as shown later, is related to yield strength,
H = steady-state hardening rate (doled),
P = parameter describing the shape of the stress-strain curve before reaching the steady-state harden
ing,
aPL = ProPortionallimit of stressbelow which there is no plastic strain,
ep = true plastic strain.
The value aPL was estimated to be 0.50^, where 0.5a,, is the 0.2% offset yield strength. The constant His 2758 MPa, while P is given by 500C. The value of Cis determined by the criterion that a = ay for ep =0.002. Since a knowledge of stress and Young's modulus yields the magnitude of the elastic strain, Eq. (8)
can be used to calculate the total strain corresponding to a given stress by only knowing the yield strength
of the material at a given temperature. The analysis of stress-strain behavior is fully described elsewhere.46
Sikka and Booker47 and Hammond and Sikka48 have found excellent agreement between experimentalstress-strain curves and those predicted by Eq. (8) for several heats of types 304 and 316 stainless steel.
The purpose of this section is to check whether Eq. (8) can predict the stress-strain behavior of the base
metal and weld for the pipes tested. Figures 77 through 81 show the comparisons between the predicted
and observed stress-strain curves for the base metal of the five pipes. These comparisons are made for axial
specimens and at test temperatures of room temperature, 427, 538, and 649°C. These figures show that themodel, Eq. (8), accurately predicts the experimental behavior of the base metal at all test temperatures.
Two of the tests for pipe G-l 5, one at room temperature and one at 649°C, are predicted with less accuracy
than are the rest of the 18 tests. Thus it can be concluded that Eq. (8) is applicable in predicting thestress-strain behavior (up to 5%) of the base metal of large-diameter formed and welded pipes.
Figures 82 through 86 compare the predicted stress-strain curves with the experimental curves for
longitudinal weld specimens from the five pipes. Once again these comparisons are for test temperatures of
room temperature, 427, 538, and 649°C. The model, Eq. (8), appears to predict longitudinal weld stress-strain behavior less accurately than it does for axial base-metal behavior. In general, the observed steady-
state hardening rate (H = dajde) is less than predicted from Eq. (8). The difference in steady-state harden
ing rate appears to be the greatest for the autogenous weld (G-16) and the SA weld with type 16-8-2 filler
metal (H-22). It therefore appears that the stress-strain model developed from base-metal data can be used
to accurately predict weld behavior by modifying the steady-state hardening parameter, H. For example,
the change of H from 2758 MPa for the base metal to 2200 MPa will predict the stress-strain curves more
accurately for the welds from pipes G-16 and H-22.
It can be concluded that a model of the type given in Eq. (8) is capable of describing the general shape
of the stress-strain curve (up to 5%) for both the base metal and weld from formed and welded pipes.
However, for accurate prediction of weld stress-strain behavior, a modified hardening parameter, H, may
need to be used.
7.10 Photographs of Tensile-Tested Specimens
Photographs of the tensile-tested specimens from the base metal and weld of each pipe are shown in
Figs. 87 through 91. These figures show that the longitudinal weld specimens generally experienced uni
form straining, as did the base metal. However, because the transverse weld specimens are composites of the
weld, HAZ, and the base metal, the straining was concentrated in the weaker weld metal. These figures
show that the tensile failure occurs in the weld of each of the transverse specimens as postulated in one of
the previous sections of this report. In summary, the photographs of tensile-tested specimens have shown
that in the formed and welded pipe, the weld is the weakest link in transverse specimens.

500
400
300 —
200
100
280 —
240
200
160
120 -,
a
a.
0
2 280
COtoUJcrH
240
LU
3cr 200
ORNL-DWG 78-18977
538°C
0.005 0.010 0.015 0.020 0.025 0.030 0.035 0.040 0.045 0.050
TOTAL TRUE STRAIN
Fig. 77. Comparison of experimental vs predicted stress-strain curves for axial base-metal specimens from pipe E-l 3.The dashed line represents the experimental data; the solid line represents the predicted behavior, (a) Room temperature,(b) 427°C, (c) 538°C, (d) 649°C.

D
5
500
400 —
300
220
200
180 —
160
140 —
ORNL DWG 78-18973
ROOM TEMPERATURE
I- 120 —CO
LU
538°C S?—
AS— AS
ASAA
—
—
«> I I I I I I I I I
100 -,
80 --
60 -
40
20
0.005 0.010 0.015 0.020 0.025 0.030 0.035 0.040 0.045 0.050
TOTAL TRUE STRAIN
Fig. 78. Comparison of experimental vs predicted stress-strain curves for axial base-metal specimens from pipe F-14.The dashed line represents the experimental data; the solid line represents the predicted behavior, (a) Room temperature,(b) 427°C, (c) 538°C, (d) 649°C.

o
Q.
COCOLUcr\-co
LU
cri-
500
400
300
200
100
0
320
ORNL-DWG 78-18978
(a)
IROOM TEMPERATURE
——
—
BASE
I I I
METAL (G-15)
nnrni PTm
I
— EXPERIMENTAL
427°C
200 —
0.005 0.010 0.015 0.020 0.025 0.030 0.035 0.040 0.045 0.050
TOTAL TRUE STRAIN
Fig. 79. Comparison of experimentalvs predicted stress-strain curves for axial base-metal specimens from pipeG-15.The dashed line represents the experimental data; the solid line represents the predicted behavior, (a) Room temperature,(b) 427°C, (c) 538°C, (d) 649°C.

DQ.
COCOLUcr(-CO
LU
cr
ORNL-DWG 78-18980
400
300
200
0.005 0.010 0.015 0.020 0.025 0.030 0.035 0.040 0.045 0.050
TOTAL TRUE STRAIN
Fig. 80. Comparison of experimental vs predicted stress-strain curves for axial base-metal specimens from pipeG-16.The dashed line represents the experimental data; the solid line represents the predicted behavior, (a) Room temperature,(b) 427°C, (c) 538°C, (d) 649°C.
SO

ORNL-DWG 78-1898Z
500
400
300 —
—
IROOM
I ITEMPERATURE '
I I'
1
- -z^"^^E
—
_ „^— "M^^-^^^^*
—
—/ BASE METAL (H-22) —
1 KLUIL I LU
— EXPERIMENTAL —
'(«) I I I | 1 1 | 1
200 —i
100 -j
0o
a.320
"
toCOLU 280rrHCO
LU3 240orH-
0.005 0.010 0.015 0.020 0.025 0.030 0.035 0.040 0.045 0.050
TOTAL TRUE STRESS
Fig. 81. Comparison of experimental vs predicted stress-strain curves for axial base-metal specimens from pipe H-22.The dashed line represents the experimental data; the solid line represents the predicted behavior, (a) Room temperature,(6) 427°C, (c) 538°C, (d) 649°C.
^1

ORNL DWG 78-18974
500
400 —ROOM TEMPERATURE
300
200 -,
0.
coCOLUcr
H 280 —CO
LU3
cr
I I538°C
^^^^^^
(/1/
—
1(C) 1 1
—
240 —
200 —
160 —,
120 -
80 -f-
40
0
320
280 —
240
200
160
120
649°C
0.005 0.010 0.015 0.020 0.025 0.030 0.035 0.040 0.045 0.050
TOTAL TRUE STRAIN
Fig. 82. Comparison of experimental vs predicted stress-strain curves for longitudinalweld specimens from pipe E-l 3.The dashed line represents the experimental data; the solid line represents the predicted behavior, (a) Room temperature,(b) 427°C, (c) 538°C, (d) 649°C.
vO

400
360
320
280
240
200
160
120
80
40
0
320
(")
280 —
240
200
160
120
a. 80
CO
co 40LUcr
\-co
LU
3360
(*)
320 —
280
240
WELD METAL (F-14)
PREDICTED
EXPERIMENTAL
ORNL DWG 78-18976
0.005 0.010 0.015 0.020 0.025 0.030 0.035 0.040 0.045 0.050
TOTAL TRUE STRAIN
Fig. 83. Comparison of experimental vs predicted stress-strain curves for longitudinal weld specimens from pipe F-14.The dashed line represents the experimental data; the solid line represents the predicted behavior, (a) Room temperature,(b) 427°C, (c) 538°C, (d) 649°C.

o
Q-
2
coCOLUrri-co
3crt-
ORNL-DWG 78-18979
500
400
300
IROOM TEMPERATURE
j^^Z
1 1^ —
^ zzzzzz. - ~
__
—
-(T^ —
—i WELD METAL (G-15) —
-/— — EXPERIMENTAL—
(«) | 1 1 | | | | | I
200 -i
100 -/-
320
280 —
240 —
200
0.005 0.010 0.015 0.020 0.025 0.030 0.035 0.040 0.045 0.050
TOTAL TRUE STRAIN
Fig. 84. Comparison of experimental vs predicted stress-strain curves for longitudinal weld specimens from pipe G-15.The dashed Line represents the experimental data; the sohd line represents the predicted behavior, (a) Room temperature,(b) 427° C, (c) 538°C, (d) 649° C.

cocoLUcr
co
LU3tr
400
360
320
280
240
200
160
120
40
WELD METAL (G-16) .
PREDICTED
EXPERIMENTAL
ORNL-DWG 78-18981
0.005 0.010 0.015 0.020 0.025 0.030 0.035 0.040 0.045 0.050
TOTAL TRUE STRAIN
Fig. 85. Comparison of experimental vs predicted stress-strain curves for longitudinalweld specimens from pipe G-16.The dashed line represents the experimental data; the solid line represents the predicted behavior, (a) Room temperature,(b) 427°C, (c) 538°C, (d) 649°C.

ORNL-DWG 78-18983
500
400 —ROOM TEMPERATURE
I I I I I^J^_^-^r^zmr__- —•
^_
V^—r
WELD METAL (H-22) —
~l EXPERIMENTAL
f C«) | | | I I I I I I
300
200
100
o
0- 0:>
320COcoLU
cr
CO 280
LU
3cr
0.005 0.010 0.015 0.020 0.025 0.030 0.035 0.040 0.045 0.050
TOTAL TRUE STRESS
Fig. 86. Comparison of experimental vs predicted stress-strain curves for longitudinal weld specimens from pipe H-22.The dashed Line represents the experimental data; the sohd line represents the predicted behavior, (a) Room temperature,(b) 427°C, (c) 538°C, (d) 649°C.
o

TEST BASE METAL (E-13)TEMPERATURE (°C) CIRCUMFERENTIAL
to
RT
427
538
649
1 2 cm 3 4 5
lilllniillillliHllillllHillllllllllllllllll
TEST WELD METAL (E-13)TEMPERATURE (°C) TRANSVERSE
RT
427
538
649
to
TEST BASE METAL (E-13) ™TEMPERATURE (°C) AXIAL
DT MmJk -^MtftiL 't ***<ft
538 4 Si^^^^^fil I*649 ju , - EMmflB|B
1 I cm 3 4 5
W lllllllllilNllllllllHllllllllllllllllllllllllIll
TEST WELD METAL (E-13)TEMPERATURE (°C) LONGITUDINAL
RT
427
538
649
W)
Fig. 87. Tensile specimens of E-13 pipeof type 316 stainless steel, (a) Base-metal circumferential, (ft)base-metal axial, (c) transverse weld, (d) longitudinal weld.
oCyJ

TEST BASE METAL (F-14)
TEMPERATURE (X) CIRCUMFERENTIAL
RT
427
538
649
to
TEST
TEMPERATURE (°C)
RT
427
538
649to (d)
Fig. 88. Tensile specimensof F-14 pipe of type 316 stainless steel, (a) Base-metal circumferential, (ft) base-metalaxial, (c) transverse weld, (d) longitudinal weld.
WELD METAL (F-14)TRANSVERSE
TEST BASE METAL (F-14)TEMPERATURE (°C) AXIAL
RT
427
538
649
tfc>
TEST
TEMPERATURE (°C)
RT
427
538
649
WELD METAL (F-14)LONGITUDINAL
a-u
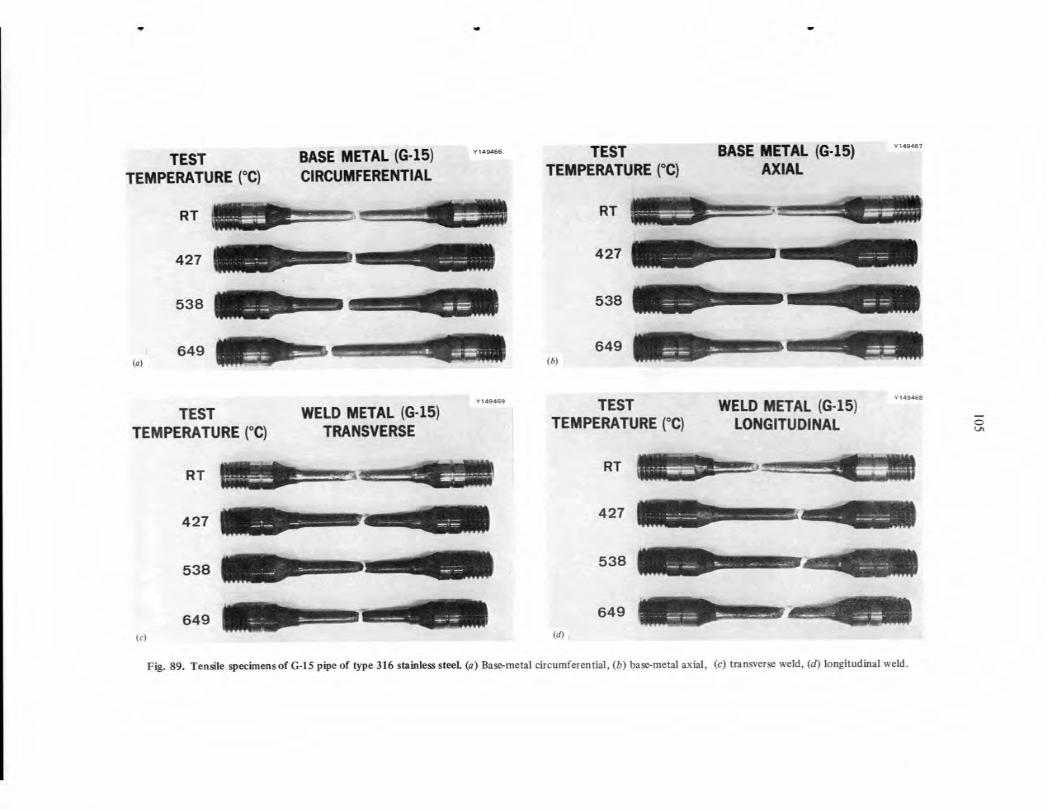
TEST
TEMPERATURE (°C)
RT
427
538
to649
TEST
TEMPERATURE (°C)
RT
427
538
649
BASE METAL (G-15)CIRCUMFERENTIAL
WELD METAL (G-15)TRANSVERSE
TEST BASE METAL (G-15)TEMPERATURE (°C) AXIAL
RT
427
538
649(6)
TEST
TEMPERATURE (°C)
RT
427
538
649
WELD METAL (G-15)LONGITUDINAL
(c) W
Fig. 89. Tensile specimens of G-15 pipeof type 316 stainless steel, (a) Base-metal circumferential, (ft) base-metal axial, (c) transverse weld, (d) longitudinal weld.
—

TEST
TEMPERATURE (°C)
RT
427
538
649
to
BASE METAL (G-16)CIRCUMFERENTIAL
K.JlUI
TEST WELD METAL (G-16) ns»*TEMPERATURE (°C) TRANSVERSE
RT
427
538
649
TEST BASE METAL (G-16)TEMPERATURE (°C) AXIAL
RT
427
538
649
(*)
TEST
TEMPERATURE (°C)
RT
427
538
649
WELD METAL (G-16)LONGITUDINAL
to
Fig. 90. Tensile specimens of G-16 pipeof type 316 stainless steel, (a) Base-metal circumferential, (ft) base-metal axial, (c) transverse weld,(d) longitudinal weld.
oOh

TEST
TEMP. (°C)
RT
427
538
to649
TEST
TEMP. (°C)
RT
427
538
to649
BASE METAL (H-22)
CIRCUMFERENTIAL
WELD METAL (H-22)
TRANSVERSE
TEST
TEMP. (°C)
RT
427
538
649(ft)
TEST
TEMP. (°C)
RT
427
538
M649
BASE METAL (H-22)
AXIAL
WELD METAL (H-22)
LONGITUDINAL
«S5.......
Fig. 91. Tensile specimens of H-22 pipeof type 316 stainless steeL (a) Base-metal circumferential, (ft) base-metal axial, (c) transverse weld, (d)longitudinal weld.
o

108
7.11 Summary of Mechanical Property Characterization
Tensile data were reported on five formed and welded pipes of type 316 stainless steel. Tensile tests
were performed on specimens taken from both the base metal and weld. The tensile tests were primarily
carried out on material in the as-received condition. However, eight tests per pipe (four at room tempera
ture and four at 649°C) were also performed on material in the reannealed condition. The reannealingtreatment consisted in heating specimens at 1065°C for 0.5 hr followed by rapid cooling. The tensile testswere supplemented by photographs of the specimens to show the location of failure.
Tensile stress-strain curves for the base metal and weld were compared. The tensile properties were
compared with the upper and lower bounds for the wrought material. The weld properties of each pipe
were compared with the corresponding base-metal properties. The tensile properties of an SA weld were
compared with a GTA weld to study the effect of welding procedure. The reannealed and as-received data
were used to estimate the residual cold work (from straightening) in the base metal and weld of each pipe.
The variation in tensile properties of the base metal and weld was examined in terms of currently available
relationships between strength properties and the C + N content. A previously developed stress-strain model
for the base metal was used to predict the stress-strain behavior (up to 5%) of the base metal and weld from
each of the pipes. The following conclusions can be drawn from this work:
1. The yield strength values of the base metal of all five pipes were close to or slightly below the average
for the wrought material, whereas those of the weld were close to or slightly above the average.
2. The ultimate tensile strengths of base metal from all five pipes were close to or slightly above the upper
bound for the wrought material, whereas the weld values were close to or below the lower bound.
Some of the weld values even fall below the minimum curve determined by the ratio method.
3. The uniform elongations of base metal from all pipes were close to the average for the wrought data,
whereas the weld values fall below the lower bound. Several weld values were even below the minimum
curve determined by the ratio method. The transverse weld specimens generally showed lower values
than did the longitudinal specimens.
4. Total elongation values for the base metal were above average or close to the upper bound for the
wrought material. However, several of the weld values were below the lower bound for the wrought
material.
5. Reduction-of-area values for the base metal were within the range observed for the wrought material. A
significant number of the values for the weld fell below the lower bound for the wrought material.
6. Yield strength was a function of the welding process. The GTA process with type 16-8-2 filler metal
resulted in yield strength values equal to or greater than those of the base metal. The SA process with
type 16-8-2 filler metal resulted in yield strength values lower than those of the base metal.
7. The ultimate tensile strength of the weld was always lower than that of the corresponding base metal.
The extent of lowering was influenced by the welding process. The SA process produced the greatestdifference between the base metal and the weld.
8. The uniform elongation of the SA weld with type 16-8-2 filler metal was lower than that of the
corresponding GTA weld with 16-8-2 filler metal.
9. Based on yield strength data, the as-received base metal contained residual straightening stress (corresponds to increase in friction stress) in the range of 5 to 58 MPa (0.7 to 8.4 ksi) for the five pipes. The
corresponding valuesfor the weldswere 6 to 68 MPa (0.9 to 9.9 ksi). Although reannealingmay reduce
the yield strength to values at or belowthe minimum requirement, the yieldstrengthis not consideredto be an important property in terms of creep and creep-rupture behavior.

109
10. Reannealing decreased the base-metal ultimate tensile strength in the range of 0 to 28 MPa (0.4 ksi).
The corresponding decrease for the weld-metal regions was 6 to 43 MPa (0.7 to 6.2 ksi). Thesedecreases are not considered to be significant in terms of the relationship between UTS and creep andcreep-rupture properties.
11. The observed variations in the yield and ultimate tensile strength of the base metal and weld (except
weld room-temperature ultimate tensile strength) were related to the variation in C + N content.
12. A previously developed stress-strain model could generally describe the stress-strain behavior (up to5%) of the base metal and weld for all five pipes. However, for an accuratedescriptionof the weld, amodified steady-state strain-hardening constant is necessary.
13. On the basis of previous work, the lower ultimate tensile strength values of the weld as compared with
the base metal are expected to produce reduced creep-rupture properties. The SA weld is expected toshow poorer creep-rupture properties than those of the GTA welds.
14. Irrespective of the welding process and filler metal combinations tested, the weld was the weakest link
in the formed and welded pipe for transverse tensile tests.
8. CONCLUSIONS
The results of this characterization indicate that formed and welded pipe can be manufactured at a
lower cost than can the hot-extruded and -worked pipe used for the FFTF. However, the dimensional
requirements as compared with the FFTF were shown to have been relaxed in order to allow the use of
formed and welded pipe for the ClinchRiver Breeder Reactor. While stressanalyses havebeen performed tojustify the relaxed dimensional control, fitup for welding was shown to conceivably be affected. Therefore,
the selection of formed and welded pipe over alternate manufacturing methods must weigh the loss ofdimensional control against the potential cost reduction.
The tensile properties of the weldments in the five formed and welded pipes were shown to be generallyweaker than those for the base metal. The most significant differences were for UTS and ductility. Since
UTS has been used to predict creep and stress-rupture properties for base metals,39-41 the weldments in
these pipes are expected to have reduced time-dependent properties as compared with the base metal.
Although ASME Code Case N474 currently penalizes welds being used at elevated temperature to accountfor these reduced properties, the penalty factor was arbitrarily set by limiting the allowable strain for theweld region to one-half the value permitted for the base metal. If welded pipe is going to be used, it would
appear that a more realistic method should be employed to account for the reduced weldment properties.One possible method would be to establish a design limit curve for weldment creep and stress-ruptureproperties which would enable correlation to acceptance testing of weld prolongations from actual components or from welding procedure qualification tests. The proposed method could provide a means toaccount for variations resulting from such factors as base metal, filler metal, flux, and arc atmospherecomposition; dilution; heat input; welding travel speed; and heat treatment. One such method which
utilizes UTS at the temperature of interest is beinginvestigated at ORNL. It is important to remember thatthe sodium coolant system piping will contain non-heat-treated circumferential welds joining pipesectionseven if seamless pipe is used. The use of the design method being investigated at ORNL would also beapplicable to these welds.

110
ACKNOWLEDGMENTS
We would like to acknowledge D. P. Edmonds, G. M. Goodwin, R. T. King, and G. M. Slaughter for
their work early in this program, R. J. Beaver for his efforts in writing the specifications for and procuring
the pipe, T. G. Ramsey and J. L. Holbrook for performing the dimensional and radiographic inspections, C.
W. Houck for performing the metallographic evaluations, L. Deroos and J. Green (Y-12 Plant) for per
forming the QTM examinations, D. P. Edmonds for obtaining the chemical analyses, L. T. Ratcliff for
performing the tensile tests, R. Baldwin for his efforts in processing the mechanical properties data, K.
Gardner for typing the draft of this paper, and R. T. King and R. E. McDonald for reviewing this paper. The
report was edited and composed under subcontract with Adroit, Inc.
REFERENCES
1. ClinchRiver Breeder Reactor Plant Design, Breeder Reactor Corp., October 1975.2. R. A. Moen, D. P. O'Keefe, J. E. Irvin, and J. C. Tobin, "Specifying and Manufacturing Piping for
the Fast-Flux Test Facility," ASME Congress on Pressure Vessels and Piping, Miami Beach, Fla., June24-25,1974.
3. ASME Boiler and Pressure Vessel Code, Section III, Division 1, Nuclear Power Plant Components,Appendicies.^w. Soc. Mech. Eng., 1977 edition.
4. ASME Boiler and Pressure Vessel Code, Code Cases, Nuclear Components, Am. Soc. Mech. Eng.,1977 edition.
5. C. R. Brinkman, V. K. Sikka, and R. T. King, MechanicalProperties of LMFBR Primary PipingMaterials, ORNL-5199 (November 1976).
6. E. C. Rodabaugh, Stresses in Out-of-Round Pipe Due to Internal Pressure, ORNL/TM-3244(January 1971).
7. K. Thomas, Effects of Nonuniform Geometry and Welding on Piping Elbow Design, WARD-SD-30454 (April 1977).
8. FFTF dimensional inspection records provided by C. Bonham, Hanford Engineering DevelopmentLaboratory, Richland, Wash., December 14, 1976.
9. Specification 5853-M-106 for Seamless Austenitic Stainless Steel Pipe for Liquid-Metal Service forthe Fast-Flux Test Facility of the U.S. Atomic Energy Commission, Richland, Wash., Rev. 3, June 19,1974. (unpublished work)
10. J. M. Steichen, Mechanical Properties of FFTF Primary Outlet Piping, HEDL/TM-75-15 (January1975).
11. J. M. Steichen, FFTF Primary Piping Fabrication Comparison, HEDL/TME-72-133 (October1972).
12. ASME Boiler and Pressure Vessel Code, Section II, Material Specification Part A, Ferrous Materials,SA-240, "Specification for Chromium and Chromium-Nickel Stainless Steel Plate, Sheet, and Strip forFusion-Welded Unified Pressure Vessels," Am. Soc. Mech. Eng., 1974 edition, through summer 1975addenda.
13. ASME Boiler and Pressure Vessel Code, Section II, Material Specification Part A, Ferrous Materials,SA-358, "Specification for Electric-Fusion-Welded Austenitic Chromium-Nickel Alloy Steel Pipe for High-Temperature Service," Am. Soc. Mech. Eng, 1974 edition, through summer 1975 addenda.
14. ASME Boiler and Pressure Vessel Code, Section III, Material Specification Part A, FerrousMaterials, SA-312, "Specification for Seamlessand Welded Austenitic Stainless Steel Pipe," Am. Soc. Mech.Eng., 1974 edition, through summer 1975 addenda.
15. ASME Boiler and Pressure Vessel Code, Section HI, Division 1, Nuclear Power Plant Components,Subsection NB - Class 1 Components, Am. Soc. Mech. Eng., 1974 edition, through summer 1975 addenda.
16. ASME Boiler and Pressure Vessel Code, Section III, Division 1, Nuclear Power Plant Components,Subsection NC - Class 2 Components, Am. Soc. Mech. Eng, 1974 edition, through summer 1975 addenda.
17. Specification ORNL MET-WB-MS-3, "Austenitic Stainless Steel Plate, Sheet and Strip (ASMESA-240 with Additional Requirements, Including RDT M5-1T Requirements)," January 26, 1976. (unpublished work)

11
18. Specification ORNL MET-WB-MS-2, "Austenitic Stainless Steel Welded Pipe, Large-Diameter(ASME SA-358 Including the Additional Requirements of RDT M3-7T)," January 26,1976. (unpublishedwork)
19. Specification ORNL MET-WB-MS-4, "Austenitic Stainless Steel Welded Pipe (ASME SA-312 withAdditional Requirements)," January 26,1976. (unpublished work)
20. Bechtel Power Corporation Purchase Order No. 8776-M-106AC, March 10, 1972, provided by C.Bonham, Hanford Engineering Development Laboratory, Richland, Wash., December 14, 1976.
21. C. E. Veall, J. Donaldson, and D. H. Woodward, "Manufacture of Welded Steel Pipe and Tube," Br.Weld. J. 15,4 (April 1968).
22. ASME Boiler and Pressure Vessel Code, Section III, Division 1, Nuclear Power Plant Components,Subsection NB —Class 1 Components, Am. Soc. Mech. Eng. 1977 edition, through summer 1975 addenda.
23. "Three-Roll Forming," Metals Handbook, vol. A,Forming, pp. 217-21, 8th ed. 1969.24. "The Making, Shaping and Treating of Steel," Manufacture ofSteel Tubular Products, pp. 887—89,
ninth ed., 1971.
25. Private discussions with D. P. Edmonds, Oak Ridge National Laboratory, March 29,1978.26. "Clinch River Breeder Reactor Plant Specification, Pipe, Large-Diameter, Welded, Sodium Service,"
Specification No. 953094, Rev. 1, Para. 1.2.2.F, December 1976 and later revisions, Westinghouse ElectricCorporation Advanced Reactors Division.
27. M. G. Fontana and N. D. Greene, Corrosion Engineering, p. 58, McGraw-Hill, New York, 1967.28. Standard Specification for General Requirements for Specialized Carbon and Alloy Steel Pipe,
A530-75, para. 10 and 12, pp. 536—37 in Part 1, Steel Piping, Tubing, Fittings, 1976 Annual Book ofASTM Standards, ASTM, Philadelphia, 1976.
29. "A-480-75, Standard Specification for General Requirements for Flat-Rolled Stainless and Heat-Resisting Steel Plate, Sheet, and Strip," para. 16, p. 356 in Part 3, Steel Plate, Sheet, Strip, Wire;MetallicCoated Products, 1976 Annual Book ofASTM Standards, ASTM, Philadelphia, 1976.
30. Clinch River Breeder Reactor Plant Equipment Specification, Shop Fabrication of Piping Subassemblies for Liquid-Metal Service, Specification No. E-953109, Rev. 0, April 1977, Westinghouse ElectricCorporation Advanced Reactors Division.
31. Private communications with R. Newton, Westinghouse Electric Corp., Advanced ReactorsDivision.
32. "Clinch River Breeder Reactor Plant Specification, Pipe, Large-Diameter, Welded, Sodium Service,"Specification No. E-953094, Rev. 2, Para. 1.2.2.F, February 1977, Westinghouse Electric CorporationAdvanced Reactors Division.
33. AWS A4.2-74, Standard Procedures for Calibrating Magnetic Instruments to Measure the DeltaFerrite Content ofAustenitic Stainless Steel Weld Metal, American Welding Society, Miami, 1974.
34. C. J. Long and W. T. DeLong, "The Ferrite Content of Austenitic Stainless Steel Weld Metal,"Weld. J. (Miami, Fla.) 52(7), 281-s-297-s (July 1973).
35. V. K. Sikka, Tensile Properties of Type 316 Stainless Steel, report in preparation.36. G. V. Smith, An Evaluation of the Yield, Tensile Creep, and Rupture Properties of Wrought 304,
316, 321, 321 and 347 Stainless Steels at Elevated Temperatures, ASMT Data Series DS5-S2, Am. Soc. forTesting and Materials, Philadelphia (February 1969).
37. V. K. Sikka, R. W. Swindeman, T. L. Hebble, C. R. Brinkman, and M. K. Booker, "Residual ColdWork and Its Influence on Tensile and Creep Properties of Types 304 and 316 Stainless Steels," Nucl.Technol. 31,96-114(1976).
38. V. K. Sikka, Product Form Characterization of Reference Heat of Type 316 Stainless Steel,ORNL-5384 (February 1978).
39. V. K. Sikka, H. E. McCoy, M. K. Booker, and C. R. Brinkman, "Heat-to-Heat Variation in CreepProperties of Types 304 and 316 Stainless Steel,"/. Pressure Vessel Technol. 97, 243-51 (1975).
40. V. K. Sikka and C. R. Brinkman, "Relation Between Short- and Long-Term Elevated TemperatureProperties of Several Austenitic StainlessSteels," Sci. Metall. 10, 25-28 (1976).
41. V. K. Sikka, M. K. Booker, and C. R. Brinkman, Use of Ultimate TensileStrength to Correlate andEstimate Creep and Creep-Rupture Behavior of Type 304 and 316 Stainless Steel, ORNL-5285 (October1977).

112
42. J. W. McEnerney and V. K. Sikka, Time-Dependent Properties of Formed and Welded Pipe forBreeder Reactor Application, report in preparation.
43. K. I. Irvine, T. Gladman, and F. B. Pickering, "The Strength of Austenitic Stainless Steels," J. IronSteel Inst. 207,1017-28 (1969).
44. K. Natesan, T. F. Kassner, and Che-Yu Li, "Effect of Sodium on Mechanical Properties andFriction-Wear Behavior of LMFBR Materials," React. Technol. 15, 244-77 (Winter 1972-73).
45. P. Soo and W. H. Horton, The Effect of Carbon and Nitrogen on the Short-Term Tensile BehaviorofSolution-Treated Types 304 and 316 Stainless Steels, WARD-NA-3045-2 (July 1973).
46. V. K. Sikka, M. K. Booker, and J. P. Hammond, Rational Polynominal TensileStress-Strain Equation for Low-Strain Behaviorof Types 304 and 316 Stainless Steel, report in preparation.
47. V. K. Sikka and M. K. Booker, "Influence of Laboratory Annealing on Tensile Properties andDesign Stress Intensity Limits for Type 304 Stainless Steel," Effects ofMelting andProcessing Variables onthe Mechanical PropertiesofSteel, MPC-6, ASME, New York (1977).
48. J. P. Hammond and V. K. Sikka, Heat-to-Heat Variation of Total Strain (to 5%) at Discrete StressLevels in Types 316 and 304 Stainless Steel from 24 to 316°C, ORNL/NUREG/TM-57 (December 1976).
49. S. Kumar, "HTS Piping/Structural Analysis Calculation Summary Sheet," SARB No. LPE-PD-76-30 Rev. 0, Westinghouse Advanced ReactorsDivision, January 1977. (unpublishedwork)
50. R. M. Mello, "HTS Piping/Piping Tolerance-Fatigue Damage Study Calculation Summary Sheet,"SARB No. LPE-PD-76-031 Rev. 0, Westinghouse Advanced Reactors Division, December 1976. (unpublished work)
51. G. D. Eichenberger, P. W. Turner, and D. W. Hood, Tooling for Mechanized Welding of LargeDiameter Pipe, TREE-1258, Idaho National Engineering Laboratory, April 1978.
52. Private discussions with G. D. Eichenberger, Idaho National Engineering Laboratory, August 2,
1978.
53. V. K. Sikka, "Elevated-Temperature Ductility of Types 304 and 316 Stainless Steel," accepted forpublication in Metals Properties Councilbook entitled Ductilityand Toughness Considerations in Elevated-Temperature Service, 1978.

13
ORNL/TM-6609
Distribution
Category UC-79b, -h, -k
INTERNAL DISTRIBUTION
1-2. Central Research Library3. Document Reference Section
4-5. Laboratory Records Department6. Laboratory Records Department, RC7. ORNL Patent Section
8. M. K. Booker
9. J.M.Corum
10. J. R. DiStefano
11. D.P.Edmonds
12. G.M.Goodwin
13. R.J.Gray14-15. M.R.Hill
16. J.F.King
17. R. L. Klueh
18. K. C. Lui
19. H. E. McCoy20-29. J. W. McEnerney
30. A. J. Moorhead
31. C.E.Pugh32-36. V. K. Sikka
37. G. M. Slaughter38. J.H.Smith
39. R. W. Balluffi (consultant)40. W. R. Hibbard, Jr. (consultant)41. M. J. Mayfield (consultant)42. J. T. Stringer (consultant)
EXTERNAL DISTRIBUTION
43-44. DOE DIVISION OF REACTOR RESEARCH AND TECHNOLOGY, Washington, DC 20545Director
45. DOE OAK RIDGE OPERATIONS OFFICE, P.O. Box E, Oak Ridge, TN 37830Assistant Manager, Energy Research and Development
46-307. DOE TECHNICAL INFORMATION CENTER, Office of Information Services, P.O. Box 62, Oak
Ridge, TN 37830
For distribution as shown in TID-4500 Distribution Category,UC-79b (Fuels and Materials Engineering Development),UC-79h (Structural Materials Design Engineering), andUC-79k (Components).