check your progress 18 - sri lanka's educational...
TRANSCRIPT

a.
b. c.
from snout to tail. The Carboniferous period is called the Age of Amphibians. The process that turned the great Carboniferous for-ests into the coal we use today to fuel our modern society started during the Carboniferous period. The weather turned cold and dry, and this brought an end to the Age of Amphibians. A major mass extinction event occurred
at the end of the Permian period, bringing an end to the Paleozoic era and setting the stage for the Mesozoic era.
Check Your Progress 18.2B
1. Why is the Carboniferous a significant period?
FIGURE 18.11 Swamp forests of the Carboniferous period.
a. Vast swamp forests of treelike club mosses and horsetails dominated the land during the Carboniferous period (see Table 18.1). The air contained insects with wide wingspans, such as the predecessors to dragonflies shown here, and amphibians lumbered from pool to pool. b. Dragonfly fossil from the Carboniferous period. c. Modern-day dragonfly.
mad2543X_ch18_317-336.indd 329mad2543X_ch18_317-336.indd 329 11/18/08 2:30:56 PM11/18/08 2:30:56 PM

The Mesozoic EraAlthough a severe mass extinction occurred at the end of the Paleozoic era, the evolution of certain types of plants and ani-mals continued into the Triassic, the first period of the Meso-zoic era. Nonflowering seed plants (collectively called gym-nosperms), which had evolved and then spread during the Paleozoic, became dominant. Cycads are short and stout with palmlike leaves, and they produce large cones. Cycads and re-lated plants were so prevalent during the Triassic and Juras-sic periods that these periods are sometimes called the Age of Cycads. Reptiles can be traced back to the Permian period of the Paleozoic era. Unlike amphibians, reptiles can thrive in a dry climate because they have scaly skin and lay a shelled egg that hatches on land. Reptiles underwent an adaptive radiation during the Mesozoic era to produce forms that lived in the air, in the sea, and on the land. One group of reptiles, the therap-sids, had several mammalian skeletal traits. During the Jurassic period, large flying reptiles called pterosaurs ruled the air, and giant marine reptiles with paddle-like limbs ate fishes in the sea. But on land, it was dinosaurs that prevented the evolving mammals from taking center stage. Although the average size of the dinosaurs was about that of a crow, many giant species developed. The gargan-tuan Apatosaurus and the armored, tractor-sized Stegosaurus fed on cycad seeds and conifer trees. The size of a dinosaur such as Apatosaurus is hard for us to imagine. It was 4.5 m tall at the hips and 27 m long in length and weighed about 40 tons. How might dinosaurs have benefited from being so large? One hypothesis is that, being ectothermic (cold-blooded), the surface-area-to-volume-ratio was favorable
for retaining heat. There is also data that suggests dino-saurs were endothermic (warm-blooded). During the Cretaceous period, great herds of rhinolike dinosaurs, Triceratops, roamed the plains, as did the infamous Tyrannosaurus rex, which may have been a carnivore, filling the same ecological role as lions do today. Parasaurolophus was a unique-looking, long-crested, duck-billed dinosaur (Fig. 18.12). The long, hollow crest was bigger than the rest of its skull and functioned as a resonating chamber for making booming calls, perhaps used during mating or to help members of a herd lo-cate each other. In comparison to Apatosaurus, Parasaurolophus was small. It was less than 3 m tall at the hips and weighed only about 3 tons. Still, it was one of the largest plant-eaters of the late Cretaceous period and fed on pine needles, leaves, and twigs. Parasaurolophus was easy prey for large predators; its main de-fense would have been running away in large herds. At the end of the Cretaceous period, the dinosaurs be-came victims of a mass extinction, which will be discussed on page 333. One group of dinosaurs, called theropods, were bipedal and had an elongate, mobile, S-shaped neck. They most likely gave rise to the birds, whose fossil re-cord includes the famous Archaeopteryx (see Fig. 15.12, page 276). Up until 1999, Mesozoic mammal fossils largely consisted of teeth. This changed when a fossil found in China was dated at 120 mya and named Jeholodens. The animal, identified as a mammal, apparently looked like a long-snouted rat. Surprisingly, Jeholodens had sprawling hindlimbs as do reptiles, but its forelimbs were under the belly, as in today’s mammals.
FIGURE 18.12 Dinosaurs of the late Cretaceous period.
Parasaurolophus walkeri, although not as large as other dinosaurs, was one of the largest plant-eaters of the late Cretaceous period. Its crest atop the head was about 2 m long and was used to make booming calls. Also living at this time were the rhinolike dinosaurs represented here by Triceratops (left), another herbivore.
330 PART II I EVOLUTION
mad2543X_ch18_317-336.indd 330mad2543X_ch18_317-336.indd 330 11/18/08 2:31:18 PM11/18/08 2:31:18 PM
www.ebook3000.com

The Cenozoic EraClassically, the Cenozoic era is divided into two periods, the Tertiary period and the Quaternary period. Another scheme, dividing the Cenozoic into the Paleogene and the Neogene pe-riods is gaining popularity. This new system divides the epochs differently. In any case, we are living in the Holocene epoch.
Mammalian DiversificationAt the end of the Mesozoic era, mammals began an adaptive radiation into the many habitats now left vacant by the demise of the dinosaurs. Mammals are endotherms, and they have hair, which helps keep body heat from escaping. Their name refers to the presence of mammary glands, which produce milk to feed their young. At the start of the Paleocene epoch, mammals were small and resembled rats. By the end of the Eocene epoch, mammals had diversified to the point that all of the modern orders were in existence. Mammals adaptively radiated into a number of environments. Several species of mammals, includ-ing the bats, conquered the air. Whales, dolphins, manatees, and other mammals returned to the sea from land ancestry. On land, herbivorous hoofed mammals populated the forests and grass-lands and were preyed upon by carnivorous mammals. Many of the types of herbivores and carnivores of the Oligocene epoch are extinct today (Fig. 18.13).
Evolution of PrimatesFlowering plants (collectively called angiosperms) were al-ready diverse and plentiful by the Cenozoic era. Primates are a type of mammal adapted to living in flowering trees, where there is protection from predators and where food in the
form of fruit is plentiful. The ancestors of modern primates appeared during the Eocene epoch about 55 mya. The first primates were small, squirrel-like animals. Ancestral apes appeared during the Oligocene epoch. These primates were adapted to living in the open grasslands and savannas. Apes diversified during the Miocene and Pliocene epochs and gave rise to the first hominids, a group that includes humans. Many of the skeletal differences between apes and humans relate to the fact that humans walk upright. Exactly what caused hu-mans to adopt bipedalism is still being debated. The world’s climate became progressively colder dur-ing the Tertiary period. The Quaternary period begins with the Pleistocene epoch, which is known for multiple ice ages in the Northern Hemisphere. During periods of glaciation, snow and ice covered about one-third of the land surface of the Earth. The Pleistocene epoch was an age of not only hu-mans, but also giant ground sloths, beavers, wolves, bison, woolly rhinoceroses, mastodons, and mammoths (Fig. 18.14). Humans have survived, but what happened to the oversized mammals just mentioned? Some think humans became such skilled hunters that they are at least partially responsible for the extinction of these awe-inspiring animals.
Check Your Progress 18.2C
1. If the geologic timescale was proportional to Figure 18.5b, which era would be allowed the least amount of space in the timescale?
2. What significant type of plant and animal was abundant during the Mesozoic era?
FIGURE 18.13 Mammals of the Oligocene epoch.
The artist’s representation of these mammals and their habitat vegetation is based on fossil remains.
FIGURE 18.14 Woolly mammoth of the Pleistocene epoch.
Woolly mammoths were animals that lived along the borders of continental glaciers.
CHAPTER 18 ORIGIN AND HISTORY OF LIFE 331
mad2543X_ch18_317-336.indd 331mad2543X_ch18_317-336.indd 331 11/18/08 2:31:28 PM11/18/08 2:31:28 PM

Pangaea
(251 million years ago)
Laurasia
Gondwana
(135 million years ago)
NorthAmerica Eurasia
SouthAmerica
AfricaIndia
Australia
Antarctica
NorthAmerica Eurasia
AfricaIndia
Australia
Antarctica
SouthAmerica
Present day(65 million years ago)
PALEOZOIC MESOZOIC CENOZOIC
332 PART II I EVOLUTION
18.3 Factors That Influence Evolution
In the past, it was thought that the Earth’s crust was im-mobile, that the continents had always been in their pres-ent positions, and that the ocean floors were only a catch basin for the debris that washed off the land. But in 1920, Alfred Wegener, a German meteorologist, presented data from a number of disciplines to support his hypothesis of continental drift.
Continental DriftContinental drift was finally confirmed in the 1960s, estab-lishing that the continents are not fixed; instead, their posi-tions and the positions of the oceans have changed over time (Fig. 18.15). During the Paleozoic era, the continents joined to form one supercontinent that Wegener called Pangaea [Gk. pangea, all lands]. First, Pangaea divided into two large sub-continents, called Gondwana and Laurasia, and then these also split to form the continents of today. Presently, the conti-nents are still drifting in relation to one another. Continental drift explains why the coastlines of several continents are mirror images of each other—for example, the outline of the west coast of Africa matches that of the east coast of South America. The same geological structures are also found in many of the areas where the continents touched. A single mountain range runs through South America, Antarc-tica, and Australia. Continental drift also explains the unique distribution patterns of several fossils. Fossils of the same species of seed fern (Glossopteris) have been found on all the southern continents. No suitable explanation was possible pre-viously, but now it seems plausible that the plant evolved on one continent and spread to the others while they were still joined as one. Similarly, the fossil reptile Cynognathus is found in Africa and South America, and Lystrosaurus, a mammal-like reptile, has now been discovered in Antarctica, far from Af-rica and southeast Asia, where it also occurs. With mammalian
fossils, the situation is different: Australia, South America, and Africa all have their own distinctive mammals because mam-mals evolved after the continents separated. The mammalian biological diversity of today’s world is the result of isolated evolution on separate continents. For example, why are mar-supials prevalent in Australia but no place else? Most likely marsupials started evolving in the Americas and were able to reach Australia when the southern continents were still joined. Once Australia separated off, marsupials were able to diver-sify because placental mammals on that continent offered little competition. On the other hand, placental mammals are preva-lent in the Americas and few marsupials can be found.
Plate TectonicsWhy do the continents drift? An answer has been suggested through a branch of geology known as plate tectonics [Gk. tektos, fluid, molten, able to flow], which says that the Earth’s crust is fragmented into slablike plates that float on a lower hot mantle layer. The continents and the ocean basins are a part of these rigid plates, which move like conveyor belts. At ocean ridges, seafloor spreading occurs as molten mantle rock rises and material is added to the ocean floor. Seafloor spreading causes the continents to move a few centimeters a year on the average. At subduction zones, the forward edge of a moving plate sinks into the mantle and is destroyed, form-ing deep ocean trenches bordered by volcanoes or volcanic island chains. The Earth isn’t getting bigger or smaller, so the amount of oceanic crust being formed is as much as that being destroyed. When two continents collide, the result is often a mountain range; for example, the Himalayas re-sulted when India collided with Eurasia. The place where two plates meet and scrape past one another is called a transform boundary. The San Andreas fault in Southern Cali-fornia is at a transform boundary, and the movement of the two plates is responsible for the many earthquakes in that region. No one can see the continents moving. The only visible evidence of movement is an earthquake at trans-form boundaries.
FIGURE 18.15 Continental drift.
About 251 MYA, all the continents were joined into a supercontinent called Pangaea. During the Mesozoic era, the joined continents of Pangaea began moving apart, forming two large continents called Laurasia and Gondwana. Then all the continents began to separate. Presently, North America and Europe are drifting apart at a rate of about 2 cm per year.
mad2543X_ch18_317-336.indd 332mad2543X_ch18_317-336.indd 332 11/18/08 2:31:33 PM11/18/08 2:31:33 PM
www.ebook3000.com

CAMBRIAN ORDOVICIAN SILURIAN DEVONIAN CARBONIFEROUS PERMIAN TRIASSIC JURASSIC CRETACEOUS TERTIARY QUATER-NARY
MajorExtinctions
% SpeciesExtinct
PRESENT
STATUS TODAY
ammonoids extinct
poriferans
brachiopods
insects
birds
mammals
443.7 MYA 359.2 MYA 251 MYA 199.6 MYA 65.5 MYA
75% 70% 90% 60% 75%
poriferansbrachiopods
mammals
birds
dinosaursinsects
ammonoids
dinosaurs extinct
CHAPTER 18 ORIGIN AND HISTORY OF LIFE 333
Mass ExtinctionsAt least five mass extinctions have occurred throughout his-tory: at the ends of the Ordovician, Devonian, Permian, Tri-assic, and Cretaceous periods (Fig. 18.16; see Table 18.1). Is a mass extinction due to some cataclysmic event, or is it a more gradual process broug ht on by environmental changes, including tectonic, oceanic, and climatic fluctuations? This question was brought to the fore when Walter and Luis Al-varez proposed in 1977 that the Cretaceous extinction when the dinosaurs died out was due to a bolide. A bolide is an asteroid (minor planet) that explodes, producing meteorites that fall to Earth. They found that Cretaceous clay contains an abnormally high level of iridium, an element that is rare in the Earth’s crust but more common in asteroids and meteor-ites. The result of a large meteorite striking Earth could have been similar to that of a worldwide atomic bomb explosion: A cloud of dust would have mushroomed into the atmosphere, blocking out the sun and causing plants to freeze and die. A layer of soot has been identified in the strata alongside the iridium, and a huge crater that could have been caused by a meteorite was found in the Caribbean–Gulf of Mexico region on the Yucatán peninsula. Certainly, continental drift contributed to the Ordovician extinction. This extinction occurred after Gondwana arrived at the South Pole. Immense glaciers, which drew water from the oceans, chilled even once-tropical land. Marine invertebrates and coral reefs, which were especially hard hit, didn’t recover until Gondwana drifted away from the pole and warmth re-turned. The mass extinction at the end of the Devonian period saw an end to 70% of marine invertebrates. Helmont Geld-setzer of Canada’s Geological Survey notes that iridium has also been found in Devonian rocks in Australia, suggesting it’s possible that a bolide event was involved because iridium
has been found in Devonian rocks in Australia. Some scien-tists believe that this mass extinction could have been due to movement of Gondwana back to the South Pole. The extinc-tion at the end of the Permian period was quite severe; 90% of species disappeared. The latest hypothesis attributes the Permian extinction to excess carbon dioxide. When Pangaea formed, there were no polar ice caps to initiate ocean currents. The lack of ocean currents caused organic matter to stagnate at the bottom of the ocean. Then, as the continents drifted into a new configuration, ocean circulation switched back on. Now, the extra carbon on the seafloor was swept up to the surface where it became carbon dioxide, a deadly gas for sea life. The trilobites became extinct, and the crinoids (sea lilies) barely survived. Excess carbon dioxide on land led to a global warming that altered the pattern of vegetation. Areas that were wet and rainy became dry and warm, and vice versa. Burrowing animals that could escape land surface changes seemed to have the best chance of survival. The extinction at the end of the Triassic period is another that has been attributed to the environmental effects of a me-teorite collision with Earth. Central Quebec has a crater half the size of Connecticut that some believe is the impact site. The dinosaurs may have benefited from this event because this is when the first of the gigantic dinosaurs took charge of the land. A second wave occurred in the Cretaceous period but it ended in dinosaur extinction as discussed previously.
Check Your Progress 18.3
1. Climate permitting, would you expect to find dinosaur bones all over the globe? Explain.
2. Humans did not become extinct during any of the mass extinctions discussed. Explain.
FIGURE 18.16 Mass extinctions.
Five significant mass extinctions and their effects on the abundance of certain forms of marine and terrestrial life. The width of the horizontal bars indicates the varying abundance of each life-form considered. MYA=million years ago
mad2543X_ch18_317-336.indd 333mad2543X_ch18_317-336.indd 333 11/18/08 2:31:37 PM11/18/08 2:31:37 PM
334 PART II I EVOLUTION
summary18.1 Origin of LifeThe unique conditions of the early Earth allowed a chemical evolution to occur. An abiotic synthesis of small organic molecules such as amino acids and nucleotides occurred, possibly either in the atmosphere or at hydrothermal vents. These monomers joined together to form polymers either on land (warm seaside rocks or clay) or at the vents. The first polymers could have been proteins or RNA, or they could have evolved together. The aggregation of polymers inside a plasma membrane produced a protocell having some enzymatic properties such that it could grow. If the protocell developed in the ocean, it was a heterotroph; if it developed at hydrothermal vents, it was a chemoautotroph. A true cell had evolved once the protocell contained DNA genes. The first genes may have been RNA molecules, but later DNA became the information storage molecule of heredity. Biological evolution now began.
18.2 History of LifeThe fossil record allows us to trace the history of life. The oldest prokaryotic fossils are cyanobacteria, dated about 3.5 BYA, and they were the first organisms to add oxygen to the atmosphere. The eukaryotic cell evolved about 2.2 BYA, but multicellular animals (the Ediacaran animals) do not occur until 600 MYA. A rich animal fossil record starts at the Cambrian period of the Paleozoic era. The occurrence of external skeletons, which seems to explain the increased number of fossils at this time, may have been due to the presence of plentiful oxygen in the atmosphere, or perhaps it was due to predation. The fishes were the first vertebrates to diversify and become dominant. Amphibians are descended from lobe-finned fishes. Plants also invaded land during the Ordovician period. The swamp forests of the Carboniferous period contained seedless vascular plants, insects, and amphibians. This period is sometimes called the Age of Amphibians. The Mesozoic era was the Age of Cycads and Reptiles. First mammals and then birds evolved from reptilian ancestors. During this era, dinosaurs of enormous size were present. By the end of the Cretaceous period, the dinosaurs were extinct. The Cenozoic era is divided into the Tertiary period and the Quaternary period. The Tertiary is associated with the adaptive radiation of mammals and flowering plants that formed vast tropical forests. The Quaternary is associated with the evolution of primates; first monkeys appeared, then apes, and then humans. Grasslands
were replacing forests, and this put pressure on primates, who were adapted to living in trees. The result may have been the evolution of humans—primates who left the trees.
18.3 Factors That Influence EvolutionThe continents are on massive plates that move, carrying the land with them. Plate tectonics is the study of the movement of the plates. Continental drift helps explain the distribution pattern of today’s land organisms. Mass extinctions have played a dramatic role in the history of life. It has been suggested that the extinction at the end of the Cretaceous period was caused by the impact of a large meteorite, and evidence indicates that other extinctions have a similar cause as well. It has also been suggested that tectonic, oceanic, and climatic fluctuations, particularly due to continental drift, can bring about mass extinctions.
understanding the terms
Match the terms to these definitions:a. Concept that rates mutational in certain types
of genes is constant over time.b. Cell forerunner that possibly developed from
cell-like microspheres.c. Droplet of lipid molecules formed in a liquid
environment.d. A region where crust forms and from which it
moves laterally in each direction.e. Formed from oxygen in the upper
atmosphere, it protects the Earth from ultraviolet radiation.
Would the history of life on Earth always be the same? In a previous chapter, we learned that the evolutionary process sometimes oc-curs gradually and steadily over time and at other times speciation seems to occur rap-idly. Is it possible that both mechanisms may be at work in different groups of organisms and at different times? Is it also possible that the history of life could have turned out differently? The spe-
The history of life on Earth, as we know it, is only one possible scenario. If we could rewind the “tape of life” and let history take its course anew, the result might well be very different, depending on the geologic and bio-logic events that took place the second time around. As an analogy, consider that if you were born in another time period and in a different country, you might be very different from the “you” of today.
Connecting the Concepts
cies alive today are the end product of the abiotic and biotic changes that occurred on Earth as life evolved. And what if the abiotic and biotic changes had been other than they were? For example, if the continents had not separated 65 MYA, what types of mammals, if any, would be alive today? Given a different sequence of environments, a different mix of plants and animals might very well have resulted.
absolute dating (of fossils) 324
chemical evolution 318coacervate droplet 320continental drift 332endosymbiotic
theory 325extinction 327fossil 322geologic timescale 324index fossil 322liposome 320mass extinction 327microsphere 319molecular clock 327
ocean ridge 319ozone shield 325paleontology 322plate tectonics 332protein-first
hypothesis 319proteinoid 319protobiont 320protocell 320relative dating
(of fossils) 322RNA-first hypothesis 319sedimentation 322stratum 322stromatolite 324
mad2543X_ch18_317-336.indd 334mad2543X_ch18_317-336.indd 334 11/18/08 2:31:39 PM11/18/08 2:31:39 PM
www.ebook3000.com

CHAPTER 18 ORIGIN AND HISTORY OF LIFE 335
reviewing this chapter 1. List and describe the various hypotheses concerning the
chemical evolution that produced polymers. 318–19 2. Trace in general the steps by which the protocell may have
evolved from polymers. 319–20 3. List and describe the various hypotheses concerning the origin
of a self-replication system. 320–21 4. Explain how the fossil record develops and how fossils are
dated relatively and absolutely. 322, 324 5. When did prokaryotes arise, and what are stromatolites? 324–25 6. When and how might the eukaryotic cell have arisen? 325 7. Describe the first multicellular animals found in the Ediacara
Hills in southern Australia. 326 8. Why might there be so many fossils from the Cambrian
period? 327 9. Which plants, invertebrates, and vertebrates were present on
land during the Carboniferous period? 328–29 10. Which type vertebrate was dominant during the Mesozoic era?
Which types began evolving at this time? 330 11. Which type of vertebrate underwent an adaptive radiation in
the Cenozoic era? 331 12. What is continental drift, and how is it related to plate tectonics?
Give examples to show how biogeography supports the occurrence of continental drift. 332
13. Identify five significant mass extinctions during the history of the Earth. What may have caused mass extinctions? 333
testing yourselfChoose the best answer for each question.
For questions 1–6, match the statements with events in the key. Answers may be used more than once.
KEY:
a. early Earthb. monomers evolvec. polymers evolved. protocell evolvese. self-replication system evolves
1. The heat of the sun could have caused amino acids to form proteinoids.
2. In a liquid environment, phospholipid molecules automatically form a membrane.
3. As the Earth cooled, water vapor condensed, and subsequent rain produced the oceans.
4. Miller’s experiment shows that under the right conditions, inorganic chemicals can react to form small organic molecules.
5. Some investigators believe that RNA was the first nucleic acid to evolve.
6. An abiotic synthesis may have occurred at hydrothermal vents. 7. Which of these did Stanley Miller place in the experimental
system to show that organic monomers could have arisen from inorganic molecules on the early Earth?a. microspheresb. purines and pyrimidinesc. early atmospheric gasesd. only RNAe. All of these are correct.
8. Which of these is not a place where polymers found in today’s cells may have arisen?a. at hydrothermal ventsb. on rocks beside the seac. in clayd. in the atmospheree. Both b and c are correct.
9. Which of these is the chief reason the protocell was probably a fermenter?a. The protocell didn’t have any enzymes.b. The atmosphere didn’t have any oxygen.c. Fermentation provides the most energy.d. There was no ATP yet.e. All of these are correct.
10. Liposomes (lipid droplets) are significant because they show thata. the first plasma membrane contained protein.b. a plasma membrane could have easily evolved.c. a biological evolution produced the first cell.d. there was water on the early Earth.e. the protocell had organelles.
11. Evolution of the DNA RNA protein system was a milestone because the protocell could nowa. be a heterotrophic fermenter.b. pass on genetic information.c. use energy to grow.d. take in preformed molecules.e. All of these are correct.
12. Fossilsa. are the remains and traces of past life.b. can be dated absolutely according to their location in strata.c. are usually found embedded in sedimentary rock.d. have been found for all types of animals except humans. e. Both a and c are correct.
13. Which of these events did not occur during the Precambrian? a. evolution of the prokaryotic cellb. evolution of the eukaryotic cellc. evolution of multicellularityd. evolution of the first animalse. All of these occurred during the Precambrian.
14. The organisms with the longest evolutionary history area. prokaryotes that left no fossil record. b. eukaryotes that left a fossil record.c. prokaryotes that are still evolving today.d. animals that had a shell.
For questions 15–19, match the phrases with divisions of geologic time in the key. Answers may be used more than once.
KEY:
a. Cenozoic erab. Mesozoic erac. Paleozoic erad. Precambrian time
15. dinosaur diversity, evolution of birds and mammals
16. contains the Carboniferous period
17. prokaryotes abound; eukaryotes evolve and become multicellular
18. mammalian diversification
19. invasion of land
mad2543X_ch18_317-336.indd 335mad2543X_ch18_317-336.indd 335 11/18/08 2:31:39 PM11/18/08 2:31:39 PM

336 PART II I EVOLUTION
20. Which of these occurred during the Carboniferous period? a. Dinosaurs evolved twice and became huge.b. Human evolution began.c. The great swamp forests contained insects and amphibians.d. Prokaryotes evolved. e. All of these are correct.
21. Continental drift helps explaina. mass extinctions.b. the distribution of fossils on the Earth.c. geological upheavals such as earthquakes.d. climatic changes. e. All of these are correct.
22. Which of these pairs is mismatched?a. Mesozoic—cycads and dinosaursb. Cenozoic—grasses and humans c. Paleozoic—rise of prokaryotes and unicellular eukaryotesd. Cambrian—marine organisms with external skeletonse. Precambrian—origin of the cell at hydrothermal vents
23. Complete the following listings using these phrases: O2 accumulates in atmosphere, Ediacaran animals, oldest known fossils, Cambrian animals, protists diversify, oldest eukaryotic fossils
2.1 BYA a. 1.0 BYA d. 2.7 BYA b. 630 MYA e. 3.5 BYA c. 542 MYA f. 4.6 BYA formation of the
Earth
24. The protocell is hypothesized to have had a membrane boundary as do and .
25. Once there was a flow of information from DNA to RNA to protein, the protocell became a cell, and biological evolution began.
26. The evolution of prokaryotes caused oxygen to enter the atmosphere.
27. Primitive vascular plants and amphibians were large and abundant during the period.
28. The mammals diversified and human evolution began during the era.
29. Mass extinctions seem to be due to climatic changes that occur after a bombards the Earth, or after the continents into a new configuration.
30. Which statement is not correct?a. The geologic timescale divides the history of Earth into eras,
then periods, and then epochs.b. Eras span the least amount of time and epochs have the
longest time frames.
c. Only the periods of the Cenozoic era are divided into epochs, meaning that more attention is given to the evolution of primates and flowering plants than to the earlier evolving organisms.
d. Modern civilization is given its own epoch, despite the fact that humans have only been around about 0.4% of the history of life.
e. All of these are correct. 31. Which statement is not correct?
a. The geologic timescale shows that evolution has been a series of events leading from the first cells to humans.
b. The geologic timescale shows all the facets, twists, and turns of the history of life.
c. Timewise, the events at the bottom of the timescale would be in a lower strata than the events that occur at the top of the timescale.
d. Humans were present and, therefore, our ancestors had first-hand knowledge about the events that occurred during the history of the Earth.
e. Both a and d are incorrect. 32. Which statement is not correct? The tree of life shows that
a. endosymbiotic events can account for at least some of the organelles in a eukaryotic cell.
b. evolution proceeds from the simple to the complex.c. both plants and animals can trace their ancestry to the
protists.d. humans hold a special place in the evolution of animals.e. the prokaryotic cell preceded the eukaryotic cell.f. All of these are correct.
thinking scientifically 1. You were asked to supply an evolutionary tree of life and decided
to use Figure 18.7. How is this tree consistent with evolutionary principles?
2. Explain the occurrence of living fossils, such as horseshoe crabs, that closely resemble their ancestors known from the fossil record.
Biology websiteThe companion website for Biology provides a wealth of information organized and integrated by chapter. You will find practice tests, animations, videos, and much more that will complement your learning and understanding of general biology.
http://www.mhhe.com/maderbiology10
mad2543X_ch18_317-336.indd 336mad2543X_ch18_317-336.indd 336 11/18/08 2:31:39 PM11/18/08 2:31:39 PM
www.ebook3000.com
337 337
19.1 SYSTEMATICS■ Systematists use particularly fossil
record data, morphological data, and, increasingly, molecular data to determine evolutionary relationships. 338
■ Linnaeus contributed to both taxonomy (the naming of organisms) and classification (placing species in the proper categories). 338–39
■ Classification usually involves the assignment of species to a genus, family, order, class, phylum, kingdom, and domain (the largest classification category). 340
19.2 PHYLOGENETIC TREES■ Linnean classification has been modified
to accommodate the concept of evolution, and it is possible to use classification categories to depict a phylogenetic tree. 341
■ Cladistics uses shared derived traits to construct phylogenetic trees, and a strict adherence to monophyletic grouping to distinguish one clade from another. 342–44
■ How Linnean classification can be modified to accommodate the principles of cladistics has not as yet been determined. 344–46
19.3 THE THREE-DOMAIN SYSTEM■ The three-domain system has been
adopted today. It recognizes three domains: Bacteria, Archaea, and Eukarya. The domain Eukarya contains the protists, fungi, plants, and animals. 348–50
c o n c e p t s
19
337
Systematics and Phylogeny
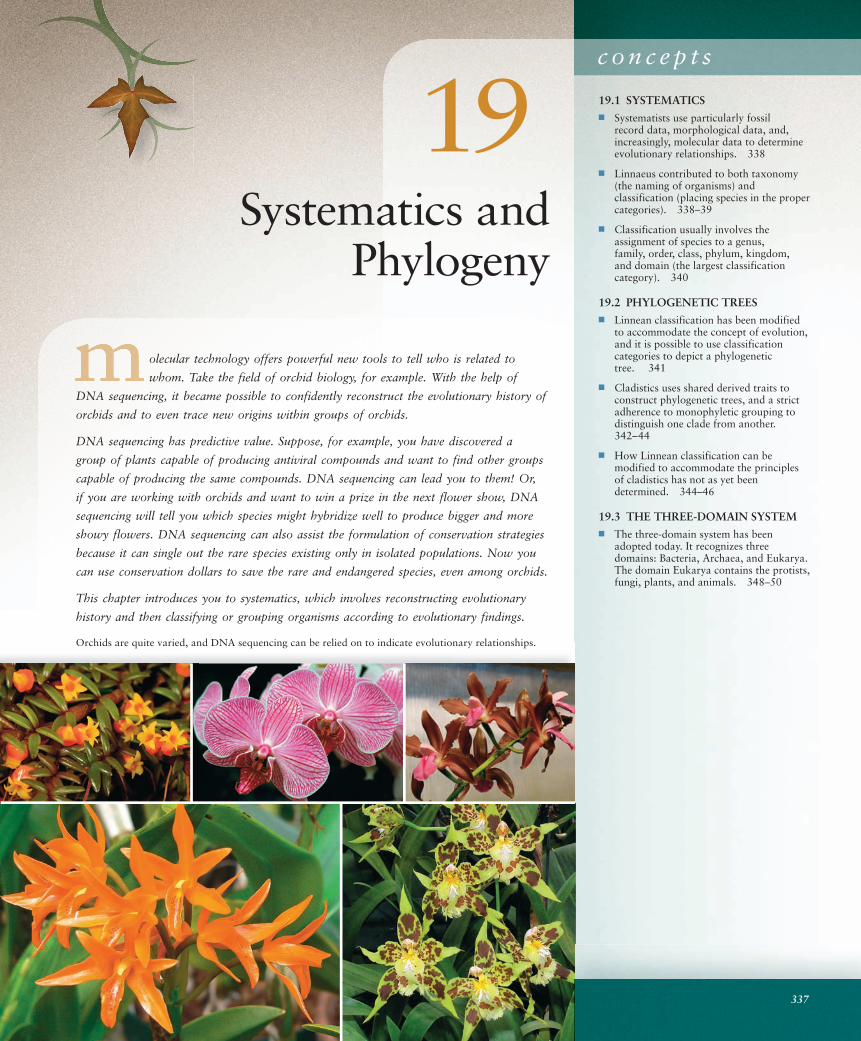
olecular technology offers powerful new tools to tell who is related to
whom. Take the field of orchid biology, for example. With the help of
DNA sequencing, it became possible to confidently reconstruct the evolutionary history of
orchids and to even trace new origins within groups of orchids.
DNA sequencing has predictive value. Suppose, for example, you have discovered a
group of plants capable of producing antiviral compounds and want to find other groups
capable of producing the same compounds. DNA sequencing can lead you to them! Or,
if you are working with orchids and want to win a prize in the next flower show, DNA
sequencing will tell you which species might hybridize well to produce bigger and more
showy flowers. DNA sequencing can also assist the formulation of conservation strategies
because it can single out the rare species existing only in isolated populations. Now you
can use conservation dollars to save the rare and endangered species, even among orchids.
This chapter introduces you to systematics, which involves reconstructing evolutionary
history and then classifying or grouping organisms according to evolutionary findings.
Orchids are quite varied, and DNA sequencing can be relied on to indicate evolutionary relationships.
mad2543X_ch19_337-353.indd 337mad2543X_ch19_337-353.indd 337 11/18/08 3:32:48 PM11/18/08 3:32:48 PM
338 PART II I EVOLUTION
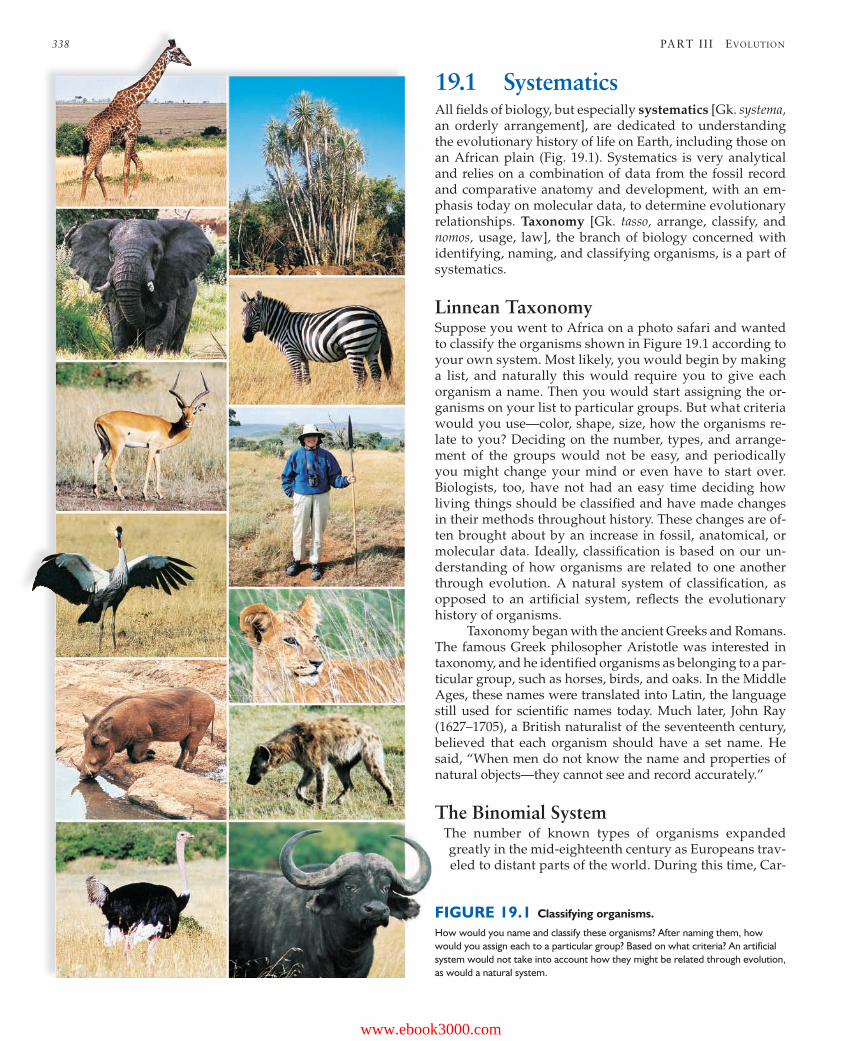
19.1 SystematicsAll fi elds of biology, but especially systematics [Gk. systema, an orderly arrangement], are dedicated to understanding the evolutionary history of life on Earth, including those on an African plain (Fig. 19.1). Systematics is very analytical and relies on a combination of data from the fossil record and comparative anatomy and development, with an em-phasis today on molecular data, to determine evolutionary relationships. Taxonomy [Gk. tasso, arrange, classify, and nomos, usage, law], the branch of biology concerned with identifying, naming, and classifying organisms, is a part of systematics.
Linnean TaxonomySuppose you went to Africa on a photo safari and wanted to classify the organisms shown in Figure 19.1 according to your own system. Most likely, you would begin by making a list, and naturally this would require you to give each organism a name. Then you would start assigning the or-ganisms on your list to particular groups. But what criteria would you use—color, shape, size, how the organisms re-late to you? Deciding on the number, types, and arrange-ment of the groups would not be easy, and periodically you might change your mind or even have to start over. Biologists, too, have not had an easy time deciding how living things should be classifi ed and have made changes in their methods throughout history. These changes are of-ten brought about by an increase in fossil, anatomical, or molecular data. Ideally, classifi cation is based on our un-derstanding of how organisms are related to one another through evolution. A natural system of classifi cation, as opposed to an artifi cial system, refl ects the evolutionary history of organisms. Taxonomy began with the ancient Greeks and Romans. The famous Greek philosopher Aris totle was interested in taxonomy, and he identifi ed organisms as belonging to a par-ticular group, such as horses, birds, and oaks. In the Middle Ages, these names were translated into Latin, the language still used for scientifi c names today. Much later, John Ray (1627–1705), a British naturalist of the seventeenth century, believed that each organism should have a set name. He said, “When men do not know the name and properties of natural objects—they cannot see and record accurately.”
The Binomial SystemThe number of known types of organisms expanded greatly in the mid-eighteenth century as Europeans trav-eled to distant parts of the world. During this time, Car-
FIGURE 19.1 Classifying organisms.
How would you name and classify these organisms? After naming them, how would you assign each to a particular group? Based on what criteria? An artificial system would not take into account how they might be related through evolution, as would a natural system.
mad2543X_ch19_337-353.indd 338mad2543X_ch19_337-353.indd 338 11/18/08 3:33:14 PM11/18/08 3:33:14 PM
www.ebook3000.com

c. Lilium bulbiferumb. Lilium canadense
a.
CHAPTER 19 SYSTEMATICS AND PHYLOGENY 339
olus Linnaeus (1707–78) developed binomial nomencla-ture, by which each species receives a two-part name (Fig. 19.2). For example, Lilium bulbiferum and Lilium canadense are two different species of lily. The fi rst word, Lilium, is the genus (pl., genera), a classifi cation category that can contain many species. The second word, the specifi c epi-thet, refers to one species within that genus. The specifi c epithet sometimes tells us something descriptive about the organism. Notice that the scientifi c name is in italics; the genus is capitalized, while the specifi c epithet is not. Both names are separately underlined when handwritten. The species is designated by the full binomial name—in this case, either Lilium bulbiferum or Lilium canadense. The spe-cifi c epithet alone gives no clue as to species—just as the house number alone without the street name gives no clue as to which house is specifi ed. The genus name can be used alone, however, to refer to a group of related species. Also, the genus can be abbreviated to a single letter if used with the specifi c epithet (e.g., L. bulbiferum) and if the full name has been given previously. Scientific names are derived in a number of ways. Some scientific names are descriptive in nature, for ex-ample, Acer rubrum for the red maple. Other scientific names may include geographic descriptions such as Alligator mississippiensis for the American alligator. Sci-entific names can also include eponyms (named after someone), such as the owl mite Strigophilus garylarsonii (named after the cartoonist). Many scientific names are derived from mythical characters, such as Iris versicolor, named for Iris, the goddess of the rainbow. Some scien-tific names reflect a humorous slant, such as Ba humbugi for a species of snail. Why do organisms need scientific names? And why do scientists use Latin, rather than common names, to describe organisms? There are several reasons. First, a common name will vary from country to country because different countries use different languages. Second, even
people who speak the same language sometimes use dif-ferent common names to describe the same organism. For example, bowfin, grindle, choupique, and cypress trout describe the same common fish, Amia calva. Fur-thermore, between countries, the same common name is sometimes given to different organisms. A “robin” in England is very different from a “robin” in the United States, for example. Latin, on the other hand, is a univer-sal language that not too long ago was well known by most scholars, many of whom were physicians or cler-ics. When scientists throughout the world use the same scientific binomial name, they know they are speaking of the same organism. The Linnean Society rules on the appropriateness of the binomial name for each species in the world. Of the estimated 3–30 million species now living on Earth, a million species of animals and a half million species of plants and microorganisms have been named. We are fur-ther along on some groups than others; we may have fi n-ished the birds, but there may be hundreds of thousands of unnamed insects. The task of identifying and naming the species of the world is a daunting one. A new fast and effi cient way of identifying species that is based on their DNA is described in the Science Focus on page 347. This method has been called into question by those who feel that nucleotide base differences in a single gene may not yield enough data to distinguish two closely related spe-cies or to recognize when hybridization has occurred. But the method was found to be satisfactory for the identifica-tion of mosquito species in India.
Linnaean Classification CategoriesClassifi cation, which begins when an organism is named, includes taxonomy, since genus and species are two clas-sifi cation categories. In the context of classifi cation, a spe-cies is a taxonomic category below the rank of genus. A
FIGURE 19.2 Carolus Linnaeus.
a. Linnaeus was the father of taxonomy and gave us the binomial system of naming and classifying organisms. His original name was Karl von Linne, but he later latinized it because of his fascination with scientific names. Linnaeus was particularly interested in classifying plants. b, c. Each of these two lilies are species in the same genus, Lilium.
mad2543X_ch19_337-353.indd 339mad2543X_ch19_337-353.indd 339 11/18/08 3:33:18 PM11/18/08 3:33:18 PM
DOMAINS
Eukarya
KINGDOMS
Plantae
PHYLA
Anthophyta
Eudicotyledones
CLASSES
Vitales
ORDERS
Vitaceae
FAMILIES
Parthenocissus
GENERA
P. quinquefolia
SPECIES
Parthenocissus quinquefoliaVirginia creeper (five-leaf ivy)
340 PART II I EVOLUTION
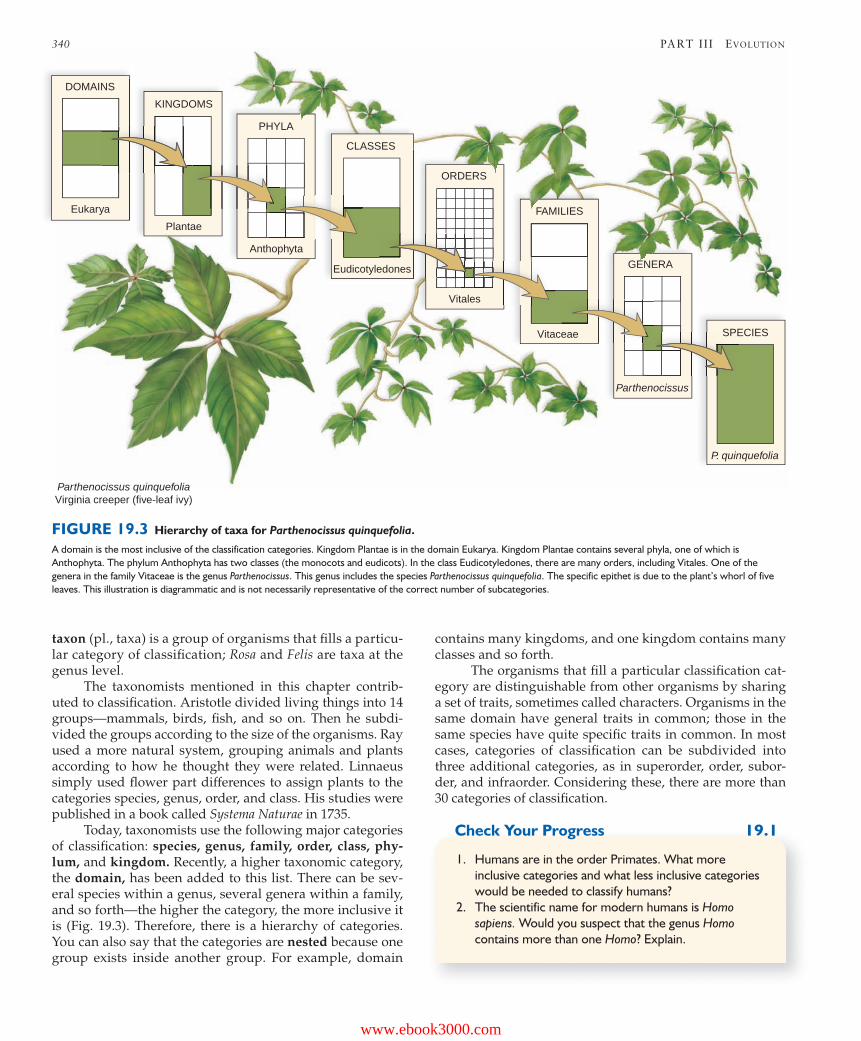
taxon (pl., taxa) is a group of organisms that fi lls a particu-lar category of classifi cation; Rosa and Felis are taxa at the genus level. The taxonomists mentioned in this chapter contrib-uted to classifi cation. Aristotle divided living things into 14 groups—mammals, birds, fi sh, and so on. Then he subdi-vided the groups according to the size of the organisms. Ray used a more natural system, grouping animals and plants according to how he thought they were related. Linnaeus simply used fl ower part differences to assign plants to the categories species, genus, order, and class. His studies were published in a book called Systema Naturae in 1735. Today, taxonomists use the following major categories of classifi cation: species, genus, family, order, class, phy-lum, and kingdom. Recently, a higher taxonomic category, the domain, has been added to this list. There can be sev-eral species within a genus, several genera within a family, and so forth—the higher the category, the more inclusive it is (Fig. 19.3). Therefore, there is a hierarchy of categories. You can also say that the categories are nested because one group exists inside another group. For example, domain
contains many kingdoms, and one kingdom contains many classes and so forth. The organisms that fi ll a particular classifi cation cat-egory are distinguishable from other organisms by sharing a set of traits, sometimes called characters. Organisms in the same domain have general traits in common; those in the same species have quite specifi c traits in common. In most cases, categories of classifi cation can be subdivided into three additional categories, as in superorder, order, subor-der, and infraorder. Considering these, there are more than 30 categories of classifi cation.
Check Your Progress 19.1
1. Humans are in the order Primates. What more inclusive categories and what less inclusive categories would be needed to classify humans?
2. The scientific name for modern humans is Homo sapiens. Would you suspect that the genus Homo contains more than one Homo? Explain.
FIGURE 19.3 Hierarchy of taxa for Parthenocissus quinquefolia.
A domain is the most inclusive of the classification categories. Kingdom Plantae is in the domain Eukarya. Kingdom Plantae contains several phyla, one of which is Anthophyta. The phylum Anthophyta has two classes (the monocots and eudicots). In the class Eudicotyledones, there are many orders, including Vitales. One of the genera in the family Vitaceae is the genus Parthenocissus. This genus includes the species Parthenocissus quinquefolia. The specific epithet is due to the plant’s whorl of five leaves. This illustration is diagrammatic and is not necessarily representative of the correct number of subcategories.
mad2543X_ch19_337-353.indd 340mad2543X_ch19_337-353.indd 340 11/18/08 3:33:21 PM11/18/08 3:33:21 PM
www.ebook3000.com

common ancestor(placental mammal)
reindeer monkeys apes
monkeys apes
commonancestor(mobile limbs)
Aepycerosmelampus(impala)
Oryx gazella(oryx)
Cervus elaphus
(red deer)
Rangifertarandus(reindeer)
Aepyceros Oryx Cervus Rangifer
CervidaeBovidae
Artiodactyla
Gen
us
Sp
ecie
sFa
mily
Ord
er
CHAPTER 19 SYSTEMATICS AND PHYLOGENY 341
19.2 Phylogenetic TreesOne goal of systematics is to determine phylogeny [Gk. phyle, tribe; L. genitus, producing], a depiction of evolution-ary history called a phylogenetic tree or an evolutionary tree. The tree shows the common ancestors (an ancestor to two or more lines of descent) and branches coming off from the common ancestor. Each branch in a tree is a divergence that gives rise to two or more new groups. For example, this portion of an evolutionary tree says that monkeys and apes share a common primate ancestor:
Divergence is presumed because monkeys and apes have their own derived traits (traits not seen previously). For example, skeletal differences allow an ape to swing from limb to limb of a tree while monkeys run along the tops of tree branches. The common primate ancestor to both monkeys and apes has traits that are shared by the ancestor and also monkeys and apes. For example, the common primate ances-tor had mobile limbs. A phylogenetic tree has many branch points, and they show that it is possible to trace the ancestry of a group of or-ganisms back farther and farther in the past. For example, reindeer, monkeys, and apes all give birth to live young be-cause they all have a common ancestor that was a placental mammal. This ancestor was also a quadruped, as they all are:
Because classifi cation is hierarchical, it is possible to use classi-fi cation categories to construct a phylogenetic tree. A species is most closely related to other species in the same genus and then is related, but less so, to genera in the same family, and so forth, from order to class to phylum to kingdom. When we say that two species (or genera, families, etc.) are closely related, we mean that they share a recent common ancestor. For example, all the ani-mals in Figure 19.4 are related because we can trace their ancestry back to the same order. The animals in the order Artiodactyla all have even-toed hoofs. Animals in the family Cervidae have solid horns, called antlers, but they are highly branched in red deer (genus Cervus) and palmate (having the shape of a hand) in reindeer (genus Rangifer). In contrast, animals in the family Bovi-dae have hollow horns and, unlike the Cervidae, both males and females have horns, although they are smaller in females.
FIGURE 19.4 Classification and phylogeny.
The classification and phylogenetic tree for a group of organisms are ideally constructed to reflect their evolutionary history. A species is most closely related to other species in the same genus, more distantly related to species in other genera of the same family, and so forth, on through order, class, phylum, kingdom, and domain.
mad2543X_ch19_337-353.indd 341mad2543X_ch19_337-353.indd 341 11/18/08 3:33:24 PM11/18/08 3:33:24 PM

chim
panz
ee
dog
finch
croc
odile
lizar
d
frog
tuna
lanc
elet
(ou
tgro
up)
Species
Trai
ts
mammary glands
gizzard
epidermal scales
amniotic egg
four limbs
vertebrae
notochord inembryo
hair
ingroup
342 PART II I EVOLUTION
Cladistic Phylogenetic TreesBiologists are always seeking new and improved ways to discover the evolutionary history of life on Earth. Tracing evolutionary history would be easy if similarities alone could be used to trace phylogeny, but this is not the case because evolution is quite variable, sometimes even reversing to a former state. For example, some vertebrates have teeth and some do not, and therefore we need a methodology that will tell us which is the ancestral state—teeth or no teeth. In this instance, the fossil record tells us that possession of teeth is an early characteristic of vertebrates. But if the fossil is un-available, we need some other method. The most commonly used method to determine evolutionary relationships when a complete fossil record is not available is called cladistics.
Methodology of CladisticsCladistics, which is based on the work of Willi Hennig, is a way to trace evolutionary history of a group by using shared traits, derived from a common ancestor, to deter-mine which species are most closely related. These traits are then used to construct phylogenetic trees called clado-grams. A cladogram [Gk. klados, branch, stem, and gramma, picture] depicts the evolutionary history (phylogeny) of a group based on the available data. The fi rst step when constructing a cladogram is to draw up a table that summarizes the derived traits of the species being compared (Fig. 19.5). At least one, but pref-erably several species, is considered an outgroup. The out-group is not part of the study group called the ingroup. In Figure 19.5, lancelets are the outgroup because unlike the species in the ingroup they are not vertebrates. Any trait found both in the outgroup and the ingroup is a shared ancestral trait, presumed to have been present in a com-mon ancestor to both the outgroup and ingroup. Ancestral traits are not used in the cladogram, so why do we need an outgroup? An outgroup tells us which traits are shared derived traits, also called synapomorphies [Gk. syn, to-gether with, apo, away from, and morph, shape]. Any trait not found in the outgroup is a shared derived trait. We could go to the fossil record to discover which traits are shared derived traits, but the fossil record is rarely com-plete enough to use exclusively. All the synapomorphies listed in Figure 19.5 indi-cate evolutionary relationships among the members of the ingroup will be used to construct the cladogram (Fig. 19.6). A cladogram contains several clades; each clade includes a common ancestor and all its descendants that share one or more synapomorphies. These synapomor-phies are differences that distinguish the clade from the other clades in the cladogram. The common ancestors in our cladogram are indicated by white circles. Because the outgroup does not have vertebrae and all the species in the ingroup do have vertebrae, we know that the first common ancestor for the ingroup was a vertebrate—it had vertebrae. All the ingroup species are in the first clade because they all have vertebrae. The next clade in-cludes all the species that have four limbs, and the mem-
bers of the next clade all had an amniotic egg. The com-mon ancestor for only the lizard, crocodile, and bird had epidermal scales. The common ancestor for crocodiles and birds had a gizzard. Feathers are not listed in Fig-ure 19.5 because only birds have feathers. The last clade in our cladogram includes the dog and human because they have a common ancestor, which had both hair and mammary glands. Similar to feathers, the canine teeth of the dog and the enlarged brain of the human are not in Figure 19.5 because they are not shared by any other species in our ingroup. A cladogram is objective because it lists the data that are used to construct the cladogram. Cladists typically use many more traits than appear in our simplifi ed clado-gram. They also feel that a cladogram is a hypothesis that can be tested and either corroborated or refuted on the basis of additional data. The terms you need to learn to understand cladistics are given in Table 19.1.
FIGURE 19.5 Constructing a cladogram: the data.
This lancelet is in the outgroup, and all the other species listed are in an ingroup (study group). The species in the ingroup have shared derived traits (synapomorphies), derived because a lancelet does not have the trait, and shared because certain species in the study group do have them. All the species in the ingroup have vertebrae, all but a fish have four limbs, and so forth. The shared derived traits indicate which species are distantly related and which are closely related. For example, a human is more distantly related to a fish, with which it shares only one trait (vertebrae), than an iguana, with which it shares three traits (vertebrae, four limbs, amniotic egg).
mad2543X_ch19_337-353.indd 342mad2543X_ch19_337-353.indd 342 11/18/08 3:33:33 PM11/18/08 3:33:33 PM
www.ebook3000.com

vertebrae
four limbs
amnioticegg
feathers
gizzard
hair, mammary glands
long canine teeth
enlarged brain
epidermalscales
commonancestor
chimpanzee
tuna
frog
lizard
crocodile
finch
terrier
lancelet (outgroup)
common ancestor
CHAPTER 19 SYSTEMATICS AND PHYLOGENY 343
How to Judge a CladogramIn order to tell if a cladogram has produced the best hypoth-esis, cladists are often guided by the principle of parsimony, which states that the minimum number of assumptions is
the most logical. That is, they construct the cladogram that leaves the fewest number of shared derived characters un-explained or that minimizes the number of evolutionary changes. The rule of parsimony works best for traits that evolve at a slower rate than the frequency of speciation events. A problem with parsimony can arise when DNA se-quencing is used to help construct cladograms. Mutations, especially in noncoding DNA, can be quite high, and, if so, base charges are not reliable data to distinguish clades. For this reason, some systematists have begun using statisti-cal tools and not parsimony to help construct phylogenetic trees. This new branch of systematics is called statistical phylogenetics. In any case, the reliability of a cladogram is dependent on the knowledge and skill of the particu-lar investigator gathering the data and doing the character analysis.
How to Judge a CladeJust like Linnean taxonomic categories, clades are often nested inside other clades. For example, all the clades in our cladogram are inside the fi rst one because all the species have vertebrae. Notice also that crocodiles and birds have a common ancestor with a gizzard and, along with the liz-ard, are in a clade whose common ancestor had epidermal
FIGURE 19.6 Constructing a cladogram: the phylogenetic tree.
Based on the data shown in Figure 19.5, the ingroup in this phylogenetic tree has six clades. Each clade contains a common ancestor with derived traits that are shared by the members of the clade.
TABLE 19.1Terms Used in Cladistics
Outgroup Species that define(s) which study group trait is oldest
Ingroup Species that will be placed into clades in a cladogram
Ancestral trait Traits present in both the outgroup and the ingroup
Clade Evolutionary branch of a cladogram that contains a common ancestor and all its descendant species
Shared derived traits Traits that distinguish a particular clade
Monophyletic grouping Contains a single common ancestor and all its descendant species
Parsimony Results in the simplest cladogram possible
mad2543X_ch19_337-353.indd 343mad2543X_ch19_337-353.indd 343 11/18/08 3:33:34 PM11/18/08 3:33:34 PM

common ancestor
Monophyletic grouping: This group is a cladebecause it contains B, closest commonancestor, and all the descendants of B.
Paraphyletic grouping: This group is not a cladebecause it lacks F, also a descendant of thecommon ancestor B.
Polyphyletic grouping: This group is not a cladebecause it lacks A, the closest common ancestorto all the descendants.
A
B
C
D
E
F
H
I
G
A
B
C
D
E
F
H
I
G
A
B
C
D
E
F
H
I
G
dorsal temporalopening
orbit
lateral temporalopening
344 PART II I EVOLUTION
scales. This means that birds are closely related to crocodiles and should be classifi ed with them as well as with lizards! Birds, dinosaurs, lizards, snakes, and crocodilians can all trace their ancestry to amniotes called diapsids. Dinosaurs, as well as the other animals listed, have the skull openings of a diapsid:
Linnean classifi cation does not group birds with crocodiles nor with reptiles and, in doing so, has broken one of the rules of cladistics. Among the groupings shown in Figure 19.7, cla-distics only allows monophyletic groupings. A monophyletic group includes a common ancestor and all the descendants of that ancestor. A paraphyletic group contains a common ancestor and does not include all the descendants. A poly-phyletic group contains some of the descendants of more than one common ancestor and not all the common ancestors. Because the Linnean classifi cation system allows groupings other than those that are monophyletic, it is now being severely criticized by some biologists who show that Linnean classifi cation does not truly refl ect the evolutionary history of life on Earth. Biologists are presently trying to determine how Linnean classifi cation could be changed to refl ect our current understanding of phylogeny.
Check Your Progress 19.2A
1. How do you know how many clades your cladogram will have?
2. Why do cladists tell us that birds should be classified as reptiles?
Tracing PhylogenyFrom our discussion so far, it may seem as if systematists mainly rely on morphological data to discover evolutionary relationships between species. However, systematists also use fossil, developmental, behavioral, and molecular data to determine the correct sequence of common ancestors in any particular group of organisms.
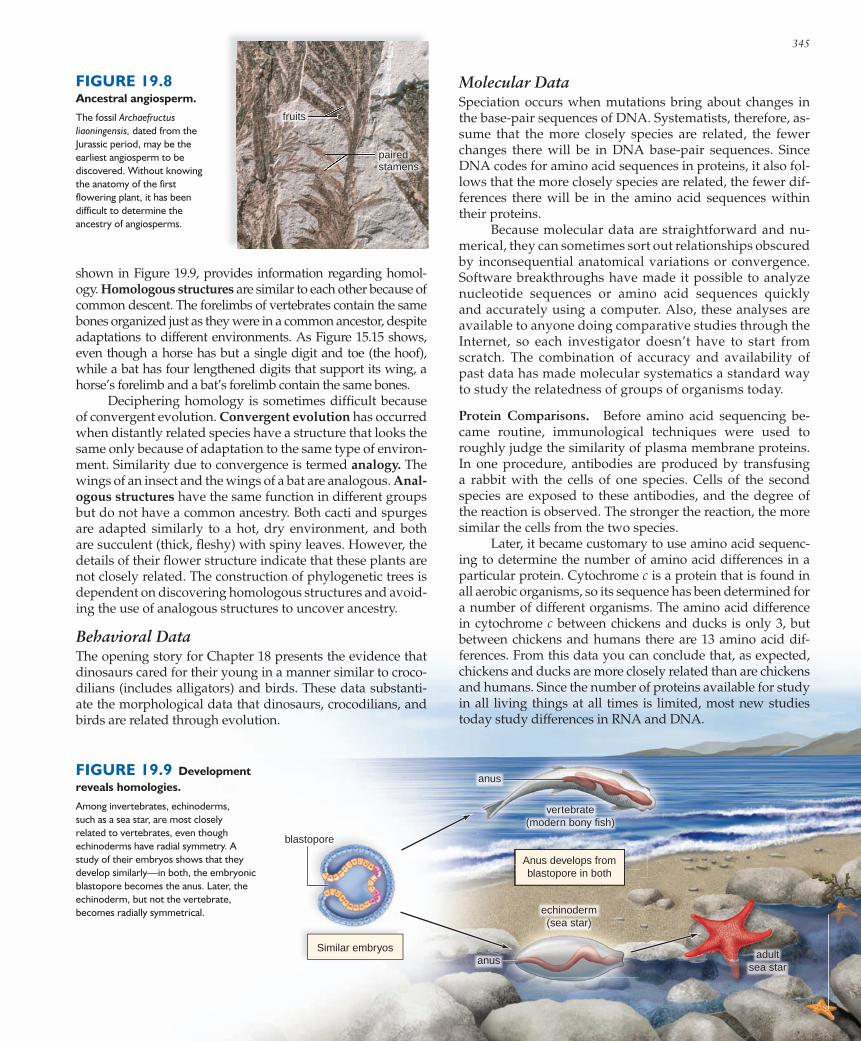
Fossil Record DataOne of the advantages of fossils is that they can be dated, but unfortunately it is not always possible to tell to which group, living or extinct, a fossil is related. For example, at present, paleontologists are discussing whether fossil turtles indi-cate that turtles are distantly or closely related to crocodiles. On the basis of his interpretation of fossil turtles, Olivier C. Rieppel of the Field Museum of Natural History in Chicago is challenging the conventional interpretation that turtles are ancestral (have traits seen in a common ancestor to all rep-tiles) and are not closely related to crocodiles, which evolved later. His interpretation is being supported by molecular data that show turtles and crocodiles are closely related. If the fossil record was more complete, there might be fewer controversies about the interpretation of fossils. One reason the fossil record is incomplete is that most fossils ex-ist as only harder body parts, such as bones and teeth. Soft parts are usually eaten or decayed before they have a chance to be buried. This may be one reason it has been diffi cult to discover when angiosperms (fl owering plants) fi rst evolved. A Jurassic fossil recently found, if accepted as an angiosperm by most botanists, may help pin down the date (Fig. 19.8). As paleontologists continue to explore the world, the sometimes stingy fossil record will reveal some of its secrets.
Morphological DataHomology [Gk. homologos, agreeing, corresponding] is structural similarity that stems from having a common ancestor. Compara-tive anatomy, including developmental evidence such as that
FIGURE 19.7 Different groupings of species.
A clade in a cladogram must be monophyletic. Linnean classification is criticized for allowing the use of groupings that are not monophyletic.
mad2543X_ch19_337-353.indd 344mad2543X_ch19_337-353.indd 344 11/18/08 3:33:34 PM11/18/08 3:33:34 PM
www.ebook3000.com
fruits
pairedstamens
vertebrate(modern bony fish)
anus
anus
echinoderm(sea star)
Anus develops fromblastopore in both
adultsea star
Similar embryos
blastopore
shown in Figure 19.9, provides information regarding homol-ogy. Homologous structures are similar to each other because of common descent. The forelimbs of vertebrates contain the same bones organized just as they were in a common ancestor, despite adaptations to different environments. As Figure 15.15 shows, even though a horse has but a single digit and toe (the hoof), while a bat has four lengthened digits that support its wing, a horse’s forelimb and a bat’s forelimb contain the same bones. Deciphering homology is sometimes diffi cult because of convergent evolution. Convergent evolution has occurred when distantly related species have a structure that looks the same only because of adaptation to the same type of environ-ment. Similarity due to convergence is termed analogy. The wings of an insect and the wings of a bat are analogous. Anal-ogous structures have the same function in different groups but do not have a common ancestry. Both cacti and spurges are adapted similarly to a hot, dry environment, and both are succulent (thick, fl eshy) with spiny leaves. However, the details of their fl ower structure indicate that these plants are not closely related. The construction of phylogenetic trees is dependent on discovering homologous structures and avoid-ing the use of analogous structures to uncover ancestry.
Behavioral DataThe opening story for Chapter 18 presents the evidence that dinosaurs cared for their young in a manner similar to croco-dilians (includes alligators) and birds. These data substanti-ate the morphological data that dinosaurs, crocodilians, and birds are related through evolution.
Molecular DataSpeciation occurs when mutations bring about changes in the base-pair sequences of DNA. Systematists, therefore, as-sume that the more closely species are related, the fewer changes there will be in DNA base-pair sequences. Since DNA codes for amino acid sequences in proteins, it also fol-lows that the more closely species are related, the fewer dif-ferences there will be in the amino acid sequences within their proteins. Because molecular data are straightforward and nu-merical, they can sometimes sort out relationships obscured by inconsequential anatomical variations or convergence. Software breakthroughs have made it possible to analyze nucleotide sequences or amino acid sequences quickly and accurately using a computer. Also, these analyses are available to anyone doing comparative studies through the Internet, so each investigator doesn’t have to start from scratch. The combination of accuracy and availability of past data has made molecular systematics a standard way to study the relatedness of groups of organisms today.
Protein Comparisons. Before amino acid sequencing be-came routine, immunological techniques were used to roughly judge the similarity of plasma membrane proteins. In one procedure, antibodies are produced by transfusing a rabbit with the cells of one species. Cells of the second species are exposed to these antibodies, and the degree of the reaction is observed. The stronger the reaction, the more similar the cells from the two species. Later, it became customary to use amino acid sequenc-ing to determine the number of amino acid differences in a particular protein. Cytochrome c is a protein that is found in all aerobic organisms, so its sequence has been determined for a number of different organisms. The amino acid difference in cytochrome c between chickens and ducks is only 3, but between chickens and humans there are 13 amino acid dif-ferences. From this data you can conclude that, as expected, chickens and ducks are more closely related than are chickens and humans. Since the number of proteins available for study in all living things at all times is limited, most new studies today study differences in RNA and DNA.
FIGURE 19.9 Development reveals homologies.
Among invertebrates, echinoderms, such as a sea star, are most closely related to vertebrates, even though echinoderms have radial symmetry. A study of their embryos shows that they develop similarly—in both, the embryonic blastopore becomes the anus. Later, the echinoderm, but not the vertebrate, becomes radially symmetrical.
FIGURE 19.8 Ancestral angiosperm.
The fossil Archaefructus liaoningensis, dated from the Jurassic period, may be the earliest angiosperm to be discovered. Without knowing the anatomy of the first flowering plant, it has been difficult to determine the ancestry of angiosperms.
345
mad2543X_ch19_337-353.indd 345mad2543X_ch19_337-353.indd 345 12/16/08 1:39:56 PM12/16/08 1:39:56 PM

PRESENT
human
commonchimpanzee
white-handedgibbon
rhesus monkey
greenmonkey
capuchinmonkey
lesserbushbaby
Million years ago (MYA)
Increased difference in DNA
102030405060
346 PART II I EVOLUTION
DNA and RNA Comparisons. In the next part of this chapter, we will mention that a study of RNA differences be-tween prokaryotes and eukaryotes resulted in an acceptance of the three-domain system of classifi cation. In the opening story for this chapter, we discuss how a study of DNA differ-ences has helped make sense of the structural data regard-ing the evolutionary history of orchids. The same RNA and DNA comparisons can be used in other ways, aside from deciphering evolutionary relationships. For example, they can be used by conservationists to determine that a species is rare and endangered. DNA differences can substantiate data, help trace the course of macroevolution, and fi ll in the gaps of the fossil record. The phylogenetic tree of primates shown in Figure 19.10 is based on the fossil record and on DNA differences. No doubt we share a recent common ancestor with chim-panzees, and therefore according to the rules of cladistics, should be classifi ed with them as we now are to the level of subfamily (see Fig. 30.4). Mitochondrial DNA (mtDNA) mutates ten times faster than nuclear DNA. Therefore, when determining the phylog-eny of closely related species, investigators often choose to sequence mtDNA instead of nuclear DNA. One such study concerned North American songbirds. It had long been sug-gested that these birds diverged into eastern and western subspecies due to retreating glaciers some 250,000–100,000 years ago. Sequencing of mtDNA allowed investigators to conclude that groups of North American songbirds diverged from one another an average of 2.5 million years ago (mya). Since the old hypothesis based on glaciation is apparently fl awed, a new hypothesis is required to explain why eastern and western subspecies arose among these songbirds.
Molecular Clocks. When nucleic acid changes are neu-tral (not tied to adaptation) and accumulate at a fairly con-stant rate, these changes can be used as a kind of molecu-lar clock to indicate relatedness and evolutionary time. The researchers doing comparative mtDNA sequencing used their data as a molecular clock when they equated a 5.1% nucleic acid difference among songbird subspe-cies to 2.5 mya . In Figure 19.10, the researchers used their DNA sequence data to suggest how long the different types of primates have been separate. The fossil record was used to calibrate the clock: When the fossil record for one divergence is known, it indicates how long it prob-ably takes for each nucleotide pair difference to occur. When the fossil record and molecular clock data agree, researchers have more confidence that the proposed phy-logenetic tree is correct.
Check Your Progress 19.2B
1. What type of evidence could you use to determine that the wing of an insect and the wing of a bat are analogous or are homologous?
2. What would you expect to find if you compared the DNA differences of a snake, bird, and monkey?
FIGURE 19.10 Molecular data.
The relationship of certain primate species based on a study of their genomes. The length of the branches indicates the relative number of nucleotide pair differences that were found between groups. These data, along with knowledge of the fossil record for one divergence, make it possible to suggest a date for the other divergences in the tree.
mad2543X_ch19_337-353.indd 346mad2543X_ch19_337-353.indd 346 11/18/08 3:33:38 PM11/18/08 3:33:38 PM
www.ebook3000.com

a. b.
CHAPTER 19 SYSTEMATICS AND PHYLOGENY 347
DNA Bar Coding of Life
T raditionally, taxonomists have often relied on anatomical data to tell spe-
cies apart. For example, differences in the type of spinning apparatus and the type of web have played a large role in distinguish-ing one spider from another (Fig. 19A). We can well imagine that if a mother wanted to know if certain spiders in the backyard were dangerous to her children, she might want a faster answer than could be provided by a traditional taxonomist at a university some distance away. Enter the Consortium for the Barcode of Life (CBOL), which proposes that any scien-tist, not just taxonomists, will be able to iden-tify a species with the flick of a handheld scan-ner. Just like the 11-digit Universal Product Code (UPC) used to identify products sold in a supermarket, the consortium believes that a sample of DNA should be able to identify any organism on Earth. The proposed scan-ner would tap into a bar-code database that contains the bar codes for all species so far identified on planet Earth. Also, a handheld DNA–bar-coding device is expected to pro-vide a fast and inexpensive way for a wide range of researchers, including biology stu-dents, to catalog any and all of the world’s
FIGURE 19A Identifying spiders.
Identifi cation of spiders at present depends in part on their type of spinning apparatus and the type of web they weave. The orb web of the garden spider Araneus diadematus (a) differs somewhat from (b) the orb web of the New Zealand spider Waitkera waitkerensis.
species that do not yet have a bar code. So far scientists have identified only about 1.5 million species out of a potential 30 million. And there is no central database that keeps track of the known species. The idea of using bar codes to identify spe-cies is not new, but Paul Hebert and his col-leagues at the University of Guelph in Canada are the first to suggest it would be possible to use the base sequence in DNA to develop a bar code for each living thing. The order of DNA’s nucleotides—A, T, C, and G—within a particular gene common to the organisms in each kingdom would fill the role taken by numbers in the UPC used in warehouses and stores. Hebert believes that the gene
• should contain no more than 650 nucleotides so that sequencing can be accomplished speedily with few mistakes;
• should be easy to extract from an organism’s complete genome;
• should have mutated to the degree that each species has its own sequence of bases but not so fast that the sequence differs greatly among individuals within the same species.
Hebert’s team decided that a mitochondrial gene known as cytochrome c oxidase sub-unit 1, or CO1, would be a suitable target gene in animals. (This gene codes for one of the carriers in the electron transport chain; see page 112.) Another researcher, John Kress, a plant taxonomist at the Smithsonian Institution in Washington, D.C., has devel-oped a potential method for bar coding plant species. The Consortium for the Barcode of Life is growing by leaps and bounds and now includes various biotech companies, various museums and universities, the U.S. Food and Drug Administration, and also the U.S. De-partment of Homeland Security. Hebert has received a $3 million grant from the Gordon and Betty Moore Foundation to start the Biodiversity Institute of Ontario, which will be housed on the University of Guelph campus, where he teaches. Speedy DNA bar coding would not only be a boon to ordinary citizens and taxonomists, but it would also benefit farmers who need to identify a pest attacking their crops, doctors who need to know the correct antivenin for snakebite victims, and college students who are expected to identify the plants, animals, and protists on an ecological field trip.
mad2543X_ch19_337-353.indd 347mad2543X_ch19_337-353.indd 347 11/18/08 3:33:41 PM11/18/08 3:33:41 PM
common ancestor
ARCHAEA BACTERIA
EUKARYA
animals
fungi
plants
cyanobacteria
heterotrophic bacteria
protists protists
348 PART II I EVOLUTION
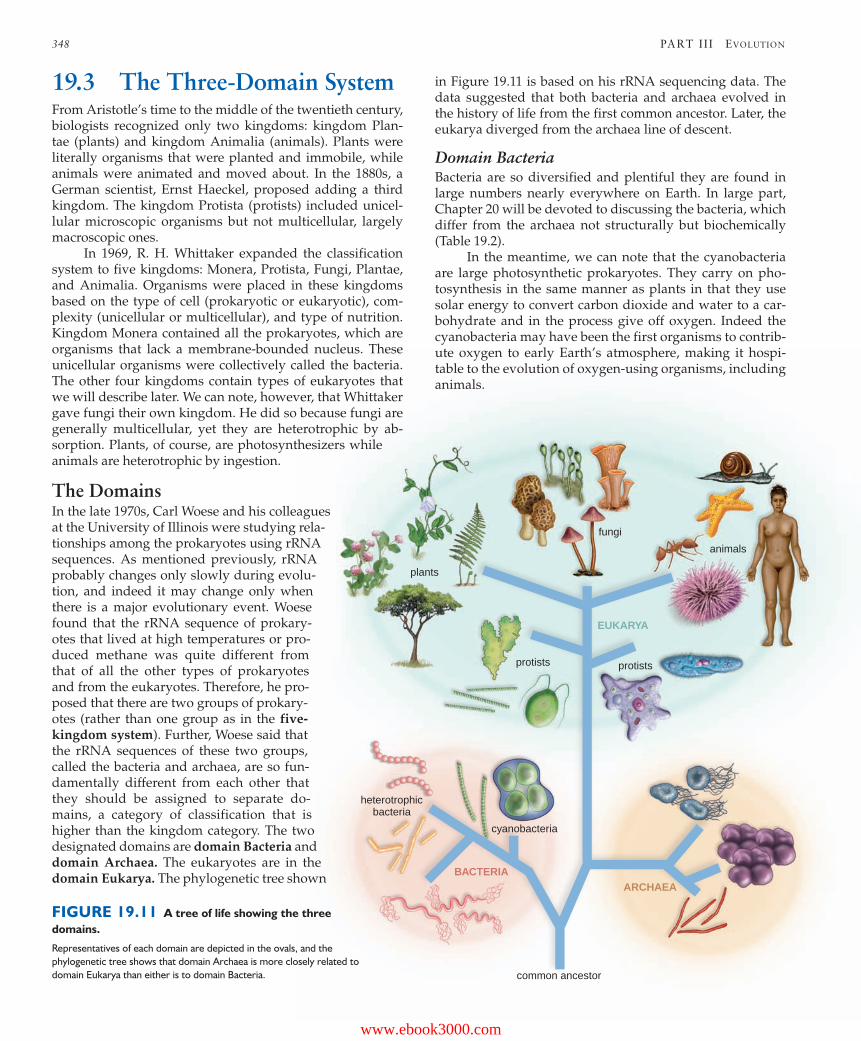
19.3 The Three-Domain SystemFrom Aristotle’s time to the middle of the twentieth century, biologists recognized only two kingdoms: kingdom Plan-tae (plants) and kingdom Animalia (animals). Plants were literally organisms that were planted and immobile, while animals were animated and moved about. In the 1880s, a German scientist, Ernst Haeckel, proposed adding a third kingdom. The kingdom Protista (protists) included unicel-lular microscopic organisms but not multicellular, largely macroscopic ones. In 1969, R. H. Whittaker expanded the classification system to five kingdoms: Monera, Protista, Fungi, Plantae, and Animalia. Organisms were placed in these kingdoms based on the type of cell (prokaryotic or eukaryotic), com-plexity (unicellular or multicellular), and type of nutrition. Kingdom Monera contained all the prokaryotes, which are organisms that lack a membrane-bounded nucleus. These unicellular organisms were collectively called the bacteria. The other four kingdoms contain types of eukaryotes that we will describe later. We can note, however, that Whittaker gave fungi their own kingdom. He did so because fungi are generally multicellular, yet they are heterotrophic by ab-sorption. Plants, of course, are photosynthesizers while animals are heterotrophic by ingestion.
The DomainsIn the late 1970s, Carl Woese and his colleagues at the University of Illinois were studying rela-tionships among the prokaryotes using rRNA sequences. As mentioned previously, rRNA probably changes only slowly during evolu-tion, and indeed it may change only when there is a major evolutionary event. Woese found that the rRNA sequence of prokary-otes that lived at high temperatures or pro-duced methane was quite different from that of all the other types of prokaryotes and from the eukaryotes. Therefore, he pro-posed that there are two groups of prokary-otes (rather than one group as in the five-kingdom system). Further, Woese said that the rRNA sequences of these two groups, called the bacteria and archaea, are so fun-damentally different from each other that they should be assigned to separate do-mains, a category of classification that is higher than the kingdom category. The two designated domains are domain Bacteria and domain Archaea. The eukaryotes are in the domain Eukarya. The phylogenetic tree shown
in Figure 19.11 is based on his rRNA sequencing data. The data suggested that both bacteria and archaea evolved in the history of life from the first common ancestor. Later, the eukarya diverged from the archaea line of descent.
Domain BacteriaBacteria are so diversified and plentiful they are found in large numbers nearly everywhere on Earth. In large part, Chapter 20 will be devoted to discussing the bacteria, which differ from the archaea not structurally but biochemically (Table 19.2). In the meantime, we can note that the cyanobacteria are large photosynthetic prokaryotes. They carry on pho-tosynthesis in the same manner as plants in that they use solar energy to convert carbon dioxide and water to a car-bohydrate and in the process give off oxygen. Indeed the cyanobacteria may have been the first organisms to contrib-ute oxygen to early Earth’s atmosphere, making it hospi-table to the evolution of oxygen-using organisms, including animals.
FIGURE 19.11 A tree of life showing the three domains.
Representatives of each domain are depicted in the ovals, and the phylogenetic tree shows that domain Archaea is more closely related to domain Eukarya than either is to domain Bacteria.
mad2543X_ch19_337-353.indd 348mad2543X_ch19_337-353.indd 348 11/18/08 3:33:51 PM11/18/08 3:33:51 PM
www.ebook3000.com

CHAPTER 19 SYSTEMATICS AND PHYLOGENY 349
All forms of nutrition are found among the bacteria, but most are heterotrophic. Escherichia coli, which lives in the hu-man intestine, is heterotrophic as are parasitic forms that cause human disease. Clostridium tetani (cause of tetanus), Bacillus anthracis (cause of anthrax), and Vibrio cholerae (cause of chol-era) are disease-causing species of bacteria. Heterotrophic bac-teria are beneficial in ecosystems because they are organisms of decay that break down organic remains. Along with fungi, they keep chemical cycling going so that plants always have a source of inorganic nutrients.
Domain ArchaeaLike bacteria, archaea are prokaryotic unicellular organisms that reproduce asexually. Archaea don’t look that different from bacteria under the microscope, and the extreme condi-tions under which many species live has made it difficult to culture them. This may have been the reason that their unique place among the living organisms long went unrecognized. The archaea are distinguishable from bacteria by a dif-ference in their rRNA base sequences and also by their unique plasma membrane and cell wall chemistry (Table 19.3). The chemical nature of the archaeal cell wall is diverse and never the same as that of the bacterial cell. The branched nature of diverse lipids in the archaeal plasma membrane, for example, could possibly help them live in extreme conditions. The archaea live in all sorts of environments, but they are known for thriving in extreme environments thought to be sim-ilar to those of the early Earth. For example, the meth anogens live in anaerobic environments, such as swamps and marshes and the guts of animals; the halophiles are salt lovers living in bodies of water such as the Great Salt Lake in Utah; and the thermoacidophiles are both high temperature and acid loving. These archaea live in extremely hot acidic environments, such as hot springs and geysers.
Domain EukaryaEukaryotes are unicellular to multicellular organisms whose cells have a membrane-bounded nucleus. They also have various organelles that arose through endosymbiosis (see page 325). Sexual reproduction is common, and various types of life cycles are seen. Later in this text, we will be studying
the individual kingdoms that occur within the domain Eu-karya (Fig. 19.12 and Table 19.3). In the meantime, we can note that protists are a diverse group of organisms that are hard to classify and define. They are eukaryotes and mainly unicellular, but some are filaments, colonies, or multicellular sheets. Even so, protists do not have true tissues. Nutrition is diverse and some are heterotrophic by ingestion or absorp-tion and some are photosynthetic. Green algae, paramecia, and slime molds are representative protists. There has been considerable debate over the classification of protists, and presently they are placed in five supergroups (Fig. 21.2) and not in a kingdom. Fungi are eukaryotes that form spores, lack flagella, and have cell walls containing chitin. They are multicellular with a few exceptions. Fungi are heterotrophic by absorption—they secrete digestive enzymes and then absorb nutrients from de-caying organic matter. Mushrooms, molds, and yeasts are rep-resentative fungi. Despite appearances, molecular data suggest that fungi and animals are more closely related to each other than ei-ther are to plants. Plants are photosynthetic organisms that have become adapted to a land environment. They share a common ancestor, which is an aquatic photosynthetic protist. Land plants possess true tissues and have the organ system level of organization. Examples include cacti, ferns, and cypress trees. Animals are motile eukaryotic multicellular organisms that evolved from a heterotrophic protist. Like land plants, animals have true tissues and the organ system level of orga-nization. Animals ingest their food; examples include worms, whales, and insects.
Check Your Progress 19.3
1. Explain the introduction of the domain level of classification.
2. What type of evidence suggests that fungi are related to animals rather than plants? Why is a close relationship between animals and fungi so unexpected?
TABLE 19.2Major Distinctions Among the Three Domains of Life
Bacteria Archaea Eukarya
Unicellularity Yes Yes Some, many multicellular
Membrane lipids Phospholipids, unbranched Varied branched lipids Phospholipids, unbranched
Cell wall Yes (contains peptidoglycan) Yes (no peptidoglycan) Some yes, some no
Nuclear envelope No No Yes
Membrane-bounded organelles No No Yes
Ribosomes Yes Yes Yes
Introns No Some Yes
mad2543X_ch19_337-353.indd 349mad2543X_ch19_337-353.indd 349 11/18/08 3:33:53 PM11/18/08 3:33:53 PM

Domain EukaryaKingdom AnimaliaGrey wolf, Canis
Domain BacteriaEscherichia
Domain EukaryaKingdom Fungi
Mushroom, Hygrocybe
Domain EukaryaProtists
Paramecium, Paramecium
Domain Eukarya Kingdom Plantae
Black-eyed Susan, Rudbeckia
Domain ArchaeaMethanosarcina
350 PART II I EVOLUTION
TABLE 19.3Classification Criteria for the Three Domains
Domains Bacteria and Archaea Domain Eukarya
Protists Kingdom Fungi Kingdom Plantae Kingdom Animalia
Type of cell Prokaryotic Eukaryotic Eukaryotic Eukaryotic Eukaryotic
Complexity Unicellular Unicellular usual Multicellular usual Multicellular Multicellular
Type of nutrition Autotrophic or Photosynthetic Heterotrophic Autotrophic by Heterotrophic by heterotrophic or heterotrophic by absorption photosynthesis ingestion by various means
Motility Sometimes by Sometimes by Nonmotile Nonmotile Motile by contractile flagella flagella (or cilia) fibers
Life cycle Asexual usual Various life cycles Haploid Alternation of Diploid generations
Internal protection No No No Yes Yesof zygote
FIGURE 19.12 The three domains of life.
This pictorial representation of the domains Bacteria, Archaea, and Eukarya includes an example for each of the four types of eukaryotes: protists, fungi, plants, and animals.
mad2543X_ch19_337-353.indd 350mad2543X_ch19_337-353.indd 350 11/18/08 3:33:54 PM11/18/08 3:33:54 PM
www.ebook3000.com

CHAPTER 19 SYSTEMATICS AND PHYLOGENY 351
summary19.1 Systematics Systematics is dedicated to understanding the evolutionary history of life on Earth. Taxonomy, a part of systematics, deals with the naming of organisms; each species is given a binomial name consisting of the genus and specific epithet. Classification involves the assignment of species to categories. When an organism is named, a species has been assigned to a particular genus. Eight obligatory categories of classification are species, genus, family, order, class, phylum, kingdom, and domain. Each higher category is more inclusive; species in the same kingdom share general characters, and species in the same genus share quite specific characters.
19.2 Phylogenetic TreesPhylogenetic trees are diagrams that should be considered a hypothesis concerning the evolutionary relationships between designated species. The tree shows a sequence of common ancestors by which evolution occurred. Because of the hierarchical nature of Linnean classification, it is possible to draw up a phylogenetic tree based on classification categories. Rather than using similarities to construct phylogenetic trees, cladistics offers a way to use shared derived traits to distinguish different groups of species from one another. When no original common ancestor can be found in the fossil record, the use of an outgroup allows us to determine with what trait to begin the tree. Based on the rest of the available data, it is possible to determine the sequence of clades in the tree. Clades are monophyletic; they contain the most recent common ancestor along with all its descendants. All the members of a clade share the same derived traits. Linnean classification permits the use of groupings other than those that are monophyletic, and therefore has come under severe criticism. The fossil record, homology, and molecular data, in particular, are used to help decipher phylogenies. Because fossils can be dated, available fossils can establish the antiquity of a species. If the fossil record is complete enough, we can sometimes trace a lineage through time. Homology helps indicate when species belong to a monophyletic taxon (share a common ancestor); however, convergent evolution sometimes makes it difficult to distinguish homologous structures from analogous structures. DNA base sequence data are commonly used to help determine evolutionary relationships.
19.3 The Three-Domain SystemOn the basis of molecular data, three evolutionary domains have been established: Bacteria, Archaea, and Eukarya. The first two domains contain prokaryotes; the domain Eukarya contains the protists, fungi, plants, and animals.
understanding the terms
Match the terms to these definitions:
a. Branch of biology concerned with identifying, describing, and naming organisms.
b. Diagram that indicates common ancestors and lines of descent.
c. Group of organisms that fills a particular classification category.
d. School of systematics that determines the degree of relatedness by analyzing shared derived characters.
e. Similarity in structure due to having a common ancestor.
We have seen in this chapter that identifying, naming, and classifying living organisms is an ongoing process. Carolus Linnaeus’s system of binomial nomenclature is still accepted by virtually all biologists, but many species re-main to be found and named (most in the rain forests). For years, Whittaker’s five-kingdom concept of life on Earth was widely used. Now, new findings suggest that there are three domains of life: Bacteria, Archaea, and
Eukarya. The archaea are structurally similar to bacteria, but their rRNA differs from that of bacteria and is instead similar to that of eukaryotes. Also, some archaeal genes are unique only to the archaea. Kingdoms fungi, plants, and animals are still recognized among eukarya, but protists are now placed in sev-eral supergroups Most of today’s systematists use evolu-tionary relationships among organisms for
classification purposes. Cladistics offers us mechanisms for determining such relation-ships and indicates how Linnean classification should be revised. The cladist believes that only shared derived differences in chiefly ana-tomical traits and DNA sequences should be used to classify organisms. The sequencing of DNA has emerged as a powerful new tool to assist in determining evolutionary relation-ships and how species should be classified.
Connecting the Concepts
analogous structure 345analogy 345binomial nomenclature 339clade 342cladistics 342cladogram 342class 340common ancestor 341convergent evolution 345derived trait 341domain 340domain Archaea 348domain Bacteria 348domain Eukarya 348family 340five-kingdom system 348genus 340homologous structure 345
homology 344ingroup 342kingdom 340molecular clock 346monophyletic group 344nested 340order 340outgroup 342phylogenetic tree 341phylogeny 341phylum 340species 340specific epithet 339statistical phylogenetics 343synapomorphy 342systematics 338taxon 340taxonomy 338
mad2543X_ch19_337-353.indd 351mad2543X_ch19_337-353.indd 351 11/18/08 3:33:58 PM11/18/08 3:33:58 PM

352 PART II I EVOLUTION
reviewing this chapter 1. Explain the binomial system of naming organisms. Why must
species be designated by a complete name? 338–39 2. Why is it necessary to give organisms scientific names? 339 3. What are the eight obligatory classification categories? In what
way are they a hierarchy? 340 4. Discuss the principles of cladistics, and explain how to construct
a cladogram. 342 5. Explain the difference between monophyletic, paraphyletic, and
polyphyletic groupings. 343–44 6. With reference to the phylogenetic tree shown in Figure 19.6,
why are birds in a clade with crocodiles? In a clade with other reptiles? 344
7. What types of data help systematists construct phylogenetic trees? 345–46
8. Compare the five-kingdom system of classification to the three-domain system. 348–49
9. Contrast the characteristics of the bacteria, the archaea, and the eukarya. 349–50
10. Contrast the eukaryotic protists, fungi, plants, and animals. 349–50
testing yourselfChoose the best answer for each question. 1. Which is the scientific name of an organism?
a. Rosa rugosab. Rosac. rugosad. Rugosa rugosae. Both a and d are correct.
2. Which of these describes systematics? a. studies evolutionary relationshipsb. includes taxonomy and classificationc. includes phylogenetic trees d. utilizes fossil, morphological, and molecular datae. All of these are correct.
3. The classification category below the level of family isa. class.b. species.c. phylum.d. genus.e. order.
4. Which of these are domains? Choose more than one answer if correct.a. Bacteriab. Archaeac. Eukaryad. Animalse. Plants
5. Which of these are eukaryotes? Choose more than one answer if correct.a. bacteriab. archaeac. eukaryad. animalse. plants
6. Which of these characteristics is shared by bacteria and archaea? Choose more than one answer if correct.a. presence of a nucleusb. absence of a nucleusc. presence of ribosomesd. absence of membrane-bounded organellese. presence of a cell wall
7. Which is mismatched?a. Fungi—prokaryotic single cellsb. Plants—nucleatedc. Plants—flowers and mossesd. Animals—arthropods and humanse. Protists—unicellular eukaryotes
8. Which is mismatched?a. Fungi—heterotrophic by absorptionb. Plants—usually photosyntheticc. Animals—rarely ingestived. Protists—various modes of nutritione. Both c and d are mismatched.
9. Concerning a phylogenetic tree, which is incorrect?a. Dates of divergence are always given.b. Common ancestors give rise to descendants.c. The more recently evolved are always at the top of the
tree.d. Ancestors have primitive characters.
10. Which pair is mismatched?a. homology—character similarity due to a common ancestorb. molecular data—DNA strands matchc. fossil record—bones and teethd. homology—functions always differe. molecular data—molecular clock
11. One benefit of the fossil record isa. that hard parts are more likely to fossilize.b. fossils can be dated.c. its completeness.d. fossils congregate in one place.e. All of these are correct.
12. The discovery of common ancestors in the fossil record, the presence of homologies, and nucleic acid similarities help scientists decide a. how to classify organisms.b. the proper cladogram.c. how to construct phylogenetic trees.d. how evolution occurred.e. All of these are correct.
13. Molecular clock data are based ona. common adaptations among animals.b. DNA dissimilarities in living species.c. DNA fingerprinting of fossils.d. finding homologies among plants.e. All of these are correct.
14. In cladistics,a. a clade must contain the common ancestor plus all its
descendants.b. shared derived traits help construct cladograms.c. data for the cladogram are presented.d. the species in a clade share homologous structures.e. All of these are correct.
mad2543X_ch19_337-353.indd 352mad2543X_ch19_337-353.indd 352 11/18/08 3:33:58 PM11/18/08 3:33:58 PM
www.ebook3000.com

A
B
C
D
E
F
H
I
G
CHAPTER 19 SYSTEMATICS AND PHYLOGENY 353
15. Linnean classification is being criticized because a. it doesn’t always use monophyletic groupings.b. it cannot be reconciled in general with the principles of
systematics.c. some scientists are behind the times.d. it doesn’t lend itself to the construction of phylogenetic trees.e. All of these are correct.
16. Which of these pairs is mismatched?a. cladogram—shows shared derived charactersb. any phylogenetic tree—must use names of classification
categoriesc. cladogram—based on monophyletic groupsd. any phylogenetic tree—shows common ancestorse. All of these are properly matched.
17. Lancelets are the outgroup. Lanceletsa. are related to all the species in the ingroup. b. have traits shared by both lancelets and the species in the
ingroup.c. cannot be a member of any clade in the phylogenetic tree.d. don’t have any of the traits listed in the tree. e. All of these are correct.
18. Birds have a gizzard that mammals don’t have and mammals have hair that birds don’t have.a. Even so, both birds and mammals can be in a clade together
because they both descended from an ancestor that had an amniotic egg.
b. Regardless, birds and mammals cannot be in the same clade because they have other traits that are different.
c. If they and their common ancestors are grouped together, the grouping would be polyphyletic.
d. Both a and b are correct. e. Both b and c are correct.
19. Which of these statements is correct? a. All the species in the ingroup have all the traits in common.b. All the species in the ingroup have only the first trait(s) of the
phylogenetic tree in common. c. Only the last species to evolve necessarily has all the traits
mentioned in the tree.d. Every clade has only unique derived traits not shared by any
other clade. e. All of these are correct.
20. This clade is paraphyletic because it does
a. not include the common ancestor for the species in the clade.
b. not include all the descendants of a common ancestor.c. include species from two different common ancestors. d. include species from a number of different clades.e. All of these are correct.
21. How is Linnean systematics like that of cladistic systematics? They botha. allow monophyletic and paraphyletic groups.b. have an outgroup to decide which traits are ancestral.c. are nested—have groups within groups.d. are tied to a strict classification system.e. coordinate well with the geological timescale.
thinking scientifically 1. Recent DNA evidence suggests to some plant taxonomists
that the traditional way of classifying flowering plants is not correct, and that flowering plants need to be completely reclassified. Other botanists disagree, saying it would be chaotic and unwise to disregard the historical classification groups. Argue for and against keeping traditional classification schemes.
2. What data might make you conclude that the eukaryotes should be in more than one domain? What domains do you hypothesize might be required?
bioethical issueClassifying Chimpanzees
Because the genomes of chimpanzees and humans are almost identical, and the differences between them are no greater than between any two human beings, their classification has been changed. Chimpanzees and humans are placed in the same family and subfamily. They are in different “tribes,” which is a rarely used classification category between subfamily and genus. The former classification of chimpanzees and humans placed the two animals in different families. Do you believe the chimpanzees should be classified in the same family and subfamily as humans, or do you prefer the classification used formerly? Which way seems prejudicial? Give your reasons for preferring one method over the other.
Biology websiteThe companion website for Biology provides a wealth of information organized and integrated by chapter. You will find practice tests, animations, videos, and much more that will complement your learning and understanding of general biology.
http://www.mhhe.com/maderbiology10
mad2543X_ch19_337-353.indd 353mad2543X_ch19_337-353.indd 353 11/18/08 3:33:58 PM11/18/08 3:33:58 PM
354
Microbiology and Evolutionicrobes occupy a world unseen by the naked eye. It’s richly populated because
it includes the viruses, the prokaryotic bacteria and archaea, and the eukaryotic
protists and fungi. These organisms occur everywhere from the highest mountain peaks
to the deepest ocean trenches and in every type of environment, even those that are
extremely hot and acidic.
At the outset, let’s acknowledge that microbes cause serious diseases in plants and
animals, including ourselves. But we make use of microbes in innumerable ways. For
example, bacteria help us accomplish gene cloning and genetic engineering; make
food stuffs and antibiotics; and help dispose of sewage and environmental pollutants.
The biosphere is totally dependent on the services of microorganisms. While we often
mention how much we rely on land plants, we may fail to acknowledge that without
microorganisms, land plants could not exist. Decomposing fungi and bacteria make
inorganic nutrients available to plants, which they can absorb all the better because
their roots are coated with friendly fungi. Photosynthetic bacteria first put oxygen in the
atmosphere, and they, along with certain protists, are the producers of food in the oceans.
Microbes are our ancestors. They alone were on Earth for about 2.5 billion years, and
unicellular protists gave rise to animals and land plants that populate the macroscopic
world. This part discusses microbes, organisms that contribute so much to our world,
even though we cannot see them without the use of a microscope.
20 Viruses, Bacteria, and Archaea 355
21 Protist Evolution and Diversity 373
22 Fungi Evolution and Diversity 393
354
pa r t IV
mad2543X_ch20_354-372.indd 354mad2543X_ch20_354-372.indd 354 12/10/08 10:50:29 AM12/10/08 10:50:29 AM
www.ebook3000.com
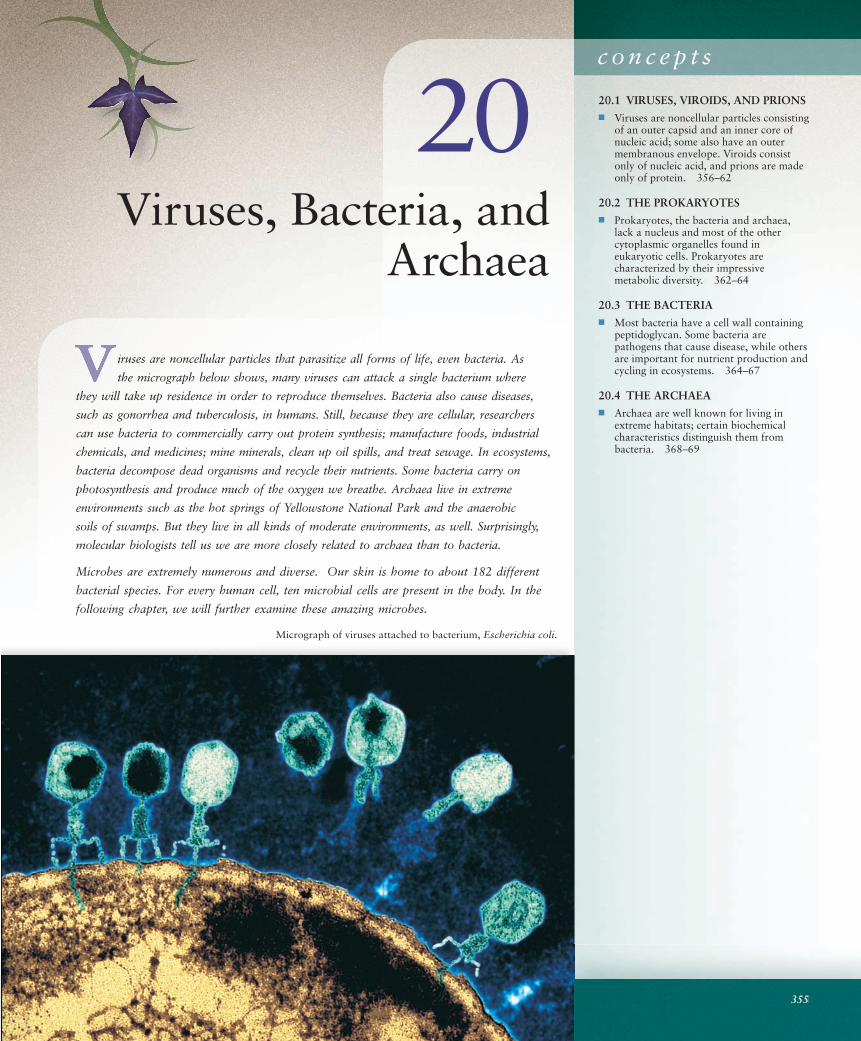
355 355
20.1 VIRUSES, VIROIDS, AND PRIONS■ Viruses are noncellular particles consisting
of an outer capsid and an inner core of nucleic acid; some also have an outer membranous envelope. Viroids consist only of nucleic acid, and prions are made only of protein. 356–62
20.2 THE PROKARYOTES■ Prokaryotes, the bacteria and archaea,
lack a nucleus and most of the other cytoplasmic organelles found in eukaryotic cells. Prokaryotes are characterized by their impressive metabolic diversity. 362–64
20.3 THE BACTERIA■ Most bacteria have a cell wall containing
peptidoglycan. Some bacteria are pathogens that cause disease, while others are important for nutrient production and cycling in ecosystems. 364–67
20.4 THE ARCHAEA■ Archaea are well known for living in
extreme habitats; certain biochemical characteristics distinguish them from bacteria. 368–69
c o n c e p t s
20
355
Viruses, Bacteria, and Archaea
iruses are noncellular particles that parasitize all forms of life, even bacteria. As
the micrograph below shows, many viruses can attack a single bacterium where
they will take up residence in order to reproduce themselves. Bacteria also cause diseases,
such as gonorrhea and tuberculosis, in humans. Still, because they are cellular, researchers
can use bacteria to commercially carry out protein synthesis; manufacture foods, industrial
chemicals, and medicines; mine minerals, clean up oil spills, and treat sewage. In ecosystems,
bacteria decompose dead organisms and recycle their nutrients. Some bacteria carry on
photosynthesis and produce much of the oxygen we breathe. Archaea live in extreme
environments such as the hot springs of Yellowstone National Park and the anaerobic
soils of swamps. But they live in all kinds of moderate environments, as well. Surprisingly,
molecular biologists tell us we are more closely related to archaea than to bacteria.
Microbes are extremely numerous and diverse. Our skin is home to about 182 different
bacterial species. For every human cell, ten microbial cells are present in the body. In the
following chapter, we will further examine these amazing microbes.
Micrograph of viruses attached to bacterium, Escherichia coli.
mad2543X_ch20_354-372.indd 355mad2543X_ch20_354-372.indd 355 12/10/08 10:50:41 AM12/10/08 10:50:41 AM

Adenovirus: DNA virus with a polyhedral capsid and a fiber at each corner. T-even bacteriophage: DNA virus with a polyhedral head and a helical tail.
protein unit
DNA
a.
capsid
b.
fiber
fiber proteincapsid
DNA
tail sheathneck
tail fiber
base platepins
TEM 80,000� TEM 90,000�
Leaf infected with tobacco mosaic virus.
356 PART IV MICROBIOLOGY AND EVOLUTION
20.1 Viruses, Viroids, and PrionsThe term virus [L. virus, poison] is associated with a number of plant, animal, and human diseases (see Table 20.1). The mere mention of the term brings to mind serious illnesses such
as polio, rabies, and AIDS (acquired immunodefi ciency syn-drome), as well as common childhood maladies such as mea-sles, chickenpox, and mumps. Viral diseases are of concern to everyone; it is estimated that the average person catches a cold two or three times a year. The viruses are a biological enigma. They have a DNA or RNA genome, but they can reproduce only by using the metabolic machinery of a host cell. Viruses are noncellular, and therefore cannot be assigned a two-part binomial name, as are organisms. Our knowledge of viruses began in 1884 when the French chemist Louis Pasteur (1822–95) suggested that something smaller than a bacterium was the cause of rabies, and it was he who chose the word virus from a Latin word meaning poison. In 1892, Dimitri Iva-nowsky (1864–1920), a Russian microbiologist, was studying a disease of tobacco leaves, called
FIGURE 20.1 Viruses.
Despite their diversity, all viruses have an outer capsid composed of protein subunits and a nucleic acid core—composed of either DNA or RNA, but not both. Some types of viruses also have a membranous envelope.
TABLE 20.1Viral Diseases in Humans
Category Disease
Sexually transmitted AIDS (HIV), genital warts, genitaldiseases herpes
Childhood diseases Mumps, measles, chickenpox, German measles
Respiratory diseases Common cold, influenza, severe acute respiratory infection (SARS)
Skin diseases Warts, fever blisters, shingles
Digestive tract diseases Gastroenteritis, diarrhea
Nervous system diseases Poliomyelitis, rabies, encephalitis
Other diseases Smallpox, hemorrhagic fevers, cancer, hepatitis, mononucleosis, yellow fever, dengue fever, conjunctivitis, hepatitis C
mad2543X_ch20_354-372.indd 356mad2543X_ch20_354-372.indd 356 12/10/08 10:50:54 AM12/10/08 10:50:54 AM
www.ebook3000.com
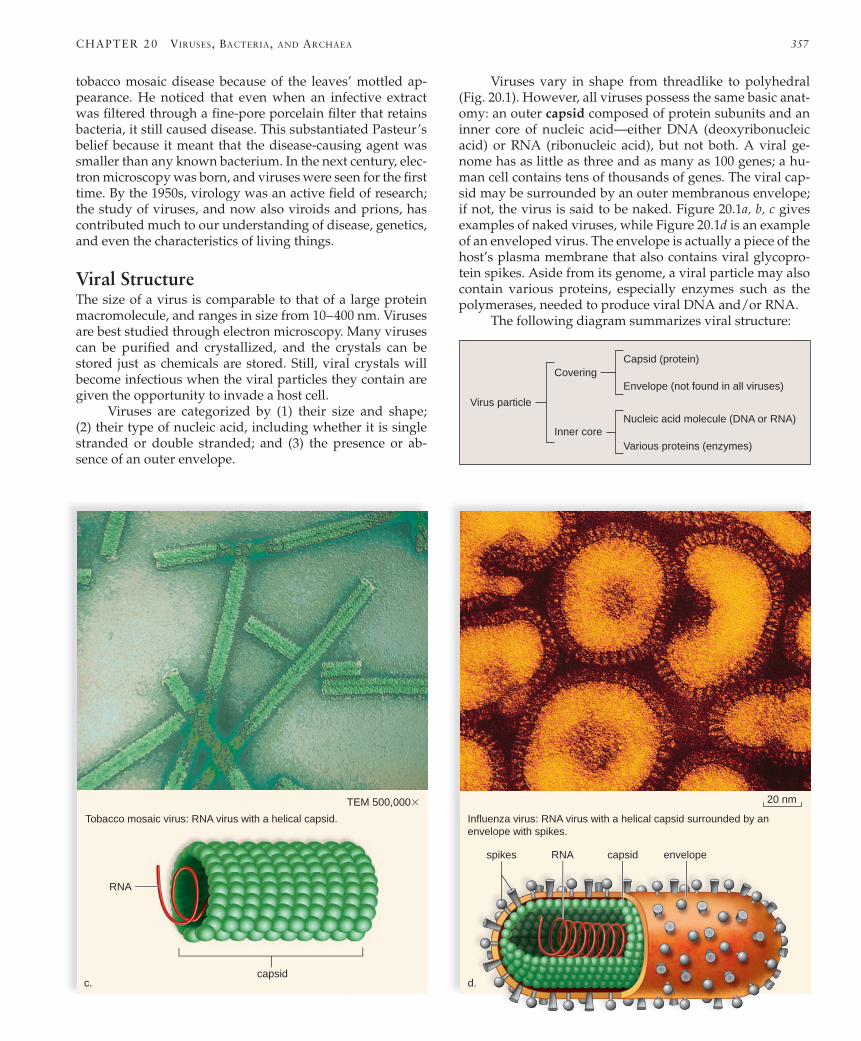
Tobacco mosaic virus: RNA virus with a helical capsid. Influenza virus: RNA virus with a helical capsid surrounded by anenvelope with spikes.
capsid
capsidRNAspikes envelope
RNA
c. d.
TEM 500,000� 20 nm
Virus particle
Covering
Inner coreNucleic acid molecule (DNA or RNA)
Various proteins (enzymes)
Capsid (protein)
Envelope (not found in all viruses)
CHAPTER 20 VIRUSES, BACTERIA, AND ARCHAEA 357
tobacco mosaic disease because of the leaves’ mottled ap-pearance. He noticed that even when an infective extract was fi ltered through a fi ne-pore porcelain fi lter that retains bacteria, it still caused disease. This substantiated Pasteur’s belief because it meant that the disease-causing agent was smaller than any known bacterium. In the next century, elec-tron microscopy was born, and viruses were seen for the fi rst time. By the 1950s, virology was an active fi eld of research; the study of viruses, and now also viroids and prions, has contributed much to our understanding of disease, genetics, and even the characteristics of living things.
Viral StructureThe size of a virus is comparable to that of a large protein macro molecule, and ranges in size from 10–400 nm. Viruses are best studied through electron microscopy. Many viruses can be purifi ed and crystallized, and the crystals can be stored just as chemicals are stored. Still, viral crystals will become infectious when the viral particles they contain are given the opportunity to invade a host cell. Viruses are categorized by (1) their size and shape; (2) their type of nucleic acid, including whether it is single stranded or double stranded; and (3) the presence or ab-sence of an outer envelope.
Viruses vary in shape from threadlike to polyhedral (Fig. 20.1). However, all viruses possess the same basic anat-omy: an outer capsid composed of protein subunits and an inner core of nucleic acid—either DNA (deoxyribonucleic acid) or RNA (ribonucleic acid), but not both. A viral ge-nome has as little as three and as many as 100 genes; a hu-man cell contains tens of thousands of genes. The viral cap-sid may be surrounded by an outer membranous envelope; if not, the virus is said to be naked. Figure 20.1a, b, c gives examples of naked viruses, while Figure 20.1d is an example of an enveloped virus. The envelope is actually a piece of the host’s plasma membrane that also contains viral glycopro-tein spikes. Aside from its genome, a viral particle may also contain various proteins, especially enzymes such as the polymerases, needed to produce viral DNA and/or RNA. The following diagram summarizes viral structure:
mad2543X_ch20_354-372.indd 357mad2543X_ch20_354-372.indd 357 12/10/08 10:50:57 AM12/10/08 10:50:57 AM

358 PART IV MICROBIOLOGY AND EVOLUTION
Parasitic NatureViruses are obligate intracellular parasites, which means they can-not reproduce outside a living cell. Like prokaryotic and eu-karyotic cells, viruses have genetic material. Whereas a cell is ca-pable of copying its own genetic material in order to reproduce, a virus cannot duplicate its genetic material or any of its other components. For a virus to reproduce, it must infect a living cell. The infected cell duplicates the nucleic acid and other parts of the virus, including the capsid, viral enzymes, and for some viruses, the envelope. To maintain animal viruses in the laboratory, they are sometimes injected into live chicken embryos (Fig. 20.2). Today, host cells are often maintained in tissue (cell) culture by simply placing a few cells in a glass or plastic container with appropri-ate nutrients to sustain the cells. The cells can then be infected with the animal virus to be studied. Viruses infect a variety of cells, but they are host specifi c. Bacteriophages infect only bac-teria, the tobacco mosaic virus infects only certain species of plants, and the rabies virus infects only mammals, for example. Some human viruses even specialize in a particular tissue. Hu-man immunodefi ciency virus (HIV) enters only certain blood cells, the polio virus reproduces in spinal nerve cells, and the hepatitis viruses infect only liver cells. What could cause this remarkable parasite–host cell correlation? Some scientists hy-pothesize that viruses are derived from the very cell they infect; the nucleic acid of viruses came from their host cell genomes! In that case, viruses evolved after cells came into existence, and new viruses may be evolving even now. Using protein and ge-netic analysis in 2000, other scientists hypothesize that viruses arose early in the origin of life, predating the three domains. Viruses can also mutate; therefore, it is correct to say that they evolve. Those that mutate often can be quite trou-blesome because a vaccine that is effective today may not be effective tomorrow. Flu viruses are well known for mutat-ing, and this is why it is necessary to have a fl u shot every year—antibodies generated from last year’s shot are not ex-pected to be effective this year.
Viral ReproductionViruses are microscopic pirates, commandeering the meta-bolic machinery of a host cell. Viruses gain entry into a host cell because portions of a naked capsid (or one of the types of envelope spikes) attach in a lock-and-key manner with a receptor on the host cell’s outer surface. The attachment of the capsid or spikes of a virus to particular host cell receptors is responsible for the remarkable specifi city between viruses and their host cells. A virus cannot infect a host cell to which it is unable to attach. For example, the tobacco mosaic virus cannot infect an exposed human because its capsid cannot attach to the receptors on the surfaces of human cells. After a virus has become attached to a suitable host cell, the viral nucleic acid enters the cell. Once inside, the nucleic acid codes for the protein units in the capsid. In ad-dition, the virus may have genes for special enzymes needed for the virus to reproduce and exit from the host cell. In large measure, however, a virus relies on the host’s enzymes, ri-bosomes, transfer RNA (tRNA), and ATP (adenosine tri-phosphate) for its own reproduction. Because the host cell’s metabolism is diverted from meeting the needs of the cell, infected cells may have an abnormal appearance.
Reproduction of BacteriophagesBacteriophages [Gk. bacterion, rod, and phagein, to eat], or simply phages, are viruses that parasitize bacteria; the bac-terium in Figure 20.3 could be Escherichia coli, which lives in our intestines, for example. As the fi gure shows, there are two types of bacteriophage life cycles, termed the lytic cycle and the lysogenic cycle. In the lytic cycle, viral reproduction occurs, and the host cell undergoes lysis, a breaking open of the cell to release viral particles. In the lysogenic cycle, viral reproduction does not immediately occur, but reproduction may take place sometime in the future. The following dis-cussion is based on the DNA bacteriophage lambda, which undergoes both lytic and lysogenic cycles.
Lytic Cycle. The lytic cycle [Gk. lyo, loose] may be divided into fi ve stages: attachment, penetration, biosynthesis, mat-uration, and release. During attachment, portions of the cap-sid combine with a receptor on the rigid bacterial cell wall in a lock-and-key manner. During penetration, a viral enzyme digests away part of the cell wall, and viral DNA is injected into the bacterial cell. Biosynthesis of viral components be-gins after the virus brings about inactivation of host genes not necessary to viral replication. The virus takes over the machinery of the cell in order to carry out viral DNA replica-tion and production of multiple copies of the capsid protein subunits. During maturation, viral DNA and capsids assem-ble to produce several hundred viral particles. Lysozyme, an enzyme coded for by a viral gene, is produced; this disrupts the cell wall, and the release of new viruses occurs. The bacte-rial cell dies as a result.
Lysogenic Cycle. With the lysogenic cycle [Gk. lyo, loose, break up, and genitus, producing], the infected bacterium does not immediately produce phage but
FIGURE 20.2 Culturing viruses.
To culture a virus, scientists can inoculate live chicken eggs with viral particles. A virus reproduces only inside a living cell because it takes over the machinery of the cell.
mad2543X_ch20_354-372.indd 358mad2543X_ch20_354-372.indd 358 12/10/08 10:51:00 AM12/10/08 10:51:00 AM
www.ebook3000.com
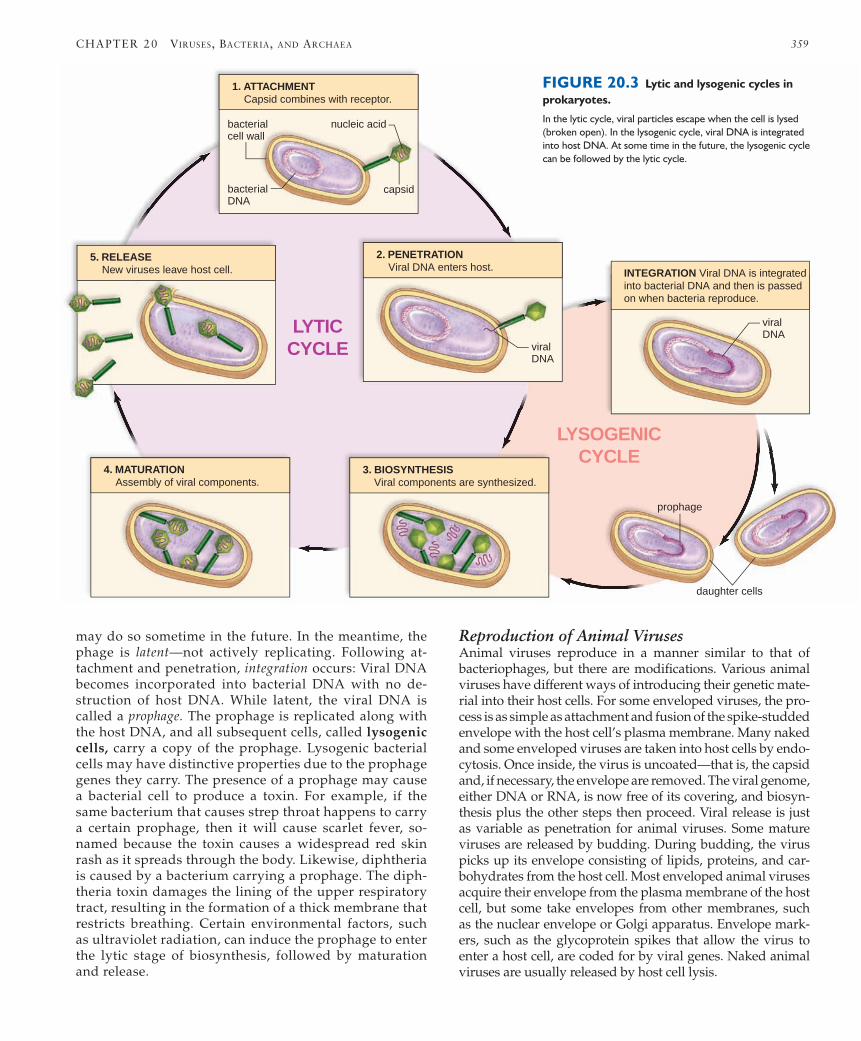
1. ATTACHMENT Capsid combines with receptor.
2. PENETRATION Viral DNA enters host.
3. BIOSYNTHESIS Viral components are synthesized.
4. MATURATION Assembly of viral components.
5. RELEASE New viruses leave host cell. INTEGRATION Viral DNA is integrated
into bacterial DNA and then is passedon when bacteria reproduce.
bacterialDNA
viralDNA
viralDNA
bacterialcell wall
capsid
nucleic acid
prophage
daughter cells
LYTICCYCLE
LYSOGENICCYCLE
CHAPTER 20 VIRUSES, BACTERIA, AND ARCHAEA 359
may do so sometime in the future. In the meantime, the phage is latent—not actively replicating. Following at-tachment and penetration, integration occurs: Viral DNA becomes incorporated into bacterial DNA with no de-struction of host DNA. While latent, the viral DNA is called a prophage. The prophage is replicated along with the host DNA, and all subsequent cells, called lysogenic cells, carry a copy of the prophage. Lysogenic bacterial cells may have distinctive properties due to the prophage genes they carry. The presence of a prophage may cause a bacterial cell to produce a toxin. For example, if the same bacterium that causes strep throat happens to carry a certain prophage, then it will cause scarlet fever, so-named because the toxin causes a widespread red skin rash as it spreads through the body. Likewise, diphtheria is caused by a bacterium carrying a prophage. The diph-theria toxin damages the lining of the upper respiratory tract, resulting in the formation of a thick membrane that restricts breathing. Certain environmental factors, such as ultraviolet radiation, can induce the prophage to enter the lytic stage of biosynthesis, followed by maturation and release.
Reproduction of Animal VirusesAnimal viruses reproduce in a manner similar to that of bacteriophages, but there are modifi cations. Various animal viruses have different ways of introducing their genetic mate-rial into their host cells. For some enveloped viruses, the pro-cess is as simple as attachment and fusion of the spike-studded envelope with the host cell’s plasma membrane. Many naked and some enveloped viruses are taken into host cells by endo-cytosis. Once inside, the virus is uncoated—that is, the capsid and, if necessary, the envelope are removed. The viral genome, either DNA or RNA, is now free of its covering, and biosyn-thesis plus the other steps then proceed. Viral release is just as variable as penetration for animal viruses. Some mature viruses are released by budding. During budding, the virus picks up its envelope consisting of lipids, proteins, and car-bohydrates from the host cell. Most enveloped animal viruses acquire their envelope from the plasma membrane of the host cell, but some take envelopes from other membranes, such as the nuclear envelope or Golgi apparatus. Envelope mark-ers, such as the glycoprotein spikes that allow the virus to enter a host cell, are coded for by viral genes. Naked animal viruses are usually released by host cell lysis.
FIGURE 20.3 Lytic and lysogenic cycles in prokaryotes.
In the lytic cycle, viral particles escape when the cell is lysed (broken open). In the lysogenic cycle, viral DNA is integrated into host DNA. At some time in the future, the lysogenic cycle can be followed by the lytic cycle.
mad2543X_ch20_354-372.indd 359mad2543X_ch20_354-372.indd 359 12/10/08 10:51:01 AM12/10/08 10:51:01 AM
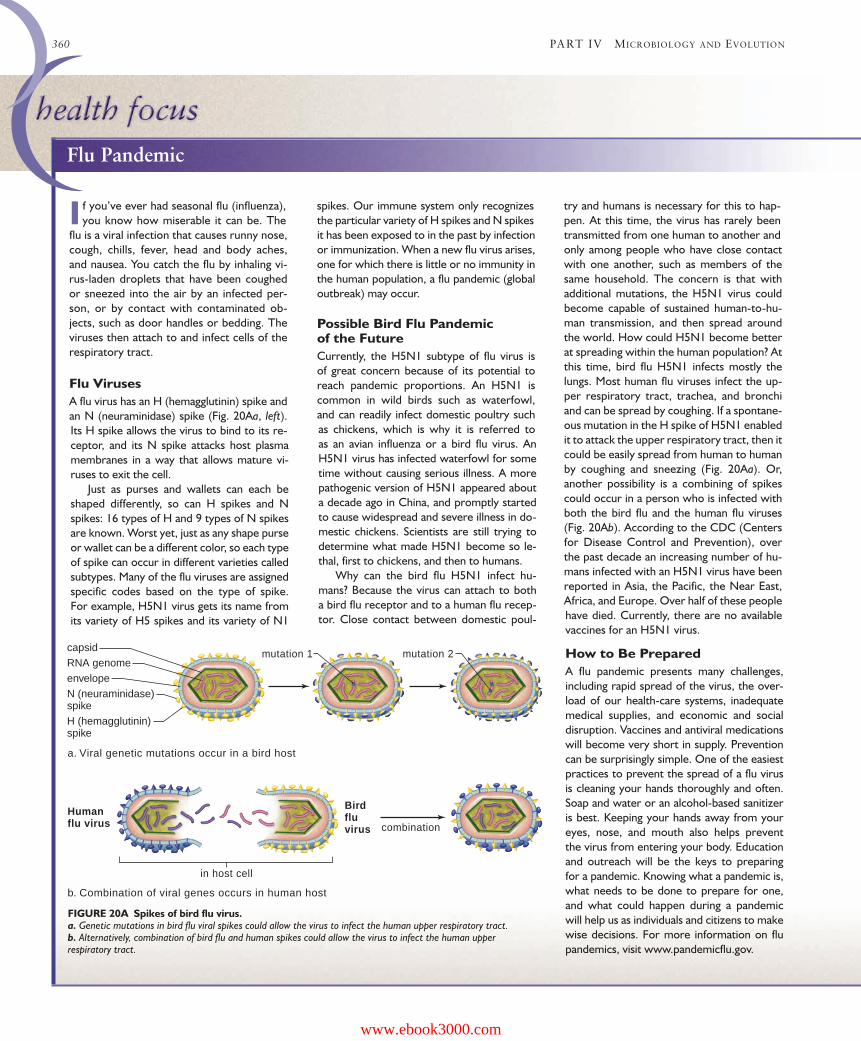
in host cell
mutation 1
Humanflu virus
Birdfluvirus
mutation 2 capsid
RNA genome
envelope
N (neuraminidase)spike
H (hemagglutinin)spike
combination
a. Viral genetic mutations occur in a bird host
b. Combination of viral genes occurs in human host
360 PART IV MICROBIOLOGY AND EVOLUTION
I f you’ve ever had seasonal flu (influenza), you know how miserable it can be. The
flu is a viral infection that causes runny nose, cough, chills, fever, head and body aches, and nausea. You catch the flu by inhaling vi-rus-laden droplets that have been coughed or sneezed into the air by an infected per-son, or by contact with contaminated ob-jects, such as door handles or bedding. The viruses then attach to and infect cells of the respiratory tract.
Flu VirusesA flu virus has an H (hemagglutinin) spike and an N (neuraminidase) spike (Fig. 20Aa, left). Its H spike allows the virus to bind to its re-ceptor, and its N spike attacks host plasma membranes in a way that allows mature vi-ruses to exit the cell. Just as purses and wallets can each be shaped differently, so can H spikes and N spikes: 16 types of H and 9 types of N spikes are known. Worst yet, just as any shape purse or wallet can be a different color, so each type of spike can occur in different varieties called subtypes. Many of the flu viruses are assigned specific codes based on the type of spike. For example, H5N1 virus gets its name from its variety of H5 spikes and its variety of N1
spikes. Our immune system only recognizes the particular variety of H spikes and N spikes it has been exposed to in the past by infection or immunization. When a new flu virus arises, one for which there is little or no immunity in the human population, a flu pandemic (global outbreak) may occur.
Possible Bird Flu Pandemic of the Future Currently, the H5N1 subtype of flu virus is of great concern because of its potential to reach pandemic proportions. An H5N1 is common in wild birds such as waterfowl, and can readily infect domestic poultry such as chickens, which is why it is referred to as an avian influenza or a bird flu virus. An H5N1 virus has infected waterfowl for some time without causing serious illness. A more pathogenic version of H5N1 appeared about a decade ago in China, and promptly started to cause widespread and severe illness in do-mestic chickens. Scientists are still trying to determine what made H5N1 become so le-thal, first to chickens, and then to humans. Why can the bird flu H5N1 infect hu-mans? Because the virus can attach to both a bird flu receptor and to a human flu recep-tor. Close contact between domestic poul-
try and humans is necessary for this to hap-pen. At this time, the virus has rarely been transmitted from one human to another and only among people who have close contact with one another, such as members of the same household. The concern is that with additional mutations, the H5N1 virus could become capable of sustained human-to-hu-man transmission, and then spread around the world. How could H5N1 become better at spreading within the human population? At this time, bird flu H5N1 infects mostly the lungs. Most human flu viruses infect the up-per respiratory tract, trachea, and bronchi and can be spread by coughing. If a spontane-ous mutation in the H spike of H5N1 enabled it to attack the upper respiratory tract, then it could be easily spread from human to human by coughing and sneezing (Fig. 20Aa). Or, another possibility is a combining of spikes could occur in a person who is infected with both the bird flu and the human flu viruses (Fig. 20Ab). According to the CDC (Centers for Disease Control and Prevention), over the past decade an increasing number of hu-mans infected with an H5N1 virus have been reported in Asia, the Pacific, the Near East, Africa, and Europe. Over half of these people have died. Currently, there are no available vaccines for an H5N1 virus.
How to Be PreparedA flu pandemic presents many challenges, including rapid spread of the virus, the over-load of our health-care systems, inadequate medical supplies, and economic and social disruption. Vaccines and antiviral medications will become very short in supply. Prevention can be surprisingly simple. One of the easiest practices to prevent the spread of a flu virus is cleaning your hands thoroughly and often. Soap and water or an alcohol-based sanitizer is best. Keeping your hands away from your eyes, nose, and mouth also helps prevent the virus from entering your body. Education and outreach will be the keys to preparing for a pandemic. Knowing what a pandemic is, what needs to be done to prepare for one, and what could happen during a pandemic will help us as individuals and citizens to make wise decisions. For more information on flu pandemics, visit www.pandemicflu.gov.
FIGURE 20A Spikes of bird flu virus.a. Genetic mutations in bird flu viral spikes could allow the virus to infect the human upper respiratory tract. b. Alternatively, combination of bird flu and human spikes could allow the virus to infect the human upper respiratory tract.
Flu Pandemic
mad2543X_ch20_354-372.indd 360mad2543X_ch20_354-372.indd 360 12/16/08 1:41:25 PM12/16/08 1:41:25 PM
www.ebook3000.com