chemical abundances in the leading arm of the...
TRANSCRIPT
Chemical Abundances in the Leading Arm of the Magellanic Stream∗
Andrew J. Fox1 , Kathleen A. Barger2 , Bart P. Wakker3 , Philipp Richter4 , Jacqueline Antwi-Danso2,5,Dana I. Casetti-Dinescu6 , J. Christopher Howk7 , Nicolas Lehner7 , Elena D’Onghia3,8, Paul A. Crowther9, and
Felix J. Lockman101 Space Telescope Science Institute, 3700 San Martin Drive, Baltimore, MD 21218, USA; [email protected]
2 Department of Physics and Astronomy, Texas Christian University, TCU Box 298840, Fort Worth, TX 76129, USA3 Department of Astronomy, University of Wisconsin–Madison, 475 North Charter Street, Madison, WI 53706, USA
4 Institut für Physik und Astronomie, Universität Potsdam, Haus 28, Karl-Liebknecht-Str. 24/25, D-14476, Potsdam, Germany5 Department of Physics and Astronomy, Texas A&M University, College Station, TX 77843, USA
6 Department of Physics, Southern Connecticut State University, 501 Crescent Street, New Haven, CT 06515, USA7 Department of Physics, University of Notre Dame, 225 Nieuwland Science Hall, Notre Dame, IN 46556, USA
8 Center for Computational Astrophysics, Flatiron Institute, 162 Fifth Avenue, New York, NY 10010, USA9 Department of Physics and Astronomy, Hounsfield Road, University of Sheffield, S3 7RH, UK
10 Green Bank Observatory, P.O. Box 2, Route 28/92, Green Bank, WV 24944, USAReceived 2017 November 8; revised 2017 December 27; accepted 2018 January 18; published 2018 February 21
Abstract
The Leading Arm (LA) of the Magellanic Stream is a vast debris field of H I clouds connecting the Milky Way andthe Magellanic Clouds. It represents an example of active gas accretion onto the Galaxy. Previously, only onechemical abundance measurement had been made in the LA. Here we present chemical abundance measurementsusing Hubble Space Telescope/Cosmic Origins Spectrograph and Green Bank Telescope spectra of four AGNsightlines passing through the LA and three nearby sightlines that may trace outer fragments of the LA. We findlow oxygen abundances, ranging from -
+4.0 %2.02.0 solar to -
+12.6 %4.16.0 solar, in the confirmed LA directions, with the
lowest values found in the region known as LA III, farthest from the LMC. These abundances are substantiallylower than the single previous measurement, S/H=35±7% solar, but are in agreement with those reported inthe SMC filament of the trailing Stream, supporting a common origin in the SMC (not the LMC) for the majority ofthe LA and trailing Stream. This provides important constraints for models of the formation of the MagellanicSystem. Finally, two of the three nearby sightlines show high-velocity clouds with H I columns, kinematics, andoxygen abundances consistent with LA membership. This suggests that the LA is larger than traditionally thought,extending at least 20° further to the Galactic northwest.
Key words: Galaxy: evolution – Galaxy: halo – ISM: abundances – Magellanic Clouds – quasars: absorption lines
1. Introduction
Understanding the processes that deliver gas to galaxies is amajor goal of modern galactic astrophysics. A key part of thiseffort is the observational characterization of gas cloudsaccreting onto galaxies. In the Milky Way, accreting gascan be seen directly among the population of high-velocityclouds (HVCs; see reviews by Wakker & van Woerden 1997;Putman et al. 2012; Richter 2017), so there is a considerablebody of knowledge on the state of current-day Galacticaccretion. Through a combination of radio 21 cm emission-line spectroscopy and UV absorption-line spectroscopy, thechemical abundances of HVCs can be measured. Theseabundances give important clues on their origin.
The Leading Arm (LA) of the Magellanic Stream (MS) is awell-known HVC complex and a prime example of activeaccretion onto the Milky Way (see the review by D’Onghia &Fox 2016). It forms a network of fragmented clouds connectingthe LMC with the Galactic disk, and is visible in the original21 cm data that led to the discovery of the MS (Wannieret al. 1972; Mathewson et al. 1974). Its connection to the
Magellanic Clouds was demonstrated kinematically by Putmanet al. (1998), and the fact that it leads the orbital motion of theMagellanic Clouds provides strong evidence for a tidal origin,since ram pressure (the chief alternative mechanism forformation of the Stream) cannot easily produce an LA.The LA contains three principal substructures, named LA I,
LA II, and LA III (Putman et al. 1998; Brüns et al. 2005; Foret al. 2013), though a fourth substructure (LA IV) has beenreported (Venzmer et al. 2012; For et al. 2013), and the fullextent of the LA tidal debris field is not known. Thesubstructures likely lie at different distances from the Sun.Region LA I lies below the Galactic plane at d≈20 kpc, basedon the detection of a young stellar population (Casetti-Dinescuet al. 2014; Zhang et al. 2017). Regions LA II and LA III lieabove the plane; the presence of many cometary head-tailclouds (For et al. 2013, 2016) in between LA II and LA IIIsuggests that this inter-cloud region has already reached (and isinteracting with) the outer disk of the Milky Way at a distanceof ≈21kpc (McClure-Griffiths et al. 2008; Casetti-Dinescuet al. 2014).Previous studies of the chemical enrichment of the LA are
limited to a single sightline, toward NGC 3783 (Luet al. 1994, 1998; Sembach et al. 2001), which passes throughLA II. Lu et al. (1998) analyzed Hubble Space Telescope(HST)/Goddard High Resolution Spectrograph spectra andderived an LA sulfur abundance (S/H)=0.35±0.07 solarand a sulfur-to-iron ratio (S/Fe)=10.7±2.2 solar, indicative
The Astrophysical Journal, 854:142 (14pp), 2018 February 20 https://doi.org/10.3847/1538-4357/aaa9bb© 2018. The American Astronomical Society. All rights reserved.
∗ Based on observations taken under programs 12172, 12212, 12248, 12275,13115, and 14687 of the NASA/ESA Hubble Space Telescope, obtained at theSpace Telescope Science Institute, which is operated by the Association ofUniversities for Research in Astronomy, Inc., under NASA contract NAS5-26555, and under programs GBT12A_206, GBT17B_424 of the Green BankObservatory, which is a facility of the National Science Foundation and isoperated by Associated Universities, Inc.
1
of depletion of iron atoms into dust grains (these numbers havebeen updated to reflect the Asplund et al. 2009 solarabundances, rather than the Anders & Grevesse 1989 solarabundances used by Lu et al. 1998). The quarter-solarmetallicity contrasts with measurements in the MS, where ametallicity of ≈0.1 solar or lower has been measured in sevendirections (Fox et al. 2010, 2013; Kumari et al. 2015; Howket al. 2017), supporting an SMC origin, although there is anLMC filament of the Stream with much higher metallicity(≈0.5 solar; Gibson et al. 2000; Richter et al. 2013) anddifferent kinematics (Nidever et al. 2008). This indicates thatthe Stream has a dual origin.
So where and when did the LA originate? Did its origincoincide with the formation of the MS, as tidal models predict?These are the fundamental questions addressed in this paper.We present new and archival HST/Cosmic OriginsSpectrograph (COS) spectra of four sightlines passing throughthe LA, and three sightlines passing nearby, together with H I21 cm observations of the same directions from existing radiosurveys and from new observations. We analyze the O I/H Iand S II/H I ratios to determine the chemical abundances inregions LA I, LA II, and LA III, which are at widely differentangular scales from the LMC. We also investigate whether theHVCs seen in the three nearby sightlines could be physicallyassociated with the LA, to explore its total angular size.
2. Observations and Data Handling
2.1. Sample Creation
We were awarded six orbits of HST/COS time in Cycle 24under Program ID 14687 to observe two LA targets: (1) the B5IVstar CD14-A05 lying close to region LA I; this star was firstidentified as a Magellanic System candidate by Casetti-Dinescuet al. (2012), has a photospheric metallicity [Mg/H]=−0.57±0.35, and a radial velocity vr=133±9 km s−1(Zhang et al.2017); (2) the QSO UVQS J1016-3150 at z=0.2417 (identified
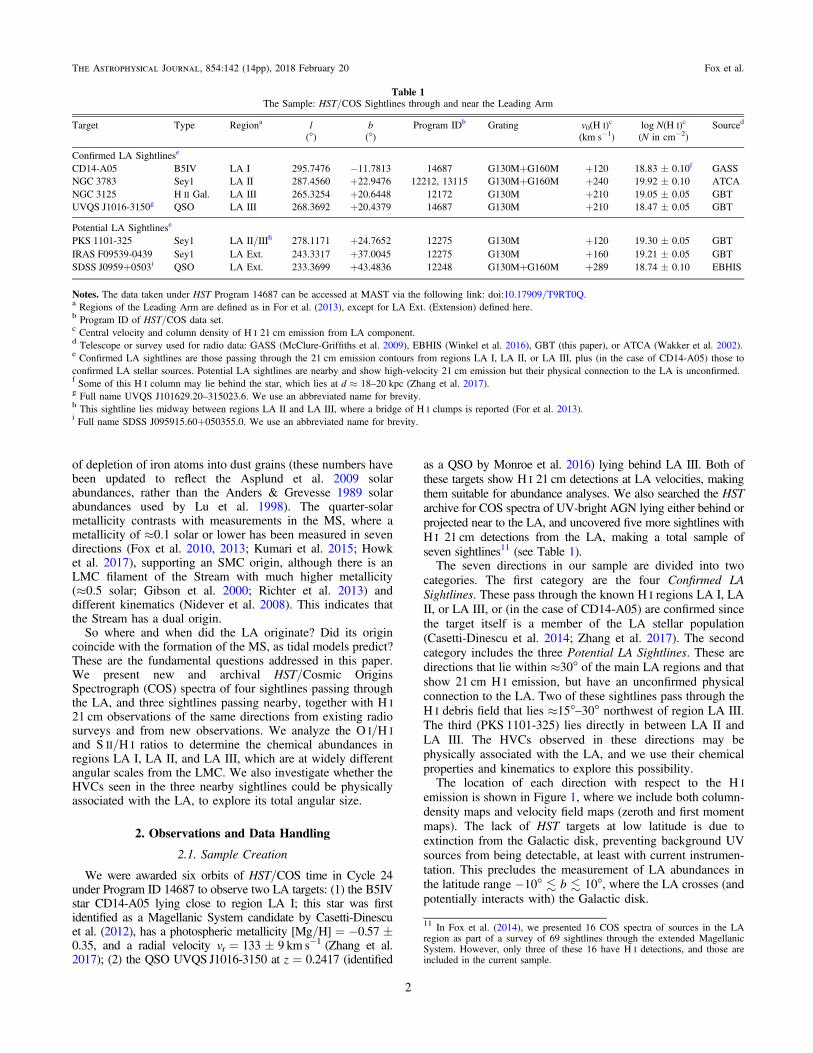
as a QSO by Monroe et al. 2016) lying behind LA III. Both ofthese targets show H I 21 cm detections at LA velocities, makingthem suitable for abundance analyses. We also searched the HSTarchive for COS spectra of UV-bright AGN lying either behind orprojected near to the LA, and uncovered five more sightlines withH I 21 cm detections from the LA, making a total sample ofsevensightlines11 (see Table 1).The seven directions in our sample are divided into two
categories. The first category are the four Confirmed LASightlines. These pass through the known H I regions LA I, LAII, or LA III, or (in the case of CD14-A05) are confirmed sincethe target itself is a member of the LA stellar population(Casetti-Dinescu et al. 2014; Zhang et al. 2017). The secondcategory includes the three Potential LA Sightlines. These aredirections that lie within ≈30° of the main LA regions and thatshow 21 cm H I emission, but have an unconfirmed physicalconnection to the LA. Two of these sightlines pass through theH I debris field that lies ≈15°–30°northwest of region LA III.The third (PKS 1101-325) lies directly in between LA II andLA III. The HVCs observed in these directions may bephysically associated with the LA, and we use their chemicalproperties and kinematics to explore this possibility.The location of each direction with respect to the H I
emission is shown in Figure 1, where we include both column-density maps and velocity field maps (zeroth and first momentmaps). The lack of HST targets at low latitude is due toextinction from the Galactic disk, preventing background UVsources from being detectable, at least with current instrumen-tation. This precludes the measurement of LA abundances inthe latitude range −10°b10°, where the LA crosses (andpotentially interacts with) the Galactic disk.
Table 1The Sample: HST/COS Sightlines through and near the Leading Arm
Target Type Regiona l b Program IDb Grating v0(H I)c log N(H I)c Sourced
(°) (°) (km s−1) (N in cm−2)
Confirmed LA Sightlinese
CD14-A05 B5IV LA I 295.7476 −11.7813 14687 G130M+G160M +120 18.83±0.10f GASSNGC 3783 Sey1 LA II 287.4560 +22.9476 12212, 13115 G130M+G160M +240 19.92±0.10 ATCANGC 3125 H II Gal. LA III 265.3254 +20.6448 12172 G130M +210 19.05±0.05 GBTUVQS J1016-3150g QSO LA III 268.3692 +20.4379 14687 G130M +210 18.47±0.05 GBT
Potential LA Sightlinese
PKS 1101-325 Sey1 LA II/IIIh 278.1171 +24.7652 12275 G130M +120 19.30±0.05 GBTIRAS F09539-0439 Sey1 LA Ext. 243.3317 +37.0045 12275 G130M +160 19.21±0.05 GBTSDSS J0959+0503i QSO LA Ext. 233.3699 +43.4836 12248 G130M+G160M +289 18.74±0.10 EBHIS
Notes.The data taken under HST Program 14687 can be accessed at MAST via the following link:doi:10.17909/T9RT0Q.a Regions of the Leading Arm are defined as in For et al. (2013), except for LA Ext. (Extension) defined here.b Program ID of HST/COS data set.c Central velocity and column density of H I 21 cm emission from LA component.d Telescope or survey used for radio data: GASS (McClure-Griffiths et al. 2009), EBHIS (Winkel et al. 2016), GBT (this paper), or ATCA (Wakker et al. 2002).e Confirmed LA sightlines are those passing through the 21 cm emission contours from regions LA I, LA II, or LA III, plus (in the case of CD14-A05) those toconfirmed LA stellar sources. Potential LA sightlines are nearby and show high-velocity 21 cm emission but their physical connection to the LA is unconfirmed.f Some of this H I column may lie behind the star, which lies at d≈18–20 kpc (Zhang et al. 2017).g Full name UVQS J101629.20–315023.6. We use an abbreviated name for brevity.h This sightline lies midway between regions LA II and LA III, where a bridge of H I clumps is reported (For et al. 2013).i Full name SDSS J095915.60+050355.0. We use an abbreviated name for brevity.
11 In Fox et al. (2014), we presented 16 COS spectra of sources in the LAregion as part of a survey of 69 sightlines through the extended MagellanicSystem. However, only three of these 16 have H I detections, and those areincluded in the current sample.
2
The Astrophysical Journal, 854:142 (14pp), 2018 February 20 Fox et al.

2.2. Data Reduction
For each COS target, we took the extracted one-dimensionalspectra from the calcos pipeline (x1d files) and aligned themin wavelength space using customized reduction software thatcross-correlates the positions of low-ionization ISM lines(following Wakker et al. 2015). The aligned spectra are co-added and then further calibrated using the velocities ofinterstellar 21 cm H I components as zero-points. Lines due to
intergalactic systems at higher redshift were identified. Thedata were continuum-normalized around each absorption lineof interest. The spectra were binned by five pixels (to10 km s−1 bins, to give two rebinned pixels per resolutionelement) for display purposes. A second, night-only reductionwas conducted to extract the data taken during orbitalnighttime. This reduces geocoronal airglow emission in therange 1 1- v100 100LSR km s−1, which allows us to
Figure 1. Maps of the LA showing the location of our HST/COS sightlines (stars) relative to the H I emission from the GASS survey (McClure-Griffiths et al. 2009).The upper map shows the H I velocity field with the COS sightlines color-coded by velocity of absorption. The lower map shows the H I column densities with theCOS sightlines color-coded by N(H I). The H I data in the top-right corner of each map (l<240°, b>40°) are taken from the LAB survey (Kalberla et al. 2005) sinceGASS does not cover this region. Both maps show H I data in the range < <v150 350LSR km s−1, so the Galactic foreground is strong at low latitude. The scatteredmorphology and complex velocity field of the LA are clear. The CD14-A05 sightline is slightly offset from region LA I, but this star has confirmed kinematicmembership of the LA (Casetti-Dinescu et al. 2014; Zhang et al. 2017) and the absorption velocity matches the stellar velocity.
3
The Astrophysical Journal, 854:142 (14pp), 2018 February 20 Fox et al.

measure the O I 1302 line crucial to our abundance analysis.The spectral resolution of the COS data is R≈15,000–18,000(FWHM≈17–20 km s−1), depending on wavelength anddetector lifetime position.
A stack of absorption lines for each direction is presented inFigure 2. The suite of lines shown depends on whether thetarget was observed with both the G130M and G160M gratings(three targets, with coverage from ≈1150 to 1700Å), or justthe G130M grating (four targets, with coverage from ≈1150 to1450Å). For the sightlines observed with both gratings, weshow O I λ1302 (night-only data), Al II λ1670, Si II λλ1260,1193, 1190, 1526, Si III λ1206, S II λλ1250, 1253, Fe IIλλ1144, 1608, C IV λλ1548, 1550, and Si IV λλ1393, 1402.These lines were chosen as the strongest metal lines availablein the COS far-ultraviolet (FUV) bandpass. We do not showC II λ1334 or S II 1259 since these lines are blended at LAvelocities by Galactic C II* 1335 and Si II 1260, respectively.Atomic data were taken from Morton (2003) and verifiedagainst the recent updates by Cashman et al. (2017).
2.3. 21 cm H I Spectra
For the reference H I column densities, we use 21 cm spectrafrom a variety of telescopes, as summarized in Table 1. Forfour of our directions, we obtained new high-sensitivityobservations from the Robert C. Byrd Green Bank Telescope(GBT). These data were taken under programs GBT12A_206and GBT17B_424. The spectra were measured over the LSRvelocity range −450 and +550 km s−1at a velocity resolutionof 0.15 km s−1 using frequency switching. The spectra weresmoothed, converted to brightness temperature, and correctedfor stray radiation following the procedures described inBoothroyd et al. (2011). A third-order polynomial was fit toemission-free regions of the spectra to achieve a final rms noisein brightness temperature of ≈11 mK in a 0.6 km s−1 channel.The GBT has an angular resolution of 9 1 at 1420MHz.
For the other three directions, we use H I 21 cm spectra fromeither (1) the Galactic All-Sky Survey (GASS; 16 1 angularresolution; McClure-Griffiths et al. 2009), (2) the Effelsberg-Bonn H I Survey (EBHIS; 10 8 resolution; Winkel et al.2016), or (3) the Australia Telescope Compact Array (ATCA;1′-resolution; Wakker et al. 2002). The choice of data setadopted in each direction depends on the target declination andavailability of data; we present the highest angular resolutionspectra available for each target.
2.4. Measurement of Absorption
We use the known 21 cm velocity field of the LA (shown inFigure 1(a)) to identify LA absorption components. Theidentification step is important since non-Magellanic absorptioncomponents (from foreground or background structures) couldbe present in the data at other velocities, and without the 21 cmvelocity field one could misidentify them as LA components.
The H I velocity field in the LA is complex, extending frombelow ≈150 to ≈350 km s−1 (Figure 1(a)). The traditionallydefined regions LA I, LA II, and LA III lie in the higher-velocity end (≈200–350 km s−1) of this range, though gas at≈150 km s−1 is found near each LA I, LA II, and LA III. Forthe seven sightlines in our survey, the LSR velocities of the LAcomponents we identify range from +120 to +289 km s−1. Forcontext, the velocity field for high-positive-velocity gas in thisquadrant of the sky is given in Richter et al. (2017). Their
Figure 8 shows an extended population of high-positive-velocity UV absorbers (halo clouds) extending to the Galacticnorthwest beyond the boundaries of the LA, in the direction ofComplexes WA and Complex M, but without 21 cm counter-parts. Therefore, there are no known 21 cm HVCs other thanthe LA in this part of the sky.The two ions we focus on for chemical abundance
measurements are S II and O I, traced via S II λλ1250, 1253(the λ1259 region is blended) and O I λ1302. These ions arethe best metallicity indicators available in the FUV becausesulfur and oxygen are relatively undepleted onto dust grains(Jensen et al. 2005; Jenkins 2009) and have relatively smallionization corrections (ICs; particularly for oxygen; seeSection 3.1). They are also both α-elements so they havesimilar nucleosynthetic origins. Column densities for thesetwo ions were determined via the apparent optical depth(AOD) technique (Savage & Sembach 1991), which returnsaccurate measures of the column density provided the lineprofiles are resolved and unsaturated. The AOD in each pixelis given by t =( ) [ ( ) ( )]v F v F vlna c , where F(v) and Fc(v) arethe observed flux and the estimated continuum flux,respectively, as a function of velocity. The integrated AOD is
òt t= ( )v dva v
va
min
max , and the apparent column density is
l t= ´ -( ) ( ) ( )N v f v3.768 10 aa14 1 cm−2. The velocity range
of absorption, vmin to vmax, is selected by eye to encompass therange of the UV metal-line absorption and the H I emission,though we include a contribution to the error budget toaccount for varying these limits by±5 km s−1.The AOD measurements in each direction are presented in
Table 2. In lines that are clearly or potentially saturated (thosewith normalized flux <( ) ( )F v F v 0.1c ) we present a lowerlimit on Na(v). In lines that are not detected at 3σ significance,we present an upper limit on N(v), based on measuring a 3σlimit on the equivalent width and converting it to columndensity assuming a linear curve of growth.
3. Abundance Determinations
Following standard notation, the ion abundances of O I andS II are defined on a logarithmic scale relative to solar:
= - -= - -
:
:
[ ] [ ( ) ( )] ( )[ ] [ ( ) ( )] ( )
N NN N
O H log O log H log O H andS H log S log H log S H .
I I I I
II I II I
We use the solar oxygen and sulfur abundances of Asplundet al. (2009), which are log(O/H)e=−3.31 and log(S/H)e=−4.88. The ion abundances simply represent the observedconcentration of ions relative to hydrogen, without any ICbeing applied.
3.1. Ionization Corrections
Due to differences in ionization potentials (IPs) betweenvarious ions and H I, ionization effects can lead to differencesbetween the ion abundances and the true elemental abundances.These differences are known as ICs, where
= += +
[ ] [ ] ( )[ ] [ ] ( )O H O H IC O andS H S H IC S .
I I
II I
The magnitude of the IC depends on the element. Foroxygen, the close similarity in the first IPs of hydrogen(13.60 eV) and oxygen (13.62 eV) coupled with charge-exchange reactions make the ICs very small (Field &Steigman 1971; Viegas 1995), except in cases of intense
4
The Astrophysical Journal, 854:142 (14pp), 2018 February 20 Fox et al.

Figure 2. (a) HST/COS spectra of UV metal-line absorption in each sightline in our sample. Normalized flux is plotted against LSR velocity for a range of low-ionand high-ion transitions. In each direction, a 21 cm H I emission profile is included in the top-left panel. Golden shading denotes the LA component; the LA velocitycentroid is indicated by the vertical dashed line. The COS data and the H I data have been rebinned by five pixels for display purposes. The O I λ1302 data are from anight-only reduction. (b) HST/COS and 21 cm H I spectra of each sightline in our sample. (c) HST/COS and 21 cm H I spectra of each sightline in our sample.
5
The Astrophysical Journal, 854:142 (14pp), 2018 February 20 Fox et al.

radiation fields. For sulfur, the (larger) IP of S II (23.34 eV)means that the ion can exist in regions where the hydrogen islargely ionized, and so the IC is larger.
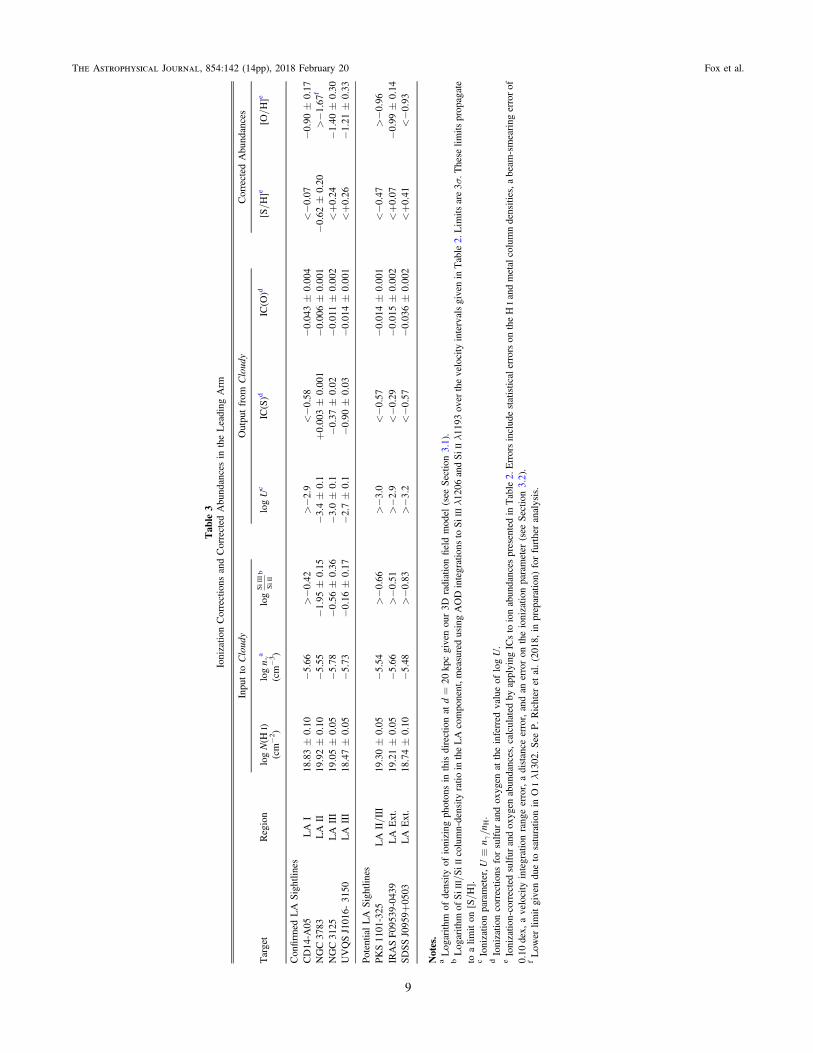
To calculate the ICs, we computed a grid of photoionizationsimulations using the Cloudy radiative transfer code (Ferlandet al. 2013). The simulations use a plane–parallel geometry andassume that the plasma has uniform density, so they do notaccount for clumpiness in the gas. For a given set of inputparameters, Cloudy calculates the ionization breakdown of allchemical elements up to zinc. The ICs are a function of theionization parameter º gU n nH (the ratio of the ionizingphoton density to the gas density) and the H I column density N(H I) in the LA component. These parameters are constrained asfollows:
(1) To derive nγ, we use a 3D model of the Galactic ionizingradiation field from Fox et al. (2014), which is based onBland-Hawthorn & Maloney (1999) and updated byBarger et al. (2013) to include the radiation from theMagellanic Clouds. This is combined with the Haardt &Madau (2001) model of the extragalactic radiation field atz=0. The LA is taken to be at d=20 kpc, based on theexisting distance constraints toward LA I (Casetti-Dinescu et al. 2014; Zhang et al. 2017), though seeSection 3.2 for a discussion of the effect of changing thedistance.
(2) U is derived from the observed Si III/Si IIcolumn-densityratio in the LA; this ratio is a monotonic function of U forvarious ionizing radiation fields (Fox et al. 2016;Bordoloi et al. 2017). Knowing U and nγ allows nH tobe calculated. LA directions, where both Si III λ1206 andone of the Si II lines (λ1260, 1190, 1193, 1190) areunsaturated (and thus measurable) have the best con-strained models. When Si III is saturated, only a lowerlimit on the Si III/Si II ratio can be measured, whichtranslates to a lower limit on logU and a limit on IC(S).Fortunately, IC(O) is independent of logU when log N(H I)>18 (Bordoloi et al. 2017), as is the case for allseven sightlines in our sample. Therefore, uncertainty inthe knowledge of logU does not affect the reliability ofour oxygen abundances.
(3) N(H I) is directly measured in the 21 cm data byintegrating over the velocity range of the LA component.
By running Cloudy models in this manner, we derived theICs and the corrected sulfur and oxygen abundances presentedin Table 3. Notice that for the range of logN(H I) in our LAsample (18.47–19.92), the ICs for oxygen are negligible
1(∣ ( )∣IC O 0.04 dex) but the ICs for sulfur are substantial (upto −0.90 dex), particularly in the cases where log N(H I)<19.0. The oxygen abundances should therefore beconsidered more robust.
Figure 2. (Continued.)
6
The Astrophysical Journal, 854:142 (14pp), 2018 February 20 Fox et al.

3.2. Uncertainties in the Abundance Measurements
We investigated the uncertainty in the abundance measure-ments caused by six sources of error: the distance to the LA, thevelocity integration range, the beam-size mismatch betweenradio and UV observations, the error on logU, the statisticalerror in the measurements of UV absorption, and the statisticalerror in the measurements of H I emission. The first four ofthese are now discussed in turn (the last two are self-explanatory). The six sources of error were added in quadratureto produce the final errors on the abundance measurementspresented in Table 3. The statistical errors on the UVabsorption measurements dominate the errors.
(1) Uncertainty in distance: to investigate the uncertainty inthe ICs caused by uncertainty in the distance to the LA, we ranCloudy models for the NGC 3125 sightline for five heliocentricdistances: 10, 20, 30, 40, and 50 kpc, where 20 kpc is thenominal case because of existing distance constraints. Thissightline (through LA III) was chosen to be representative ofthe LA directions, given its intermediate value of logN(H I)=19.05. All other properties of the models were heldconstant; increasing the distance decreases the Galacticcontribution to the ionizing radiation field, while keeping the
UV background contribution fixed. For each distance, wecomputed the best-fit value of logU, IC(S), and IC(O). Wefound that IC(S) varies from −0.42 at 10 kpc to −0.35 at50 kpc, whereas IC(O) remains flat at −0.01 at all distances.The distance error is therefore negligible for the oxygenabundances and reaches −0.07 dex for the sulfur abundances.(2) Uncertainty in velocity integration range: in each
direction, the velocity integration range vmin to vmax waschosen to encompass the H I emission and the UV absorptionfrom the LA. By varying vmin and vmax by±5 km s−1, wequantify the error on N(H I), which propagates directly to theabundance measurements. The magnitude of this error variesfrom 0.01 to 0.06 dex for our seven sightlines.(3) Uncertainty due to beam smearing: because of the
mismatched beam-size between pencil-beam UV observationsand finite-beam radio observations, a beam-smearing errorshould be included in abundance measurements to account forsmall-scale structure. In our case, the radio beam-sizes rangefrom 1′ (ATCA), 9 1 (GBT), 10 8 (EBHIS), to 16 1 (GASS)The magnitude of the beam-smearing effect on abundancemeasurements across these angular scales has been shown to be≈0.10 dex (Wakker et al. 2001; Fox et al. 2010), so we adopt
Figure 2. (Continued.)
7
The Astrophysical Journal, 854:142 (14pp), 2018 February 20 Fox et al.
an error on the abundances of 0.10 dex to account for this.Nonetheless, small-scale structure on sub-beam scales isdifficult to quantify and cannot be ruled out, particularly giventhe highly fragmentary nature of the LA emission.
(4) Uncertainty in log U: the error in the value of logUderived from the Si III/Si II ratio is ≈0.1 dex. This translates toerrors in IC(S) ranging from 0.01 to 0.03, and errors in IC(O)ranging from 0.001 to 0.004 dex. The errors on IC(O) are anorder of magnitude smaller since IC(O) is a flat function oflogU, whereas IC(S) increases with logU.
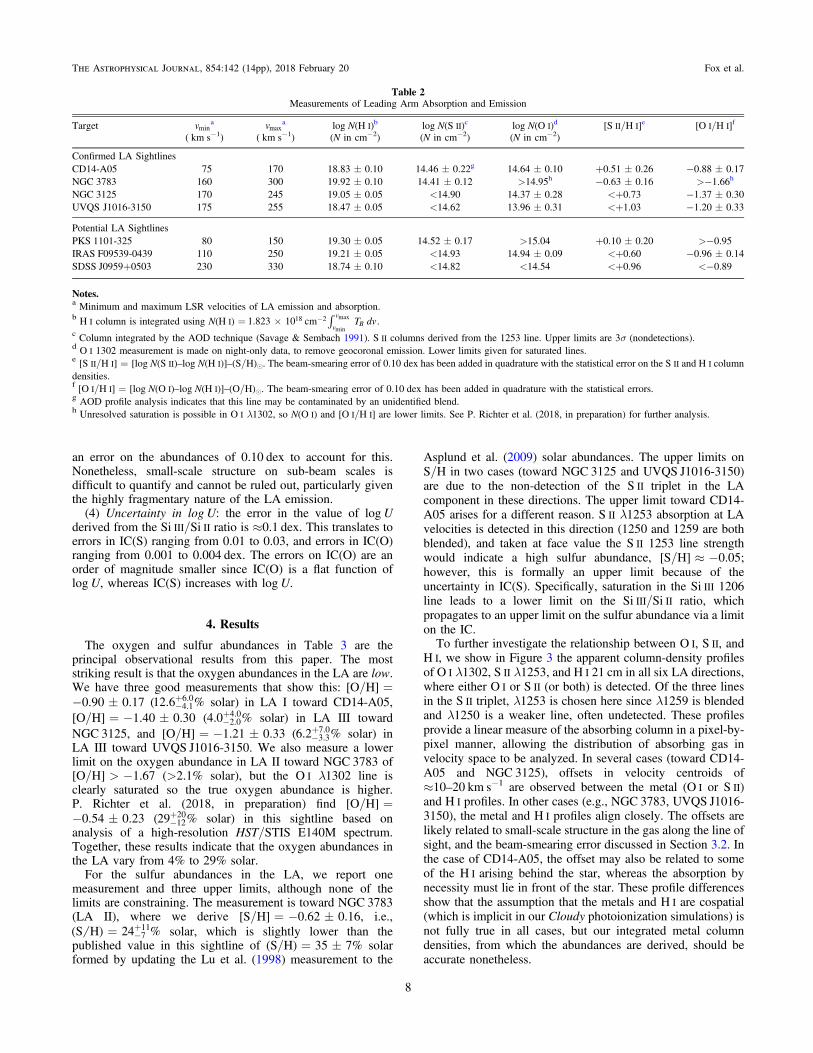
4. Results
The oxygen and sulfur abundances in Table 3 are theprincipal observational results from this paper. The moststriking result is that the oxygen abundances in the LA are low.We have three good measurements that show this: [O/H]=−0.90±0.17 ( -
+12.6 %4.16.0 solar) in LA I toward CD14-A05,
[O/H]=−1.40±0.30 ( -+4.0 %2.0
4.0 solar) in LA III towardNGC 3125, and [O/H]=−1.21±0.33 ( -
+6.2 %3.37.0 solar) in
LA III toward UVQS J1016-3150. We also measure a lowerlimit on the oxygen abundance in LA II toward NGC 3783 of[O/H]>−1.67 (>2.1% solar), but the O I λ1302 line isclearly saturated so the true oxygen abundance is higher.P. Richter et al. (2018, in preparation) find [O/H]=−0.54±0.23 ( -
+29 %1220 solar) in this sightline based on
analysis of a high-resolution HST/STIS E140M spectrum.Together, these results indicate that the oxygen abundances inthe LA vary from 4% to 29% solar.
For the sulfur abundances in the LA, we report onemeasurement and three upper limits, although none of thelimits are constraining. The measurement is toward NGC 3783(LA II), where we derive [S/H]=−0.62±0.16, i.e.,
= -+( )S H 24 %7
11 solar, which is slightly lower than thepublished value in this sightline of (S/H)=35±7% solarformed by updating the Lu et al. (1998) measurement to the
Asplund et al. (2009) solar abundances. The upper limits onS/H in two cases (toward NGC 3125 and UVQS J1016-3150)are due to the non-detection of the S II triplet in the LAcomponent in these directions. The upper limit toward CD14-A05 arises for a different reason. S II λ1253 absorption at LAvelocities is detected in this direction (1250 and 1259 are bothblended), and taken at face value the S II 1253 line strengthwould indicate a high sulfur abundance, [S/H]≈−0.05;however, this is formally an upper limit because of theuncertainty in IC(S). Specifically, saturation in the Si III 1206line leads to a lower limit on the Si III/Si II ratio, whichpropagates to an upper limit on the sulfur abundance via a limiton the IC.To further investigate the relationship between O I, S II, and
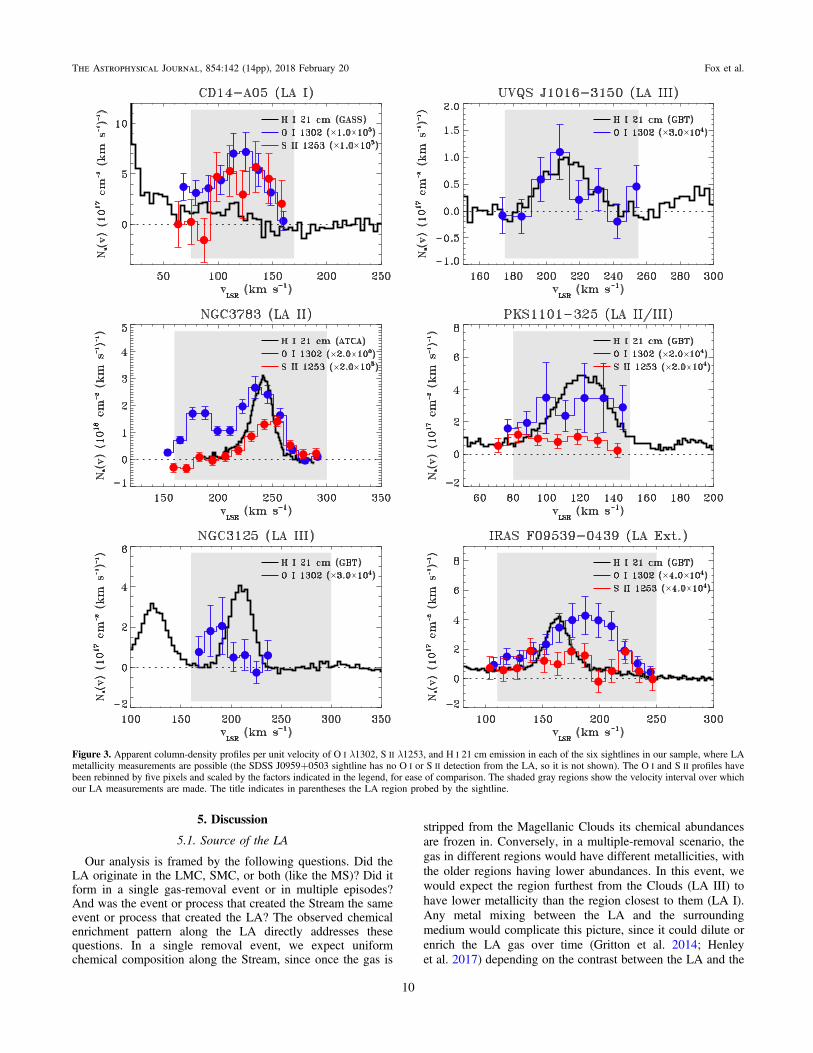
H I, we show in Figure 3 the apparent column-density profilesof O I λ1302, S II λ1253, and H I 21 cm in all six LA directions,where either O I or S II (or both) is detected. Of the three linesin the S II triplet, λ1253 is chosen here since λ1259 is blendedand λ1250 is a weaker line, often undetected. These profilesprovide a linear measure of the absorbing column in a pixel-by-pixel manner, allowing the distribution of absorbing gas invelocity space to be analyzed. In several cases (toward CD14-A05 and NGC 3125), offsets in velocity centroids of≈10–20 km s−1 are observed between the metal (O I or S II)and H I profiles. In other cases (e.g., NGC 3783, UVQS J1016-3150), the metal and H I profiles align closely. The offsets arelikely related to small-scale structure in the gas along the line ofsight, and the beam-smearing error discussed in Section 3.2. Inthe case of CD14-A05, the offset may also be related to someof the H Iarising behind the star, whereas the absorption bynecessity must lie in front of the star. These profile differencesshow that the assumption that the metals and H I are cospatial(which is implicit in our Cloudy photoionization simulations) isnot fully true in all cases, but our integrated metal columndensities, from which the abundances are derived, should beaccurate nonetheless.
Table 2Measurements of Leading Arm Absorption and Emission
Target vmina vmax
a log N(H I)b log N(S II)c log N(O I)d [S II/H I]e [O I/H I]f
( km s−1) ( km s−1) (N in cm−2) (N in cm−2) (N in cm−2)
Confirmed LA SightlinesCD14-A05 75 170 18.83±0.10 14.46±0.22g 14.64±0.10 +0.51±0.26 −0.88±0.17NGC 3783 160 300 19.92±0.10 14.41±0.12 >14.95h −0.63±0.16 >−1.66h
NGC 3125 170 245 19.05±0.05 <14.90 14.37±0.28 <+0.73 −1.37±0.30UVQS J1016-3150 175 255 18.47±0.05 <14.62 13.96±0.31 <+1.03 −1.20±0.33
Potential LA SightlinesPKS 1101-325 80 150 19.30±0.05 14.52±0.17 >15.04 +0.10±0.20 >−0.95IRAS F09539-0439 110 250 19.21±0.05 <14.93 14.94±0.09 <+0.60 −0.96±0.14SDSS J0959+0503 230 330 18.74±0.10 <14.82 <14.54 <+0.96 <−0.89
Notes.a Minimum and maximum LSR velocities of LA emission and absorption.b H I column is integrated using N(H I)= ò´ - T dv1.823 10 cm
v
vB
18 2min
max .c Column integrated by the AOD technique (Savage & Sembach 1991). S II columns derived from the 1253 line. Upper limits are 3σ (nondetections).d O I 1302 measurement is made on night-only data, to remove geocoronal emission. Lower limits given for saturated lines.e [S II/H I]=[log N(S II)–log N(H I)]–(S/H)e. The beam-smearing error of 0.10 dex has been added in quadrature with the statistical error on the S II and H I columndensities.f [O I/H I]=[log N(O I)–log N(H I)]–(O/H)e. The beam-smearing error of 0.10 dex has been added in quadrature with the statistical errors.g AOD profile analysis indicates that this line may be contaminated by an unidentified blend.h Unresolved saturation is possible in O I λ1302, so N(O I) and [O I/H I] are lower limits. See P. Richter et al. (2018, in preparation) for further analysis.
8
The Astrophysical Journal, 854:142 (14pp), 2018 February 20 Fox et al.
Tab
le3
Ionizatio
nCorrections
andCorrected
Abu
ndancesin
theLeading
Arm
Inp
utto
Cloud
y
Outpu
tfrom
Cloud
y
Corrected
Abu
ndances
Target
Region
logN(H
I)logn γ
alog
Si SiII
I II
blogUc
IC(S)d
IC(O
)d[S/H
]e[O
/H]e
(cm
−2 )
(cm
−3 )
Confirm
edLA
Sigh
tlines
CD14
-A05
LA
I18
.83±0.10
−5.66
>−0.42
>−2.9
<−0.58
−0.04
3±0.004
<−0.07
−0.90±
0.17
NGC37
83LA
II19
.92±0.10
−5.55
−1.95±
0.15
−3.4±0.1
+0.00
3±0.001
−0.00
6±0.001
−0.62±
0.20
>−1.67
f
NGC31
25LA
III
19.05±0.05
−5.78
−0.56±
0.36
−3.0±0.1
−0.37±
0.02
−0.01
1±0.002
<+0.24
−1.40±
0.30
UVQSJ101
6-31
50LA
III
18.47±0.05
−5.73
−0.16±
0.17
−2.7±0.1
−0.90±
0.03
−0.01
4±0.001
<+0.26
−1.21±
0.33
PotentialLA
Sigh
tlines
PKS11
01-325
LA
II/III
19.30±0.05
−5.54
>−0.66
>−3.0
<−0.57
−0.01
4±0.001
<−0.47
>−0.96
IRASF0
9539
-043
9LA
Ext.
19.21±0.05
−5.66
>−0.51
>−2.9
<−0.29
−0.01
5±0.002
<+0.07
−0.99±
0.14
SDSS
J095
9+05
03LA
Ext.
18.74±0.10
−5.48
>−0.83
>−3.2
<−0.57
−0.03
6±0.002
<+0.41
<−0.93
Notes.
aLog
arith
mof
density
ofionizing
photon
sin
thisdirectionat
d=20kp
cgivenou
r3D
radiationfieldmod
el(see
Section3.1).
bLog
arith
mof
SiIII/Si
IIcolumn-density
ratio
intheLAcompo
nent,m
easuredusingAODintegrations
toSi
IIIλ12
06andSi
IIλ11
93ov
erthevelocity
intervalsgivenin
Table2.
Lim
itsare3σ
.These
limits
prop
agate
toalim
iton
[S/H
].cIonizatio
nparameter,
ºg
Un
n H.
dIonizatio
ncorrectio
nsforsulfur
andox
ygen
attheinferred
valueof
logU.
eIonizatio
n-correctedsulfur
andox
ygen
abun
dances,calculatedby
applying
ICsto
ionabun
dances
presentedin
Table2.
Errorsinclud
estatisticalerrorson
theH
Iandmetalcolumndensities,a
beam
-smearing
errorof
0.10
dex,
avelocity
integrationrang
eerror,adistance
error,andan
erroron
theionizatio
nparameter
(see
Section3.2).
fLow
erlim
itgivendu
eto
saturatio
nin
OIλ13
02.S
eeP.
Richter
etal.(20
18,inpreparation)
forfurtheranalysis.
9
The Astrophysical Journal, 854:142 (14pp), 2018 February 20 Fox et al.
5. Discussion
5.1. Source of the LA
Our analysis is framed by the following questions. Did theLA originate in the LMC, SMC, or both (like the MS)? Did itform in a single gas-removal event or in multiple episodes?And was the event or process that created the Stream the sameevent or process that created the LA? The observed chemicalenrichment pattern along the LA directly addresses thesequestions. In a single removal event, we expect uniformchemical composition along the Stream, since once the gas is
stripped from the Magellanic Clouds its chemical abundancesare frozen in. Conversely, in a multiple-removal scenario, thegas in different regions would have different metallicities, withthe older regions having lower abundances. In this event, wewould expect the region furthest from the Clouds (LA III) tohave lower metallicity than the region closest to them (LA I).Any metal mixing between the LA and the surroundingmedium would complicate this picture, since it could dilute orenrich the LA gas over time (Gritton et al. 2014; Henleyet al. 2017) depending on the contrast between the LA and the
Figure 3. Apparent column-density profiles per unit velocity of O I λ1302, S II λ1253, and H I 21 cm emission in each of the six sightlines in our sample, where LAmetallicity measurements are possible (the SDSS J0959+0503 sightline has no O I or S IIdetection from the LA, so it is not shown). The O I and S IIprofiles havebeen rebinned by five pixels and scaled by the factors indicated in the legend, for ease of comparison. The shaded gray regions show the velocity interval over whichour LA measurements are made. The title indicates in parentheses the LA region probed by the sightline.
10
The Astrophysical Journal, 854:142 (14pp), 2018 February 20 Fox et al.
halo metallicity. This contrast is not well constrainedobservationally.
With that introduction, our first observation is that all regionsof the LA show metallicities below the current-day metallicityof the LMC (46% solar) and the SMC (22% solar; Russell &Dopita 1992; Trundle et al. 2007), with the single exception ofthe sulfur abundance of 34±7% solar in the high N(H I) coreof LA II. Our three LA measurements of O/H range from
-+4.0 %2.0
4.0 solar to -+12.6 %4.1
6.2 solar and are therefore well belowZLMC and ZSMC. This simple point is worth emphasizing,because it indicates that the LA was formed either (1) long ago(several gigayears ago), when the LMC and SMC abundanceswere lower according to their age–metallicity relations (Pagel& Tautvaivsienė 1998; Harris & Zaritsky 2004, 2009; Meschinet al. 2014), or (2) from the outer regions of the LMC or SMCwhere the metallicity is lower than in the inner regions becauseof radial abundance gradients. Evidence for radial abundancegradients in the Magellanic Clouds based on stellar and nebularmetallicities is mixed: Toribio San Cipriano et al. (2017) findno strong gradient in H II region abundances in either galaxy,and Cioni (2009) find no significant gradient in AGB-starabundances in the SMC. However, Cioni (2009) report agradient in AGB-star abundances in the LMC of−0.047±0.003 dex kpc−1 out to 8 kpc, and Dobbie et al.(2014) find a gradient of −0.075±0.011 dex deg−1 for redgiant stars in the inner 5° of the SMC. Therefore, both the LAage and Magellanic abundance gradients may be factors inexplaining the LA’s low metallicity.
Our second observation is that there is spatial variation of theoxygen abundances. The two directions through region LA IIIhave identical (low) oxygen abundances, given the observa-tional errors, with [O/H]=−1.40±0.30 toward NGC 3125and [O/H]=−1.21±0.33 toward UVQS J1016-3150. Forregion LA II, we only report a limit on [O/H], but P. Richteret al. (2018, in preparation) find a higher value of [O/H]=−0.54±0.23 in this sightline based on the analysis of a high-resolution HST/STIS spectrum. Region LA I also has a slightlyhigher abundance, [O/H]=−0.90±0.17 (13% solar), basedon the measurement toward CD14-A05. This observedabundance gradient, with LA III having lower metallicity thanLA I and II, is consistent with LA III being older than LA I andII, which is important considering that LA III lies far awayfrom the Magellanic Clouds on the sky (see Figure 1) and thushas a longer travel time to reach its current location. Thegradient supports a multiple-episode formation scenario forthe LA.
However, the existence of this gradient should be consideredtentative until more data are available, especially consideringthe statistical uncertainties. Another caveat is that our singleabundance measurement in LA I (toward CD14-A05) isderived from a stellar sightline, not an AGN sightline, andwe cannot rule out the possibility of some self-enrichment ofthe LA in this direction by recent star formation. Moreover,some of the H I emission toward CD14-A05 may exist behindthe star, whereas the metal absorption lies in front. Thispossibility, which is suggested by the mismatch in velocitycentroid between H I emission and UV metal absorption in thisdirection (Figure 2), could potentially lead to an underestimateof the LA oxygen abundance, since it would cause anoverestimation of the foreground H I column.
Our third observation is that the very low (≈4%–6% solar)oxygen abundances measured in region LA III are too low to
support an LMC origin. Even the abundances in regions LA I(≈11% solar) and LA II (≈29% solar) are difficult to reconcilewith a recent LMC origin unless the gas was stripped from theouter regions of the LMC. This strongly suggests that LA III,and potentially all the LA, is formed from material from theSMC, not the LMC. This stands in contrast to studies of the LAH I kinematics, which find that the LA arises almost entirelyfrom the LMC (Putman et al. 1998; Nidever et al. 2008;Venzmer et al. 2012), but it supports several tidal and ram-pressure models of MS and LA formation (Gardiner &Noguchi 1996; Connors et al. 2006; Besla et al. 2012; Diaz& Bekki 2012; Yang et al. 2014), which predict that the MSand LA form together from SMC material.Furthermore, the oxygen abundances in the LA match the
α-element abundances measured in most of the trailing MS;oxygen or sulfur abundances of 10% solar or less have beenmeasured in seven directions through the SMC filament of theStream (Fox et al. 2010, 2013; Kumari et al. 2015; Howket al. 2017), though there is also an LMC filament with 50%solar abundances (Gibson et al. 2000; Richter et al. 2013). OurLA metallicities can also be compared to those measured in theMagellanic Bridge, the gaseous connection between the LMCand SMC. A Bridge metallicity of 10% solar or lower has beenreported in several studies (Lehner et al. 2001; Lehner 2002;Misawa et al. 2009) targeting stars and background quasars.The finding that the Bridge, most of the LA, and most of theStream have low metallicity (10% solar) provides support foran SMC origin for most of the gas in the Magellanic system.
5.2. Origin Mechanism of the LA
The similarity in oxygen abundances between regions LA IIIand the SMC filament of the MS (which represents the majorityof the MS) supports an origin model in which LA III and theMS were generated in the same event in the past, when theSMC had a lower metallicity. Most tidal and ram-pressuremodels of the MS date its age to ≈1.5–2.5 Gyr (Moore & Davis1994; Gardiner & Noguchi 1996; Yoshizawa & Noguchi 2003;Mastropietro et al. 2005; Connors et al. 2006; Besla et al. 2010;Diaz & Bekki 2012) although a direct LMC–SMC collisionmay have happened more recently (∼100–500Myr ago; Beslaet al. 2012; Hammer et al. 2015). Independently, age–metallicity studies of the stellar population of the SMC findthat it had a mean metallicity of 0.1 solar ≈2 Gyr ago (Pagel &Tautvaivsienė 1998; Harris & Zaritsky 2004). These twofindings are consistent with the idea that much of the Streamand LA were formed at that time from SMC gas released froman LMC–SMC encounter.If the LA is at d=20 kpc, as measured in two separate
regions (McClure-Griffiths et al. 2009; Casetti-Dinescu et al.2014), then it cannot be a purely tidal feature produced at thefirst passage of the LMC and SMC. The reason is that theClouds are at ≈50–60 kpc, so in a first-passage scenario (Beslaet al. 2007, 2010, 2012) the LA should be close to or beyondthat distance, not 20 kpc (e.g., see Figure 10 in Beslaet al. 2012). Conversely, in a multiple-passage scenario, theLA may have had time to fall down closer to the MW. Our LAabundance measurements do not resolve this issue but doprovide constraints on when the gas was removed from theClouds, since they indicate that the gas is chemicallyunenriched.In addition to tidal forces and ram pressure, another physical
process relevant to the formation of the MS and LA may be
11
The Astrophysical Journal, 854:142 (14pp), 2018 February 20 Fox et al.
stellar feedback. The LMC is known to drive an outflow, asseen in UV absorption lines blueshifted with respect to theLMC systemic velocity (Lehner & Howk 2007; Lehneret al. 2009; Barger et al. 2016), although the LMC outflowdoes not contain enough mass flux to reproduce the mass of theStream (Barger et al. 2016). In the SMC, evidence for stellarfeedback was seen in O VI absorption by Hoopes et al. (2002),who report O VI column densities correlated to proximity tostar-forming regions, and O VI kinematics consistent with agalactic fountain. These studies indicate that feedback from starformation drives material out of the Magellanic Clouds intotheir halos, where ram-pressure and tidal forces may disperse itover larger distances (Olano 2004; Nidever et al. 2008, 2010;Besla et al. 2012). The finding that the LMC filament of the MScan be traced back to a region near 30 Doradus (Nideveret al. 2008), an actively star-forming region, supports thisconnection between stellar feedback and Stream formation,although the low LA metallicity we measure does not favor anLMC origin. Indeed, the lack of evidence for a half-solar LAfilament as a counterpart to the known half-solar MS filament isan important result of our study, since purely tidal modelswould be expected to produce such a counterpart.
5.3. Stellar Abundances in the LA
For the stellar component of the LA, chemical abundanceswere measured by Zhang et al. (2017) for a sample of earlyB-stars located in regions LA I, II, and III discovered byCasetti-Dinescu et al. (2014). They found that the fivekinematical members of the LA have an average Mgabundance of [Mg/H]=−0.42±0.16, close to the LMCabundance, and significantly lower than that that of non-members. However, individually, our target CD14-A05 has[Mg/H]=−0.57±0.35, compatible within errors with theSMC Mg abundance = -[ ]Mg H 0.8 0.1SMC (Trundleet al. 2007), and also compatible with the gas-phase oxygenabundance we measure in the same sightline, [O/H]gas=−0.90±0.17. This similarity between the stellar and gas-phase metallicity is interesting given the possibility that someof the H I lies behind the star, such that [O/H]gas is formally alower limit on the LA oxygen abundance in this direction.Furthermore, the B-type stars (like CD14-A05) may haveformed from gas enriched by previous episodes of starformation. More data are needed to explore the relationshipbetween the stellar and gas-phase abundances in the LA inmore depth.
5.4. Outlying Fragments and Size of the LA
The three sightlines in our sample lying away from the mainregions of the LA are those toward PKS 1101-325 (betweenLA II and LA III), IRAS F09539-0439 (≈15° northwest of LAIII), and SDSS J0959+0503 (≈30° northwest of LA III). Allthree directions show HVCs with similar H I columns, withlog N(H I) between 18.74 and 19.30. Two of the three showkinematics consistent with those of the main LA regions (theexception is SDSS J0959+0503, where the HVC velocity of289 km s−1appears to be too high for an LA origin). The sulfurand oxygen abundances in these HVCs are given in the lowerpart of Table 3. Toward PKS 1101-325, IRAS F09539-0439,and SDSS J0959+0503, we find [O/H]>−0.96, [O/H]=−0.99±0.14, and [O/H]<−0.93 (3σ), respectively. Theseabundances are all close enough to our confirmed LA
abundances to suggest that the HVCs are outlying fragmentsof the LA: they have the right kinematics, H I columns, andoxygen abundances to support this idea. In this interpretationthe LA extends at least ≈20° further to the northwest (inGalactic coordinates) than the named regions (LA I, II, and III),and the outer fragments trace the full extent of the debris field.The LA then covers a linear extent of ≈80°and an area on thesky of ≈60°×80°. Nonetheless, this extended LA is stillconsiderably shorter than the trailing Stream, which is ≈140°long (Nidever et al. 2010). This asymmetry is an importantconstraint for origin models (e.g., Pardy et al. 2018). Thepresence of fragmented small-scale structure has long beennoticed as a key feature of the neutral gas in the MagellanicSystem, including the LA (Stanimirović et al. 2002; Putmanet al. 2003; Westmeier & Koribalski 2008; Venzmeret al. 2012; For et al. 2013). Our new results extend the regionover which such small-scale structure is seen.The finding that the LA is larger than traditionally thought is
reproduced in several simulations (e.g., Yang et al. 2014;Hammer et al. 2015). It is also consistent with results fromother regions of the Magellanic System, where UV absorptiondetections are reported in directions up to 30° away from theH I Stream (Fox et al. 2005, 2014; Kumari et al. 2015; Howket al. 2017). Furthermore, For et al. (2013) report a bridge ofLA cloudlets in between LA II and LA III; our HVC at+150 km s−1 toward PKS 1101-325(which lies halfwaybetween LA II and LA III) may trace this gaseous bridge.The known presence of LA gas in this region supports ourinterpretation of the +150 km s−1 HVC as tracing the LA.
6. Summary
Using new and archival HST/COS spectra, we have studiedthe LA in UV absorption of four sightlines, sampling each ofthe three main regions LA I, LA II, and LA III. We also presentan analysis of the HVC absorption in three additional nearbyCOS sightlines to investigate whether these HVCs representoutlying fragments of the LA. We combined the COS data withnew and publicly available H I 21 cm spectra and applied achemical abundance analysis, focusing on the gas-phase O/Hratio because of its small dust correction. We ran tailoredCloudy photoionization simulations to calculate the ICs. Wehave arrived at the following conclusions.
1. The oxygen abundances in all four sightlines throughthe LA are low, ranging from [O/H]=−1.40±0.30 ( -
+4.0 %2.02.0 solar) toward NGC 3125 to [O/H]=
−0.90±0.17 ( -+12.5 %4.1
6.0 solar) toward CD14-A05, and[O/H]=−0.54±0.23 ( -
+29 %1220 solar) toward
NGC 3783 (P. Richter et al. 2018, in preparation). Theseoxygen abundances are unlikely to be affected by dustor ICs.
2. We observe a variation in metallicity with location in theLA. The abundance measurements in region LA I(O/H=12.5% solar) and LA II (O/H=25% solar)are higher than the two measurements in region LA III(O/H=4%–6% solar). LA III is the region farthest fromthe LMC, so its lower metal enrichment suggests that it isthe oldest part of the LA.
3. The LA III oxygen abundances are too low to support anLMC origin and indicate an SMC origin, even whenaccounting for the evolution in metallicity of theMagellanic Clouds over the last few gigayears. The
12
The Astrophysical Journal, 854:142 (14pp), 2018 February 20 Fox et al.

origin of LA I and LA II cannot be conclusivelydetermined from their oxygen abundances alone, butthe observed abundance gradient is consistent with anSMC origin for the entire LA.
4. The low oxygen abundances in the LA, particularly in LAIII, match those measured in the SMC filament of thetrailing MS. This is consistent with at least parts ofthe LA being generated in the same event that generatedthe Stream, as predicted by many simulations of Streamformation. Tidal models of the Stream and the age–metallicity relation of the SMC suggest this eventhappened ≈1.5–2.5 Gyr ago via an LMC–SMC closeencounter, although a direct collision may have occurredmore recently (100–500Myr ago).
5. The oxygen abundances, H I columns, and kinematics ofthe HVCs measured in two directions (PKS 1101-325 andIRAS F09539-0439) away from the main LA complexesare consistent with an LA origin. One of these directionslies ≈20° further to the Galactic northwest than LA III.This suggests (but does not prove) that the LA has alarger spatial extent than previously thought, forming anextended debris field, covering a ≈60°×80° region.
In an upcoming paper, we will present an in-depth analysisof the NGC 3783 sightline (passing through LA II) using FUSEand STIS data (P. Richter et al. 2018, in preparation). Theunusually high H I column in this direction allows a wide rangeof molecular and low-ion metal lines to be detected, enabling adetailed abundance and physical-conditions analysis beyondthe scope of the current paper.
In closing, we note that the chemical abundances presentedin this paper, and specifically the low oxygen abundancesindicative of an SMC origin, are important clues to constrainnumerical simulations of MS and LA formation. Purely tidalmodels for MS formation predict that the trailing and leadingarms form at the same time, but our abundance analysis showsno evidence yet for a leading LMC filament as a counterpart tothe trailing LMC filament. This seemingly indicates that purelytidal models are unable to explain the LA, and that anotherphysical process such as ram pressure or stellar feedback maycontribute. Further comparisons between observations andsimulations will be necessary to piece together the fullinteraction history of our closest satellite neighbors.
Support for program 14687 was provided by NASA throughgrants from the Space Telescope Science Institute, which isoperated by the Association of Universities for Research inAstronomy, Inc., under NASA contract NAS5-26555. Wethank Jerry Kriss for kindly sharing his reductions of the COSdata of NGC 3783, and we are grateful to the anonymousreferee for a useful report.
Facilities: HST (COS), GBT, ATCA, Parkes, Effelsberg.
ORCID iDs
Andrew J. Fox https://orcid.org/0000-0003-0724-4115Kathleen A. Barger https://orcid.org/0000-0001-5817-0932Bart P. Wakker https://orcid.org/0000-0002-0507-7096Philipp Richter https://orcid.org/0000-0002-1188-1435Dana I. Casetti-Dinescu https://orcid.org/0000-0001-9737-4954J. Christopher Howk https://orcid.org/0000-0002-2591-3792
Nicolas Lehner https://orcid.org/0000-0001-9158-0829Felix J. Lockman https://orcid.org/0000-0002-6050-2008
References
Anders, E., & Grevesse, N. 1989, GeCoA, 53, 197Asplund, M., Greenness, N., Jacques Sauval, A., & Scott, P. 2009, ARA&A,
47, 481Barger, K. A., Haffner, L. M., & Bland-Hawthorn, J. 2013, ApJ, 771, 132Barger, K. A., Lehner, N., & Howk, J. C. 2016, ApJ, 817, 91Besla, G., Kallivayalil, N., Hernquist, L., et al. 2007, ApJ, 668, 949Besla, G., Kallivayalil, N., Hernquist, L., et al. 2010, ApJL, 721, L97Besla, G., Kallivayalil, N., Hernquist, L., et al. 2012, MNRAS, 421, 2109Bland-Hawthorn, J., & Maloney, P. R. 1999, ApJL, 510, L33Boothroyd, A. I., Blagrave, K., Lockman, F. J., et al. 2011, A&A, 536, A81Bordoloi, R., Fox, A. J., Lockman, F. J., et al. 2017, ApJ, 834, 191Brüns, C., Kerp, J., Staveley Smith, L., et al. 2005, A&A, 432, 45Casetti-Dinescu, D. I., Moni Bidin, C., Girard, R. M., et al. 2014, ApJL,
784, L37Casetti-Dinescu, D. I., Vieira, K., Girard, T. M., & van Altena, W. F. 2012,
ApJ, 753, 123Cashman, F. H., Kulkarni, V. P., Kisielius, R., Ferland, G. J., &
Bogdanovich, P. 2017, ApJS, 230, 8Cioni, M.-R. L. 2009, A&A, 506, 1137Connors, T. W., Kawata, D., & Gibson, B. K. 2006, MNRAS, 371, 108D’Onghia, E., & Fox, A. J. 2016, ARA&A, 54, 363Diaz, J. D., & Bekki, K. 2012, ApJ, 750, 36Dobbie, P. D., Cole, A. A., Subramaniam, A., & Keller, S. 2014, MNRAS,
442, 1680Ferland, G. J., Porter, R. L., van Hoof, P. A. M., et al. 2013, RMxAA, 49, 137Field, G. B., & Steigman, G. 1971, ApJ, 166, 59For, B.-Q., Staveley-Smith, L., & McClure-Griffiths, N. M. 2013, ApJ, 764, 74For, B.-Q., Staveley-Smith, L., McClure-Griffiths, N. M., Westmeier, T., &
Bekki, K. 2016, MNRAS, 461, 892Fox, A. J., Lehner, N., Lockman, F. J., et al. 2016, ApJL, 816, L11Fox, A. J., Richter, P., Wakker, B. P., et al. 2013, ApJ, 772, 110Fox, A. J., Wakker, B. P., Barger, K. A., et al. 2014, ApJ, 787, 147Fox, A. J., Wakker, B. P., Savage, B. D., et al. 2005, ApJ, 630, 332Fox, A. J., Wakker, B. P., Smoker, J. V., et al. 2010, ApJ, 718, 1046Gardiner, L. T., & Noguchi, M. 1996, MNRAS, 278, 191Gibson, B. K., Giroux, M. L., Penton, S. V., et al. 2000, AJ, 120, 1803Gritton, J. A., Shelton, R. L., & Kyujin, K. 2014, ApJ, 795, 99Haardt, F., & Madau, P. 2001, arXiv:astro-ph/0106018Hammer, F., Yang, Y. B., Flores, H., Puech, M., & Fouquet, S. 2015, ApJ,
813, 110Harris, J., & Zaritsky, D. 2004, AJ, 127, 1532Harris, J., & Zaritsky, D. 2009, AJ, 138, 1243Henley, D. B., Gritton, J. A., & Shelton, R. L. 2017, ApJ, 837, 82Hoopes, C. G., Sembach, K. R., Howk, J. C., Savage, B. D., & Fullerton, A. W.
2002, ApJ, 569, 233Howk, J. C., Wotta, C. B., Berg, M. A., et al. 2017, ApJ, 846, 141Jenkins, E. B. 2009, ApJ, 700, 1299Jensen, A. G., Rachford, B. L., & Snow, T. P. 2005, ApJ, 619, 891Kalberla, P. M. W., Burton, W. B., Hartmann, D., et al. 2005, A&A, 440, 775Kumari, N., Fox, A. J., Tumlinson, J., et al. 2015, ApJ, 800, 44Lehner, N. 2002, ApJ, 578, 126Lehner, N., & Howk, J. C. 2007, MNRAS, 377, 687Lehner, N., Sembach, K. R., Dufton, P. L., Rolleston, W. R. J., & Keenan, F. P.
2001, ApJ, 551, 781Lehner, N., Staveley-Smith, L., & Howk, J. C. 2009, ApJ, 702, 940Lu, L., Savage, B. D., & Sembach, K. R. 1994, ApJ, 426, 563Lu, L., Savage, B. D., Sembach, K. R., et al. 1998, AJ, 115, 162Mastropietro, C., Moore, B., Mayer, L., Wadsley, J., & Stadel, J. 2005,
MNRAS, 363, 509Mathewson, D. S., Cleary, M. N., & Murray, J. D. 1974, ApJ, 190, 291McClure-Griffiths, N. M., Pisano, D. J., Calabretta, M. R., et al. 2009, ApJS,
181, 398McClure-Griffiths, N. M., Staveley-Smith, L., Lockman, F. J., et al. 2008,
ApJL, 673, L143Meschin, I., Gallart, C., Aparicio, A., et al. 2014, MNRAS, 438, 1067Misawa, T., Charlton, J. C., Kobulnicky, H. A., Wakker, B. P., &
Bland-Hawthorn, J. 2009, ApJ, 695, 1382Monroe, T. R., Prochaska, J. X., Tejos, N., et al. 2016, AJ, 152, 25Moore, B., & Davis, M. 1994, MNRAS, 270, 209
13
The Astrophysical Journal, 854:142 (14pp), 2018 February 20 Fox et al.

Morton, D. C. 2003, ApJS, 149, 205Nidever, D. L., Majewski, S. R., & Burton, W. B. 2008, ApJ, 679, 432 (N08)Nidever, D. L., Majewski, S. R., & Burton, W. B. 2010, ApJ, 723, 1618Olano, C. A. 2004, A&A, 423, 895Pagel, B. E. J., & Tautvaivsienė, G. 1998, MNRAS, 299, 535Pardy, S., D’Onghia, E., & Fox, A. J. 2018, ApJ, submitted (arXiv:1802.01600)Putman, M. E., Gibson, B. K., Staveley-Smith, L., et al. 1998, Natur, 394,
752Putman, M. E., Peek, J. E. G., & Joung, M. R. 2012, ARA&A, 50, 491Putman, M. E., Staveley-Smith, L., Freeman, K. C., Gibson, B. K., &
Barnes, D. G. 2003, ApJ, 586, 170Richter, P. 2017, ASSL, 430, 15Richter, P., Fox, A. J., Wakker, B. P., et al. 2013, ApJ, 772, 111Richter, P., Nuza, S. E., Fox, A. J., et al. 2017, A&A, 607, A48Russell, S. C., & Dopita, M. A. 1992, ApJ, 384, 508Savage, B. D., & Sembach, K. R. 1991, ApJ, 379, 245Sembach, K. R., Howk, J. C., Savage, B. D., & Shull, J. M. 2001, AJ, 121, 992
Stanimirović, S., Dickey, J. M., Krčo, M., & Brooks, A. M. 2002, ApJ, 576, 773Toribio San Cipriano, L., Domínguez-Guzmán, G., Esteban, C., et al. 2017,
MNRAS, 467, 3759Trundle, C., Dufton, P. L., Hunter, I., et al. 2007, A&A, 471, 625Venzmer, M. S., Kerp, J., & Kalberla, P. M. W. 2012, A&A, 547, 12Viegas, S. 1995, MNRAS, 276, 268Wakker, B. P., Hernandez, A. K., French, D., et al. 2015, ApJ, 814, 40Wakker, B. P., Kalberla, P. M. W., van Woerden, H., de Boer, K. S., &
Putman, M. E. 2001, ApJS, 136, 537Wakker, B. P., Oosterloo, T. A., & Putman, M. E. 2002, AJ, 123, 1953Wakker, B. P., & van Woerden, H. 1997, ARA&A, 35, 217Wannier, P., Wrixon, G. T., & Wilson, R. W. 1972, A&A, 18, 224Westmeier, T., & Koribalski, B. S. 2008, MNRAS, 388, L29Winkel, B., Kerp, J., Flöer, L., et al. 2016, A&A, 585, A41Yang, Y., Hammer, F., Fouquet, S., et al. 2014, MNRAS, 442, 2419Yoshizawa, A. M., & Noguchi, M. 2003, MNRAS, 339, 1135Zhang, L., Moni Bidin, C., Casetti-Dinescu, D. I., et al. 2017, ApJ, 835, 285
14
The Astrophysical Journal, 854:142 (14pp), 2018 February 20 Fox et al.