chemical and morphological comparison of erionite from oregon
TRANSCRIPT
Prepared for U.S. Environmental Protection Agency, Region 8
Chemical and Morphological Comparison of Erionite from Oregon, North Dakota, and Turkey
By Heather A. Lowers, David T. Adams, Gregory P. Meeker, and Constance J. Nutt
Open-File Report 2010–1286
U.S. Department of the Interior U.S. Geological Survey
ii
U.S. Department of the Interior Ken Salazar, Secretary
U.S. Geological Survey Marcia McNutt, Director
U.S. Geological Survey, Reston, Virginia 2010
For product and ordering information: World Wide Web: http://www.usgs.gov/pubprod Telephone: 1-888-ASK-USGS
For more information on the USGS—the Federal source for science about the Earth, its natural and living resources, natural hazards, and the environment: World Wide Web: http://www.usgs.gov Telephone: 1-888-ASK-USGS
Any use of trade, product, or firm names is for descriptive purposes only and does not imply endorsement by the U.S. Government.
Although this report is in the public domain, permission must be secured from the individual copyright owners to reproduce any copyrighted material contained within this report.
Suggested citation: Lowers, H.A., Adams, D.T., Meeker, G.P., and Nutt, C.J., 2010, Chemical and morphological comparison of erionite from Oregon, North Dakota, and Turkey: U.S. Geological Survey Open-File Report 2010–1286, 13 p.
iii
Contents Introduction ................................................................................................................................... 1 Methods ........................................................................................................................................ 1
Sampling .................................................................................................................................... 1 Electron Microscopy ................................................................................................................... 1
Results and Conclusions ............................................................................................................... 2 Morphological Comparison ......................................................................................................... 2 Chemical Comparison ................................................................................................................ 2
References Cited .......................................................................................................................... 3 APPENDIX A. Method for concentrating erionite from North Dakota tuff samples ....................... 9
Figures Figure 1. Representative morphology comparison of erionite ..................................................... 4 Figure 2. Length and width frequency plot of air sampling erionite fiber data .............................. 5 Figure 3. Aspect ratio comparison of North Dakota (ND, red) and Turkey (blue) erionite fibers .. 6 Figure 4. Energy dispersive spectrum comparison of erionite ..................................................... 7 Figure A1. Settled material after 10 minutes (step 2) ................................................................ 11 Figure A2. Material in the suspension after 50 minutes settling time (step 3)............................ 11 Figure A3. Settled material after 50 minutes (step 3) ................................................................ 12 Figure A4. Settled material after 50 minutes (step 4) ................................................................ 12 Figure A5. Suspended material after the 50 minutes (step 5) ................................................... 13
Tables Table 1. Electron probe microanalysis data of erionite ................................................................ 8 Table A1. Weight (g) of sample recovered at the various processing stages ............................ 10
1
Chemical and Morphological Comparison of Erionite from Oregon, North Dakota, and Turkey
By Heather A. Lowers, David T. Adams, Gregory P. Meeker, and Constance J. Nutt
Introduction Erionite, a fibrous zeolite, occurs in pediment gravel deposits near Killdeer Mountain,
North Dakota. Material from these pediment deposits has been excavated for use as roadbed throughout Dunn County, North Dakota. Erionite also occurs in the Cappadocian region of Turkey, where a link between malignant mesothelioma and inhalation of this mineral has been established (Dogan and others, 2006). The U.S. Environmental Protection Agency (EPA), Region 8, requested that the U.S. Geological Survey (USGS) compare the chemistry and morphology of erionite collected from the Killdeer Mountains to those collected from villages in Turkey and from Rome, Oregon, which has also been linked to disease in animal studies.
Methods Sampling
In April of 2008, USGS, EPA Region 8, and EPA Environmental Response Team scientists traveled to the Cappadocian region of Turkey. They collected material thought to contain erionite from outcrops; homes; structural building materials; whitewash; and decorative stone from Karain, Tuzkoy, Karlik, and Old Sarihidir. Residents of Karain, Tuzkoy, and Old Sarihidir are known to have high incidences of malignant mesothelioma, whereas Karlik is relatively disease free (Dogan and others, 2006). The North Dakota erionite samples were collected by the North Dakota Geological Survey and the Rome, Oregon samples were provided by EPA Region 10.
Electron Microscopy A random aliquot of material was removed from each sample bag using a stainless steel
spatula. The material was placed into a separate glass vial with approximately 1 milliliter of isopropanol and shaken to suspend the material in solution. The suspension was pipetted immediately (to prevent fractionation by settling) onto a polycarbonate filter adhered to an aluminum sample stub. After coating with carbon, samples were examined with a JEOL 5800-LV scanning electron microscope (SEM) operated at 15 kilovolts and 0.1 to 1.0 nanoamperes current and equipped with a Thermo Noran System Six energy dispersive spectroscopy (EDS) package. Each sample was analyzed to determine the presence of fibrous zeolite minerals and other accessory phases.

2
A concentrate of erionite from North Dakota (tuffaceous source material, sample KM-13) and Tuzkoy (sample TUZ36C) were prepared as polished grain mounts for electron probe microanalysis. An explanation of the procedure to concentrate the erionite from North Dakota tuff samples is described in Appendix A. A JEOL 8900 electron probe microanalyzer (EPMA) with a spot beam, operating at 10 kilovolts and 20 nanoamperes, was used to acquire chemical data of the zeolite as precisely as possible. The water content of the zeolite was determined by difference assuming a 100 percent total. Correction procedures were implemented to account for the volatilization of sodium and potassium. The determined weight-percent oxide data were converted to a structural formula based on the recommendations of Passaglia and others (1998).
Results and Conclusions
Morphological Comparison The general morphology of erionite from the studied localities is similar (fig. 1). The
erionite is composed of single fibers, bundles of fibers, and radiating bundles of fibers. The fibers’ size generally ranges from less than 0.2 to 10 µm in diameter and have lengths that range from 2 µm to over 200 µm.
In addition to our own SEM/EDS investigation, EPA Region 8 provided air sampling data for North Dakota and Turkey. The data represent air samples taken during stationary monitoring and activity-based sampling from indoor and outdoor locations. Although it has been documented that activity-based sampling and stationary sampling may provide different size distributions depending on distance from the point source, the purpose of this comparison was to compare the overall size distribution of the fibers released to the air regardless of sampling method. A comparison of erionite lengths and widths from air sampling data collected by EPA Region 8 for North Dakota and Turkey is shown in figure 2. There is general overlap in the lengths and widths of the Turkey and North Dakota erionite fibers. The Turkey erionite fibers tend to have smaller diameters than the North Dakota samples, although the majority of both samples are comprised of fibers with diameters than less 0.5 µm. The aspect ratio of the erionite fibers is compared in figure 3. Erionite fibers from the Turkey air samples tend to have higher aspect ratios than erionite from the North Dakota air samples. The aspect ratio at the 50 percent cumulative frequency mark for the Turkey and North Dakota samples is ~12 and ~6, respectively.
Chemical Comparison EDS spectra of the samples taken under the same analytical conditions are compared in
figure 4. The spectra have been plotted between 0.6 KeV and 5 KeV. The region less than 0.6 KeV, which includes the carbon and oxygen peaks, has been removed for clarity. Carbon is not a structural element of the erionite and the differences in the C and O peaks are attributed to particle geometry. It is evident in figure 4 that the Karain and Karlik, Turkey, and Rome, Oregon samples have similar EDS patterns, they are dominated by K and Na. The Tuzkoy and Old Sarihidir, Turkey, and North Dakota samples are similar to one another; they are dominated by K and Mg with varying amounts of Na and Ca.

3
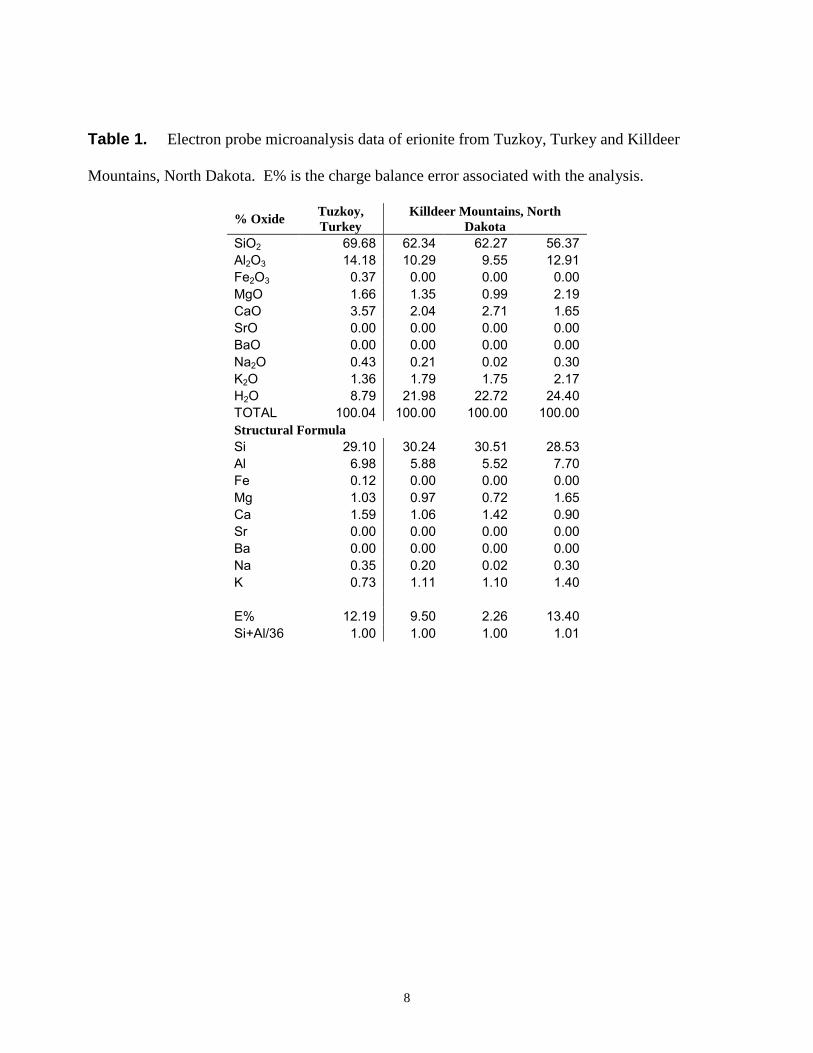
Representative EPMA data for erionite separates from Tuzkoy and North Dakota are given in table 1. In agreement with the EDS data, erionite from Tuzkoy and North Dakota are both dominated by K, Ca, and Mg with little Na. The calculated structural formulae are consistent with erionite and most are within a charge balance error (E%) of 20 percent. Analyses with a balance error (E%) less than 10 percent and (Si+Al)/36 ratios near one are considered suitable analyses (Passaglia and others, 1998). However, due to the fibrous nature and small widths (often less than 3 µm) of this material in combination with volatile loss due to specimen beam interactions, erionite analyses with E% less than 20 percent have been included.
References Cited Dogan, A.U., Baris, Y.I., Dogan, Meral, Emri, Salih, Steele, Ian, Elmishad, A.G., and Carbone,
Michele, 2006, Genetic predisposition to fiber carcinogenesis causes a mesothelioma epidemic in Turkey: Cancer Research, v. 66, p. 5063–5068.
Passaglia, Elio, Artioli, Gilberto, and Gualtieri, A.F., 1998, Crystal chemistry of the zeolites
erionite and offretite: American Mineralogist, v. 83, p. 577–589.

4
Figure 1. Representative morphology comparison of erionite from North Dakota, Old Sarihidir and Tuzkoy, Turkey, and Rome, Oregon. All samples contained individual fibers, bundles of fibers, and radiating fiber bundles. Note the scale bar differences in the lower right of each image.

5
Figure 2. Length and width frequency plot of air sampling erionite fiber data from North Dakota (red) and Turkey (blue). There is overlap among many of the size bins. The Turkey samples tend to have smaller diameters than the North Dakota samples, although both contain a majority less than 0.5 µm.

6
Figure 3. Aspect ratio comparison of North Dakota (ND, red) and Turkey (blue) erionite fibers from collected samples and air sampling data. Erionite fibers from the Turkey air samples tend to have greater aspect ratios than erionite from the North Dakota air samples.
0
0.1
0.2
0.3
0.4
0.5
0.6
0.7
0.8
0.9
1
0 10 20 30 40 50 60 70 80 90 100
Aspect Ratio
Cum
ulat
ive
Freq
uenc
y
TurkeyND

7
Figure 4. Energy dispersive spectrum comparison of erionite from the studied localities. Karain and Karlik, Turkey, and Oregon erionite fibers are dominated by Na and K; in contrast Tuzkoy and Old Sarihidir, Turkey, and North Dakota erionite fibers are dominated by K and Mg and contain little Na. (CPS, counts per second; KeV, kilovolts).
8
Table 1. Electron probe microanalysis data of erionite from Tuzkoy, Turkey and Killdeer
Mountains, North Dakota. E% is the charge balance error associated with the analysis.
% Oxide Tuzkoy, Turkey
Killdeer Mountains, North Dakota
SiO2 69.68 62.34 62.27 56.37 Al2O3 14.18 10.29 9.55 12.91 Fe2O3 0.37 0.00 0.00 0.00 MgO 1.66 1.35 0.99 2.19 CaO 3.57 2.04 2.71 1.65 SrO 0.00 0.00 0.00 0.00 BaO 0.00 0.00 0.00 0.00 Na2O 0.43 0.21 0.02 0.30 K2O 1.36 1.79 1.75 2.17 H2O 8.79 21.98 22.72 24.40 TOTAL 100.04 100.00 100.00 100.00 Structural Formula Si 29.10 30.24 30.51 28.53 Al 6.98 5.88 5.52 7.70 Fe 0.12 0.00 0.00 0.00 Mg 1.03 0.97 0.72 1.65 Ca 1.59 1.06 1.42 0.90 Sr 0.00 0.00 0.00 0.00 Ba 0.00 0.00 0.00 0.00 Na 0.35 0.20 0.02 0.30 K 0.73 1.11 1.10 1.40 E% 12.19 9.50 2.26 13.40 Si+Al/36 1.00 1.00 1.00 1.01

9
APPENDIX A. Method for concentrating erionite from North Dakota tuff samples.
North Dakota Concentrate This procedure describes the method used to concentrate erionite from the North Dakota
outcrop sample (KM13 EERC#06–0395) as provided by the U.S. Environmental Protection Agency. The provided sample consists of a fine white to gray powder. The method employed used gravity settling in isopropanol. Isopropanol was chosen to prevent dissolving water soluble phases that may be present. The entire sample was split and 80.2 g of material was processed to yield a fine-fraction erionite concentrate of approximately 0.5 g. The bulk material before processing contained approximately 5 weight-percent erionite based on x-ray diffraction analysis. The final fine fraction contains approximately 75 weight-percent erionite based on visual examination. Table A1 lists the weights of sample recovered at each of the processing steps.
1. Approximately 5g of material was placed in a 250 ml beaker with 100 ml of isopropanol (2-propanol, ACS, 99.5% min). The volume of isopropanol was adjusted to create a 3-cm-high settling column. The sample was stirred with a glass rod and allowed to settle for 1 minute. The suspension was poured into a glass container (1,000 ml beaker or the like) for further processing. Material was added to the 250 ml beaker and the process was repeated. When the beaker became too full with settled material, the process was started in another 250 ml beaker. The settled material was dried and archived. This step was repeated until the entire 80.2 g of sample was processed.
2. The suspension collected in step 1 was poured into a glass beaker (1,000 ml) until the column height was 10 cm. The suspension was stirred and allowed to settle for 10 minutes. After 10 minutes, the suspension was siphoned, leaving the settled material in the bottom of the beaker. The settled material was dried and archived (fig. A1). The settled material contained quartz, feldspar, volcanic glass, and larger erionite crystals.
3. The suspension collected in step 2 was poured into a glass beaker (1,000 ml) until the column height was 10 cm. The suspension was stirred and allowed to settle for 50 minutes. After 50 minutes, the suspension was siphoned, leaving the settled material in the bottom of the beaker. Based on reconnaissance SEM analysis of the suspension, it appeared to contain a large fraction of clay material (fig. A2). This suspension was dried and archived. The settled material was dried and collected for further processing (fig. A3).
4. The settled material collected in step 3 was placed in a glass beaker (1,000 ml). Isopropanol was added until the column height was 10 cm. The suspension was stirred and allowed to settle for 50 minutes. After 50 minutes, the suspension was siphoned and the settled material was left. Isopropanol was added to the settled material in the beaker to bring the

10
column settling height back to 10 cm. The mixture was stirred and allowed to settle for another 50 minutes. The suspension was collected and the settled material was dried and archived (fig. A4).
5. The suspension collected in step 4 was filtered through a 0.4 mm transfer filter using a Millipore apparatus. After the filter was air dried, the material was removed from the filter and weighed. Approximately 0.5 g of this fine fraction was recovered from the 80.2 g bulk sample (fig. A5).
Table A1. Weight (g) of sample recovered at the various processing stages.
Processing Stage Weight recovered (g)
1. Settled material after 1 minute through 3-cm-high column.
73.0
2. Settled material after 10 minutes through 10-cm-high column.
4.5
3. First suspension after 50 minutes through 10-cm-high column. This fraction contained a high clay component.
0.9
4. Settled material after 50 minutes through 10-cm-high column.
1.15
5. Second suspension after 50 minutes through 10-cm-high column.
0.5

11
Figure A1. Settled material after 10 minutes (step 2).
Figure A2. Material in the suspension after 50 minutes settling time (step 3). This fraction was determined to have a very large clay fraction and was not further processed.

12
Figure A3. Settled material after 50 minutes (step 3). This material was resuspended for 50 minutes (step 4).
Figure A4. Settled material after 50 minutes (step 4).

13
Figure A5. Suspended material after the 50 minutes (step 5).