chemical characterization, bioactive properties, and...
TRANSCRIPT
CHEMICAL CHARACTERIZATION, BIOACTIVE PROPERTIES, AND
PIGMENT STABILITY OF POLYPHENOLICS IN
AÇAI (EUTERPE OLERACEA MART.)
A Dissertation
by
LISBETH ALICIA PACHECO PALENCIA
Submitted to the Office of Graduate Studies of Texas A&M University
in partial fulfillment of the requirements for the degree of
DOCTOR OF PHILOSOPHY
May 2009
Major Subject: Food Science and Technology
CHEMICAL CHARACTERIZATION, BIOACTIVE PROPERTIES, AND
PIGMENT STABILITY OF POLYPHENOLICS IN
AÇAI (EUTERPE OLERACEA MART.)
A Dissertation
by
LISBETH ALICIA PACHECO PALENCIA
Submitted to the Office of Graduate Studies of Texas A&M University
in partial fulfillment of the requirements for the degree of
DOCTOR OF PHILOSOPHY
Approved by:
Chair of Committee, Stephen T. Talcott Committee Members, Susanne Talcott Joseph Sturino Luis Cisneros-Zevallos Intercollegiate Faculty Chair, Jimmy Keeton
May 2009
Major Subject: Food Science and Technology
iii
ABSTRACT
Chemical Characterization, Bioactive Properties, and Pigment Stability of
Polyphenolics in Açai (Euterpe oleracea Mart.). (May 2009)
Lisbeth Alicia Pacheco Palencia, B.S., Zamorano University;
M.S., University of Florida
Chair of Advisory Committee: Dr. Stephen T. Talcott
Phytochemical composition, antioxidant activity, pigment stability, bioactive
properties, and in-vitro absorption of polyphenolics in açai fruit (Euterpe oleracea
Mart.) were investigated. Detailed characterization of phenolic compounds present in
açai fruit, açai fruit pulp, and a polyphenolic-enriched açai oil were conducted by HPLC-
ESI-MSn analyses and their stability and influence on antioxidant capacity determined.
Anthocyanins were predominant in açai fruits, which also contained several flavone and
flavonol glycosides, flavanol derivatives, and phenolic acids. In-vitro absorption and
antiproliferative effects of phytochemical extracts from açai pulp and açai oil were
determined as a function of chemical composition. Polyphenolic mixtures from both açai
pulp and açai oil extracts significantly inhibited HT-29 colon cancer cell proliferation,
also inducing the generation of reactive oxygen species. In-vitro intestinal absorption
using Caco-2 cell models demonstrated that phenolic acids and monomeric flavanol
derivatives are readily transported through cell monolayers in-vitro.
iv
The influence of polyphenolic cofactors on the stability of anthocyanins in açai
fruit under varying conditions of temperature and pH was evaluated. Significant time,
temperature, and pH-dependent anthocyanin losses were observed in all models, yet the
presence of phenolic acids, procyanidins, and flavone-C-glycosides had a positive
influence on anthocyanin stability. External addition of flavone-C-glycosides
significantly enhanced visual color, increased anthocyanin stability during exposures to
high pH or storage temperatures, and had comparable effects to those of a commercial
anthocyanin enhancer.
Anthocyanin polymerization reactions occurring during storage of açai fruit juice
models were investigated and potential mechanisms and reaction products identified.
Polymeric anthocyanin fractions contained several anthocyanin-flavanol adducts based
on cyanidin or pelargonidin aglycones and their presence was related to increased
anthocyanin sulfite bleaching resistance and to the appearance of large, unresolved peaks
in HPLC chromatograms. A reaction mechanism involving the nucleophilic addition of
anthocyanins in their hydrated form to flavanol carbocations resulting from cleavage of
interflavanic bonds was proposed for the formation of flavanol-anthocyanin adducts in
açai fruit juices. Antiproliferative activity and in-vitro absorption of monomeric and
polymeric anthocyanin fractions were also evaluated. Both fractions inhibited HT-29
colon cancer cell growth in a similar, concentration-dependent manner, yet in-vitro
absorption trials using Caco-2 intestinal cell monolayers indicated the presence of
anthocyanin polymers may influence anthocyanin absorption in açai fruit products.

v
To my family, my greatest gift.
vi
ACKNOWLEDGEMENTS
I will always be so grateful to Dr. Steve Talcott, my advisor, for guiding me
through my Ph.D. adventures. I thank him for believing so much in me and for all the
opportunities he made possible during this time. I always felt so fortunate to have him as
my advisor, and I know I will always feel that way. I am also very grateful to Dr. Susanne
Talcott, for introducing me to the cell culture world, and Dr. Joseph Sturino and Dr. Luis
Cisneros for their guidance and support, and for all the valuable time devoted to me.
I also wish to thank my friends and lab siblings, Youngmok, Chris, Jorge,
Kimmy and my big sister, Flor. Their friendship has been a joy to my life, and I thank
them so much for all the happy memories we shared.
My dearest thanks go to my family, particularly to my parents, Dr. Eugenia
Palencia and Dr. Pablo Pacheco, my little brothers, Luis Pablo and Kevin, and my
grandparents, Albertina and Manuel, for inspiring me through their example. I’m also
greatly indebted to my uncles, aunts, and cousins, particularly my Godfather, Ing.
Adolfo Palencia, for their always loving, unconditional support. No words can ever thank
my family for everything I have been given throughout my life.
Finally, I extend my most loving thanks to my best friend, the love of my life, and
my precious husband, Jolián Rios. I am so blessed to have you by my side, and I thank you
with all my heart for being always there for me, and for letting me know how much you
loved me, every single step of the way. You are and always will be all I want, more than I
deserve, and everything I need. I love you so much.
vii
TABLE OF CONTENTS
Page
ABSTRACT .......................................................................................................... iii
DEDICATION....................................................................................................... v
ACKNOWLEDGEMENTS ................................................................................... vi
TABLE OF CONTENTS....................................................................................... vii
LIST OF FIGURES ............................................................................................... x
LIST OF TABLES................................................................................................. xiv
CHAPTER
I INTRODUCTION............................................................................. 1
II LITERATURE REVIEW .................................................................. 4
Açai Fruit Generalities and Composition...................................... 4 Polyphenolics: Structure, Classification, and Bioactive Properties..................................................................................... 5 Anthocyanin Properties and Pigment Stability.............................. 8 HPLC-ESI-MSn as a Tool for Polyphenolic Characterization ....... 13 In-Vitro Models for Polyphenolic Absorption .............................. 15 III PHYTOCHEMICAL, ANTIOXIDANT, AND THERMAL STABILITY OF TWO AÇAI SPECIES, EUTERPE OLERACEA AND EUTERPE PRECATORIA ........................................................ 18
Introduction ................................................................................. 18 Materials and Methods................................................................. 19 Results and Discussion................................................................. 22 Conclusion................................................................................... 36
viii
CHAPTER Page
IV CHEMICAL COMPOSITION AND THERMAL STABILITY OF A PHYTOCHEMICAL-ENRICHED OIL FROM AÇAI....................... 37
Introduction ................................................................................. 37 Materials and Methods................................................................. 38 Results and Discussion................................................................. 41 Conclusion................................................................................... 56 V IN-VITRO ABSORPTION AND BIOLOGICAL ACTIVITY OF
PHYTOCHEMICAL RICH EXTRACTS FROM AÇAI. ................... 57 Introduction ................................................................................. 57 Materials and Methods................................................................. 59 Results and Discussion................................................................. 64 Conclusion................................................................................... 80 VI CHEMICAL STABILITY OF AÇAI ANTHOCYANINS AS
INFLUENCED BY NATURAL AND ADDED POLYPHENOLIC COFACTORS IN MODEL JUICE SYSTEMS.................................. 82
Introduction ................................................................................. 82 Materials and Methods................................................................. 84 Results and Discussion................................................................. 89 Conclusion................................................................................... 105 VII PHYTOCHEMICAL MODELS FOR ANTHOCYANIN
POLYMERIZATION REACTIONS IN AÇAI JUICE SYSTEMS. ... 106 Introduction ................................................................................. 106 Materials and Methods................................................................. 108 Results and Discussion................................................................. 112 Conclusion................................................................................... 133 VIII IN-VITRO ABSORPTION AND ANTIPROLIFERATIVE ACTIVITY OF MONOMERIC AND POLYMERIC ANTHOCYANIN FRACTIONS FROM AÇAI FRUIT..................... 135 Introduction ................................................................................. 135 Materials and Methods................................................................. 137 Results and Discussion................................................................. 141 Conclusion................................................................................... 155
ix
CHAPTER Page
IX SUMMARY ...................................................................................... 157
REFERENCES ...................................................................................................... 163
VITA..................................................................................................................... 182
x
LIST OF FIGURES
Page Figure 1 Basic Flavonoid Structure............................................................... 7 Figure 2 Chemical Structures of the Most Abundant Anthocyanidins............ 9 Figure 3 HPLC Chromatogram of Non-Anthocyanin Polyphenolics in E. oleracea Juice at 280 nm. Peak Assignments are Shown in Table 2............................................................................................ 26 Figure 4 HPLC Chromatogram of Non-Anthocyanin Polyphenolics in E. precatoria Juice at 280 nm. Peak Assignments are Shown in Table 3 ........................................................................................... 28 Figure 5 Antioxidant Capacity (µmol Trolox Equivalents/mL) of Non- Hydrolyzed and Hydrolyzed E. oleracea and E. precatoria Phytochemical Isolates. Bars Represent the Standard Error of the Mean (n=6) ............................................................................... 32 Figure 6 Percent Changes in Total Anthocyanin Contents in E. oleracea and
E. precatoria Fruit Purees Following Heating (80°C), as a Function of Heating Time.............................................................................. 34 Figure 7 HPLC Chromatogram of Polyphenolics Present in a Typical E. oleracea Oil Extract. Peak Assignments: 1. Protocatechuic Acid; 2. p-Hydroxybenzoic Acid; 3. (+)-Catechin; 4. Vanillic Acid; 5. Syringic Acid; 6-7. Procyanidin Dimers; 8. Ferulic Acid; 9-10. Procyanidin Dimers; 11-14. Procyanidin Trimers................... 42 Figure 8 Percent Changes in Total Soluble Phenolic Contents During Storage of E. oleracea Oil Extracts Adjusted to Different Initial Phenolic Contents. Error Bars Represent the Standard Error of the Mean (n=3) ............................................................................... 52 Figure 9 Percent Changes in Antioxidant Capacity During Storage of E. oleracea Oil Extracts Adjusted to Different Initial Phenolic Contents. Error Bars Represent the Standard Error of the Mean (n=3) .............................................................................. 53 Figure 10 Percent Changes in Total Soluble Phenolics and Antioxidant Capacity in E. oleracea Oil Extracts Following Heating. Error Bars Represent the Standard Error of the Mean (n=3). .................... 55
xi
Page Figure 11 HPLC Chromatogram of Polyphenolics in Phytochemical-Rich Extracts from Açai Juice (A) and Açai Oil (B). Peak Assignments: 1. Protocatechuic Acid; 2. p-Hydroxybenzoic Acid; 3. (+)-Catechin; 4. Vanillic Acid; 5. Syringic Acid; 6-7.Procyanidin Dimers; 8. Ferulic Acid; 9-10 Procyanidin Dimers; 11-14 Procyanidin Trimers.............................................................. 67 Figure 12 Percent Changes in Total HT-29 Cell Numbers Expressed as a Ratio to Control Cells Following Treatment with Juice or Oil Polyphenolic Extracts for 48 h. Error Bars Represent the Standard Error of the Mean (n=6). .................................................. 69 Figure 13 Intracellular Levels of ROS in HT-29 Cells Following Treatment With Açai Juice or Oil Polyphenolic Extracts. Error Bars Represent the Standard Error of the Mean (n=6) ............................. 72 Figure 14 Intracellular Rate of Generation of ROS in HT-29 Cells Following
Treatment With Açai Juice or Oil Polyphenolic Extracts. Error Bars Represent the Standard Error of the Mean (n=6) ............................. 73 Figure 15 Typical HPLC Chromatogram of Polyphenolics Present in the Basolateral Side of Caco-2 Cell Monolayers Following Incubation With Açai Juice (A) or Oil (B) Polyphenolic Extracts for 2 h. Peak Assignments: 1. Protocatechuic Acid; 2. p-Hydroxybenzoic Acid; 3. Vanillic Acid; 4. Syringic Acid; 5. Ferulic Acid .......................... 75 Figure 16 ESI-MS Negative Product Ion Spectra of (A) Apigenin-6-C- glucosyl-8-C-arabinoside (Shaftoside, 563.1, [M-H]-), and (B) Apigenin 6,8-di-C-glucoside (Vicenin-2, 593.5, [M-H]-)........... 91 Figure 17 Percent Changes in Total Anthocyanin Contents During Storage (30°C) of Cyanidin-3-glucoside Standard Models Adjusted to pH 3.0. Error Bars Represent the Standard Error of the Mean (n=3)...... 99 Figure 18 Percent Polymeric Anthocyanins During Storage (30°C) of Açai Models Adjusted to pH 3.0 (A), 3.5 (B), and 4.0 (C). Error Bars Represent the Standard Error of the Mean (n=3) ..................... 101 Figure 19 Percent Changes in Antioxidant Capacity of Açai Models Adjusted to pH 3.0 During Storage at 30°C (A), 20°C (B), and 5°C (C). Error Bars Represent the Standard Error of the Mean (n=3). ........... 102
xii
Page Figure 20 Chromatographic Profile (520 nm) of Monomeric Anthocyanin Fractions from Açai Pulp. Peak Assignments: 1. Cyanidin-3-glucoside; 2. Cyanidin-3-rutinoside .......................... 114 Figure 21 Chromatographic Profile (520 nm) of Polymeric Anthocyanin Fractions from Açai Pulp. Peak Assignments: 1. Cyanidin-3-glucoside; 2. Cyanidin-3-rutinoside; 3. Pelargonidin-3-glucoside; and 4. Peonidin-3-glucoside. .............. 117 Figure 22 Chromatographic Profile (520 nm) of Polymeric Anthocyanin Fractions from Açai Pulp Following Acid Hydrolysis (2N HCl, 90°C) for 30 min. Peaks Correspond to Cyanidin (1), Pelargonidin (2), and Peonidin (3) Aglycones ................................. 120 Figure 23 Chromatographic Profile (520 nm) of Polymeric Anthocyanin Fractions from Açai Pulp Following Storage for 12 Days at 35°C. Peak Identities are Summarized in Table 17.................................... 121 Figure 24 Proposed Mechanism for the Formation of Anthocyanin-Flavanol Adducts .......................................................................................... 130 Figure 25 Proposed Mechanism for the Formation of Flavanol-Anthocyanin Adducts .......................................................................................... 131 Figure 26 HPLC Chromatogram (520 nm) of Anthocyanin Monomer Extracts (A) and Anthocyanin Polymer Extracts (B). Peak Assignments: 1. Cyanidin-3-glucoside; 2. Cyanidin-3-rutinoside; 3. Pelargonidin-3-glucoside; 4. Peonidin-3-glucoside...................... 143 Figure 27 Percent Changes in Total HT-29 Cell Numbers Expressed as a Ratio to Control Cells Following Treatment of Cells with Anthocyanin Monomer and Polymer Fractions Adjusted to Different Concentrations (µg/mL) for 48 h. Error Bars Represent the Standard Error of the Mean (n=6).............................................. 146 Figure 28 Typical HPLC Chromatogram (520 nm) of Anthocyanins Present in the Basolateral Compartment of Caco-2 cell Monolayers Following Incubation with Anthocyanin Monomer Fractions (A) and Anthocyanin Polymer Fractions (B) for 2h. Peak Assignments: 1. Cyanidin-3-glucoside; 2. Cyanidin-3-rutinoside .......................... 149

xiii
Page Figure 29 Percent Transport of Cyanidin-3-glucoside and Cyanidin-3-rutinoside From Apical to Basolateral Side of Caco-2 Cell Monolayers Following Incubation with Monomeric and Polymeric Anthocyanin Fractions from Açai................................... 153
xiv
LIST OF TABLES
Page Table 1 HPLC-ESI-MSn Analyses of Anthocyanins Present in E. oleracea
and E. precatoria Fruits .................................................................. 24 Table 2 Characterization of Non-Anthocyanin Polyphenolics Present in E. oleracea Fruits ........................................................................... 27
Table 3 Characterization of Non-Anthocyanin Polyphenolics Present in E. precatoria Fruits......................................................................... 29
Table 4 HPLC-ESI-(-)MSn Analyses of Polyphenolics in E. oleracea
Oil Extracts..................................................................................... 43 Table 5 Concentration (mg/L) and Relative Abundance (%) of Non- Anthocyanin Polyphenolics Present in E. oleracea Clarified Juice and Oil Extracts ..................................................................... 44 Table 6 Major Polyphenolics Present in E. oleracea Oil Extracts (mg/L) Adjusted to Three Different Polyphenolic Levels ............................ 48 Table 7 Percent Polyphenolic Losses in E. oleracea Oil Extracts Adjusted to Different Polyphenolic Levels Following Storage at 20, 30, and 40ºC.......................................................................... 49 Table 8 Concentration (mg/L) and Relative Abundance of Polyphenolics Present in E. oleracea Juice and Oil Extracts .................................. 65 Table 9 Average Transport Rates (µg/mL·h) of Polyphenolics from Açai ... Juice and Oil Extracts from the Apical to the Basolateral Side of Caco-2 Cell Monolayers ................................................................. 76 Table 10 Transport Efficiency (%) of Polyphenolics from Açai Juice and Oil Extracts from the Apical to the Basolateral Side of Caco-2 Cell Monolayers Following Incubation for 2 h at 37°C ................... 79 Table 11 Polyphenolic Composition of E. oleracea Juice Models.................. 90
Table 12 Kinetic Parameters of Anthocyanin Pigment Degradation During Storage of Açai Models....................................................... 94
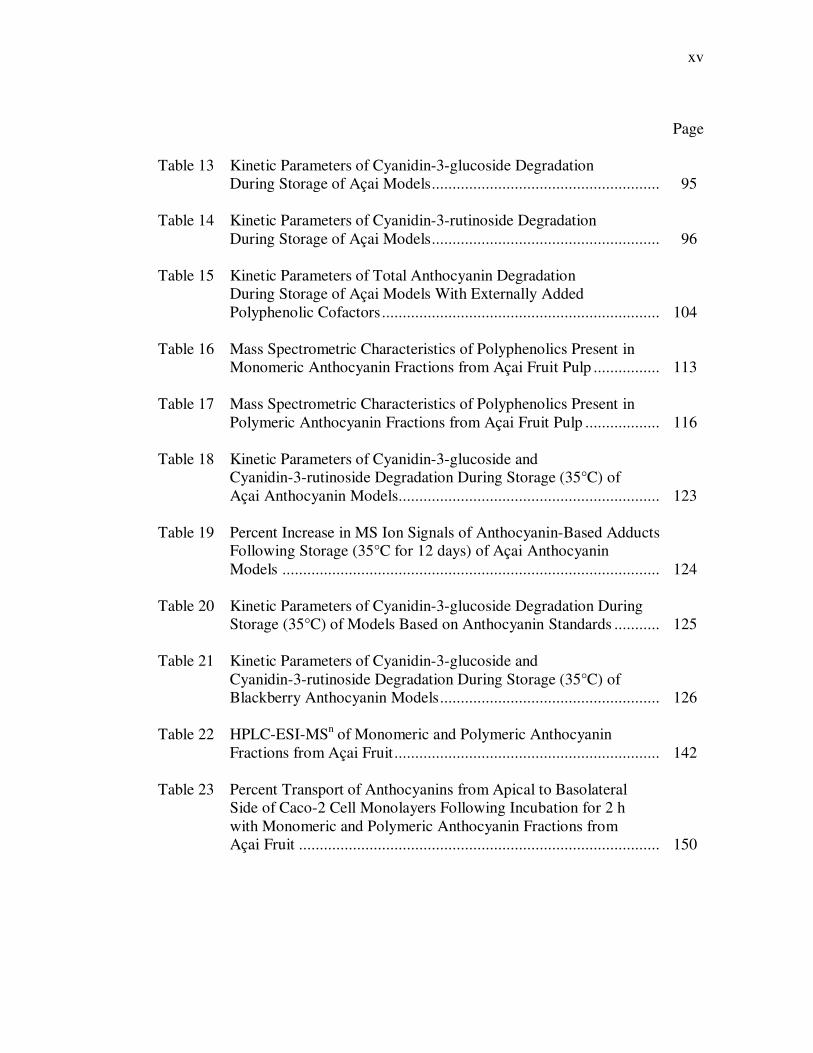
xv
Page Table 13 Kinetic Parameters of Cyanidin-3-glucoside Degradation During Storage of Açai Models....................................................... 95 Table 14 Kinetic Parameters of Cyanidin-3-rutinoside Degradation During Storage of Açai Models....................................................... 96 Table 15 Kinetic Parameters of Total Anthocyanin Degradation During Storage of Açai Models With Externally Added Polyphenolic Cofactors................................................................... 104 Table 16 Mass Spectrometric Characteristics of Polyphenolics Present in Monomeric Anthocyanin Fractions from Açai Fruit Pulp ................ 113 Table 17 Mass Spectrometric Characteristics of Polyphenolics Present in Polymeric Anthocyanin Fractions from Açai Fruit Pulp .................. 116 Table 18 Kinetic Parameters of Cyanidin-3-glucoside and Cyanidin-3-rutinoside Degradation During Storage (35°C) of Açai Anthocyanin Models............................................................... 123 Table 19 Percent Increase in MS Ion Signals of Anthocyanin-Based Adducts Following Storage (35°C for 12 days) of Açai Anthocyanin Models ........................................................................................... 124 Table 20 Kinetic Parameters of Cyanidin-3-glucoside Degradation During Storage (35°C) of Models Based on Anthocyanin Standards ........... 125 Table 21 Kinetic Parameters of Cyanidin-3-glucoside and Cyanidin-3-rutinoside Degradation During Storage (35°C) of Blackberry Anthocyanin Models..................................................... 126 Table 22 HPLC-ESI-MSn of Monomeric and Polymeric Anthocyanin Fractions from Açai Fruit................................................................ 142 Table 23 Percent Transport of Anthocyanins from Apical to Basolateral Side of Caco-2 Cell Monolayers Following Incubation for 2 h with Monomeric and Polymeric Anthocyanin Fractions from Açai Fruit ....................................................................................... 150

xvi
Page Table 24 Average Anthocyanin Transport Rates (µg/L·h) from the Apical to the Basolateral Side of Caco-2 Cell Monolayers, Following Incubation with Monomeric and Polymeric Anthocyanin Fractions from Açai Fruit................................................................ 154
1
CHAPTER I
INTRODUCTION
Functional foods and beverages are achieving global success, mainly due to
modern consumer trends toward health maintenance. Particular attention has been given
to the protective effects of polyphenolics in fruits and vegetables and their potential roles
in the prevention of degenerative diseases, including certain cancers (Riboli & Norat,
2003). Consequently, efforts to improve and retain health-supporting characteristics of
fruit juices and beverages have dominated many categories and beverage manufacturers
have expanded their choices to natural ingredients that add novel flavors and targeted
functionality to their products.
Açai (Euterpe oleracea Mart.), a palm fruit native to the Amazon region, has
recently attracted international attention as a novel source of polyphenolics, particularly
anthocyanins, and may offer a promising alternative to synthetic dyes for food and
beverage applications. However, few attempts (Gallori, Bilia, Bergonzi, Barbosa, &
Vincieri, 2004; Lichtenthaler, Belandrino, Maia, Papagiannopoulos, Fabricius, & Marx,
2005; Schauss et al., 2006; Pacheco-Palencia, Hawken, & Talcott, 2007a; Pacheco-
Palencia, Hawken, & Talcott, 2007b) have been made to characterize its phytochemical
composition in detail and assess its bioactive properties.
Moreover, the poor stability of anthocyanins remains a major problem facing the
beverage industry, as oxidation and polymerization reactions during processing, storage,
____________ This dissertation follows the style of Food Chemistry.
2
and distribution lead to the formation of brown pigments (Monagas Gomez-Cordoves, &
Begoña, 2006; Pacheco-Palencia et al., 2007a), which negatively impact color and
overall quality perception. Furthermore, anthocyanin polymerization reactions may not
only affect quality attributes, but potentially influence the intestinal absorption and
bioactive properties of anthocyanins present in these products.
These studies evaluated the polyphenolic composition, antioxidant properties,
chemical stability, antiproliferative activity and in-vitro absorption properties of açai
fruit and its main commercial products; emphasizing key relations between polyphenolic
structure and in-vitro absorption and antiproliferative activity. In addition, factors
influencing anthocyanin stability were examined and potential mechanisms for
anthocyanin polymerization reactions and their influence on antiproliferative activity and
in-vitro absorption determined.
Specific objectives were:
1- To characterize polyphenolic compounds present in the two main commercial
açai species (Euterpe oleracea Mart. and Euterpe precatoria Mart.) and assess
their thermal stability under common thermal processing conditions.
2- To assess the polyphenolic composition and stability of polyphenolic compounds
from açai oil and evaluate their impact on antioxidant capacity.
3- To evaluate the antiproliferative activities of açai polyphenolic extracts against
colon cancer cells and determine their intestinal absorption using in-vitro cell
models.
3
4- To investigate the influence of non-anthocyanin polyphenolic components on
anthocyanin stability and overall pigment intensity.
5- To determine potential mechanisms, reactants, and products involved in
anthocyanin polymerization reactions in açai juices.
6- To investigate potential relations between anthocyanin polymerization reactions
and antiproliferative properties and in-vitro intestinal absorption of anthocyanins
in açai.
4
CHAPTER II
LITERATURE REVIEW
Açai Fruit Generalities and Composition
Açai (Euterpe oleracea Mart.) is a slender, multistemmed, monoecious palm,
widely distributed in the Amazon estuary floodplains, and particularly abundant in the
Northeastern regions of Brazil (Muñiz-Miret, Vamos, Hiraoka, Montagnini, &
Mendelsohn, 1996). Açai palms can reach a height of over 25 meters and produce from 3
to 6 kg of fruit per year (Clay & Clement, 1993). Fruits appear in clusters, and are
rounded, measure between 1.0 and 1.4 cm in diameter, have a large seed (up to 80% of
total mass) and generally mature to a dark purple color (Rogez, 2000). Fruiting occurs
throughout the year, with heavy seasonal production between July and December
(Muñiz-Miret et al., 1996). Harvesting açai fruit is an arduous and frequently dangerous
task, done by individuals accustomed to climb the açai palms using a fiber ring to
support their feet, and manually collect all ripe fruit bunches in baskets (Rogez, 2000).
Fruits are generally transported to the markets and commercialized in less than 24 hours
to prevent significant nutritional and quality losses (Rogez, 2000).
Once harvested, the edible pulp of açai fruits is typically macerated with water to
produce a thick, purple beverage of creamy texture, oily appearance, and characteristic
flavor, which is also commonly referred to as “açai”. The most important trade qualities
are based on total solids and are known as “açai grosso” (>14% total solids), “açai
medio” (>11% total solids) and “açai fino” (>8% total solids) (Muñiz-Miret et al., 1996).
5
Nutrient composition may vary among fruit sources and processing methods, but
according to Clay & Clement (1993), açai fruits generally contain ~12.5 protein, ~10.0%
lipid, ~1% sugar, 0.05% calcium, 0.03% phosphorous, and traces of iron, vitamins A and
B1. In addition, açai fruit pulps are rich sources of anthocyanins, particularly cyanidin-3-
rutinoside and cyanidin-3-glucoside, and contain lower concentrations of phenolic acids
and flavanol derivatives (Schauss et al., 2006; Pacheco-Palencia et al., 2007b).
Due to its highly perishable nature, consumption and commercialization of açai
fruit and açai fruit pulps had long been restricted to a regional level; however, increased
international interest and expanded distribution has made açai fruit pulp and various
retail products made from açai fruit pulp, widely available to the general public.
Considerable attention has been generated by health related benefits associated to its
high anthocyanin content and antioxidant capacity (Gallori et al., 2004, Coisson,
Travaglia, Piana, Capasso, & Arlorio, 2005), and numerous açai-containing functional
ingredients and beverages are already gaining popularity in European, Asian, and North
American markets.
Polyphenolics: Structure, Classification, and Bioactive Properties
Polyphenolics are a wide array of secondary metabolites synthesized by vascular
plants, and encompass more than 8,000 compounds connected to a variety of
physiological functions such as nutrient uptake, photosynthesis, enzyme activity, protein
synthesis, microbial resistance, pigmentation, and sensory properties (Robbins, 2003).
6
Structurally, phenolic compounds are derivatives of benzene with one or more
hydroxyl substituents, often accompanied by functional substitutions such as esters,
methyl esters, glycosides and others (Visioli, Borsani, & Galli, 2000). Phenolic
compounds are synthesized via the plant aromatic pathway, beginning with the
production of aromatic amino acids through the shikimate pathway. Some aromatic
amino acids continue to the phenylpropanoid pathway, yielding cinnamic acid
derivatives, which may enter the flavonoid route to give rise to a wide diversity of
flavonoid compounds (De Bruyne, Pieters, Deelstra, & Vlietinck, 1999).
Based on their structural properties, phenolic compounds may be divided into
various groups, including phenolic acids, flavonoids, tannins, and other phenylpropanoid
derivatives (Skerget, Kotnik, Hadolin, Hras, Simonic, & Knez, 2005). Phenolic acids are
characterized by one carboxylic acid functional group and two constitutive carbon
frameworks, the hydroxycinnamic and hydroxybenzoic structures, commonly substituted
with one or more hydroxyl groups (Herrmann, 1995). Flavonoids are the most common
and widely distributed group of plant phenolics (Le Marchand, 2002). To date, over
5,000 different flavonoids have been identified and are classified into at least 10
chemical groups (Whiting, 2001). Among them, flavonols, flavones, flavanones,
catechins, anthocyanidins, and isoflavones are particularly common (Cook & Samman,
1996). The basic flavonoid structure is the flavan nucleus, which consists of 15 carbon
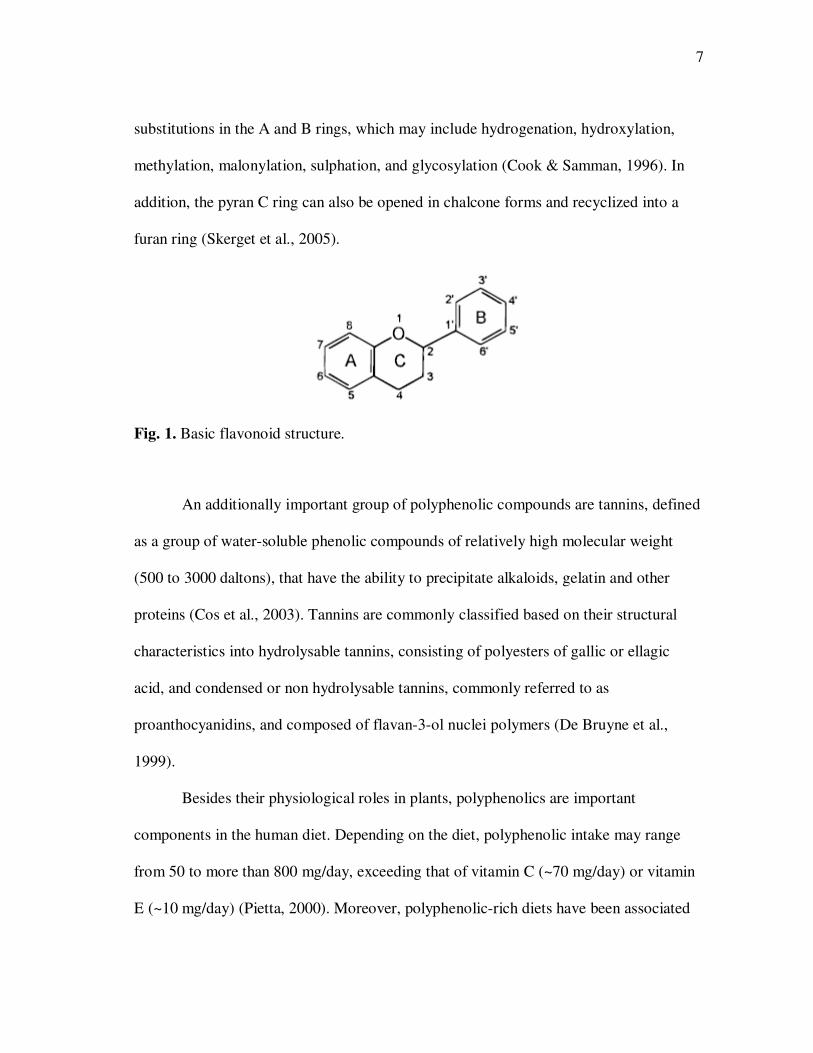
atoms arranged in three rings (C6-C3-C6), commonly referred to as A, B and C (Fig. 1).
The level of oxidation and pattern of substitution of the C ring distinguish the various
flavonoid classes, while individual compounds within a class are differentiated by
7
substitutions in the A and B rings, which may include hydrogenation, hydroxylation,
methylation, malonylation, sulphation, and glycosylation (Cook & Samman, 1996). In
addition, the pyran C ring can also be opened in chalcone forms and recyclized into a
furan ring (Skerget et al., 2005).
Fig. 1. Basic flavonoid structure.
An additionally important group of polyphenolic compounds are tannins, defined
as a group of water-soluble phenolic compounds of relatively high molecular weight
(500 to 3000 daltons), that have the ability to precipitate alkaloids, gelatin and other
proteins (Cos et al., 2003). Tannins are commonly classified based on their structural
characteristics into hydrolysable tannins, consisting of polyesters of gallic or ellagic
acid, and condensed or non hydrolysable tannins, commonly referred to as
proanthocyanidins, and composed of flavan-3-ol nuclei polymers (De Bruyne et al.,
1999).
Besides their physiological roles in plants, polyphenolics are important
components in the human diet. Depending on the diet, polyphenolic intake may range
from 50 to more than 800 mg/day, exceeding that of vitamin C (~70 mg/day) or vitamin
E (~10 mg/day) (Pietta, 2000). Moreover, polyphenolic-rich diets have been associated
8
with a reduced incidence of oxidative damage diseases, including cancer and coronary
heart disease (Visioli et al., 2000). Much of these effects have been attributed to the
ability of polyphenolics to inhibit oxidative reactions in-vivo (Chun, Dim, Smith,
Schroeder, Han, & Lee, 2005). Proposed mechanisms of antioxidant action by phenolic
compounds include the suppression of enzymes and trace elements involved in free
radical production, scavenging of reactive oxygen or nitrogen species, and protection of
natural antioxidant defenses (Pietta, 2000). Polyphenolics have shown to inhibit the
enzymes responsible for radical production, including xanthine oxidase and protein
kinase C, cyclooxygenase, lipoxygenase, microsomal monooxygenase, glutathione S-
transferase, mitochondrial succinoxidase, and NADH oxidase, and to efficiently chelate
trace metals that play important roles in the generation of reactive oxygen species (Cos
et al., 2003). Yet the predominant mode of antioxidant activity is believed to be
scavenging of reactive species, via hydrogen atom or electron donation (Shahidi &
Wanasundara, 1992). According to Rice-Evans, Miller, & Paganga (1996), structural
properties of polyphenolics, in terms of the availability of hydrogen-donating groups,
determine their antioxidant activity, while substituents in the aromatic ring affect the
stabilization of the resulting phenolic radical and thus, the radical-quenching ability of
phenolic compounds.
Anthocyanin Properties and Pigment Stability
Anthocyanins are considered one of the largest and most important plant
pigments visible to the human eye (Kong, Chia, Goh, Chia, & Brouillard, 2003). They
9
belong to the flavonoid group of phenolic compounds and are glycosides of polyhydroxy
and polymethoxy derivatives of 2-phenyl-benzopyrylium or flavylium salts (Brouillard,
1983). The flavylium cation constitutes the main part of the anthocyanin molecule and
contains conjugated double bonds responsible for light absorption around 500 nm,
causing pigments to appear red to the human eye (Markakis, 1974). The aglycones,
called anthocyanidins, are usually penta- (3,5,7,3´,4´) or hexa-substituted (3,5,7,3´,4´,5´)
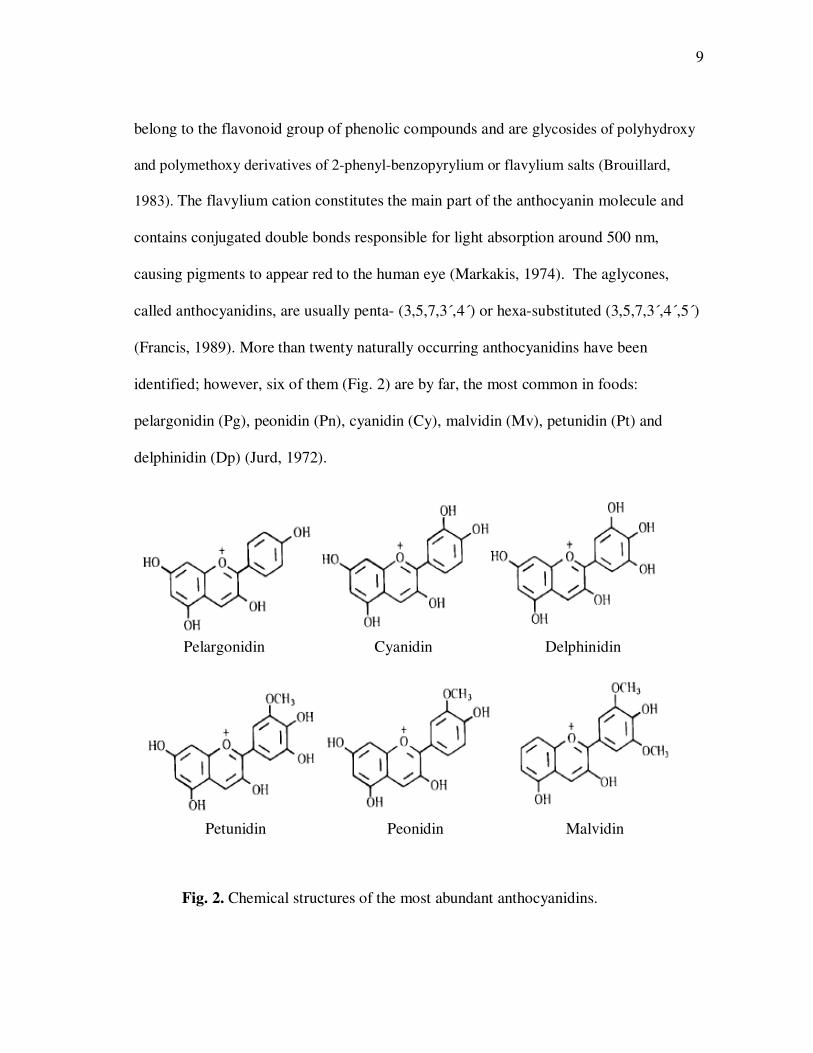
(Francis, 1989). More than twenty naturally occurring anthocyanidins have been
identified; however, six of them (Fig. 2) are by far, the most common in foods:
pelargonidin (Pg), peonidin (Pn), cyanidin (Cy), malvidin (Mv), petunidin (Pt) and
delphinidin (Dp) (Jurd, 1972).
Fig. 2. Chemical structures of the most abundant anthocyanidins.
Pelargonidin Cyanidin Delphinidin
Petunidin Peonidin Malvidin

10
Anthocyanidins are rarely found in nature as such, and occur most commonly in
their glycosylated forms, as anthocyanins, which are more soluble and stable in aqueous
solutions (Harborne, 1964). Common glycoside moieties include glucose, rhamnose,
galactose, arabinose and xylose; however complex glycosides such as rutinose,
sophorose, and sambubiose may also occur naturally (De Ancos, Gonzales, & Cano,
1999). Anthocyanins may be also differentiated by the nature and number of organic
acids attached to the anthocyanin glycosyl units, typically aromatic phenolic acids or
aliphatic dicarboxyl acids or a combination of both. The most common acylating agents
include derivatives of hydroxycinnamic acids, hydroxybenzoic acids, and a range of
aliphatic acids (Clifford, 2000).
In addition to their role as secondary metabolites in the pigmentation of plants,
anthocyanins have gained increased interest as functional ingredients for food
applications and as prospective, potent protective agents against oxidative stress
(Stintzing, Stintzing, Carle, Frei, & Wrolstad, 2002). However, being electron deficient,
the flavylium nucleus of anthocyanins is highly reactive and undergoes undesirable
structural changes during processing and storage (Jurd, 1972). Color stability of
anthocyanins is thus, strongly affected by a variety of factors, including anthocyanin
structure, concentration, pH, temperature, light, and the presence of enzymes, oxygen,
copigments, metallic ions, ascorbic acid, sugar and their degradation products
(Rodriguez-Saona, Giusti, & Wrolstad, 1999). Anthocyanin structure, particularly
related to the number and position of glycosyl units and acyl groups attached to the
aglycone, significantly influences the reactivity of the anthocyanin molecule and
11
generally results in improved color stability (Baublis, Spomer, & Berber-Jimenez, 1994;
Turker, Aksay, & Ekiz, 2004). Increased anthocyanin concentration has also shown to
promote higher color stability via self-association reactions among anthocyanins (Dao,
Takeoka, Edwards, & Berrios, 1998). Due to their ionic nature, anthocyanins are
strongly influenced by changes in pH, which enable structural changes and result in
different colors and hues at different pH values (Jurd, 1972; Clifford, 2000). As a result,
the intensely red colored flavylium cation, being the predominant anthocyanin form in
very acidic media, hydrates as the pH is increased, yielding the colorless carbinol form
and decreasing color intensity. Further pH increases lead to ring opening of the carbinol
form, yielding the colorless chalcone (Markakis, 1974; Brouillard, 1983).
Temperature and the presence of oxygen are important factors influencing
anthocyanin degradation rates during processing and storage. Increased processing and
storage temperatures are thought to induce hydrolysis of glycosidic bonds in anthocyanin
molecules, leading to the formation of unstable aglycones which degrade rapidly in
aqueous systems (Maccarone, Maccarone, & Rapisarda, 1985). Deleterious effects and
accelerated anthocyanin losses in the presence of oxygen have been attributed to direct
or indirect oxidation reactions (Jackman, Yada, Tung, & Speers, 1987). Moreover, the
presence of certain enzymes common in food systems, including glycosidases,
peroxidases, and phenolases, have also been shown to accelerate anthocyanin
degradation. Glycosidases have the ability to break covalent bonds between glycosyl
residues and aglycones, leading to the rapid degradation of the unstable aglycone, while
peroxidases and phenolases can oxidize phenolic compounds in the media to their
12
corresponding quinones, which then react with anthocyanins, and lead to brown
condensation products (Kader, Irmouli, Nicolas, & Metche, 2001). Finally, the presence
of sugars, ascorbic acid, and their degradation products are known to decrease
anthocyanin stability via oxidative reactions (Krifi, Chouteau, Boudrant, & Metche,
2000) and to enhance the formation of large polymer pigments (Poei-Langston &
Wrolstad, 1981).
In addition to anthocyanin losses due to oxidation and degradation reactions, the
formation of anthocyanin polymers and resulting changes in color, from bright red to
darker hues, has been a long-observed phenomenon (Somers, 1971). However, the
nature and mechanism of formation of these polymeric compounds are yet poorly
understood and current information on anthocyanin polymerization is largely limited to
reactions occurring in red wine systems, which may differ from those occurring in juice
systems. Anthocyanin polymers have been shown to form during thermal processing and
storage in a time and temperature-dependent manner, accelerated by the presence of
oxygen, light, ascorbic acid, and flavanol derivatives (Skrede, Wrolstad, Lea, & Enersen,
1992; Garzon & Wrolstad, 2002; Tsai, Delva, Yu, Huand, & Dufosse, 2005; Pacheco-
Palencia et al., 2007a). Interactions between anthocyanins and sugar or ascorbic acid
degradation products, particularly furfurals and other aldehydes, are thought to influence
the formation of brown pigments during storage of fruit-based, anthocyanin-containing
beverages (Es-Safi, Cheynier, & Moutounet, 2000). Aldehydes have also been shown to
promote anthocyanin polymerization with flavonols, flavan-3-ols, and their derivatives
resulting in the formation of both colorless and yellow-colored compounds that
13
contribute to anthocyanin browning reactions and decreased color stability in wines
(Timberlake & Bridle, 1976; Es-Safi, Cheynier, & Moutounet, 2002). Moreover,
anthocyanin reactions with tannins are thought to be responsible for polymeric pigments
formed in the course of wine aging (Cheynier et al., 2006) and various products
resulting from direct condensation reactions of anthocyanins with tannins have been
detected in wines (Remy, Fulcrand, Labarbe, Cheynier, & Moutounet, 2000; Salas,
Dueñas, Schwarz, Winterhalter, Cheynier, & Fulcrand, 2005). However, several of these
anthocyanin-tannin adducts are colorless (Remy et al., 2000). Moreover, anthocyanin
reactions that do not involve procyanidins or tannins have also been demonstrated. The
resulting products include uncharacterized, large anthocyanin polymers (Salas et al.,
2005) and smaller molecules such as pyranoanthocyanins (Fulcrand, Benabdeljalil,
Rigaud, Cheynier, & Moutounet, 1998), and anthocyanin-caftaric acid adducts formed
through enzymatic oxidation reactions (Sarni-Manchado, Cheynier, & Moutounet,
1997).
HPLC-ESI-MSn as a Tool for Polyphenolic Characterization
High Performance Liquid Chromatography (HPLC) coupled with electrospray
ionization (ESI) and tandem mass spectrometry (MSⁿ) has gained popularity in recent
years as a fast and effective method for the identification and structural characterization
of polyphenolics in a variety of foods and beverages. Until a few years ago,
polyphenolic characterization was mainly performed using diode-array detection
coupled with HPLC (Pati, Losito, Gambacorta, La Notte, Palmisano, & Zambonin,
14
2006). Nevertheless, structural similarities among polyphenolics based on the same
constitutive units led to similar UV-visible spectra and possible co-elution, which along
with a lack of commercially available standards, made their identification very difficult
(Gu et al., 2003). Moreover, due to their ubiquitous presence as complex mixtures in
plants, extensive fractionation procedures and hyphenated techniques were often needed
(Careri, Mangia, & Musci, 1998).
Mass spectrometry has proved to be an effective tool in the structural
characterization of polyphenolics, providing experimental evidence for structures that
were only hypothesized until a few years ago (Flamini, 2003). Liquid chromatography-
mass spectrometry coupling has led to the development of new interfaces, expanding the
possibilities for the analysis of non-volatile, thermally labile phenolic compounds
(Careri, Bianchi, & Corradini, 2002). Major advances in ionization techniques having
the ability to analyze high molecular mass compounds with high sensitivity have been
key to the development of such new interfaces (Careri et al., 1998). Among them,
electrospray ionization has been introduced as a soft ionization technique for the analysis
of phenolic compounds, as it has proved suitable for non-volatile, thermally labile
compounds, in a relatively wide mass range (Niessen, 1999).
Early ESI applications were predominantly involved with the detection of
molecular ions (Guyot, Doco, Souquet, Moutounet, & Drilleau, 1997; Hammerstone,
Lazarus, Mitchell, Rucker, & Schmitz, 1999), as ESI offered the possibility of
generating molecular ions without any fragmentation (Friedrich, Eberhardt, & Galensa,
2000). Ions were measured both in the positive ionization mode ([M+H]+) and in the
15
negative ionization mode ([M-H]-) (Hammerstone et al., 1999; Wu, Wang, & Simon,
2003). However, due to the weakly acidic character of most polyphenolics, dissociation
is generally favored over protonation, and the negative ionization mode is often
associated with better sensitivity and selectivity in polyphenolic analysis (Friedrich et
al., 2000). The use of formic or acetic acids in the HPLC eluents has shown improved
chromatographic resolution and ion formation efficiency in the negative ionization
mode; however, it often leads to formate or acetate adducts which may complicate data
interpretation (Wu et al., 2003). In addition, multi-charged species ([M-2H]-2 or
[M-3H]-3), dimeric ions, and cluster ions have also been reported when using ESI-MSn
operating in the negative mode (Poon, 1998; Le Roux, Doco, Sarni-Manchado, Lozano,
& Cheynier, 1998). Despite these difficulties, instruments having ESI coupled with
tandem MS capabilities have been extensively employed in polyphenolic identification
and structural elucidation. ESI-MSn analyses are known to yield characteristic and
consistent fragmentation patterns for each particular compound in both positive and
negative ionization modes, making it sensitive and reliable method for structural
polyphenolic analyses (Gu et al., 2003).
In-Vitro Models for Polyphenolic Absorption
Polyphenolic bioavailability is a key factor when trying to relate in-vitro
chemoprotective and antioxidant properties to in-vivo outcomes in cancer and
inflammatory disease prevention (Balimane, Chong, & Morrison, 2000; Yi, Akoh,
Fischer, & Krewe, 2006). Currently, the most extensively characterized and widely used
16
in-vitro model for intestinal absorption and permeability is the Caco-2 cell line
(Balimane et al., 2000). Caco-2 cells, originally obtained from a human colon
adenocarcinoma, undergo a process of spontaneous differentiation in long-term culture,
leading to the formation of cell monolayers that express several morphological and
functional characteristics of mature intestinal enterocytes (Pinto et al., 1983). Thus,
Caco-2 cells grow in monolayers, show a cylindrical morphology, with microvilli on the
apical side, tight junctions between cells, and express intestinal hydrolase enzyme
activities on the apical membrane (Sambuy, De Angelis, Ranaldi, Scarino, Stammati, &
Zucco, 2005). Caco-2 cells are commonly cultured on permeable supports that allow free
access of nutrients to both sides of the cell monolayer, which resemble the conditions in
the intestine in-vivo and lead to improved morphological and functional differentiation
(Artursson, 1990). In addition, transepithelial electrical resistance and permeability of
marker molecules have been routinely used to monitor the integrity of the cell monolayer
(Sambuy et al., 2005).
Caco-2 cell monolayer models have been employed to assess intestinal transport
of several groups of polyphenolics, including several phenolic acids (Konishi,
Kobayashi, & Shimizu, 2003; Konishi & Shimizu, 2003), flavonoids (Walgren, Walle, &
Walle, 1998; Vaidyanathan & Walle, 2001; Yi et al., 2006), and procyanidins (Deprez,
Mila, Humeau, Tome, & Scalbert, 2001). Overall, all polyphenolic groups tested have
been shown to be transported from the apical to the basolateral side of cell monolayers,
and transport efficiency has been strongly influenced by chemical structure,
concentration, and the presence of additional matrix components (Konishi et al., 2003;
17
Walgren et al, 1998; Yi et al., 2006; Deprez et al., 2001). Transport efficiency is usually
higher for low molecular weight compounds and decreases as the molecular mass
increases (Konishi et al., 2003). Thus, while low amounts of procyanidin dimers and
trimers have been reported to pass through Caco-2 cell monolayers, polymers with a
higher degree of polymerization have not (Scalbert, Deprez, Mila, Albrecht, Huneau, &
Robot, 2000). According to Shoji et al. (2006), the absorption of polyphenolics of higher
molecular weight and the limits of absorption in-vivo, in relation to the degree of
polymerization, is still unclear.
18
CHAPTER III
PHYTOCHEMICAL, ANTIOXIDANT, AND THERMAL STABILITY OF TWO
AÇAI SPECIES, EUTERPE OLERACEA AND EUTERPE PRECATORIA
Introduction
Açai fruit, Euterpe oleracea Mart. and Euterpe precatoria Mart., are an
important economic palm fruit export from the Brazilian Amazon (Galotta &
Boaventura, 2005) and constitute the majority of açai pulp exported for food and
ingredient applications. The predominant species of açai exported from Brazil is E.
oleracea, or locally referred to as “açai-do-Pará”, frequently found in mono-specific
populations common in the Amazon River estuary floodplains (Muñiz-Miret et al.,
1996). The lesser available E. precatoria or “açaí-do-terra-firma” is widely distributed in
the central and western regions of the Brazilian Amazon and is commonly found in non-
flooded, upland fields (Clay & Clement, 1993). The palms of E. oleracea are multi-
stemmed, monoecious, and may reach heights higher than 25 m to produce small, round
(1.0 to 1.4 cm in diameter), dark purple fruits that are mainly harvested between July and
December (Muñiz-Miret et al., 1996). By contrast, the palms of E. precatoria are single-
stemmed and may grow to a maximum height of 22 m to produce spherical, dark purple
fruits (1.0 to 1.8 cm in diameter) harvested from December to August (Clay & Clement,
1993). Fruits from both species are characterized by a single seed that comprises
approximately 80% of the total volume, covered by fibrous layers and a slight oily
coating under a thin (0.5 to 1.5 mm. thick), edible mesocarp (Muñiz-Miret et al., 1996;
19
Clay & Clement, 1993). Fruits of both species ripen from green to deep purple color and
are commercially pulped with added water to prepare a thick, dark purple pulp with an
oily surface appearance and distinctive flavor. Locally known in Brazil as “açai” and
popular in the eastern regions of South America (Brondizio et al., 2002), açai pulp has
gained in commercial export markets for use in a variety of food and beverage
applications, greatly favored by international consumer trends towards health, wellness,
novelty, and exotic flavors. Particular attention has been given to the potential health
benefits of açai, associated with its in vitro antioxidant properties (Gallori et al., 2004)
attributed to its polyphenolic composition (Lichtenthaler et al., 2005). Polyphenolics
from E. oleracea have only been recently characterized (Gallori et al., 2004;
Lichtenthaler et al., 2005; Pacheco-Palencia et al., 2007a; Pacheco-Palencia et al.,
2007b; Schauss et al., 2006), and no previous reports on the phytochemical composition
comparing E. oleracea or E. precatoria fruits are available. Moreover, factors affecting
polyphenolic stability have not been determined. Therefore, this study was conducted to
assess the phytochemical composition, antioxidant properties, and thermal stability of
de-seeded E. oleracea and E. precatoria fruits. Results from these studies are aimed to
assist the food industry in determining potential uses of these fruits for a variety of food
and supplement applications.
Materials and Methods
Frozen, manually de-seeded, fully ripe açai fruits from Euterpe oleracea and
Euterpe precatoria were kindly donated by Everything Nature, Inc. (Orlando, FL) and
20
Turiya Corp. (Vero Beach, FL) and shipped overnight to the Department of Nutrition
and Food Science at Texas A&M University. Only the edible portion of the fruit pulp
was retained, and the inedible seed discarded. A composite from approximately 250
fully ripe fruits was used in these trials. Replications were made from these de-seeded
fruit pulps by macerating with a known volume of water (1:5 w/v fruit/water ratio)
adjusted to pH 3.5 with citric acid. Treatments were prepared by loading 10 mL of the
prepared fruit puree into screw-cap tubes and sparging for 5 minutes with either nitrogen
or air (as an oxygen source) until complete saturation. Dissolved oxygen content was
monitored using a YSI-57 dissolved oxygen meter (Yellow Springs, OH). Purees were
then heated in a water bath to an internal temperature of 80°C for 1, 30 or 60 minutes
and compared to a non-heated control. Treatments were held frozen at -20 °C and
analyzed within 1 week after processing. Prior to analysis, purees were centrifuged at
4°C for 15 min to separate insoluble solids and lipids from the aqueous juice fraction,
which was collected and filtered through Whatman #4 filter paper to clarify. For
antioxidant analyses, these aqueous extracts were partitioned into two polyphenolic
fractions using ethyl acetate, which separated most phenolic acids and flavonoids (non-
anthocyanin fraction) from the remaining aqueous juice (anthocyanin fraction). Ethyl
acetate was removed under reduced pressure at <40°C, and the isolate re-dissolved in
0.05 M citric acid buffer (pH 3.5) and along with the anthocyanin fractions, subjected to
acid hydrolysis for 90 minutes at 95°C in 2N HCl and immediately assessed for
antioxidant capacity and phytochemical composition.
21
Polyphenolic compounds present in açai were analyzed by reverse phase HPLC
with a Waters 2695 Alliance system (Waters Corp., Milford, MA), equipped with a
Waters 996 photodiode array detector. Separations were performed on a 250 x 4.6 mm
Acclaim 120-C18 column (Dionex, Sunnyvale, CA) with a C18 guard column. Mobile
phases consisted of water (phase A) and a 60:40 methanol and water (phase B), both
adjusted to pH 2.4 with o-phosphoric acid. The gradient solvent program ran phase B
from 0 to 60% in 20 min; 60 to 100% in 20 min; 100% for 7 min; 100 to 0% in 3 min
and final conditions were held for 2 min at a flow rate of 0.8 mL/min. Polyphenolics
were identified by UV/VIS spectral interpretation, retention time, and comparison to
authentic standards (Sigma Chemical Co., St. Louis, MO). Unidentified flavonoid
compounds were quantified in rutin equivalents, while procyanidin concentrations were
expressed in (+)-catechin equivalents.
Mass spectrometric analyses were performed on a Thermo Finnigan LCQ Deca
XP Max MSn ion trap mass spectrometer equipped with an ESI ion source
(ThermoFisher, San Jose, CA). Separations were conducted using the Phenomenex
(Torrace, CA) Synergi 4µ Hydro-RP 80A (2 x 150 mm) with a C18 guard column.
Mobile phases consisted of 0.5% formic acid in water (phase A) and 0.5% formic acid in
50:50 methanol:acetonitrile (phase B) run at 0.25 mL/min. Polyphenolics were separated
with a gradient elution program where phase B changed from 5 to 30% in 15 min, from
30 to 65% in 25 min, and from 65 to 95% in 10 min and was held isocratic for 20 min.
Electrospray ionization was conducted in the negative ion mode under the following
conditions: sheath gas (N2), 60 units/min; auxiliary gas (N2), 5 units/min; spray voltage,
22
3.3 kV; capillary temperature, 250°C; capillary voltage, 1.5 V; tube lens offset, 0 V.
Total anthocyanin contents were determined spectrophotometrically (Helios, Thermo
Electron, San Jose, CA) at 520 nm and quantified using mg/kg equivalents of cyanidin-
3-glucoside with a molar extinction coefficient of 29,600 (Pacheco-Palencia et al.,
2007b). Antioxidant capacity was determined using the oxygen radical absorbance
capacity assay, adapted to be performed in a BGM Labtech FLUOstar fluorescent
microplate reader (485 nm excitation and 520 nm emission), as previously described
(Talcott & Lee, 2002). Results were quantified in µmol Trolox equivalents (TE) per
gram of de-seeded açai fruit.
Data for each chemical analysis was the mean of three replicates, prepared
independently. Analysis of variance, parametric correlations, and means separations
(Tukey-Kramer HSD post-hoc test, p < 0.05) were conducted using SPSS version 15.0
(SPSS Inc., Chicago, IL).
Results and Discussion
From historical observations and repeated evaluations of both açai species for
characteristics such as total polyphenolics, total anthocyanins, and radical scavenging
activity, it was observed that E. precatoria has consistent and appreciably high
concentrations for these attributes than E. oleracea. Such observations led to a more in-
depth study comparing these two commercial species of açai. Commercial açai pulps can
vary considerably based on processing methods, the ratio of fruit pulp to water, fruit
quality, and level of fruit ripeness yet the fruit selected for these evaluations were chosen
23
by industrial processors to be most representative of fruit commercially available. Both
açai species shared similar polyphenolic profiles yet significant variations among
individual polyphenolic concentrations were detected. Anthocyanins were the
predominant polyphenolic in both species, and accounted for more than 90% of their
total polyphenolic contents.
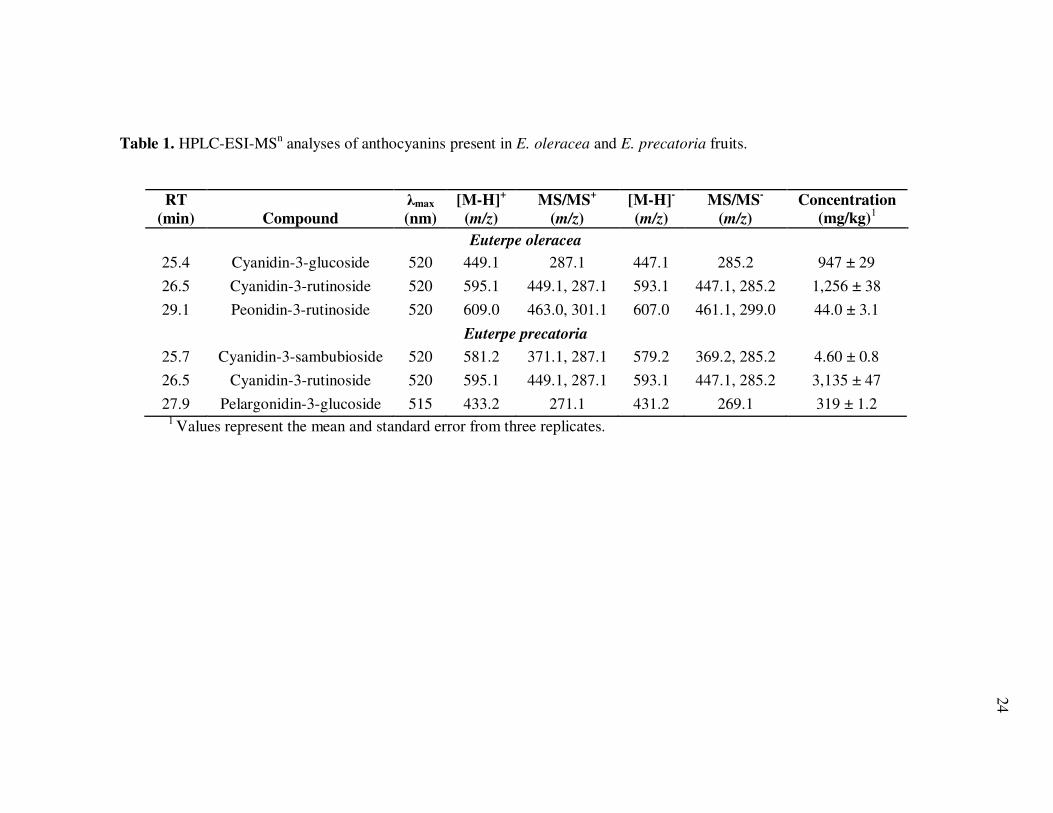
Spectroscopic and mass spectrometric data under both positive and negative
ionization modes, along with individual anthocyanin concentrations for each species are
presented in Table 1. Cyanidin glycosides were characterized by major ion signals at
m/z=287.1, [M-H]+, and m/z=285.2, [M-H]-, corresponding to cyanidin aglycone.
Similarly, peonidin-3-glucoside resulted in peonidin aglycone ion signals at m/z=301.1,
[M-H]+, and m/z=299.0, [M-H]-, while pelargonidin-3-glucoside produced analogous
aglycone ion signals at m/z=271.1, [M-H]+, and m/z=269.0, [M-H]-. Total anthocyanin
concentrations were over 50% higher in E. precatoria than in E. oleracea fruits, mainly
due to the abundance of cyanidin-3-rutinoside (3,135 ± 47 mg/kg), although
pelargonidin-3-glucoside (319 ± 1.2) and cyanidin-3-sambubioside (4.6 ± 0.8 mg/kg)
were also present. The lower anthocyanin concentrations detected in E. oleracea fruits
included cyanidin-3-rutinoside (1,256 ± 38 mg/kg), cyanidin-3-glucoside (947 ± 29
mg/kg), and peonidin-3-rutinoside (44.0 ± 3.1 mg/kg). These findings confirm previous
investigations that report anthocyanins in E. oleracea pulp and freeze-dried concentrates
(Gallori et al., 2004; Lichtenthaler et al., 2005; Pacheco-Palencia et al., 2007a; Pacheco-
Palencia et al., 2007b; Schauss et al., 2006) and are the first report of the anthocyanin
profile of E. precatoria.
24
Table 1. HPLC-ESI-MSn analyses of anthocyanins present in E. oleracea and E. precatoria fruits.
RT
(min) Compound
λmax
(nm)
[M-H]+
(m/z)
MS/MS+
(m/z)
[M-H]-
(m/z)
MS/MS-
(m/z)
Concentration (mg/kg)
1
Euterpe oleracea
25.4 Cyanidin-3-glucoside 520 449.1 287.1 447.1 285.2 947 ± 29
26.5 Cyanidin-3-rutinoside 520 595.1 449.1, 287.1 593.1 447.1, 285.2 1,256 ± 38
29.1 Peonidin-3-rutinoside 520 609.0 463.0, 301.1 607.0 461.1, 299.0 44.0 ± 3.1
Euterpe precatoria
25.7 Cyanidin-3-sambubioside 520 581.2 371.1, 287.1 579.2 369.2, 285.2 4.60 ± 0.8
26.5 Cyanidin-3-rutinoside 520 595.1 449.1, 287.1 593.1 447.1, 285.2 3,135 ± 47
27.9 Pelargonidin-3-glucoside 515 433.2 271.1 431.2 269.1 319 ± 1.2 1 Values represent the mean and standard error from three replicates.
25
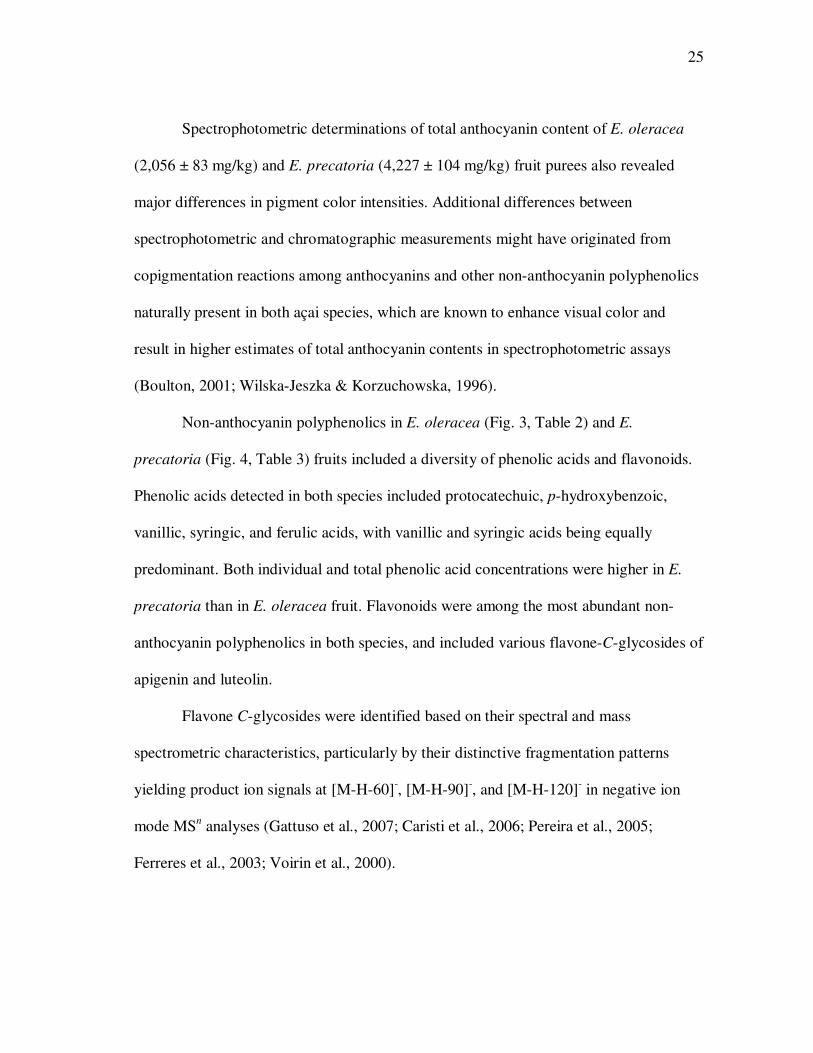
Spectrophotometric determinations of total anthocyanin content of E. oleracea
(2,056 ± 83 mg/kg) and E. precatoria (4,227 ± 104 mg/kg) fruit purees also revealed
major differences in pigment color intensities. Additional differences between
spectrophotometric and chromatographic measurements might have originated from
copigmentation reactions among anthocyanins and other non-anthocyanin polyphenolics
naturally present in both açai species, which are known to enhance visual color and
result in higher estimates of total anthocyanin contents in spectrophotometric assays
(Boulton, 2001; Wilska-Jeszka & Korzuchowska, 1996).
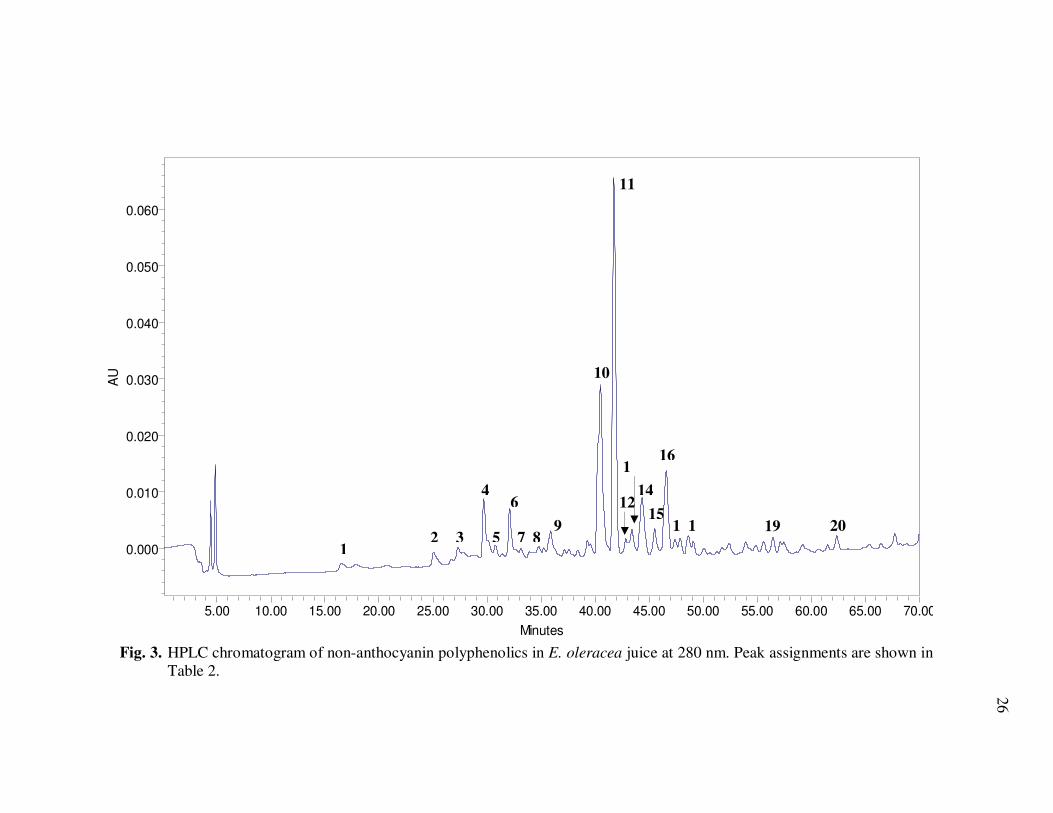
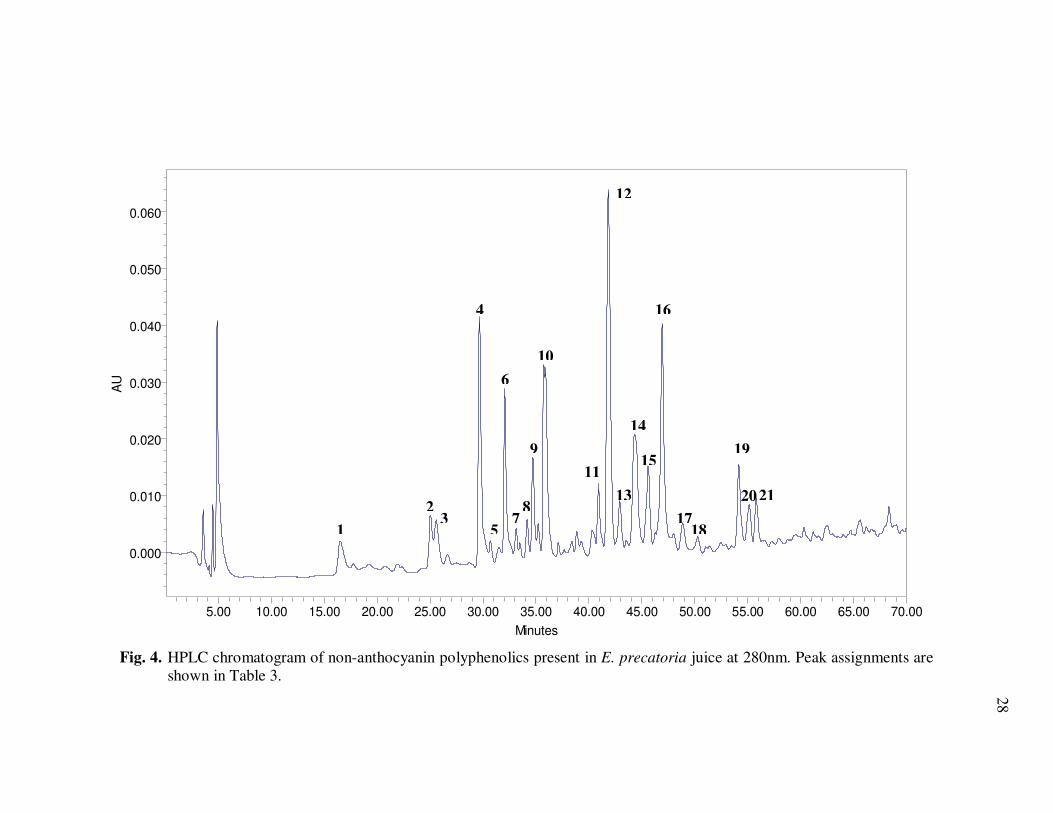
Non-anthocyanin polyphenolics in E. oleracea (Fig. 3, Table 2) and E.
precatoria (Fig. 4, Table 3) fruits included a diversity of phenolic acids and flavonoids.
Phenolic acids detected in both species included protocatechuic, p-hydroxybenzoic,
vanillic, syringic, and ferulic acids, with vanillic and syringic acids being equally
predominant. Both individual and total phenolic acid concentrations were higher in E.
precatoria than in E. oleracea fruit. Flavonoids were among the most abundant non-
anthocyanin polyphenolics in both species, and included various flavone-C-glycosides of
apigenin and luteolin.
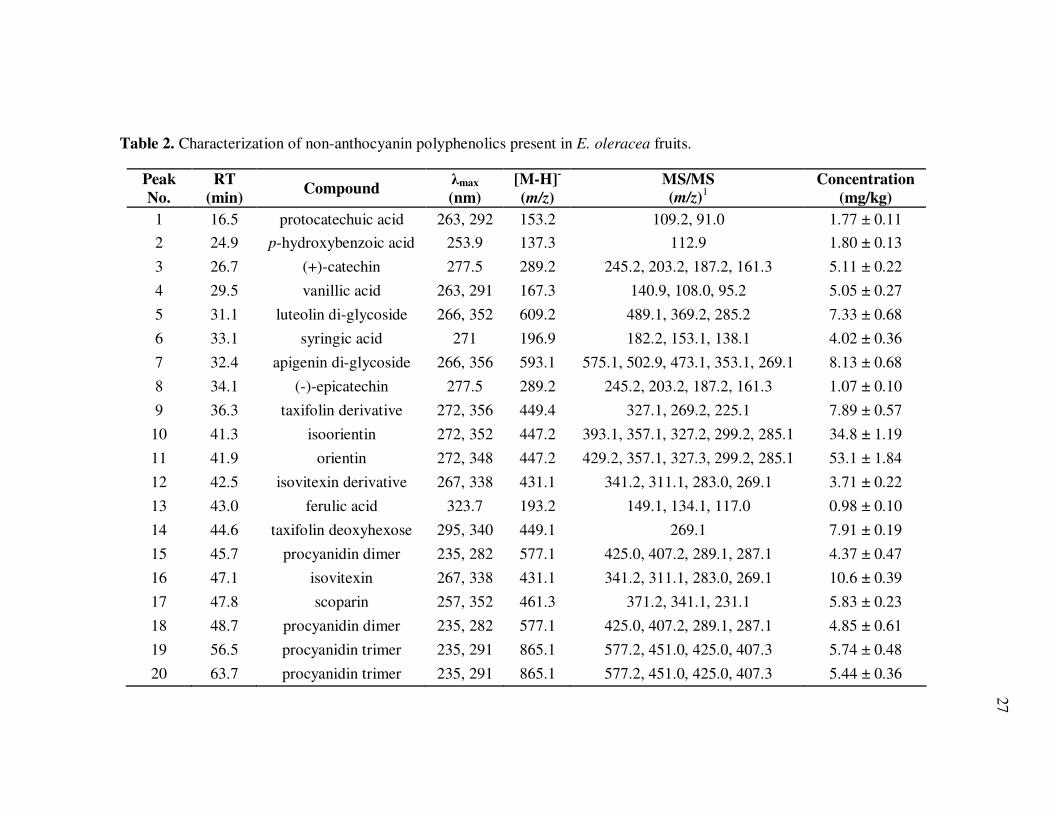
Flavone C-glycosides were identified based on their spectral and mass
spectrometric characteristics, particularly by their distinctive fragmentation patterns
yielding product ion signals at [M-H-60]-, [M-H-90]-, and [M-H-120]- in negative ion
mode MSn analyses (Gattuso et al., 2007; Caristi et al., 2006; Pereira et al., 2005;
Ferreres et al., 2003; Voirin et al., 2000).
26
Fig. 3. HPLC chromatogram of non-anthocyanin polyphenolics in E. oleracea juice at 280 nm. Peak assignments are shown in Table 2.
AU
0.000
0.010
0.020
0.030
0.040
0.050
0.060
Minutes
5.00 10.00 15.00 20.00 25.00 30.00 35.00 40.00 45.00 50.00 55.00 60.00 65.00 70.00
1 2 3
4 6
7 5 9
8
10
12
1
11
14
15
16
19 20 11
27
Table 2. Characterization of non-anthocyanin polyphenolics present in E. oleracea fruits.
Peak
No.
RT
(min) Compound
λmax
(nm)
[M-H]-
(m/z)
MS/MS
(m/z)1
Concentration
(mg/kg)
1 16.5 protocatechuic acid 263, 292 153.2 109.2, 91.0 1.77 ± 0.11
2 24.9 p-hydroxybenzoic acid 253.9 137.3 112.9 1.80 ± 0.13
3 26.7 (+)-catechin 277.5 289.2 245.2, 203.2, 187.2, 161.3 5.11 ± 0.22
4 29.5 vanillic acid 263, 291 167.3 140.9, 108.0, 95.2 5.05 ± 0.27
5 31.1 luteolin di-glycoside 266, 352 609.2 489.1, 369.2, 285.2 7.33 ± 0.68
6 33.1 syringic acid 271 196.9 182.2, 153.1, 138.1 4.02 ± 0.36
7 32.4 apigenin di-glycoside 266, 356 593.1 575.1, 502.9, 473.1, 353.1, 269.1 8.13 ± 0.68
8 34.1 (-)-epicatechin 277.5 289.2 245.2, 203.2, 187.2, 161.3 1.07 ± 0.10
9 36.3 taxifolin derivative 272, 356 449.4 327.1, 269.2, 225.1 7.89 ± 0.57
10 41.3 isoorientin 272, 352 447.2 393.1, 357.1, 327.2, 299.2, 285.1 34.8 ± 1.19
11 41.9 orientin 272, 348 447.2 429.2, 357.1, 327.3, 299.2, 285.1 53.1 ± 1.84
12 42.5 isovitexin derivative 267, 338 431.1 341.2, 311.1, 283.0, 269.1 3.71 ± 0.22
13 43.0 ferulic acid 323.7 193.2 149.1, 134.1, 117.0 0.98 ± 0.10
14 44.6 taxifolin deoxyhexose 295, 340 449.1 269.1 7.91 ± 0.19
15 45.7 procyanidin dimer 235, 282 577.1 425.0, 407.2, 289.1, 287.1 4.37 ± 0.47
16 47.1 isovitexin 267, 338 431.1 341.2, 311.1, 283.0, 269.1 10.6 ± 0.39
17 47.8 scoparin 257, 352 461.3 371.2, 341.1, 231.1 5.83 ± 0.23
18 48.7 procyanidin dimer 235, 282 577.1 425.0, 407.2, 289.1, 287.1 4.85 ± 0.61
19 56.5 procyanidin trimer 235, 291 865.1 577.2, 451.0, 425.0, 407.3 5.74 ± 0.48
20 63.7 procyanidin trimer 235, 291 865.1 577.2, 451.0, 425.0, 407.3 5.44 ± 0.36
28
Fig. 4. HPLC chromatogram of non-anthocyanin polyphenolics present in E. precatoria juice at 280nm. Peak assignments are shown in Table 3.
AU
0.000
0.010
0.020
0.030
0.040
0.050
0.060
Minutes
5.00 10.00 15.00 20.00 25.00 30.00 35.00 40.00 45.00 50.00 55.00 60.00 65.00 70.00
2 3
1
4
5
6
9
8
10
7
13
14
15
17
21
11
12
16
19
20
18
29
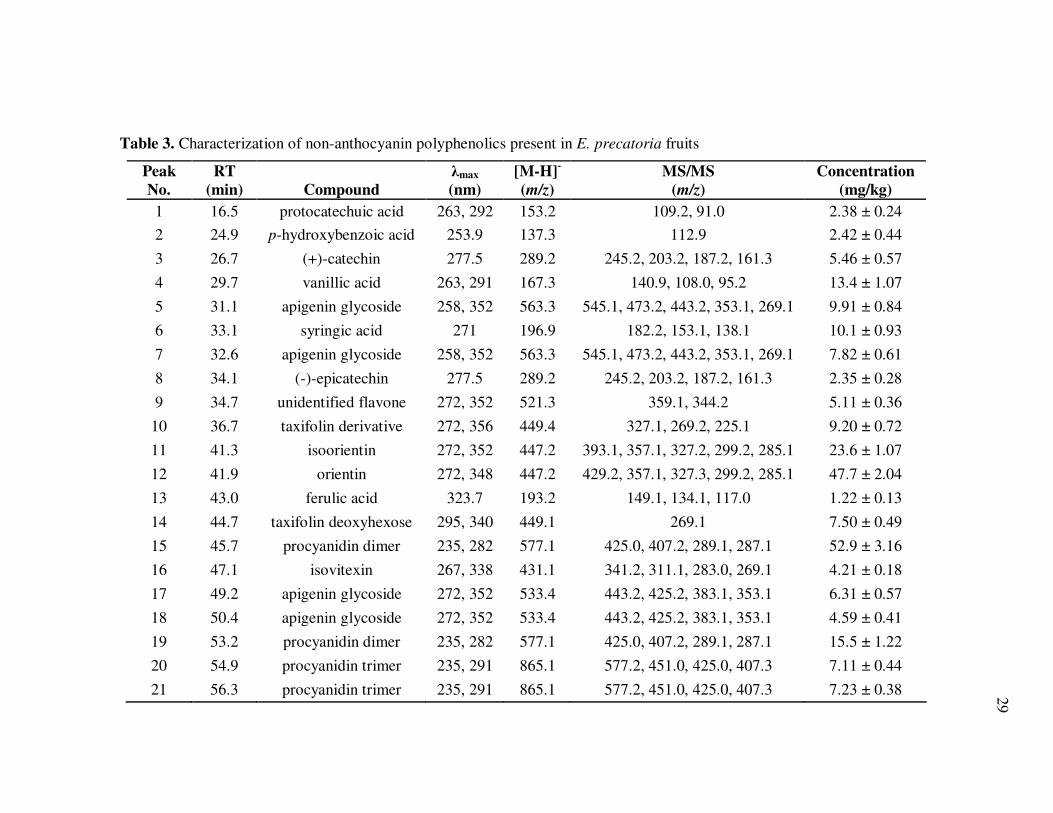
Table 3. Characterization of non-anthocyanin polyphenolics present in E. precatoria fruits
Peak
No.
RT
(min) Compound
λmax
(nm)
[M-H]-
(m/z)
MS/MS
(m/z)
Concentration
(mg/kg)
1 16.5 protocatechuic acid 263, 292 153.2 109.2, 91.0 2.38 ± 0.24
2 24.9 p-hydroxybenzoic acid 253.9 137.3 112.9 2.42 ± 0.44
3 26.7 (+)-catechin 277.5 289.2 245.2, 203.2, 187.2, 161.3 5.46 ± 0.57
4 29.7 vanillic acid 263, 291 167.3 140.9, 108.0, 95.2 13.4 ± 1.07
5 31.1 apigenin glycoside 258, 352 563.3 545.1, 473.2, 443.2, 353.1, 269.1 9.91 ± 0.84
6 33.1 syringic acid 271 196.9 182.2, 153.1, 138.1 10.1 ± 0.93
7 32.6 apigenin glycoside 258, 352 563.3 545.1, 473.2, 443.2, 353.1, 269.1 7.82 ± 0.61
8 34.1 (-)-epicatechin 277.5 289.2 245.2, 203.2, 187.2, 161.3 2.35 ± 0.28
9 34.7 unidentified flavone 272, 352 521.3 359.1, 344.2 5.11 ± 0.36
10 36.7 taxifolin derivative 272, 356 449.4 327.1, 269.2, 225.1 9.20 ± 0.72
11 41.3 isoorientin 272, 352 447.2 393.1, 357.1, 327.2, 299.2, 285.1 23.6 ± 1.07
12 41.9 orientin 272, 348 447.2 429.2, 357.1, 327.3, 299.2, 285.1 47.7 ± 2.04
13 43.0 ferulic acid 323.7 193.2 149.1, 134.1, 117.0 1.22 ± 0.13
14 44.7 taxifolin deoxyhexose 295, 340 449.1 269.1 7.50 ± 0.49
15 45.7 procyanidin dimer 235, 282 577.1 425.0, 407.2, 289.1, 287.1 52.9 ± 3.16
16 47.1 isovitexin 267, 338 431.1 341.2, 311.1, 283.0, 269.1 4.21 ± 0.18
17 49.2 apigenin glycoside 272, 352 533.4 443.2, 425.2, 383.1, 353.1 6.31 ± 0.57
18 50.4 apigenin glycoside 272, 352 533.4 443.2, 425.2, 383.1, 353.1 4.59 ± 0.41
19 53.2 procyanidin dimer 235, 282 577.1 425.0, 407.2, 289.1, 287.1 15.5 ± 1.22
20 54.9 procyanidin trimer 235, 291 865.1 577.2, 451.0, 425.0, 407.3 7.11 ± 0.44
21 56.3 procyanidin trimer 235, 291 865.1 577.2, 451.0, 425.0, 407.3 7.23 ± 0.38
30
Thus, isovitexin (apigenin-6-C-glucoside) identification was based on its
distinctive molecular ion at m/z= 431.1, [M-H]-, and subsequent fragmentation to
product ions at m/z= 341.2, [M-H-90]-, and m/z= 311.1, [M-H-120]- while scoparin
(chrysoeriol 8-C-glucoside) was characterized by a precursor ion at m/z= 461.3, [M-H]-,
and fragment ions at m/z= 371.2, [M-H-90]-, and m/z= 341.1, [M-H-120]-.
Both orientin (luteolin-8-C-glucoside) and isoorientin (luteolin-6-C-glucoside)
gave predominant molecular ions at m/z=447.2, [M-H]-. Loss of water resulted in ion
signals at m/z= 429.2, while fragmentation of the attached glycoside was likely
responsible for ions at m/z=357.1, [M-H-90]-, and m/z=327.2, [M-H-120]-. Finally,
cleavage of the C-sugar bond allowed the detection of the luteolin aglycone at m/z=
285.1. Identification of taxifolin deoxyhexose was based on spectral (λmax= 295, 340)
and mass spectrometric (m/z=449.1, [M-H]- and m/z=269.1, [M-H-180]-) characteristics,
as compared to previous reports using authentic standards (Schauss et al., 2006; Rijke et
al., 2006). Additional luteolin and apigenin glycosides were also detected in both
species, and tentative identifications were based on their typical spectral characteristics
(absorption at 350-360 nm) and mass fragmentation patterns (ion signals at [M-H-60]-,
[M-H-90]-, and [M-H-120]-), along with fragment ions corresponding to luteolin
(m/z=285.2, [M-H]-) and apigenin (m/z=269.1, [M-H]-) aglycones.
Orientin and isoorientin were the predominant flavonoids in both species,
accounting for over 50% of the total flavonoid concentration. Isovitexin, scoparin,
taxifolin deoxyhexose, two isovitexin and taxifolin derivatives, and two luteolin and
apigenin glycosides were also present in E. oleracea fruits at concentrations between 3.7
31
and 10.6 mg rutin equivalents/kg. Of these, only isovitexin and taxifolin deoxyhexose
were also detected in E. precatoria fruits (4.2 and 7.5 mg rutin equivalents/kg
respectively) along with four apigenin glycosides, a taxifolin derivative, and an
unidentified flavone, likely a glycoside, in concentrations ranging from 4.6 to 9.9 mg
rutin equivalents/kg. Results were in agreement to previous HPLC-MS characterizations
of flavonoids in E. oleracea (Gallori et al., 2004; Schauss et al., 2006), but this is the
first report with quantitative information.
In addition to flavonoids, procyanidin dimers and trimers were among the most
predominant non-anthocyanin polyphenolics in both açai species. Procyanidin dimers
were identified based on precursor ion signals at m/z= 577.1, [M-H]-, and fragments
corresponding to (+)-catechin or (-)-epicatechin units (m/z= 289.1 and m/z= 287.1, [M-
H]-), probably resulting from cleavage of the interflavanoid bond, and characteristic of
B-type procyanidin dimers (Friederich et al., 2000; Gu et al., 2003). Procyanidin trimers
(m/z= 865.1, [M-H]-) were characterized by predominant product ion signals at
m/z=577.2, [M-H-288]-, likely due to the loss of a (+)-catechin or (-)-epicatechin unit,
yielding dimeric procyanidin fragment ions (Friedrich et al., 2000; Gu et al., 2003).
Further fragmentation of ions at m/z=577.2 occurred in a similar manner as in the
previously identified B-type procyanidins, confirming their identity. Procyanidin dimers
were particularly abundant in E. precatoria fruits, accounting for more than 25% of the
total non-anthocyanin polyphenolic content, while procyanidin trimers accounted for just
over 5%. Conversely, procyanidin dimers and trimers accounted for only over 10% of
the total non-anthocyanin polyphenolics in E. oleracea. Flavonol monomers such as (+)-
32
catechin and (-)-epicatechin also represented less than 5% of the total non-anthocyanin
polyphenolic content for both species. Higher molecular weight compounds, likely
polymeric procyanidins (Schauss et al., 2006), were also detected; however,
quantification was not possible due to their poor resolution under these chromatographic
conditions (Santos-Buelga & Williamson, 2003).
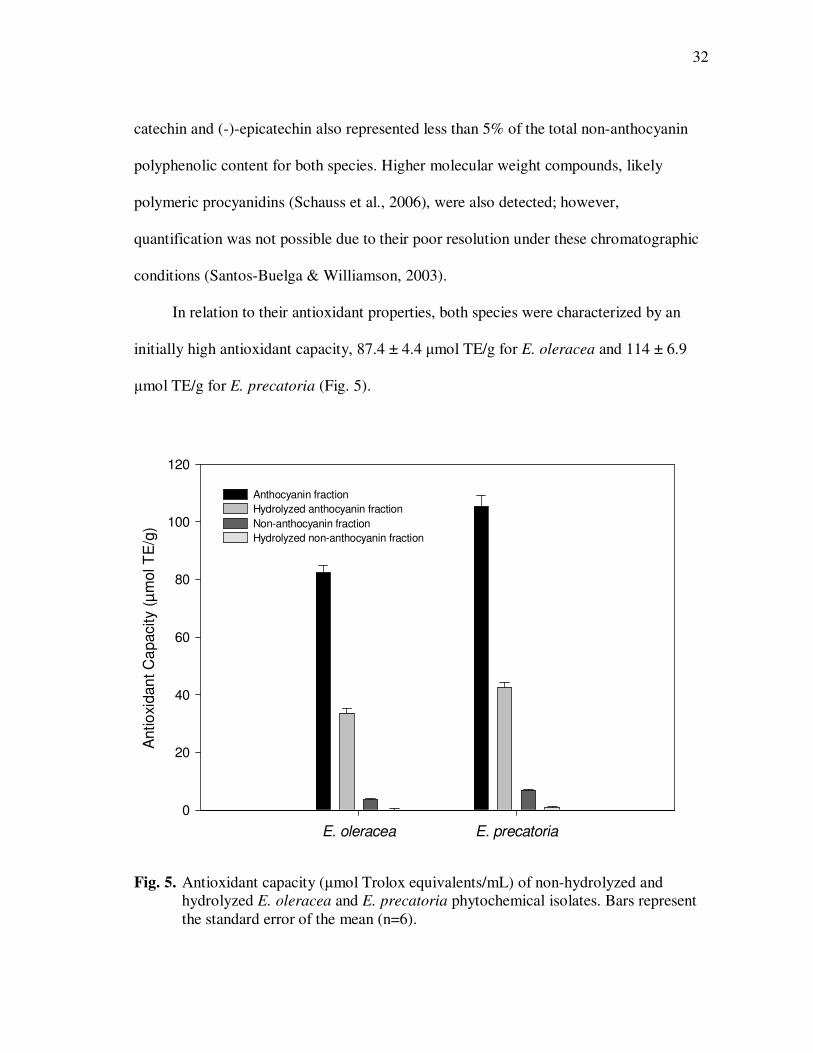
In relation to their antioxidant properties, both species were characterized by an
initially high antioxidant capacity, 87.4 ± 4.4 µmol TE/g for E. oleracea and 114 ± 6.9
µmol TE/g for E. precatoria (Fig. 5).
E. oleracea E. precatoria
Antio
xid
an
t C
apacity (
µm
ol T
E/g
)
0
20
40
60
80
100
120
Anthocyanin fraction
Hydrolyzed anthocyanin fraction
Non-anthocyanin fraction
Hydrolyzed non-anthocyanin fraction
Fig. 5. Antioxidant capacity (µmol Trolox equivalents/mL) of non-hydrolyzed and hydrolyzed E. oleracea and E. precatoria phytochemical isolates. Bars represent the standard error of the mean (n=6).
33
Variations in antioxidant capacity between species were attributed to simple
differences in phytochemical composition and concentration, primarily associated with
the higher anthocyanin and procyanidin contents of E. precatoria. Fractionation of
anthocyanins from remaining polyphenolics followed by acid hydrolysis provided
additional detail that related to those compounds most responsible for radical scavenging
contributions from each species. Anthocyanin-containing fractions from both species
exhibited the highest antioxidant capacity, ranging from 82.4 ± 2.3 µmol TE/g in E.
oleracea to 105.4 ± 3.9 µmol TE/g in E. precatoria, confirming that anthocyanins were
the major contributors to antioxidant capacity at over 90% of the total. The remaining
antioxidant capacity was due to non-anthocyanin compounds and represented from 3.7 ±
0.34 µmol TE/g in E. oleracea to 6.8 ± 0.52 µmol TE/mL in E. precatoria. Acid
hydrolysis resulted in a significant reduction in the antioxidant capacity for both species,
equivalent to 59.1 to 59.5% decrease for the anthocyanin isolate compared to 88.9 to
100% for the remaining polyphenolics (Fig. 5).
Chromatographic analyses of polyphenolics in the hydrolyzed, anthocyanin
fractions revealed the presence of cyanidin (m/z=287.1, [M-H]-, 99%) and peonidin
(m/z=301.1, [M-H]-, 1%) aglycones in E. oleracea and cyanidin (m/z=287.1, [M-H]-,
94%) and pelargonidin (m/z=271.1, [M-H]-, 6%) aglycones in E. precatoria fractions,
further confirming their presence. Moreover, luteolin (m/z=285, [M-H]-) and apigenin
(m/z=269, [M-H]-) aglycones were also detected in the hydrolyzed non-anthocyanin
polyphenolic fraction of both species, along with trace concentrations of a cyanidin
aglycone (<1 mg/kg), potentially derived from polymeric procyanidins.
34
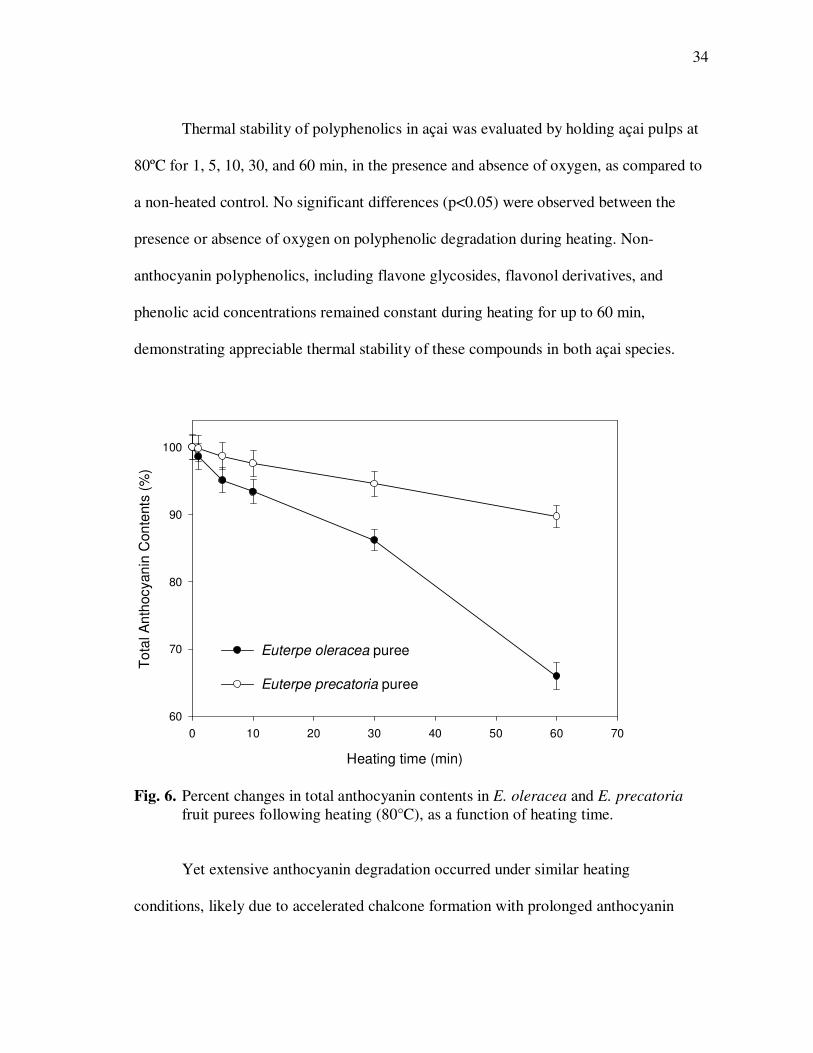
Thermal stability of polyphenolics in açai was evaluated by holding açai pulps at
80ºC for 1, 5, 10, 30, and 60 min, in the presence and absence of oxygen, as compared to
a non-heated control. No significant differences (p<0.05) were observed between the
presence or absence of oxygen on polyphenolic degradation during heating. Non-
anthocyanin polyphenolics, including flavone glycosides, flavonol derivatives, and
phenolic acid concentrations remained constant during heating for up to 60 min,
demonstrating appreciable thermal stability of these compounds in both açai species.
Heating time (min)
0 10 20 30 40 50 60 70
To
tal A
nth
ocyan
in C
on
tents
(%
)
60
70
80
90
100
Euterpe oleracea puree
Euterpe precatoria puree
Fig. 6. Percent changes in total anthocyanin contents in E. oleracea and E. precatoria
fruit purees following heating (80°C), as a function of heating time. Yet extensive anthocyanin degradation occurred under similar heating
conditions, likely due to accelerated chalcone formation with prolonged anthocyanin
35
exposure to high temperatures (Delgado-Vargas et al., 2002). Anthocyanin degradation
rates were directly related to thermal exposure times (Fig. 6), yet highly variable
between species, ranging from 10.3 ± 1.1% in E. precatoria to 34.0 ± 2.3% in E.
oleracea purees. Variations in overall anthocyanin stability were attributed to differences
in anthocyanin composition and variations in non-anthocyanin polyphenolics, which
likely conferred additional stability. Cyanidin-3-rutinoside consistently showed a higher
thermal stability (7.0 ± 0.6% loss following heating at 80°C for 1 h) than cyanidin-3-
glucoside (up to 72 ± 5.3% loss under identical heating conditions) in both açai species.
Therefore, an overall higher anthocyanin thermal stability in E. precatoria purees was
likely attributed to higher concentrations of cyanidin-3-rutinoside (~90% of total
anthocyanins, Table 1), compared to E. oleracea purees (~55% of total anthocyanins,
Table 1).
Results were in agreement with previous investigations on the storage stability of
anthocyanins in E. oleracea juice, where cyanidin-3-rutinoside half-lives doubled those
of cyanidin-3-glucoside, both in the presence and absence of ascorbic acid (Pacheco-
Palencia et al., 2007a). Similar observations have been also reported in other cyanidin-3-
glucoside and cyanidin-3-rutinoside containing fruits, such as blackcurrants (Rubiskiene
et al., 2005), where cyanidin-3-rutinoside was found to be the most thermally stable
anthocyanin (35% loss after 150 min at 95°C). Variations in total anthocyanin contents
during heating were highly correlated (r=0.98) to changes in total antioxidant capacity,
which decreased by up to 10 ± 0.8% in E. precatoria and by 25 ± 2% in E. oleracea
36
purees, evidencing a major contribution of anthocyanins to the overall antioxidant
capacity of both açai species.
Conclusion
Euterpe oleracea and Euterpe precatoria species shared similar polyphenolic
profiles, characterized by the predominant presence of anthocyanins, which accounted
for nearly 90% of the total antioxidant capacity in both açai fruits. Moreover, changes in
antioxidant activity during heating were highly correlated to anthocyanin losses while
phenolic acids, flavone glycosides, and flavanol derivatives present in both species, were
not significantly altered by thermal exposure. Thus, both açai species are comparably
suitable for food and beverage applications involving mild exposure to high
temperatures.
37
CHAPTER IV
CHEMICAL COMPOSITION AND THERMAL STABILITY OF A
PHYTOCHEMICAL-ENRICHED OIL FROM AÇAI
Introduction
Açai fruit (Euterpe oleracea Mart.) is currently among the most economically
significant palm species in the Brazilian Amazon (Galotta & Boaventura, 2005), and has
become one of the main export products of the Amazon estuary to other regions in the
world. International growth of the açai trade in recent years has been attributed to the
açai beverage industry and related products (Brondizio, Safar, & Siqueira, 2002), where
much attention has been given to its antioxidant capacity and associated potential health
benefits (Del Pozo, Brenes, & Talcott, 2004; Gallori et al., 2004; Lichtenthaler et al.,
2005). As such, research efforts have focused on the study of açai pulps and juices, and
factors affecting their stability and functional properties (Gallori et al., 2004;
Lichtenthaler et al., 2005, Pacheco-Palencia et al., 2007a; Pacheco-Palencia et al.,
2007b).
A distinguishing feature of açai fruit pulp is the presence of lipids that may
account for up to 9% of the total fresh weight of the edible pulp (Clay & Clement, 1993;
Lubrano, Robin, & Khaiat, 1994) and potentially represents a valuable by-product given
its unique sensory characteristics, dark green color, and potential health benefits related
to its traditional therapeutic uses by Amazonian inhabitants (Plotkin & Balick, 1984). A
previous study on açai oil composition (Lubrano et al., 1994) reported 60% oleic acid,
38
22% palmitic acid, 12% linoleic acid, and 6% each of palmitoleic and stearic acids along
with other fatty acids in trace amounts. At least five sterols were also identified
including β-sitosterol (78%), stigmasterol (6.5%), δ5-avenasterol (6.5%), campesterol
(6.0%), and cholesterol (2.0%). However, no reports on the polyphenolic and antioxidant
composition of açai oil are available and its stability during processing and storage has
not been previously assessed.
The present study was conducted to characterize the main polyphenolic
compounds in oil extracts from açai fruit and to evaluate short and long-term stability of
these compounds in terms of lipid oxidation and their impact on antioxidant capacity and
total soluble phenolic contents. Based on these trials, the potential uses of açai oil
extracts for food, supplement, and cosmetic applications were determined.
Materials and Methods
Açai oil was solvent extracted using a patent-pending process (Talcott, 2007)
from a water-insoluble juice processing by-product obtained from the Bossa Nova
Beverage Group (Los Angeles, CA) and solvent removed under vacuum to produce a
crude oil for these trails. The resultant oil designated “high phenolics” was naturally
enriched in polyphenolics present in the açai fruit itself, and was hypothesized to
influence the oxidative stability of the oil. A second oil was prepared by repeatedly
extracting the high phenolic oil with water and then extracting with 100% hexane to
facilitate the removal of polyphenolics from the oil. Upon solvent removal under
reduced pressure at <40°C an oil that was essentially free of phenolic acids (<5% of the
39
original oil) resulted and was designated “low phenolics”. An “intermediate phenolics”
oil was then prepared as a 50:50 mixture of high and low phenolic oils.
Equal amounts of oils (5 mL) were loaded into screw-cap glass test tubes in
triplicate, the headspace flushed with nitrogen, and stored at 20, 30, and 40°C in the dark
for 10 weeks. Tubes were removed from storage periodically and treatments held at -
20°C until analysis. The short-term thermal stability of polyphenolics in the high
phenolic oil was also evaluated by loading 2 mL of oil into screw-cap glass test tube and
heated to an internal temperature of 150 and 170°C for 0, 5, 10, and 20 min using a
commercial vegetable oil as the heating medium. Samples were immediately cooled by
immersion in cold water. For chemical analyses, oil samples (100 mg) were extracted
with 4 mL a 1:1 hexane:methanol mixture, followed by an equivalent volume of water.
The upper phase was discarded and the lower, hydrophilic phase was used for
subsequent analyses. Phytochemical analyses on the enriched açai oil were compared to
a polyphenolic extract from clarified açai juice, prepared by extensive liquid/liquid
extraction with ethyl acetate to isolate non-anthocyanin polyphenolics from the aqueous
juice. The solvent was evaporated under reduced pressure at <40°C and the isolate
redissolved in a known volume of citric acid buffer (pH 3.5) and used for subsequent
analyses.
Major polyphenolic compounds present in açai oil were analyzed by reversed
phase HPLC with a Waters 2695 Alliance system (Waters Corp., Milford, MA), using
water with 2% acetic acid (phase A) and a mixture of 68% acetonitrile, 30% water, and
2% acetic acid (phase B). The elution program ran phase B from 0 to 30% in 20 min, 30
40
to 50% from 20 to 50 min, and 50 to 90% in 75 min, at a flow rate of 0.8 mL/min. Initial
conditions were then restored and kept constant for 10 min prior each injection.
Polyphenolics were identified and quantified based on their spectral
characteristics and retention time, as compared to authentic standards (Sigma Chemical
Co., St. Louis, MO). Further structural information was obtained by mass spectrometric
analyses, performed on a Thermo Finnigan LCQ Deca XP Max MSn ion trap mass
spectrometer equipped with an ESI ion source (ThermoFisher, San Jose, CA).
Separations were conducted using the Phenomenex (Torrace, CA) Synergi 4µ Hydro-RP
80A (2 x 150 mm; 4 µm) with a C18 guard column. Mobile phases consisted of 0.5%
formic acid in water (phase A) and 0.5% formic acid in a mixture of 50% methanol, 50%
acetonitrile (phase B) run at 0.25 mL/min. Polyphenolics were separated with a gradient
elution program in which phase B changed from 5 to 30% in 5 min, from 30 to 65% in
70 min, and from 65 to 95% in 30 min and was held isocratic for 20 min. Electrospray
ionization was conducted in the negative ion mode under the following conditions:
sheath gas (N2), 60 units/min; auxiliary gas (N2), 5 units/min; spray voltage, 3.3 kV;
capillary temperature, 250°C; capillary voltage, 1.5 V; tube lens offset, 0 V.
Total soluble phenolics, measuring the metal reduction capacity of oil
extractions, was analyzed by the Folin-Ciocalteu assay (Singleton & Rossi, 1965) and
quantified in gallic acid equivalents (GAE). Antioxidant capacity was determined by the
oxygen radical absorbance capacity (ORAC) assay in a BGM Labtech FLUOstar
fluorescent microplate reader (485 nm excitation and 538 nm emission), as previously
described in chapter III. Results were quantified in µmol Trolox equivalents (TE) per
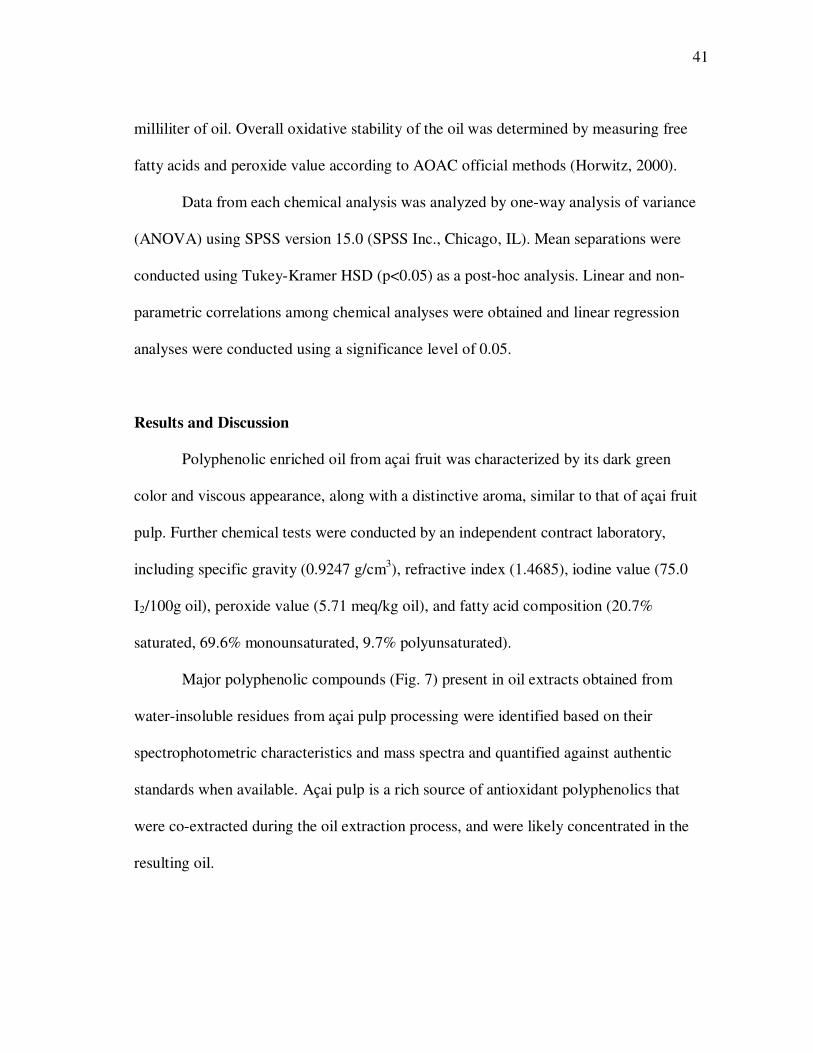
41
milliliter of oil. Overall oxidative stability of the oil was determined by measuring free
fatty acids and peroxide value according to AOAC official methods (Horwitz, 2000).
Data from each chemical analysis was analyzed by one-way analysis of variance
(ANOVA) using SPSS version 15.0 (SPSS Inc., Chicago, IL). Mean separations were
conducted using Tukey-Kramer HSD (p<0.05) as a post-hoc analysis. Linear and non-
parametric correlations among chemical analyses were obtained and linear regression
analyses were conducted using a significance level of 0.05.
Results and Discussion
Polyphenolic enriched oil from açai fruit was characterized by its dark green
color and viscous appearance, along with a distinctive aroma, similar to that of açai fruit
pulp. Further chemical tests were conducted by an independent contract laboratory,
including specific gravity (0.9247 g/cm3), refractive index (1.4685), iodine value (75.0
I2/100g oil), peroxide value (5.71 meq/kg oil), and fatty acid composition (20.7%
saturated, 69.6% monounsaturated, 9.7% polyunsaturated).
Major polyphenolic compounds (Fig. 7) present in oil extracts obtained from
water-insoluble residues from açai pulp processing were identified based on their
spectrophotometric characteristics and mass spectra and quantified against authentic
standards when available. Açai pulp is a rich source of antioxidant polyphenolics that
were co-extracted during the oil extraction process, and were likely concentrated in the
resulting oil.
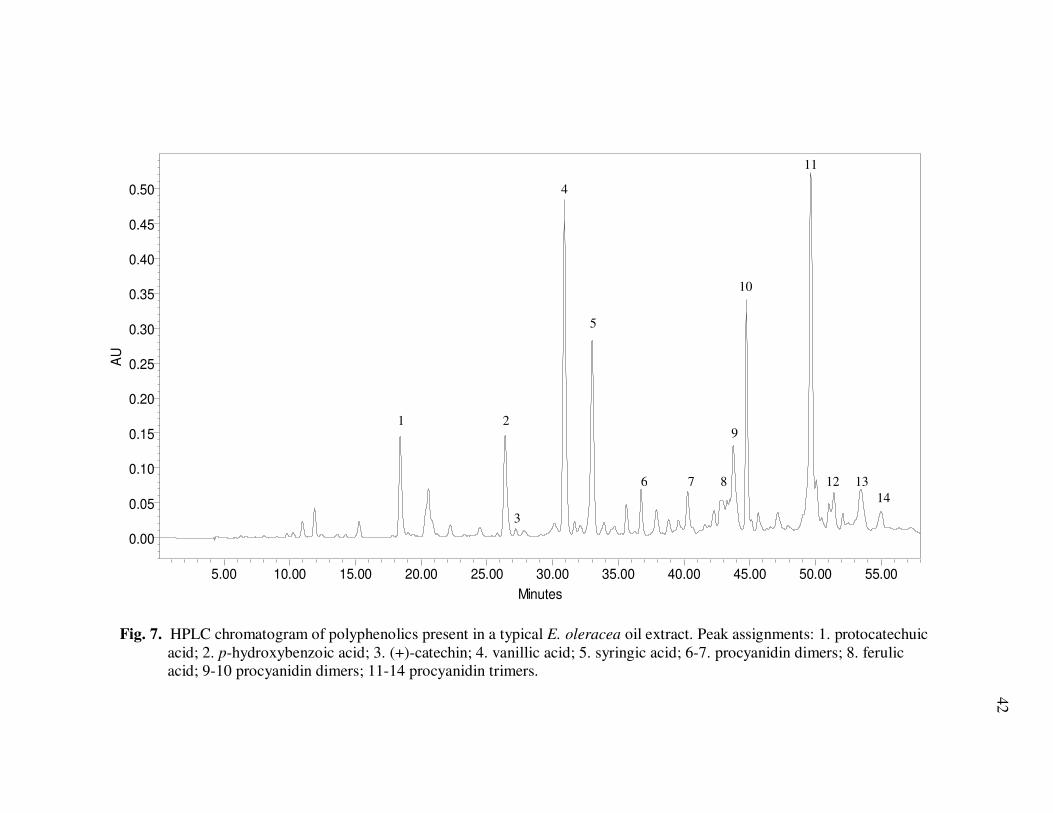
42
Fig. 7. HPLC chromatogram of polyphenolics present in a typical E. oleracea oil extract. Peak assignments: 1. protocatechuic acid; 2. p-hydroxybenzoic acid; 3. (+)-catechin; 4. vanillic acid; 5. syringic acid; 6-7. procyanidin dimers; 8. ferulic acid; 9-10 procyanidin dimers; 11-14 procyanidin trimers.
AU
0.00
0.05
0.10
0.15
0.20
0.25
0.30
0.35
0.40
0.45
0.50
Minutes
5.00 10.00 15.00 20.00 25.00 30.00 35.00 40.00 45.00 50.00 55.00
1
2
3
4
5
7 8
9
10
11
12 13 14
6
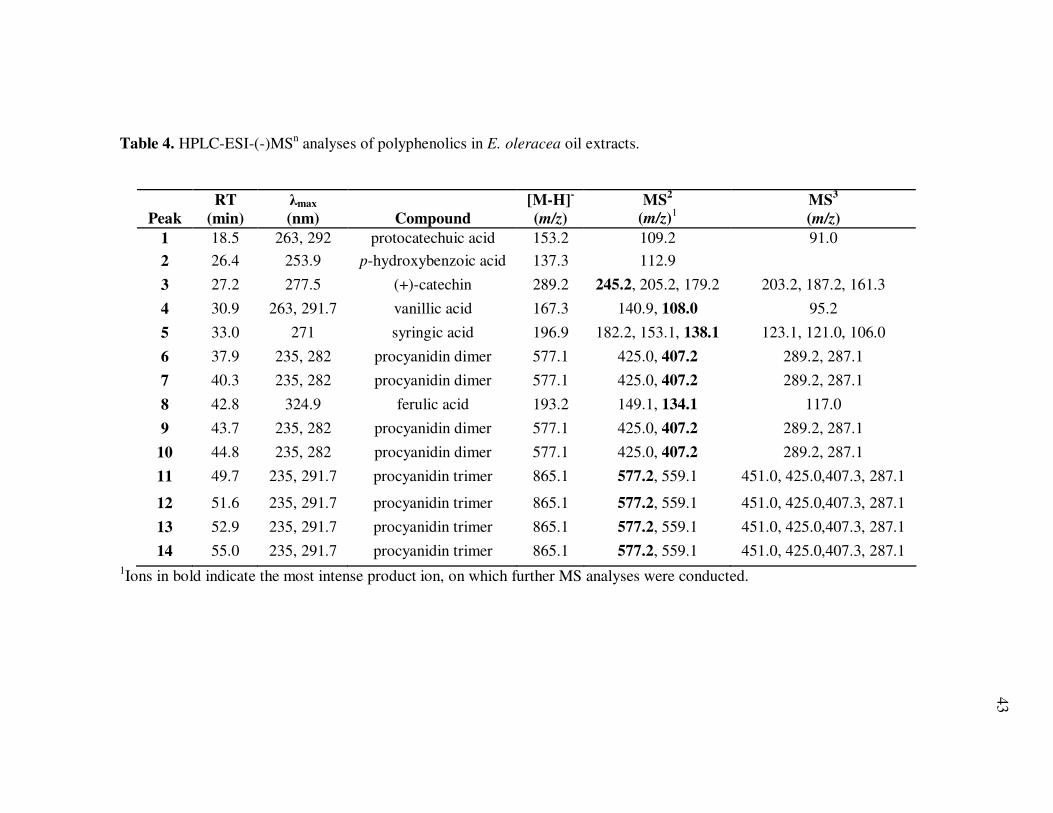
43
Table 4. HPLC-ESI-(-)MSn analyses of polyphenolics in E. oleracea oil extracts.
Peak
RT
(min)
λmax
(nm) Compound
[M-H]-
(m/z)
MS2
(m/z)1
MS3
(m/z)
1 18.5 263, 292 protocatechuic acid 153.2 109.2 91.0
2 26.4 253.9 p-hydroxybenzoic acid 137.3 112.9
3 27.2 277.5 (+)-catechin 289.2 245.2, 205.2, 179.2 203.2, 187.2, 161.3
4 30.9 263, 291.7 vanillic acid 167.3 140.9, 108.0 95.2
5 33.0 271 syringic acid 196.9 182.2, 153.1, 138.1 123.1, 121.0, 106.0
6 37.9 235, 282 procyanidin dimer 577.1 425.0, 407.2 289.2, 287.1
7 40.3 235, 282 procyanidin dimer 577.1 425.0, 407.2 289.2, 287.1
8 42.8 324.9 ferulic acid 193.2 149.1, 134.1 117.0
9 43.7 235, 282 procyanidin dimer 577.1 425.0, 407.2 289.2, 287.1
10 44.8 235, 282 procyanidin dimer 577.1 425.0, 407.2 289.2, 287.1
11 49.7 235, 291.7 procyanidin trimer 865.1 577.2, 559.1 451.0, 425.0,407.3, 287.1
12 51.6 235, 291.7 procyanidin trimer 865.1 577.2, 559.1 451.0, 425.0,407.3, 287.1
13 52.9 235, 291.7 procyanidin trimer 865.1 577.2, 559.1 451.0, 425.0,407.3, 287.1
14 55.0 235, 291.7 procyanidin trimer 865.1 577.2, 559.1 451.0, 425.0,407.3, 287.1 1Ions in bold indicate the most intense product ion, on which further MS analyses were conducted.
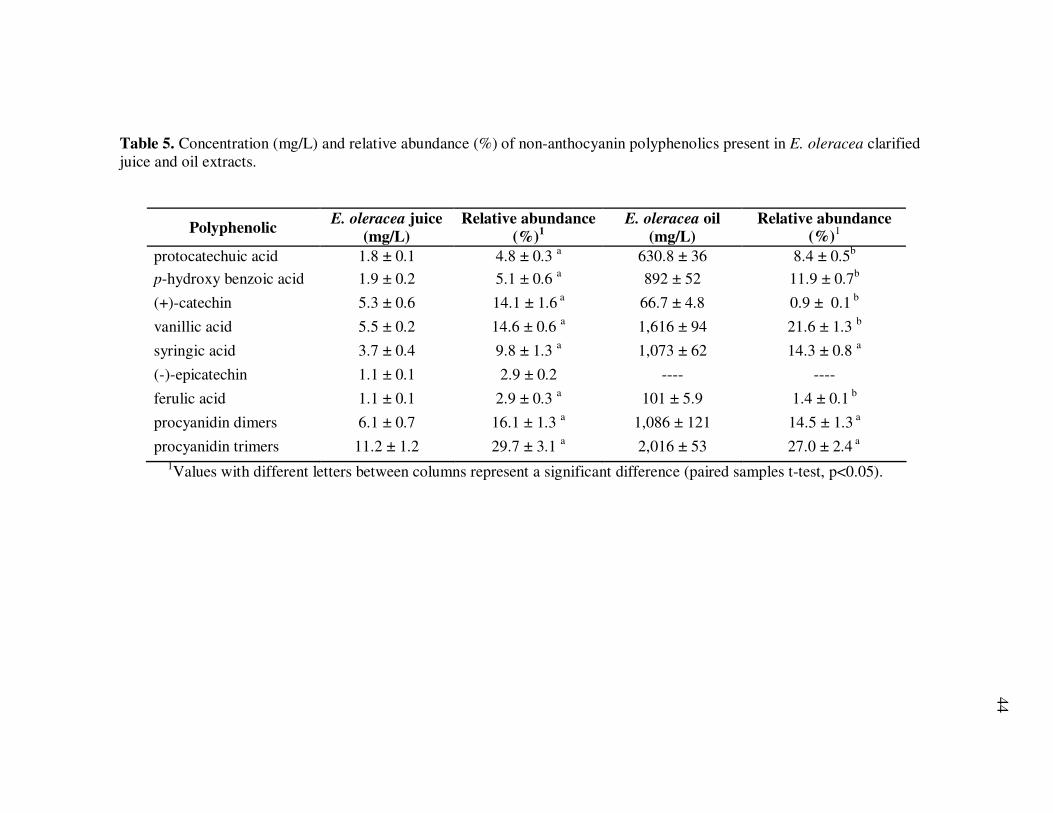
44
Table 5. Concentration (mg/L) and relative abundance (%) of non-anthocyanin polyphenolics present in E. oleracea clarified juice and oil extracts.
Polyphenolic E. oleracea juice
(mg/L) Relative abundance
(%)1
E. oleracea oil (mg/L)
Relative abundance (%)
1
protocatechuic acid 1.8 ± 0.1 4.8 ± 0.3 a 630.8 ± 36 8.4 ± 0.5b
p-hydroxy benzoic acid 1.9 ± 0.2 5.1 ± 0.6 a 892 ± 52 11.9 ± 0.7b
(+)-catechin 5.3 ± 0.6 14.1 ± 1.6 a 66.7 ± 4.8 0.9 ± 0.1 b
vanillic acid 5.5 ± 0.2 14.6 ± 0.6 a 1,616 ± 94 21.6 ± 1.3 b
syringic acid 3.7 ± 0.4 9.8 ± 1.3 a 1,073 ± 62 14.3 ± 0.8 a
(-)-epicatechin 1.1 ± 0.1 2.9 ± 0.2 ---- ----
ferulic acid 1.1 ± 0.1 2.9 ± 0.3 a 101 ± 5.9 1.4 ± 0.1 b
procyanidin dimers 6.1 ± 0.7 16.1 ± 1.3 a 1,086 ± 121 14.5 ± 1.3 a
procyanidin trimers 11.2 ± 1.2 29.7 ± 3.1 a 2,016 ± 53 27.0 ± 2.4 a 1Values with different letters between columns represent a significant difference (paired samples t-test, p<0.05).
45
Phenolic acids such as vanillic acid (1,616 ± 94 mg/L), syringic acid (1,073 ± 62 mg/L),
p-hydroxy benzoic acid (892 ± 52 mg/L), protocatechuic acid (629 ± 36 mg/L), and
ferulic acid (101 ± 5.9 mg/L) were predominantly present in the oil while (+)-catechin
(66.7 ± 4.8 mg/L), four procyanidin dimers (1,085.6 ± 121.3 mg (+)-catechin
equivalents/L), and four procyanidin trimers (2,016.2 ± 53.2 mg (+)-catechin
equivalents/L) were also detected in high concentrations (Tables 4 and 5).
In addition, five compounds exhibiting typical flavonoid spectral characteristics
were detected at trace concentrations, from 0.58 to 4.21 mg rutin equivalents/kg in açai
oil. Previous studies on polyphenolics in açai pulp (Gallori et al., 2004; Lichtenthaler et
al., 2005; Pacheco-Palencia et al., 2007a; Pacheco-Palencia et al., 2007b), seeds
(Rodrigues et al., 2006), and freeze-dried açai fruit (Schauss et al., 2006) reported the
presence of phenolic acids such as vanillic, syringic, p-hydroxy benzoic, protocatechuic,
and ferulic acid, as well as (+)-catechin, (-)-epicatechin, and B type procyanidins, from
dimers to high molecular weight polymers that were not characterized. In this study,
structural information was obtained by means of mass spectrometric analyses that
confirmed the identities of the polyphenolics previously identified by HPLC and
provided additional information on the identity and degree of polymerization of
procyanidin dimers and trimers (Table 4). Both the catechin-like UV spectra and
characteristic signals at m/z 577.1 ([M-H]-) indicated the presence of procyanidin dimers
while signals at m/z 865.1 ([M-H]-) were attributed to procyanidin trimers.
Previous LC-ESI-MSn studies on proanthocyanidins agreed that the m/z 577.1 ion
is indicative of B-type procyanidin dimers (Friedrich et al., 2000) while fragmentation to
46
the m/z 425.0 ion was characteristic of the product obtained from Retro-Diels-Alder
reaction of ring C and subsequent elimination of ring B from the flavan-3-ol (Gu et al.,
2003). Finally, m/z 289.2 and 287.1 fragments, likely from cleavage of the interflavanoid
bond (Friedrich et al., 2000; Gu et al., 2003; Pati et al., 2006) suggested that these
procyanidin dimers consisted of two catechin units, although no differentiation between
stereoisomers was possible. Similarly, procyanidin trimers (m/z 865.1) were
characterized by a predominant product ion at m/z 577.2, likely corresponding to a
dimeric fragment ion from cleavage of interflavanoid linkages, which has been
recognized as the most important fragmentation mechanism in proanthocyanidin trimers
(Friedrich et al., 2000). Further fragmentation of m/z 577.2 occurred in a similar manner
as in the previously described procyanidin dimers.
The açai oil extracts used in these trials did not contain anthocyanins and were
therefore compared with non-anthocyanin polyphenolics present in clarified açai juice
by chemically contrasting content and concentrations under identical chromatographic
conditions (Table 5). Similar polyphenolic profiles were observed in the açai oil extracts
and non-anthocyanin polyphenolic extracts of açai juice, yet their concentrations differed
markedly. Due to an enhanced extraction of compounds from water-insoluble residues
from açai pulp processing, individual polyphenolic concentrations were significantly
higher (from 12.6 to 469 times higher) in açai oil than in açai juice.
Dimeric and trimeric procyanidins were predominant in both açai oil extracts
(3,102 ± 127 mg/L) and açai juice (17.2 ± 2.2 mg/L), and accounted for over 40% of the
total polyphenolics present. Similarly, phenolic acids such as vanillic, syringic,
47
protocatechuic, p-hydroxybenzoic, and ferulic acids were predominant in both the oil
extracts (101 to 1,616 mg/L) and açai juice (1.1 to 5.5 mg/L). However, their respective
abundance differed significantly (p<0.05) between products and with the exception of
ferulic acid, phenolic acids were appreciably enhanced in the oil (Table 5). Although
both (+)-catechin and (-)-epicatechin were found in açai juice (1.1 and 5.3 mg/kg,
respectively), only (+)-catechin (66.7 ± 4.8 mg/kg) was present in açai oil extracts. The
similarities between the polyphenolic profiles of açai juice and açai oil extracts suggest
that these polyphenolics have the ability to be extracted from açai by-product sources as
free or bound compounds and deposited to a non-polar lipid phase which serves to
appreciably enhance polyphenolic concentrations in the oil when compared to the fruit
pulp from which they were derived.
The influence of naturally occurring polyphenolics on the phytochemical stability
of extracted açai oil during storage was evaluated by monitoring changes to individual
polyphenolics, total soluble phenolic content, and antioxidant capacity of oils stored at
20, 30, or 40°C for 10 weeks. Initial polyphenolic concentrations in the oil were adjusted
to three concentration levels containing high, intermediate, and low polyphenolic
concentrations by diluting original oil extracts with oil whose polyphenolics were
removed by aqueous extraction. The açai oil containing the lowest polyphenolic
concentration contained <5% of the original oil’s concentration, whereas the
intermediate oil was 50% of the original (Table 6).
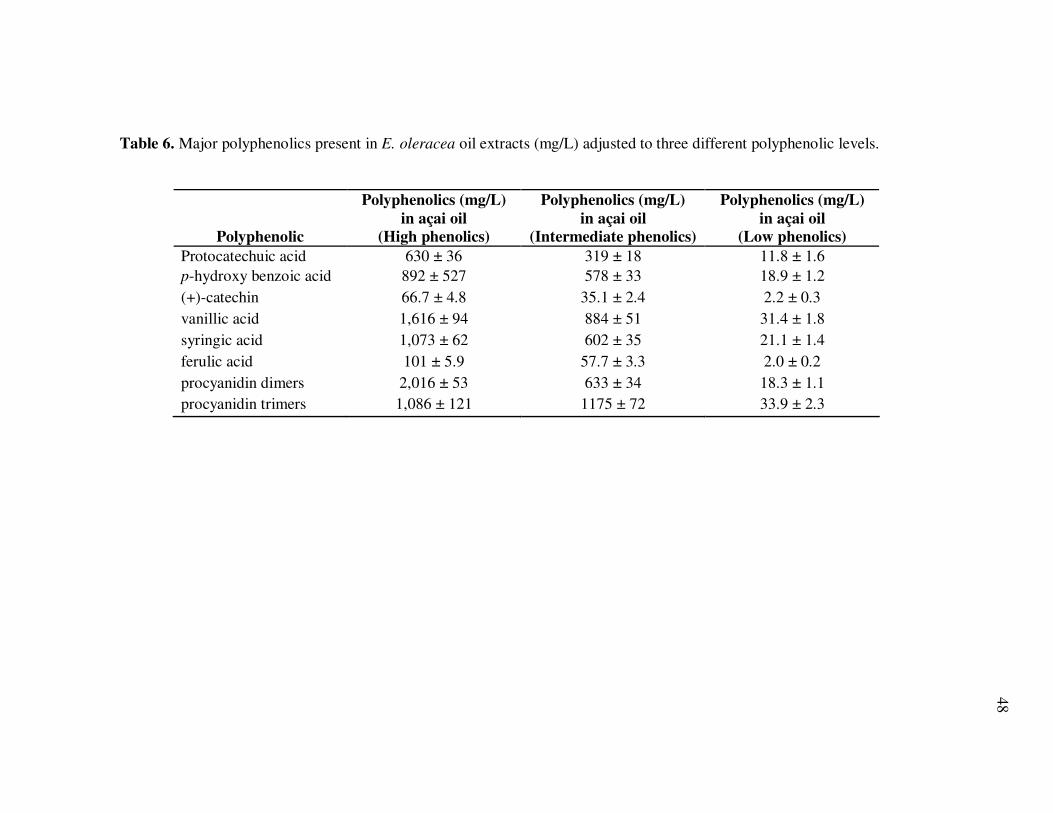
48
Table 6. Major polyphenolics present in E. oleracea oil extracts (mg/L) adjusted to three different polyphenolic levels.
Polyphenolic
Polyphenolics (mg/L)
in açai oil
(High phenolics)
Polyphenolics (mg/L)
in açai oil
(Intermediate phenolics)
Polyphenolics (mg/L)
in açai oil
(Low phenolics)
Protocatechuic acid 630 ± 36 319 ± 18 11.8 ± 1.6 p-hydroxy benzoic acid 892 ± 527 578 ± 33 18.9 ± 1.2 (+)-catechin 66.7 ± 4.8 35.1 ± 2.4 2.2 ± 0.3 vanillic acid 1,616 ± 94 884 ± 51 31.4 ± 1.8 syringic acid 1,073 ± 62 602 ± 35 21.1 ± 1.4 ferulic acid 101 ± 5.9 57.7 ± 3.3 2.0 ± 0.2 procyanidin dimers 2,016 ± 53 633 ± 34 18.3 ± 1.1 procyanidin trimers 1,086 ± 121 1175 ± 72 33.9 ± 2.3
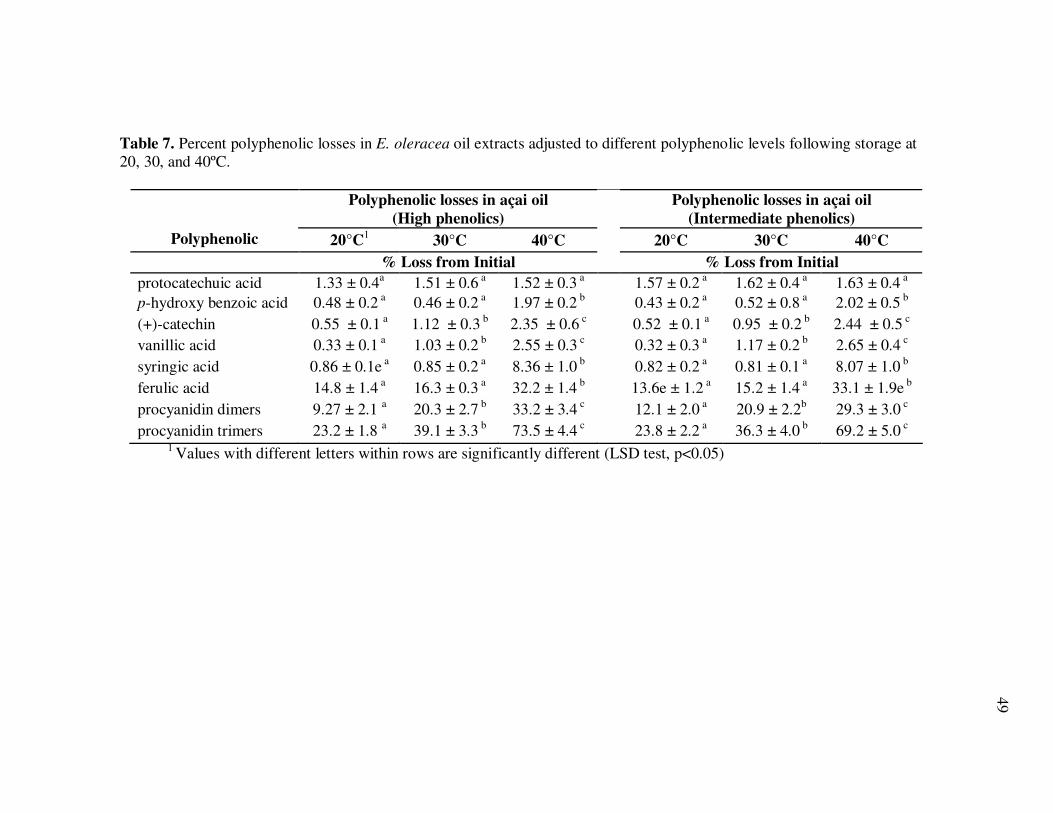
49
Table 7. Percent polyphenolic losses in E. oleracea oil extracts adjusted to different polyphenolic levels following storage at 20, 30, and 40ºC.
Polyphenolic losses in açai oil
(High phenolics)
Polyphenolic losses in açai oil
(Intermediate phenolics)
Polyphenolic 20°C1 30°C 40°C 20°C 30°C 40°C
% Loss from Initial % Loss from Initial
protocatechuic acid 1.33 ± 0.4a 1.51 ± 0.6 a 1.52 ± 0.3 a 1.57 ± 0.2 a 1.62 ± 0.4 a 1.63 ± 0.4 a p-hydroxy benzoic acid 0.48 ± 0.2 a
0.46 ± 0.2 a 1.97 ± 0.2 b
0.43 ± 0.2 a 0.52 ± 0.8 a
2.02 ± 0.5 b
(+)-catechin 0.55 ± 0.1 a 1.12 ± 0.3 b 2.35 ± 0.6 c 0.52 ± 0.1 a 0.95 ± 0.2 b 2.44 ± 0.5 c vanillic acid 0.33 ± 0.1 a 1.03 ± 0.2 b 2.55 ± 0.3 c 0.32 ± 0.3 a 1.17 ± 0.2 b 2.65 ± 0.4 c syringic acid 0.86 ± 0.1e a 0.85 ± 0.2 a 8.36 ± 1.0 b 0.82 ± 0.2 a 0.81 ± 0.1 a 8.07 ± 1.0 b ferulic acid 14.8 ± 1.4 a 16.3 ± 0.3 a 32.2 ± 1.4 b 13.6e ± 1.2 a 15.2 ± 1.4 a 33.1 ± 1.9e b procyanidin dimers 9.27 ± 2.1 a 20.3 ± 2.7 b 33.2 ± 3.4 c 12.1 ± 2.0 a 20.9 ± 2.2b 29.3 ± 3.0 c procyanidin trimers 23.2 ± 1.8 a 39.1 ± 3.3 b 73.5 ± 4.4 c 23.8 ± 2.2 a 36.3 ± 4.0 b 69.2 ± 5.0 c
1 Values with different letters within rows are significantly different (LSD test, p<0.05)
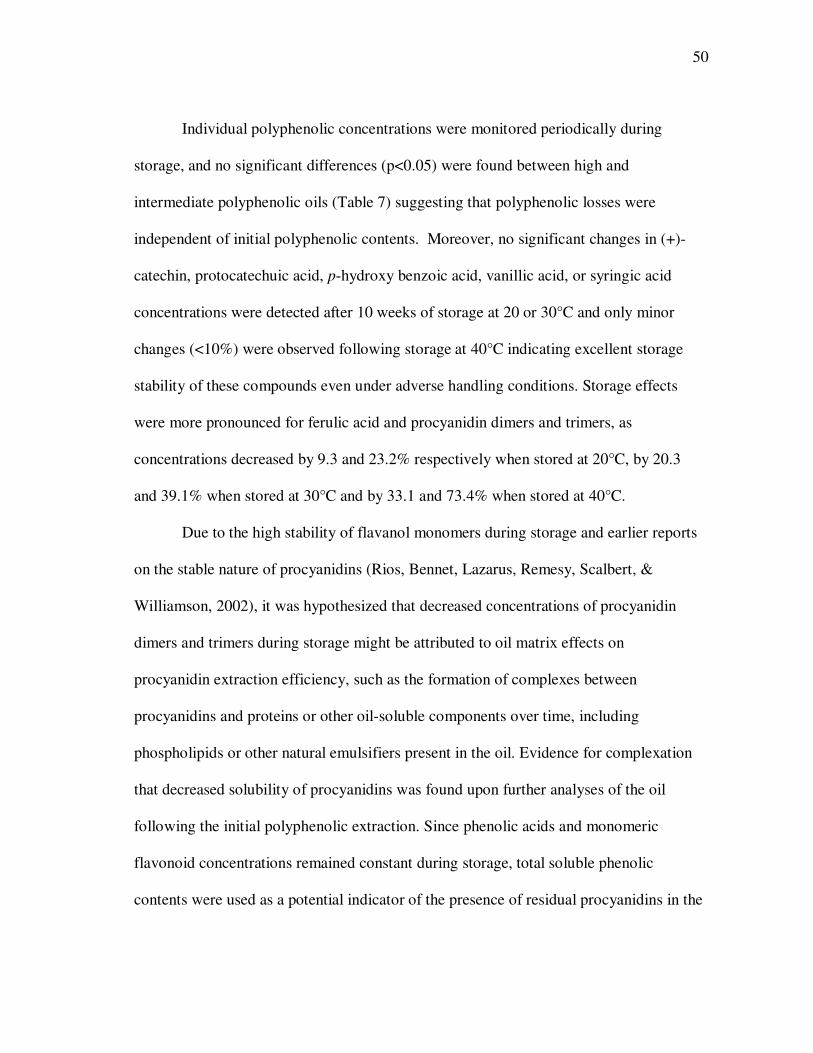
50
Individual polyphenolic concentrations were monitored periodically during
storage, and no significant differences (p<0.05) were found between high and
intermediate polyphenolic oils (Table 7) suggesting that polyphenolic losses were
independent of initial polyphenolic contents. Moreover, no significant changes in (+)-
catechin, protocatechuic acid, p-hydroxy benzoic acid, vanillic acid, or syringic acid
concentrations were detected after 10 weeks of storage at 20 or 30°C and only minor
changes (<10%) were observed following storage at 40°C indicating excellent storage
stability of these compounds even under adverse handling conditions. Storage effects
were more pronounced for ferulic acid and procyanidin dimers and trimers, as
concentrations decreased by 9.3 and 23.2% respectively when stored at 20°C, by 20.3
and 39.1% when stored at 30°C and by 33.1 and 73.4% when stored at 40°C.
Due to the high stability of flavanol monomers during storage and earlier reports
on the stable nature of procyanidins (Rios, Bennet, Lazarus, Remesy, Scalbert, &
Williamson, 2002), it was hypothesized that decreased concentrations of procyanidin
dimers and trimers during storage might be attributed to oil matrix effects on
procyanidin extraction efficiency, such as the formation of complexes between
procyanidins and proteins or other oil-soluble components over time, including
phospholipids or other natural emulsifiers present in the oil. Evidence for complexation
that decreased solubility of procyanidins was found upon further analyses of the oil
following the initial polyphenolic extraction. Since phenolic acids and monomeric
flavonoid concentrations remained constant during storage, total soluble phenolic
contents were used as a potential indicator of the presence of residual procyanidins in the
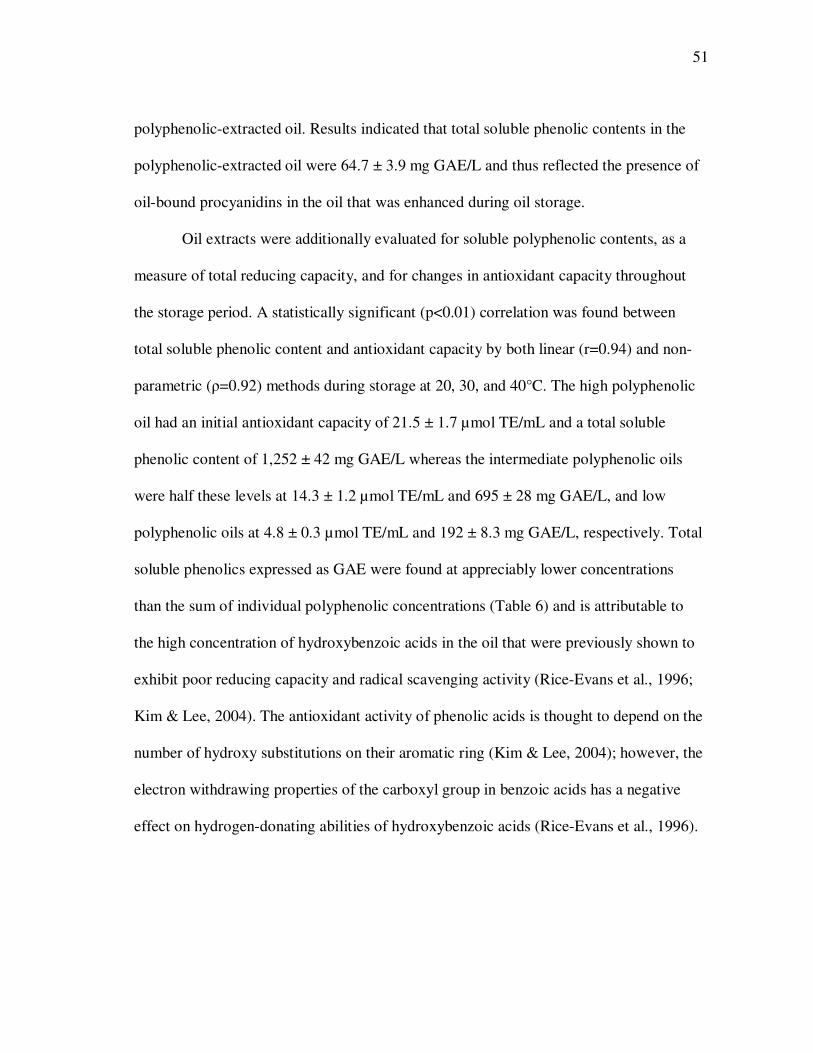
51
polyphenolic-extracted oil. Results indicated that total soluble phenolic contents in the
polyphenolic-extracted oil were 64.7 ± 3.9 mg GAE/L and thus reflected the presence of
oil-bound procyanidins in the oil that was enhanced during oil storage.
Oil extracts were additionally evaluated for soluble polyphenolic contents, as a
measure of total reducing capacity, and for changes in antioxidant capacity throughout
the storage period. A statistically significant (p<0.01) correlation was found between
total soluble phenolic content and antioxidant capacity by both linear (r=0.94) and non-
parametric (ρ=0.92) methods during storage at 20, 30, and 40°C. The high polyphenolic
oil had an initial antioxidant capacity of 21.5 ± 1.7 µmol TE/mL and a total soluble
phenolic content of 1,252 ± 42 mg GAE/L whereas the intermediate polyphenolic oils
were half these levels at 14.3 ± 1.2 µmol TE/mL and 695 ± 28 mg GAE/L, and low
polyphenolic oils at 4.8 ± 0.3 µmol TE/mL and 192 ± 8.3 mg GAE/L, respectively. Total
soluble phenolics expressed as GAE were found at appreciably lower concentrations
than the sum of individual polyphenolic concentrations (Table 6) and is attributable to
the high concentration of hydroxybenzoic acids in the oil that were previously shown to
exhibit poor reducing capacity and radical scavenging activity (Rice-Evans et al., 1996;
Kim & Lee, 2004). The antioxidant activity of phenolic acids is thought to depend on the
number of hydroxy substitutions on their aromatic ring (Kim & Lee, 2004); however, the
electron withdrawing properties of the carboxyl group in benzoic acids has a negative
effect on hydrogen-donating abilities of hydroxybenzoic acids (Rice-Evans et al., 1996).
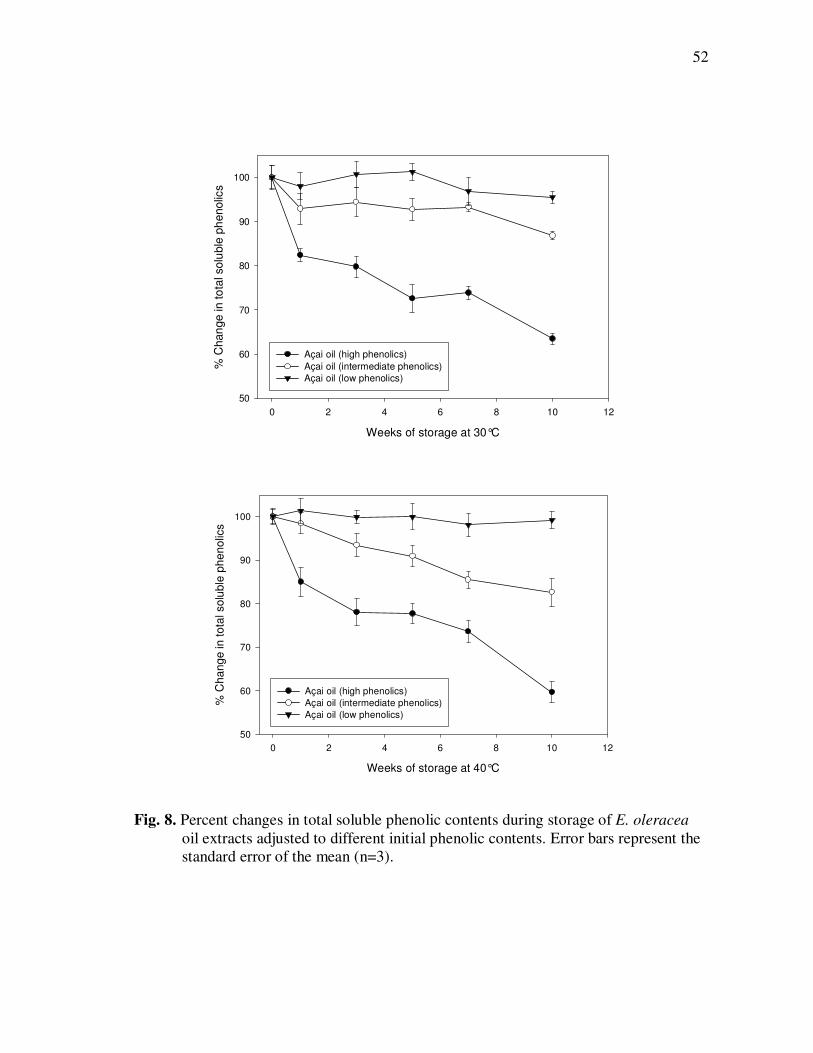
52
Weeks of storage at 30°C
0 2 4 6 8 10 12
% C
han
ge in to
tal solu
ble
ph
enolic
s
50
60
70
80
90
100
Açai oil (high phenolics)
Açai oil (intermediate phenolics)
Açai oil (low phenolics)
Weeks of storage at 40°C
0 2 4 6 8 10 12
% C
ha
ng
e in
to
tal so
lub
le p
he
no
lics
50
60
70
80
90
100
Açai oil (high phenolics)
Açai oil (intermediate phenolics)
Açai oil (low phenolics)
Fig. 8. Percent changes in total soluble phenolic contents during storage of E. oleracea
oil extracts adjusted to different initial phenolic contents. Error bars represent the standard error of the mean (n=3).
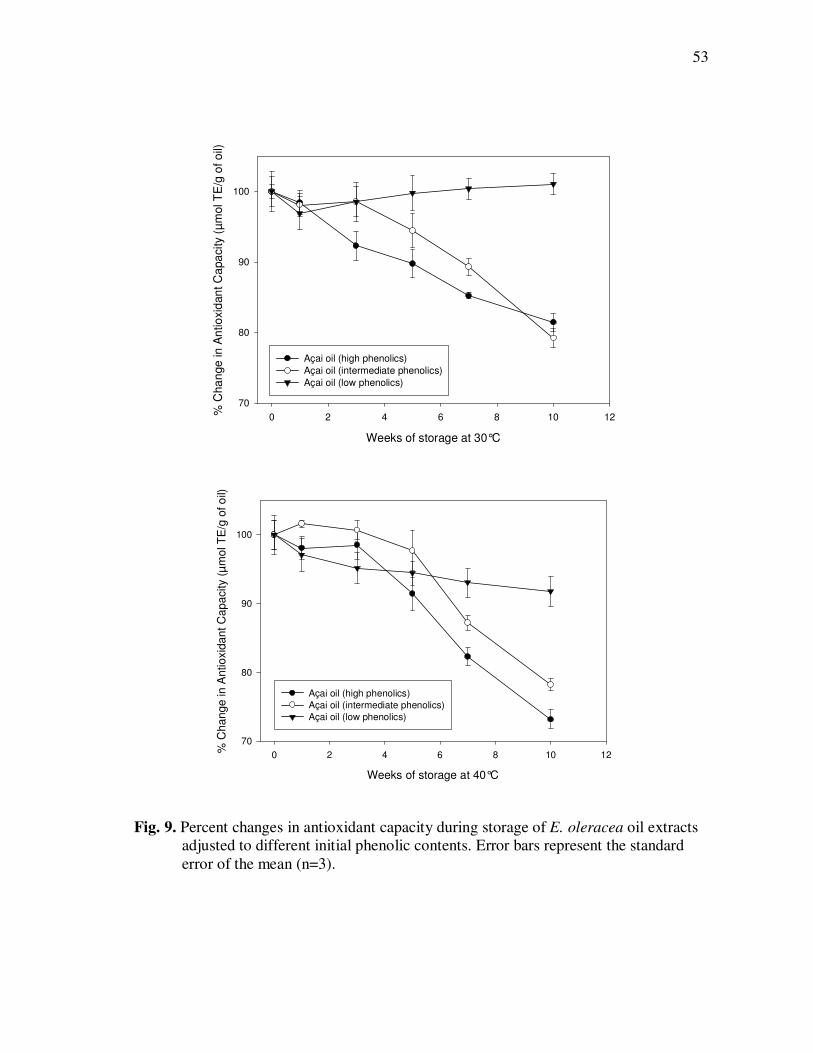
53
Weeks of storage at 30°C
0 2 4 6 8 10 12
% C
ha
nge
in
An
tio
xid
an
t C
apa
city (
µm
ol T
E/g
of o
il)
70
80
90
100
Açai oil (high phenolics)
Açai oil (intermediate phenolics)
Açai oil (low phenolics)
Weeks of storage at 40°C
0 2 4 6 8 10 12
% C
hange in A
ntioxid
ant
Capacity (
µm
ol T
E/g
of o
il)
70
80
90
100
Açai oil (high phenolics)
Açai oil (intermediate phenolics)
Açai oil (low phenolics)
Fig. 9. Percent changes in antioxidant capacity during storage of E. oleracea oil extracts adjusted to different initial phenolic contents. Error bars represent the standard error of the mean (n=3).
54
During storage, total soluble phenolic content of the high polyphenolic oil
decreased by 36.1 to 40.3% when stored at 20, 30, or 40°C (Fig. 8) corresponding to a
18.6 to 26.8% decrease in antioxidant capacity (Fig. 9). Both the intermediate and low
polyphenolic oils experienced significantly (p<0.05) smaller losses for these attributes
during storage ranging from minor losses (<10%) in the low polyphenolic oil at all
storage temperatures and as high as 21.8% in the intermediate polyphenolic oil at 40°C.
Linear regression analyses of antioxidant capacity and total soluble phenolic contents
during storage further confirmed a significant (p<0.01) influence of oil polyphenolic
concentration on retention of both total soluble phenolics and antioxidant capacity
during storage, but no significant effect was attributed to storage temperature. Such
differences might be attributed, at least partially, to previously observed differences in
procyanidin concentrations (Table 6), which were more pronounced in high and
intermediate polyphenolic oils.
The oxidative stability of açai oil extracts adjusted to three different polyphenolic
concentrations was further assessed by monitoring changes in free fatty acid (% oleic
acid) and peroxide values (meq/kg) following storage. Free fatty acid (<0.1%) and
peroxide value (<10 meq/kg) were at threshold levels of detection prior to and after
storage of the oils, indicating that lipids in the oil did not experience noticeable oxidative
changes after 10 weeks of storage at 20, 30, or 40°C.
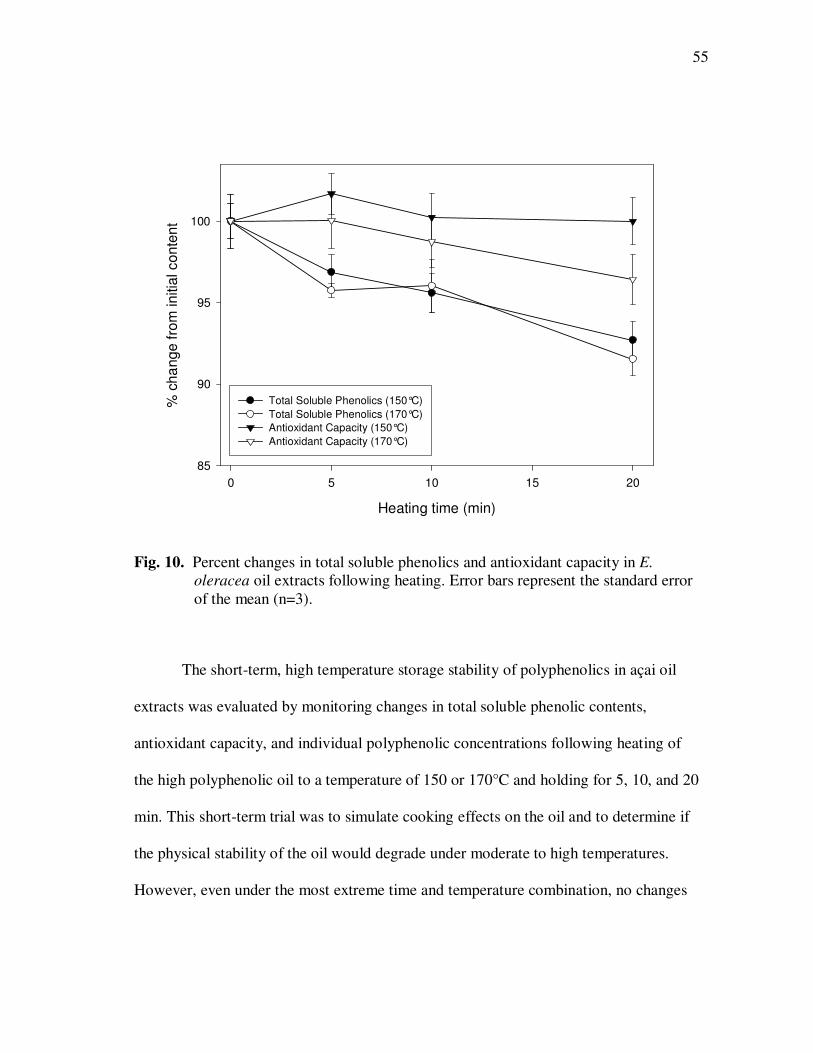
55
Heating time (min)
0 5 10 15 20
% c
ha
nge fro
m initia
l conte
nt
85
90
95
100
Total Soluble Phenolics (150°C)
Total Soluble Phenolics (170°C)
Antioxidant Capacity (150°C)
Antioxidant Capacity (170°C)
Fig. 10. Percent changes in total soluble phenolics and antioxidant capacity in E.
oleracea oil extracts following heating. Error bars represent the standard error of the mean (n=3).
The short-term, high temperature storage stability of polyphenolics in açai oil
extracts was evaluated by monitoring changes in total soluble phenolic contents,
antioxidant capacity, and individual polyphenolic concentrations following heating of
the high polyphenolic oil to a temperature of 150 or 170°C and holding for 5, 10, and 20
min. This short-term trial was to simulate cooking effects on the oil and to determine if
the physical stability of the oil would degrade under moderate to high temperatures.
However, even under the most extreme time and temperature combination, no changes
56
in the physical nature of the oil were observed such as smoke or color degradation and
no significant (p<0.05) changes to individual polyphenolic concentrations were detected
during this evaluation. Minor changes in overall antioxidant capacity (<5%) and soluble
phenolic contents (<10%) were observed under these same conditions (Fig. 10) with
slightly greater losses observed at 170°C compared to 150°C. Therefore, the extracted
açai oil demonstrated excellent thermal stability for the polyphenolics present, and
indicated its potential for culinary applications involving moderate exposure times to
high temperatures.
Conclusion
The phytochemical composition of açai oil extracts from water-insoluble residues
of açai pulp processing were characterized and found to be appreciably enhanced in non-
anthocyanin polyphenolics such as phenolic acids and procyanidins. Individual
polyphenolic contents were not significantly altered by long-term storage at temperature
up to 40°C for 10 weeks nor by short-term heating at temperatures up to 170°C for 20
min indicating good stability of these compounds and their antioxidant properties. Due
to its high polyphenolic content, storage stability, and unique sensory characteristics,
açai oil is a promising new alternative to traditional oils for food, supplement, and
cosmetic applications.
57
CHAPTER V
IN-VITRO ABSORPTION AND BIOLOGICAL ACTIVITY OF
PHYTOCHEMICAL RICH EXTRACTS FROM AÇAI
Introduction
Intake of naturally occurring polyphenolics in fruits and vegetables has been
associated with a reduced risk of developing various types of cancer in several
epidemiological studies (Hertog, Bueno-de-Mesquita, & Fehily, 1996; Dragsted, Strube,
& Leth, 1997; Abedamowo et al., 2004). In addition to their antioxidant properties and
ability to protect vital cellular components from oxidative stress, polyphenolics have
also been shown to inhibit cell proliferation, induce apoptosis, alter cell cycle kinetics,
and interfere with intracellular signal transduction in several in-vitro cancer cell models
(Robards, Prenzler, Tucker, Swatsitang, & Glover, 1999; Elattar & Viriji, 1999; Birviba,
Pan, & Rechkemmer, 2002; Mertens-Talcott, Lee, & Talcott, 2006). Information on the
inhibitory effects of individual polyphenolic compounds on carcinogenesis is abundant;
however, it has been suggested that isolated compounds may not behave on the same
manner as when present in whole foods (Liu, 2003). Thus, studies considering the
unique combination of phytochemicals in specific commodities may provide information
that more properly reflects the potential health benefits associated with their
consumption.
Açai (Euterpe oleracea Mart.), a palm fruit native to the Amazon estuary, has
received much attention in recent years, due to potential health benefits associated with
58
its high antioxidant capacity and phytochemical composition (Lichtenthaler et al., 2005;
Rodrigues et al., 2006; Schauss et al., 2006, Pacheco-Palencia et al., 2007a). However,
reports on its biological properties are limited (Del Pozo-Insfran et al., 2006) and its
anticarcinogenic activity has yet to be investigated in more detail. The present study was
conducted to evaluate the antiproliferative activities of phytochemical rich extracts from
açai fruit in HT-29 human colon adenocarcinoma cells. Non-anthocyanin polyphenolic
fractions from açai juice were contrasted against polyphenolic extracts from a
phytochemical enriched açai oil, characterized previously in chapter IV, and found to
contain concentrated amounts of phenolic acids and flavonoids naturally present in açai
fruit. Moreover, potential relations between the magnitude of the observed antioxidant
and antiproliferative activities and the polyphenolic composition of the extracts were
determined.
Results from this study will provide additional evidence on the biological activity
of açai polyphenolics in-vitro and offer new information on their bioavailability. In
addition, a key factor to relate in-vitro study results to outcomes in-vivo is information
regarding bioavailability. In the present study, polyphenolic absorption from açai
extracts was evaluated using Caco-2 human intestinal cell monolayer models. Although
some studies have been conducted to evaluate the bioavailability of certain
polyphenolics in-vitro (Kobayashi et al., 2000; Konishi et al., 2003), information on the
absorption of polyphenolics, particularly mixtures, is still very limited. As a result,
polyphenolic absorption from açai extracts was additionally evaluated using Caco-2 cell
monolayer models as an in-vitro model for intestinal absorption. Similarly to
59
proliferation studies, non-anthocyanin polyphenolic extracts from açai juice were
contrasted against homologous extracts from a phytochemical enriched açai oil. Results
from this study were aimed to asses the bioactive properties of açai polyphenolics and
offer initial information on their bioavailability.
Materials and Methods
Frozen, pasteurized, açai pulp was kindly donated by Bossa Nova Beverage
Group (Los Angeles, CA) and shipped overnight to the Department of Nutrition and
Food Science at Texas A&M University. Prior to polyphenolic isolation, açai pulp was
clarified according to a previously described procedure (Pacheco-Palencia et al., 2007b).
Phenolic acids and non-anthocyanin flavonoids were isolated from açai juice by repeated
liquid/liquid extraction with ethyl acetate (1:1 ratio). The upper ethyl acetate fraction
was recovered, passed through a 5 cm bed of sodium sulfate to remove residual water,
evaporated under vacuum (<40°C), and redissolved in dimethyl sulfoxide (DMSO). Açai
oil was extracted using a patent-pending process (Talcott et al., 2007) from a water-
insoluble juice processing by-product obtained from the Bossa Nova Beverage Group.
Polyphenolics present in the resultant oil were extracted (3 times) by the addition of a
methanol and water (80:20 v/v mixture) and centrifuged at 5,000g for 15 min. The
methanolic extracts were then recovered, pooled and concentrated under vacuum at
<40°C until complete solvent removal. The crude extract was reconstituted in DMSO
and used for further analyses.
60
Polyphenolic isolates were standardized to a total soluble phenolic content of
1200 mg gallic acid equivalents/L, corresponding to the total soluble phenolic content of
single-strength polyphenolic-enriched açai oil, and equivalent to a 300-fold concentrated
açai juice. Total soluble phenolics were analyzed by the Folin-Ciocalteau assay,
according to the procedure by Singleton & Rossi (1965) and quantified against a gallic
acid standard curve. All polyphenolic isolates were sterile-filtered prior use in cell
culture experiments and normalized to a final concentration of 0.1% DMSO when
applied to the cells. A control with 0.1% DMSO was included in all assays.
Polyphenolic isolates were analyzed by reversed phase HPLC with a Waters
2695 Alliance system (Waters Corp., Milford, MA), according to previously described
chromatographic conditions, detailed in chapter IV. Identification and quantitation of
polyphenolics was based on their spectral characteristics and retention time, as compared
to authentic standards (Sigma Chemical Co., St. Louis, MO). Compound identities were
further confirmed by mass spectrometric analyses, performed on a Thermo Finnigan
LCQ Deca XP Max MSn ion trap mass spectrometer equipped with an ESI ion source
(Thermo Fisher, San Jose, CA). Separations were conducted using the Phenomenex
(Torrace, CA) Synergi 4µHydro-RP 80A (2 x 150 mm; 4 µm; S/N = 106273-106275)
with a C18 guard column. Mobile phases consisted of 0.5% formic acid in water (phase
A) and 0.5% formic acid in 50:50 methanol and acetonitrile (phase B) run at 0.3
mL/min. Polyphenolics were separated with a gradient elution program in which phase B
changed from 5 to 30% in 5 min, from 30 to 65% in 70 min, and from 65 to 95% in 30
min and was held isocratic for 20 min. Ionization was conducted in the negative ion
61
mode under the following conditions: sheath gas (N2), 60 units/min; auxiliary gas (N2), 5
units/min; spray voltage, 3.5 kV; capillary temperature, 250 °C; capillary voltage, 1.5 V;
tube lens offset, 0 V. Total soluble phenolic contents were determined using the Folin-
Ciocalteu assay (described in chapter IV) and quantified in gallic acid equivalents
(GAE), used to normalize total phenolic concentrations between açai juice and açai oil
extracts. Antioxidant capacity was determined by the oxygen radical absorbance
capacity assay using a BGM Labtech FLUOstar fluorescent microplate reader (485 nm
excitation and 538 nm emission), as described in chapter IV. Results were quantified in
µmol Trolox equivalents (TE) per milliliter of extract.
Cell proliferation studies were conducted in HT-29 human colon adenocarcinoma
cells obtained from ATCC (Manassas, VA), and cultured in Dulbecco’s modified
Eagle’s medium (1X) (DMEM) containing 5% fetal bovine serum, 1% non-essential
amino acids, 100 units/mL penicillin G, 100 µg/mL streptomycin, 1.25 µg/mL
amphotericin B, and 10 mM sodium pyruvate (Gibco BRL Life Technology, Grand
Island, NY). Cells were incubated at 37 °C under 5% CO2, and utilized between
passages 10-20. Uniform amounts (5x10⁴ cells/well) of cells were inoculated into each
well of a 12-well tissue culture plate. After a 24 hr incubation the growth medium was
replaced with 1000 µL of media containing different concentrations of polyphenolic
extracts (from 0.04 to 12 µg gallic acid equivalents/mL). Following incubation for 48 hr,
cell numbers were determined using a Beckham Coulter Particle Counter (Fullerton,
CA). Cell numbers were expressed as a percentage of the DMSO control (0.1% DMSO).
The extract concentration where cell proliferation was inhibited by 50% (IC50) was
62
calculated by linear regression analyses on cell inhibition percentages as a ratio to the
DMSO control.
Generation of reactive oxygen species (ROS) was determined by the
dichlorofluorescein (DCF) assay, performed according to the procedures described by
Mertens-Talcott, Bomser, Romero, Talcott, & Percival, 2005. Briefly, cells (5x10⁴/mL)
were passed into 96-well plates and incubated for 24 h. Cells were then washed twice
with PBS and preloaded with dichlorofluorescein diacetate (DCFH-DA) substrate by
incubating with 10 µmol DCFH-DA for 30 min at 37°C. Cells were subsequently
washed and incubated with polyphenolic extracts, adjusted to concentrations ranging
from 0.04 to 12 µg gallic acid equivalents/mL. Fluorescence was determined after 30
min incubation with polyphenolics using a BGM Labtech FLUOstar fluorescent
microplate reader (485 nm excitation and 538 nm emission).
In-vitro intestinal absorption was assessed using Caco-2 cell monolayer models.
Caco-2 colon carcinoma cells obtained from American Type Culture Collection (ATCC,
Manassas, VA), and cultured in Dulbecco’s modified Eagle’s medium (1X) high glucose
(DMEM) containing 10% fetal bovine serum, 1% non-essential amino acids, 100
units/mL penicillin G, 100 µg/mL streptomycin, 1.25 µg/mL amphotericin B, and 10
mM sodium pyruvate. Cells were incubated at 37 °C and 5% CO2 (chemicals were
obtained from Gibco BRL Life Technology, Grand Island, NY).
Cells between passages 10-20 were seeded in 12-mm transparent polyester cell
culture insert well plates (Transwell, Corning Costar Corp., Cambridge, MA) at 1.0 x
105 cells per insert with 0.5 mL of medium in the apical side and 1.5 mL of medium in
63
the basolateral side. Cells were allowed to grow and differentiate to confluent
monolayers for 21 days, as previously described (Hidalgo, Raub, & Borchardt, 1989).
Transepithelial electrical resistance (TEER) values were monitored with an EndOhm
Volt ohmmeter equipped with a STX-2 electrode (World Precision Instruments Inc.,
Sarasota, FL) and monolayers with TEER values >350 Ω cm2 after correction for the
resistance in control wells were used for transport experiments. TEER values were also
obtained at the conclusion of transport experiments to insure integrity of the monolayer.
For transport studies, media pH was adjusted to 6.0 on the apical side and 7.4 on
the basolateral side using Hank’s balanced salt solution (HBSS, Fischer Scientific,
Pittsburgh, PA) containing 10 mM 2-(N-morpholino)ethanesulfonic acid solution
(MES), and HBSS containing N-[2-hydroxyethyl]piperazine-N’-[2-ethanesulfonic acid]
buffer solution (1 M) (HEPES) to create a pH gradient similar to the absorption sites in
the small intestine environment (chemicals obtained from Gibco BRL Life Technology,
Grand Island, NY). Polyphenolic extract solutions were diluted in HBSS (from 2.4 to 36
µg gallic acid equivalents/mL) and loaded into the apical side of the cells.
Transepithelial transport was followed over time and sample aliquots (200 µL) were
taken at 30, 60, and 120 min.
Data from in-vitro experiments were statistically analyzed by one-way analysis
of variance (ANOVA) using SPSS version 15.0 (SPSS Inc., Chicago, IL). Mean
separations were conducted using post-hoc Tukey-Kramer HSD (p<0.05) pairwise
comparisons. Correlation and linear regression analyses were conducted using a
significance level of 0.05.
64
Results and Discussion
Characterization of polyphenolics present in açai juice and in the phytochemical
enriched açai oil used in this study is detailed previously in chapters III and IV.
Biological activities of phytochemical-rich extracts from açai oil and non-anthocyanin
polyphenolic extracts from clarified açai juice were compared, and their respective
chemical compositions were contrasted under identical chromatographic conditions.
Similar to their respective original matrices, both extracts contained several phenolic
acids, flavonoids, and procyanidins. Phenolic acids such as protocatechuic (m/z =
153.2), p-hydroxybenzoic (m/z = 137.3), vanillic (m/z = 167.3), syringic (m/z= 196.9),
and ferulic (m/z = 193.2) acids, and the monomeric flavonols (+)-catechin (m/z = 289.2)
and (-)-epicatechin (m/z = 289.2) were identified based on spectral and mass
spectrometric characteristics as compared to authentic standards.
In addition, various procyanidin dimers and trimers were identified based on
their distinctive fragmentation patterns and spectral similarities to (+)-catechin and (-)-
epicatechin. Procyanidin dimers were characterized by signals at m/z 577.1, and major
fragmentations to the m/z 425.0, typical of the Retro-Diels-Alder product of ring C, and
m/z 289.2, likely corresponding to a monomeric (+)-catechin or (-)-epicatechin unit
resulting from cleavage of the interflavanoid bond, as described in chapter IV.
Fragmentations were characteristic of B-type procyanidins, composed exclusively by
(+)-catechin and (-)-epicatechin units, although no differentiation between these isomers
was possible by mass spectrometric means.
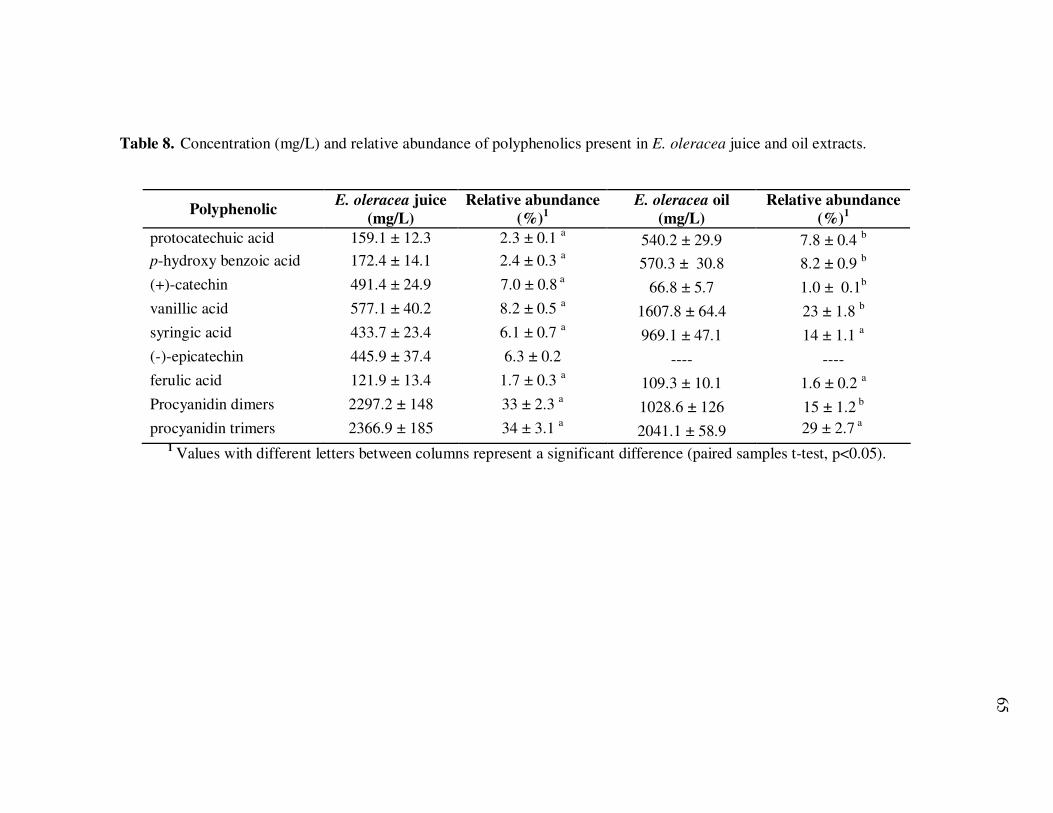
65
Table 8. Concentration (mg/L) and relative abundance of polyphenolics present in E. oleracea juice and oil extracts.
Polyphenolic E. oleracea juice
(mg/L)
Relative abundance
(%)1
E. oleracea oil
(mg/L)
Relative abundance
(%)1
protocatechuic acid 159.1 ± 12.3 2.3 ± 0.1 a 540.2 ± 29.9 7.8 ± 0.4 b p-hydroxy benzoic acid 172.4 ± 14.1 2.4 ± 0.3 a 570.3 ± 30.8 8.2 ± 0.9 b (+)-catechin 491.4 ± 24.9 7.0 ± 0.8 a 66.8 ± 5.7 1.0 ± 0.1b vanillic acid 577.1 ± 40.2 8.2 ± 0.5 a 1607.8 ± 64.4 23 ± 1.8 b syringic acid 433.7 ± 23.4 6.1 ± 0.7 a 969.1 ± 47.1 14 ± 1.1 a (-)-epicatechin 445.9 ± 37.4 6.3 ± 0.2 ---- ---- ferulic acid 121.9 ± 13.4 1.7 ± 0.3 a 109.3 ± 10.1 1.6 ± 0.2 a Procyanidin dimers 2297.2 ± 148 33 ± 2.3 a 1028.6 ± 126 15 ± 1.2 b procyanidin trimers 2366.9 ± 185 34 ± 3.1 a 2041.1 ± 58.9 29 ± 2.7 a
1 Values with different letters between columns represent a significant difference (paired samples t-test, p<0.05).
66
Procyanidin trimers (m/z = 865.1) were additionally characterized by a
predominant product ion at m/z 577.2, likely corresponding to a dimeric fragment ion
from cleavage of interflavanoid linkages, and further fragmentation to ions m/z 425.0,
and m/z 289.2, as previously discussed (chapter IV). Individual polyphenolic
concentrations in açai juice and oil extracts are presented in Table 8.
Similar polyphenolic profiles were observed in the açai oil extracts and non-
anthocyanin polyphenolic extracts of açai juice (Fig. 11); however, their absolute and
relative ratios differed markedly. Individual phenolic acid concentrations were generally
higher (by up to 3.4 fold) in açai oil extracts (540 to 1607 mg/L) than in juice extracts
(159 to 577 mg/L), with the exception of ferulic acid (109 and 122 mg/L respectively).
In contrast, flavanols such as (+)-catechin and (-)-epicatechin were abundantly present in
juice extracts (492 and 446 mg/L respectively), yet no (-)-epicatechin and only limited
(+)-catechin concentrations (67 mg/L) was detected in extracts from açai oil. Similarly,
procyanidin dimer concentrations in açai juice extracts (2,297 mg (+)-catechin
equivalents/L) doubled those present in oil extracts (1,029 mg (+)-catechin
equivalents/L), yet equivalent concentrations of procyanidin trimers were present in both
extracts (2,041-2,367 mg (+)-catechin equivalents/L).
Differences in composition among extracts were attributed not only to variations
in polyphenolic extraction protocols, due to the different nature of the matrices (aqueous
and oil), but also to initial differences in composition between extracts.
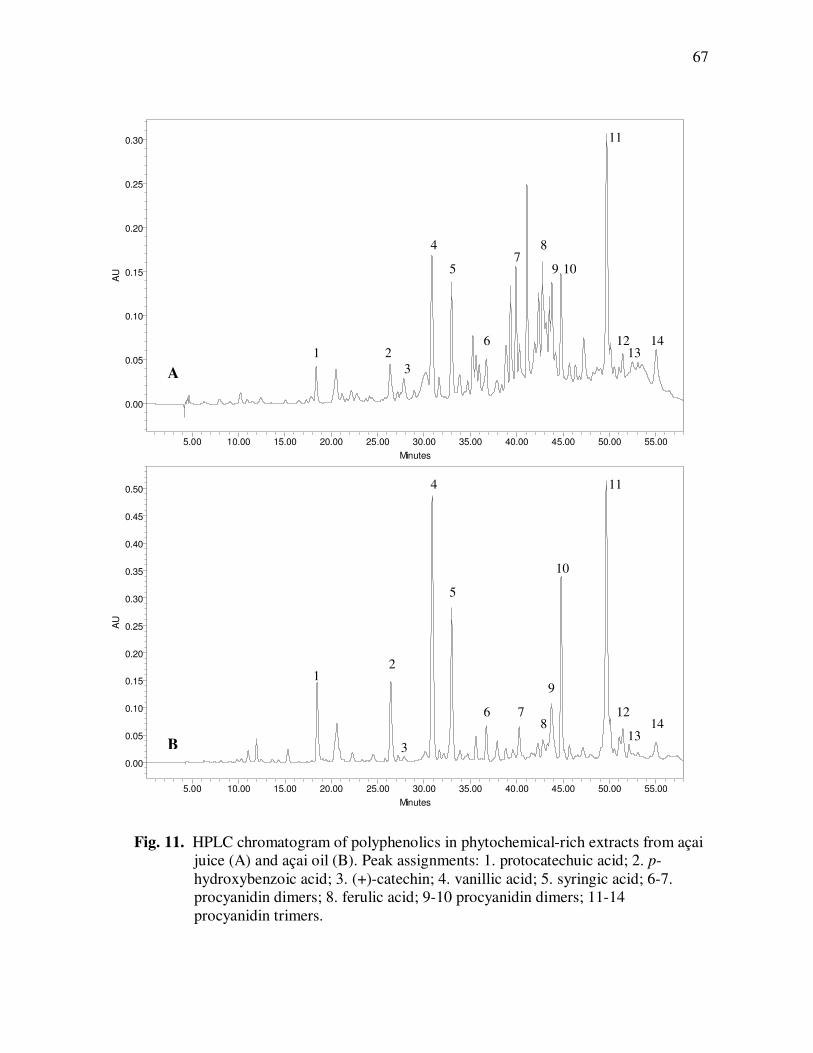
67
Fig. 11. HPLC chromatogram of polyphenolics in phytochemical-rich extracts from açai juice (A) and açai oil (B). Peak assignments: 1. protocatechuic acid; 2. p-hydroxybenzoic acid; 3. (+)-catechin; 4. vanillic acid; 5. syringic acid; 6-7. procyanidin dimers; 8. ferulic acid; 9-10 procyanidin dimers; 11-14 procyanidin trimers.
AU
0.00
0.05
0.10
0.15
0.20
0.25
0.30
0.35
0.40
0.45
0.50
Minutes
5.00 10.00 15.00 20.00 25.00 30.00 35.00 40.00 45.00 50.00 55.00
AU
0.00
0.05
0.10
0.15
0.20
0.25
0.30
Minutes
5.00 10.00 15.00 20.00 25.00 30.00 35.00 40.00 45.00 50.00 55.00
A
B
1 2 3
4
5
6
7 8
9 10
11
12
1 2
3
4
5
6 7 8
9
10
11
12 14
13
13 14
68
As previously shown in chapter IV, individual polyphenolics were significantly
higher in açai oil than in açai juice by a factor ranging from 12.6 to 469.4 fold, owing to
the selective, enhanced extraction of compounds from water-insoluble residues of açai
pulp. Due to these initial differences in total polyphenolic concentrations between açai
juice and the phytochemical enriched oil, both phytochemical extracts were normalized
to an equivalent concentration of total soluble phenolics (1200 mg gallic acid
equivalents/L) for their subsequent use in cell culture experiments. Such polyphenolic
concentration was comparable to that originally present in the oil (single strength) and
was also equivalent to 300 times the total soluble phenolic content of açai juice,
following anthocyanin extraction. Thus, non-anthocyanin polyphenolic contents were
originally 300-fold higher in the phytochemical enriched açai oil than in açai juice,
which must be considered when making inferences from in-vitro biological activity
outcomes. Resultant antioxidant capacity of both polyphenolic extracts following the
normalization was 17.2 ± 0.16 µmol TE/mL for the açai juice extract and 15.3 ± 0.11
µmol TE/mL for the açai oil extract.
The antiproliferative activities of açai juice and oil extracts were evaluated in a
cell culture model using HT-29 colon carcinoma cells. Total cell numbers were
indicative of the proliferative activity of HT-29 cells and the corresponding cytotoxic
effects of each extract. Both polyphenolic extracts caused significant (p<0.01) decreases
in total cell numbers in a concentration-dependent manner (Fig. 12). However,
polyphenolic extracts from açai oil were more than twice as effective in reducing total
cell numbers across all dilutions, with an IC50 of 4.5 µg GAE/mL compared to 10.2 µg
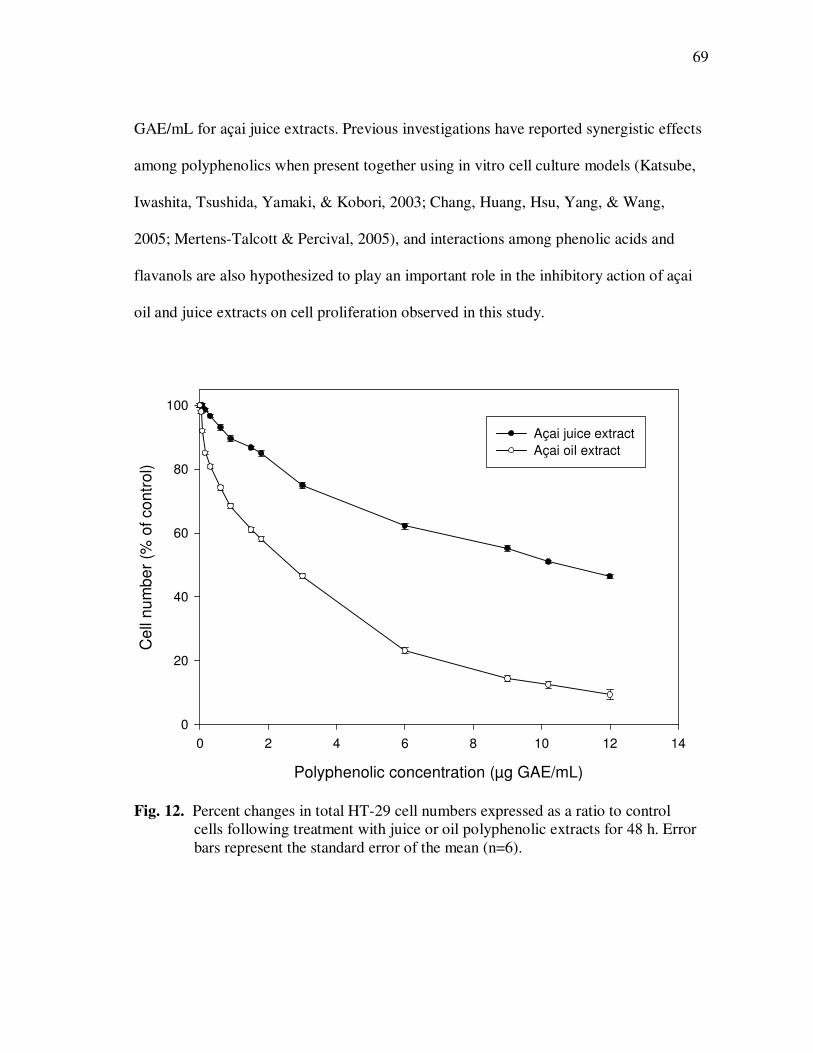
69
GAE/mL for açai juice extracts. Previous investigations have reported synergistic effects
among polyphenolics when present together using in vitro cell culture models (Katsube,
Iwashita, Tsushida, Yamaki, & Kobori, 2003; Chang, Huang, Hsu, Yang, & Wang,
2005; Mertens-Talcott & Percival, 2005), and interactions among phenolic acids and
flavanols are also hypothesized to play an important role in the inhibitory action of açai
oil and juice extracts on cell proliferation observed in this study.
Polyphenolic concentration (µg GAE/mL)
0 2 4 6 8 10 12 14
Ce
ll n
um
be
r (%
of co
ntr
ol)
0
20
40
60
80
100
Açai juice extract
Açai oil extract
Fig. 12. Percent changes in total HT-29 cell numbers expressed as a ratio to control
cells following treatment with juice or oil polyphenolic extracts for 48 h. Error bars represent the standard error of the mean (n=6).
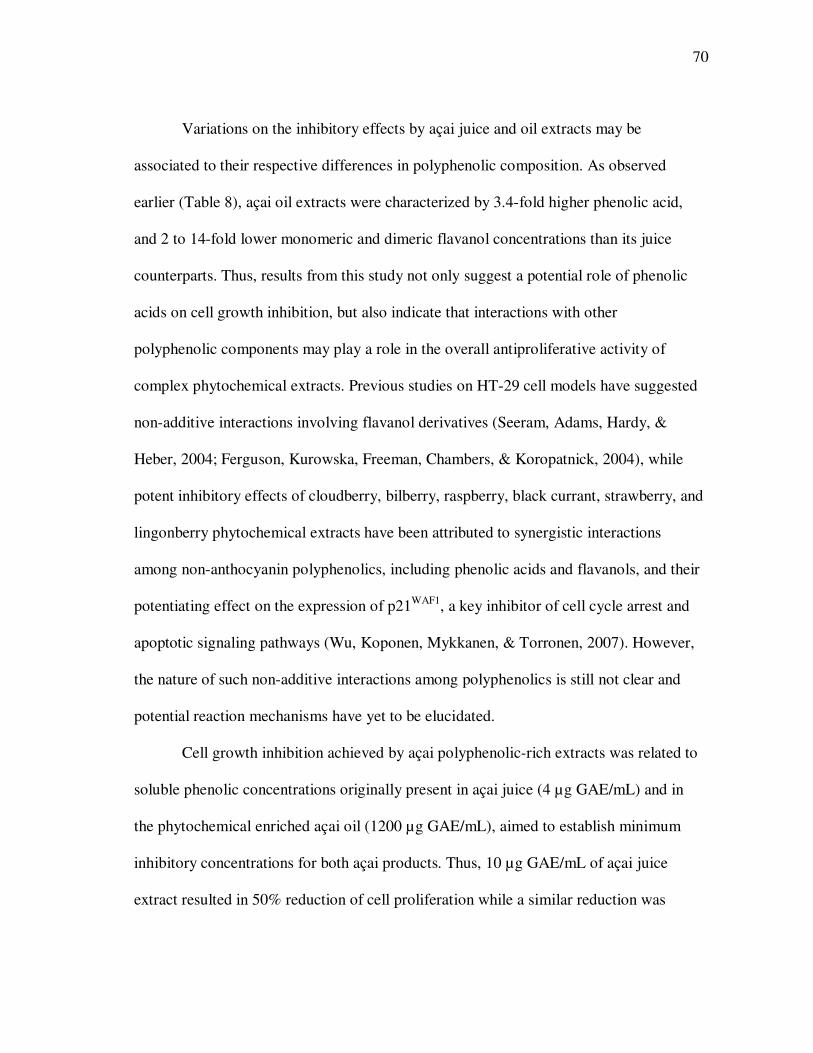
70
Variations on the inhibitory effects by açai juice and oil extracts may be
associated to their respective differences in polyphenolic composition. As observed
earlier (Table 8), açai oil extracts were characterized by 3.4-fold higher phenolic acid,
and 2 to 14-fold lower monomeric and dimeric flavanol concentrations than its juice
counterparts. Thus, results from this study not only suggest a potential role of phenolic
acids on cell growth inhibition, but also indicate that interactions with other
polyphenolic components may play a role in the overall antiproliferative activity of
complex phytochemical extracts. Previous studies on HT-29 cell models have suggested
non-additive interactions involving flavanol derivatives (Seeram, Adams, Hardy, &
Heber, 2004; Ferguson, Kurowska, Freeman, Chambers, & Koropatnick, 2004), while
potent inhibitory effects of cloudberry, bilberry, raspberry, black currant, strawberry, and
lingonberry phytochemical extracts have been attributed to synergistic interactions
among non-anthocyanin polyphenolics, including phenolic acids and flavanols, and their
potentiating effect on the expression of p21WAF1, a key inhibitor of cell cycle arrest and
apoptotic signaling pathways (Wu, Koponen, Mykkanen, & Torronen, 2007). However,
the nature of such non-additive interactions among polyphenolics is still not clear and
potential reaction mechanisms have yet to be elucidated.
Cell growth inhibition achieved by açai polyphenolic-rich extracts was related to
soluble phenolic concentrations originally present in açai juice (4 µg GAE/mL) and in
the phytochemical enriched açai oil (1200 µg GAE/mL), aimed to establish minimum
inhibitory concentrations for both açai products. Thus, 10 µg GAE/mL of açai juice
extract resulted in 50% reduction of cell proliferation while a similar reduction was
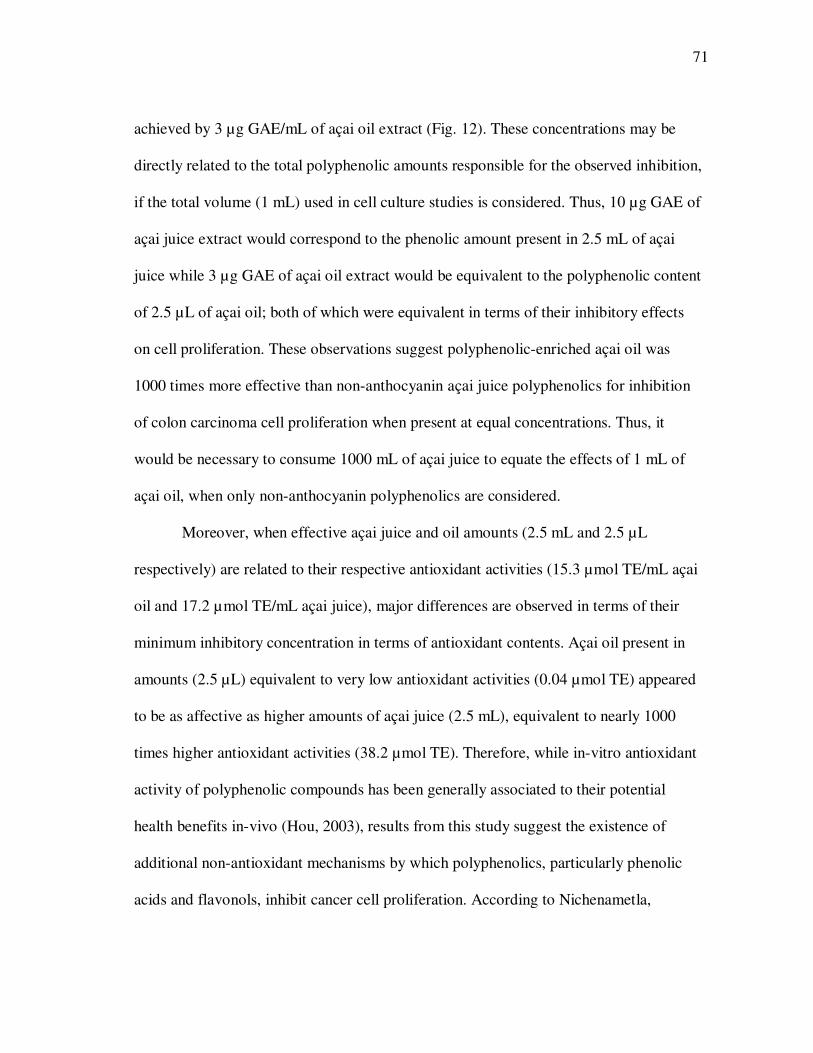
71
achieved by 3 µg GAE/mL of açai oil extract (Fig. 12). These concentrations may be
directly related to the total polyphenolic amounts responsible for the observed inhibition,
if the total volume (1 mL) used in cell culture studies is considered. Thus, 10 µg GAE of
açai juice extract would correspond to the phenolic amount present in 2.5 mL of açai
juice while 3 µg GAE of açai oil extract would be equivalent to the polyphenolic content
of 2.5 µL of açai oil; both of which were equivalent in terms of their inhibitory effects
on cell proliferation. These observations suggest polyphenolic-enriched açai oil was
1000 times more effective than non-anthocyanin açai juice polyphenolics for inhibition
of colon carcinoma cell proliferation when present at equal concentrations. Thus, it
would be necessary to consume 1000 mL of açai juice to equate the effects of 1 mL of
açai oil, when only non-anthocyanin polyphenolics are considered.
Moreover, when effective açai juice and oil amounts (2.5 mL and 2.5 µL
respectively) are related to their respective antioxidant activities (15.3 µmol TE/mL açai
oil and 17.2 µmol TE/mL açai juice), major differences are observed in terms of their
minimum inhibitory concentration in terms of antioxidant contents. Açai oil present in
amounts (2.5 µL) equivalent to very low antioxidant activities (0.04 µmol TE) appeared
to be as affective as higher amounts of açai juice (2.5 mL), equivalent to nearly 1000
times higher antioxidant activities (38.2 µmol TE). Therefore, while in-vitro antioxidant
activity of polyphenolic compounds has been generally associated to their potential
health benefits in-vivo (Hou, 2003), results from this study suggest the existence of
additional non-antioxidant mechanisms by which polyphenolics, particularly phenolic
acids and flavonols, inhibit cancer cell proliferation. According to Nichenametla,
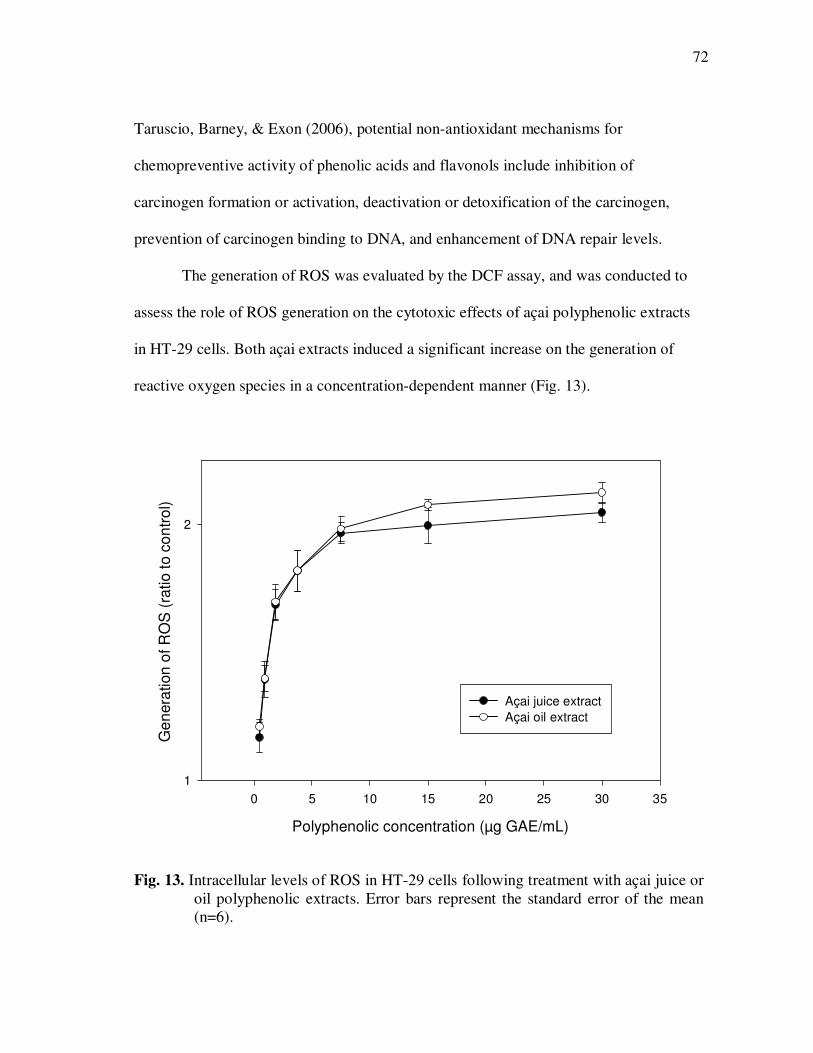
72
Taruscio, Barney, & Exon (2006), potential non-antioxidant mechanisms for
chemopreventive activity of phenolic acids and flavonols include inhibition of
carcinogen formation or activation, deactivation or detoxification of the carcinogen,
prevention of carcinogen binding to DNA, and enhancement of DNA repair levels.
The generation of ROS was evaluated by the DCF assay, and was conducted to
assess the role of ROS generation on the cytotoxic effects of açai polyphenolic extracts
in HT-29 cells. Both açai extracts induced a significant increase on the generation of
reactive oxygen species in a concentration-dependent manner (Fig. 13).
Polyphenolic concentration (µg GAE/mL)
0 5 10 15 20 25 30 35
Ge
nera
tion
of R
OS
(ra
tio t
o c
on
tro
l)
1
2
Açai juice extract
Açai oil extract
Fig. 13. Intracellular levels of ROS in HT-29 cells following treatment with açai juice or oil polyphenolic extracts. Error bars represent the standard error of the mean (n=6).
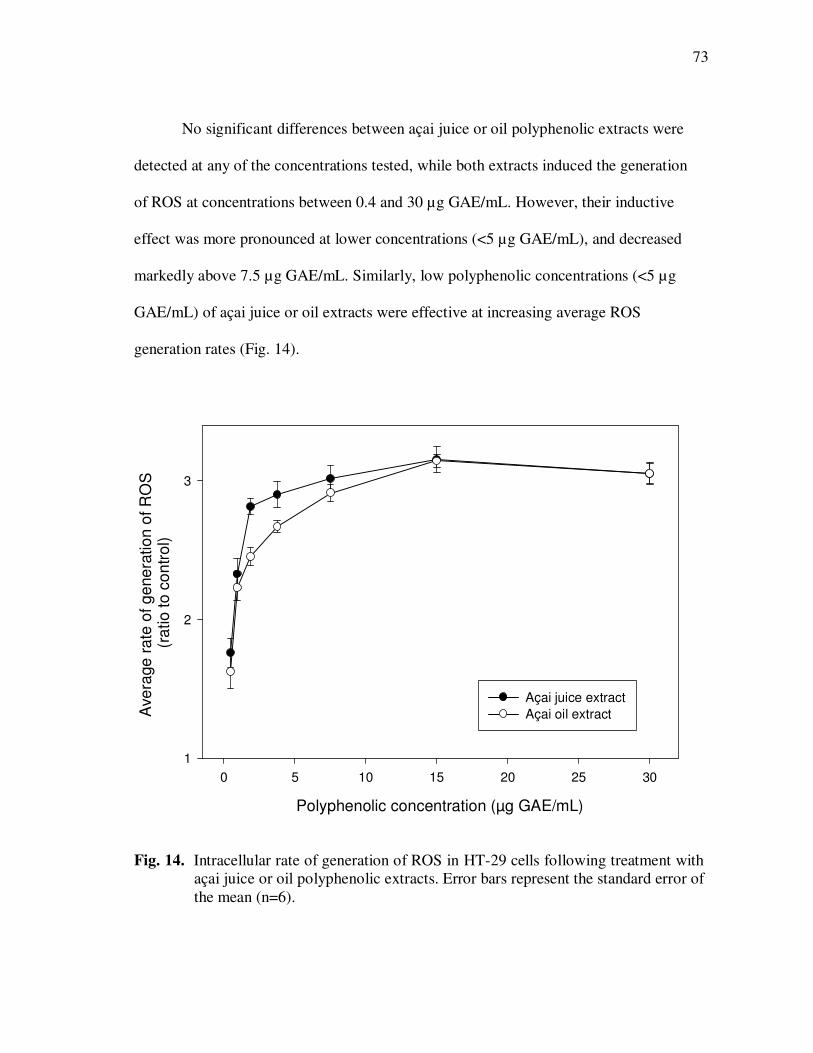
73
No significant differences between açai juice or oil polyphenolic extracts were
detected at any of the concentrations tested, while both extracts induced the generation
of ROS at concentrations between 0.4 and 30 µg GAE/mL. However, their inductive
effect was more pronounced at lower concentrations (<5 µg GAE/mL), and decreased
markedly above 7.5 µg GAE/mL. Similarly, low polyphenolic concentrations (<5 µg
GAE/mL) of açai juice or oil extracts were effective at increasing average ROS
generation rates (Fig. 14).
Polyphenolic concentration (µg GAE/mL)
0 5 10 15 20 25 30
Ave
rage
ra
te o
f g
ene
ratio
n o
f R
OS
(r
atio t
o c
on
tro
l)
1
2
3
Açai juice extract
Açai oil extract
Fig. 14. Intracellular rate of generation of ROS in HT-29 cells following treatment with açai juice or oil polyphenolic extracts. Error bars represent the standard error of the mean (n=6).
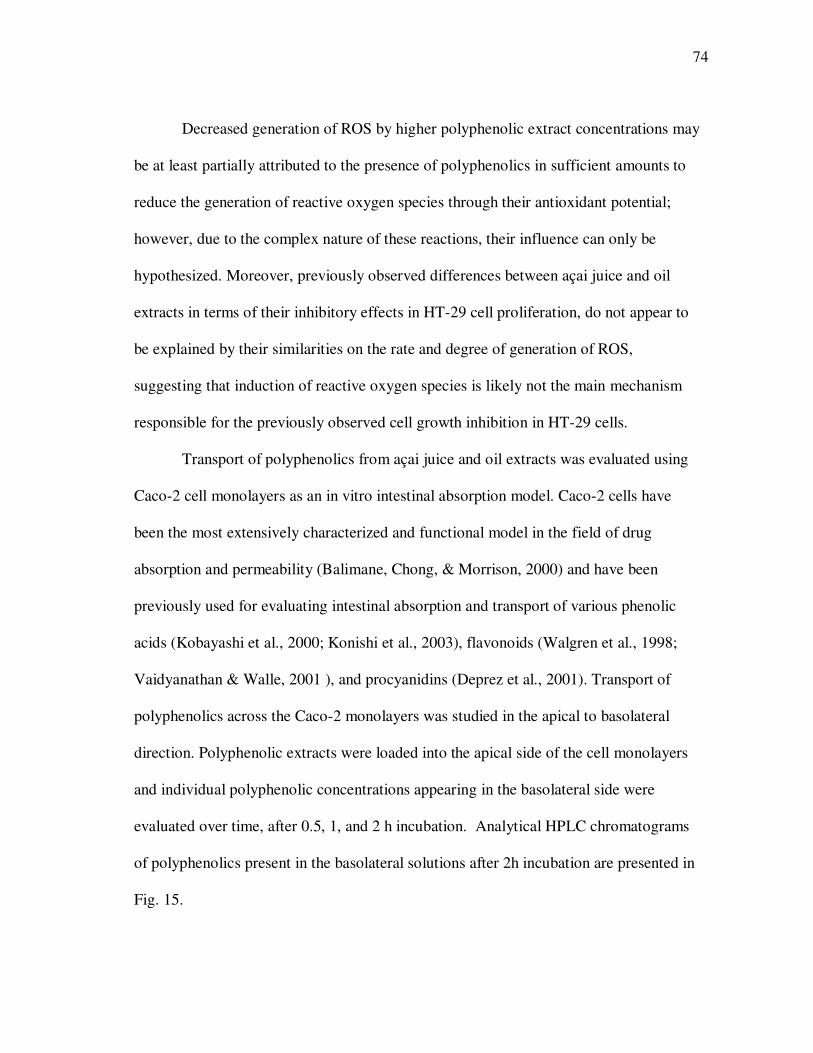
74
Decreased generation of ROS by higher polyphenolic extract concentrations may
be at least partially attributed to the presence of polyphenolics in sufficient amounts to
reduce the generation of reactive oxygen species through their antioxidant potential;
however, due to the complex nature of these reactions, their influence can only be
hypothesized. Moreover, previously observed differences between açai juice and oil
extracts in terms of their inhibitory effects in HT-29 cell proliferation, do not appear to
be explained by their similarities on the rate and degree of generation of ROS,
suggesting that induction of reactive oxygen species is likely not the main mechanism
responsible for the previously observed cell growth inhibition in HT-29 cells.
Transport of polyphenolics from açai juice and oil extracts was evaluated using
Caco-2 cell monolayers as an in vitro intestinal absorption model. Caco-2 cells have
been the most extensively characterized and functional model in the field of drug
absorption and permeability (Balimane, Chong, & Morrison, 2000) and have been
previously used for evaluating intestinal absorption and transport of various phenolic
acids (Kobayashi et al., 2000; Konishi et al., 2003), flavonoids (Walgren et al., 1998;
Vaidyanathan & Walle, 2001 ), and procyanidins (Deprez et al., 2001). Transport of
polyphenolics across the Caco-2 monolayers was studied in the apical to basolateral
direction. Polyphenolic extracts were loaded into the apical side of the cell monolayers
and individual polyphenolic concentrations appearing in the basolateral side were
evaluated over time, after 0.5, 1, and 2 h incubation. Analytical HPLC chromatograms
of polyphenolics present in the basolateral solutions after 2h incubation are presented in
Fig. 15.
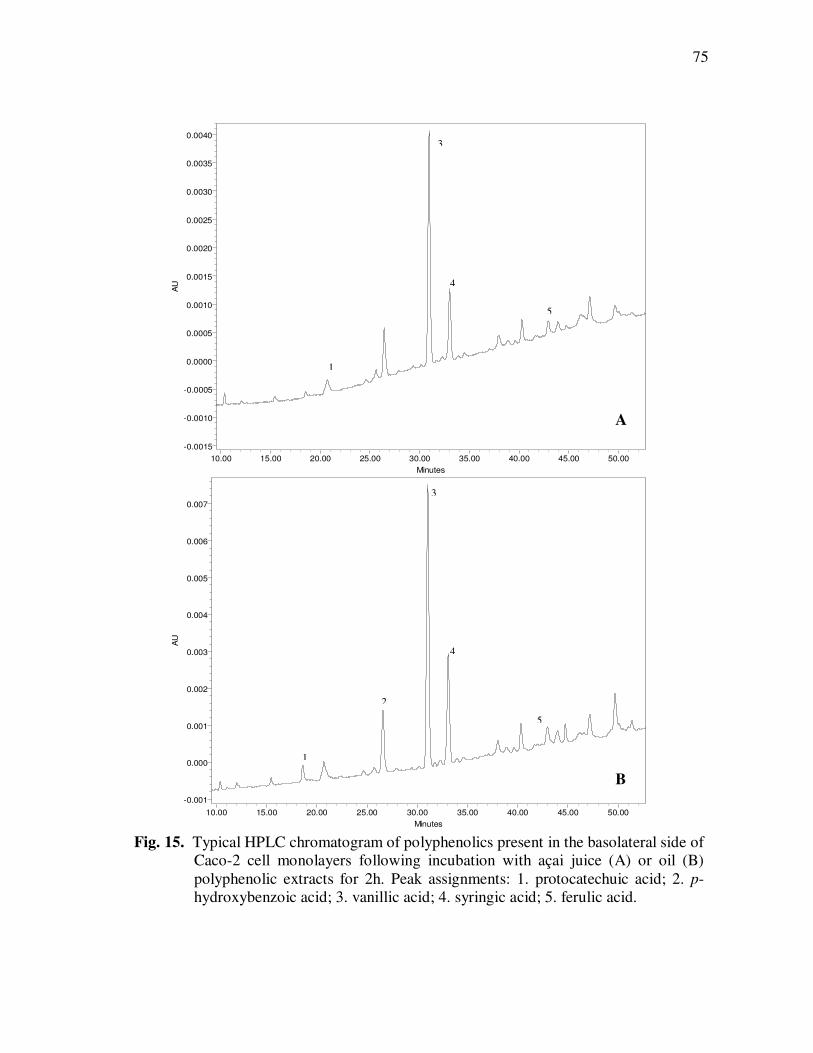
75
Fig. 15. Typical HPLC chromatogram of polyphenolics present in the basolateral side of Caco-2 cell monolayers following incubation with açai juice (A) or oil (B) polyphenolic extracts for 2h. Peak assignments: 1. protocatechuic acid; 2. p-hydroxybenzoic acid; 3. vanillic acid; 4. syringic acid; 5. ferulic acid.
AU
-0.0015
-0.0010
-0.0005
0.0000
0.0005
0.0010
0.0015
0.0020
0.0025
0.0030
0.0035
0.0040
Minutes
10.00 15.00 20.00 25.00 30.00 35.00 40.00 45.00 50.00
AU
-0.001
0.000
0.001
0.002
0.003
0.004
0.005
0.006
0.007
Minutes
10.00 15.00 20.00 25.00 30.00 35.00 40.00 45.00 50.00
1
2
5
3
4
1
3
4
5
A
B
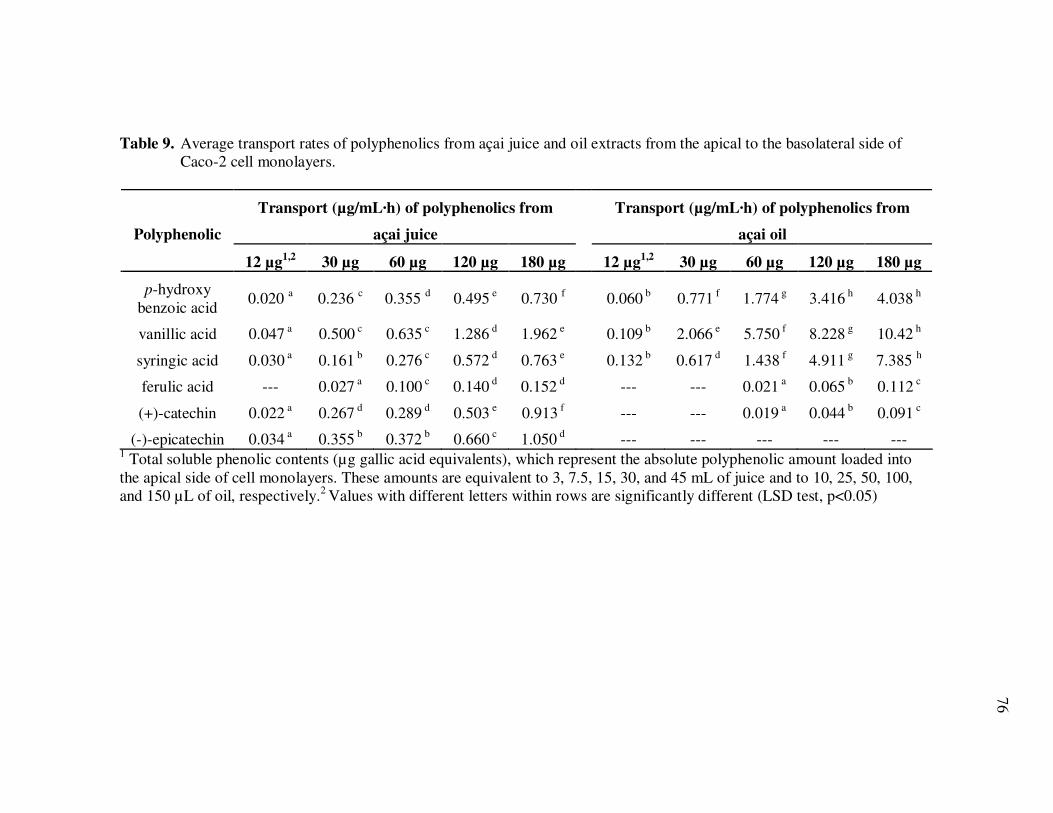
76
Table 9. Average transport rates of polyphenolics from açai juice and oil extracts from the apical to the basolateral side of Caco-2 cell monolayers.
Transport (µg/mL·h) of polyphenolics from
açai juice
Transport (µg/mL·h) of polyphenolics from
açai oil Polyphenolic
12 µg1,2
30 µg 60 µg 120 µg 180 µg 12 µg1,2
30 µg 60 µg 120 µg 180 µg
p-hydroxy benzoic acid
0.020 a 0.236 c 0.355 d 0.495 e 0.730 f 0.060 b 0.771 f 1.774 g 3.416 h 4.038 h
vanillic acid 0.047 a 0.500 c 0.635 c 1.286 d 1.962 e 0.109 b 2.066 e 5.750 f 8.228 g 10.42 h
syringic acid 0.030 a 0.161 b 0.276 c 0.572 d 0.763 e 0.132 b 0.617 d 1.438 f 4.911 g 7.385 h
ferulic acid --- 0.027 a 0.100 c 0.140 d 0.152 d --- --- 0.021 a 0.065 b 0.112 c
(+)-catechin 0.022 a 0.267 d 0.289 d 0.503 e 0.913 f --- --- 0.019 a 0.044 b 0.091 c
(-)-epicatechin 0.034 a 0.355 b 0.372 b 0.660 c 1.050 d --- --- --- --- --- 1 Total soluble phenolic contents (µg gallic acid equivalents), which represent the absolute polyphenolic amount loaded into the apical side of cell monolayers. These amounts are equivalent to 3, 7.5, 15, 30, and 45 mL of juice and to 10, 25, 50, 100, and 150 µL of oil, respectively.2 Values with different letters within rows are significantly different (LSD test, p<0.05)
77
The phytochemical composition of each açai extract (Fig. 1) and their
corresponding polyphenolic concentrations (Table 8) were previously discussed. Initial
observations indicated that phenolic acids such as p-hydroxy benzoic, vanillic, syringic,
and ferulic acids can be transported from the apical to the basolateral side of Caco-2 cell
monolayers, along with monomeric flavanols such as (+)-catechin and (-)-epicatechin,
when present in complex polyphenolic mixtures, such as those employed herein.
Average transport rates (µg/mL·h) of polyphenolics from açai juice and oil extracts
adjusted to different concentrations (µg gallic acid equivalents/mL), from the apical to
the basolateral side of Caco-2 cell monolayers were monitored over time (Table 9).
Individual polyphenolic transport rates (0.02 to 10.4 µg/mL·h) increased in a
concentration-dependent (24-360 µg GAE/mL) manner for both extracts; however,
absolute phenolic acid transport rates were significantly higher (p<0.05) for açai oil
extracts than for their juice counterparts at equivalent total phenolic concentrations while
the opposite was true for (+)-catechin and (-)-epicatechin. These results are in good
agreement with the corresponding polyphenolic profiles of açai juice and oil extracts,
since phenolic acid concentrations in açai oil extracts were up to 3.4-fold higher than in
açai juice extracts while the latter contained 14-fold higher flavanol concentrations than
their oil equivalents.
Variations on individual polyphenolic transport rates were minor at low phenolic
extract concentrations (~24 µg/mL·h); however, transport efficiency of vanillic and
syringic acids was enhanced at higher extract concentrations. Higher transport efficiency
of these phenolic acids might be related to their methylated structures, which have
78
shown to enhance the transport of anthocyanins (Yi et al., 2006) and other flavonoids
(Ollila, Halling, Vuorela, Vuorela, & Slotte, 2002; Tammela et al., 2004) in similar
Caco-2 cell models. Thus, a higher number of methyl groups has shown to increase
polyphenolic transport through cell monolayers, while free hydroxyl groups have been
associated with longer retention delays in membranes, likely due to hydrogen-bond
formation between phenolic hydroxyl groups and polar groups of the lipid molecules at
the lipid/water interface (Ollila et al., 2002).
Moreover, methoxylated phenolic derivatives have been found to exert a potent
inhibitory effect on the fluorescein transport in Caco-2 monolayers, which is indicative
of a higher structural affinity to the monocarboxylic acid transporter (MCT), previously
shown to play a role in the active transport of several phenolic acids (Konishi et al.,
2003; Konishi & Shimizu, 2003). Flavanols, on the other hand, have been shown to be
transported mainly via paracellular diffusion (Konishi et al., 2003); therefore, higher (+)-
catechin and (-)-epicatechin transport rates in cells loaded with juice polyphenolic
extracts are likely associated to their respective higher concentrations initially present in
juice extracts when compared to their oil counterparts.
Relative transport efficiency of açai polyphenolics from juice and oil extracts by
the end of the incubation period (2h) is summarized in Table 10. Transport efficiencies
were expressed as the percentage of the initial polyphenolic concentration (loaded in the
apical side) detected on the basolateral side of Caco-2 cell monolayers following
incubation for 2h.
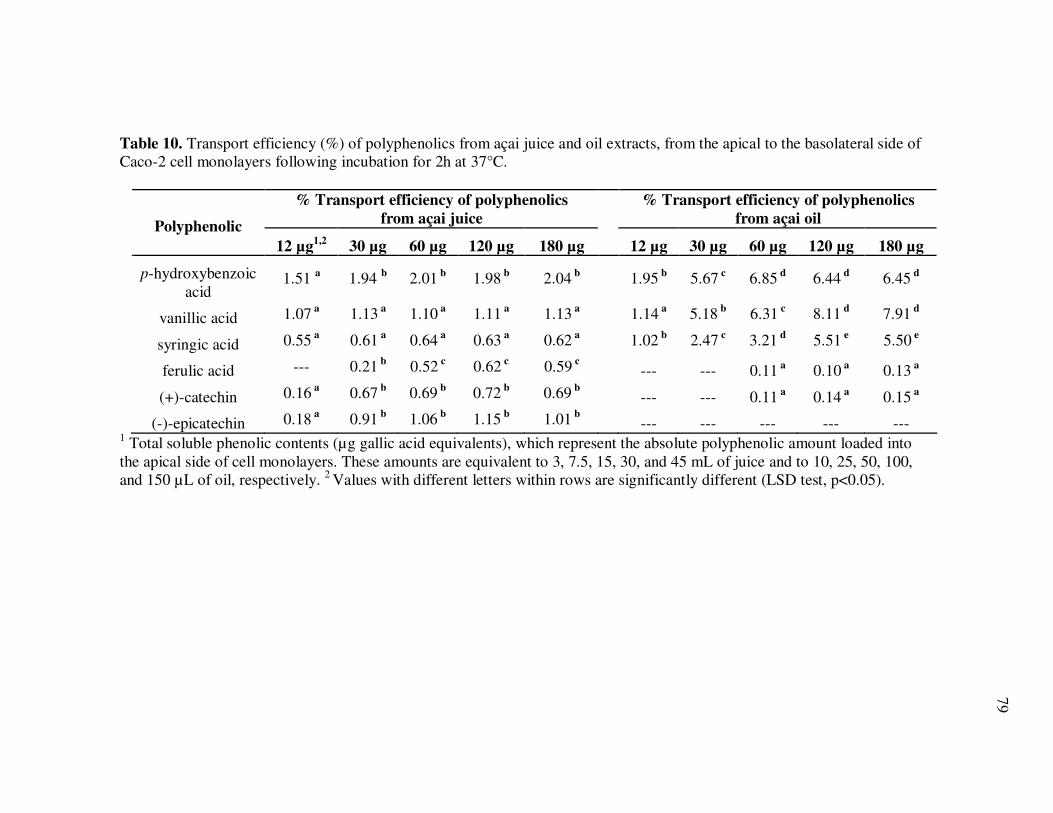
79
Table 10. Transport efficiency (%) of polyphenolics from açai juice and oil extracts, from the apical to the basolateral side of Caco-2 cell monolayers following incubation for 2h at 37°C.
% Transport efficiency of polyphenolics
from açai juice % Transport efficiency of polyphenolics
from açai oil Polyphenolic
12 µg1,2
30 µg 60 µg 120 µg 180 µg 12 µg 30 µg 60 µg 120 µg 180 µg
p-hydroxybenzoic acid
1.51 a 1.94 b 2.01 b 1.98 b 2.04 b 1.95 b 5.67 c 6.85 d 6.44 d 6.45 d
vanillic acid 1.07 a 1.13 a 1.10 a 1.11 a 1.13 a 1.14 a 5.18 b 6.31 c 8.11 d 7.91 d
syringic acid 0.55 a 0.61 a 0.64 a 0.63 a 0.62 a 1.02 b 2.47 c 3.21 d 5.51 e 5.50 e
ferulic acid --- 0.21 b 0.52 c 0.62 c 0.59 c --- --- 0.11 a 0.10 a 0.13 a
(+)-catechin 0.16 a 0.67 b 0.69 b 0.72 b 0.69 b --- --- 0.11 a 0.14 a 0.15 a
(-)-epicatechin 0.18 a 0.91 b 1.06 b 1.15 b 1.01 b --- --- --- --- --- 1 Total soluble phenolic contents (µg gallic acid equivalents), which represent the absolute polyphenolic amount loaded into the apical side of cell monolayers. These amounts are equivalent to 3, 7.5, 15, 30, and 45 mL of juice and to 10, 25, 50, 100, and 150 µL of oil, respectively. 2 Values with different letters within rows are significantly different (LSD test, p<0.05).
80
Contrary to previous observations on polyphenolic transport rates, relative
transport efficiencies of individual polyphenolics did not present systematic variations as
a function of initial polyphenolic concentrations. In fact, transport efficiencies for p-
hydroxy benzoic (~2.0%), vanillic (~1.0%), and syringic (~0.6%) acids were not
affected (p<0.05) by initial polyphenolic concentrations in açai juice extracts while the
same was true for ferulic acid (~0.1%) and (+)-catechin (~0.1%) in açai oil extracts.
Similarly, equal transport efficiencies for ferulic acid, (+)-catechin, and (-)-epicatechin
were observed at initial juice extract polyphenolic concentrations above 60 µg/mL.
However, transport of phenolic acids such as p-hydroxy benzoic, vanillic, and syringic
from açai oil extracts increased proportionally to the amount originally loaded into the
apical compartment, up to a certain concentration (<240 µg/mL), after which no further
changes in transport efficiency were observed. This effect might be partially attributed to
the presence of concentrated amounts of other polyphenolic components at higher
extract concentrations, which may interfere with both active and passive absorption
mechanisms (Konishi et al., 2003; Yi et al., 2006).
Conclusion
Results from this study suggest polyphenolic extracts from açai juice and from a
recently characterized phytochemical enriched açai oil are rich sources of phenolic acids,
including vanillic, syringic, p-hydroxy benzoic, protocatechuic, and ferulic acid, and
flavan-3-ols such as (+)-catechin, (-)-epicatechin, and procyanidin dimers and trimers.
Both polyphenolic extracts were found to significantly inhibit cell proliferation and
81
increase the generation of reactive oxygen species (ROS) in a concentration-dependent
manner. Additional to the generation of ROS, further cytotoxic mechanisms are likely
responsible for the potent antiproliferative effects of açai extracts on HT-29 colon cancer
cells. In addition, the bioavailability of polyphenolic compounds present in açai extracts
were evaluated using Caco-2 monolayers as a model for intestinal absorption. It was
demonstrated that polyphenolic mixtures containing phenolic acids such as p-hydroxy
benzoic, vanillic, syringic, and ferulic acids, and monomeric flavanols such as (+)-
catechin and (-)-epicatechin can be transported from the apical to the basolateral side of
Caco-2 cell monolayers. Results from this study provide further evidence on the
antiproliferative properties of açai polyphenolics in cancer cells and offer new
information on their bioavailability.
82
CHAPTER VI
CHEMICAL STABILITY OF AÇAI ANTHOCYANINS AS INFLUENCED BY
NATURAL AND ADDED POLYPHENOLIC COFACTORS IN
MODEL JUICE SYSTEMS
Introduction
Anthocyanins have been categorized as the most important group of water-
soluble pigments in plants, and are responsible for most blue, red, and related colors in
flowers and fruits (Clifford, 2000). Anthocyanin color is an important sensory
characteristic and often a major quality parameter for a variety of fruit products. Açai
(Euterpe oleracea Mart.), a palm fruit native to the Brazilian Amazon, has been the
focus of increased international attention as a functional ingredient (Del Pozo, Brenes, &
Talcott, 2004; Schauss et al., 2006) and is a potential rich source of anthocyanins
(Gallori et al., 2004; Lichtenthaler et al., 2005; Pacheco-Palencia et al., 2007a; Pacheco-
Palencia et al., 2007b). Two predominant anthocyanins, cyanidin-3-rutinoside and
cyanidin-3-glucoside, are responsible for most of its characteristic dark purple color, and
are often a major source of color in açai-containing juices and beverages (Schauss et al.,
2006; Lichtenthaler et al., 2005; Pacheco-Palencia et al., 2007a). However, anthocyanins
are highly reactive and generally experience extensive degradation during long-term
storage, leading to dark, dull, brown hues (Jurd, 1972).
Anthocyanin color changes are known to be influenced by several factors,
including pH, temperature, light, and the presence of enzymes, sugars, metals, and
83
phenolic cofactors (Markakis, 1982). Among these, the presence of non-anthocyanin
polyphenolics may significantly affect anthocyanin color, as they participate in
copigmentation reactions in enhanced color and increased stability during storage
(Singleton, 1972). Intermolecular copigmentation reactions are common in nature and
occur when colorless phenolic cofactors are attracted to anthocyanins via weak
hydrophobic forces (Mazza & Brouillard, 1990). Anthocyanin copigmentation reactions
are detected by both a hyperchromic shift, where absorbance at the λmax of the absorption
spectrum increases, and by a bathochromic shift, where a change toward higher
wavelengths (nm) at the λmax of the absorption spectrum occurs (Baranac, Petranovic, &
Dimitric-Markovic, 1996; Malien-Aubert, Dangles, & Amiot, 2001).
Previous studies have evaluated the use of externally added polyphenolic
cofactors, particularly phenolic acids, to enhance and stabilize anthocyanin color in berry
juices (Eiro & Heinonen, 2002). External addition of commercial polyphenolic cofactors
from rosemary (Rosmarinus officinalis) has also shown to result in enhanced
anthocyanin color and increased stability in grape juices (Talcott, Brenes, Pires, & Del
Pozo-Insfran, 2003; Brenes, Del Pozo-Insfran, & Talcott, 2005). Thus, the natural
occurrence and predominant presence of certain groups of polyphenolic cofactors in açai
fruit, including phenolic acids, flavone-C-glycosides, and procyanidins (Gallori et al.,
2004; Pacheco-Palencia et al., 2007b; Schauss et al., 2006), may play a significant role
in the structural and pigment stability of anthocyanins in açai fruit juices.
The role of flavone-C-glycosides is of particular interest, as their presence in other
anthocyanin-rich fruits has not been previously reported. Moreover, the potential use of
84
flavone-C-glycoside-rich extracts as anthocyanin color enhancers and stabilizing agents
has not been evaluated. Extracts rich in flavone-C-glycosides may be obtained from
various botanical sources, among which, rooibos (Aspalathus linearis) tea, a leguminous
shrub native to South Africa, is among the highest, most widely available, and easily
extractable sources (Krafczyk & Glomb, 2008). This study was conducted to evaluate
the influence of different groups of naturally occurring polyphenolic cofactors on the
stability of anthocyanins in açai fruit juice models stored under different pH (3.0, 3.5,
and 4.0) and temperature (5, 20, and 30°C) conditions and assess the influence of
externally added polyphenolic cofactors from rooibos tea, rich in flavone-C-glycosides,
and from commercial rosemary extracts on the stability of açai juice models. Relations
between anthocyanin degradation and sulfite bleaching resistance, reducing capacity,
and antioxidant activity were additionally determined.
Materials and Methods
Polyphenolic cofactors were isolated from various açai fruit products prior use in
juice models. Phenolic acids and procyanidins were extracted from a previously
characterized, polyphenolic-enriched açai oil (chapter IV), which contained concentrated
amounts of phenolic acids and procyanidins originally present in açai fruit pulp. Açai oil
was extracted from a semi-solid filter cake obtained from Bossa Nova Beverage Group
(Los Angeles, CA), commercially used for açai pulp clarification, using a hydro-
alcoholic solution, as described in a patent-pending process (Talcott et al., 2007).
Following solvent removal, the resultant oil was kept frozen (-20°C) until use. Açai oil
85
was extensively extracted with an equal volume of a 1:1 (v/v) hexane:methanol solution
until complete dissolution. A known volume of 0.1 M aqueous citric acid buffer at pH
3.0 was added to the mixture, to form a bi-layer, from which the hydrophilic phase was
retained. Residual methanol in the hydrophilic phase was evaporated under reduced
pressure (<40°C) and the resulting aqueous solution was recovered, adjusted to pH 7.0,
and loaded onto C18 Sep-Pak Vac 20 cm³ mini-columns (Waters Corporation, Milford,
MA). Phenolic acids were eluted in the unbound fraction, while procyanidins were
eluted with acidified methanol (0.01% HCl). The aqueous, phenolic acid-containing
fraction was then acidified to pH 3.0, loaded onto a second Sep-Pak column, and eluted
with acidified methanol (0.01% HCl). Methanol from each extraction was then
evaporated under vacuum (<40°C) and each fraction was re-dissolved in a known
volume of the citric acid buffer.
In a second extraction, anthocyanins and naturally occurring flavone-C-
glycosides in açai fruit were extracted from clarified açai pulp (Bossa Nova Beverage
Group, Los Angeles, CA). Clarified açai pulp was likewise loaded onto Sep-Pak mini-
columns (Waters Corporation, Milford, MA), and sequentially eluted with acidified
water (0.01% HCl) to remove metals, sugars and other water soluble components,
followed by ethyl acetate to remove phenolic acids, and finally acidified methanol
(0.01% HCl), to elute both anthocyanins and flavone-C-glycosides. Following solvent
evaporation and re-dissolution in the citric acid buffer, the methanolic fraction was
loaded onto manually packed, lipophilic Sephadex LH-20 (Sigma-Aldrich, St. Louis,
MO) 40 cm³ mini-columns, previously equilibrated with water. Columns were washed
86
with 30% aqueous methanol (v/v) to elute anthocyanins, followed by 60% aqueous
methanol (v/v) to elute flavone-C-glycosides, and with 100% methanol to elute
procyanidins. These procyanidins were combined with the procyanidin fraction
previously obtained from açai oil. All solvents were finally evaporated under reduced
pressure (<40°C) and each resulting isolate was redissolved in the citric acid buffer (pH
3.0).
Açai fruit models were created based on the predominant anthocyanins present in
the fruit (cyanidin-3-rutinoside and cyanidin-3-glucoside), adjusted to a total
concentration ~500 mg/L in all models. Four different anthocyanin-based models were
prepared by combining anthocyanins with a major group of naturally occurring
polyphenolic cofactors in açai fruit, which included: phenolic acids, procyanidins,
flavone-C-glycosides, and an anthocyanin isolate from açai fruit as a control. Cofactor
concentrations on each model were adjusted according to the original ratio of total
phenolic cofactors to anthocyanins (1:10) naturally present in 100% clarified açai pulp.
Each model was adjusted to three different pH levels (3.0, 3.5, and 4.0) and equal
amounts of each anthocyanin model were loaded into screw-cap glass test tubes in
triplicate. Treatments were stored in the dark at 5, 20, and 30°C for up to 60 days.
Sodium azide (50 mg/L) was added to all treatments to prevent microbial growth during
storage. Individual tubes were removed from storage at predetermined time intervals and
held at -20°C until analysis.
Additional anthocyanin-based models containing externally added polyphenolic
cofactors were prepared by copigmenting anthocyanin isolates from açai fruit (~500
87
mg/L) with a rooibos tea extract, rich in flavone-C-glycosides, or with a commercial
rosemary extract (ColorEnhance, 3.5% rosmarinic acid, Naturex, South Hackensack,
NJ), and compared to an uncopigmented anthocyanin control. Rooibos tea extracts were
obtained from rooibos tea, prepared by brewing 50 g of loose rooibos tea obtained from
a local market in 50 mL boiling water for 30 min. Both rooibos tea and commercial
rosemary extracts were subsequently diluted in citric acid buffer (0.1 M, pH 3.0) and
further purified using Sep-Pak columns. Sugars, organic acids, and other water soluble
components were removed with water, and polyphenolic components were recovered
with ethyl acetate. Following solvent removal, compounds were redissolved in a known
volume of citric acid buffer (0.1 M, pH 3.0), adjusted to equal soluble phenolic contents
(10,000 mg gallic acid equivalents/L, corresponding to single-strength rosemary extract)
and added to anthocyanin isolates to contain final concentrations of 0.2% v/v, based on
previous reports using similar rosemary extracts (Talcott et al., 2003; Brenes et al.,
2005). All models were finally adjusted to pH 3.0, 3.5, or 4.0, loaded into screw-cap
glass tubes in triplicate, and stored at 30°C for up to 30 days. Sodium azide (50 mg/L)
was added to all treatments to retard microbial growth and pH was measured every other
day to confirm its consistency during storage. Individual tubes were removed from
storage every 3 days and held at -20°C until analysis.
Polyphenolic compounds were analyzed by reversed phase HPLC with a Waters
2695 Alliance system (Waters Corporation, Milford, MA), using previously described
chromatographic conditions (Pacheco-Palencia et al., 2007a). Polyphenolic identification
and quantification was based on spectral properties, retention time, and comparison to
88
authentic standards. Phenolic acid, flavonol, and anthocyanin standards were obtained
from Sigma Chemical Company (St. Louis, MO), and flavone-C-glycoside standards
were obtained from Indofine Chemical Company (Hillsborough, NJ). Mass
spectrometric analyses were additionally performed on a Thermo Finnigan LCQ Deca
XP Max MSn ion trap mass spectrometer equipped with an ESI ion source
(ThermoFisher, San Jose, CA). Separations were conducted using a Dionex (Dionex
Corporation, Sunnyvale, CA), Acclaim 120 column (4.6 x 250 mm; 5 µm) with a C18
guard column. Mobile phases consisted of 0.5% formic acid in water (phase A) and
0.5% formic acid in methanol (phase B) run at 0.30 mL/min. A gradient elution program
in which phase B changed from 5 to 30% in 10 min, from 30 to 65% in 70 min, and from
65 to 95% in 30 min was used and held isocratic for 20 min prior each injection.
Electrospray ionization in the negative ion mode was conducted under the following
conditions: sheath gas (N2), 60 units/min; auxiliary gas (N2), 5 units/min; spray voltage,
3.5 kV; capillary temperature, 250°C; capillary voltage, 1.5 V; tube lens offset, 0 V.
Total anthocyanin contents were determined spectrophotometrically at 520 nm,
according to the pH differential method described by Wrolstad, Durst, & Lee (2005) and
quantified using equivalents of cyanidin-3-glucoside (mg/L) with a molar extinction
coefficient of 29,600 (Jurd & Asen, 1966). Anthocyanin sulfite bleaching resistance was
also determined spectrophotometrically, based on color retention in the presence of
sodium sulfite (Rodriguez-Saona et al., 1999). Total soluble phenolic contents were
estimated from the total metal reducing capacity of each model in the Folin-Ciocalteu
assay, as described in chapter IV, and quantified in gallic acid equivalents (GAE).
89
Antioxidant capacity was determined by the oxygen radical absorbance capacity assay
(ORAC) described in chapter III, using fluorescein as the fluorescent probe, and
measured on a BMG Labtech FLUOstar fluorescent microplate reader (485 nm
excitation and 538 nm emission). Results were quantified and expressed as µmol Trolox
equivalents (TE) per milliliter.
A 4 x 3 x 3 factorial design that included four anthocyanin-based models, three
pH levels, and three storage temperatures was employed. Data from each chemical
analysis was analyzed by one-way analysis of variance (ANOVA) using SPSS version
15.0 (SPSS Inc., Chicago, IL) and mean separations were conducted using Tukey-
Kramer HSD (p<0.05) as a post-hoc analysis. Linear regression analyses and parametric
correlations were conducted using a 0.05 significance level.
Results and Discussion
Anthocyanins, phenolic acids, procyanidins, and flavone-C-glycosides present in
açai juice models were characterized based on their spectral characteristics and mass
spectrometric fragmentation patterns and quantified against authentic standards when
available (Table 11). All models were adjusted to equal cyanidin-3-glucoside and
cyanidin-3-rutinoside concentrations (519 ± 48 mg/L, Table 11). In addition, a particular
group of naturally occurring phenolic cofactors in açai fruit was included on each model:
phenolic acids (protocatechuic, p-hydroxybenzoic, vanillic, syringic, and ferulic acids),
procyanidins (dimers and trimers), and flavone-C-glycosides, including luteolin 6-C-
glucoside (isoorientin), luteolin 8-C-glucoside (orientin), apigenin-6-C-glucoside
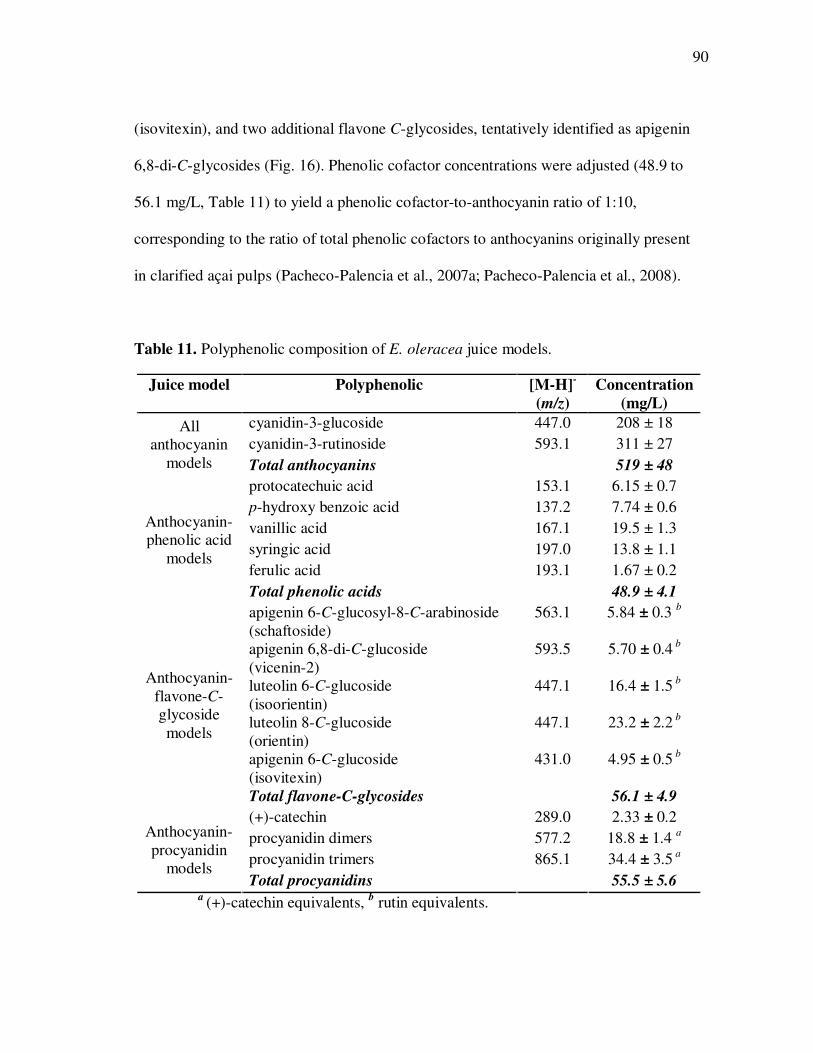
90
(isovitexin), and two additional flavone C-glycosides, tentatively identified as apigenin
6,8-di-C-glycosides (Fig. 16). Phenolic cofactor concentrations were adjusted (48.9 to
56.1 mg/L, Table 11) to yield a phenolic cofactor-to-anthocyanin ratio of 1:10,
corresponding to the ratio of total phenolic cofactors to anthocyanins originally present
in clarified açai pulps (Pacheco-Palencia et al., 2007a; Pacheco-Palencia et al., 2008).
Table 11. Polyphenolic composition of E. oleracea juice models.
Juice model Polyphenolic [M-H]-
(m/z) Concentration
(mg/L)
cyanidin-3-glucoside 447.0 208 ± 18 cyanidin-3-rutinoside 593.1 311 ± 27
All anthocyanin
models Total anthocyanins 519 ± 48
protocatechuic acid 153.1 6.15 ± 0.7 p-hydroxy benzoic acid 137.2 7.74 ± 0.6 vanillic acid 167.1 19.5 ± 1.3 syringic acid 197.0 13.8 ± 1.1 ferulic acid 193.1 1.67 ± 0.2
Anthocyanin-phenolic acid
models
Total phenolic acids 48.9 ± 4.1
apigenin 6-C-glucosyl-8-C-arabinoside (schaftoside)
563.1 5.84 ± 0.3 b
apigenin 6,8-di-C-glucoside (vicenin-2)
593.5 5.70 ± 0.4 b
luteolin 6-C-glucoside (isoorientin)
447.1 16.4 ± 1.5 b
luteolin 8-C-glucoside (orientin)
447.1 23.2 ± 2.2 b
apigenin 6-C-glucoside (isovitexin)
431.0 4.95 ± 0.5 b
Anthocyanin- flavone-C-glycoside models
Total flavone-C-glycosides 56.1 ± 4.9
(+)-catechin 289.0 2.33 ± 0.2 procyanidin dimers 577.2 18.8 ± 1.4 a procyanidin trimers 865.1 34.4 ± 3.5 a
Anthocyanin-procyanidin
models Total procyanidins 55.5 ± 5.6
a (+)-catechin equivalents, b rutin equivalents.
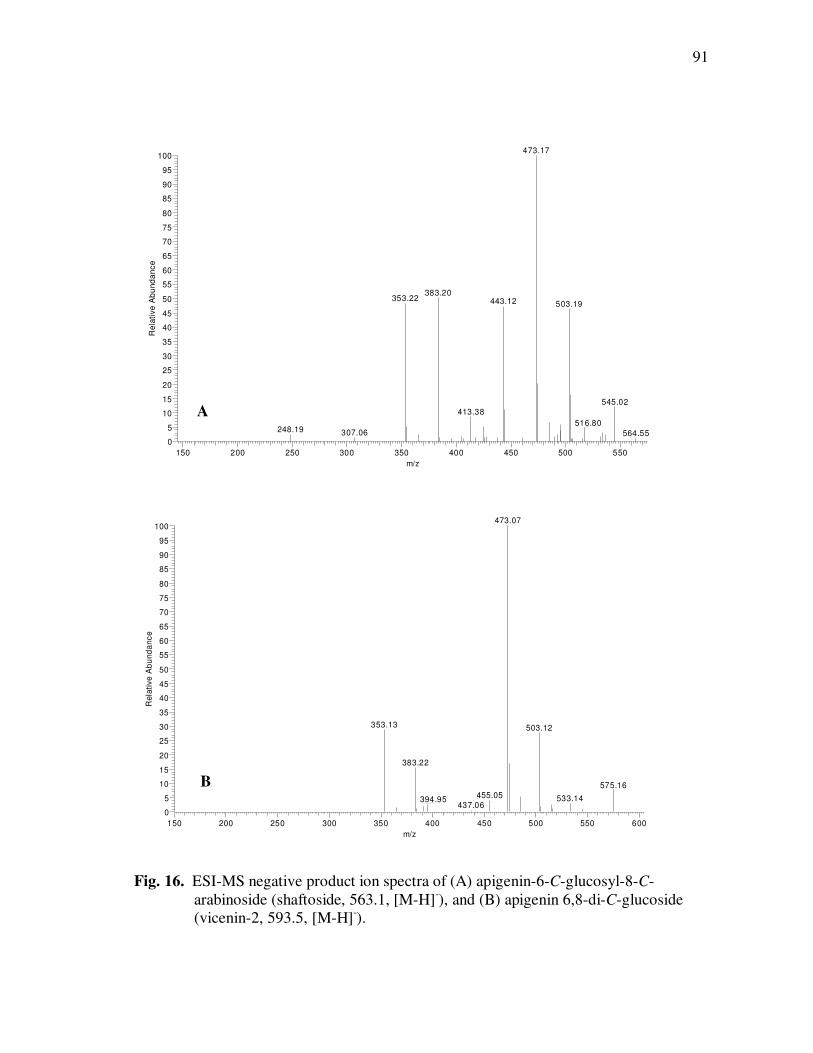
91
Fig. 16. ESI-MS negative product ion spectra of (A) apigenin-6-C-glucosyl-8-C-arabinoside (shaftoside, 563.1, [M-H]-), and (B) apigenin 6,8-di-C-glucoside (vicenin-2, 593.5, [M-H]-).
AcaipH3_MEOH #1444 RT: 34.80 AV: 1 NL: 1.05E5F: - c ESI d Full ms2 [email protected] [145.00-575.00]
150 200 250 300 350 400 450 500 550
m/z
0
5
10
15
20
25
30
35
40
45
50
55
60
65
70
75
80
85
90
95
100R
ela
tive
Ab
un
da
nc
e473.17
383.20353.22 443.12 503.19
545.02
413.38
516.80248.19 307.06 564.55
A
B
Aflav_25d #1144 RT: 31.18 AV: 1 NL: 7.86E4T: - c ESI d Full ms2 [email protected] [150.00-605.00]
150 200 250 300 350 400 450 500 550 600
m/z
0
5
10
15
20
25
30
35
40
45
50
55
60
65
70
75
80
85
90
95
100
Re
lati
ve
Ab
un
da
nc
e
473.07
353.13 503.12
383.22
575.16
455.05 533.14394.95437.06
92
Identification of flavone-C-glycosides was based on their characteristic MS
patterns, as preferential fragmentation of the glycosidic moiety occurs, yielding typical
product ions at [M-H-60]-, [M-H-90]-, and [M-H-120]- (Ferreres, Silva, Andrade,
Seabra, & Ferreira, 2003; Gattuso, Barreca, Gargiulli, Leuzzi, & Caristi, 2007; Pereira,
Yariwake, & McCullagh, 2005). Thus, tentative identification of apigenin-6-C-glucosyl-
8-C-arabinoside was based on precursor ion signals at m/z= 563.1 ([M-H]-), and
respective product ions at m/z= 503.1 ([M-H-60]-), m/z= 473.2 ([M-H-90]-); and m/z=
443.1 ([M-H-120]-), as noted in Fig. 16. Exact fragmentation patterns corresponded to
those previously reported for apigenin-6-C-glucosyl-8-C-arabinoside (shaftoside, m/z=
563.1, [M-H]-) in quince seeds (Ferreres et al., 2003) and in Scutellaria baicalensis roots
(Han, Ye, Xu, Sun, Wang, & Guo, 2007). Tentative identification of apigenin 6,8-di-C-
glucoside was based on ion signals at m/z= 593.5, [M-H]-, and similar neutral losses
yielding ions at m/z= 533.1 ([M-H-60]-); m/z= 503.1 ([M-H-90]-); and m/z= 473.1 ([M-
H-120]-) (Fig. 16). Mass fragmentations were identical to those of apigenin 6,8-di-C-
glucoside (vicenin-2, m/z= 593.5, [M-H]-), previously reported in wild basil leaves
(Grayer, Kite, Abou-Zaid, & Archer, 2000) and quince seeds (Ferreres et al., 2003).
The influence of naturally occurring polyphenolic cofactors on the stability of
anthocyanins in açai fruit was evaluated by monitoring changes in anthocyanin
concentrations of model juice systems adjusted to different conditions of temperature (5,
20, or 30°C for up to 12 weeks) and pH (3.0, 3.5, and 4.0). Initial spectrophotometric
determinations of total anthocyanin contents were consistent among anthocyanin
controls and models combined with phenolic acids or procyanidins (522.9 ± 27.3 mg
93
cyanidin-3-glucoside equivalents/L). However, models containing flavone-C-glycosides,
were 18.0% higher in initial absorbance values (617.1± 30.1 mg/L), attributed to
hyperchromic shifts resulting from anthocyanin copigmentation reactions. Molecular
associations between anthocyanins and other phenolics are commonly associated with
enhanced anthocyanin color, despite equivalent individual anthocyanin concentrations
(Boulton, 2001). Copigmentation reactions are often accompanied by a bathochromic
shift in the wavelength of maximum absorbance (Talcott et al., 2003); however, no
change was observed in the presence of flavone-C-glycosides in these models.
Degradation rates for cyanidin-3-glucoside, cyanidin-3-rutinoside, and total
anthocyanins followed first-order (p<0.01) degradation kinetics. Rate constants (β1, in
days-1), half-lives (t½, time, in days, to achieve a 50% reduction on initial
concentrations), and temperature quotients (Q10, fold increase in degradation rate when
temperature was increased from 20 to 30°C) were calculated as previously described
(Pacheco-Palencia et al., 2007b) and are shown in Tables 12-14. Anthocyanin models
experienced significant pH- and temperature-dependent total anthocyanin losses, with
half-lives ranging from 4.01 to 23.2 days for models stored at 30°C, from 6.94 to 47.0
days when stored at 20°C, and from 48.2 to 259 days for models kept at 5°C (Table 12).
Total anthocyanin losses were also influenced by pH variations, and increased by 45-
60% when the pH was raised from 3.0 to 3.5 and by 90-100% when raised from 3.5 to
4.0, regardless of storage temperature or cofactor presence.
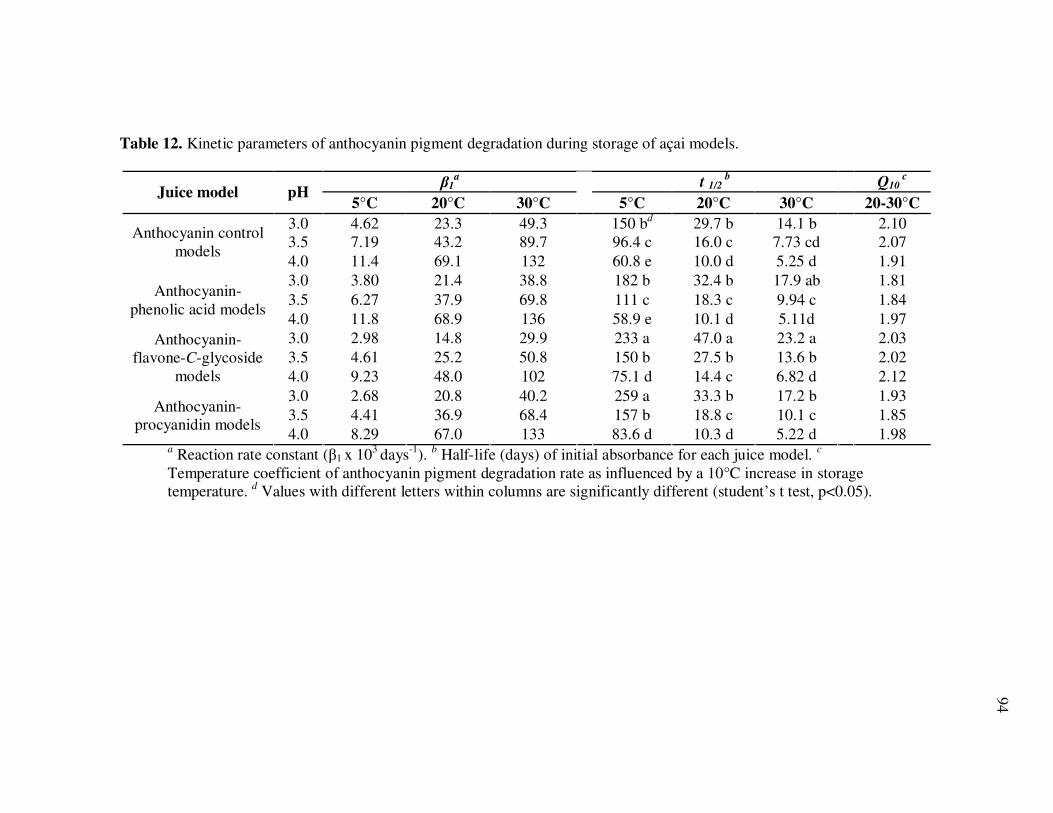
94
Table 12. Kinetic parameters of anthocyanin pigment degradation during storage of açai models.
β1a t 1/2
b Q10
c
Juice model pH 5°C 20°C 30°C 5°C 20°C 30°C 20-30°C
3.0 4.62 23.3 49.3 150 bd 29.7 b 14.1 b 2.10 3.5 7.19 43.2 89.7 96.4 c 16.0 c 7.73 cd 2.07
Anthocyanin control models
4.0 11.4 69.1 132 60.8 e 10.0 d 5.25 d 1.91 3.0 3.80 21.4 38.8 182 b 32.4 b 17.9 ab 1.81 3.5 6.27 37.9 69.8 111 c 18.3 c 9.94 c 1.84 Anthocyanin-
phenolic acid models 4.0 11.8 68.9 136 58.9 e 10.1 d 5.11d 1.97 3.0 2.98 14.8 29.9 233 a 47.0 a 23.2 a 2.03 3.5 4.61 25.2 50.8 150 b 27.5 b 13.6 b 2.02
Anthocyanin- flavone-C-glycoside
models 4.0 9.23 48.0 102 75.1 d 14.4 c 6.82 d 2.12 3.0 2.68 20.8 40.2 259 a 33.3 b 17.2 b 1.93 3.5 4.41 36.9 68.4 157 b 18.8 c 10.1 c 1.85 Anthocyanin-
procyanidin models 4.0 8.29 67.0 133 83.6 d 10.3 d 5.22 d 1.98
a Reaction rate constant (β1 x 10³ days-1). b Half-life (days) of initial absorbance for each juice model. c
Temperature coefficient of anthocyanin pigment degradation rate as influenced by a 10°C increase in storage temperature. d Values with different letters within columns are significantly different (student’s t test, p<0.05).
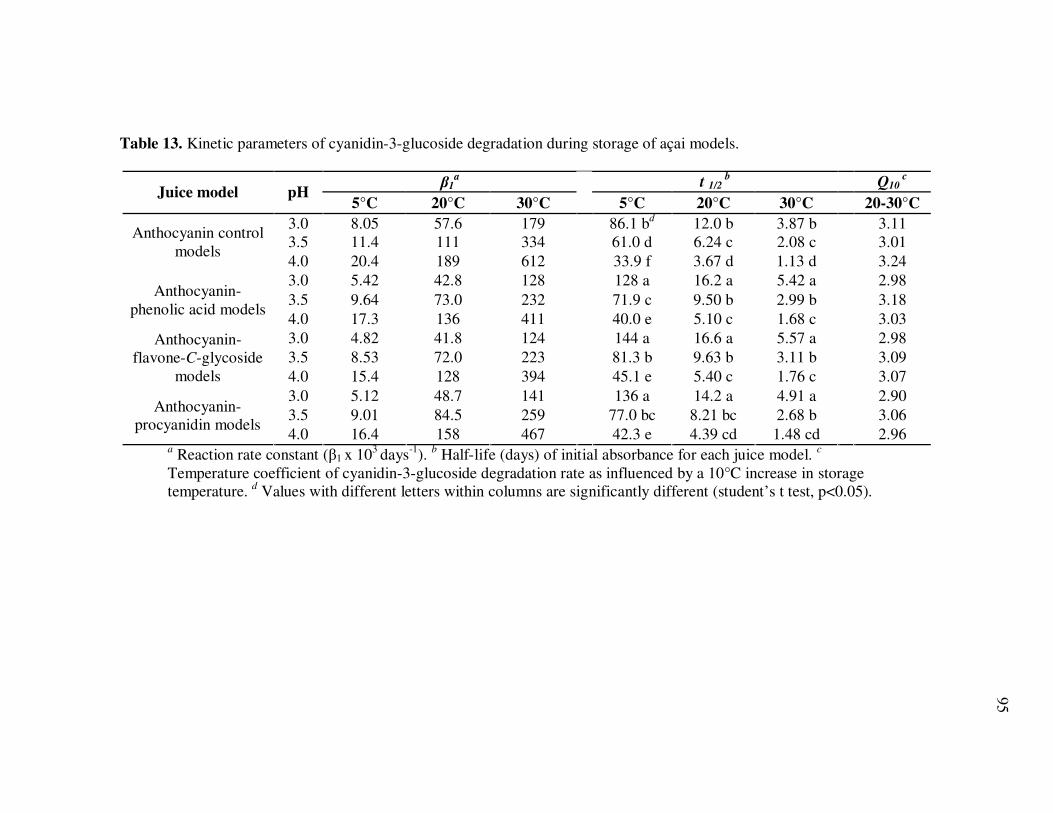
95
Table 13. Kinetic parameters of cyanidin-3-glucoside degradation during storage of açai models.
β1a t 1/2
b Q10
c
Juice model pH 5°C 20°C 30°C 5°C 20°C 30°C 20-30°C
3.0 8.05 57.6 179 86.1 bd 12.0 b 3.87 b 3.11 3.5 11.4 111 334 61.0 d 6.24 c 2.08 c 3.01
Anthocyanin control models
4.0 20.4 189 612 33.9 f 3.67 d 1.13 d 3.24 3.0 5.42 42.8 128 128 a 16.2 a 5.42 a 2.98 3.5 9.64 73.0 232 71.9 c 9.50 b 2.99 b 3.18 Anthocyanin-
phenolic acid models 4.0 17.3 136 411 40.0 e 5.10 c 1.68 c 3.03 3.0 4.82 41.8 124 144 a 16.6 a 5.57 a 2.98 3.5 8.53 72.0 223 81.3 b 9.63 b 3.11 b 3.09
Anthocyanin- flavone-C-glycoside
models 4.0 15.4 128 394 45.1 e 5.40 c 1.76 c 3.07 3.0 5.12 48.7 141 136 a 14.2 a 4.91 a 2.90 3.5 9.01 84.5 259 77.0 bc 8.21 bc 2.68 b 3.06 Anthocyanin-
procyanidin models 4.0 16.4 158 467 42.3 e 4.39 cd 1.48 cd 2.96
a Reaction rate constant (β1 x 10³ days-1). b Half-life (days) of initial absorbance for each juice model. c
Temperature coefficient of cyanidin-3-glucoside degradation rate as influenced by a 10°C increase in storage temperature. d Values with different letters within columns are significantly different (student’s t test, p<0.05).

96
Table 14. Kinetic parameters of cyanidin-3-rutinoside degradation during storage of açai models.
β1a t 1/2
b Q10
c
Juice model pH 5°C 20°C 30°C 5°C 20°C 30°C 20-30°C
3.0 4.06 24.4 66.3 171 ad 28.4 a 10.7 a 2.72 3.5 7.80 42.1 119 88.9 b 16.4 b 5.81 b 2.83
Anthocyanin control models
4.0 12.0 64.8 185 57.8 c 10.7 c 3.75 c 2.85 3.0 3.72 20.4 56.8 186 a 34.0 a 12.4 a 2.78 3.5 6.62 34.3 101 105 b 20.2 b 6.87 b 2.95 Anthocyanin-
phenolic acid models 4.0 11.9 63.2 179 58.2 c 11.0 c 3.87 c 2.83 3.0 3.31 20.9 55.3 210 a 33.2 a 12.8 a 2.65 3.5 5.85 33.8 96.8 118 b 20.5 b 7.16 b 2.86 Anthocyanin-flavone-
C-glycoside models 4.0 10.6 59.7 172 65.7 c 11.6 c 4.04 c 2.87 3.0 3.51 23.2 58.8 197 a 29.9 a 12.0 a 2.53 3.5 6.18 39.7 103 112 b 17.5 b 6.70 b 2.61 Anthocyanin-
procyanidin models 4.0 11.2 73.5 187 61.7 c 9.43 c 3.71 c 2.54
a Reaction rate constant (β1 x 10³ days-1). b Half-life (days) of initial absorbance for each juice model. c
Temperature coefficient of cyanidin-3-rutinoside degradation rate as influenced by a 10°C increase in storage temperature. d Values with different letters within columns are significantly different (student’s t test, p<0.05).
97
Similar pH and temperature-dependent degradation patterns were observed when
individual cyanidin-3-glucoside and cyanidin-3-rutinoside concentrations were
monitored (Tables 13, 14) and both cyanidin-3-glucoside (r=0.94) and cyanidin-3-
rutinoside (r=0.93) concentrations were highly correlated (p<0.001) to total anthocyanin
losses in all models throughout storage. However, temperature quotients (Q10, Tables 12-
14) indicated cyanidin-3-glucoside was less stable to temperature changes (Q10=2.9-3.2,
Table 13) compared to cyanidin-3-rutinoside (Q10=2.5-2.9, Table 14), and that individual
anthocyanin concentrations were significantly less stable to temperature changes
compared to total anthocyanin contents (Q10=1.8-2.1, Table 13). Observed differences
between total anthocyanin contents and changes in individual anthocyanin
concentrations were likely due to color contributions from polymeric anthocyanins
formed during storage, and to the potential influence of other matrix components in the
juice models (Wrolstad et al., 2005).
Similar detrimental effects were observed at increasing pH values, and changes
from pH 3.0 to 3.5 nearly doubled cyanidin-3-glucoside and cyanidin-3-rutinoside
degradation rates (Tables 13, 14) and increased total anthocyanin degradation rates by
~50% in all juice models. Detrimental effects of both high temperature and pH on
anthocyanin stability and color were attributed to shifts in the anthocyanin equilibrium
toward the colorless pseudobase and chalcone forms, expected to occur under these
conditions (Markakis, 1982; Clifford, 2000).
Structural differences also had a significant influence on anthocyanin stability,
with cyanidin-3-rutinoside being consistently more stable (t½=2.67 to 210 days, Table
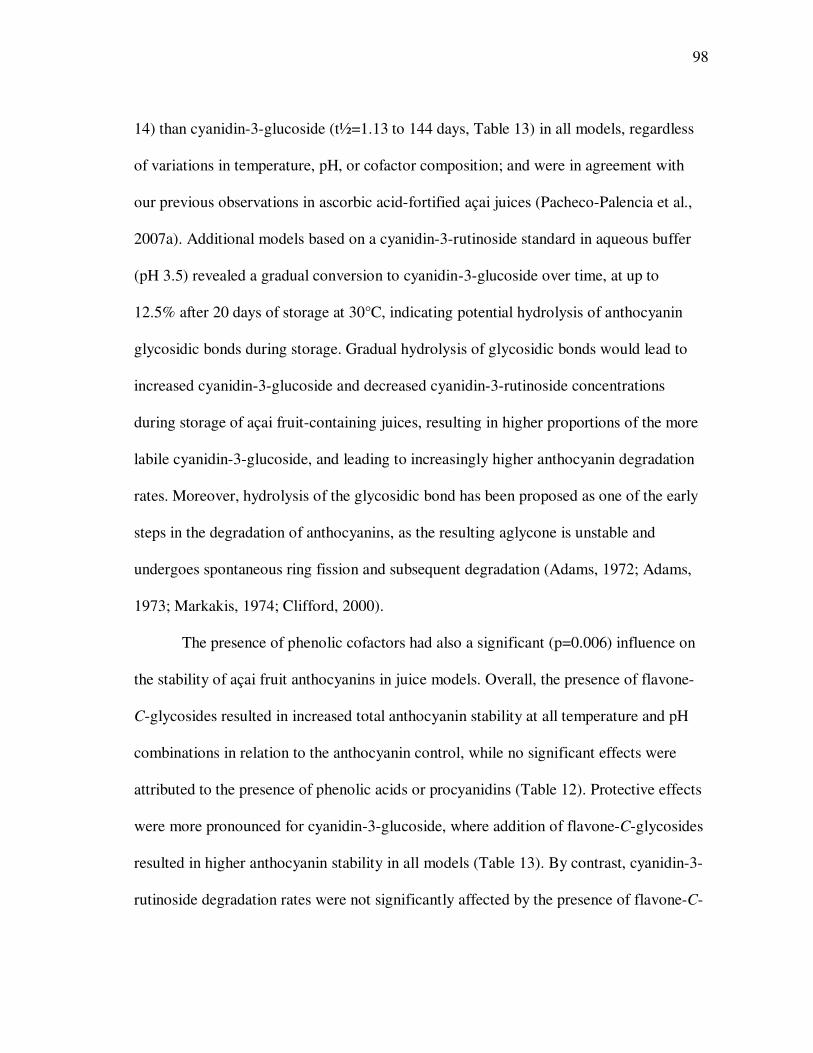
98
14) than cyanidin-3-glucoside (t½=1.13 to 144 days, Table 13) in all models, regardless
of variations in temperature, pH, or cofactor composition; and were in agreement with
our previous observations in ascorbic acid-fortified açai juices (Pacheco-Palencia et al.,
2007a). Additional models based on a cyanidin-3-rutinoside standard in aqueous buffer
(pH 3.5) revealed a gradual conversion to cyanidin-3-glucoside over time, at up to
12.5% after 20 days of storage at 30°C, indicating potential hydrolysis of anthocyanin
glycosidic bonds during storage. Gradual hydrolysis of glycosidic bonds would lead to
increased cyanidin-3-glucoside and decreased cyanidin-3-rutinoside concentrations
during storage of açai fruit-containing juices, resulting in higher proportions of the more
labile cyanidin-3-glucoside, and leading to increasingly higher anthocyanin degradation
rates. Moreover, hydrolysis of the glycosidic bond has been proposed as one of the early
steps in the degradation of anthocyanins, as the resulting aglycone is unstable and
undergoes spontaneous ring fission and subsequent degradation (Adams, 1972; Adams,
1973; Markakis, 1974; Clifford, 2000).
The presence of phenolic cofactors had also a significant (p=0.006) influence on
the stability of açai fruit anthocyanins in juice models. Overall, the presence of flavone-
C-glycosides resulted in increased total anthocyanin stability at all temperature and pH
combinations in relation to the anthocyanin control, while no significant effects were
attributed to the presence of phenolic acids or procyanidins (Table 12). Protective effects
were more pronounced for cyanidin-3-glucoside, where addition of flavone-C-glycosides
resulted in higher anthocyanin stability in all models (Table 13). By contrast, cyanidin-3-
rutinoside degradation rates were not significantly affected by the presence of flavone-C-
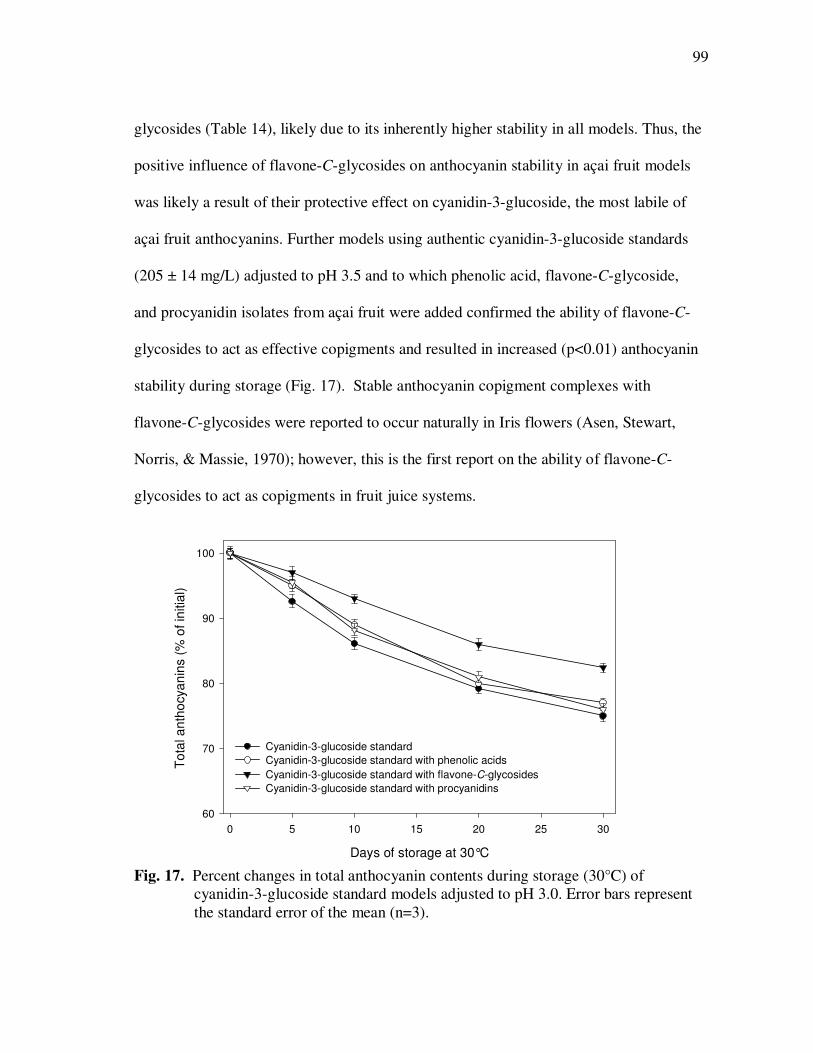
99
Days of storage at 30°C
0 5 10 15 20 25 30
To
tal a
nth
ocya
nin
s (
% o
f in
itia
l)
60
70
80
90
100
Cyanidin-3-glucoside standard
Cyanidin-3-glucoside standard with phenolic acids
Cyanidin-3-glucoside standard with flavone-C-glycosides
Cyanidin-3-glucoside standard with procyanidins
glycosides (Table 14), likely due to its inherently higher stability in all models. Thus, the
positive influence of flavone-C-glycosides on anthocyanin stability in açai fruit models
was likely a result of their protective effect on cyanidin-3-glucoside, the most labile of
açai fruit anthocyanins. Further models using authentic cyanidin-3-glucoside standards
(205 ± 14 mg/L) adjusted to pH 3.5 and to which phenolic acid, flavone-C-glycoside,
and procyanidin isolates from açai fruit were added confirmed the ability of flavone-C-
glycosides to act as effective copigments and resulted in increased (p<0.01) anthocyanin
stability during storage (Fig. 17). Stable anthocyanin copigment complexes with
flavone-C-glycosides were reported to occur naturally in Iris flowers (Asen, Stewart,
Norris, & Massie, 1970); however, this is the first report on the ability of flavone-C-
glycosides to act as copigments in fruit juice systems.
Fig. 17. Percent changes in total anthocyanin contents during storage (30°C) of cyanidin-3-glucoside standard models adjusted to pH 3.0. Error bars represent the standard error of the mean (n=3).
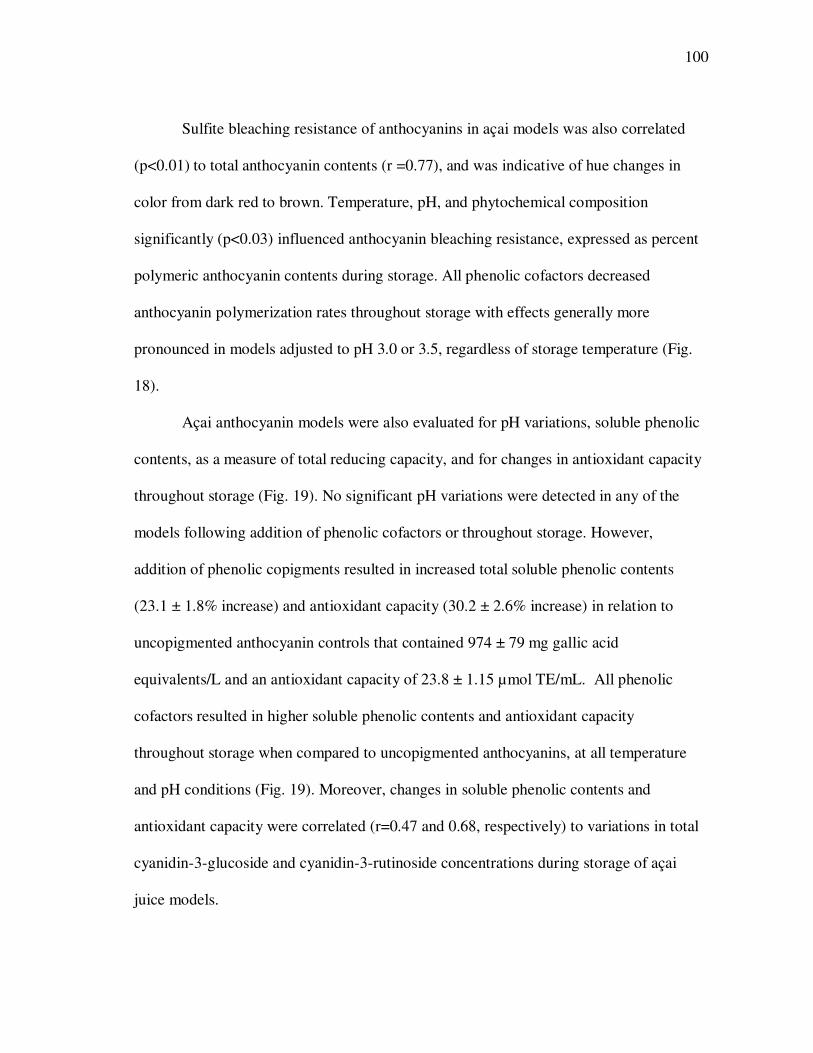
100
Sulfite bleaching resistance of anthocyanins in açai models was also correlated
(p<0.01) to total anthocyanin contents (r =0.77), and was indicative of hue changes in
color from dark red to brown. Temperature, pH, and phytochemical composition
significantly (p<0.03) influenced anthocyanin bleaching resistance, expressed as percent
polymeric anthocyanin contents during storage. All phenolic cofactors decreased
anthocyanin polymerization rates throughout storage with effects generally more
pronounced in models adjusted to pH 3.0 or 3.5, regardless of storage temperature (Fig.
18).
Açai anthocyanin models were also evaluated for pH variations, soluble phenolic
contents, as a measure of total reducing capacity, and for changes in antioxidant capacity
throughout storage (Fig. 19). No significant pH variations were detected in any of the
models following addition of phenolic cofactors or throughout storage. However,
addition of phenolic copigments resulted in increased total soluble phenolic contents
(23.1 ± 1.8% increase) and antioxidant capacity (30.2 ± 2.6% increase) in relation to
uncopigmented anthocyanin controls that contained 974 ± 79 mg gallic acid
equivalents/L and an antioxidant capacity of 23.8 ± 1.15 µmol TE/mL. All phenolic
cofactors resulted in higher soluble phenolic contents and antioxidant capacity
throughout storage when compared to uncopigmented anthocyanins, at all temperature
and pH conditions (Fig. 19). Moreover, changes in soluble phenolic contents and
antioxidant capacity were correlated (r=0.47 and 0.68, respectively) to variations in total
cyanidin-3-glucoside and cyanidin-3-rutinoside concentrations during storage of açai
juice models.
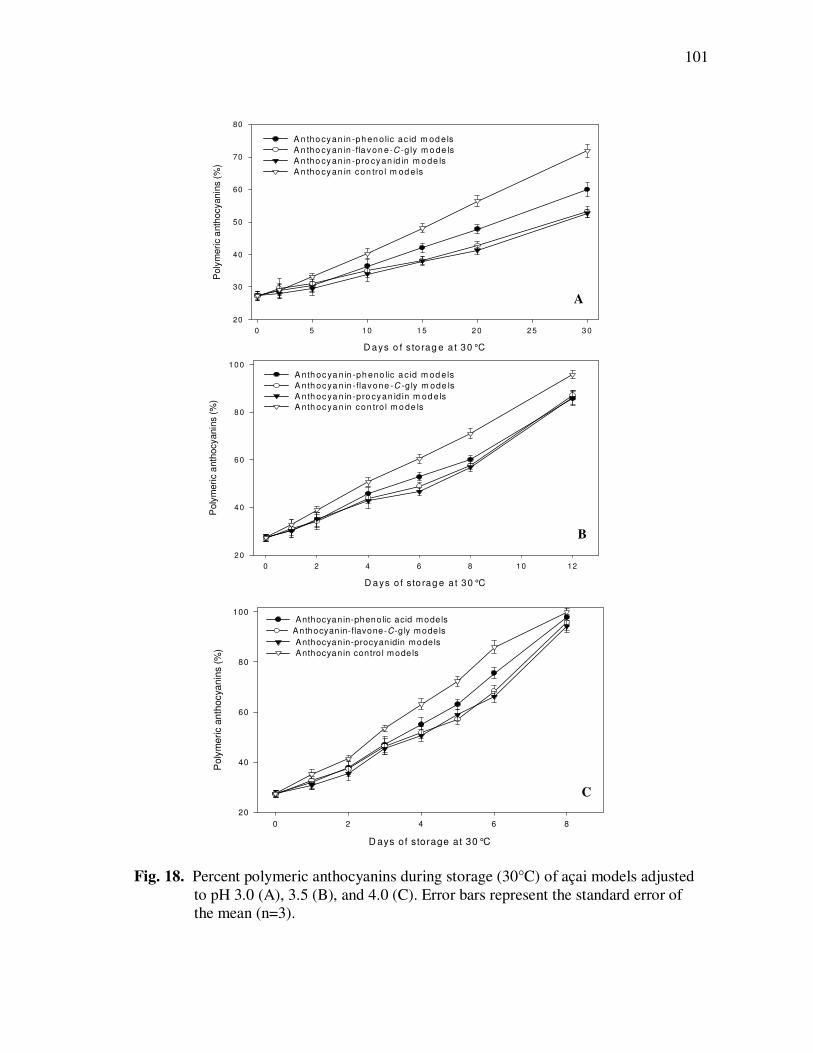
101
Fig. 18. Percent polymeric anthocyanins during storage (30°C) of açai models adjusted to pH 3.0 (A), 3.5 (B), and 4.0 (C). Error bars represent the standard error of the mean (n=3).
D ays of storage at 30°C
0 2 4 6 8
Poly
meric a
nth
ocyanin
s (
%)
20
40
60
80
100Anthocyan in-phenolic acid models
Anthocyan in-flavone-C-g ly models
Anthocyan in-procyan idin models
Anthocyan in contro l models
C
D ays o f s to rag e a t 30°C
0 2 4 6 8 1 0 12
Poly
meri
c a
nth
ocyanin
s (%
)
2 0
4 0
6 0
8 0
1 0 0
A nth ocya n in -ph eno lic a cid m od els
A nth ocya n in -flavone -C -g ly m ode ls
A nth ocya n in -pro cyan id in m od els
A nth ocya n in con tro l m o de ls
D ays o f s to rag e a t 30°C
0 5 1 0 1 5 2 0 2 5 3 0
Poly
meri
c a
nth
ocyanin
s (%
)
20
30
40
50
60
70
80
A n tho cyan in -ph en o lic ac id m od els
A n tho cyan in -fla von e-C -g ly m o de ls
A n tho cyan in -pro cyan id in m o de ls
A n tho cyan in con tro l m od e ls
A
B
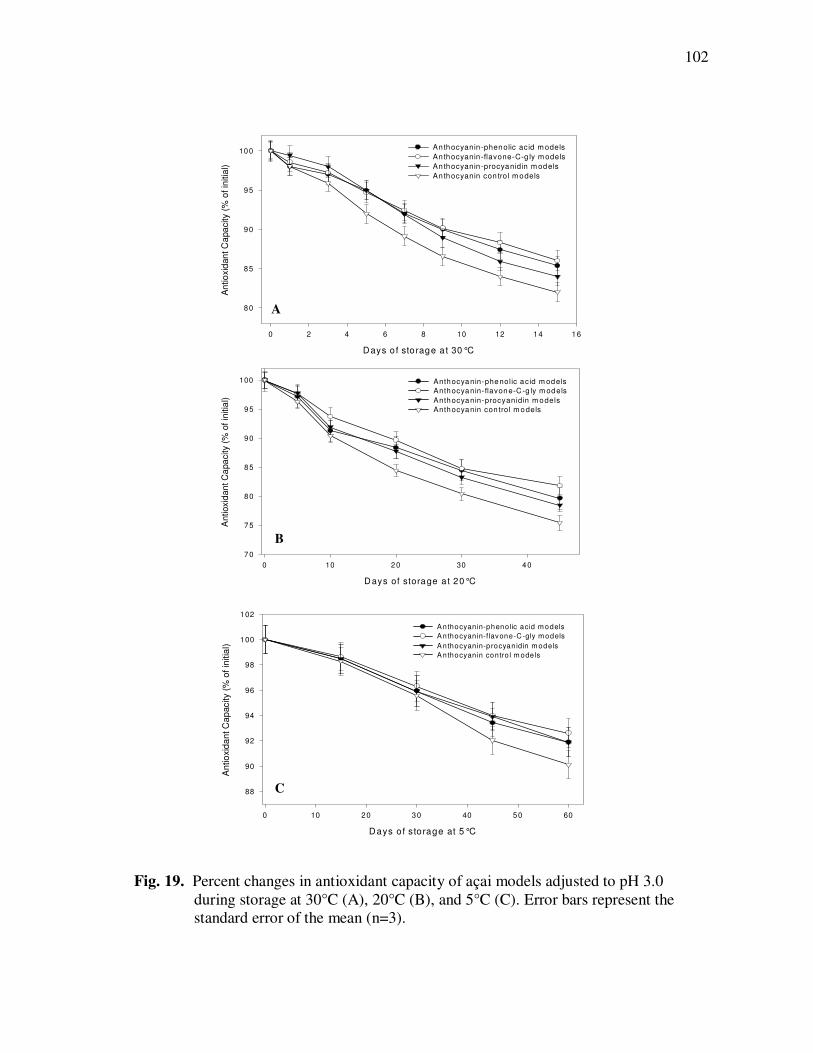
102
Fig. 19. Percent changes in antioxidant capacity of açai models adjusted to pH 3.0
during storage at 30°C (A), 20°C (B), and 5°C (C). Error bars represent the standard error of the mean (n=3).
D ays of storage a t 20°C
0 10 20 30 40
Antioxid
an
t C
apa
city
(% o
f in
itia
l)
70
75
80
85
90
95
100 Anthocyanin-phenolic ac id m odels
Anthocyanin-flavone-C -g ly m odels
Anthocyanin-procyanidin m odels
Anthocyanin con trol m odels
Days of storage at 5°C
0 10 20 30 40 50 60
An
tio
xid
an
t C
ap
acity (
% o
f in
itia
l)
88
90
92
94
96
98
100
102
Anthocyanin-phenolic acid m odels
Anthocyanin-flavone-C-gly m odels
Anthocyanin-procyanidin m odels
Anthocyanin contro l m odels
Days o f sto rage a t 30°C
0 2 4 6 8 10 12 14 16
An
tio
xid
an
t C
apa
city (
% o
f in
itia
l)
80
85
90
95
100Anthocyanin -phenolic acid m odels
An thocyanin -flavone-C-g ly m odels
An thocyanin -procyanidin m odels
An thocyanin con tro l m odels
A
B
C
103
The overall stability of naturally occurring polyphenolic cofactors during storage
of açai anthocyanin models was additionally evaluated. Phenolic acid concentrations
remained unchanged (p<0.05) in models stored at up to 20°C, yet losses were <10% at
30°C. Similarly, flavonol derivatives were stable in models stored at 5°C but
experienced temperature-dependent losses following storage at both 20 and 30°C, of up
to 12.1 ± 1.3% after 30 days, regardless of pH differences. Specifically, the predominant
flavone C-glycosides, orientin and isoorientin, experienced temperature-dependent
losses of up to 11.1% during storage at 5 to 30°C for up to 60 days, while no changes
occurred for the flavone C-glycosides luteolin 6,8-di-C-glucoside, apigenin 6,8-di-C-
glucoside, isovitexin, and scoparin.
The influence of externally added flavone-C-glycoside cofactors on the stability
of anthocyanin isolates from açai fruit was additionally evaluated and compared to a
commercially available anthocyanin color enhancer isolated from rosemary. Extracts
rich in flavone-C-glycosides were obtained from rooibos tea (Aspalathus linearis),
which was previously identified to contain high amounts of flavone-C-glycosides
(Bramati, Minoggio, Gardana, Simonetti, Mauri, & Pietta, 2002; Marnewick, Joubert,
Joseph, Swanevelder, Swart, & Gelderblom, 2005; Krafczyk & Glomb, 2008). Chemical
analyses of rooibos extracts used in these trials revealed the presence of orientin (39.9 ±
2.8%), isoorientin (48.1 ± 3.1%), vitexin (19.9 ± 1.4%), and isovitexin (19.7 ± 1.3%),
along with lower concentrations of C-linked dehydrochalcone glycosides (12.3 ± 1.1%),
likely aspalathin and nothofagin (Marnewick et al., 2005; Krafczyk & Glomb, 2008).
Copigmentation of anthocyanin isolates with rooibos extracts (0.2% v/v) resulted in
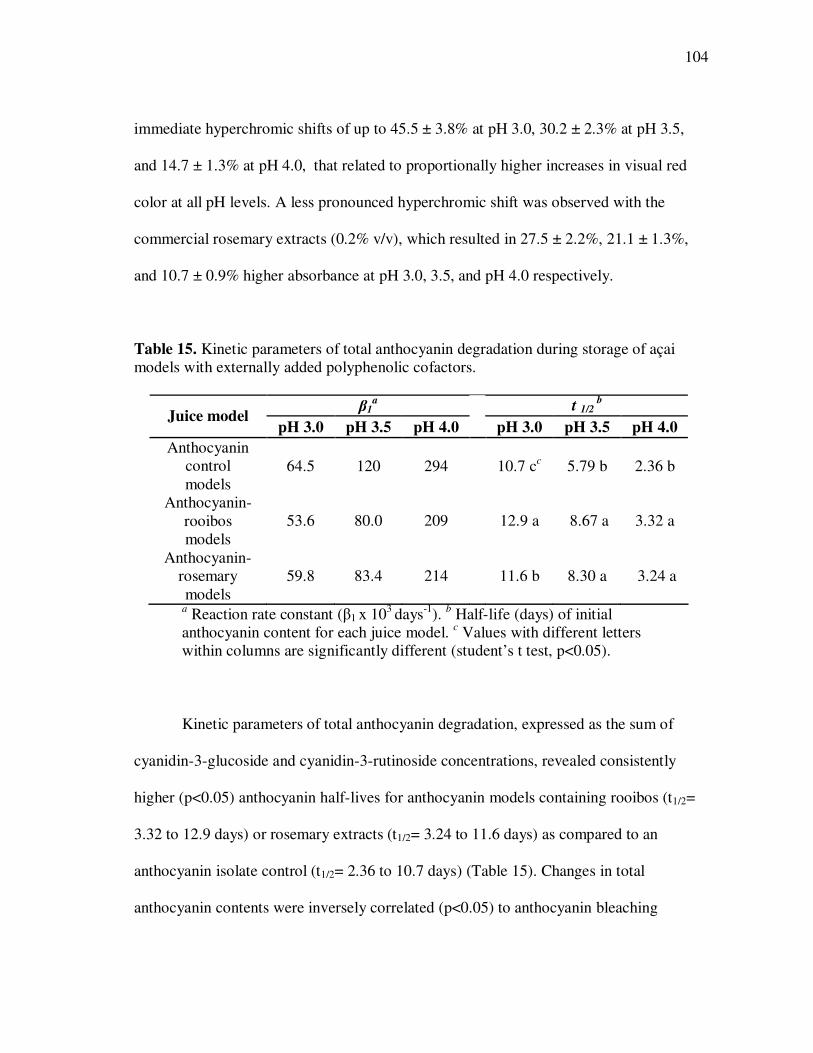
104
immediate hyperchromic shifts of up to 45.5 ± 3.8% at pH 3.0, 30.2 ± 2.3% at pH 3.5,
and 14.7 ± 1.3% at pH 4.0, that related to proportionally higher increases in visual red
color at all pH levels. A less pronounced hyperchromic shift was observed with the
commercial rosemary extracts (0.2% v/v), which resulted in 27.5 ± 2.2%, 21.1 ± 1.3%,
and 10.7 ± 0.9% higher absorbance at pH 3.0, 3.5, and pH 4.0 respectively.
Table 15. Kinetic parameters of total anthocyanin degradation during storage of açai models with externally added polyphenolic cofactors.
β1a t 1/2
b
Juice model pH 3.0 pH 3.5 pH 4.0 pH 3.0 pH 3.5 pH 4.0
Anthocyanin control models
64.5 120 294 10.7 cc 5.79 b 2.36 b
Anthocyanin- rooibos models
53.6 80.0 209 12.9 a 8.67 a 3.32 a
Anthocyanin-rosemary models
59.8 83.4 214 11.6 b 8.30 a 3.24 a
a Reaction rate constant (β1 x 10³ days-1). b Half-life (days) of initial anthocyanin content for each juice model. c Values with different letters within columns are significantly different (student’s t test, p<0.05). Kinetic parameters of total anthocyanin degradation, expressed as the sum of
cyanidin-3-glucoside and cyanidin-3-rutinoside concentrations, revealed consistently
higher (p<0.05) anthocyanin half-lives for anthocyanin models containing rooibos (t1/2=
3.32 to 12.9 days) or rosemary extracts (t1/2= 3.24 to 11.6 days) as compared to an
anthocyanin isolate control (t1/2= 2.36 to 10.7 days) (Table 15). Changes in total
anthocyanin contents were inversely correlated (p<0.05) to anthocyanin bleaching
105
resistance (r=0.72) and directly correlated to antioxidant capacity (r=0.65). Thus,
addition of rooibos extracts, rich in flavone-C-glycosides, not only resulted in higher
color intensities but also increased anthocyanin stability during long-term storage (30°C)
of juice models, in a comparable manner to a known copigment source such as rosemary
extract, indicating its potential for anthocyanin stabilization in açai-containing foods,
juice blends and beverages.
Conclusion
The influence of naturally occurring and externally added polyphenolic cofactors
on the chemical and color stability of predominant anthocyanins in açai fruit (Euterpe
oleracea), cyanidin-3-glucoside and cyanidin-3-rutinoside, was investigated. Overall, the
presence of flavone-C-glycosides induced an increase in anthocyanin color and
enhanced total anthocyanin stability, regardless of pH (3.0, 3.5, or 4.0) or storage
temperature (5, 20, or 30°C), while no significant effects were attributed to the presence
of phenolic acids or procyanidins. External addition of flavone-C-glycoside-rich extracts
from rooibos tea also resulted in up to ~45% higher anthocyanin color and up to ~40%
higher anthocyanin stability compared to uncopigmented anthocyanin isolates, and had
similar copigmentation effects to a commercial anthocyanin color enhancer extracted
from rosemary. Results suggest flavone-C-glycosides are a potential alternative for the
food and beverage industry for their use as color enhancers and stabilizing agents in
products containing non-acylated cyanidin glycosides, particularly açai fruit juice blends
and beverages.
106
CHAPTER VII
PHYTOCHEMICAL MODELS FOR ANTHOCYANIN POLYMERIZATION
REACTIONS IN AÇAI JUICE SYSTEMS
Introduction
Anthocyanins are among the most widely distributed naturally occurring
pigments in plants, and represent a major source of red, blue, and purple hues in many
fruit products. Anthocyanin color is often a major quality parameter in many fruit juices
and functional beverages, influencing consumer’s preference, acceptability, and
ultimately choice of a particular product. American consumers spend over $4.5 billion
annually in natural fruit juices, and an additional $10 billion in functional beverages
(Mintel International U.S. Functional Beverage Report, 2008), with nearly 20% of
products containing anthocyanins. However, anthocyanin pigment stability during
processing and storage remains a major problem facing beverage manufacturers.
Anthocyanin stability during processing and storage is known to be influenced by a wide
variety of factors, including anthocyanin structure and concentration, pH, temperature,
light, and the presence of enzymes, oxygen, metal ions, ascorbic acid, sugar and their
degradation products (Rodriguez-Saona et al., 1999; Stingzing et al., 2002). Moreover,
anthocyanin polymerization reactions during storage negatively impact appearance and
quality attributes, as hue transformations occur, from bright red to dark, dull, brick-red
colors (Baranac et al., 1996; Monagas et al., 2006).
107
Polymerization reactions in anthocyanin-containing juices and their effects on
sensory properties are generally acknowledged, yet reaction mechanisms and nature of
the products formed are still poorly understood. Anthocyanin polymerization reactions
have been particularly studied in aged red wines, where three basic types of
anthocyanin-derived pigments have been described: ethyl-linked condensed products
resulting from aldehyde-mediated reactions between anthocyanins and flavanols (Berg &
Akiyoshi, 1975; Timberlake & Bridle, 1976; Rivas-Gonzalo, Bravo-Haro, & Santos-
Buelga, 1995; Dallas, Ricardo-da-Silva, & Laureano, 1996; Francia-Aricha, Guerra,
Rivas-Gonzalo, & Santos-Buelga, 1997; Es-Safi et al., 2000; Es-Safi et al., 2002), 4-
substituted anthocyanin-vinylphenol adducts (pyranoanthocyanins), containing
additional pyrano rings (Fulcrand, Cameira do Santos, Sarni-Manchado, Cheynier, &
Bonvin, 1996; Bakker & Timberlake, 1997; Francia-Aricha et al., 1997; Swarz, Wabnitz,
& Winterhalter, 2003; Rein, Ollilainen, Vahermo, Yli-Kauhaluoma, & Heinonen, 2005;
Oliveira et al., 2006), and anthocyanin-flavanol condensed products (Jurd, 1967; Mateus,
Silva, Santos-Buelga, Rivas-Gonzalo, & De Freitas, 2002; Salas, Fulcrand, Meudec, &
Cheynier, 2003; Remy-Tanneau, Le Guerneve, Meudec, & Cheynier, 2003; Salas,
Atanasova, Poncet-Legrand, Meudec, Mazauric, & Cheynier, 2004a; Gonzalez-Paramas
et al., 2006). However, reactions involved in the formation of anthocyanin polymers in
fruit juices are largely unknown. Based on our previous reports (Pacheco-Palencia et al.,
2007a; Pacheco-Palencia et al., 2007b), açai (Euterpe oleracea Mart.) fruit juices seem
to be particularly prone to accelerated anthocyanin polymerization reactions during
storage, giving rise to undesirable brown hues in açai-containing products. As a result,
108
the aim of this work was to elucidate potential precursors and mechanisms for
anthocyanin polymerization reactions in açai fruit juice systems, provide structural
information on the products formed, and evaluate their ability to occur in açai fruit
juices. Results from these investigations may assist in the development of strategies to
enhance color and quality stability of similar anthocyanin-containing products.
Materials and Methods
Anthocyanin models were based on isolates extracted from 100% açai fruit pulp.
Pasteurized açai pulp was kindly donated by Bossa Nova Beverage Group (Los Angeles,
CA) and shipped frozen to the Department of Nutrition and Food Science at Texas A&M
University. Prior to anthocyanin isolation, açai pulp was clarified according to a
previously described procedure (Pacheco-Palencia et al., 2007b) to remove lipids and
insoluble solids. Clarified açai pulp was then loaded onto activated C18 Sep-Pak 6 cc
cartridges (Waters Corporation, Milford, MA), and eluted repeatedly with water, to
remove sugars, organic acids, metals, and proteins. Elution with ethyl acetate followed,
removing phenolic acids and most non-anthocyanin flavonoids (Pacheco-Palencia et al.,
2007a), and anthocyanins were finally recovered with acidified methanol (0.01% HCl).
Methanol was evaporated under vacuum (<40°C), and the resulting anthocyanin isolate
redissolved in a 0.1M citric acid buffer (pH 3.0) and adsorbed onto a second C18 Sep-
Pak cartridge (Waters Corporation, Milford, MA). A protocol adapted from the
separation of anthocyanins containing o-diphenolic systems, in which anthocyanins
containing an o-diphenolic system form negatively charged complexes in alkaline borate
109
solutions (Hong & Wrolstad, 1990), was employed. Briefly, the loaded C18 cartridge
was continuously rinsed with an alkaline borate solution (0.1 N, pH 9.0), until a
colorless eluent was obtained. Eluted anthocyanins (monomers) were recovered and
immediately reconverted into their red oxonium salt forms by dilution with 4N HCl.
Anthocyanins remaining on the cartridge (polymers) were finally eluted with acidified
methanol (0.01% HCl), concentrated under vacuum at <40°C until complete solvent
removal, and reconstituted in a 0.1 M citric acid buffer (pH 3.0) for use in model
systems. Anthocyanin monomers were further concentrated using a third C18 Sep-Pak
cartridge, from which anthocyanins were recovered with 0.01% HCl in methanol,
subjected to complete solvent evaporation under vacuum (<40°C), and likewise
reconstituted in a 0.1 M citric acid buffer (pH 3.0) for use in model systems.
Anthocyanin monomer and polymer isolates were finally standardized to 500 mg
cyanidin-3-glucoside equivalents/L, determined spectrophotometrically, as previously
described in chapter VI.
Anthocyanin model systems consisted of mixtures of anthocyanin monomer and
polymer fractions combined in varying proportions (10:90, 20:80, 30:70, and 50:50
polymer-to-monomer fraction ratio), along with a 100% anthocyanin monomer control.
Each model was adjusted to pH 3.5, loaded into screw-cap glass test tubes in triplicate,
and stored at 35°C for up to 20 days. Sodium azide (50 mg/L) was added to all
treatments to retard microbial growth and pH was maintained constant throughout
storage. Models were sampled every 2-3 days and samples were held at -20°C until
analysis.
110
A similar approach was used to assess the influence of açai polymers on
authentic cyanidin-3-glucoside standards and on blackberry anthocyanin isolates, which
were independently combined with açai polymers in 1:9 (10%), 1:4 (20%), 1:2 (33%),
and 1:1 (50%) polymer-to-anthocyanin ratios, in addition to an anthocyanin control.
Models were likewise adjusted to pH 3.5, stored at 35°C for up to 20 days, sampled
every 2-3 days, and immediately analyzed or held at -20°C until analysis. Blackberry
anthocyanins were extracted from a commercial blackberry concentrate (Glcc Co., Paw
Paw, MI), which were diluted with water, loaded onto C18 Sep-Pak cartridges, eluted
with ethyl acetate (for non-anthocyanin polyphenolic removal), and recovered with
acidified methanol (0.01% HCl). The solvent was evaporated under vacuum (<40°C)
and the resulting isolate redissolved in a known volume of citric acid buffer (0.1M, pH
3.5) prior use in anthocyanin models. Anthocyanin monomer and polymer fractions were
subjected to acid hydrolysis (90°C, 2N HCl) to assist their characterization. Sample
aliquots were loaded onto tightly sealed screw-cap glass test tubes, heated in a water
bath at 90°C for 30 min, and immediately analyzed on the HPLC-ESI-MSn system.
Polymeric anthocyanin fractions were thiolyzed to provide further structural data.
Thiolysis of polymeric anthocyanin fractions was based on the method by Guyot,
Marnet, & Drilleau (2001) and Gu et al. (2002). Briefly, 100 µL of sample (adjusted to
~2,000 mg/L in methanol) was mixed with 100 µL of acidified methanol (3.3% v/v HCl)
and 200 µL of benzyl mercaptan (5% v/v in methanol), in a 2.0 mL glass vial (National
Scientific, Rockwood, TN). The mixture was reacted for 30 min at 40°C, kept at room
temperature for 12 h to ensure complete degradation, and kept frozen (-18°C) until direct
111
HPLC analysis. Pure (+)-catechin and (-)-epicatechin solutions were also thiolyzed in
each batch to obtain their respective epimerization rates.
Polyphenolics present in monomeric and polymeric anthocyanin fractions were
analyzed by HPLC-ESI-MSn. Tandem reversed phase HPLC and mass spectrometry
analyses were conducted using a Thermo Finnigan LCQ Deca XP Max MSn ion trap
mass spectrometer equipped with an ESI ion source (Thermo Fisher, San Jose, CA).
Separations were performed on an Acclaim 120 5µm 120Å (4.6 x 250 mm) column and
mobile phases consisted of 0.5% formic acid in water (phase A) and 0.5% formic acid in
methanol (phase B) run at 0.6 mL/min. Polyphenolics were separated with a gradient
elution program in which phase B changed from 5 to 10% in 3 min, from 10 to 30% in
the following 17 min, from 30 to 50% in the following 20 min, from 50 to 70% in the
following 15 min, and from 70 to 100% in the following 10 min. Initial conditions were
then restored within 1 min, and held constant for 20 min prior each injection. Ionization
was conducted in the negative ion mode under the following conditions: sheath gas (N2),
60 units/min; auxiliary gas (N2), 10 units/min; spray voltage, 3.5 kV; capillary
temperature, 350 °C; capillary voltage, 1.5 V; tube lens offset, 0 V. Identification and
quantitation of polyphenolics was based on their spectral characteristics, retention time,
and mass spectrometric properties, which were compared to authentic standards when
available (Indofine Chemical Company, Hillsborough, NJ, and Sigma Chemical Co., St.
Louis, MO).
Antioxidant capacity was determined by the oxygen radical absorbance capacity
assay using a BMG Labtech FLUOstar fluorescent microplate reader (485 nm excitation
112
and 538 nm emission), as previously described in chapter III, and results were quantified
in µmol Trolox equivalents (TE)/mL. Total anthocyanin contents and anthocyanin sulfite
bleaching resistance were determined spectrophotometrically at 520 nm, according to the
procedures described in chapter VI, and quantified using equivalents of cyanidin-3-
glucoside (mg/L).
Statistical analyses were conducted independently for each anthocyanin source
(açai, blackberry, or anthocyanin standard). Data from each analysis was analyzed by
one-way analysis of variance (ANOVA) using SPSS version 15.0 (SPSS Inc., Chicago,
IL), conducting post-hoc Tukey-Kramer HSD mean separations (p<0.05). A significance
level of 0.05 was used for parametric correlations and linear stepwise regression models.
Results and Discussion
Polyphenolic composition of monomeric and polymeric anthocyanin fractions
from açai was assessed by HPLC-ESI-MSn analyses and characterized according to
elution time, spectral properties, and MS fragmentation patterns. The term “monomeric”
was used for fractions rich in anthocyanin glycosides, eluting as individual, resolved
peaks, while the term “polymeric” referred to those fractions characterized by a
prolonged, large, unresolved baseline, in the 500-530 nm range of HPLC
chromatograms. Polyphenolics present in monomeric anthocyanin fractions (Table 16)
were characterized as follow:
Peaks 1, 2, 4, and 5 were tentatively assigned to flavonol glycosides, potentially
kaempferol (m/z 609.1, [M-H]-) and quercetin (m/z 609.2, 463.2, 609.1, [M-H]-) mono
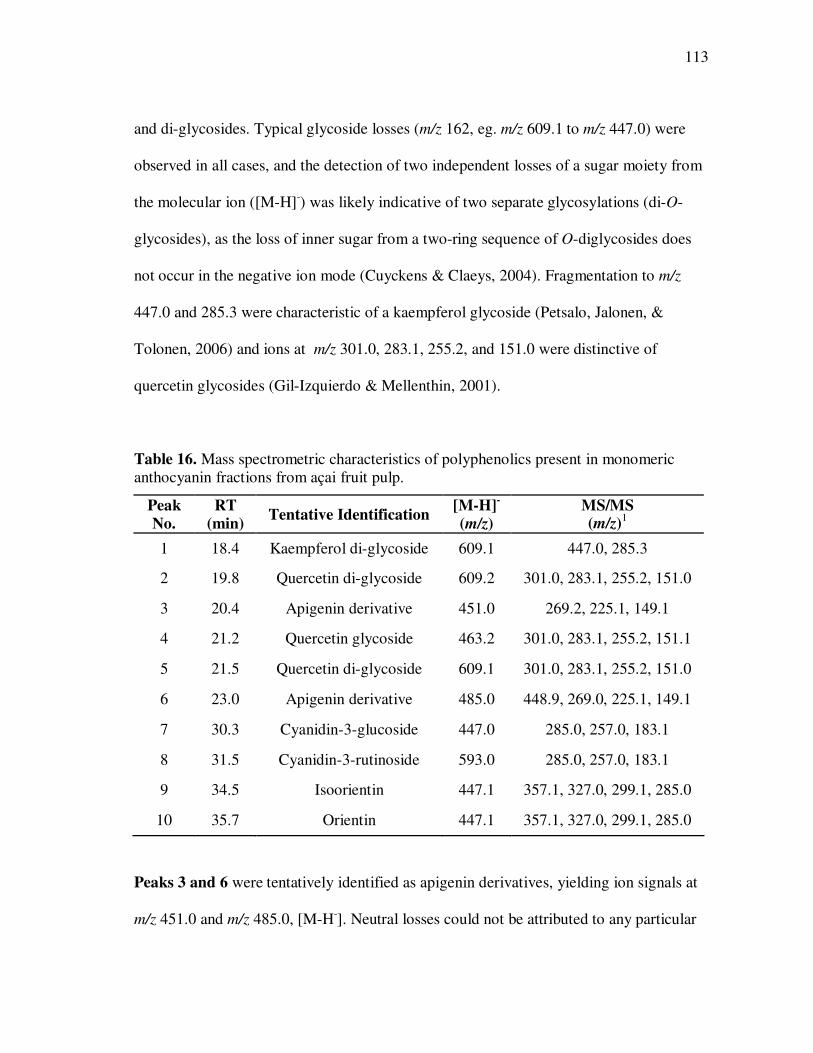
113
and di-glycosides. Typical glycoside losses (m/z 162, eg. m/z 609.1 to m/z 447.0) were
observed in all cases, and the detection of two independent losses of a sugar moiety from
the molecular ion ([M-H]-) was likely indicative of two separate glycosylations (di-O-
glycosides), as the loss of inner sugar from a two-ring sequence of O-diglycosides does
not occur in the negative ion mode (Cuyckens & Claeys, 2004). Fragmentation to m/z
447.0 and 285.3 were characteristic of a kaempferol glycoside (Petsalo, Jalonen, &
Tolonen, 2006) and ions at m/z 301.0, 283.1, 255.2, and 151.0 were distinctive of
quercetin glycosides (Gil-Izquierdo & Mellenthin, 2001).
Table 16. Mass spectrometric characteristics of polyphenolics present in monomeric anthocyanin fractions from açai fruit pulp.
Peak No.
RT (min)
Tentative Identification [M-H]
-
(m/z) MS/MS (m/z)
1
1 18.4 Kaempferol di-glycoside 609.1 447.0, 285.3
2 19.8 Quercetin di-glycoside 609.2 301.0, 283.1, 255.2, 151.0
3 20.4 Apigenin derivative 451.0 269.2, 225.1, 149.1
4 21.2 Quercetin glycoside 463.2 301.0, 283.1, 255.2, 151.1
5 21.5 Quercetin di-glycoside 609.1 301.0, 283.1, 255.2, 151.0
6 23.0 Apigenin derivative 485.0 448.9, 269.0, 225.1, 149.1
7 30.3 Cyanidin-3-glucoside 447.0 285.0, 257.0, 183.1
8 31.5 Cyanidin-3-rutinoside 593.0 285.0, 257.0, 183.1
9 34.5 Isoorientin 447.1 357.1, 327.0, 299.1, 285.0
10 35.7 Orientin 447.1 357.1, 327.0, 299.1, 285.0
Peaks 3 and 6 were tentatively identified as apigenin derivatives, yielding ion signals at
m/z 451.0 and m/z 485.0, [M-H-]. Neutral losses could not be attributed to any particular
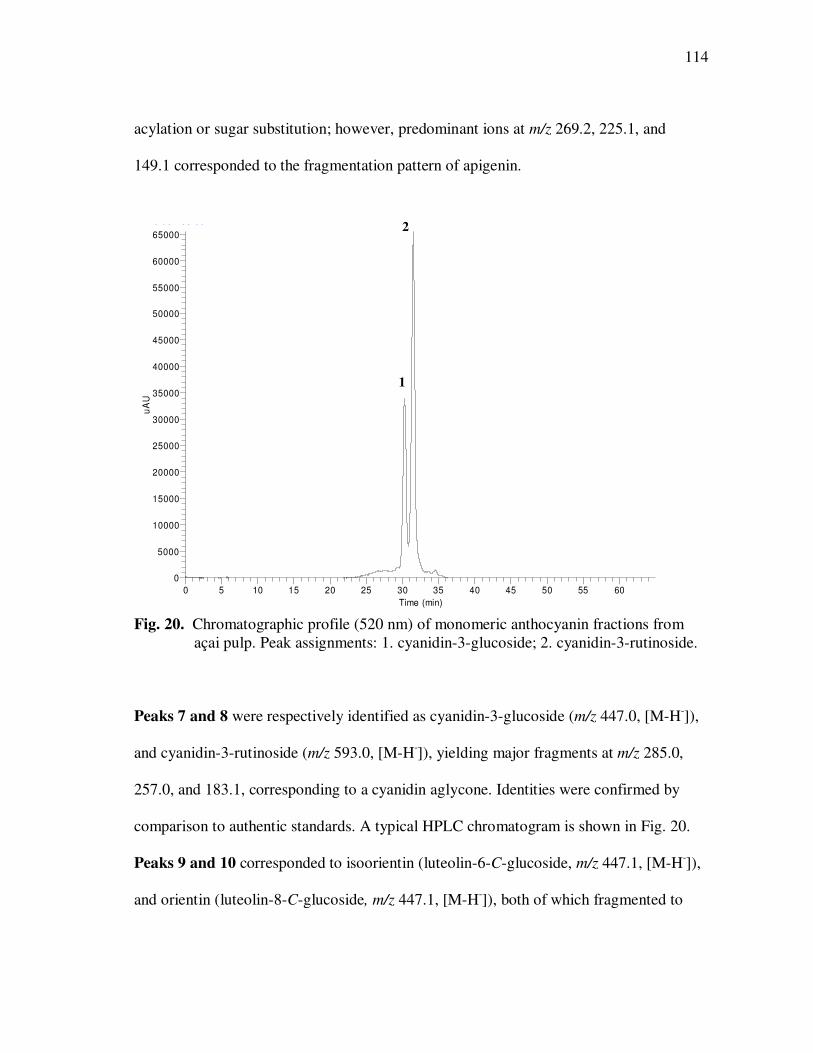
114
acylation or sugar substitution; however, predominant ions at m/z 269.2, 225.1, and
149.1 corresponded to the fragmentation pattern of apigenin.
Fig. 20. Chromatographic profile (520 nm) of monomeric anthocyanin fractions from
açai pulp. Peak assignments: 1. cyanidin-3-glucoside; 2. cyanidin-3-rutinoside. Peaks 7 and 8 were respectively identified as cyanidin-3-glucoside (m/z 447.0, [M-H-]),
and cyanidin-3-rutinoside (m/z 593.0, [M-H-]), yielding major fragments at m/z 285.0,
257.0, and 183.1, corresponding to a cyanidin aglycone. Identities were confirmed by
comparison to authentic standards. A typical HPLC chromatogram is shown in Fig. 20.
Peaks 9 and 10 corresponded to isoorientin (luteolin-6-C-glucoside, m/z 447.1, [M-H-]),
and orientin (luteolin-8-C-glucoside, m/z 447.1, [M-H-]), both of which fragmented to
RT: 0.00 - 65.00
0 5 10 15 20 25 30 35 40 45 50 55 60 65
Time (min)
0
5000
10000
15000
20000
25000
30000
35000
40000
45000
50000
55000
60000
65000
uA
U
1
2
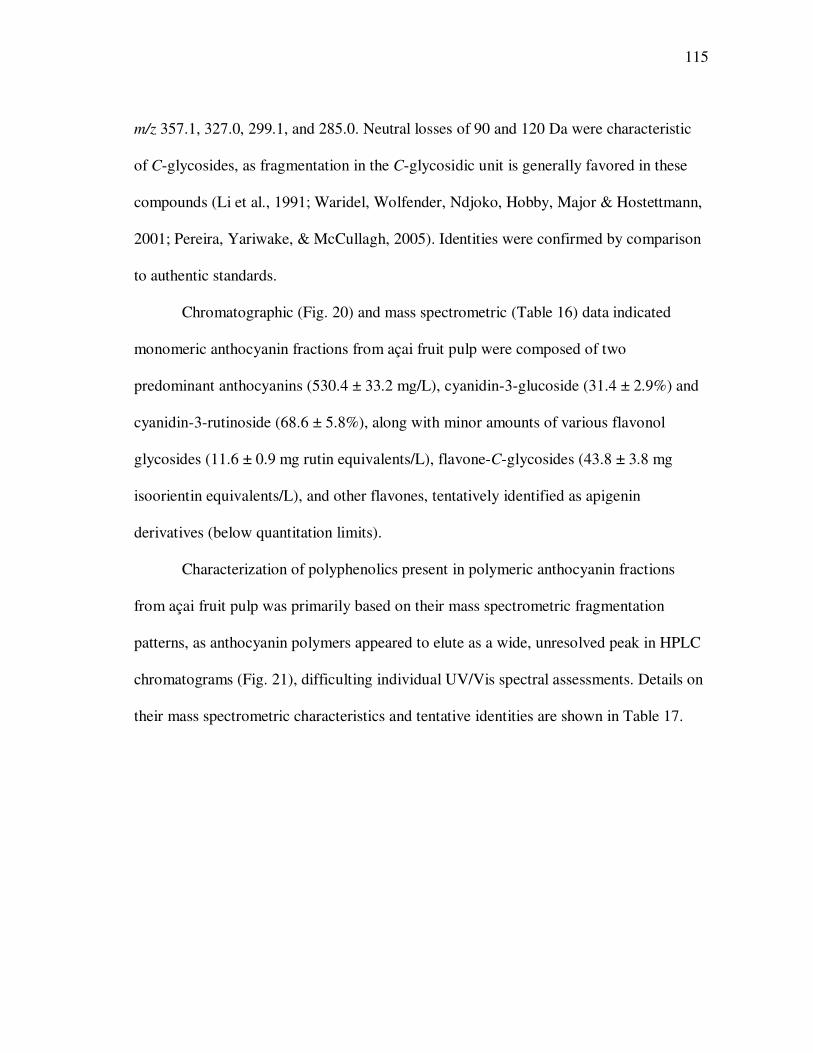
115
m/z 357.1, 327.0, 299.1, and 285.0. Neutral losses of 90 and 120 Da were characteristic
of C-glycosides, as fragmentation in the C-glycosidic unit is generally favored in these
compounds (Li et al., 1991; Waridel, Wolfender, Ndjoko, Hobby, Major & Hostettmann,
2001; Pereira, Yariwake, & McCullagh, 2005). Identities were confirmed by comparison
to authentic standards.
Chromatographic (Fig. 20) and mass spectrometric (Table 16) data indicated
monomeric anthocyanin fractions from açai fruit pulp were composed of two
predominant anthocyanins (530.4 ± 33.2 mg/L), cyanidin-3-glucoside (31.4 ± 2.9%) and
cyanidin-3-rutinoside (68.6 ± 5.8%), along with minor amounts of various flavonol
glycosides (11.6 ± 0.9 mg rutin equivalents/L), flavone-C-glycosides (43.8 ± 3.8 mg
isoorientin equivalents/L), and other flavones, tentatively identified as apigenin
derivatives (below quantitation limits).
Characterization of polyphenolics present in polymeric anthocyanin fractions
from açai fruit pulp was primarily based on their mass spectrometric fragmentation
patterns, as anthocyanin polymers appeared to elute as a wide, unresolved peak in HPLC
chromatograms (Fig. 21), difficulting individual UV/Vis spectral assessments. Details on
their mass spectrometric characteristics and tentative identities are shown in Table 17.
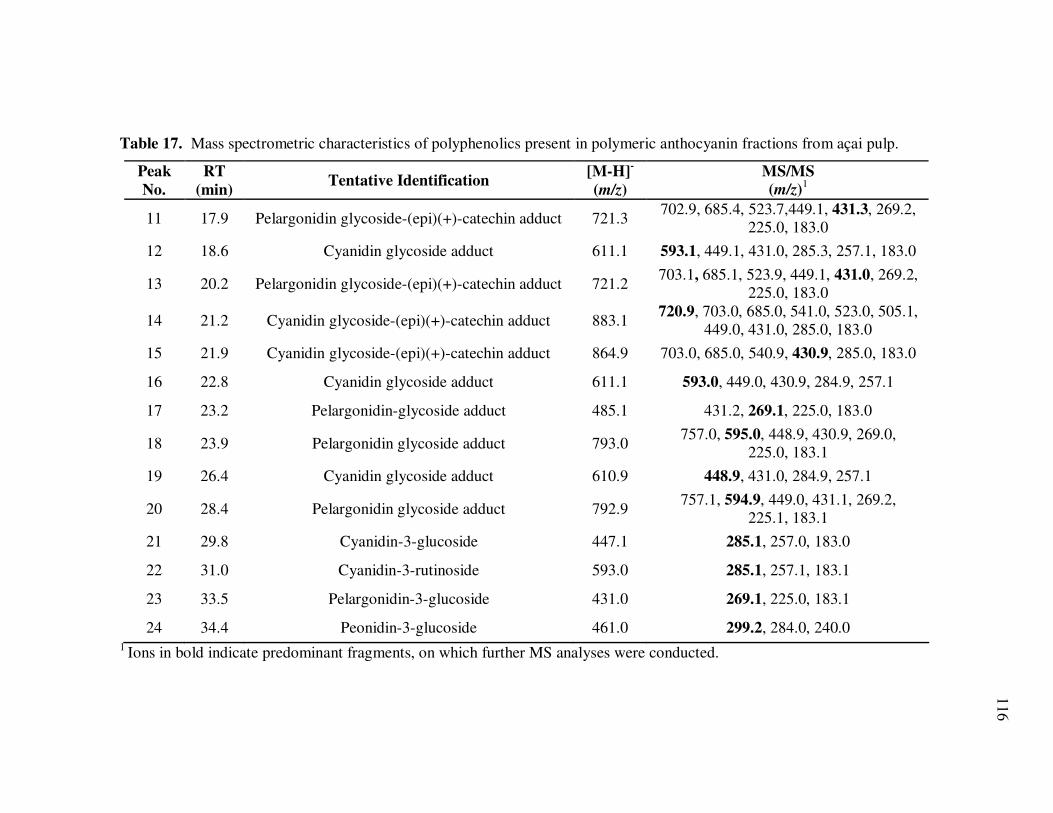
116
Table 17. Mass spectrometric characteristics of polyphenolics present in polymeric anthocyanin fractions from açai pulp.
Peak
No.
RT
(min) Tentative Identification
[M-H]-
(m/z)
MS/MS
(m/z)1
11 17.9 Pelargonidin glycoside-(epi)(+)-catechin adduct 721.3 702.9, 685.4, 523.7,449.1, 431.3, 269.2,
225.0, 183.0
12 18.6 Cyanidin glycoside adduct 611.1 593.1, 449.1, 431.0, 285.3, 257.1, 183.0
13 20.2 Pelargonidin glycoside-(epi)(+)-catechin adduct 721.2 703.1, 685.1, 523.9, 449.1, 431.0, 269.2,
225.0, 183.0
14 21.2 Cyanidin glycoside-(epi)(+)-catechin adduct 883.1 720.9, 703.0, 685.0, 541.0, 523.0, 505.1,
449.0, 431.0, 285.0, 183.0
15 21.9 Cyanidin glycoside-(epi)(+)-catechin adduct 864.9 703.0, 685.0, 540.9, 430.9, 285.0, 183.0
16 22.8 Cyanidin glycoside adduct 611.1 593.0, 449.0, 430.9, 284.9, 257.1
17 23.2 Pelargonidin-glycoside adduct 485.1 431.2, 269.1, 225.0, 183.0
18 23.9 Pelargonidin glycoside adduct 793.0 757.0, 595.0, 448.9, 430.9, 269.0,
225.0, 183.1
19 26.4 Cyanidin glycoside adduct 610.9 448.9, 431.0, 284.9, 257.1
20 28.4 Pelargonidin glycoside adduct 792.9 757.1, 594.9, 449.0, 431.1, 269.2,
225.1, 183.1
21 29.8 Cyanidin-3-glucoside 447.1 285.1, 257.0, 183.0
22 31.0 Cyanidin-3-rutinoside 593.0 285.1, 257.1, 183.1
23 33.5 Pelargonidin-3-glucoside 431.0 269.1, 225.0, 183.1
24 34.4 Peonidin-3-glucoside 461.0 299.2, 284.0, 240.0 1 Ions in bold indicate predominant fragments, on which further MS analyses were conducted.
117
Fig. 21. Chromatographic profile (520 nm) of polymeric anthocyanin fractions from
açai pulp. Peak assignments: 1. cyanidin-3-glucoside; 2. cyanidin-3-rutinoside; 3. pelargonidin-3-glucoside; and 4. peonidin-3-glucoside.
Peaks 11 and 13 were tentatively identified as a pelargonidin-3-glucoside-(+)-catechin
adducts, yielding predominant ions at m/z 766.3 (formate adduct, [M-H+HCOO]-) and
m/z 721.1 ([M-H]-). Subsequent water losses yielded ions at m/z 703.1 and m/z 685.4
respectively, followed by a neutral loss of 161 Da, possibly due to retro-diels-alder
cleavage of a phenolic C-ring, and subsequent loss of B and C rings. This fragmentation
pathway was consistent with that observed for a (+)-catechin standard, where retro-diels-
alder cleavage of the C-ring resulted in signals at m/z 161.0, most likely a fragment of B
and C rings, and m/z 125.0, probably due to the unmodified A ring of the (+)-catechin
structure, in agreement with previous reports on (+)-catechin and (-)-epicatechin
RT: 0.00 - 65.00
0 5 10 15 20 25 30 35 40 45 50 55 60 65
Time (min)
0
2000
4000
6000
8000
10000
12000
14000
16000
18000
20000
22000
24000
uA
U 1
2
3
4
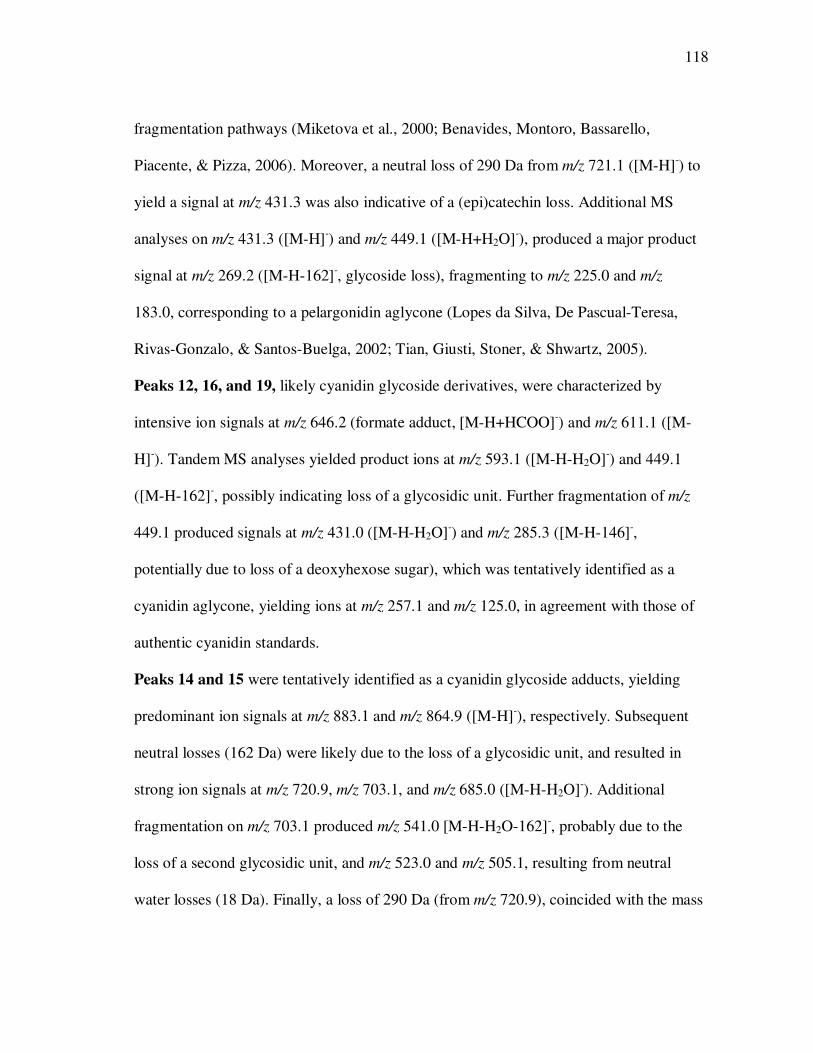
118
fragmentation pathways (Miketova et al., 2000; Benavides, Montoro, Bassarello,
Piacente, & Pizza, 2006). Moreover, a neutral loss of 290 Da from m/z 721.1 ([M-H]-) to
yield a signal at m/z 431.3 was also indicative of a (epi)catechin loss. Additional MS
analyses on m/z 431.3 ([M-H]-) and m/z 449.1 ([M-H+H2O]-), produced a major product
signal at m/z 269.2 ([M-H-162]-, glycoside loss), fragmenting to m/z 225.0 and m/z
183.0, corresponding to a pelargonidin aglycone (Lopes da Silva, De Pascual-Teresa,
Rivas-Gonzalo, & Santos-Buelga, 2002; Tian, Giusti, Stoner, & Shwartz, 2005).
Peaks 12, 16, and 19, likely cyanidin glycoside derivatives, were characterized by
intensive ion signals at m/z 646.2 (formate adduct, [M-H+HCOO]-) and m/z 611.1 ([M-
H]-). Tandem MS analyses yielded product ions at m/z 593.1 ([M-H-H2O]-) and 449.1
([M-H-162]-, possibly indicating loss of a glycosidic unit. Further fragmentation of m/z
449.1 produced signals at m/z 431.0 ([M-H-H2O]-) and m/z 285.3 ([M-H-146]-,
potentially due to loss of a deoxyhexose sugar), which was tentatively identified as a
cyanidin aglycone, yielding ions at m/z 257.1 and m/z 125.0, in agreement with those of
authentic cyanidin standards.
Peaks 14 and 15 were tentatively identified as a cyanidin glycoside adducts, yielding
predominant ion signals at m/z 883.1 and m/z 864.9 ([M-H]-), respectively. Subsequent
neutral losses (162 Da) were likely due to the loss of a glycosidic unit, and resulted in
strong ion signals at m/z 720.9, m/z 703.1, and m/z 685.0 ([M-H-H2O]-). Additional
fragmentation on m/z 703.1 produced m/z 541.0 [M-H-H2O-162]-, probably due to the
loss of a second glycosidic unit, and m/z 523.0 and m/z 505.1, resulting from neutral
water losses (18 Da). Finally, a loss of 290 Da (from m/z 720.9), coincided with the mass
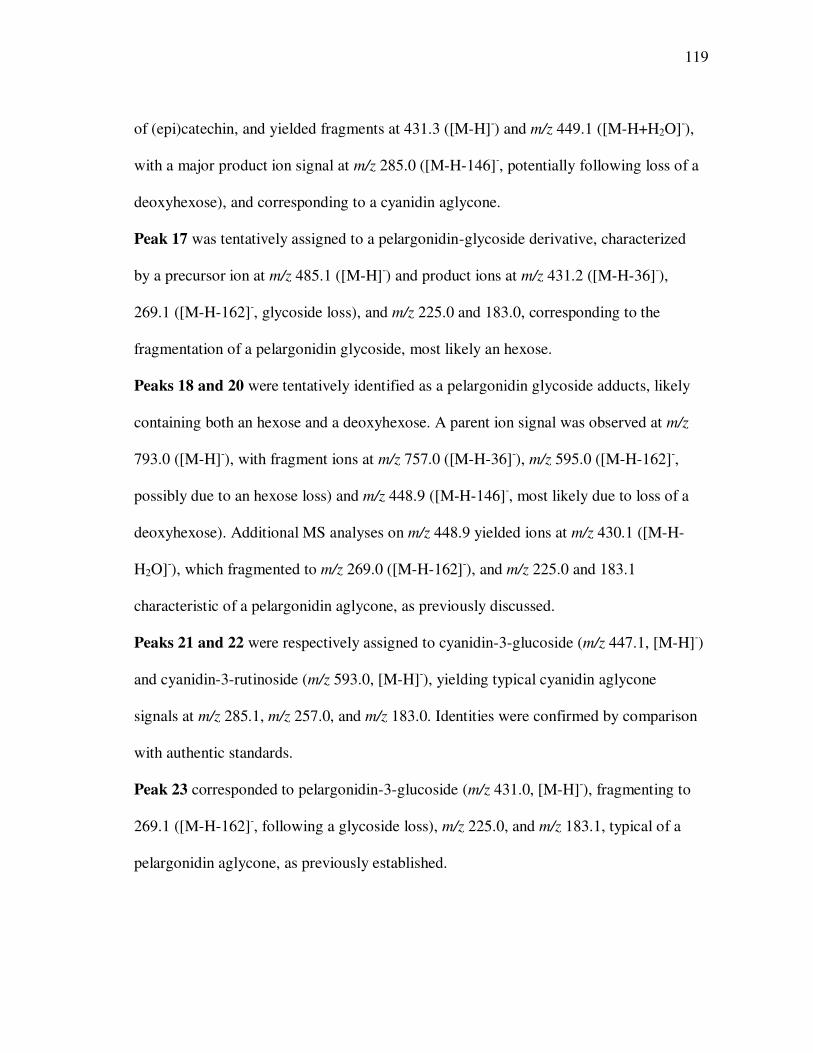
119
of (epi)catechin, and yielded fragments at 431.3 ([M-H]-) and m/z 449.1 ([M-H+H2O]-),
with a major product ion signal at m/z 285.0 ([M-H-146]-, potentially following loss of a
deoxyhexose), and corresponding to a cyanidin aglycone.
Peak 17 was tentatively assigned to a pelargonidin-glycoside derivative, characterized
by a precursor ion at m/z 485.1 ([M-H]-) and product ions at m/z 431.2 ([M-H-36]-),
269.1 ([M-H-162]-, glycoside loss), and m/z 225.0 and 183.0, corresponding to the
fragmentation of a pelargonidin glycoside, most likely an hexose.
Peaks 18 and 20 were tentatively identified as a pelargonidin glycoside adducts, likely
containing both an hexose and a deoxyhexose. A parent ion signal was observed at m/z
793.0 ([M-H]-), with fragment ions at m/z 757.0 ([M-H-36]-), m/z 595.0 ([M-H-162]-,
possibly due to an hexose loss) and m/z 448.9 ([M-H-146]-, most likely due to loss of a
deoxyhexose). Additional MS analyses on m/z 448.9 yielded ions at m/z 430.1 ([M-H-
H2O]-), which fragmented to m/z 269.0 ([M-H-162]-), and m/z 225.0 and 183.1
characteristic of a pelargonidin aglycone, as previously discussed.
Peaks 21 and 22 were respectively assigned to cyanidin-3-glucoside (m/z 447.1, [M-H]-)
and cyanidin-3-rutinoside (m/z 593.0, [M-H]-), yielding typical cyanidin aglycone
signals at m/z 285.1, m/z 257.0, and m/z 183.0. Identities were confirmed by comparison
with authentic standards.
Peak 23 corresponded to pelargonidin-3-glucoside (m/z 431.0, [M-H]-), fragmenting to
269.1 ([M-H-162]-, following a glycoside loss), m/z 225.0, and m/z 183.1, typical of a
pelargonidin aglycone, as previously established.
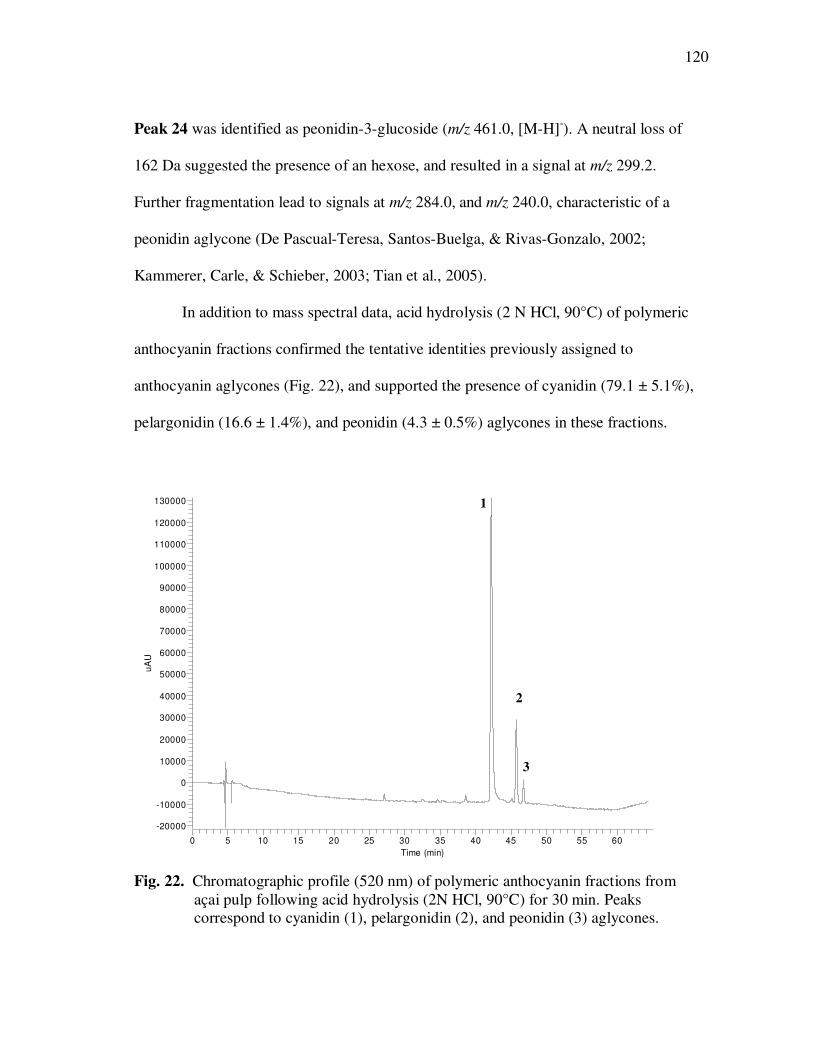
120
Peak 24 was identified as peonidin-3-glucoside (m/z 461.0, [M-H]-). A neutral loss of
162 Da suggested the presence of an hexose, and resulted in a signal at m/z 299.2.
Further fragmentation lead to signals at m/z 284.0, and m/z 240.0, characteristic of a
peonidin aglycone (De Pascual-Teresa, Santos-Buelga, & Rivas-Gonzalo, 2002;
Kammerer, Carle, & Schieber, 2003; Tian et al., 2005).
In addition to mass spectral data, acid hydrolysis (2 N HCl, 90°C) of polymeric
anthocyanin fractions confirmed the tentative identities previously assigned to
anthocyanin aglycones (Fig. 22), and supported the presence of cyanidin (79.1 ± 5.1%),
pelargonidin (16.6 ± 1.4%), and peonidin (4.3 ± 0.5%) aglycones in these fractions.
Fig. 22. Chromatographic profile (520 nm) of polymeric anthocyanin fractions from
açai pulp following acid hydrolysis (2N HCl, 90°C) for 30 min. Peaks correspond to cyanidin (1), pelargonidin (2), and peonidin (3) aglycones.
RT: 0.00 - 65.00
0 5 10 15 20 25 30 35 40 45 50 55 60 65
Time (min)
-20000
-10000
0
10000
20000
30000
40000
50000
60000
70000
80000
90000
100000
110000
120000
130000
uA
U
1
2
3
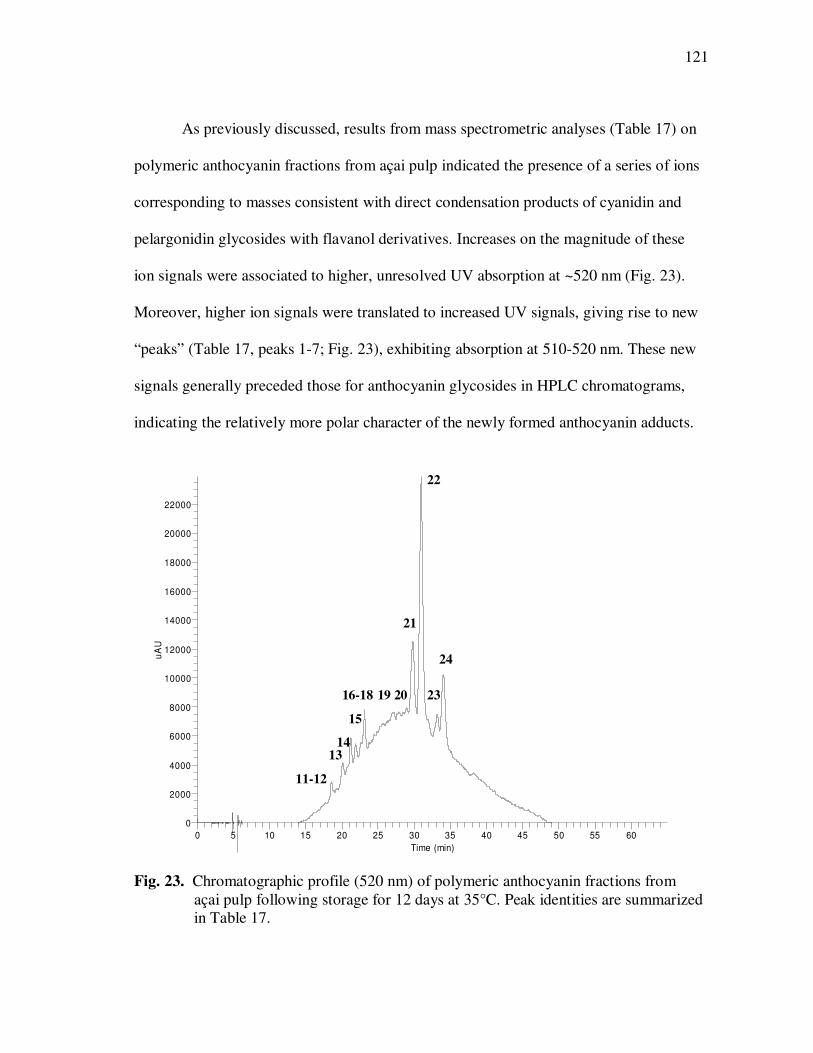
121
As previously discussed, results from mass spectrometric analyses (Table 17) on
polymeric anthocyanin fractions from açai pulp indicated the presence of a series of ions
corresponding to masses consistent with direct condensation products of cyanidin and
pelargonidin glycosides with flavanol derivatives. Increases on the magnitude of these
ion signals were associated to higher, unresolved UV absorption at ~520 nm (Fig. 23).
Moreover, higher ion signals were translated to increased UV signals, giving rise to new
“peaks” (Table 17, peaks 1-7; Fig. 23), exhibiting absorption at 510-520 nm. These new
signals generally preceded those for anthocyanin glycosides in HPLC chromatograms,
indicating the relatively more polar character of the newly formed anthocyanin adducts.
Fig. 23. Chromatographic profile (520 nm) of polymeric anthocyanin fractions from
açai pulp following storage for 12 days at 35°C. Peak identities are summarized in Table 17.
RT: 0.00 - 65.00
0 5 10 15 20 25 30 35 40 45 50 55 60 65
Time (min)
0
2000
4000
6000
8000
10000
12000
14000
16000
18000
20000
22000
uA
U
11-12
13
23
24
15
19 20
21
22
16-18
14
122
In addition, polymeric anthocyanin fractions had higher sulfite bleaching
resistance (60.4 ± 4.9% color retention) than their anthocyanin glycoside counterparts
(9.5 ± 1.1% color retention), when total absorbance following sulfite addition was
measured. These potential anthocyanin-flavanol adducts also resisted thiolysis, as (+)-
catechin or (-)-epicatechin benzylthioethers were absent following thiolysis. However,
both (+)-catechin (13.8 ± 0.4 mg/L) and (-)-epicatechin (161.3 ± 6.6 mg/L) were
detected following thiolysis of polymeric anthocyanin fractions. Epimerization of
flavanol standards under the thiolysis conditions used in these trials indicated conversion
to (-)-epicatechin (29.9 ± 0.2%) was favored over epimerization to (+)-catechin (11.5 ±
0.7%), while similar recovery rates (65.8 ± 3.9%) were observed for both compounds.
Thus, while no evidence on the occurrence of procyanidins or related flavanol
derivatives in polymeric anthocyanin fractions was found, detection of (+)-catechin and
(-)-epicatechin in polymeric anthocyanin fractions following thiolysis was consistent
with their potential presence as structural components in anthocyanin adducts.
The influence of previously characterized “polymeric” anthocyanin fractions
(Table 17), on anthocyanin stability and the formation of anthocyanin-based adducts
during accelerated storage (35°C) was evaluated in model anthocyanin systems. Models
were based on anthocyanin “monomer” isolates (550 mg cyanidin-3-glucoside
equivalents/L), rich in cyanidin-3-glucoside and cyanidin-3-rutinoside (Table 16), to
which “polymeric” anthocyanin fractions were added in varying proportions (0, 10, 20,
30, and 50%). Kinetic parameters of cyanidin-3-glucoside and cyanidin-3-rutinoside
degradation, including first-order (p<0.05) degradation rates (β1, in days-1) and half-lives
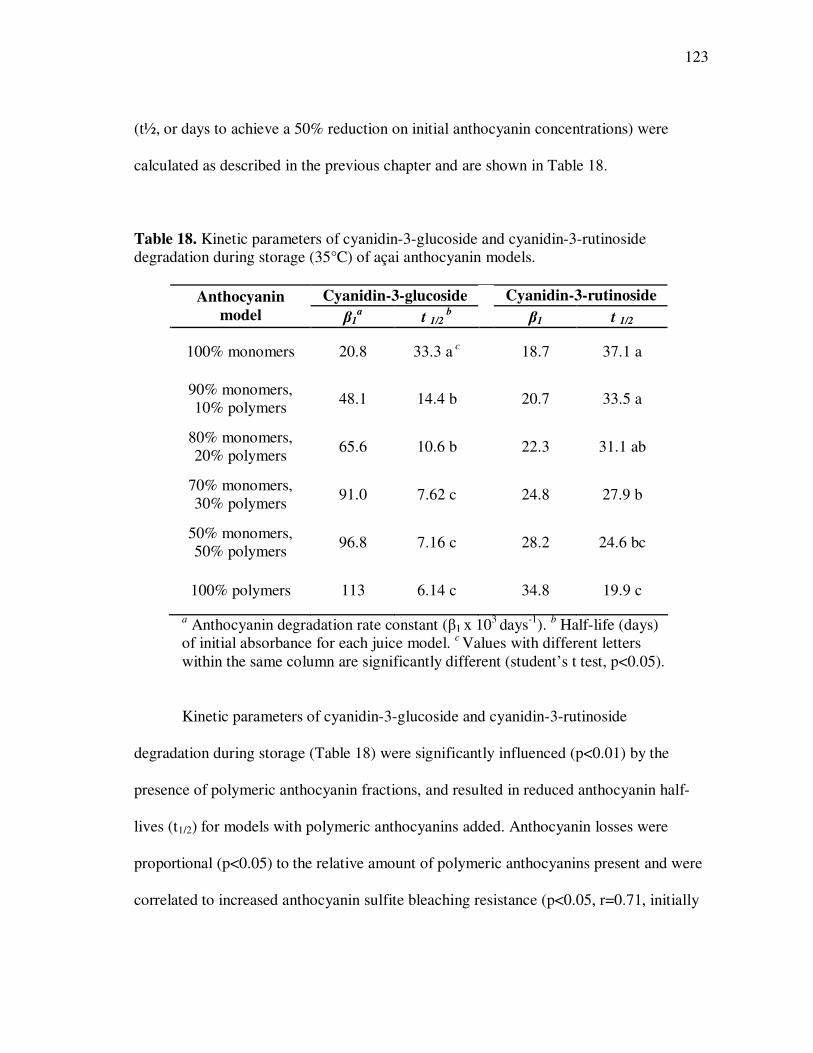
123
(t½, or days to achieve a 50% reduction on initial anthocyanin concentrations) were
calculated as described in the previous chapter and are shown in Table 18.
Table 18. Kinetic parameters of cyanidin-3-glucoside and cyanidin-3-rutinoside degradation during storage (35°C) of açai anthocyanin models.
Cyanidin-3-glucoside Cyanidin-3-rutinoside Anthocyanin
model β1a t 1/2
b β1 t 1/2
100% monomers 20.8 33.3 a c 18.7 37.1 a
90% monomers, 10% polymers 48.1 14.4 b 20.7 33.5 a
80% monomers, 20% polymers 65.6 10.6 b 22.3 31.1 ab
70% monomers, 30% polymers 91.0 7.62 c 24.8 27.9 b
50% monomers, 50% polymers 96.8 7.16 c 28.2 24.6 bc
100% polymers 113 6.14 c 34.8 19.9 c
a Anthocyanin degradation rate constant (β1 x 10³ days-1). b Half-life (days) of initial absorbance for each juice model. c Values with different letters within the same column are significantly different (student’s t test, p<0.05).
Kinetic parameters of cyanidin-3-glucoside and cyanidin-3-rutinoside
degradation during storage (Table 18) were significantly influenced (p<0.01) by the
presence of polymeric anthocyanin fractions, and resulted in reduced anthocyanin half-
lives (t1/2) for models with polymeric anthocyanins added. Anthocyanin losses were
proportional (p<0.05) to the relative amount of polymeric anthocyanins present and were
correlated to increased anthocyanin sulfite bleaching resistance (p<0.05, r=0.71, initially
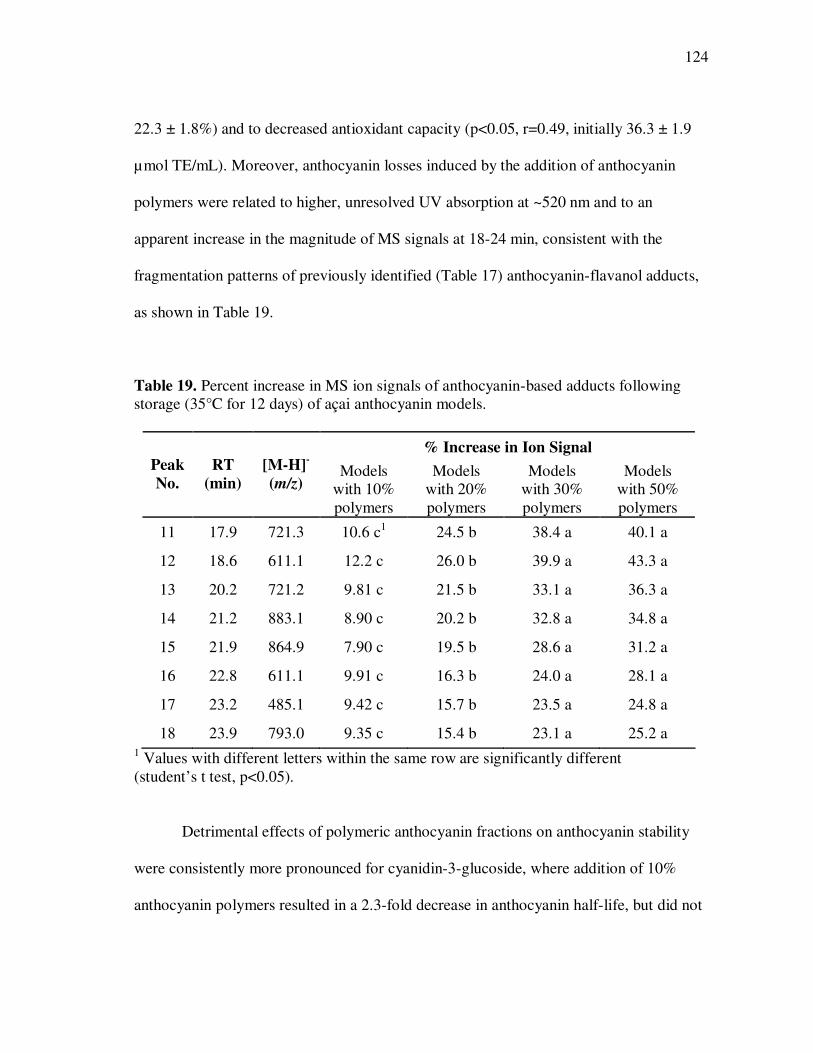
124
22.3 ± 1.8%) and to decreased antioxidant capacity (p<0.05, r=0.49, initially 36.3 ± 1.9
µmol TE/mL). Moreover, anthocyanin losses induced by the addition of anthocyanin
polymers were related to higher, unresolved UV absorption at ~520 nm and to an
apparent increase in the magnitude of MS signals at 18-24 min, consistent with the
fragmentation patterns of previously identified (Table 17) anthocyanin-flavanol adducts,
as shown in Table 19.
Table 19. Percent increase in MS ion signals of anthocyanin-based adducts following storage (35°C for 12 days) of açai anthocyanin models.
% Increase in Ion Signal Peak
No.
RT
(min)
[M-H]-
(m/z) Models
with 10% polymers
Models with 20% polymers
Models with 30% polymers
Models with 50% polymers
11 17.9 721.3 10.6 c1 24.5 b 38.4 a 40.1 a
12 18.6 611.1 12.2 c 26.0 b 39.9 a 43.3 a
13 20.2 721.2 9.81 c 21.5 b 33.1 a 36.3 a
14 21.2 883.1 8.90 c 20.2 b 32.8 a 34.8 a
15 21.9 864.9 7.90 c 19.5 b 28.6 a 31.2 a
16 22.8 611.1 9.91 c 16.3 b 24.0 a 28.1 a
17 23.2 485.1 9.42 c 15.7 b 23.5 a 24.8 a
18 23.9 793.0 9.35 c 15.4 b 23.1 a 25.2 a 1 Values with different letters within the same row are significantly different (student’s t test, p<0.05).
Detrimental effects of polymeric anthocyanin fractions on anthocyanin stability
were consistently more pronounced for cyanidin-3-glucoside, where addition of 10%
anthocyanin polymers resulted in a 2.3-fold decrease in anthocyanin half-life, but did not
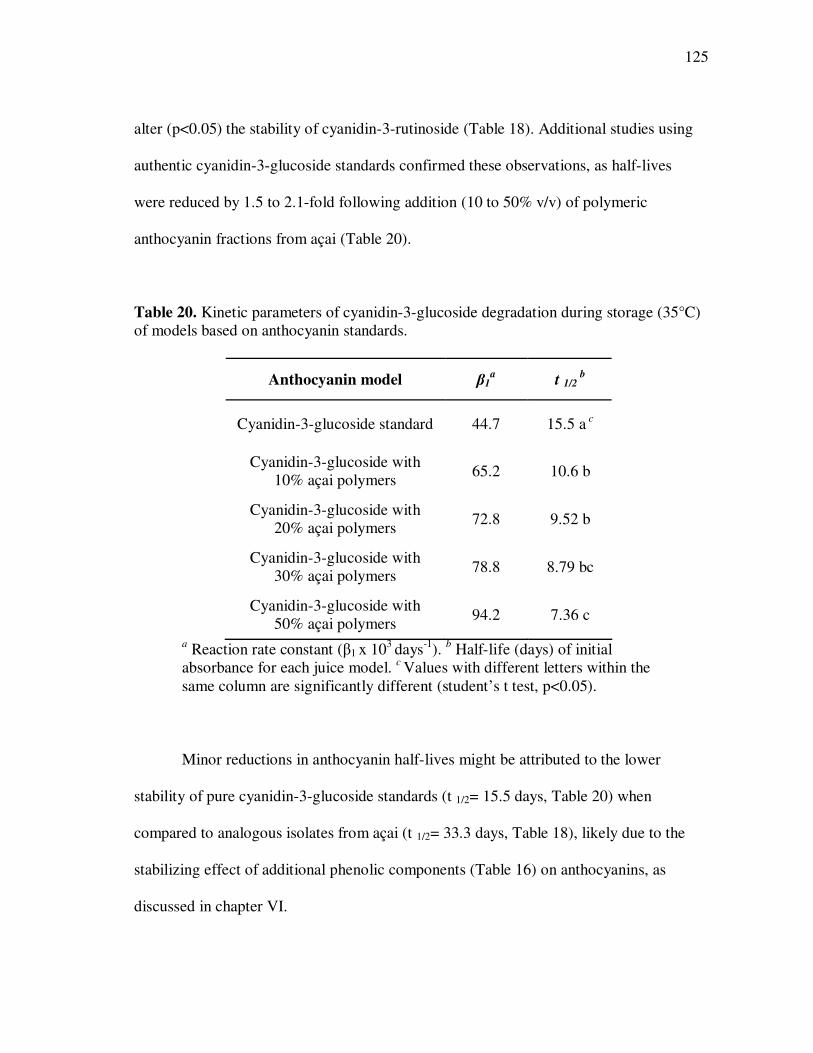
125
alter (p<0.05) the stability of cyanidin-3-rutinoside (Table 18). Additional studies using
authentic cyanidin-3-glucoside standards confirmed these observations, as half-lives
were reduced by 1.5 to 2.1-fold following addition (10 to 50% v/v) of polymeric
anthocyanin fractions from açai (Table 20).
Table 20. Kinetic parameters of cyanidin-3-glucoside degradation during storage (35°C) of models based on anthocyanin standards.
Anthocyanin model β1a t 1/2
b
Cyanidin-3-glucoside standard 44.7 15.5 a c
Cyanidin-3-glucoside with 10% açai polymers 65.2 10.6 b
Cyanidin-3-glucoside with 20% açai polymers 72.8 9.52 b
Cyanidin-3-glucoside with 30% açai polymers 78.8 8.79 bc
Cyanidin-3-glucoside with 50% açai polymers 94.2 7.36 c
a Reaction rate constant (β1 x 10³ days-1). b Half-life (days) of initial absorbance for each juice model. c Values with different letters within the same column are significantly different (student’s t test, p<0.05). Minor reductions in anthocyanin half-lives might be attributed to the lower
stability of pure cyanidin-3-glucoside standards (t 1/2= 15.5 days, Table 20) when
compared to analogous isolates from açai (t 1/2= 33.3 days, Table 18), likely due to the
stabilizing effect of additional phenolic components (Table 16) on anthocyanins, as
discussed in chapter VI.
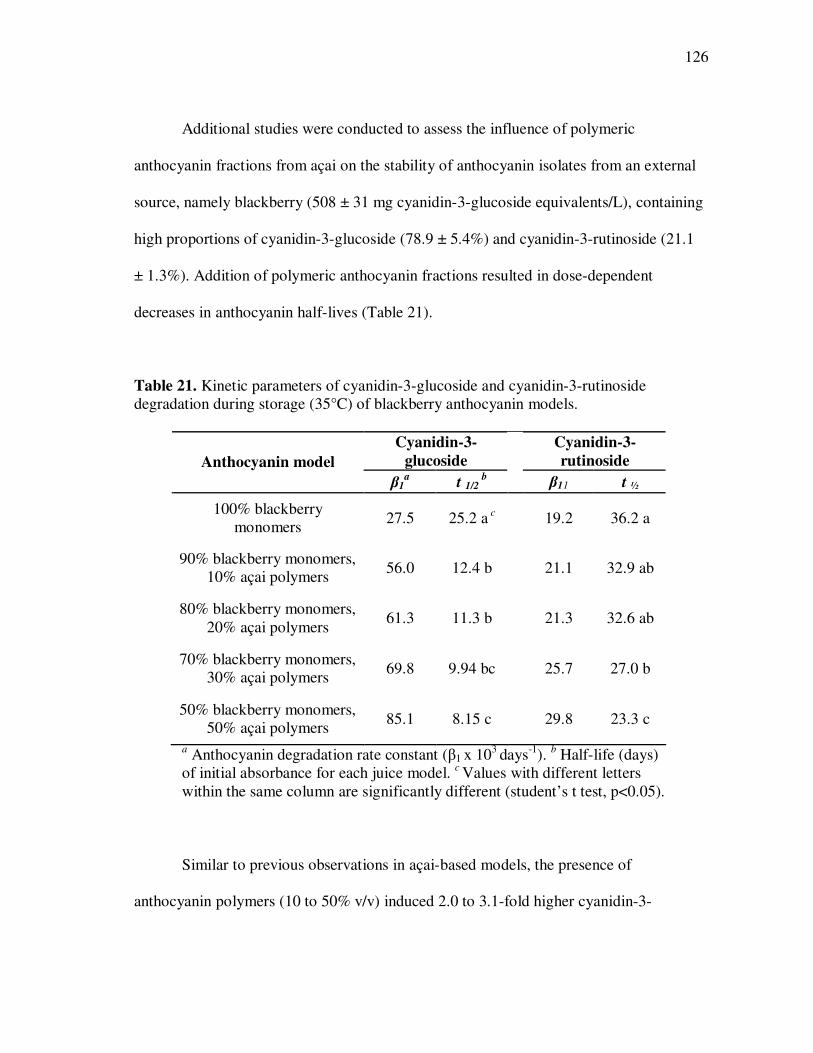
126
Additional studies were conducted to assess the influence of polymeric
anthocyanin fractions from açai on the stability of anthocyanin isolates from an external
source, namely blackberry (508 ± 31 mg cyanidin-3-glucoside equivalents/L), containing
high proportions of cyanidin-3-glucoside (78.9 ± 5.4%) and cyanidin-3-rutinoside (21.1
± 1.3%). Addition of polymeric anthocyanin fractions resulted in dose-dependent
decreases in anthocyanin half-lives (Table 21).
Table 21. Kinetic parameters of cyanidin-3-glucoside and cyanidin-3-rutinoside degradation during storage (35°C) of blackberry anthocyanin models.
Cyanidin-3-
glucoside
Cyanidin-3-
rutinoside Anthocyanin model
β1a t 1/2
b β11 t ½
100% blackberry monomers 27.5 25.2 a c 19.2 36.2 a
90% blackberry monomers, 10% açai polymers 56.0 12.4 b 21.1 32.9 ab
80% blackberry monomers, 20% açai polymers
61.3 11.3 b 21.3 32.6 ab
70% blackberry monomers, 30% açai polymers 69.8 9.94 bc 25.7 27.0 b
50% blackberry monomers, 50% açai polymers 85.1 8.15 c 29.8 23.3 c
a Anthocyanin degradation rate constant (β1 x 10³ days-1). b Half-life (days) of initial absorbance for each juice model. c Values with different letters within the same column are significantly different (student’s t test, p<0.05).
Similar to previous observations in açai-based models, the presence of
anthocyanin polymers (10 to 50% v/v) induced 2.0 to 3.1-fold higher cyanidin-3-
127
glucoside degradation, while only increased cyanidin-3-rutinoside degradation by 1.1 to
1.6-fold (Table 21). Anthocyanin losses were correlated to increased resistance to sulfite
bleaching (p<0.05, r=0.67, initially 10.1 ± 1.1%), and decreased antioxidant capacity
(p<0.05, r=0.44, initially 19.1 ± 1.8 µmol TE/mL). Losses were also related to an
increase in unresolved absorption at ~500 nm, and to 10 to 33% higher ion signals for
previously identified (Table 17) anthocyanin adducts, in agreement with prior
observations in açai-based models (Table 19). Possible mechanisms for the formation of
anthocyanin-flavanol adducts are addressed below.
Potential mechanisms for the formation of anthocyanin-based adducts were
further investigated. Aldehyde-mediated condensation of anthocyanins and flavanols
was initially considered, as pasteurization of fruit juices may result in thermal
decomposition of sugars, and the subsequent formation of aldehydic derivatives, most
commonly 5-(hydroxymethyl)furfural (HMF) (Lee & Nagy, 1990; Burdulu &
Karadeniz, 2003; Babsky, Toribio, & Lozano, 2006); and interactions between
anthocyanins and furfural derivatives have been reported in model systems (Es-Safi et
al., 2000; Es-Safi et al., 2002). Thus, the presence of HMF in a variety of commercial
açai pulps and both of the anthocyanin fractions used in these trials was evaluated by
tandem HPLC-ESI-MSn. However, HMF concentrations were below quantitation limits
(<10 µmol). Furthermore, MS fragmentation patterns of previously observed
anthocyanin adducts did not correspond to those typical aldehyde-mediated anthocyanin-
flavanol adducts, which are commonly linked by ethyl bridges (Timberlake & Bridle,
1976; Fulcrand, Docco, Es-Safi, Cheynier, & Moutounet, 1996; Dallas et al., 1996;
128
Francia-Aricha et al., 1997) and are generally characterized by the detection of ethanol-
flavanol adducts (m/z 333, [M-H]-) in ESI-MSn analyses (Es-Safi, Fulcrand, Cheynier, &
Moutounet, 1999; Es-Safi et al., 2000; Es-Safi et al., 2002).
Additional mechanisms for the formation of anthocyanin-based adducts were
considered based on the obtained MS fragmentation data (Table 17), which suggested
the presence of direct anthocyanin-polymer linkages in these polymers. The linkage
connecting the anthocyanin to the polymer may be one or more of several types known
to occur in condensed tannins, including the acid and heat-catalyzed 2-6 or 2-8 C-C links
between flavonoid units and heterocyclic ring opening of the 2-substituent (Jurd, 1969),
the 4-6 or 4-8 C-C link, as in most natural polymeric flavanols, or the products of
oxidative free-radical condensation, forming both C-C and C-O B-ring linkages
(Singleton, 1972). According to Jurd (1969), the 4-6 or 4-8 C-C leucoanthocyanidin type
is the most likely for the incorporation of an anthocyanin into a polymer, although it
would be possible for all to incorporate anthocyanins, at least as end units.
Formation of anthocyanin-flavanol adducts in dilute acid solutions (pH 3-5), both
in presence and absence of oxygen, has been previously reported (Jurd, Waiss, & Bergot,
1965; Jurd, 1967; Somers, 1971), and a direct condensation reaction has been proposed.
Direct condensation reactions would also increase anthocyanin resistance to sulfite
bleaching, commonly used to estimate polymeric anthocyanin contents, as linkages in
the 4-position makes anthocyanins resistant to bleaching by sulfite (Singleton, 1972).
Dimers resulting from the direct condensation between anthocyanins and (epi)catechins
have also been detected in red wines (Remy et al., 2000; Vivar-Quintana, Santos-Buelga,
129
& Rivas-Gonzalo, 2002; Remmy-Tanneau et al., 2003; Alcalde-Eon, Escribano-Bailon,
Santos-Buelga, & Rivas-Gonzalo, 2006), and their formation has been attributed to
anthocyanin reactions with flavanols, particularly procyanidins, which result in new
pigment species during wine storage (Salas, Le Guerneve, Fulcrand, Poncet-Legrand, &
Cheynier, 2004b).
Two basic mechanisms leading to the formation of (1) anthocyanin-flavanol (A-
F) or (2) flavanol-anthocyanin (F-A) adducts have been proposed: (1) nucleophilic
addition of the flavanol onto the flavylium cation of the anthocyanin, leading to the
colorless flavene, which is then oxidized to a red flavylium, resulting in an anthocyanin-
flavanol dimer and a monomeric flav-2-ene, as shown in Fig. 24 (Jurd, 1969; Somers,
1971; Salas, 2004b) and (2) acid-catalyzed cleavage of the interflavanic bond of
procyanidins, releasing an intermediate carbocation at C4 that reacts with the hydrated
hemiketal form of anthocyanins via nucleophilic addition, resulting in a colorless dimer
that dehydrates to a red flavylium form (Haslam, 1980; Salas, 2004b), as shown in Fig.
25. These reactions would lead to two possible structures: (1) an anthocyanin linked by
its C-4 position to the C-6 or C-8 positions of a flavanol (A-F adduct, Fig. 24) or (2) an
anthocyanin linked by its C-8 or C-6 position to the C-4 of a flavanol (F-A adduct, Fig.
25). Evidence in favor of a flavanol-anthocyanin structure has been recently obtained by
MSn fragmentation patterns (Salas et al., 2004a; Gonzalez-Paramas et al., 2006; Dueñas,
Fulcrand, & Cheynier, 2006) and hemisynthesis (Salas et al., 2004a; Salas et al., 2004b).
A complete structural characterization of similar pigments isolated from strawberries
(Fossen, Rayyan, & Andersen, 2004) and from purple corn (Gonzalez-Manzano et al.,
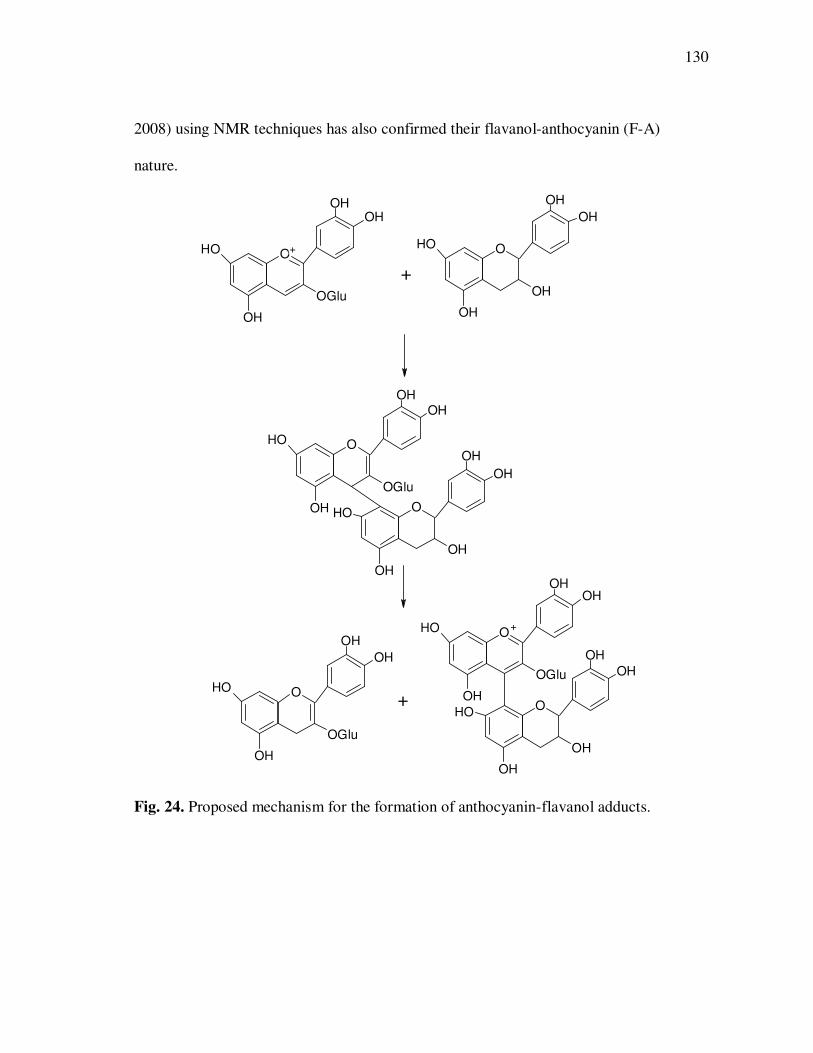
130
2008) using NMR techniques has also confirmed their flavanol-anthocyanin (F-A)
nature.
OH
OH
OHOH
O
OGlu
OH
OH
OH
OH
O
OH
OH
OH
OHOH
O
OGlu
OH
OH
OH
OH
O
OH
OH
OH
OHOH
O
OGlu
OH
OH
OH
OH
O
OH
OH
OH
OH
OH
O
OGlu
+
+
+
+
Fig. 24. Proposed mechanism for the formation of anthocyanin-flavanol adducts.
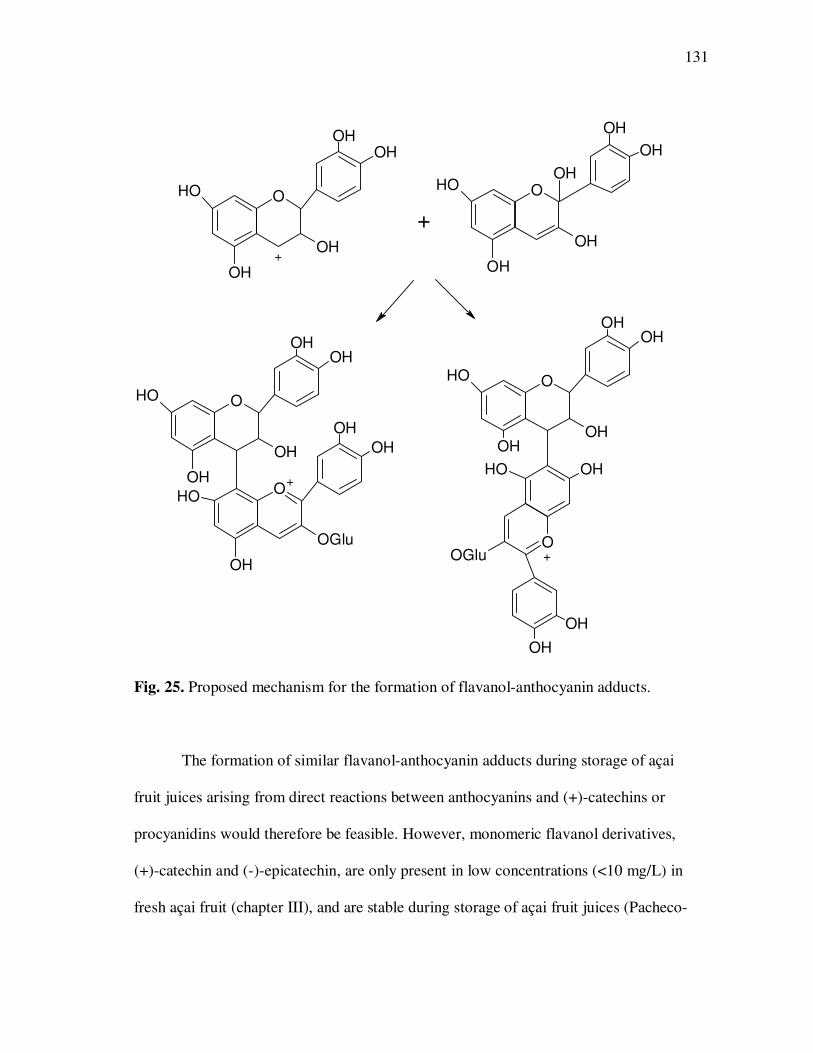
131
OH
OH
OHOH
O
OH
OH
OH
OH
OH
OHO
OH
OH
OH
OHOH
O
OH
OH
OH
OH
OH
O
OGlu
OH
OH
OHOH
O
OH
OHOH
OH
OH
OOGlu
+
+
+
+
Fig. 25. Proposed mechanism for the formation of flavanol-anthocyanin adducts.
The formation of similar flavanol-anthocyanin adducts during storage of açai
fruit juices arising from direct reactions between anthocyanins and (+)-catechins or
procyanidins would therefore be feasible. However, monomeric flavanol derivatives,
(+)-catechin and (-)-epicatechin, are only present in low concentrations (<10 mg/L) in
fresh açai fruit (chapter III), and are stable during storage of açai fruit juices (Pacheco-
132
Palencia et al., 2007a). Our previous investigations using açai fruit anthocyanin models
with added phenolic cofactors (chapter VI), also indicated that the presence of
procyanidins does not influence anthocyanin degradation or polymerization reactions
during storage, suggesting additional mechanisms may be responsible for the formation
of anthocyanin-flavanol adducts in açai fruit juices.
The natural occurrence of flavanol-anthocyanin condensed pigments in açai fruit
was investigated, as these condensed pigments could participate in similar mechanisms
to those leading to the formation of flavanol-anthocyanin adducts (Fig. 25).
Anthocyanin-flavanol condensed pigments have been reported to occur naturally in
strawberry (Fossen et al., 2004; Gonzalez-Paramas et al., 2006; Lopes da Silva,
Escribano-Bailon, Perez-Alonso, Rivas-Gonzalo, & Santos-Buelga, 2007), black
currants (McDougall, Gordon, Brennan, & Stewart, 2005), runner beans, grape skin
extracts (Gonzalez-Paramas et al., 2006) and purple corn (Gonzalez-Paramas et al.,
2006; Gonzalez-Manzano et al., 2008) and their presence in fresh açai fruit pulps (Fig.
21) may indicate that they are natural pigments in açai fruit, and not exclusive products
of anthocyanin polymerization reactions occurring during storage. It was therefore
hypothesized that naturally occurring anthocyanin-flavanol pigments in açai fruit
promote the formation of flavanol-anthocyanin adducts via similar mechanisms to those
observed in the presence of procyanidins. Hence, formation of flavanol-anthocyanin
adducts would be initiated by cleavage of interflavanic bonds and subsequent release of
intermediate nucleophilic carbocations at C-4 (F+), prone to react with the hydrated form
133
of anthocyanins (AOH) at positions C-8 or C-6, leading to 4-8 or 4-6 flavanol-
anthocyanin adducts (Fig. 25).
Additional reactions involving the carbocations (F+) resulting from cleavage of
anthocyanin-flavanol adducts could also lead to polymerization with other phenolic
compounds, including anthocyanins, and could result in the formation of large,
structurally diverse polymers during storage of açai fruit juices. These polymers may
also be responsible for increased anthocyanin sulfite resistance, hue changes towards
dark red colors, and the appearance of a wide, unresolved peak in the HPLC
chromatograms of açai fruit juices during storage. Additional studies using NMR
techniques may assist in the complete structural characterization of these polymers in
açai fruit juices and facilitate their identification in other fruit matrices.
Conclusion
Anthocyanin polymerization reactions occurring during storage of açai fruit
juices were investigated. Several anthocyanin-flavanol adducts based on cyanidin or
pelargonidin aglycones were tentatively identified by HPLC-ESI-MSn analyses and their
presence was related to increased anthocyanin sulfite bleaching resistance and to the
appearance of a wide, unresolved peak in HPLC chromatograms. A potential reaction
mechanism involving nucleophilic addition of anthocyanins in their hydrated form to
flavanol carbocations resulting from cleavage of interflavanic bonds was proposed for
the formation of flavanol-anthocyanin adducts in açai fruit juices. The natural
occurrence of condensed flavanol-anthocyanin pigments in açai fruit was also suggested
134
to promote the formation of additional anthocyanin adducts and further polymerization
with other phenolic components, potentially resulting in a variety of structurally diverse
anthocyanin polymers during storage of açai fruit juices. Results from these studies
provide new insights on the nature and occurrence of anthocyanin polymerization
reactions in açai fruit juices.
135
CHAPTER VIII
IN-VITRO ABSORPTION AND ANTIPROLIFERATIVE ACTIVITY OF
MONOMERIC AND POLYMERIC ANTHOCYANIN FRACTIONS
FROM AÇAI FRUIT
Introduction
Anthocyanins are considered one of the largest and most important plant
pigments and are responsible for most red, blue, and purple hues in fruits, vegetables,
and flowers (Kong et al., 2003). Nutritional interest in anthocyanins is based on their
considerable daily intake (180 to 215 mg/day in the United States), which is significantly
higher than the estimated intake of other flavonoids (23 mg/day), including quercetin,
kaempferol, myricetin, apigenin, and luteolin (Galvano et al., 2004). Yet numerous
studies have reported the relatively low absorption (generally <1.0%) of anthocyanins
from rich dietary fruit sources, in both animal and human trials (Miyazawa, Nakagawa,
Kudo, Muraishi, & Someya, 1999; Bub, Watzl, Heeb, Rechkemmer, & Briviba, 2001;
Matsumoto, Inaba, Kishi, Tominaga, Hirayama, & Tsuda, 2001; Felgines, Texier,
Besson, Fraisse, Lamaison, & Remesy, 2002). Anthocyanins were also shown to be
absorbed mostly without change in their glycosylated form directly into the bloodstream
(Cao, Muccitelli, Sanchez-Moreno, & Prior, 2001) with peak plasma concentrations
observed within 1-2 hours of ingestion (Matsumoto et al., 2001). However, anthocyanins
can also be metabolized in vivo to modified forms, including methylated, glucuronated,
136
and sulfo-conjugated anthocyanin metabolites, which have been reported in urine and
blood plasma (Felgines et al., 2003).
Information on the absorption of anthocyanin glycosides is widely available, yet
the literature is devoid of information concerning the absorption or mere presence of
anthocyanin polymers despite a preponderance of studies that show that anthocyanin
polymerization reactions readily occur during the processing and storage of anthocyanin-
containing fruits and vegetables. Studies on the absorption of structurally similar
compounds, such as flavanols, have revealed high absorption levels for monomers that
decrease as the degree of polymerization increases (Shoji et al., 2006). Scalbert et al.
(2000) reported (+)-catechin, procyanidin dimer B3, and procyanidin trimer C2 were
transported through the human intestinal epithelial Caco-2 cell monolayer yet polymers
with a higher degree of polymerization were not. Additional studies using LC-MS
techniques have suggested that procyanidin dimers were absorbed in vitro (Spencer,
Schroeter, Shenoy, Srai, Debnam, & Rice-Evans, 2001) and also into the bloodstream in
both animals (Baba, Osakabe, Natsume, & Terao, 2002) and humans (Sano, Yamakoshi,
Tokutake, Tobe, Kubota, & Kikuchi, 2003; Shoji et al., 2006). However, the limits of
polyphenolic absorption in relation to the degree of polymerization are still unclear.
Açai fruit (Euterpe oleracea Mart.) was selected as an anthocyanin source for
these trials, mainly due to its inherently high polymeric anthocyanin content, commonly
between 25 and 45% in fresh açai fruit pulp (Pacheco-Palencia et al., 2007a; Pacheco-
Palencia et al., 2007b), and its high anthocyanin polymerization rates during storage,
reaching polymeric anthocyanin contents of 70-80% in 8 days at 35°C (Pacheco-
137
Palencia et al., 2007a). Thus, a few days of storage may result in significant variations in
anthocyanin composition in açai fruit juices, potentially leading to changes in
anthocyanin bioactive and absorption properties. These studies were conducted to
evaluate the influence of anthocyanin monomer and polymers on the in vitro intestinal
absorption and antiproliferative activity of anthocyanins from açai fruit and to determine
a dose-response for anthocyanin forms potentially absorbed by the human body. Caco-2
cell monolayers were used as in vitro models for intestinal absorption, while
antiproliferative activities were evaluated in HT-29 human colon adenocarcinoma cells.
Results from these investigations are aimed at promoting postharvest, processing, and
storage conditions that retain absorbable and bioactive anthocyanin forms in juices,
beverages, and other anthocyanins-containing food products.
Materials and Methods
Anthocyanin models were based from 100% açai fruit pulp anthocyanin isolates.
Pasteurized açai pulp was donated by the Bossa Nova Beverage Group (Los Angeles,
CA) and shipped frozen to the Department of Nutrition and Food Science at Texas A&M
University. Prior to anthocyanin isolation, açai pulp was clarified according to a
previously described procedure (Pacheco-Palencia et al., 2007b) to remove lipids and
insoluble solids. Clarified açai pulp was then loaded onto activated C18 Sep-Pak 6 cc
cartridges (Waters Corporation, Milford, MA) and eluted sequentially with water and
ethyl acetate to remove sugars, organic acids, metals, proteins, phenolic acids, and other
flavonoids (Pacheco-Palencia et al., 2007a). Anthocyanins were recovered with acidified
138
methanol (0.01% HCl) and redissolved in a 0.1M citric acid buffer (pH 3.0) following
solvent evaporation under vacuum (<40°C). The resulting anthocyanin isolate was
adsorbed onto a second Sep-Pak cartridge and eluted with an alkaline borate solution
(0.1 N, pH 9.0), until a colorless eluent was obtained. Eluted anthocyanin monomers
were immediately diluted with 4N HCl to favor anthocyanin equilibrium toward the
more stable red flavylium form, loaded onto a third Sep-Pak cartridge, and recovered
with methanol (0.01% HCl). Polymeric anthocyanins adsorbed to the second cartridge
were likewise eluted with acidified methanol (0.01% HCl), and both fractions were
concentrated under vacuum at <40°C until complete solvent removal and reconstituted
in a 0.1 M citric acid buffer (pH 3.0). Anthocyanin monomer and polymer fractions were
standardized to a final concentration of ~2500 mg cyanidin-3-glucoside equivalents/L,
determined spectrophotometrically (Pacheco-Palencia et al., 2007b). All anthocyanin
isolates were kept at -20°C and sterile-filtered prior use in cell culture experiments.
Polyphenolic isolates were analyzed by reversed phase HPLC and mass
spectrometric analyses, performed on a Thermo Finnigan LCQ Deca XP Max MSn ion
trap mass spectrometer equipped with an ESI ion source (Thermo Fisher, San Jose, CA).
Separations were conducted using an Acclaim 120 5µm 120Å (4.6 x 250 mm) column
(Dionex Corporation, Sunnyvale, CA). Mobile phases consisted of 0.5% formic acid in
water (phase A) and 0.5% formic acid in methanol (phase B) run at 0.6 mL/min.
Polyphenolics were separated with a gradient elution program in which phase B changed
from 5 to 10% in 3 min, from 10 to 30% in the following 17 min, from 30 to 50% in the
following 20 min, from 50 to 70% in the following 15 min, and from 70 to 100% in the
139
following 10 min. Initial conditions were then restored and held constant for 20 min
prior each injection. Ionization was conducted in the negative ion mode under the
following conditions: sheath gas (N2), 60 units/min; auxiliary gas (N2), 5 units/min;
spray voltage, 3.5 kV; capillary temperature, 250 °C; capillary voltage, 1.5 V; tube lens
offset, 0 V. Identification and quantitation of polyphenolics was based on their spectral
characteristics, retention time, and mass spectrometric properties, as compared to
authentic cyanidin-3-glucoside and cyanidin-3-rutinoside standards (Sigma Chemical
Co., St. Louis, MO). Antioxidant capacity was determined by the oxygen radical
absorbance capacity assay using a BMG Labtech FLUOstar fluorescent microplate
reader (485 nm excitation and 538 nm emission), as described previously (Pacheco-
Palencia et al., 2007b). Results were expressed in µmol Trolox equivalents, TE/mL.
Total soluble phenolic contents were determined by the Folin-Cioucalteau assay, as a
measure of the reducing ability of anthocyanin fractions, as noted in Chapter IV.
Antiproliferative activity of anthocyanin fractions against HT-29 human colon
adenocarcinoma cells was evaluated. HT-29 cells were purchased from American Type
Culture Collection (ATCC, Manassas, VA), cultured in Dulbecco’s modified Eagle’s
medium (1X) (DMEM) containing 5% fetal bovine serum, 1% non-essential amino
acids, 100 units/mL penicillin G, 100 µg/mL streptomycin, 1.25 µg/mL amphotericin B,
and 10 mM sodium pyruvate (Gibco BRL Life Technology, Grand Island, NY). Cells
were incubated at 37°C under 5% CO2, and used between passages 10-20. Cells were
seeded at a density 2x10⁴ cells/well, into 24-well tissue culture plates. Following
incubation for 24 h, the growth medium was replaced with 500 µL of media containing
140
different concentrations of standardized anthocyanin extracts (from 0.5 to 100 µg
cyanidin-3-glucoside equivalents/mL). Cell numbers were determined following
incubation for 48 h, using a Beckman Coulter Particle Counter (Fullerton, CA). Cell
numbers were expressed as a percentage of the untreated control and the anthocyanin
extract concentration at which cell proliferation was inhibited by 50% (IC50) was
calculated by linear regression analyses for each anthocyanin fraction.
Transepithelial transport models using Caco-2 colon carcinoma cells were used
to evaluate in-vitro absorption properties of anthocyanin fractions. Caco-2 cells were
obtained from American Type Culture Collection (ATCC, Manassas, VA) and cultured
at 37°C and 5% CO2 in Dulbecco’s modified Eagle’s medium (1X) high glucose
(DMEM) containing 10% fetal bovine serum, 1% non-essential amino acids, 100
units/mL penicillin G, 100 µg/mL streptomycin, 1.25 µg/mL amphotericin B, and 10
mM sodium pyruvate (all chemicals supplied by Sigma-Aldrich Co., St. Louis, MO).
Cells between passages 5-10 were seeded in 12-mm transparent polyester cell culture
insert well plates (Transwell, Corning Costar Corp., Cambridge, MA) at 1.0 x 10⁵ cells
per insert, with 0.5 mL of growth medium in the apical side and 1.5 mL in the
basolateral side. Cells were grown and differentiated to confluent monolayers for 21
days, as previously described (Hidalgo, Raub, & Borchardt, 1989). Transepithelial
electrical resistance (TEER) values were monitored with an EndOhm Volt ohmmeter
equipped with a STX-2 electrode (World Precision Instruments Inc., Sarasota, FL).
Monolayers with TEER values >450 Ω cm2 after correction for the resistance in control
wells were used for transport experiments. To insure monolayer integrity, TEER values
141
were also measured at the conclusion of transport experiments and data was only
collected from monolayers with corrected TEER values >350 Ω cm2. Prior transport
experiments, growth media was replaced by Hank’s balanced salt solution (HBSS,
Fischer Scientific, Pittsburgh, PA) containing 10 mM 2-(N-morpholino)ethanesulfonic
acid solution (MES, Gibco BRL Life Technology, Grand Island, NY) adjusted to pH 6.0
in the apical side, and HBSS containing N-[2-hydroxyethyl]piperazine-N’-[2-
ethanesulfonic acid] buffer solution (1 M) (HEPES, Gibco BRL Life Technology, Grand
Island, NY) adjusted to pH 7.4 in the basolateral side, creating a pH gradient similar to
the small intestine environment. Sample aliquots (200 µL) were taken from the
basolateral compartment at 0.5, 1.0, 1.5, and 2.0 h, immediately acidified with a known
volume of 4N HCl, kept frozen (-20°C), and analyzed within one week. Samples were
finally filtered through 0.45µm PTFE membranes (Whatman, Florham Park, NJ) and
injected directly into the HPLC-ESI-MS system.
Statistical analyses were performed in all data and included one-way analysis of
variance (ANOVA) using SPSS version 15.0 (SPSS Inc., Chicago, IL) using α=0.05.
Mean separations were conducted by post-hoc LSD (p<0.05) pairwise comparisons. A
significance level of 0.05 was also used for parametric correlations and linear regression
analyses.
Results and Discussion
Polyphenolic composition of monomeric and polymeric anthocyanin fractions
was evaluated. Anthocyanins present in monomeric and polymeric fractions from açai
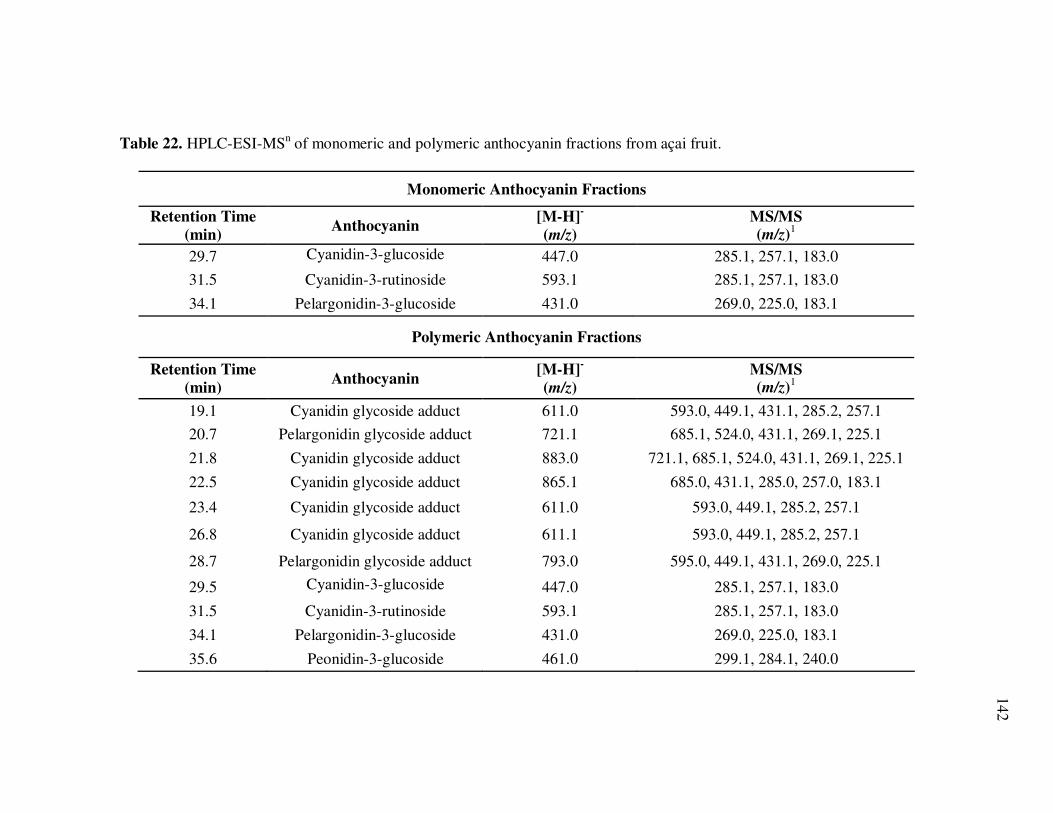
142
Table 22. HPLC-ESI-MSn of monomeric and polymeric anthocyanin fractions from açai fruit.
Monomeric Anthocyanin Fractions
Retention Time
(min) Anthocyanin
[M-H]-
(m/z) MS/MS
(m/z)1
29.7 Cyanidin-3-glucoside
447.0 285.1, 257.1, 183.0
31.5 Cyanidin-3-rutinoside 593.1 285.1, 257.1, 183.0
34.1 Pelargonidin-3-glucoside 431.0 269.0, 225.0, 183.1
Polymeric Anthocyanin Fractions
Retention Time (min)
Anthocyanin [M-H]
-
(m/z) MS/MS
(m/z)1
19.1 Cyanidin glycoside adduct 611.0 593.0, 449.1, 431.1, 285.2, 257.1
20.7 Pelargonidin glycoside adduct 721.1 685.1, 524.0, 431.1, 269.1, 225.1
21.8 Cyanidin glycoside adduct 883.0 721.1, 685.1, 524.0, 431.1, 269.1, 225.1
22.5 Cyanidin glycoside adduct 865.1 685.0, 431.1, 285.0, 257.0, 183.1
23.4 Cyanidin glycoside adduct 611.0 593.0, 449.1, 285.2, 257.1
26.8 Cyanidin glycoside adduct 611.1 593.0, 449.1, 285.2, 257.1
28.7 Pelargonidin glycoside adduct 793.0 595.0, 449.1, 431.1, 269.0, 225.1
29.5 Cyanidin-3-glucoside
447.0 285.1, 257.1, 183.0
31.5 Cyanidin-3-rutinoside 593.1 285.1, 257.1, 183.0
34.1 Pelargonidin-3-glucoside 431.0 269.0, 225.0, 183.1
35.6 Peonidin-3-glucoside 461.0 299.1, 284.1, 240.0
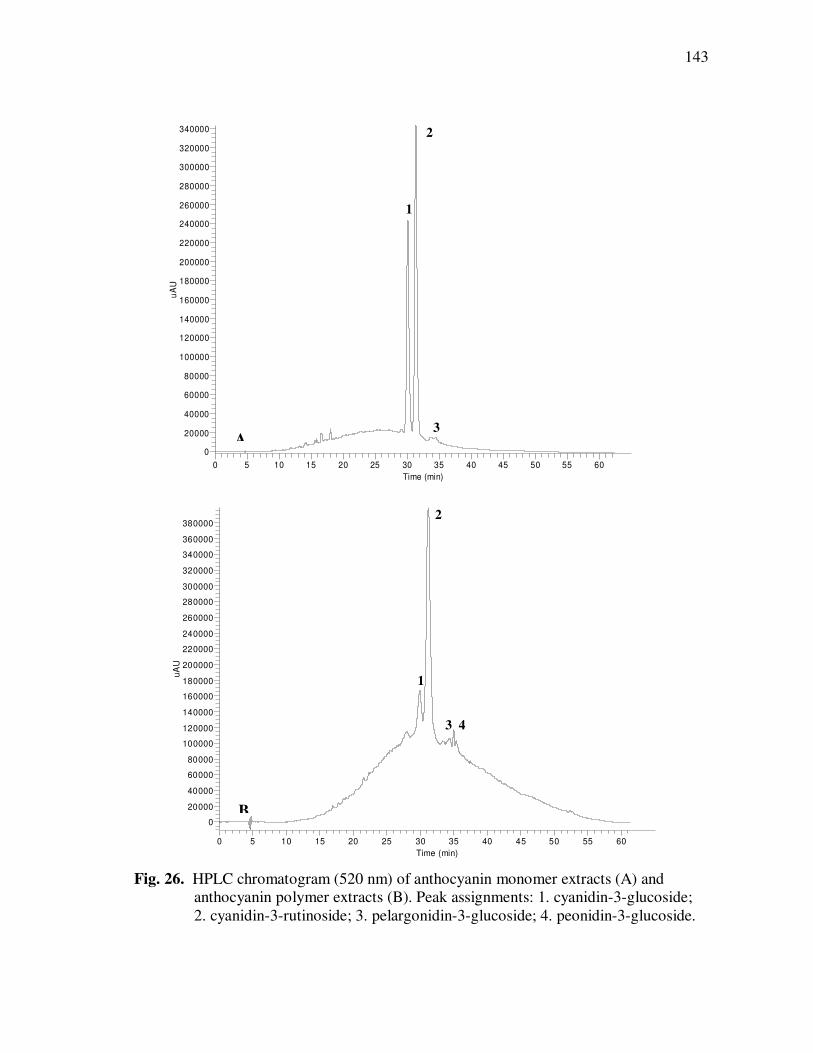
143
Fig. 26. HPLC chromatogram (520 nm) of anthocyanin monomer extracts (A) and anthocyanin polymer extracts (B). Peak assignments: 1. cyanidin-3-glucoside; 2. cyanidin-3-rutinoside; 3. pelargonidin-3-glucoside; 4. peonidin-3-glucoside.
1
2
3
RT: 0.00 - 65.00
0 5 10 15 20 25 30 35 40 45 50 55 60
Time (min)
0
20000
40000
60000
80000
100000
120000
140000
160000
180000
200000
220000
240000
260000
280000
300000
320000
340000
uA
U
A
1
2
3 4
RT: 0.00 - 65.00
0 5 10 15 20 25 30 35 40 45 50 55 60
Time (min)
0
20000
40000
60000
80000
100000
120000
140000
160000
180000
200000
220000
240000
260000
280000
300000
320000
340000
360000
380000
uA
U
B
144
fruit were normalized to equivalent total anthocyanin contents (2500 ± 100 mg cyanidin-
3-glucoside equivalents/L) and characterized by HPLC-ESI-MSn analyses. Mass
fragmentation patterns for anthocyanins in both fractions are shown in Table 22.
Cyanidin-3-rutinoside (1397.7 ± 64.3 mg/L) and cyanidin-3-glucoside (992.8 ± 10.9
mg/L) were predominant in monomeric fractions, along with trace amounts of
pelargonidin-3-glucoside (Fig. 26). Polymeric anthocyanin fractions were characterized
by the presence of pelargonidin and cyanidin adducts, which eluted as a large,
unresolved peak in the reversed phase HPLC chromatograms, with strong UV absorption
~520 nm (Fig. 26), responsible for the characteristic dark red color observed in these
fractions.
Cyanidin adducts present in polymeric anthocyanin fractions were identified by
negative ion signals at m/z 611.0, 883.0, and 865.1, yielding common fragments at m/z
285.2 and 257.1, corresponding to the fragmentation pattern of cyanidin glycosides.
Likewise, pelargonidin adducts were characterized by negative ion signals at m/z 721.1
and 793.0 and common fragments at m/z 431.1, 269.1, and 225.1, corresponding to the
fragmentation of pelargonidin glycosides (Table 22). Cyanidin-3-rutinoside (332.8 ±
24.4 mg/L), cyanidin-3-glucoside (84.6 ± 5.9 mg/L), and traces of pelargonidin-3-
glucoside, and peonidin-3-glucoside were also detected in polymeric anthocyanin
fractions. Hence, anthocyanin monomers were responsible for 95.6 ± 3.7% of total
anthocyanin contents in monomeric fractions, but only accounted for 16.7 ± 0.6% of
total anthocyanin contents in polymeric fractions. Polymeric anthocyanin fractions also
contained higher proportions of cyanidin-3-rutinoside (79.7 ± 5.8%) and relatively
145
smaller amounts of cyanidin-3-glucoside (20.3 ± 1.4%) when compared to monomeric
fractions (58.5 ± 4.6% cyanidin-3-rutinoside, 41.5 ± 1.1% cyanidin-3-glucoside).
Variations in anthocyanin composition were hypothesized to be important
contributing factors to differences in absorption and bioactive properties between
monomeric and polymeric anthocyanin fractions. Thus, mixtures containing varying
proportions of monomers and polymers (75/25 and 50/50 monomer/polymer ratios) were
also evaluated in order to assess the influence of polymeric anthocyanins on the
absorption and bioactive properties of monomeric anthocyanin glycosides.
Total antioxidant capacity of anthocyanin fractions and fraction mixtures were
also related to total anthocyanin contents. Both anthocyanin fractions were comparable
in terms of antioxidant capacity, with respective values of 256.9 ± 12.6 µmol TE/mL for
monomeric fractions and 206.8 ± 6.7 µmol TE/mL for polymeric fractions. Comparable
reducing capacities were also observed for both monomeric and polymeric anthocyanin
fractions in the Folin-Ciocalteu assay, ranging from 5220 to 6577 mg gallic acid
equivalents/mL. Analogous observations have been reported in anthocyanin extracts
from Hibiscus sabdariffa, where degradation of monomeric anthocyanins to brown
polymeric forms resulted in a <10% change in antioxidant capacity (Tsai & Huang,
2004).
The antiproliferative activities of anthocyanin monomer and polymer fractions
were evaluated in a cell culture model using HT-29 colon carcinoma cells. Cell counts
were related to HT-29 cell proliferation and declines in cell numbers were considered
reflective of the cytotoxic effects of anthocyanin extracts. Both monomeric and
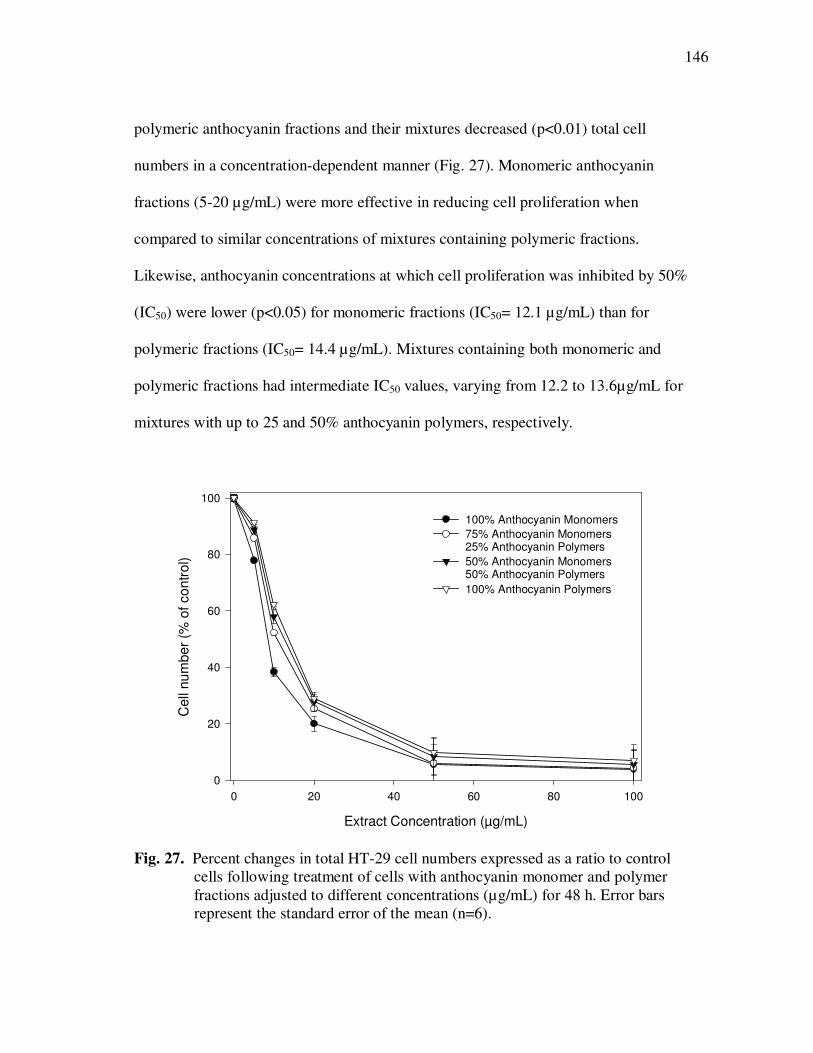
146
polymeric anthocyanin fractions and their mixtures decreased (p<0.01) total cell
numbers in a concentration-dependent manner (Fig. 27). Monomeric anthocyanin
fractions (5-20 µg/mL) were more effective in reducing cell proliferation when
compared to similar concentrations of mixtures containing polymeric fractions.
Likewise, anthocyanin concentrations at which cell proliferation was inhibited by 50%
(IC50) were lower (p<0.05) for monomeric fractions (IC50= 12.1 µg/mL) than for
polymeric fractions (IC50= 14.4 µg/mL). Mixtures containing both monomeric and
polymeric fractions had intermediate IC50 values, varying from 12.2 to 13.6µg/mL for
mixtures with up to 25 and 50% anthocyanin polymers, respectively.
Extract Concentration (µg/mL)
0 20 40 60 80 100
Ce
ll n
um
be
r (%
of
co
ntr
ol)
0
20
40
60
80
100
100% Anthocyanin Monomers
75% Anthocyanin Monomers25% Anthocyanin Polymers
50% Anthocyanin Monomers50% Anthocyanin Polymers
100% Anthocyanin Polymers
Fig. 27. Percent changes in total HT-29 cell numbers expressed as a ratio to control
cells following treatment of cells with anthocyanin monomer and polymer fractions adjusted to different concentrations (µg/mL) for 48 h. Error bars represent the standard error of the mean (n=6).
147
Differences in the inhibitory effects of monomeric and polymeric anthocyanin
extracts may be due to variations in their anthocyanin composition, as the availability of
functional groups and ability to access target sites within the cells is likely higher for
monomeric anthocyanin glycosides. Anthocyanin chemical structure has been found to
influence the chemopreventive and antiproliferative activities of anthocyanin-rich
extracts in similar cell models, with non-acylated, monoglycosylated anthocyanins
having a higher inhibitory effect on HT-29 cell growth when compared to their acylated
counterparts (Zhao, Giusti, Malik, Moyer, & Magnuson, 2004; Jing, Bomser, Schwartz,
He, Magnuson, & Giusti, 2008). Inhibitory concentrations (IC50) for purple corn
extracts, rich in cyanidin-3-glucoside, were estimated at ~14 µg/mL (Jing et al., 2008),
in agreement with those calculated for açai fruit anthocyanin fractions in this study
(IC50= 12.1-14.4 µg/mL).
Antiproliferative activity of monomeric anthocyanin glycosides on cancer cells
has been attributed to their effects on growth stimulatory signals across the cell
membrane, including inhibition of the epidermal growth factor receptor (EGFR)
(Meiers, Kemeny, Weyand, Gastpar, Von Angerer, & Marko, 2001) and to their ability
to interfere with various stages of the cell cycle by effects on regulator proteins such as
p21WAF1, an inhibitor of cell proliferation (Malik, Zhao, Schoene, Guisti, Moyer, &
Magnuson, 2003; Wu et al., 2007; Wang & Stoner, 2008). Additional mechanisms,
including induction of apoptosis in malignant cells are also likely to be involved in the
antiproliferative action of anthocyanin monomers (Hou, 2003; Chen, Chu, Chiou,
Chiang, Yang, & Hsieh, 2005; Seeram et al., 2006; Srivastava, Akoh, Fischer, &
148
Krewer, 2007; Fimognari, Lenzi, & Hrelia, 2008; Neto, Amoroso, & Liberty, 2008).
Similar mechanisms might be responsible for the inhibitory effects of anthocyanin
polymers on colon cancer cell growth, yet this is the first report on the antiproliferative
activity of polymeric anthocyanin fractions on cancer cells in-vitro. Results from this
study suggest both monomeric and polymeric anthocyanin fractions may inhibit colon
cancer cell proliferation and potentially exert other important biological functions in
tissues exposed to these fractions.
Caco-2 cell monolayers were used as in-vitro models to assess intestinal
absorption of monomeric and polymeric anthocyanin fractions from açai fruit.
Unidirectional anthocyanin transport was assessed from the apical to basolateral side of
differentiated cell monolayers. Transport efficiencies were expressed as the percentage
of anthocyanin concentrations initially loaded into the apical side detected on the
basolateral side of cell monolayers following incubation for 0.5, 1.0, 1.5, and 2.0 h.
Analytical HPLC chromatograms of anthocyanins present in the basolateral side of cell
monolayers following incubation with monomeric and polymeric anthocyanin fractions
for 2 h are presented in Fig. 28. Cyanidin-3-glucoside and cyanidin-3-rutinoside present
in all açai fruit anthocyanin fractions were transported from apical to basolateral sides of
cell monolayers, while additional polymeric anthocyanin fraction components were not
transported following incubation for up to 2 h (Fig. 28). Transport efficiencies of
monomeric and polymeric anthocyanin fractions and their mixtures are shown in Table
23.
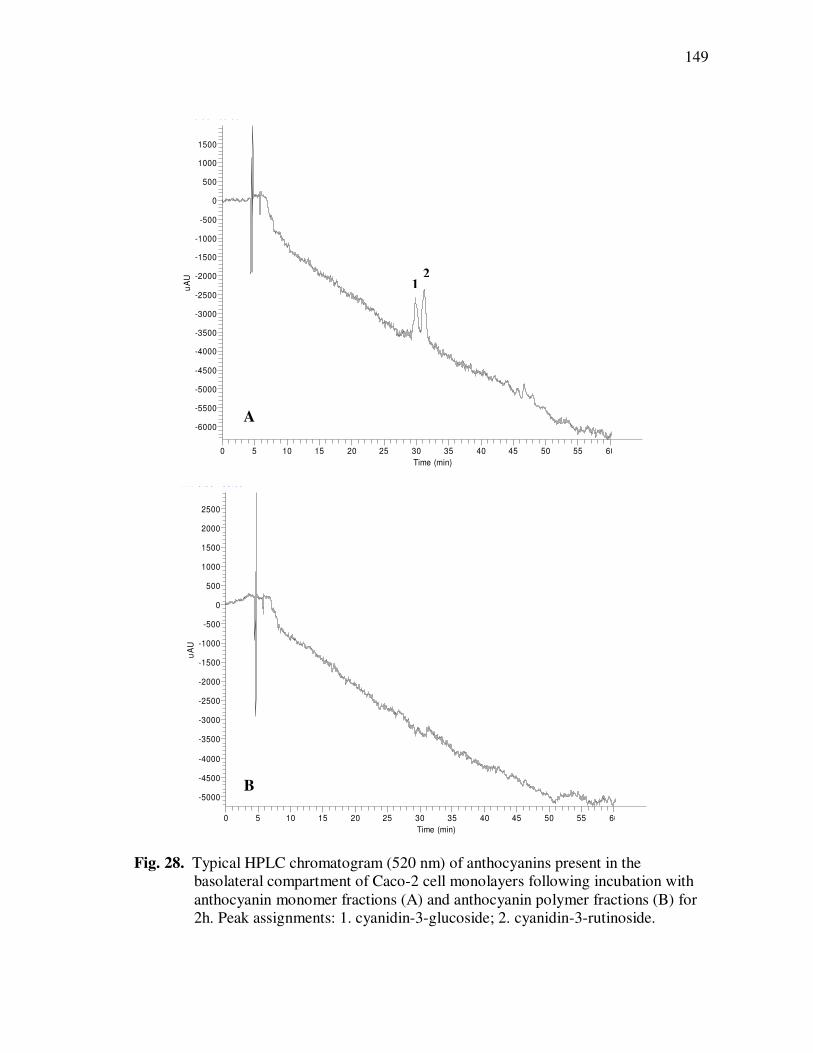
149
Fig. 28. Typical HPLC chromatogram (520 nm) of anthocyanins present in the
basolateral compartment of Caco-2 cell monolayers following incubation with anthocyanin monomer fractions (A) and anthocyanin polymer fractions (B) for 2h. Peak assignments: 1. cyanidin-3-glucoside; 2. cyanidin-3-rutinoside.
RT: 0.00 - 65.00
0 5 10 15 20 25 30 35 40 45 50 55 60
Time (min)
-6000
-5500
-5000
-4500
-4000
-3500
-3000
-2500
-2000
-1500
-1000
-500
0
500
1000
1500
uA
U
1 2
A
RT: 0.00 - 65.00
0 5 10 15 20 25 30 35 40 45 50 55 60
Time (min)
-5000
-4500
-4000
-3500
-3000
-2500
-2000
-1500
-1000
-500
0
500
1000
1500
2000
2500
uA
U
B
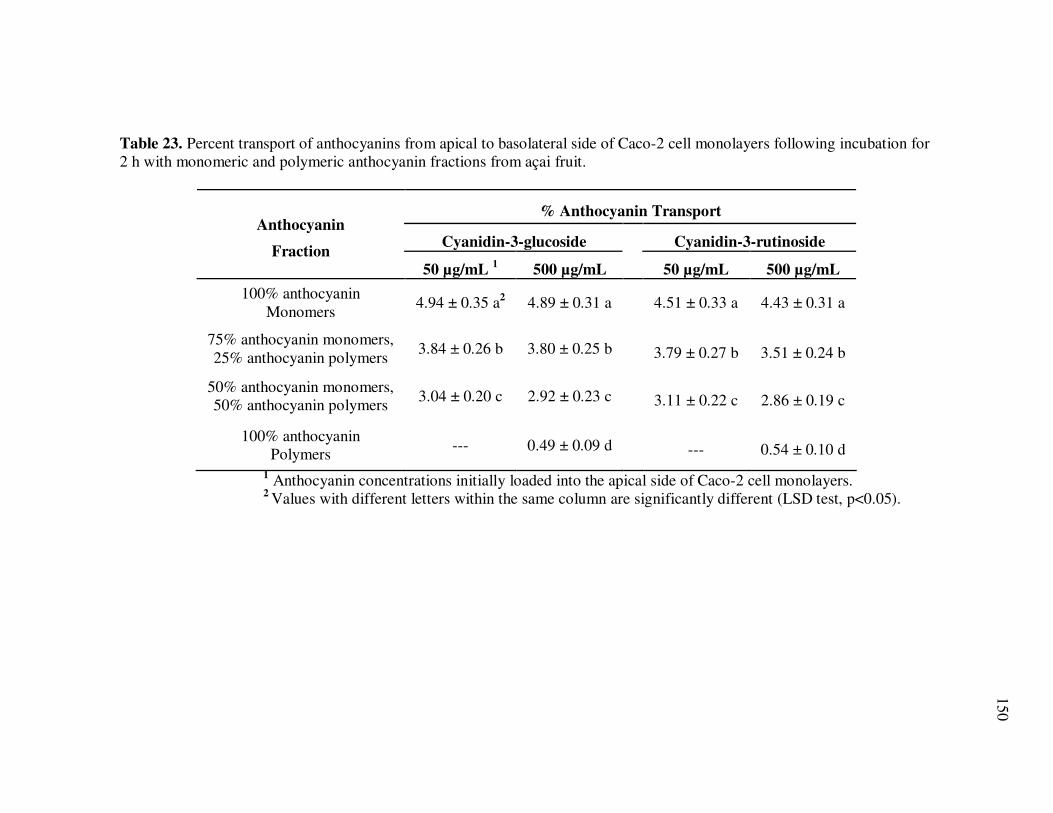
150
Table 23. Percent transport of anthocyanins from apical to basolateral side of Caco-2 cell monolayers following incubation for 2 h with monomeric and polymeric anthocyanin fractions from açai fruit.
% Anthocyanin Transport
Cyanidin-3-glucoside Cyanidin-3-rutinoside Anthocyanin
Fraction 50 µg/mL
1 500 µg/mL 50 µg/mL 500 µg/mL
100% anthocyanin Monomers
4.94 ± 0.35 a2 4.89 ± 0.31 a 4.51 ± 0.33 a 4.43 ± 0.31 a
75% anthocyanin monomers, 25% anthocyanin polymers
3.84 ± 0.26 b 3.80 ± 0.25 b 3.79 ± 0.27 b 3.51 ± 0.24 b
50% anthocyanin monomers, 50% anthocyanin polymers 3.04 ± 0.20 c 2.92 ± 0.23 c 3.11 ± 0.22 c 2.86 ± 0.19 c
100% anthocyanin Polymers --- 0.49 ± 0.09 d --- 0.54 ± 0.10 d
1 Anthocyanin concentrations initially loaded into the apical side of Caco-2 cell monolayers. 2 Values with different letters within the same column are significantly different (LSD test, p<0.05).
151
Percent transport of monomeric anthocyanin glycosides following incubation for
2 h ranged from 0.5 to 4.9% in all anthocyanin fractions tested, and was higher for
monomeric fractions (4.4 to 4.9%). Decreased monomeric anthocyanin transport
efficiencies were observed for anthocyanin mixtures containing 25% to 50% polymeric
fractions (2.9 to 3.8%), while anthocyanins in polymeric fractions had the lowest
transport efficiencies, at 0.5 ± 0.1% (Table 23). Similar results were also observed
following incubation for 0.5, 1.0, and 1.5 h (Fig. 29). Decreased monomeric anthocyanin
transport (16.0 to 40.3%) in anthocyanin fraction mixtures containing polymeric
fractions (25 to 50%) indicated anthocyanin polymers may interfere with monomeric
anthocyanin transport mechanisms. Mechanisms for absorption and transport of
monomeric anthocyanin glycosides through cell monolayers are not yet clear, and both
active and passive transport mechanisms have been proposed (Cao et al., 2001; Brown,
Khodr, Hider, & Rice-Evans, 1998; Hollman & Katan, 1998; Hollman, Bijsman, van
Gameren, Cnossen, de Vries, & Katan, 1999; Gee et al., 2000; Williamson, Day, Plumb,
& Couteau, 2000; Mulleder, Murkovic, & Pfannhauser, 2002; Manach, Williamson,
Morand, Scalber, & Remesy, 2005). Results from this study suggest the presence of
anthocyanin polymers may interfere with either active or passive transport mechanisms
involved in the absorption of anthocyanin glycosides.
To determine a dose response on transport efficiency, 50 or 500 µg/mL of both
monomeric and polymeric anthocyanin fractions and two combination ratios were
loaded into the apical compartment of the cell monolayers. No differences were found
for the relative transport rates of cyanidin-3-glucoside or cyanidin-3-rutinoside for either
152
fraction, suggesting intestinal transport efficiency of anthocyanin glycosides was not
dose-dependent (Table 23). Moreover, both target anthocyanins were equally (p<0.05)
transported from the apical to basolateral side of the cell monolayers, indicating that the
glycosidic moiety (glucose to rutinose) had no influence on absorption of these cyanidin-
based anthocyanins (Table 23).
Average transport rates (µg/L·h) of anthocyanin glycosides following incubation
with monomeric and polymeric anthocyanin fractions and their mixtures (50 or 500
µg/mL) were calculated based on the relative amount of anthocyanins transported from
apical to basolateral side of cell monolayers over time (0.5, 1.0, 1.5, and 2.0 hrs), as
shown in Fig. 29. Anthocyanin transport rates varied with anthocyanin composition, and
ranged from 3.2 to 19.6 µg/L·h (Table 24). Transport rates were higher for anthocyanin
glycosides present in monomeric fractions (18.9-19.6 µg/L·h), and decreased to 11.6-
16.2 µg/L·h as the relative proportion of polymeric fractions increased from 25% to50%.
Transport rates were lowest (3.2-3.6 µg/L·h) in the polymeric anthocyanin fraction.
Similar to previous observations on anthocyanin transport efficiencies, variations in
anthocyanin concentration levels loaded into the apical compartments of cell monolayers
(50 or 500 µg/L) did not influence transport rates of cyanidin-3-glucoside or cyanidin-3-
rutinoside and no differences were found between transport rates for cyanidin-3-
glucoside and cyanidin-3-rutinoside in any of the fractions.
A strong correlation (r=0.98) was found between anthocyanin transport
efficiencies (%) and anthocyanin transport rates (µg/L·h), suggesting that factors
responsible for increased anthocyanin transport likely influenced the rate of anthocyanin
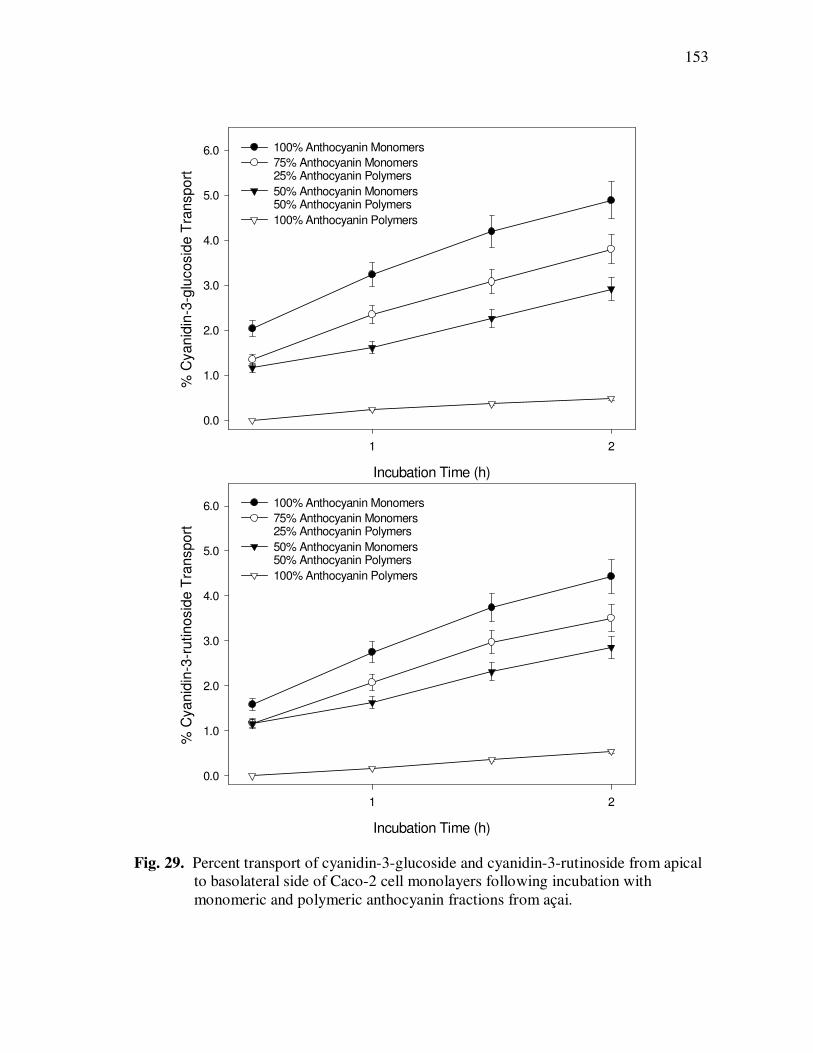
153
Incubation Time (h)
1 2
% C
yanid
in-3
-rutinosid
e T
ransport
0.0
1.0
2.0
3.0
4.0
5.0
6.0 100% Anthocyanin Monomers
75% Anthocyanin Monomers25% Anthocyanin Polymers
50% Anthocyanin Monomers50% Anthocyanin Polymers
100% Anthocyanin Polymers
Incubation Time (h)
1 2
% C
yanid
in-3
-glu
cosid
e T
ransport
0.0
1.0
2.0
3.0
4.0
5.0
6.0 100% Anthocyanin Monomers
75% Anthocyanin Monomers25% Anthocyanin Polymers
50% Anthocyanin Monomers50% Anthocyanin Polymers
100% Anthocyanin Polymers
Fig. 29. Percent transport of cyanidin-3-glucoside and cyanidin-3-rutinoside from apical to basolateral side of Caco-2 cell monolayers following incubation with monomeric and polymeric anthocyanin fractions from açai.
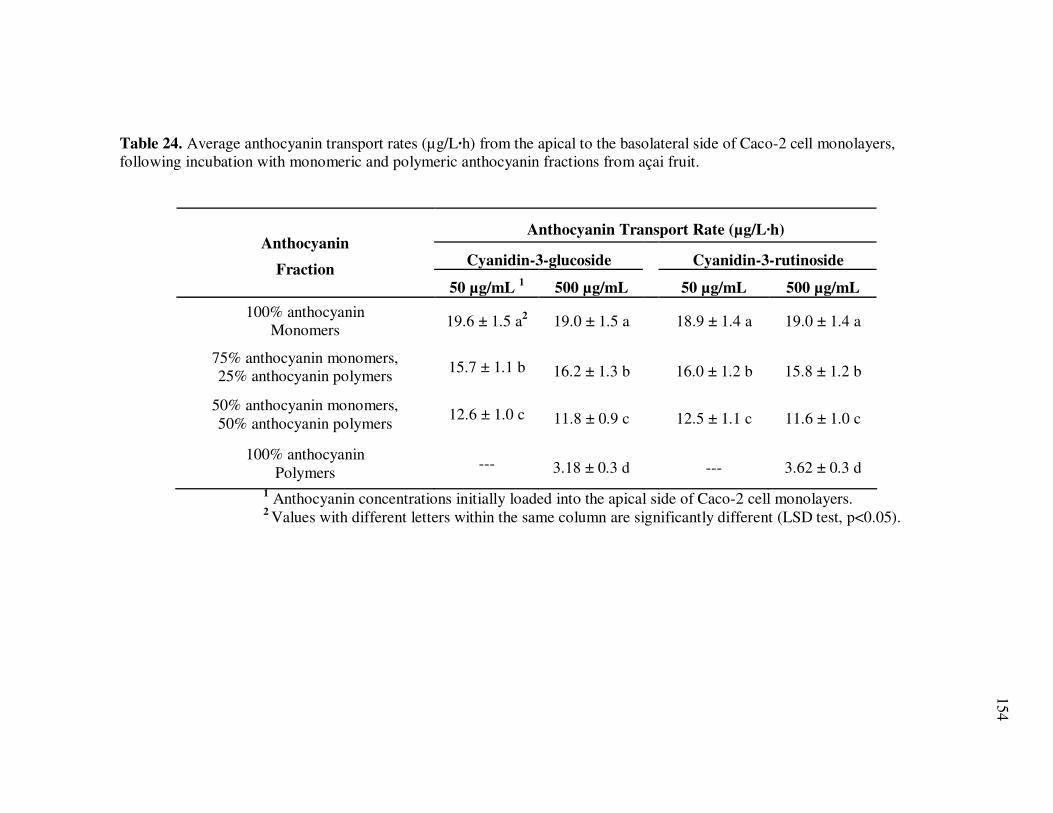
154
Table 24. Average anthocyanin transport rates (µg/L·h) from the apical to the basolateral side of Caco-2 cell monolayers, following incubation with monomeric and polymeric anthocyanin fractions from açai fruit.
Anthocyanin Transport Rate (µg/L·h)
Cyanidin-3-glucoside Cyanidin-3-rutinoside Anthocyanin
Fraction 50 µg/mL
1 500 µg/mL 50 µg/mL 500 µg/mL
100% anthocyanin Monomers 19.6 ± 1.5 a2 19.0 ± 1.5 a 18.9 ± 1.4 a 19.0 ± 1.4 a
75% anthocyanin monomers, 25% anthocyanin polymers 15.7 ± 1.1 b 16.2 ± 1.3 b 16.0 ± 1.2 b 15.8 ± 1.2 b
50% anthocyanin monomers, 50% anthocyanin polymers
12.6 ± 1.0 c 11.8 ± 0.9 c 12.5 ± 1.1 c 11.6 ± 1.0 c
100% anthocyanin Polymers
--- 3.18 ± 0.3 d --- 3.62 ± 0.3 d
1 Anthocyanin concentrations initially loaded into the apical side of Caco-2 cell monolayers. 2 Values with different letters within the same column are significantly different (LSD test, p<0.05).
155
transport in these models. Thus, higher transport efficiencies may be associated with
transport mechanisms targeting monomeric anthocyanin glycosides, potentially inhibited
or disrupted by the presence of polymeric anthocyanin fractions. Polymeric anthocyanin
fractions may decrease transport of monomeric anthocyanin glycosides due to the
presence of polar hydroxyl group ends, which have been associated with increased
hydrogen-bond formation at the surface of the cell membrane, resulting in lower
transport efficiencies (Saija, Scalese, Lanza, Marzullo, Bonina, & Castelli, 1995; Van
Dijk, Driessen, & Recourt, 2000; Ollila et al., 2002). Although mechanisms for
anthocyanin transport are still in debate and may be influenced by numerous factors
including molecular weight or substituent moieties, this is the first report to show that
polymeric anthocyanins are prevented from absorption in-vitro and that polymeric
anthocyanins exert an inhibitory response to the absorption of monomeric anthocyanin
glycosides.
Conclusion
The influence of anthocyanin polymerization reactions on the chemical
composition, antioxidant properties, antiproliferative activity, and in-vitro absorption of
anthocyanins from açai fruit were evaluated. Monomeric anthocyanin fractions were
characterized by the predominant presence of cyanidin-3-glucoside and cyanidin-3-
rutinoside, while several anthocyanin adducts were found in polymeric fractions. Both
fractions (0.5-100 µg cyanidin-3-glucoside equivalents/mL) inhibited HT-29 colon
cancer cell proliferation in a concentration-dependent manner by up to 95.2%. In-vitro
156
absorption trials using Caco-2 intestinal cell monolayers demonstrated that cyanidin-3-
glucoside and cyanidin-3-rutinoside were similarly transported from the apical to the
basolateral side of the cell monolayers (0.5-4.9% efficiency), while no anthocyanin
adducts were transported following incubation for up to 2 h. The presence of polymeric
anthocyanin fractions also decreased transport of monomeric anthocyanin glycosides in
a dose-dependent manner by up to 40.3%. Results from this study suggest the presence
of anthocyanin polymers may significantly influence anthocyanin absorption properties
in açai fruit products.
157
CHAPTER IX
SUMMARY
Açai fruit are native to the Amazon region of South America and two
predominant species are commercially exported as fruit pulps for use in food and
beverage applications. Detailed characterization of the polyphenolic compounds present
in the fruits of Euterpe oleracea and Euterpe precatoria species were conducted by
HPLC-ESI-MSn analyses and their thermal stability and overall influence on antioxidant
capacity determined. Anthocyanins were the predominant polyphenolics in both E.
oleracea (2,247 ± 23 mg/kg) and E. precatoria (3,458 ± 16 mg/kg) species, and
accounted for nearly 90% of the antioxidant capacity in both E. oleracea (87.4 ± 4.4
µmol TE/g) and E. precatoria (114 ± 6.9 µmol TE/g) fruits. Various flavones, including
isoorientin, orientin, taxifolin deoxyhexose, and isovitexin; flavanol derivatives,
including (+)-catechin, (-)-epicatechin, procyanidin dimers and trimers; and phenolic
acids, including protocatechuic, p-hydroxybenzoic, vanillic, syringic, and ferulic acid,
were also present in both species. Thermal stability was evaluated following a thermal
holding cycle (80ºC for up to 60 min) in the presence and absence of oxygen. Both
species experienced minor changes (<5%) in non-anthocyanin polyphenolic contents
during all thermal processes whereas 34 ± 2.3% of anthocyanins in E. oleracea and 10.3
± 1.1% of anthocyanins in E. precatoria were lost under these conditions, regardless of
the presence of oxygen. Proportional decreases (10 to 25%) in antioxidant capacity
accompanied the anthocyanin changes. Both açai species were characterized by similar
158
polyphenolic profiles, comparable antioxidant capacities, yet only moderate
phytochemical stability during heating.
Polyphenolic compounds present in crude oil extracts from açai fruit were
identified for the first time. Stability of açai oil that contained three concentrations of
polyphenolics was evaluated under a short and long-term storage for lipid oxidation and
polyphenolic retention impacting antioxidant capacity. Similar to açai fruit, açai oil
isolates contained phenolic acids such as vanillic acid (1,616 ± 94 mg/kg), syringic acid
(1,073 ± 62 mg/kg), p-hydroxy benzoic acid (892 ± 52 mg/kg), protocatechuic acid (630
± 36 mg/kg), and ferulic acid (101 ± 5.9 mg/kg) at highly enriched concentrations in
relation to açai pulp, as well as (+)-catechin (66.7 ± 4.8 mg/kg) and various procyanidin
oligomers (3,102 ± 130 mg/kg). Phenolic acids experienced up to 16% loss after 10
weeks storage at 20 or 30°C and up to 33% loss at 40°C. Procyanidin oligomers
degraded more extensively (23% at 20°C, 39% at 30°C, and 74% at 40°C), in both high-
and low-polyphenolic açai oils. The hydrophilic antioxidant capacity of açai oil isolates
with the highest polyphenolic concentration was 21.5 ± 1.7 µmol TE/g and total soluble
phenolic content was 1,252 ± 11 mg gallic acid equivalents, GAE/kg and each decreased
by up to 30 and 40%, respectively during long-term storage. Short-term heating stability
at 150 and 170 °C for up to 20 min exhibited only minor losses (<10%) in polyphenolics
and antioxidant capacity. Due to its high polyphenolic content, the phytochemical
enriched açai oil from açai fruit offers a promising alternative to traditional tropical oils
for food, supplement, and cosmetic applications.
159
Polyphenolic extracts from various fruits and vegetables have been shown to
exert growth inhibitory effects in cell culture studies. Whereas individual polyphenolic
compounds have been extensively evaluated, understanding the biological activity of
polyphenolic extracts from natural sources are limited and critical to understanding their
potential effects on the human body. Thus, the absorption and anti-proliferative effects
of phytochemical extracts from açai pulp and a polyphenolic-enriched açai oil obtained
from the fruit pulp of the açai berry were investigated. Chemical composition,
antioxidant properties, and polyphenolic absorption of phytochemical fractions in a
Caco-2 monolayer were determined, along with their cytotoxicity in HT-29 human colon
adenocarcinoma cells. Extracts were characterized by their predominance of
hydroxybenzoic acids, monomeric flavan-3-ols, and procyanidin dimers and trimers.
Polyphenolic mixtures (0-12 µg GAE/mL) from both açai pulp and açai oil extracts
inhibited cell proliferation by up to 90.7%, which was accompanied by up to 2.1 fold
increase in reactive oxygen species. Absorption experiments using a Caco-2 intestinal
cell monolayer demonstrated that phenolic acids such as p-hydroxy benzoic, vanillic,
syringic, and ferulic acids were readily transported from the apical to the basolateral side
along with monomeric flavanols such as (+)-catechin and (-)-epicatechin. Results
indicated açai fruit extracts are sources of bioactive and absorbable polyphenolics.
The influence of different classes of previously characterized polyphenolic
cofactors naturally occurring in açai on the phytochemical and color stability of
anthocyanins in açai fruit was also investigated. Model systems were based on
anthocyanin isolates from açai fruit, rich in cyanidin-3-rutinoside (311 ± 27 mg/L) and
160
cyanidin-3-glucoside (208 ± 18 mg/L), and isolated groups of naturally occurring
polyphenolic cofactors in açai fruit (phenolic acids, procyanidins, and flavone-C-
glycosides, each adjusted to ~50 mg/L). Anthocyanin degradation kinetics were assessed
as a function of pH (3.0, 3.5, and 4.0) and storage temperature (5, 20 and 30°C). During
storage, anthocyanins experienced pH and temperature-dependent losses, and the half
life cyanidin-3-rutinoside (t½= 2.67 to 210 days) was consistently longer than cyanidin-
3-glucoside (t½= 1.13 to 144 days). The presence of flavone-C-glycosides induced
significant hyperchromic shifts and enhanced anthocyanin stability at all pH and
temperature combinations, while no effects were attributed to the presence of phenolic
acids or procyanidins. Additional models using externally added cofactors from rooibos
tea, also rich in flavone-C-glycosides, resulted in up to 45.5% higher anthocyanin color
and up to 40.7% increased anthocyanin stability compared to uncopigmented
anthocyanin isolates and had similar copigmentation effects to a commercial rosemary-
based color enhancer. Results suggest flavone-C-glycosides offer potential for their use
as color enhancers and stabilizing agents in products rich in cyanidin glycosides,
particularly açai fruit-containing juice blends and beverages.
Anthocyanin polymerization reactions occurring during storage of açai fruit
juices were additionally investigated. Several anthocyanin-flavanol adducts based on
cyanidin or pelargonidin aglycones were tentatively identified by HPLC-ESI-MSn
analyses and their presence was related to increased anthocyanin sulfite bleaching
resistance and to the appearance of a wide, unresolved peak in HPLC chromatograms.
The proposed reaction mechanism involved the nucleophilic addition of anthocyanins in
161
their hydrated form to flavanol carbocations resulting from cleavage of interflavanic
bonds, and leading to the formation of flavanol-anthocyanin adducts in açai fruit juices.
It was also hypothesized that condensed flavanol-anthocyanin pigments are not likely
exclusive products of polymerization reactions during storage, but may be naturally
occurring compounds in açai fruit. Moreover, the natural occurrence of condensed
flavanol-anthocyanin pigments in açai fruit pulp was also thought to promote the
formation of additional anthocyanin adducts and further polymerization with other
phenolic components, potentially resulting in a variety of structurally diverse
anthocyanin polymers during storage of açai fruit juices.
The role of anthocyanin polymerization reactions on anthocyanin absorption and
anti-cancer properties was also evaluated. Phytochemical composition, antioxidant
properties, antiproliferative activity, and in-vitro absorption of monomeric and
polymeric anthocyanin fractions from açai fruit were determined. Cyanidin-3-rutinoside
(58.5 ± 4.6%) and cyanidin-3-glucoside (41.5 ± 1.1%) were the predominant compounds
found in monomeric fractions, while a mixture of anthocyanin adducts were found in
polymeric fractions and characterized using HPLC-ESI-MSn analyses. Monomeric
fractions (0.5-100 µg cyanidin-3-glucoside equivalents/mL) inhibited HT-29 colon
cancer cell proliferation by up to 95.2% while polymeric anthocyanin fractions induced
up to 92.3% inhibition. In-vitro absorption trials using Caco-2 intestinal cell monolayers
demonstrated that cyanidin-3-glucoside and cyanidin-3-rutinoside were equally
transported from the apical to the basolateral side of the cell monolayers (0.5-4.9%
efficiency), while no anthocyanin adducts were transported following incubation for up
162
to 2h. Polymeric anthocyanin fractions also decreased monomeric anthocyanin transport
by up to 40.3 ± 2.8%. Results indicated that the presence of anthocyanin polymers may
significantly influence anthocyanin absorption properties in açai fruit products.
163
REFERENCES
Abedamowo, C., Cho, E., Sampson, L., Katan, M., Spiegelman, D., Willett, W., & Holmes, M. (2004). Dietary flavonols and flavonol-rich foods intake and the risk of breast cancer. International Journal of Cancer, 114, 628-633.
Adams, J. B. (1972). Changes in the polyphenols of red fruits during heat processing: the kinetics and mechanism of anthocyanin degradation. Campden Food Preservation Research Association Technology Bulletin No. 22.
Adams, J. B. (1973). Thermal degradation of anthocyanins with particular reference to the 3-glycosides of cyanidin. I. In acidified aqueous solution at 100°C. Journal of the
Science of Food and Agriculture, 24, 747–762.
Alcalde-Eon, C., Escribano-Bailon, M., Santos-Buelga, C., & Rivas-Gonzalo, J. (2006). Changes in the detailed pigment composition of red wine during maturity and ageing. A comprehensive study. Analytica Chimica Acta, 563, 238-254.
Artursson, P. (1990). Epithelial transport of drugs in cell culture. I. A model for studying the passive diffusion of drugs over intestinal absorptive (Caco-2) cells. Journal of
Pharmaceutical Science, 79, 476-482.
Asen , S., Stewart, R., Norris, K., & Massie, D. (1970). A stable blue non-metallic copigment complex of delphanin and C-glycosylflavones in Prof. Blaauw Iris. Phytochemistry, 9, 619-627.
Baba, S., Osakabe, N., Natsume, M., & Terao, J. (2002). Absorption and urinary excretion of procyanidin B2 [epicatechin-(4β-8)-epicatechin] in rats. Free Radical
Biology and Medicine, 33, 142-148.
Babsky, N., Toribio, J., & Lozano, J. (2006). Influence of storage on the composition of clarified apple juice concentrate. Journal of Food Science, 51, 564-567.
Bakker, J., & Timberlake, C. (1997). Isolation, identification, and characterization of ne color-stable anthocyanins occurring in some red wines. Journal of Agricultural and
Food Chemistry, 45, 35-43.
Balimane, P., Chong, S., & Morrison, R. (2000). Current methodologies used for evaluation of intestinal permeability and absorption. Journal of Pharmacology and
Toxicology Methods, 44, 301-312.
Baranac, J., Petranovic, N., & Dimitric-Markovic, J. (1996). Spectrophotometric study of anthocyanin copigmentation reactions. Journal of Agricultural and Food
Chemistry, 44, 1333-1336.
164
Baublis, A., Spomer, A., & Berber-Jimenez, M. (1994). Anthocyanin pigments: comparison of extract stability. Journal of Food Science, 59, 1219-1233.
Benavides, A., Montoro, P., Bassarello, C., Piacente, S., & Pizza, C. (2006). Catechin derivatives in Jatropha macrantha stems: characterization and LC/ESI/MS/MS quail-quantitative analysis. Journal of Pharmaceutical and Biomedical Analysis, 40,
639-647.
Berg, H., & Akiyoushi, M. (1975). On the nature of reactions responsible for color behavior in red wine: a hypothesis. Journal of Enology and Viticulture, 26, 134-143.
Boulton, R. (2001). The copigmentation of anthocyanins and its role in the color of red wine: a critical review. American Journal of Enology and Viticulture, 52, 67-86.
Bramati, L., Minoggio, M., Gardana, C., Simonetti, P., Mauri, P., & Pietta, P. (2002). Quantitative characterization of flavonoid compounds in Rooibos tea (Aspalathus
linearis) by LC-UV/DAD. Journal of Agricultural and Food Chemistry, 50, 5513-5519.
Brenes, C., Del Pozo-Insfran, D., & Talcott, S. T. (2005). Stability of copigmented anthocyanins and ascorbic acid in a grape juice model system. Journal of
Agricultural and Food Chemistry, 53, 49-56.
Briviba, K., Pan, L., & Rechkemmer, G. (2002). Red wine polyphenols inhibit the growth of colon carcinoma cells and modulate the activation pattern of mitogen-activated protein kinases. Journal of Nutrition, 132, 2814-2818.
Brondizio, E., Safar, C., & Siqueira, A. (2002). The urban market of açaí fruit (Euterpe
oleracea Mart.) and rural land use change: ethnographic insights into the role of price and land tenure constraining agricultural choices in the Amazon estuary. Urban
Ecosystems, 6, 67-97.
Brouillard, R. (1983). The in vivo expression of anthocyanin color in plants. Phytochemistry, 22, 1311-1323.
Brown, J., Khodr, H., Hider, R., & Rice-Evans, C. (1998). Structural dependence of flavonoid interactions with Cu2+ ions: implications for their antioxidant properties. Biochemistry Journal, 330, 1173–1178.
Bub, A., Watzl, B., Heeb, D., Rechkemmer, G., & Briviba, K. (2001). Malvidin-3-glucoside bioavailability in humans after ingestion of red wine, dealcoholized red wine and red grape juice. European Journal of Nutrition, 40, 113-120.
Burdulu, H., & Karadeniz, F. (2003). Effect of storage on nonenzymatic browning of apple juice concentrates. Food Chemistry, 80, 91-97.
165
Cao, G., Muccitelli, H., Sanchez-Moreno, C., & Prior, R. (2001). Anthocyanins are absorbed in glycated forms in elderly women: a pharmacokinetic study. American
Journal of Clinical Nutrition, 73, 920-926.
Careri, M., Bianchi, F., & Corradini, C. (2002). Recent advances in the application of mass spectrometry in food-related analysis. Journal of Chromatography A, 970, 3-64.
Careri, M., Mangia, A., & Musci, M. (1998). Overview of the applications of liquid chromatography mass spectrometry interfacing systems in food analysis: naturally occurring substances in food. Journal of Chromatography A, 794, 263-297.
Caristi, C., Bellocco, E., Gargiulli, C., Toscano, G., & Leuzzi, U. (2006). Flavone-di-C-glycosides in citrus juices from Southern Italy. Food Chemistry, 95, 431-437.
Chang, Y., Huang, H., Hsu, J., Yang, S., & Wang, C. (2005). Hibiscus anthocyanins rich extract-induced apoptotic cell death in human promyelocytic leukemia cells. Toxicology and Applied Pharmacology, 205, 201-212.
Chen, P., Chu, S., Chiou, H., Chiang, C., Yang, S., & Hsieh, Y. (2005). Cyanidin-3-glucoside and peonidin-3-glucoside inhibit tumor cell growth and induce apoptosis in vitro and suppress tumor growth in vivo. Nutrition and Cancer, 53, 232-243.
Cheynier, V., Duenas-Paton, M., Salas, E., Maury, C., Souquet, P., Sarni-Manchado, P., & Fulcrand, H. (2006). Structure and properties of wine pigments and tannins. American Journal of Enology and Viticulture, 57, 298-305.
Chun, O., Dim, D., Smith, N., Schroeder, D., Han, J., & Lee, C. (2005). Daily consumption of phenolics and total antioxidant capacity from fruit and vegetables in the American diet. Journal of the Science of Food and Agriculture, 85, 1715-1724.
Clay, J. & Clement, C. (1993). Selected species and strategies to enhance income generation from Amazonian forests. Food and Agriculture Organization of the United Nations Corporate Document Repository V0784/E. Rome, Italy.
Clifford, M. (2000). Anthocyanins: nature, occurrence and dietary burden. Journal of the
Science of Food and Agriculture, 80, 1063-1072.
Coisson, J., Travaglia, F., Piana, G., Capasso, M., & Arlorio, M. (2005). Euterpe
oleracea juice as a functional pigment for yogurt. Food Research International, 38, 893-897.
Cook, N. & Samman, S. (1996). Flavonoids-chemistry, metabolism, cardioprotective effects and dietary sources. Journal of Nutritional Biochemistry, 7, 66-76.
166
Cos, P., De Bruyne, T., Hermans, N., Apers, S., Vanden-Berghe, D., & Vlietinck, A. (2003). Proanthocyanidins in health care: current and new trends. Current Medicinal
Chemistry, 10, 1345-1359.
Cuyckens, F., & Claeys, M. (2004). Mass spectrometry in the structural analysis of flavonoids. Journal of Mass Spectrometry, 39, 1-15.
Dallas, C., Ricardo-da-Silva, J., & Laureano, O. (1996). Interactions of oligomeric procyanidins in model wine solutions containing malvidin-3-glucoside and acetaldehyde. Journal of the Science of Food and Agriculture, 70, 493-500.
Dao, L., Takeoka, G., Edwards, R., & Berrios, J. (1998). Improved method for the stabilization of anthocyanidins. Journal of Agricultural and Food Chemistry, 46, 3564-3569.
De Ancos, B., Gonzales, E., & Cano, M. (1999). Differentiation of raspberry varieties according to anthocyanin composition. Food Research and Technology, 208, 33-38.
De Bruyne, T., Pieters, L., Deelstra, H., & Vlietinck, A. (1999). Condensed vegetable tannins: Biodiversity in structure and biological activities. Biochemical Systematics
and Ecology, 27, 445-459.
De Pascual-Teresa, S., Santos-Buelga, C., & Rivas-Gonzalo, J. (2002). LC-MS analysis of anthocyanins from purple corn cob. Journal of the Science of Food and
Agriculture, 82, 1003-1006.
Del Pozo, D., Brenes, C., & Talcott, S. (2004). Phytochemical composition and pigment stability of Açai (Euterpe oleracea Mart.). Journal of Agricultural and Food
Chemistry, 52, 1539-1545.
Delgado-Vargas, F., Jiménez, A.R., & Paredes-Lopez, O. (2002). Natural pigments: carotenoids, anthocyanins and betalains, characteristics, biosynthesis, processing, and stability. Critical Reviews in Food Science and Nutrition, 40, 173–289.
Deprez, S., Mila, I., Humeau, J.F., Tome, D., & Scalbert, A. (2001). Transport of proanthocyanidin dimer, trimer, and polymer across monolayers of human intestinal epithelial Caco-2 cells. Antioxidants and Redox Signaling, 3, 957-967.
Dragsted, L., Strube, M., & Leth, T. (1997). Dietary levels of plant phenols and other non-nutritive components: could they prevent cancer? European Journal of Cancer
Prevention, 6, 522-528.
Dueñas, M., Fulcrand, H., & Cheynier, V. (2006). Formation of anthocyanin-flavanol adducts in model solutions. Analytica Chimica Acta, 563, 15-25.
167
Eiro, M., & Heinonen, M. (2002). Anthocyanin color behavior and stability during storage: effect of intermolecular copigmentation. Journal of Agricultural and Food
Chemistry, 50, 7461-7466.
Elattar, T., & Viriji, A. (1999). The effect of red wine and its components on growth and proliferation of human oral squamous carcinoma cells. Anticancer Research, 19,
5407-5414.
Es-Safi, N., Cheynier, V., & Moutounet, M. (2000). Study of the reactions between (+)-catechin and furfural derivatives in the presence or absence of anthocyanins and their implication in food color change. Journal of Agricultural and Food Chemistry, 48, 5946-5954.
Es-Safi, N., Cheynier, V., & Moutounet, M. (2002). Interactions between cyanidin-3-O-glucoside and furfural derivatives and their impact on food color changes. Journal of
Agricultural and Food Chemistry, 50, 5586-5595.
Es-Safi, N., Fulcrand, H., Cheynier, V., & Moutounet, M. (1999). Studies on the acetaldehyde-induced condensation of (-)-epicatechin and malvidin-3-O-glucoside in a model solution system. Journal of Agricultural and Food Chemistry, 47, 2096-2102.
Felgines, C., Talavera, S., Gothier, M., Texier, O., Scalbert, A., Lamaison, J., & Remesy, C. (2003). Strawberry anthocyanins are recovered in urine as glucuro-and sulfoconjugates in humans. Journal of Nutrition, 133, 1296-1301.
Felgines, C., Texier, O., Besson, C., Fraisse, D., Lamaison, J., & Remesy, C. (2002). Blackberry anthocyanins are slightly bioavailable in rats. Journal of Nutrition, 132,
1249-1253.
Ferguson, P., Kurowska, E., Freeman, D., Chambers, A., & Koropatnick, D. (2004). A flavonoid fraction from cranberry extract inhibits proliferation of human tumor cell lines. Journal of Nutrition, 134, 1529-1535.
Ferreres, F., Silva, B., Andrade, P., Seabra, R., & Ferreira, M. (2003). Approach to the study of C-glycosyl flavones by ion trap HPLC-PDA-ESI/MS/MS: application to seeds of quince (Cydonia oblonga). Phytochemical Analysis, 14, 352-259.
Fimognari, C., Lenzi, M., & Hrelia, P. (2008). Chemoprevention of cancer by isothiocyanates and anthocyanins: mechanisms of action and structure-activity relationship. Current Medicinal Chemistry, 15, 440-447.
Flamini, R. (2003). Mass spectrometry in grape and wine chemistry. Part I: Polyphenols. Mass Spectrometry Reviews, 22, 218-221.
168
Fossen, T., Rayyan, S., & Andersen, O. (2004). Dimeric anthocyanins from strawberry (Fragaria ananassa) consisting of pelargonidin-3-glucoside covalently linked to four flavan-3-ols. Phytochemistry, 65, 1421-1428.
Francia-Aricha, E., Guerra, M., Rivas-Gonzalo, J., & Santos-Buelga, C. (1997). New anthocyanin pigments formed after condensation with flavanols. Journal of
Agricultural and Food Chemistry, 45, 2262-2266.
Francis, F. (1989). Food colorants: anthocyanins. Critical Reviews in Food Science and
Nutrition, 28, 273-314.
Friederich, W., Eberhardt, A., & Galensa, R. (2000). Investigation of proanthocyanidins by HPLC with electrospray ionization mass spectrometry. European Food Research
and Technology, 211, 56-64.
Fulcrand, H., Benabdeljalil, C., Rigaud, J., Cheynier, V., & Moutounet, M. (1998). A new class of wine pigments yielded by reactions between pyruvic acid and grape anthocyanins. Phytochemistry, 47, 1401-1407.
Fulcrand, H., Cameira dos Santos, P., Sarni-Manchado, P., Cheynier, V., & Bonvin, J. (1996). Structure of new anthocyanin-derived wine pigments. Journal of Chemical
Society and Perkin Transations, 1, 735-739.
Fulcrand, H., Docco, T., Es-Safi, N., Cheynier, V., & Moutounet, M. (1996). Study of acetaldehyde induced polymerization of flavan-3-ols by liquid chromatography-ion spray mass spectrometry. Journal of Chromatography A, 752, 85-91.
Gallori, S., Bilia, A., Bergonzi, M., Barbosa, L., & Vincieri, F. (2004). Polyphenolic constituents of fruit pulp of Euterpe oleracea Mart. (açai palm). Chromatographia, 59, 739-743.
Galotta, A., & Boaventura, M. (2005). Chemical constituents from roots and leaf stalks of açai (Euterpe precatoria Mart., Arecaceae). Quimica Nova, 28, 610-613.
Galvano, F., La Fauci, L., Lazzarino, G., Fogliano, V., Ritieni, A., Ciappellano, S., Battistini, N., Tavazzi, B., & Galvano, G. (2004). Cyanidins: metabolism and biological properties. Journal of Nutritional Biochemistry, 15, 2-11.
Garzon, G., & Wrolstad, R. (2002). Comparison of the stability of pelargonidin-based anthocyanins in strawberry juice and concentrate. Journal of Food Science, 67, 1288-1299.
Gattuso, G., Barreca, D., Gargiulli, C., Leuzzi, U., & Caristi, C. (2007). Flavonoid composition of citrus juices. Molecules, 12, 1641-1673.
169
Gee, J., DuPont, M., Day, M., Day, A., Plumb, G., Williamson, G., & Johnson, I. (2000). Intestinal transport of quercetin glycosides in rats involves both deglycosylation and interaction with the hexose transport pathway. Journal of Nutrition, 130, 2765–2771.
Gil-Izquierdo, A., & Mellenthin, A. (2001). Identification and quantitation of flavonols in rowanberry (Sorbus aucuparia L.) juice. European Food Research and
Technology, 213, 1438-2377.
Gonzalez-Manzano, S., Perez-Alonso, J., Salinas-Moreno, Y., Mateus, N., Silva, A., De Freitas, V., & Santos-Buelga, C. (2008). Flavanol-anthocyanin pigments in corn: NMR characterisation and presence in different purple corn varieties. Journal of
Food Composition and Analysis, 21, 521-526.
Gonzalez-Paramas, A., Lopes da Silva, F., Martin-Lopez, P., Macz-Pop, G., Gonzalez-Manzano, S., Alcalde-Eon, C., Perez-Alonso, J., Escribano-Bailon, M., Rivas-Gonzalo, J., & Santos-Buelga, C. (2006). Flavanol-anthocyanin condensed pigments in plant extracts. Food Chemistry, 94, 428-436.
Grayer, R., Kite, G., Abou-Zaid, M., & Archer, L. (2000). The application of atmospheric pressure chemical ionization liquid chromatography-mass spectrometry in the chemotaxonomic study of flavonoids: characterization of flavonoids from Ocimum gratissimum var. Gratissimum. Phytochemical Analysis,11, 257–267.
Gu, L., Kelm, M., Hammerstone, J., Beecher, G., Cunningham, D., Vannozzi, S., & Prior, R. (2002). Fractionation of polymeric procyanidins from lowbush blueberry and quantification of procyanidins in selected foods with an optimized normal-phase HPLC-MS fluorescent detection method. Journal of Agricultural and Food
Chemistry, 50, 4852-4860.
Gu, L., Kelm, M., Hammerstone, J., Zhang Z., Beecher, G., Holden, H., Haytowitz, D., & Prior, R. (2003). Liquid chromatographic/electrospray ionization mass spectrometric studies of proanthocyanidins in foods. Journal of Mass Spectrometry,
38, 1272-1280.
Guyot, S., Doco, T., Souquet, J., Moutounet, M., & Drilleau, J. (1997). Characterization of highly polymerized procyanidins in cider apple (Malus sylvestris var. kermerrien) skin and pulp. Phytochemistry, 44, 351-357.
Guyot, S., Marnet, N., & Drilleau, J. (2001). Thiolysis-HPLC characterization of apple procyanidins covering a large range of polymerization states. Journal of Agricultural
and Food Chemistry, 49, 14-20.
Hammerstone, J., Lazarus, S., Mitchell, A., Rucker, R., & Schmitz, H. (1999). Identification of procyanidins in cocoa (Theobroma cacao) and chocolate using
170
high-performance liquid Chromatography/Mass Spectrometry. Journal of
Agricultural and Food Chemistry, 47, 490-496.
Han, J., Ye, M., Xu, M., Sun, J., Wang, B., & Guo, D. (2007). Characterization of flavonoids in the tradicional Chinese herbal medicine Huangqin by liquid chromatography coupled with electrospray ionization mass spectrometry. Journal of
Chromatography B, 848, 355–362.
Harborne, J. (1964). Plant polyphenols. XI. Structure of acylated anthocyanins. Phytochemistry, 3, 151-160.
Haslam, E. (1980). In vino veritas: oligomeric procyanidins and the ageing of red wines. Phytochemistry, 19, 2577-2582.
Herrmann, K. (1995). The shikimate pathway: early steps in the biosynthesis of aromatic compounds. Plant Cell, 7, 907-919.
Hertog, M., Bueno-de-Mesquita, H., & Fehily, A. (1996). Fruit and vegetable consumption and cancer mortality in the Caerphilly strudy. Cancer Epidemiology
Biomarkers and Prevention, 5, 673-677.
Hidalgo, I., Raub, T., & Borchardt, R. (1989). Characterization of the human colon carcinoma cell line (Caco-2) as a model system for intestinal epithelial permeability. Gastroenterology, 96, 736-749.
Hollman, P., & Katan, M. (1998). Bioavailability and health effects of dietary flavonols in man. Archives of Toxicology Supplement, 20, 237–248.
Hollman, P., Bijsman, M., van Gameren, Y., Cnossen, E., de Vries, J., & Katan, M. (1999). The sugar moiety is a major determinant of the absorption of dietary flavonoid glycosides in man. Free Radical Research, 31, 569–573.
Hong, E., & Wrolstad, R. (1990). Use of HPLC separation/photodiode array detection for the characterization of anthocyanins. Journal of Agricultural and Food
Chemistry, 38, 708-715.
Horwitz, W., Ed. (2000). Official Methods of Analysis of AOAC International, 17th ed.; AOAC International, Gaithersburg, MD.
Hou, D. (2003). Potential mechanisms of cancer chemoprevention by anthocyanins. Current Molecular Medicine, 3,149-159.
Jackman, R., Yada, R., Tung, M., & Speers R. (1987). Anthocyanins as food colorants- a review. Journal of Food Biochemistry, 11, 201-247.
171
Jing, P., Bomser, J., Schwartz, S., He, J., Magnuson, B., & Giusti, M. (2008). Structure-function relationships of anthocyanins from various anthocyanin-rich extracts on the inhibition of colon cancer cell growth. Journal of Agricultural and Food Chemistry,
56, 9391-9398.
Jurd, L. (1967). Anthocyanidins and related compounds. XI. Catechin-flavylium salt condensation reactions. Tetrahedron, 23, 1057-1064.
Jurd, L. (1969). Review of polyphenol condensation reactions and their possible occurrence in the aging of wines. American Journal of Enology and Viticulture, 20,
191-195.
Jurd, L. (1972). Some advances in the chemistry of anthocyanin-type plant pigments. Advances in Food Research Supplement, 3, 123-142.
Jurd, L., & Asen, S. (1966). The formation of metal and co-pigment complexes of cyanidin 3-glucoside. Phytochemistry, 5, 1263-1271.
Jurd, L., Waiss, A., & Bergot, B. (1965). Condensation reactions of flavylium salts. Bulletin of National Institute of Sciences India, 31, 69-77.
Kader, F., Irmouli, M., Nicolas, J., & Metche, M. (2001). Proposed mechanism for the degradation of pelargonidin 3-glucoside by caffeic acid o-quinone. Food Chemistry,
75, 139-144.
Kammerer, D., Carle, R., & Schieber, A. (2003). Detection of peonidin and pelargonidin glycosides in black carrots (Daucus carota ssp. sativus var. atrorubens Alef.) by high-performance liquid chromatography/electrospray ionization mass spectrometry. Rapid Communications in Mass Spectrometry, 17, 2407-2412.
Katsube, N., Iwashita, K., Tsushida, T., Yamaki, K., & Kobori, M. (2003). Induction of apoptosis in cancer cells by bilberry (Vaccinium myrtillus) and the anthocyanins. Journal of Agricultural and Food Chemistry, 51, 68-75.
Kim, D., & Lee, C. (2004). Comprehensive study on vitamin C equivalent antioxidant capacity (VCEAC) of various polyphenolics in scavenging a free radical and its structural relationship. Critical Reviews in Food Science and Nutrition, 44, 253–273.
Kobayashi, Y., Suzuki, M., Satsu, H., Arai, S., Hara, Y., Suzuki, K., Miyamoto, Y., & Shimizu, M. (2000). Green tea polyphenols inhibit the sodium-dependent glucose transport of intestinal epithelial cells by a competitive mechanism. Journal of
Agricultural and Food Chemistry, 48, 5618-5623.
Kong, J., Chia, L., Goh, N., Chia, T., & Brouillard, R. (2003). Analysis and biological activities of anthocyanins. Phytochemistry, 64, 923-933.
172
Konishi, Y., & Shimizu, M. (2003). Transepithelial transport of ferulic acid by monocarboxylic acid transporter in Caco-2 cell monolayers. Bioscience,
Biotechnology and Biochemistry, 67, 856-862.
Konishi, Y., Kobayashi, S., & Shimizu, M. (2003). Tea polyphenols inhibit the transport of dietary phenolic acids mediated by the monocarboxylic acid transporter (MCT) in intestinal Caco-2 cell monolayers. Journal of Agricultural and Food Chemistry, 51,
7296-7302.
Krafczyk, N., & Glomb, M. (2008). Characterization of phenolic compounds in Rooibos tea. Journal of Agricultural and Food Chemistry, 56, 3368-3376.
Krifi, B., Chouteau, F., Boudrant, J., & Metche, M. (2000). Degradation of anthocyanins from blood orange juices. International Journal of Food Science and Technology,
35, 275-283.
Le Marchand, L. (2002). Cancer preventive effects of flavonoids- a review. Biomedicine
& Pharmacotherapy, 56, 296-301.
Le Roux, E., Doco, T., Sarni-Manchado, P., Lozano, Y., & Cheynier, V. (1998). A-type proanthocyanidins from pericarp of Litchi chinensis. Phytochemistry, 48, 1251-1258.
Lee, H., & Nagy, S. (1990). Relative reactivities of sugars in the formation of 5-hydroxymethylfurfural in sugar-catalyst model systems. Journal of Food Processing
and Preservation, 14, 171-252.
Li, Q., Van den Heuvel, H., Delorenzo, O., Corthout, J., Pieters, A., Vlietinck, A., & Claeys, M. (1991). Mass spectral characterization of C-glycosidic flavonoids isolated from a medicinal plant (Pasiflora incarnata). Journal of Chromatography, 562, 435-446.
Lichtenthaler, R., Belandrino, R., Maia, J., Papagiannopoulos, M., Fabricius, H., & Marx, F. (2005). Total antioxidant scavenging capacities of Euterpe oleracea Mart. (Açai) fruits. International Journal of Food Science and Nutrition, 56, 53-64.
Liu, R. (2003). H. Health benefits of fruit and vegetables are from additive and synergistic combinations of phytochemicals. American Journal of Clinical Nutrition,
78, 517S-520S.
Lopes da Silva, F., De Pascual-Teresa, S., Rivas-Gonzalo, J., & Santos-Buelga, C. (2002). Identification of anthocyanin pigments in strawberry (cv Camarosa) by LC using DAD and ESI-MS detection. European Food Research and Technology, 214, 248–253.
173
Lopes da Silva, F., Escribano-Bailon, M., Perez-Alonso, J., Rivas-Gonzalo, J., & Santos-Buelga, C. (2007). Anthocyanin pigments in strawberry. LWT Food Science and
Technology, 40, 374-382.
Lubrano, C., Robin, J., & Khaiat, A. (1994). Composition en acides gras, sterols, et tocopherols d’huiles de pulpe de fruits de six especes de palmiers de Guyane. Oleagineux, 49, 59-65.
Maccarone, E., Maccarone, A., & Rapisarda, P. (1985). Stabilization of anthocyanins of blood orange fruit juice. Journal of Food Science, 50, 901-904.
Malien-Aubert, C., Dangles, O., & Amiot, M. (2001). Color stability of commercial anthocyanin-based extracts in relation to the phenolic composition: protective effects by intra- and intermolecular copigmentation. Journal of Agricultural and Food
Chemistry, 49, 170-176.
Malik, M., Zhao, C., Schoene, N., Guisti, M., Moyer, M., & Magnuson, B. (2003). Anthocyanin-rich extract from Aronia meloncarpa E. induces a cell cycle block in colon cancer but not normal colonic cells. Nutrition and Cancer, 46, 186-196.
Manach, C., Williamson, G., Morand, C., Scalbert, A., & Remesy, C. (2005). Bioavailability and bioefficacy of polyphenols in humans. I. Review of 97 bioavailability studies. American Journal of Clinical Nutrition, 81, S230–S242.
Markakis, P. (1974). Anthocyanins and their stability in food. Critical Reviews in Food
Technology, 4, 437-456.
Markakis, P. (1982). Stability of anthocyanins in foods. In: Anthocyanins as Food
Colors. Markakis, P., Ed., Academic Press Inc., London, UK, 163-180.
Marnewick, J., Joubert, E., Joseph, S., Swanevelder, S., Swart, P., & Gelderblom, W. (2005). Inhibition of tumor promotion in mouse skin by extracts of rooibos (Aspalathus linearis) and honeybush (Cyclopia intermedia), unique South African herbal teas. Cancer Letters, 224, 193-202.
Mateus, N., Silva, A., Santos-Buelga, C., Rivas-Gonzalo, J., & De Freitas, V. (2002). Identification of anthocyanin-flavanol pigments in red wines by NMR and mass spectrometry. Journal of Agricultural and Food Chemistry, 50, 2110-2116.
Matsumoto, H., Inaba, H., Kishi, M., Tominaga, S., Hirayama, M., & Tsuda, T. (2001). Orally administered delphinidin 3-rutinoside and cyanidin 3-rutinoside are directly absorbed in rats and humans and appear in the blood as the intact forms. Journal of
Agricultural and Food Chemistry, 49, 1546-1551.
174
Mazza, G., & Brouillard, R. (1990). The mechanism of co-pigmentation of anthocyanins in aqueous solutions. Phytochemistry, 29, 1097-1102.
McDougall, G., Gordon, S., Brennan, R., & Stewart, D. (2005). Anthocyanin-flavanol condensation products from black currant (Ribes nigrum L.). Journal of Agricultural
and Food Chemistry, 53, 7878-7885.
Meiers, S., Kemeny, M., Weyand, U., Gastpar, R., Von Angerer, E., & Marko, D. (2001). The anthocyanidins cyanidin and delphinidin are potent inhibitors of the epidermal growth-factor receptor. Journal of Agricultural and Food Chemistry, 49,
958-962.
Mertens-Talcott, S., & Percival, S. (2005). Ellagic acid and quercetin interact synergistically with resveratrol in the induction of apoptosis and cause transient cell cycle arrest in human leukemia cells. Cancer Letters, 218, 141-151.
Mertens-Talcott, S., Bomser, J., Romero, C., Talcott, S., & Percival, S. (2005). Ellagic acid potentiates the effect of quercetin on p21wafl/cip1, p53, and MPA-kinases without affecting intracellular generation of reactive oxygen species in vitro. Journal
of Nutrition, 135, 609-614.
Mertens-Talcott, S., Lee, J., Percival, S., & Talcott, S. (2006). Induction of cell death in Caco-2 human colon carcinoma cells by ellagic acid rich fractions from muscadine grapes (Vitis rotundifolia). Journal of Agricultural and Food Chemistry, 54, 5336-5343.
Miketova, P., Schram, K., Whitney, J., Li, M., Huang, R., Kerns, E., Valcic, S., Timmermann, B., Rourick, R., & Klohr, S. (2000). Tandem mass spectrometry studies of green tea catechins: identification of three minor components in the polyphenolic extract of green tea. Journal of Mass Spectrometry, 35, 860-869.
Mintel International U.S. Functional Beverage Report. (2008). Mintel International Group Ltd., Chicago.
Miyazawa, T., Nakagawa, K., Kudo, M., Muraishi, K., & Someya, K. (1999). Direct intestinal absorption of red fruit anthocyanins, cyanidin-3-glucoside and cyanidin-3,5-diglucoside, into rats and humans. Journal of Agricultural and Food Chemistry,
47, 1083-1091.
Monagas, M., Gomez-Cordoves, C., & Begoña, B. (2006). Evolution of the phenolic content of red wines from Vitis vinifera L. during ageing in bottle. Food Chemistry,
95, 405-412.
Mulleder, U., Murkovic, M., & Pfannhauser, W. (2002). Urinary excretion of cyanidin glycosides. Journal of Biochemical and Biophysical Methods, 53, 61–66.
175
Muñiz-Miret, N., Vamos, R., Hiraoka, M., Montagnini, F., & Mendelsohn, R. (1996). The economic value of managing the Açai palm (Euterpe oleracea Mart.) in floodplains of the Amazon estuary, Pará, Brazil. Forest Ecology and Management,
87, 163-173.
Neto, C., Amoroso, J., & Liberty, A. (2008). Anticancer activities of cranberry phytochemicals: an update. Molecular Nutrition & Food Research, 52, S18-S27.
Nichenametla, S., Taruscio, T., Barney, D., & Exon, J. (2006). A review of the effects and mechanisms of polyphenolics in cancer. Critical Reviews in Food Science and
Nutrition, 46, 161-183.
Niessen, W. (1999). Liquid Chromatography Mass Spectrometry. 2nd. ed. Chromatographic Science Series, Vol. 79, Marcel Dekker, New York.
Oliveira, J., Fernandes, V., Miranda, C., Santos-Buelga, C., Silva, A., De Freitas, V., & Mateus, N. (2006). Color properties of four cyanidin-pyruvic acid adducts. Journal
of Agricultural and Food Chemistry, 54, 6894-6903.
Ollila, F., Halling, K., Vuorela, P., Vuorela, H., Slotte, J. (2002). Characterization of flavonoid-biomembrane interactions. Archives of Biochemistry and Biophysics, 399,
103-108.
Pacheco-Palencia, L., Hawken, P., & Talcott, S. (2007a). Juice matrix composition and ascorbic acid fortification effects on the phytochemical, antioxidant, and pigment stability of açai (Euterpe oleracea Mart.). Food Chemistry, 105, 28-35.
Pacheco-Palencia, L., Hawken, P., & Talcott, S. (2007b). Phytochemical, antioxidant and pigment stability of açai (Euterpe oleracea Mart.) as affected by clarification, ascorbic acid fortification and storage. Food Research International, 40, 620-628.
Pati, S., Losito, I., Gambacorta, G., La Notte, E., Palmisano, F., & Zambonin, P. (2006). Simultaneous separation and identification of oligomeric procyanidins and anthocyanin-derived pigments in raw red wine by HPLC-UV-ESI-MSn. Journal of
Mass Spectrometry, 41, 861-871.
Pereira, C., Yariwake, J., & McCullagh, M. (2005). Distinction of the C-glycosylflavone isomer pairs orientin/isoorientin and vitexin/isovitexin using HPLC-MS exact mass measurement and in-source CID. Phytochemical Analysis, 16, 295-301.
Petsalo, A., Jalonen, J., & Tolonen, A. (2006). Identification of flavonoids of Rhodiola
rosea by liquid chromatography-tandem mass spectrometry. Journal of
Chromatography A, 1112, 224-231.
176
Pietta, P. (2000). Flavonoids as antioxidants. Journal of Natural Products, 63, 1035-1042.
Pinto, M., Robineleon, S., Appay, M., Kedinger, M., Triadou, N., Dussaulx, E., Lacroix, B., Simonassmann, P., Haffen, K., Fogh, J., & Zweibaum, A. (1983). Enterocyte-like differentiation and polarization of the human colon carcinoma cell line Caco-2 in culture. Biology of the Cell, 47, 323-330.
Plotkin, M., & Balick, M. (1984). Medicine uses of South American palms. Journal of
Ethnopharmacology, 10, 157-179.
Poei-Langston, M., & Wrolstad, R. (1981). Color degradation of ascorbic-anthocyanin-flavanol model system. Journal of Food Science, 46, 1218-1222.
Poon, G. (1998). Analysis of catechins in tea extracts by liquid-chromatography-electro spray ionization mass spectrometry. Journal of Chromatography A, 794, 63–74.
Rein, M., Ollilainen, V., Vahermo, M., Yli-Kauhaluoma, J., & Heinonen, M. (2005). Identification of novel pyranoanthocyanins in berry juices. European Food Research
and Technology, 220, 239-244.
Remy, S., Fulcrand, H., Labarbe, B., Cheynier, V., & Moutounet, M. (2000). First confirmation in red wine of products resulting from direct anthocyanin-tannin reactions. Journal of the Science of Food and Agriculture, 80, 745-751.
Remy-Tanneau, S., Le Guerneve, C., Meudec, E., & Cheynier, V. (2003). Characterization of a colorless anthocyanin-flavan-3-ol dimer containing both carbon-carbon and ether interflavanoid linkages by NMR and mass spectrometry. Journal of Agricultural and Food Chemistry, 51, 3592-3597.
Riboli, E., & Norat, T. (2003). Epidemiologic evidence of the protective effect of fruit and vegetables on cancer risk. American Journal of Clinical Nutrition, 78, 559S-569S.
Rice-Evans, C., Miller, N., & Paganga, G. (1996). Structure-antioxidant activity relationships of flavonoids and phenolic acids. Free Radical Biology and Medicine,
20, 933-956.
Rijke, E., Out, P., Niessen, W., Ariese, F., Gooijer, C., & Brinkman, U. (2006). Analytical separation and detection methods for flavonoids. Journal of
Chromatrography A, 1112, 31-63.
Rios, L., Bennett, R., Lazarus, S., Remesy, C., Scalbert, A., & Williamson, G. (2002). Cocoa procyanidins are stable during gastric transit in humans. American Journal of
Clinical Nutrition, 76, 1106–1110.
177
Rivas-Gonzalo, J., Bravo-Haro, S., & Santos-Buelga, C. (1995). Detection of compounds formed through the reaction of malvidin 3-monoglucoside and catechin in the presence of acetaldehyde. Journal of Agricultural and Food Chemistry, 43,
1444-1449.
Robards, K., Prenzler, P., Tucker, G., Swatsitang, P., & Glover, W. (1999). Phenolic compounds and their role in oxidative processes in fruits. Food Chemistry, 66, 401-436.
Robbins, R. (2003). Phenolic acids in foods: An overview of analytical methodology. Journal of Agricultural and Food Chemistry, 51, 2666-2687.
Rodrigues, R., Lichtenthäler, R., Zimmermann, B., Papagiannopoulos, M., Fabricius, H., Marx, F., Maia, J., & Almeida, O. (2006). Total oxidant scavenging capacity of Euterpe oleracea Mart. (açai) seeds and identification of their polyphenolic compounds. Journal of Agricultural and Food Chemistry, 54, 4162-4167.
Rodriguez-Saona L., Guisti, M., & Wrolstad, R. (1999). Color and pigment stability of red radish and red fleshed potato anthocyanins in juice model systems. Journal of
Food Science, 64, 451-456.
Rogez, H. (2000). Açai: preparo, composiçao e melhoramento da conservaçao. PhD thesis, Chemical Engineering Department, Federal University of Pará. Pará, Brazil.
Rubiskiene, M., Jasutiene, I., Venskutonis, P., & Viskelis, P. (2005). HPLC determination of the composition and stability of blackcurrant anthocyanins. Journal
of Chromatographic Science, 43, 478-482.
Saija, M., Scalese, M., Lanza, D., Marzullo, Bonina, F., & Castelli, F. (1995). Flavonoids as antioxidant agents: Importance of their interaction with biomembranes. Free Radical Biology and Medicine, 19, 481-486.
Salas, E., Atanasova, V., Poncet-Legrand, C., Meudec, E., Mazauric, J., & Cheynier, V. (2004a). Demonstration of the occurrence of flavanol-anthocyanin adducts in wine and in model solutions. Analytica Chimica Acta, 513, 325-332.
Salas, E., Dueñas, M. Schwarz, M., Winterhalter, P., Cheynier, V., Fulcrand, H. (2005). Characterization of pigments from different high speed countercurrent chromatography wine fractions. Journal of Agricultural and Food Chemistry, 53, 4536-4546.
Salas, E., Fulcrand, H., Meudec, E., & Cheynier, V. (2003). Reactions of anthocyanins and tannins in model solutions. Journal of Agricultural and Food Chemistry, 51,
7951-7961.
178
Salas, E., Le Guerneve, C., Fulcrand, H., Poncet-Legrand, C., & Cheynier, V. (2004b). Structure determination and colour properties of a new directly linked flavanol-anthocyanin dimer. Tetrahedron Letters, 45, 8725-8729.
Sambuy, Y., De Angelis, I., Ranaldi, G., Scarino, M., Stammati, A., & Zucco, F. (2005). The Caco-2 cell line as a amodel of the intestinal barrier: influence of cell and culture-related factors on Caco-2 cell functional characteristics. Cell Biology and
Toxicology, 21, 1-26.
Sano, A., Yamakoshi, J., Tokutake, S., Tobe, K., Kubota, Y., & Kikuchi, M. (2003). Procyanidin B1 is detected in human serum after intake of proanthocyanidin-rich grape seed extract. Bioscience, Biotechnology, Biochemistry, 67, 1140-1143.
Santos-Buelga, C., & Williamson, G. (2003). Methods in Polyphenol Analysis. Royal Society of Chemistry, Cambridge, U.K.
Sarni-Manchado, P., Cheynier, V., & Moutounet, M. (1997). Reaction of enzymically generated quinones with malvidin-3-glucoside. Phytochemistry, 45, 1365-1369.
Scalbert, A., Deprez, S., Mila, I., Albrecht, A., Huneau, J., & Robot, S. (2000). Proanthocyanidins and human health: Systemic effects and local effects in the gut. BioFactors, 13, 115-120.
Schauss, A., Wu, X., Prior, R., Ou, B., Patel, D., Huang, D., & Kababick, J. (2006). Phytochemical and nutrient composition of the freeze-dried amazonian palm berry, Euterpe oleracea Mart. (açai). Journal of Agricultural and Food Chemistry, 54,
8598-8603.
Seeram, N., Adams, L., Hardy, M., & Heber, D. (2004). Total cranberry extract versus its phytochemical constituents: antiproliferative and synergistic effects against human tumor cell lines. Journal of Agricultural and Food Chemistry, 52, 2512-2517.
Seeram, N., Adams, L., Zhang, Y., Lee, R., Sand, D., Scheuller, H., & Heber, D. (2006). Blackberry, black raspberry, blueberry, cranberry, red raspberry, and strawberry extracts inhibit growth and stimulate apoptosis of human cancer cells in vitro. Journal of Agricultural and Food Chemistry, 54, 9329-9339.
Shahidi, F., & Wanasundara, P. (1992). Phenolic antioxidants. Critical Reviews in Food
Science and Nutrition, 32, 67-103.
Shoji, T., Masumoto, S., Moriichi, N., Akiyama, H., Kanda, T., Ohtake, Y., & Goda, Y. (2006). Apple procyanidin oligomers absorption in rats after oral administration: analysis of procyanidins in plasma using the Porter method and high-performance liquid chromatography/tandem mass spectrometry. Journal of Agricultural and Food
Chemistry, 54, 884-892.
179
Shwarz, M., Wabnitz, T., & Winterhalter, P. (2003). Pathway leading to the formation of anthocyanin-vinylphenol adducts and related pigments in red wines. Journal of
Agricultural and Food Chemistry, 51, 3682-3687.
Singleton, V. L. (1972). Common plant phenols other than anthocyanins, contributions to coloration and discoloration. Advances in Food Research Supplement, 3, 143-191.
Singleton, V., & Rossi, J. (1965). Colorimetry of total phenolics with phosphomolybdic-phosphotungstic acid reagents. American Journal of Enology and Viticulture, 16,
144-153.
Skerget, M., Kotnik, P., Hadolin, M., Hras, A., Simonic, M., & Knez, Z. (2005). Phenols, proanthocyanidins, flavones and flavonols in some plant materials and their antioxidant activities. Food Chemistry 89, 191-98.
Skrede, G., Wrolstad, R., Lea, P., & Enersen, G. (1992). Color stability of strawberry and black currant syrups. Journal of Food Science, 57, 172-177.
Somers, T. (1971). The polymeric nature of wine pigments. Phytochemistry, 10, 2175-2186.
Spencer, J., Schroeter, H., Shenoy, B., Srai, S., Debnam, E., & Rice-Evans, C. (2001). Epicatechin is the primary bioavailable form of the procyanidin dimers B2 and B5 after transfer across the small intestine. Biochemical and Biophysical Research
Communications, 285, 588-593.
Srivastava, A., Akoh, C., Fischer, J., & Krewer, G. (2007). Effect of anthocyanin fractions from selected cultivars of Georgia-grown blueberries on apoptosis and phase II enzymes. Journal of Agricultural and Food Chemistry, 55, 3180-3185.
Stintzing, F., Stintzing, A., Carle, R., Frei, B., & Wrolstad, R. (2002). Color and antioxidant properties of cyanidin-based anthocyanin pigments. Journal of
Agricultural and Food Chemistry, 50, 6172-6181.
Talcott, S., & Lee, J. (2002). Ellagic acid and flavonoid antioxidant content of muscadine wine and juice. Journal of Agricultural and Food Chemistry, 50, 3186-3192.
Talcott, S., Brenes, C., Pires, D., Del Pozo-Insfran, D. (2003). Phytochemical stability and color retention of copigmented and processed muscadine grape juice. Journal of
Agricultural and Food Chemistry, 51, 957-963.
Talcott, S. (2007). Phytochemical-Rich Oils and Methods Related Thereto. Provisional U.S. Patent Application, June 2007.
180
Tammela, P., Laitinen, L., Galkin, A., Wennberg, T., Heczko, R., Vuorela, H., Slotte, J., & Vuorela, P. (2004). Permeability characteristics and membrane affinity of flavonoids and alkyl gallates in Caco-2 cells and in phospholipid vesicles. Archives
of Biochemistry and Biophysics, 425, 193-199.
Tian, Q., Giusti, M., Stoner, G., & Schwartz, S. (2005). Screening for anthocyanins using high-performance liquid chromatography coupled to electrospray ionization tandem mass spectrometry with precursor-ion analysis, product-ion analysis, common neutral-loss analysis and selected reaction monitoring. Journal of
Chromatography A, 1091, 72-82.
Timberlake, C., & Bridle, P. (1976). Interactions between anthocyanins, phenolic compounds and acetaldehyde and their significance in red wines. American Journal
of Enology and Viticulture, 27, 97-105.
Tsai, P., & Huang, H. (2004). Effect of polymerization on the antioxidant capacity of anthocyanins in Roselle. Food Research International, 37, 313-318.
Tsai, P., Delva, L., Yu, T., Huang, Y., & Dufosse, L. (2005). Effect of sucrose on the anthocyanin and antioxidant capacity of mulberry extract during high temperature heating. Food Research International, 38, 1059–1065.
Turker, N., Aksay, S., & Ekiz, I. (2004). Effect of storage temperature on the stability of anthocyanins of a fermented black carrot (Daucus carota.) beverage: Shalgam. Journal of Agricultural and Food Chemistry, 52, 3807-3813.
Vaidyanathan, J., & Walle, T. (2001). Transport and metabolism of the tea flavonoid (-)-epicatechin by the human intestinal cell line Caco-2. Pharmaceutical Research, 18.
1420-1425.
Van Dijk, C., Driessen, A., & Recourt, K. (2000). The uncoupling efficiency and affinity of flavonoids for vesicles. Biochemical Pharmacology, 60, 1593–1600.
Visioli, F., Borsani, L., & Galli, C. (2000). Diet and prevention of coronary heart disease: the potential role of phytochemicals. Cardiovascular Research, 47, 419-425.
Vivar-Quintana, A., Santos-Buelga, C., & Rivas-Gonzalo, J. (2002). Anthocyanin-derived pigments and colour of red wines. Analytica Chimica Acta, 458, 147-155.
Voirin, B., Sportouch, M., Raymond, O., Jay, M., Bayet, C., Dangles, O., & El Hajji, H. (2006). Separation of flavone C-glycosides and qualitative analysis of Passiflora
incarnata L. by capillary zone electrophoresis. Phytochemical Analysis, 11, 90-98.
181
Walgren, R., Walle, U., & Walle, T. (1998). Transport of quercetin and its glucosides across human intestinal epithelial Caco-2 cells. Biochemical Pharmacology, 55, 1721-1727.
Wang, L., & Stoner, G. (2008). Anthocyanins and their role in cancer prevention. Cancer Letters, 269, 281-290.
Waridel, P., Wolfender, J., Ndjoko, K., Hobby, K., Major, H., & Hostettmann, K. (2001). Evaluation of quadrupole time-of-flight tandem mass spectrometry and ion-trap multiple-stage mass spectrometry for the differentiation of C-glycosidic flavonoid isomers. Journal of Chromatography A, 926, 29-41.
Whiting, D. (2001). Natural phenolic compounds 1900-2000: a bird’s eye view of a century’s chemistry. Natural Products Report, 18, 583-606.
Williamson, G., Day, A., Plumb, G., & Couteau, D. (2000). Human metabolic pathways of dietary flavonoids and cinnamates. Biochemical Society Transaction, 28, 16–22.
Wilska-Jeszka, J., & Korzuchowska, A. (1996). Anthocyanins and chlorogenic acid copigmentation: influence on the color of strawberry and chokeberry juices. Lebensm
Unters Forsch, 203, 38-42.
Wrolstad, R. E., Durst, R. W., & Lee, J. (2005). Tracking color and pigment changes in anthocyanin products. Trends in Food Science and Technology, 16, 423-428.
Wu, Q., Koponen, J., Mykkanen, H., & Torronen, A. (2007). Berry phenolic extracts modulate the expression of p21WAF1 and Bax but not Bcl-2 in HT-29 colon cancer cells. Journal of Agricultural and Food Chemistry, 55, 1156-1163.
Wu, Q., Wang, M., & Simon, J. (2003). Determination of proanthocyanidins in grape products by liquid chromatography/mass spectrometric detection under low collision energy. Analytical Chemistry, 75, 2440-2444.
Yi, W., Akoh, C., Fischer, J., & Krewe, G. (2006). Absorption of anthocyanins from blueberry extracts by Caco-2 human intestinal cell monolayers. Journal of
Agricultural and Food Chemistry, 54, 5651-5658.
Zhao, C., Giusti, M., Malik, M., Moyer, M., & Magnuson, B. (2004). Effects of commercial anthocyanin-rich extracts on colonic cancer and nontumorigenic colonic cell growth. Journal of Agricultural and Food Chemistry, 52, 6122-6128.
182
VITA
Lisbeth Alicia Pacheco Palencia received her Bachelor of Science in
Agroindustrial Engineering from Zamorano University in Honduras, Central America in
December 2004. She pursued graduate studies in Food Science and Human Nutrition at
the University of Florida and received her Master of Science degree in May 2006. She
finally received her Doctor of Philosophy degree in Food Science and Technology, from
Texas A&M University in May 2009.
Lisbeth can be reached at 1500 Research Parkway Centeq Bldg. A, suite 234,
College Station, TX, 77845. Her email is [email protected].