chemical characterization of wild maine cranberries
TRANSCRIPT

The University of MaineDigitalCommons@UMaine
Electronic Theses and Dissertations Fogler Library
8-2001
Chemical Characterization of Wild MaineCranberriesDolly Jean Watson
Follow this and additional works at: http://digitalcommons.library.umaine.edu/etd
Part of the Food Science Commons, and the Nutrition Commons
This Open-Access Thesis is brought to you for free and open access by DigitalCommons@UMaine. It has been accepted for inclusion in ElectronicTheses and Dissertations by an authorized administrator of DigitalCommons@UMaine.
Recommended CitationWatson, Dolly Jean, "Chemical Characterization of Wild Maine Cranberries" (2001). Electronic Theses and Dissertations. 5.http://digitalcommons.library.umaine.edu/etd/5

CHEMICAL CHARACTERIZATION
OF WILD MAINE CRANBERRIES
BY
Dolly Jean Watson
B.S. University of Maine, 1997
A THESIS
Submitted in Partial Fulfillment of the
Requirements for the Degree of
Master of Science
(in Food Science and Human Nutrition)
The Graduate School
The University of Maine
August, 2001
Advisory Committee:
Alfied A. Bushway, Professor of Food Science, Co-Advisor
Rodney J. Bushway, Professor of Food Science, Co-Advisor
Denise Skonberg, Assistant Professor of Food Science

LIBRARY RIGHTS STATEMENT
In presenting this thesis in partial fulfillment of the requirements for an advanced degree
at The University of Maine, I agree that the Library shall make it freely available for
inspection. I fhther agree that permission for "fair use" copying of this thesis for
scholarly purposes may be granted by the Librarian. It is understood that any copying or
publication of this thesis for financial gain shall not be allowed without my written
permission.
&=azw9 Date: May 5,2001

CHEMICAL CHARACTERIZATION
OF WILD MAINE CRANBERRIES
By Dolly Jean Watson
Thesis Co-Advisors: Dr. Alfied A. Bushway Dr. Rodney J. Bushway
An Abstract of the Thesis Presented in Partial Fulfillment of the Requirements for the
Degree of Master of Science (in Food Science and Human Nutrition)
August, 2001
This study was conducted to analyze wild Maine cranberries for anthocyanin
(ACY), anthocyanidin, organic acid, L-ascorbic acid, and moisture content. Cranberries
were analyzed in both the fiesh and fiozen states. Analysis for ACY and anthocyanidin
content was performed by High Performance Liquid Chromatography (HPLC) and
Capillary Electrophoresis (CE); organic acids by HPLC; and L-ascorbic acid (L-AA) and
moisture by AOAC methods for titration and drying, respectively.
ACY results showed similar qualitative profiles for all cultivars except one where
no detectable ACY were present. Four major peaks and two minor peaks were detected,
which have been tentatively identified as the galactosides (Gal), arabinosides (Arab), and
glucosides (Glu) of cyanidin (Cy) and peonidin (Pn). Quantitatively, significant
differences (p<0.05) existed among the different cultivars for total and individual ACY
content, with totals ranging fiom 9.64 to 126.05 mgA00g and 13.1 1 to 94.48 mg/100g for
fiesh and fiozen samples, respectively (results reported as Cy-3-Gal). The proportion of

individual ACY content varied notably with Cy-3-Gal comprising 20-35% of the total,
Cy-3-Arab 14-22%, Pn-3-Gal30-45%, and Pn-3-Arab 13-18%.
Aglycones obtained through acid hydrolysis of the ACY and analyzed by HPLC
resulted in 55% Cy and 35% Pn. The CE method developed in this study employed an
acidic run buffer, which kept the aglycones in their flavyliurn cation form. Thus, the
same concentrations of pigments used in HPLC were applied to CE. For comparison of
methods, HPLC and CE analyses were performed on commercial cranberries; Results
showed that the methods were comparable despite the noisy baseline of the CE online
detection. The correlation coefficient was 0.967.
The primary organic acids in cranberries are citric, malic, quinic, and L-ascorbic.
Mean organic acid content of fresh and frozen berries varied slightly (2041 mg/100g and
2035 mg/100g, respectively) despite the large differences in individual acids. Malic was
the primary acid in fresh berries at 64%. Citric and quinic made up 25% and 11%,
respectively. In the frozen berry, citric and malic acids were evenly matched at 42%
and 4 1 %, respectively. Quinic remained low at 17%.

ACKNOWLEDGMENTS
I would like to extend my gratitude to Dr. Rodney Bushway and Dr. A1 Bushway.
I would not be pursuing my Masters degree if it were not for their guidance,
encouragement, and support. I feel very fortunate to have been able to work under, and
for two of the most knowledgeable professors in the field. I would also like to thank
them for their patience during the past couple of years as I spent several weeks away
fiom my research while visiting different parts of the world.
I would like to thank Brian Perkins for his wisdom in the lab, his views of the
world, and always coming to my rescue when whatever I touched or just looked upon
broke down. I cannot thank him enough for showing me around the lab, as a pesky
undergraduate, and while doing my graduate research. There usually was not a day that
passed when I did not learn something from him.
I would like to give my appreciation and love to the wonderhl friends that I have
made while pursuing my degrees at the University of Maine: Jessica Kent Begin, Rhonda
Wuensch, Mike Noble, Jon Whitten, Andy Begin, Kim Worster, Raegan Heanssler, Beth
Calder, Keith Moore, and my fellow Food Scientists in Holmes Hall. College has been a
very challenging experience, inside and outside of the classroom, but with my friends
right beside me the tough times were not so tough.
Lastly, I would like to recognize the one person who has worked harder and
sacrificed more than anyone to make this event possible, Carolyn Watson, my mom.
Although not familiar with Food Science or the variety of classes I have taken, she was
always excited to hear about the latest chapter I had learned. She never failed to call up

early Sunday mornings to say hello and ask how my week went. And even though she
was miles away she always asked if there was anything she could do or anything that I
needed. She is the most generous woman I know, and has given me the greatest gift there
is to give. Thank you, Mom. I love you.

TABLE OF CONTENTS
. . ACKNOWLEDGMENTS .............................................................................. 11
LIST OF TABLES ............................................................................................. vi
. . .......................................................................................... LIST OF FIGURES vii
LITERATURE REVIEW ................................................................................. 1 INTRODUCTION .......................................................................................... 1 COMPOSITION ................................................................................................ 2 CRANBERRY GROWTH & HARVESTING .................................................. 4 CRANBERRY QUALITY ................................................................................ 7 ANTHOCYANIN CONTENT .......................................................................... 8
................................................................................................. Structure 9 Color Stability ...................................................................................... 13
pH ............................................................................................. 13 Temperature & Light ............................................................... 17 Copigmentation, Condensation & Metal Reactions ................. 18 Vitamin C & Oxygen ............................................................... 22
Analytical Methods for Anthocyanins ................................................. 23 Extraction ............................................................................................ -25 H i ~ h Performance Liquid Chromatography (HPLC) .......................... 30 Capillary Electrophoresis (CE) ............................................................ 37
ORGANIC ACID CONTENT ......................................................................... 45 Structure .............................................................................................. -46 Analytical Methods for Organic Acids ................................................ 48
MATERIALS & METHODS ...................................................................... 50 ANALYSES PERFORMED ............................................................................ 51
Anthocyanin Extraction ....................................................................... 52 HPLC Conditions for Anthocyanin Analysis ...................................... 52 Acid Hydrolysis of Anthocyanins ........................................................ 53 HPLC Conditions for Anthocyanidin Analysis ................................... 53 CE Conditions for Anthocyanidin Analysis ........................................ 54 Organic Acid Extraction ...................................................................... 55 HPLC Conditions for Organic Acid Analysis ..................................... 55 L-Ascorbic Acid Extraction ................................................................ 56 Ouantification of L-Ascorbic Acid ...................................................... 56 Moisture Content Determination ......................................................... 57

RESULTS & DISCUSSION ........................................................................ 58 .......................................................... Anthocyanin & Anthocyanidin Content 58
Organic Acid Content ...................................................................................... 86 L-Ascorbic Acid Content ................................................................................. 96 Moisture Content ........................................................................................... 100
CONCLUSIONS .............................................................................................. 101
BIBLIOGRAPHY ............................................................................................ 103
BIOGRAPHY ................................................................................................... 11
LIST OF TABLES
Table 1 .
Table 2 .
Table 3 .
Table 4 .
Table 5 .
Table 6 .
Table 7 .
Table 8 .
Table 9 .
Table 10 .
Table 1 1 .
Table 12 .
Table 13 .
Table 14 .
Composition of Cranberry Fruit ................................................................. 4
Structures of Naturally Occuning Anthocyanidins .................................. 10
Summary of Anthocyanin Research by HPLC ......................................... 24
Average Anthocyanin Content in Cranberries Sorted by Surface ................................................................................................. Color 35
Proportions of Individual Anthocyanins in Cranberries ........................... 35
Anthocyanin Method by Capillary Zone Electrophoresis in Basic Media .................................................................................. 39
Anthocyanin Method by Capillary Zone Electrophoresis . . ................................................................................. in Acidic Media 41
pK. Values for the Major Organic Acids in Cranberries ......................... 47
Average Retention Times (in Minutes) for Cranberry .................................................................... Anthocyanins by HPLC 60
W-Vis Maxima of Cranberry Anthocyanins & Aglycones .................... 61
Comparison of Individual & Total ACY Contents in Cranberries from Two Consecutive Seasons ........................................................ 73
Average Retention Times (in Minutes) for Cranberry ................................................................. Anthocyanidins by HPLC 76
Capillary Electrophoresis Conditions for Cranberry Anthocyanidin Analysis ................................................................... -79
Average Migration Times (in Minutes) for Cranberry Anthocyanidins by CE ..................................................................... -83
Table 15 . Average Retention Times for Cranberry Organic Acids by HPLC ................................................................................................ 88
Table 16 . Comparison of Cranberry Organic Acid Contents from Two Studies ..... 96

LIST OF FIGURES
Figure 1 . Flavan Nucleus ........................................................................................ 1 0
Figure 2 . Anthocyanin Structure ............................................................................ 1
Figure 3 . Structural Transformations of Anthocyanins in Aqueous Media ............. 12
.............................................. Figure 4 . Resonance Forms of the Flavylium Cation 14
Figure 5 . Distribution of the Four Anthocyanin Structures with pH Under . . . . . Equilibrium Conditions ..................................................................... 1 5
................... Figure 6 . Spectra of Cyanidin.3, 5.Diglucoside at Varying pH Values 16
Figure 7 . Mechanisms of Anthocyanin Stabilization in vivo ................................... 20
Figure 8 . Stability of Anthocyanidins Stored on C18 SPE Cartridges at 2OC ......... 29
Figure 9 . LC Chromatogram of Cranberry Anthocyanidins .................................... 33
Figure 10 . Spectra of Pelargonidin-3-Glucoside at pH 1.8 and pH 8.0 ..................... 38
Figure 11 . Schematic Representation of the Adsorption of CTAB on the Capillary Wall ............. ; ..................................................................... 44
Figure 12 . Structure of the Five Major Organic Acids in Cranbemes ...................... 47
Figure 13 . HPLC Chromatogram of Cranberry Anthocyanins .................................. 59
Figure 14 . Spectra of the Four Major Anthocyanins in Cranbemes ......................... 62
Figure 15 . Total ACY Content in Fresh & Frozen Wild Maine Cranberries ............ 64
Figure 16 . Individual ACY Contents in Fresh & Frozen Wild Maine Cranbemes ....................................................................................... -67
Figure 17 . Significant Differences in Individual & Total ACY Contents in Fresh Wild Maine Cranbemes ...................................................... 69
Figure 18 . Average % of Total ACY in Fresh & Frozen Wild Maine Cranbemes ....................................................................................... -72
vii

Figure 19. HPLC Chromatogram & Spectra of Cranberry Anthocyanidins ............ ..75
Figure 20. Total & Individual Anthocyanidin Contents in Frozen Wild Maine ........................................................................................ Cranberries 78
Figure 21 . Electropherogram of Cranbeny Anthocyanidins ..................................... 82
........................ Figure 22. Comparison of Anthocyanidin Contents by HPLC & CE 85
...... Figure 23. HPLC Chromatogram of the Major Organic Acids in Cranberries.. ..87
Figure 24. Significant Differences in Total Organic Acids in Fresh & Frozen Wild Maine Cranberries ................................................................... 239
Figure 25. Total Content of Organic Acids in Fresh & Frozen Wild Maine Cranbemes.. ........................................................................... 90
Figure 26. Comparison of Individual Organic Acids in Fresh & Frozen Wild Maine Cranbemes. ................................................................. ..9 1
Figure 27. Significant Differences in Individual Organic Acids in Fresh Wild Maine Cranbemes ............................................................................. 93
Figure 28. Average % of Total Organic Acids in Fresh & Frozen Wild ......................................................................... Maine Cranberries.. ..95
Figure 29. Significant Differences in L-Ascorbic Acid Content in Fresh & Frozen Wild Maine Cranbemes ................................................... 98
Figure 30. L-Ascorbic Acid Content in Fresh & Frozen Wild Maine ....................................................................................... Cranberries .99
... Vlll

LITERATURE REVIEW
INTRODUCTION
The American Cranberry, Vaccinium macrocarpon, like its relative, the Small
Cranberry (Vaccinium oxycoccus) is a native berry to North America. It is a low-
growing, woody perennial plant with thick elliptical leaves that is capable of producing
fruit for decades. It thrives in the cool, damp climates of the north Atlantic and Pacific
Coast lines of North America (Eck, 1990). Early American Natives used the berry not
only for food, but also for dyes, medicinal purposes, and symbols of peace.
The American Cranberry is a popular fruit and a multi-million dollar industry
with a large majority of the cranberry harvest going into the manufacture of juice and
juice products. The perfect formula for breeding, growing, and harvesting cranberries for
maximum fruit production as well as maximum anthocyanin production is proving to be
an endless search. This is complicated by the fact that cranberries require unique
growing conditions, including an acidic soil, an adequate water supply, sand, and a
growing season stretching over the months of April to November (CCCGA, 1999). Thus,
their production is limited to certain climates and areas in the United States. The leading
cranberry producers in the U.S. are Massachusetts, Wisconsin, New Jersey, Oregon, and
Washington. The state of Maine has recently initiated an interest in the cranberry
industry. In 1998, 176 acres of cranberries were planted.
The purpose of this study was to evaluate the wild cranberries grown in Maine
primarily for their anthocyanin content and secondly for their organic acid and vitamin C

content. The results determined in this study would be useful information for breeding
wild Maine cranberries with known cultivars. The slightly colder climate in Maine,
compared to the other cranberry producing states previously mentioned, may influence
the metabolism and production of ACY or other nutrients in the berry, which would
improve the quality of the fruit in manufacturers' perspective.
COMPOSITION
Fresh cranberries primarily consist of fruit sugars, organic acids, and pectin.
Their water content averages 88% (Table 1). Hong and Wrolstad (1986) reported the
sugar content of whole cranberries ranged fiom 5.25 to 7.13 g/100g, of which glucose
comprised approximately 80% and fructose 20%.
The high content of organic acids is responsible for the tartness and low pH of
cranberries, with the primary acids being citric, malic, quinic, and benzoic (Table 1). L-
ascorbic acid is also an organic acid, but is more often categorized as a vitamin, vitamin
C. It is the acidic nature of cranberries that decreases the occurrence of urinary tract
infections for people who regularly consume cranberry juice and juice products. This is
achieved via the conversion of quinic and benzoic acids to hippuric acid in the human
body, which is then excreted in the urine (Eck, 1990; CCCGA, 1999). Unlike quinic and
benzoic acids, citric and malic acids are metabolized and used for energy; and therefore,
do not contribute pH lowering effects in urine. Organic acids are discussed later in the
literature review.

As with the sugar content of cranbemes, the ash content is also low, but
comparable to that of the closely related lowbush blueberry. Potassium and calcium are
the predominant minerals, and despite the high acidity of fiesh cranbemes, the ash of the
h i t is slightly alkaline (Eck, 1990).
The high pectin content of cranberries influences the quantity of sugar needed
during jelly processing with as little as 40% sugar being added, unlike other h i t s that
require 65% added sugar. The amount of pectin can vary between cultivars, fiom bog to
bog, and from one growing season to the next, producing a range of 0.40 to 1.36% (Eck,
1990).

TABLE 1.
COMPOSITION OF CRANBERRY FRUIT*
CHEMICAL COMPOSITION %
Moisture 88.00 Reducing sugars 4.20 Acids (as citric) 2.40 Pectin 1.20 Fat (ether extract) 0.40 Protein Ash Fiber
MINERAL CONTENT
Potassium Sodium Calcium Phosphorus Magnesium Iodine Sulhr Chlorine Iron Manganese Copper
VITAMIN CONTENT per lOOg
Vitamin A Vitamin C Thiamine Riboflavin Nicotinic Acid Pantothenic Acid Pyridoxine Biotin
ACID CONTENT
Citric Acid Malic Acid Quinic Acid Benzoic Acid
ENERGY
Fresh bemes Sauce
40 IU 7.5-10.5 mg
13.5 mg 3.0 mg
33.0 mg 25.0 mg 10.0 mg
trace
CRANBERRY GROWTH & HARVESTING
kcaY 1 OOg
Cranbemes grow wildly along the Atlantic Coast and some other areas of the
United States. They prefer conditions offering sandy soil, an abundant supply of fiesh
water, and a growing season that lasts for at least 150 fiost free days (CCCGA, 1999).

Whereas most crops require a neutral pH of the soil, cranberries thrive in acidic
conditions; typically in the range of 4.0 to 5.5. Eck (1990) reported that the preferred
substrate for cranberry growth was that of an acid peat soil, which provided a significant
source of nitrogen and boron when the organic matter decomposed. The acidic nature of
the soil also facilitated the suppression of weeds.
The growth of the cranberry involves two primary stages, an active stage and a
dormant or resting stage. During the dormant stage in winter, the cranberry bogs are
flooded to prevent damage to the vines from severe drops in temperature and early spring
frosts. Some farmers choose to apply a layer of sand every couple of years over this
protective ice sheet to stimulate growth, improve drainage, and control weeds and insects
(CCCGA, 1999). Others may "dry sand" on the vines directly during the summer
months.
With the arrival of spring and warmer temperatures, the winter floodwater is
drained. Farmers must be extremely careful of spring fiosts since the cranberry is in a
stage of rapid growth and is very susceptible to less than optimal growing conditions.
Optimal growth temperatures range between 15.6"C and 26.7"C (60°F and 80°F), with
temperatures below -0.6"C (3 1°F) causing significant damage to crop yield once the bud
is exposed (Eck, 1990).
During the summer months, rainfall and irrigation are critical for the success of
the crop. Cranberries require up to one inch of water per week during the growing season
(CCCGA, 1999). In the first months of summer, flowering of the cranberry bud occurs,
and bees take on the responsibility of pollination. Typically, flowering takes place on old
uprights rather than new ones, and it is the old flowering uprights that bear fruit. Eck

(1990) reported that berry yield was associated with the percentage of uprights with
flowering buds from the previous fall season. Theoretical yields have been estimated at
450 barrels of cranberries from a single acre, but this is unlikely since only one-third of
potential blossoms in a cranberry bog will set fruit (Eck, 1990).
Once pollination has taken place, fruit growth and development begin. The
cranberry growth curve follows that of an initial burst of growth that is maintained until
maturity of the fruit. In the early stages of fruit development the berry is small and green
owing to the presence of chlorophyll pigments. Only as the berry matures and the red
anthocyanins and other pigments predominate does the cranberry inherit its characteristic
red hue. It is the development of these anthocyanins that is crucial to the
commercialization of the cranberry and cause for extensive research for their
enhancement.
Harvesting of the fruit begins in early September and lasts until November.
Harvest time is dependent on fruit maturity, cultivar, and weather conditions, since frost
damage is still an offender of berry quality during the harvest season. There are two
kinds of harvesting for cranberries depending on the final use of the fruit: dry and wet
harvesting. Cranberries that are destined to be frozen or processed into juice, jellies, and
sauces are usually wet harvested. This accounts for more than 85% of the total cranberry
harvest (CCCGA, 1999). Wet harvesting involves flooding of the bog with
approximately a foot of water, agitating the water to fiee the berries from the vine, and
corralling the fruit for transportation. Due to the increase in rate of deterioration of wet
harvested fruit, berries are subjected to a drylng step prior to fhrther processing (Eck,
1990).

The other 15% of the cranberry harvest is dry harvested and enters the grocery
store as fresh h i t . Originally accomplished by handpicking, dry harvesting has since
progressed from scoops to picking machines. These berries are delivered to receiving
stations, graded, and screened based on their color and ability to bounce (Ocean Spray,
1999).
CRANBERRY QUALITY
The quality of cranbeny h i t is a complex term to define since there are many
factors affecting it -- weather and other environmental conditions, cultivar, method of
harvesting, h i t handling, berry size, pesticide use -- with wide variations in h i t
composition occurring from one growing season to the next. Several researchers (Sapers
et al., 1986; Sapers et al., 1983b; Andersen, 1989) reported that color, or anthocyanin
content, was the most heavily weighed factor when determining the value and quality of
cranberries. Sapers et al. (1983a) further defined quality in terms of juice yield, sugar
content, and acidity.
Breeding programs continually experiment with different growing conditions and
cultivars to achieve high pigment expression yet maintaining the hardiness of the berry.
Mazza and Miniati (1993) described the optimal ACY content in quality cranberries was
higher than 67 mg/100 g.

ANTHOCYANIN CONTENT
Anthocyanins (ACY) are the compounds responsible for the vibrant reds, blues,
and violets of flowers, h i t s , and vegetables. They are water-soluble glycosides and
acylglycosides of anthocyanidins and number more than 240 naturally occurring
compounds (Strack & Wray, 1989). ACY are located in the outer layer of plant tissue
called the exocarp, and may be used to characterize a specific variety of cranberry (or
other plant) since different cultivars may have different ACY profiles.
The demand for natural food colorants by the consumer has stimulated the food
industry to use such pigments as anthocyanins. Unfortunately, ACY are difficult to
isolate and very unstable in aqueous and slightly acidic or neutral solutions, which
encompasses the majority of beverages and food products of desired application. An
explosion of research has been conducted to address these problems of pigment
extraction, isolation, and stabilization, which will be discussed later in this review.
Recently, another area of research has focused on the potential health benefits of
ACY as antioxidants and free radical scavengers. It is believed that ACY may play an
important role in preventing the oxidation of lipids; thus, reducing the risk of certain
forms of heart disease (Frankel et al., 1993; Fuhrrnan et al., 1995; Hertog et al., 1993;
SatuC-Gracia et al., 1997; Tamura & Yamagami, 1994; Teissedre et al., 1996). The
benefits of ACY's antioxidant activity has also been associated with aiding in several
other disease states afflicting human health: diabetic retinopathy (Wang et al., 1997),
certain cancers, and neurodegeneration (Prior et al., 1996).

Structure
Collectively, anthocyanins belong to the flavonoid family of compounds and
consist of a basic flavan nucleus (Figure l), made up of two benzene rings and a y-pyran
ring, and an attached sugar moiety (Figure 2). When one sugar molecule is attached
(mainly glucose, but also rhamnose, galactose, xylose, arabinose, and fructose), it is
almost always at position 3. Other sugars may be linked at positions 5, 7, 3', 4', and 5'
with usually no more than three sugar moieties attached at different positions due to steric
hindrance (Britton, 1983; Jackrnan et al., 1987; Francis & Markakis, 1989).
Glycosylation occurs as mono-, di-, and trisaccharides of the same or combinations of
different sugar molecules. Many ACY also contain acyl acid linkages (acylation) in their
structure, which are attached to the sugar moiety. In order of occurrence, the acyl acids
are coumaric, caffeic, ferulic, p-hydroxy benzoic, synapic, malonic, acetic, succinic,
oxalic, and malic acids (Francis, 1989). As with glycosylation, acylation is believed to
play an important role in the stabilization of ACY structure and color, not just the
presence of acyl acids, but also the type of the acyl group. An example of this was
reported by Baublis et al. (1994). It was determined that decreases in degradation by
hydration were a result of intramolecular copigmentation due to the high degree of
acylation and substitution in the B ring of the chromaphore. Research has not reported
any acyl acids associated with the American Cranbeny.
Francis and Markakis (1989) listed 17 naturally occurring aglycones with only six
of them having importance to the food industry as food colorants. These aglycones and
their substitution patterns on the flavan nucleus are listed in Table 2. The aglycones of

importance to the food industry are pelargonidin (Pel), cyanidin (Cy), peonidin (Pn),
delphinidin (Del), petunidin (Pet), and malvidin (Mal), which are most likely due to their
abundance in comparison to the other aglycones.
FIGURE 1.
FLAVAN NUCLEUS
R..
TABLE 2.
STRUCTURES OF NATURALLY OCCURRING ANTHOCYANIDINS*
SUBSTITUTION PATTERN
3 5 6 7 3' 4' 5'
Pelargonidin Cyanidin Peonidin Delphinidin Petunidin Malvidin
Apigenin Luteolidin Triacetidin Aurantidin 5-MethylCy Rosinidin 6-HydroxyCy Pulchellidin Euopinidin Capensinidin Hirsutidin
*Francis & Markakis, 1989.

FIGURE 2.
ANTHOCYANIN STRUCTURE
CYANIDIN-3 -GLY COSIDE
As evident from Table 2, some substitutions on the flavan nucleus are hydroxyl
groups, while others are methoxyl groups. Methylation may occur before or after
glycosylation (Strack & Wray, 1994) and was reported to decrease the stability of ACY;
whereas, hydroxylation increased their stability via hydrogen bonding (H-bonding) with
other phenolic compounds. The number of hydroxyl and methoxyl groups also played a
significant role in the color shifts of ACY. With increased hydroxyl substitutions on the
B ring, the color changed from orange to blue. Replacing the hydroxyls with methoxyl
groups reversed this trend. For example, cyanidin glycosides, which have two hydroxyl
groups on the B ring are red; whereas, peonidin glycosides, which have only one
hydroxyl group on the B ring are orange.
In acidic or neutral solution, it has been demonstrated that four ACY structures
existed in equilibrium: the flavylium cation (AH+), the quinonoidal base (A), the carbinol
pseudobase (B), and the chalcone (C) (Figure 3).

FIGURE 3.
STRUCTURAL TRANSFORMATIONS OF ANTHOCYANINS IN AQUEOUS MEDIA*
A: Quinoidal Base (blue) AH+: Flavylium Cation (red)
C: Chalcone (colorless) D: Carbinol Pseudebase (colorless)
*Redrawn from Francis & Markakis, 1989.
The mechanism driving these reactions in Figure 3 involved the deprotonation
of the flavylium cation in slightly acidic media (pH 4-6) to the anhydro base (A). This in
turn, through hydration, gave rise to the carbinol pseudobase (B) and chalcone (C) (Chen
& Hrazdina, 1982; Strack & Wray, 1989). Two of these structures are colorless, the
pseudobase and chalcone, explaining the loss of color at higher pH values where they are
the dominant species. This is further explained in the next section under pH.

Color Stability
In aqueous solutions, ACY behave like pH indicators. They are red at low pH,
blue at intermediate pH values, and colorless at high pH. This change in and loss of color
is due to the change in equilibrium between the four anthocyanin structures (Figure 3).
The quinoidal base is blue; whereas, the flavylium cation is red. As previously
mentioned, the pseudobase and chalcone are colorless. Britton et al. (1 983) reported the
different spectra of each structural compound, with the flavylium salt (pH 1.0) having a
maximum absorption near 510 nm; the pseudobase (pH 4.0) maximum near 380 nm; the
anhydro base (pH 7.5) maximum near 535 nm; and the chalcone (in ethanol) maximum
near 380 nm. Research by Mazza and Brouillard (1987) discovered six structural species
of cyanidin at varying pH values by spectrophotometric data. The two additional
structures were the anionic forms of the quinonoidal base and the chalcone.
Further explanation of these structural changes centers on the flavylium cation. It
is relatively stabile under acidic conditions and exists as six resonance forms (Figure 4),
with the highest partial positive charges occurring at positions 2 and 4 (Jackman et al.,
1987; Strack & Wray, 1989). With even slight increases in pH, hydroxyl protons
dissociate leaving the flavylium cation more susceptible to nucleophilic attack by water,
forming the carbinol pseudobase. The pseudobase then equilibrates with the colorless
chalcone. Figure 5 depicts the distribution of these four structures under equilibrium
conditions with pH for cyanidin-3,5-glucoside. In their research, Mazza and Brouillard

(1987), also showed a diagram of the spectra of cyanidin-3,5-diglucoside at varying pH,
which allowed the reader to follow the disappearance of the flavylium cation with
increases in pH while the other structural species arose (Figure 6). Consistent with this
diagram, Fuleki and Francis (1968b) described the highest absorbency for cranberry juice
occurred at a pH around 1 .O, with increases in pH correlating to sharp decreases in optical
density.
FIGURE 4.
RESONANCE FORMS OF THE FLAVYLIUM CATION*
*Redrawn from Jackman et al., 1987.

FIGURE 5.
DISTRIBUTION OF THE FOUR ANTHOCYANIN STRUCTURES WITH pH UNDER EOUILIBRIUM CONDITIONS*
*Scanned image from Mazza & Brouillard, 1987. AH+ Flavylium Cation B Carbinol Pseudobase
A Quinonoidal Base C Chalcone
Chen and Hrazdina (1982) reported that the complete ionization of the anhydro
bases of malvidin-3-glucoside and malvidin-3,5-diglucoside occurred at pH 8.5.
Reversal of equilibrium to the flavylium cation may be achieved when acidic conditions
are reapplied and if the alkali treatment is not too severe.

FIGURE 6.
SPECTRA OF CYANIDIN-3.5-DIGLUCOSIDE AT VARYING pH VALUES*
*Scanned from Mazza & Brouillard, 1987. pH values: 1=2.21,2=2.49, 3=2.58,4=2.72,5=2.91,6=3.77,7=4.81, 8=10.66.

Temperature & Light
Temperature greatly affects the stability and integrity of ACY. When the
temperature is increased, the rate of pigment degradation is also increased. Exposure to
light also has been shown to have adverse effects on ACY. These factors have been
investigated (Withy et al., 1993; Dao et al., 1998; Inami et al., 1996; Bakker et al., 1992).
Both processing and storage temperatures and light affect the stability of anthocyanins;
thus, making the job of the food processor even more challenging.
Beverages, especially h i t juices, and h i t products are normally held at room . *
temperature and packaged in clear containers on the grocer's shelves and in the
consumer's home where exposure to light is almost unavoidable, providing less than
optimal conditions for color retention. A study conducted by Bakker et al. (1992)
showed that two h i t puree samples and one clarified juice sample lost almost 50% of
ACY concentration after three weeks at 20°C (68°F). The same samples held at -20°C (-
4°F) showed little or no change in pigment concentration after eight weeks. Dao et al.
(1998) conducted a similar study on black bean ACY and reported the disappearance of
pigments (aglycones) after 48 hours when held at 25°C (77°F) in acidified methanol
(MeOH). Color retention improved slightly when samples were held at 2OC (35.6OF) for
which total pigment loss occurred after day six. The proposed mechanism of degradation
was the favored formation of colorless chalcones at high temperatures.
Another study by Inami et al. (1996) suggested that ACY composition played a
role in color stability. The researchers compared the effects of temperature and other
. processing conditions on two species of elderberry with different ACY profiles. Their

results showed that the pigments of Sambucus canadensis were superior to pigments of S.
nigra for color retention under high temperatures. Specifically, the primary ACY in S.
canadensis, Cy-3-0(6-O-E-p-coumaroyl-2-O-a-D-xylopyranosyl)-a-D-glucopyranoside-
5-O-a-D-glucopyranoside, expressed an 80% pigment retention in comparison to 50%
retention by the primary ACY in S. nigra, cyanidin-3-sambubioside.
Inami et al. (1996) also subjected elderberry samples to solar energy to determine
the effects of sunlight on ACY. Again, it was determined that S. canadensis retained
more pigment color than S. nigra when exposed to light, 50% and 20%, respectively.
This is more evidence in support of the stabilizing effects of acyl acids on ACY and the
importance of structure, in general, on ACY stability. These are only a few cases, but
from these experiments, it can be seen the effect structure has on the stability of ACY
color, with aglycones being less stable than their glycosides, which in turn are less stable
than acylglycosides.
Copigmentation, Condensation, & Metal Reactions
Copigmentation and condensation reactions play significant roles in the color
stability of ACY. Color is intensified in these reactions through the association of ACY
with other flavonoids, alkaloids, amino acids, benzoic acids, and other ACY compounds
through the formation of H-bonds (Francis & Markakis, 1989). There are two types of
copigmentation reactions: intramolecular and intermolecular copigmentation.
Intramolecular copigmentation is more efficient in its stabilization capability
(Jackman et al., 1987; Francis & Markakis, 1989), but both types cause a bathochromic

shift in color from red to blue. Intramolecular copigmentation involves the reaction
between ACY and its aromatic acyl substituents. The ACY is protected from degradative
hydration reactions by the sandwich-like configuration of the aromatic acyl groups
around the pyrylium ring of the ACY (Figure 7a) (Harbome, 1988; Strack & Wray,
1989). A prime example of intramolecular copigmentation is the heavenly blue ACY
fiom Ipomoea tricolor flower. Stability is increased with increased content of aromatic
acyl groups and increased substitution of the aglycone.
Intermolecular copigmentation (Figure 7b) is the association of ACY with
colorless flavonoids and other related compounds that act as copigments. It is affected
more by pH than is intramolecular pigmentation (Harbome, 1988), but offers protection
fiom hydration of the ACY through the same mechanism. The degree of copigmentation
is also dependent on ACY concentration and type and copigment concentration and type.
A study conducted by Baranac et al. (1996) looked at the spectrophotometric data of
copigmentation reactions between Mal-3,5-diglucoside and quercetin-3-rutinoside to
identify the factors influencing the reaction as well as characteristics of the copigment
formed. Their findings showed that the reaction was under the influence of pH, mole
ratio, and temperature as previously mentioned. Francis and Markakis (1989) reported
that copigmentation was more pronounced with 3,5-diglucosides than with 3-glucosides,
again suggesting the importance of ACY structure in stabilizing reactions.

FIGURE 7.
MECHANISMS OF ANTHOCYANIN STABILIZATION IN VZVO*
A. Intramolecular B. Intermolecular C. Self- Copigmentation Copigrnentation Association
D. Metal Complexity
Planar ACY v////l///l/A Flavone copigment
Sugar moiety -4 Aromatic acyl moiety 0
*Redrawn from Harborne, 1988.
When the concentration of ACY is relatively high, they are more likely to
associate with other ACY than with copigments. These reactions are termed self-
association, or condensation reactions, and offer explanation as to why ACY veer fi-om
the linearity of the Beer-Lambert Law. Color may increase more than proportionally to
pigment concentration (Hoshino, 1992; Jackman et al., 1987), creating the need for care
when making dilutions for analysis. Hoshino (1992) demonstrated that during self-
association, anthocyanidin nuclei stacked vertically, which is illustrated in Figure 7c. It

was the vertical stacking that offered protection and color intensification of the pigments.
Self-association differs fiom copigmentation reactions in that they are more prominent at
lower pH values (Jackman et al., 1987) and result more fiom hydrophobic interactions
than H-bonding.
Stabilization of ACY and their associated color may also be a result of complexes
with metals (Figure 7d). This may occur along with copigmentation and condensation
reactions. In order for metal complexes to occur an orthodiphenolic group in the B-ring
must be present; thereby, making it possible to differentiate cyanidin-, delphinidin-, and
petunidin-glycosides fiom pelargonidin-, peonidin-, and malvidin-glycosides. The latter
three do not have adjacent hydroxyl groups (Jackman et al., 1987). Another application
for metal-ACY complexes is for the determination of food adulteration for those foods
having simple ACY profiles.
Different metals cause different degrees of stability and bathochromic shifts.
Bivalent metal ions are not able to form colored complexes, but chelates will form with
tin, titanium, chromium, iron, aluminum, and others (Francis & Markakis, 1989).
Experiments conducted by Takeda et al. (1985) showed marked increases in absorbency
and bathochromic shifts when aluminum chloride (AlC13) was added to solutions of ACY
(delphinidin-3-glucoside). It was also shown that above molar ratios of 5:l (A1C13:ACY)
there were no additional increases in absorbency or bathochromic shift.
Metal complexes may have important applications in the food industry since they
occur naturally in foods and are sources of contamination during processing.
Consideration must be given, though, to the undesirable formation of brown pigments
due to metal complexes with tannins.

Vitamin C & Oxygen
The water-soluble vitamin C is well known for its health benefits as an
antioxidant, but when associated with ACY, the combination of the two compounds has
not been favored. When pigment and vitamin come together, the result is mutual
destruction involving a condensation mechanism (Francis & Markakis, 1989; Jackman et
al., 1987). This is an important issue of concern for the food industry since product
quality and nutrition are both compromised.
It has also been shown that oxygen acts synergistically with vitamin C in the
degradation of ACY (Francis & Markakis, 1989; Jackman et al., 1987). The proposed
mechanism is the formation of an intermediate molecule of hydrogen peroxide, which is
known to bleach ACY. These reactions can be inhibited under low temperatures. A
study by Bakker et al. (1992) on the effects of some processing variables on strawberry
pigments showed that ACY degradation was greatly inhibited when samples were held
under air at lower temperatures (-20°C, -4°F) than higher ones (20°C, 68°F). When
comparing samples stored under nitrogen, there were no significant differences in the
degree of ACY degradation for cold or room temperature storage conditions.
Because vitamin C and ACY coexist in so many h i t s without complexing, it has
been suggested that the antioxidant activity of flavonols offers protection to both
compounds (Francis et al., 1989). At the same time flavonols stabilized ACY color by
acting as copigments, they prevented the reaction between vitamin C and pigment,
sparing both compounds. This may prove beneficial for the food scientist in achieving
maximum protection of ACY in food products. Another study carried out by Sanna et al.

(1997) showed that the oxidation of ascorbic acid by metal ions was prevented in the
presence of ACY (cyanidin derivative) via metal chelation. The researchers offered a
second explanation for the synergistic effect between vitamin C and ACY: ascorbic acid
acted as a copigment and directly interacted with the metal-chelated ACY, forming a
table ACY-metal-copigment coordinate complex (Sarma et al., 1997).
Analytical Methods for Anthocyanins
The extraction and isolation of pigments are procedures that have been in practice
for quite some time. The documentation on ACY research is extensive. Table 3 is a list
of research literature reviewed for this study, including the source of ACY, method of
extraction, and chromatographic information. Other methods of separation and
quantification have been employed besides that of HPLC. These include Thin-Layer
Chromatography (TLC) (Goiffon et al., 1991; Frsytlog et al., 1998), Paper
Chromatography (Hong & Wrolstad, 1990), Spectrophotometry (Toldarn-Andersen &
Hansen, 1997; Sapers et al., 1986; Sapers et al., 1983b; Fuleki & Francis, 1968a &
1968b), and more recently Capillary Electrophoresis (Bicard et al., 1999; da Costa et al.,
1998; Bridle & Garcia-Viguerai, 1997; Bridle et al., 1996).

TABLE 3.
SUMMARY OF ANTHOCYANIN RESEARCH BY HPLC
ACY SOURCE
MOBILE PHASE
Gradient FA':H~O (1:9) & FA: H20: MeOH (1 :4:5)
Gradient FA: H20 (1 :9) & Me0H:FA: ACN? H ~ O (22.5:22.5:45:10)
Gradient H20:AC (93:7) & H~o:AC?: ACN:MeOH (47:23:23:7)
Gradient ACN & 10% FA
Gradient 15 % AC & 100% ACN
SOLVENT COLUMN
ODs-Hypersil
Aquapore RE-300
Aquapore
HS-5-C18
Supelcosil LC- 18
ODs Hypersil
SuperPac Pep-S
SuperPac Pep-S
SuperPac Pep-S
Lichrochart RP-18
RP-18 LiChrospher
PLRP-S
AUTHOR
Vaccin ium vita-idaea
Acidified EtOH (1% HCl)
Andersen, 1985
Vaccinium Myrfillus
MeOH Baj et al., 1983
EtOH: H20 (8:2) Acidified ~ 1 0 . 1 % HC1
Baldi et al., 1995
Vaccinium Species
Ballington et a1.,1988, 1987
Raspberry Juice
Diluted d H20 Boyles & Wrolstad, 1993
Black Beans Acidified MeOH (0.5% HC1)
Doa et al., 1998
Ribes nigrum MeOH ~10.1% T F A ~
Gradient H20:AC: (9: 1) & H20:AC: MeOH (4: 15)
Gradient 5% FA MeOH
Gradient H20:FA (99:l) & MeOH
Frraylog et al., 1998
Vaccinium Anustifolium
Gao & Mazza, 1995
ACY Stds Dissolved in Acidified MeOH (2N HCl)
Gao & Mazza, 1994
Vaccinium Anustzzolium
Gradient 5% FA & MeOH
Gradient 5% FA & MeOH
Isocratic H20:FA: ACN (8 1 : lO:9)
Gradient 10% AC & Me0H:AC: H20 (6: 1 :3)
Gao & Mazza, 1994
Fruit Jams Garcia-Viguera et al., 1997
Red Fruit None Goiffon et al., 1991
Cranberry Juice & Fruit
Acidified MeOH (0.1N HC1)
Hale et al., 1986

Cranbeny Juice & Fruit
Cranbeny Juice
Sambucus Canadensis & S. nigra
Ocimum Basilicum
Vaccinium Macrocarpon
Vaccinium Macrocarpon
Juice: diluted lox Others: acidified MeOH (1% HCl)
Diluted to 50 BrixO
Acidified MeOH (0.1 % HCl)
Acidified MeOH (0.1 % HCl)
95% EtOH: ISM HCl(85: 15)
95% EtOH: ISM HCl(85: 15)
FA = Formic Acid ACN = Acetonitrile AC = Acetic Acid
Extraction
The general rule fo
Gradient 4% PA' PLRP-S & ACN
Isocratic H20: MCH-10 C18 AC:MeOH:ACN (Micropak) (7:l:l:l)
Gradient 0.5% PA Capcell Pack in 60% THF~ & 0.5% C18 PA in H20
Gradient 1.4% SynChropak Perchloric Acid & RP- 100 MeOH
Gradient 0.1 M pBondapak Phosphate (pH 1.5) C18 & ACN
Isocratic H20: pBondapak ACN:AC:PA C18 (81.7:8.4:8.4: 1.5)
TFA = Trifluoroacetic Acid ' PA = Phosphoric Acid 6 THF = Tetrahydrofuran
Ir the extraction of ACY applies an acidified
Hong &, Wrolstad 1990
Hong &, Wrolstad 1986
Inami et al., 1996
Phippen &, Simon 1998
Sapers et al., 1984
Sapers et al., 1983a
organic solve
with repeated maceration. Four of the papers listed in Table 3 used a mixture of acidified
ethanol (EtOH); whereas, eleven others use acidified methanol (MeOH). An organic
solvent was preferred over that of an aqueous one due to the degradation of ACY by
hydration as previously explained. Hydrochloric acid (HCI) (-0.1%) was the
predominant acid used to obtain acidic conditions. Recent studies have leaned toward the
use of EtOH and less harsh acids such as formic acid and acetic acid, due to the toxicity
of MeOH and the degradation of solvents containing HCI (Strack & Wray, 1989). As

mentioned earlier, an acidic medium is required to keep the ACY in the flavylium cation
fornl where it is most stable and offers the greatest UV-Vis absorbency (5 10-530 nm) for
detection.
The extraction process was further characterized by repeated maceration of the
plant in solvent. This usually occurred under low temperatures and subdued light. Prior
to chromatographic analysis, many methods subjected samples to clean-up procedures,
such as ion-exchange and preparative chromatography (Fraylog et al., 1998), or solid-
phase extraction (SPE) (Dao et al., 1998; Kraemer-Schafhalter et al., 1998).
The variation in solvent type and concentration as applied to the extraction of
plant ACY is evident from Table 3. Revilla et al. (1998) investigated several different
methods of extraction administered on Cabernet Sauvignon Grape ACY. Their purpose
was to compare the efficiency of pigment extraction by different solvents, temperatures,
and lengths of extraction. The extraction solvents varied in their concentrations of
MeOH (50-loo%), acetone (75%), and acid (1-2% 12N HCl). Two methods used solely
MeOH as the extraction solvent. The duration of extraction (9-120 hours) and
temperature (-25°C to room temperature) also varied between methods.
The results from their study showed that acidity and length of extraction played a
role in the extraction of ACY from grapes. The method obtaining the greatest total ACY
extraction and recovery employed the highest concentration of acid, the longest duration,
and coldest temperature: acidified MeOH with 2% 12N HCI for five-24 hour extraction
periods at 4OC. The method of least recovery used neutral solvents of 100% MeOH and
80% MeOH, which spanned over 20 hours. The length of extraction in these procedures

created an obvious problem and called for improvement to make analysis more time
efficient.
It was also shown that different solvents varied in the recovery of individual
ACY. Acidic solvents proved more eficient than neutral solvents in the extraction of
non-acylated ACY. Revilla et al. (1998) concluded that the use of solvents containing up
to 1% 12N HC1 produced the partial hydrolysis of some acetylated ACY during
extraction and should not be applied to samples known to have these substituents.
Cranberries have not been reported to have attached acyl groups. Thus, it has been safe
to use these strong acids in the extraction solvent for cranberry pigments.
Because of the complexity of plant tissue matrices and presence of polar, non-
phenolic compounds, metals, and other degradative compounds, it has sometimes been
necessary to subject the ACY extract to clean-up procedures. This has been
accomplished through solid-phase extraction (SPE), with carbon-18 (C18) cartridges
being the most popular adsorbent. Several articles addressed the application of SPE for
the purification of ACY. Kraemer-Schafhalter et al. (1998) showed that SPE was a quick
and efficient means for the elimination of impurities in the sample matrix, while at the
same time offering increased ACY stability due to self-association on the cartridge. They
also reported the efficiency of different adsorbent materials, with reversed-phase silica
gels achieving the highest color retention. Loss of color was less than five percent.
Another study investigating the short- and long-term storage effects of SPE on
anthocyanidin stability was conducted by Dao et al. (1998). Variables in the study
included type of SPE cartridge, temperature and atmosphere of storage, and type of
anthocyanidin. It was found that temperature played a critical role in anthocyanidin

stability in the adsorbed form as well as in solution, as previously noted. Aglycones fiom
black beans stored in acidic MeOH (0.01% HCI) at 25OC were not detectable after 48
hours. When the same pigments were stored at 2OC, anthocyanidins were not detectable
after six days, and when stored on a C18 SPE cartridge at 2OC, the same compounds were
still present after 45 days, with 82% Del, 63% Pet, and 49% Ma1 still remaining of the
original concentration. When subjected to all variables (25OC, 2OC, SPS cartridge) Del
showed the highest stability, followed by Pet and Mal.
All of the aglycones from black beans and Cy from evergreen blackberry puree,
expressed a similar pattern of color retention on SPE cartridges (Figure 8a & 8b). It can
be seen that all four compounds showed an initial increase in color retention. For Del,
Pet, and Ma1 loss of color occurred up to day 30 where they experience slight increases in
color retention until the end of the study period. This was not the pattern followed by Cy,
which showed a steady decrease in color retention throughout the entire study.

FIGURE 8.
STABILITY OF ANTHOCYANIDINS STORED ON C18 SPE CARTRIDGES AT 2OC"
TlME (DRYS) TlME (DRYS)
*Scanned fiom Doa et al. (1998).
Reasons for the increased stability of anthocyanic compounds on C18 SPE
cartridges are not known, but Doa and colleagues (1998) offered some possibilities.
Firstly, they proposed that anthocyanidins formed salts on the adsorbent after rinses of
0.01% HC1. Secondly, the compounds may have formed H-bonds with the reactive
silanol groups (SiOH) on the surface of the cartridge. And thirdly, the flavylium cations
may have expressed self-preservation through hydrophobic stacking known as self-
association. Self-association has been discussed previously under the section 'ACY
Stability. '
Hong and Wrolstad (1990) showed the importance of SPE clean-up in
quantitative analysis as applied to pigments of cranberry, strawberry, and blueberry
juices, roselle, bilberry powder, red cabbage extract, and tamarillo h i t . When samples
were subjected to a minimal clean-up step on a C18 cartridge and monitored at 520 nm,

the chromatogram appeared quite "clean." When the absorbance was changed to 260 nrn,
the resulting chromatogram showed the presence of interfering eluting peaks. More
intense clean-up procedures did not prove better since proportions of ACY were affected.
Several other studies (Hong & Wrolstad, 1986; Garcia-Viguera et al., 1997; and Phippen
& Simon, 1998) included sample clean-up with Cl8 SPE cartridges in their methods of
ACY analysis. It is now considered common practice to use SPE cartridges for the clean-
up of ACY, as evidenced by the abundance of SPE cartridges used in the analysis of
ACY as reported in the literature.
High Performance Liquid Chromatography (HPLC)
With improved technology, reversed-phase high performance liquid
chromatography (RP-HPLC) has become the favored analytical technique for the
separation and quantitation of ACY. Complex plant extracts have been easily resolved
on the non-polar, reversed-phase column support material with several examples already
mentioned. Some problems have occurred with the use of high acid concentrations in the
mobile phase and the degradation of the support material, but this has been chiefly
overcome with sturdier columns. As Baj et al. (1983) explained, the low pH was
necessary to avoid peak broadening, which arose from the inter-conversion of the
structural forms of ACY. Through small changes in mobile phase concentration, the
retention time of individual ACY can be manipulated. Increased organic solvent
decreases retention times, but may adversely affect resolution. With complex ACY
profiles, acid hydrolysis has been useful in breaking down co-eluting pigments into their
aglycones, sugars, and acyl groups, which have then been separated and looked at more
easily to determine the sample matrix.
Research conducted by Baldi et al. (1995) employed HPLC coupled with mass
spectroscopy (34s) for the qualitative evaluation of ACY in Vitis vinifera. With
HPLCIMS, researchers have been able to compile more information on a molecular level
about the individual compounds being separated. Baldi et al. (1995) found that it was
possible to obtain the mass spectra of all ACY compounds, which are characteristic of
each compound, even if they were co-eluting or in trace amounts. Through this method,
the researchers confirmed the presence of two caffeoyl derivatives and discovered the
presence of diglucosidic ACY in the species V. vinifea.
Many HPLC methods applied to the separation and quantification of ACY
employed the use of a PhotoDiode Array Detector (DAD) for spectral analysis. Data
generated from DAD analysis allows for the determination of the complete UV-Vis
spectra of all types of compounds. In regards to ACY, important structural properties
have been obtained, such as the nature of the aglycone, the position of the glycoside, and
information of any attached aromatic acyl groups (Hong & Wrolstad, 1990). Research by
Baranac et al. (1996) and Mazza and Brouillard (1987) investigated the structural
transformations and reactions of anthocyanic compounds in aqueous solutions by
studying spectrophotometric data. The ACY solvent has been a very important parameter
in spectrophotometry and has required special consideration for reproducible results since
ACY are dependent on pH for structural conformation and unstable in aqueous solutions.
Most spectral data for ACY has been measured in a methanol solvent acidified with
0.01% HCl (Hong & Wrolstad, 1990).

Qualitatively, the American Cranberry appears to have a much simpler ACY
profile than other h i t s in the Vaccinium genus, even the closely related Small Cranberry
( V . oxycoccus). Only four major ACY with two aglycones are represented in the
American Cranberry; whereas, studies conducted by Ballington et al. (1988 & 1987) on
V. crassfolium, V. sempervirens, V. ovatum, V. stamineum, V. erythrocarpum, and seven
species of bluebemes reported complex profiles of up to 15 known ACY, with all of the
six common aglycones except pelargonidin being present. The glycosides reported were
the O-3-glucosides, -galactosides, and -arabinosides. Although acyl acid substituents
were not mentioned in these papers, studies conducted by Gao and Mazza (1 995 & 1994)
on bluebemes identified acetylated ACY in some high-bush and low-bush bemes by
means of acid hydrolysis and spectral analysis.
Several research articles have been dedicated to the cranberry - evaluating berry
quality, breeding programs (Sapers et al., 1983a), juice recovery (Sapers et al., 1983b),
individual and total ACY content (Sapers et al., 1987 & 1986, Hong & Wrolstad, 1990,
Fuleki & Francis, 1968a & 1968b, and Andersen, 1989), fruit composition (Hong &
Wrolstad, 1986), and processing effects (Sapers et al., 1983b).
Hong and Wrolstad (1986) conducted a thorough investigation on the composition
of cranberry fruit, from titratable acidity and brix to spectral analysis and Hunter
parameters to organic acid, sugar, and anthocyanidin content. Consistent with other
researchers' results, Hong and Wrolstad (1986) reported the presence of two
anthocyanidins, cyanidin (Cy) and peonidin (Pn). The chromatogram on the following
page shows the peaks eluting at 8-9 minutes for Cy and 16-17 minutes for Pn (Figure 9).
The peaks are broad, which may be a result of inadequate pH for the flavylium cation.

FIGURE 9.
LC CHROMATOGRAM OF CRANBERRY ANTHOCYANIDINS'
'Scanned from Hong & Wrolstad, 1986. Peak Assignment: 1 - Cyanidin, 2 - Peonidin
Calculated as Cy-3-Glu, the content of Cy and Pn fiom eight popular cranberry
varieties ranged fiom 7.6 to 20.5 mg/100g and 6.2 to 12.1 mg/100g, respectively. The
average content of Cy and Pn was 12.3 and 8.9 mg/100g with percent coefficients of
variance (%CV) equal to 38% and 25%, respectively. The average total anthocyanidin
content was 21.2 mg/100g with a %CV of 31%. The percentages of Cy and Pn varied
less than their individual contents among cultivars. Cy contributed 57% (9%CV), while
Pn contributed 43% (12%). These percentages were inconsistent with later work
conducted by the same researchers (Hong & Wrolstad, 1990) when they report 46% Cy
and 54% Pn based on total peak area. Discrepancies were most likely due to differences
in cranberry cultivar, extraction, available standards, and quantification methods.

Later work conducted by Hong and Wrolstad (1990) further analyzed cranberry
pigments by looking at the individual ACY. In agreement with other research (Sapers et
al., 1987 & 1983a), they found the cranberry contained the 3-galactosides and 3-
arabinosides of Cy and Pn. Two minor peaks also present were believed to be the 3-
glucosides of Cy and Pn. Values of individual and total ACY content varied in the
literature, most likely due to differences in experimental design. Experiments led by
Sapers et al. (1987 & 1986) took into account the variation in berry surface color, and
they subdivided samples into light, medium, and dark berries since the highest
concentration of pigment is located in the berry skin. Total ACY values reported ranged
fiom 25.3-34.4 mg/100g for light subsamples, 38.1-62.7 mg/100g for medium
subsamples, and 61.3-100.6 mg/100g for dark subsamples in the 1987 published article
and 7-12 mg1100g for light subsamples, 15-37 mg/100g for medium subsamples, and 34-
72 mg/100g for the dark subsamples as published in the 1986 article. Average total ACY
contents fiom these two articles are listed in Table 4. Earlier work by Sapers et al.
(1 983a) obtained higher total ACY contents of 13 cranberry cultivars when analyzed by a
tristimulus reflectance method. The range and average of total ACY content was 45.9-
17 1.9 mg/100g and 86.3 mg/1 OOg, respectively.
It was concluded that berry total ACY content decreased in proportion to the
berry surface-to-volume ratio; and thus, was affected more by berry size than berry
surface color (Sapers et al., 1986).

TABLE 4.
AVERAGE ANTHOCYANIN CONTENT IN CRANBERRIES SORTED BY SURFACE COLOR
80.60' 46.13 Medium 48.03 24.33
Light 28.40
Color
a Average total ACY content within subsamples for 'Franklin,' 'McFarlin,' and 'Searles' cultivars in Sapers et al., 1987. Average total ACY content within subsamples for 'McFarlin,' 'Stevens,' and 'Early Black' cultivar in Sapers et al., 1986.
' Reported in mgJ100g
Two articles published by Sapers et al. (1987 & 1983a) also looked at the
1987"
individual proportions of ACY based on peak area. The results took into account a fifth
1 986b
unknown peak assumed to be Pn-3-Glu. The results are listed in Table 5.
TABLE 5.
PROPORTIONS OF INDIVIDUAL ANTHOCYANINS IN CRANBERRIES
Individual proportions based on peak area percent as published in Sapers et al., 1987. Individual proportions based on peak area percent as published in Sapers et al., 1983a.
YEAR
1987"
1
From Table 4 it can be seen that the total ACY content varied significantly for
different subsamples of cranberries according to surface color. Data not shown but
discussed by the researchers also showed that total ACY content varied greatly among
Cy-3-Gal
24.6
25.8
Cy-3-Arab
14.5
15.6
Pn-3-Gal
36.9
40.1
Unknown
4.7
3.1
Pn-3-Arab
13.1
15.2
cultivars (Sapers et al., 1987, 1983% & 1986). On the other hand, the proportions of
individual ACY varied little among different species, which has importance for
taxonomic purposes and cross-breeding studies, as well as determination of product
adulteration.
Garcia-Viguera et al. (1997), Hale and Fagerson (1986), and Goiffon et al. (1991)
addressed the issue of adulteration in fruit products. Garcia-Viguera et al. (1997)
developed a technique to determine jam authenticity via ACY profiles, where previously
other flavonoids had been used. Some manufactures have tried keeping the cost of
cranberry juice down by adding less expensive h i t juices without affecting the quality of
the final product. Hale et al. (1986) were able to separate a mixture of cranberry juice
cocktail adulterated with grape enocyanin by HPLC. They were able to detect
adulteration of the cranbeny juice when just 5% of the enocyanin solution was added.
Goiffon et al. (1991) performed HPLC analysis on the ACY of several red h i t s to
determine their profiles and the retention characteristics of different substituents in
different mobile phases in order to establish references for manufactures. It was
determined for analysis of ACY by RP-HPLC with weakly acidic media that the elution
order of the aglycones was Del, Cy, Pet, Pel, Pn, and Mal. With identical aglycone
moieties, the elution order of the 3-glycosides was -galactoside (Gal), -glucoside (Glu), -
rutinoside, and aabinoside (Arab) with some exceptions (Goiffon et al., 1991).

Capillary Electrophoresis (CE)
The literature on the analysis of ACY by capillary electrophoresis (CE) is in its
infancy with only a handful of articles in existence. The list is much longer for research
conducted on flavonoids (Delgado et al., 1994; Seitz et al., 1992; Fernhdez de Sim6n et
al., 1995; Morin et al., 1997; Gil et al., 1995; Ferreres et al., 1994; Ng et al., 1992; Morin
& Dreux, 1993; and Boyce & Bennett, 1996), encompassing flavonols, flavones,
flavanones and other plant phenolics. All of these flavonoid experiments employed a
borate buffer at pH 7.5 or higher; hence, the initial research on ACY (Bridle & Garcia-
Viguera, 1997; Bridle et al., 1996) also applied a borate buffer with a pH near 8.0. As
seen with HPLC applications, solvents and mobile phases were of acidic nature, as low as
pH 1.8. The necessity for very low pH values when analyzing ACY has been explained:
the flavylium cation is the predominant structure in acidic solution; it is the most stable
structure; and it has the highest chromaphore absorbency. It was determined by Bridle
and Garcia-Viguera (1997) that a much larger sample concentration (87 times) was
needed for an equivalent CE response at pH 8.0 compared to HPLC at pH 1.8. Figure 10
illustrates the differences in DAD spectra of pelargonidin-3-glucoside as determined in
the study by Bridle and Garcia-Viguera (1 997).

FIGURE 10.
SPECTRA OF PELARGONIDIN-3-GLUCOSIDE AT pH 1.8 AND pH 8.0'
SOLID LINE - pH 1.8 DOTTED LINE ... pH 8.0
a Scanned fiom Bridle and Garcia-Viguera, 1997.
Two of the CE articles reviewed followed the same analysis conditions, which are
outlined in Table 6. At pH 8.0, the dominant colored species was the blue quinonoidal
base. In borate buffer, it has a characteristic absorbency maximum in the range of 560-
580 nm. The DAD was set to monitor at 560 nrn and 580 nm for studies by Bridle and
Gracia-Viguera (1 997) and Bridle et al. (1 W6), respectively.

TABLE 6.
ANTHOCYANIN METHOD BY CAPILLARY ZONE ELECTROPHORESIS IN BASIC MEDIA*
CAPILLARY I BUFFER
150 rnM NaBorate pH 8.0
TEMPERATURE
25" C
WAVELENGTH
580 nm
CONDITIONING
MeOH, 5 min 1M NaOH, 5 min
0.1M NaOH, 5 min dH20, 3 min Buffer. 3 min
Hydrodynamic 2 seconds
9 nL
INJECTION
BTWN RUNS SAMPLE SOLVENT I
ELECTRIC FIELD
* Adapted from Bridle and Garcia-Viguera, 1997 and Bridle et al., 1996.
O.1M NaOH, 3 min dH20, 2 min MeOH, 3: 1
At pH 8.0, the silanol groups on the capillary wall were deprotonated and
possessed a negative charge. The ACY were also carrying a negative charge; and
therefore, did not interact with or adsorb on the capillary wall. The driving force behind
the migration and resolution of the pigments was three-fold: first, and foremost, was the
electro-osmotic flow (EOF), which has been the basis for almost all CE operations;
second was the chargelmass ratio; and third was the selectivity obtained from borate
complexation with ACY (Bridle et al., 1996). Despite the attraction of the negatively
charged quinonoidal base for the anode (inlet end of the capillary), the net movement was
toward the cathode and detector via the forces of the EOF. The chargelmass ratio for
negative analytes correlated to larger massed species being detected before smaller-in-
mass species with the same charge since they had less electrophoretic mobility toward the
25 rnM Phosphate pH 2.5

anode (inlet end). ACY that complexed with borate in the buffer also experienced longer
migration times since the negative charge was increased more than molecular n~ass of the
complex. Borate complexation required a fiee ortho-dihydroxyl group on the ACY.
Pigments with this characteristic are Cy, Del, and Pet. This has importance when
analyzing cranberry pigments since they contain the glycosides of Cy, which has a fiee
ortho-dihydroxyl group, and Pn, which does not.
Migration time was also affected by glycosylation (Bridle & Gracia-Viguera,
1997; Bridle et al., 1996). With increased glycosylation, there was a decrease in
migration time, which followed the chargelmass ratio mechanism previously described.
In the first study by Bridle et al. (1996) on work with ACY standards, the migration of
analytes was Mal-3,5-diglucoside, Pel-3-Glu, Mal-3-Glu, Cy-3-Rutinoside, Cy-3-Glu,
and Del-3-Glu. All peaks were baseline separated except for Pel-3-Glu and Mal-3-Glu,
and the run time was just short of eight minutes.
In the second study by Bridle and Garcia-Viguera (1997), the ACY in
strawberries and elderberries were analyzed. Four major ACY in both h i t s were
separated. The order of detection was different than that by HPLC for the strawberry
pigments, but the same for the elderberry pigments. For both analyses by CE, the run
time was under six minutes. This CE method proved much more time efficient than the
corresponding HPLC analyses, which took up to 25 minutes for the strawberry pigments.

TABLE 7.
ANTHOCYANIN METHOD BY CAPILLARY ZONE ELECTROPHORESIS IN ACIDIC MEDIA
WAVELENGTH
TEMPERATURE
25" C
WAVELENGTH
520 nrn
BUFFER
50 rnM NaPhosphate apparent pH 1.5
10-30% ACN MeOH
CONDITIONING
not described
BUFFER
0.25 mM CTAB 160 mM NaPhosphate
pH 2.1
CONDITIONING
1 M NaOH, 10 min 0.1 M NaOH, 10 min
HZO, 10 min Buffer, 15 min
INJECTION
Hydrostatic pressure 4 seconds
BTWN RUNS
Buffer, 1 min at high pressure
INJECTION
Hydrodynamic 8 seconds 50 mbar
BTWN RUNS
0.1 M NaOH, 3 min HzO, 3 min
Buffer, 5 min
ELECTRIC FIELD
positive polarity
SAMPLE SOLVENT
1 g Blackcurrant powder + 25 rnL
water
ELECTRIC FIELD
-25 kV -70 pA
negative polarity
SAMPLE SOLVENT
100 mM Citric Acid 25 mM NaPhosphate
pH 2.1 MeOH, 30%
CE conditions for ACY analysis fiom da Costa et al., 1998 CE conditions for ACY analysis fiom Bicard et al., 1999
Two more recent studies analyzed ACY by CE under acidic conditions and are
outlined in Table 7. The advantage of greater sensitivity at low pH values has been
mentioned, but da Costa et al. (1998) also discussed the fact that at higher pH values e7)
ACY rapidly degrade, making accurate quantitation difficult. Other advantages noted by
the researchers were increased peak sharpness and improved resolution of the pigments

with decreasing buffer pH. This was at the cost of increased migration time. The
migration time was significantly longer (>20 minutes) than that found under basic
conditions. The explanation for this goes back to the forces of the EOF: as the pH of the
buffer was decreased, the silanol groups on the capillary wall were progressively
protonated, decreasing the wall charge and drag of the EOF. Under acidic conditions, the
analytes migrated almost entirely under their own electrophoretic mobility. This was
another important point of consideration when analyzing ACY by CE because, as
previously mentioned, ACY possess different charges at different pH values. Under
slightly acidic conditions, the predominant ACY forms are the neutral quinoidal bases,
which do not migrate or resolve in the absence of the EOF.
In order to resolve the four ACY compounds in blackcurrants, an organic
modifier was added to the running buffer. Trials of 10-30% acetonitrile (ACN) and
MeOH were conducted. The best results were obtained with 30% ACN. The
improvement in peak resolution and shape with the addition of an organic modifier was
attributed to changes in the EOF and the analyte electrophoretic mobility, which in turn
were due to changes in buffer pH (da Costa et al., 1998). Even the slightest change in
buffer pH resulted in changing the apparent p& of the analyte, which caused subsequent
changes in solute-analyte interactions (da Costa et al., 1998).
The other study employing acidic conditions for the analysis of ACY used a
quaternary amine, cetyltrimethylammoniumbromide (CTAB). CTAB is a long chain
alkylammoniwn salt that has the ability of reversing the direction of the EOF when added
to the running buffer. At levels well below its critical micellar concentration, CTAB
coats the capillary wall and creates an overall positive charge. Reversing the EOF has

offered advantages in detecting negative analytes, which have shown the longest
migration times under normal CE conditions. Lucy and Underhill (1996) investigated the
mechanism behind CTAB7s adsorption on to the capillary wall. They discussed two
possible methods of how CTAB formed its bilayer on the capillary wall. Figure 11
shows a schematic of the proposed mechanisms, which are explained in the following
paragraphs.
The first mechanism involved small concentrations of the surfactant that, because
their positive heads were more attracted to the negative silanol groups of the capillary
wall, they individually formed a single layer on the capillary (Figure 11 Ai-ii). As more
surfactant was introduced in to the capillary, the long hydrophobic tails of the surfactant
quickly lined up with those adsorbed to the capillary wall to form a second layer (Figure
11 Aiii). The positively charged heads of this second layer were then exposed on the
capillary wall and gave it an overall positive charge.
The second mechanism proposed by Lucy and Underhill (1996) involved larger
initial concentrations of the surfactant. In this case, the hydrophobic interactions of the
long alkylammonium chains were stronger than the electrostatic attraction between the
positive charge on the CTAB head and the negative charge on the capillary wall.
Therefore, the surfactant existed in solution as hemirnicelles. Initially, a few single
molecules adhered to the wall as before through electrostatic attraction (Figure 11 Bi),
but then the hemimicelles adsorbed on to the capillary wall solely through hydrophobic
attraction (Figure 11 Bii-iii). The authors also described factors that affected these two
processes: ionic strength, pH, and temperature.

FIGURE 11.
Ai.
SCHEMATIC REPRESENTATION OF THE ADSORPTION OF CTAB ON THE CAPILLARY WALL*
Bi.
Capillary Wall - CTAB Molecule (3v
I Negative Charge - - - - - - - - - - Hemirnicelle - I
* Redrawn from Lucy & Underhill (1996).

Bicard et al. (1999) explained that it was the hydrophobic interactions between
the chromaphore and the alkyl chain of the CTAB and influence of the positive charge of
the CTAB on the capillary wall that were responsible for the resolution of the colored
flavylium cation in acidic media. The researchers experimented with slightly acidic run
buffers (pH 3-4) without CTAB present, but detection of the flavylium cation was not
found at any wavelength. They offered the explanation that the cation was adsorbed on
the capillary wall via ionic interactions with the negative silanoate groups. Thus, the
cationic surfactant was enlployed to eliminate wall-analyte interactions. Under these
conditions, three Cy- and one Mal- glycosides from different natural sources were able to
be analyzed.
ORGANIC ACID CONTENT
Organic acids, such as citric, malic, quinic, benzoic, and ascorbic acid, which are
the predominant acids in the American Cranberry, play an important role in maintaining
the quality of a wide variety of h i t s and vegetables. The presence and quantity of acids
can indicate the quality and properties of a product and can reflect contamination or
adulteration. Organic acids also offer nutritional value (L-ascorbic acid), flavor, color,
and other hc t ions to food and food components. In general, organic acids are weak,
non-oxidizing compounds. Citric and malic are the most abundant organic acids in
plants, making up to 3% of tissue on a fresh weight basis.

Structure
The structures of the five major acids present in cranberries are shown in Figure
12. It can be seen that these compounds are small aqd relatively simple in configuration,
but as with ACY these acids owe their different functions to their structure. Ascorbic
acid possesses antioxidant activity making it an important health contributor. It also
spares the degradation of other food components. Benzoic acid has shown antihngal
properties; thus, offering natural protection for food safety and keeping quality. It offers
maximum activity at pH 2.5-4.0. Kraemer-Schafhalter et al. (1998) described citric acid
as a chelator of metal ions, which may have application in the protection of ACY during
processing. Malic acid offers several flavoring characteristics to food. It has taste-
blending characteristics, aftertaste masking abilities, as well as flavor-fixing qualities,
which hold onto essential essences (Malic Attributes, 1999). There are probably other
benefits and functions of organic acids that remain undiscovered.
All of these acids contribute tart flavors to fruits and some vegetables. The pK,
values of individual acids vary, depending on the number of carboxylic acid and hydroxyl
groups present. Table 8 lists the pK, values for the acids found in cranberries.

FIGURE 12.
STURCTURE OF THE FIVE MAJOR ORGANIC ACIDS IN CRANBERRIES
HO QUlNlC AClD
MALlC AClD
COOH COOH
CITRIC AClD
L-ASCORBIC AClD
@OH BENZOIC ACID
TABLE 8.
& VALUES FOR THE MAJOR ORGANIC ACIDS IN CRANBERRIES
ACID
L-ascorbic Benzoic Citric Malic
1 Quinic
pK, VALUE
~Kal pKa2 pKa3
4.2 11.6 4.2 3.1 4.8 6.4 3.4 5.2 4.9

Analvtical Methods for Organic Acids
Organic acids have been analyzed by a variety of methods: ion-exchange column
chromatography, thin-layer and paper chromatography, spectrophotometry, gas-liquid
chromatography, RP-HPLC and CE, and on a variety of foods: grapes (L6pez & Mmez,
1996; Hunter et al., 1991), pineapples (BartolomC et al., 1996), raspberries (Riaz &
Bushway, 1994), h i t juices (Coppola et al., 1978; Blanco et al., 1996), potatoes
(Bushway et al., 1984), and other fruits or vegetables (Nisperos-Caniedo et al., 1992;
Kovics & Djedjro, 1994). The articles I reviewed come solely from the RP-HPLC
category. Improvements in column technology have been made for the analysis of
organic acids since the acidic content of the mobile phase has resulted in column
degradation. There are now columns that are able to withstand mobile phases with pH
values less than 2.0. This is important when considering the range of pK, values of
different acids and stabilizing individual acids in either their protonated or deprotonated
state..
The extraction procedure for organic acids can be extremely easy or very dificult,
depending on the food matrix. For solid foods, either a dilute acid (phosphoric or
sulfuric) or an organic solvent (EtOH or MeOH) or both have been used. The complexity
of the extraction exists when samples are subjected to ion-exchange columns andlor Sep-
Paksm for clean up. The ion-exchange columns are laborious and time consuming since
they are not reusable and must be made fiesh for each sample analyzed.
The mobile phase plays an important role in keeping each of the different acids in
a stable ionized state, usually the protonated state to minimize analyte-column

interactions. Therefore, many solvents have consisted of concentrated acids; namely
phosphate and sulfate. Some methods have been developed to isocratically analyze
organic acids as well as other food components (L6pez & G6mez. 1996). This has been
made possible through the involvement of both W and refractive index detection. Most
other methods employed W detection only, monitoring at 214 nm or 245 nm for vitamin
C.
Three of the articles reviewed specifically addressed the organic acid content in
cranbemes. Coppola et al. (1978) determined the mean content of individual acids in
cranberry juice was 1.32%, 0.92%, and 1.08% for quinic, malic, and citric, respectively.
The analysis time for all three acids was under 12 minutes. Acids eluted according to
increasing polarity with quinic acid (less polar) eluting first and citric acid (more polar)
eluting last (Coppola et al., 1978). These results were in close agreement with later work
by Hong and Wrolstad (1986), who also reported mean percent of total acids: quinic
39.2%, malic 27.2%, citric 32.4%, and shilumic 1.2%. Shikimic is an acid metabolically
related to quinic acid.
Later work conducted by Coppola (1984) exploited chromatographic analysis of
acid content in juices for the purpose of monitoring authenticity. Cranberry juice
adulteration can be monitored easily by looking at the ratio of citric to quinic. Although
these acids are present in other h i t s , quinic acid is characteristically higher in
cranberries and their juice than other h i t s . Other methods exist for monitoring
adulteration, such as sugar or anthocyanin analysis. Sometimes these methods are used
in conjunction with one another because of varietal differences within classes of h i t s
and vegetables.

MATERIALS & METHODS
The cranberries used in this study were generously given to the Department of
Food Science & Human Nutrition at the University of Maine by John Harker, an
independent grower in Southern Maine. The berries were received cleaned and
individually packaged in 16 slotted plastic containers. Sample sizes of the 16 cultivars
were small and varied, requiring the entire sample to be macerated for homogeneity.
Sample remaining after the analysis on fiesh cranberries was packaged and sealed in
Ziploc freezer-storage bags and stored in the fieezer until ready for further analysis.
When sample size allowed, samples were analyzed in triplicate. Within a week of
delivery, entire samples of the berries were macerated in a Cuisinart (Cuisinarts Corp.;
East Windsor, NJ) and immediately examined for moisture and L-AA content. Samples
for ACY and organic acid content were prepared in their respective extraction solvents
and refrigerated until analysis was completed for moisture and L-AA.
Anthocyanidin analysis was carried out on fiozen cranberries only for the 1998
cranberry cultivars. Cranberries from the 1999 harvest were also supplied and analyzed
for ACY content only. The berries were fiesh and extracted within two days. Unlike the
1998 cranberries, the 1999 berries were not held in solvent for any longer than the
extraction process. CE analysis of anthocyanidins was carried out on commercial
cranberries. The extracted pigments were then injected into the HPLC for comparison
and correlation between the developed CE method and the established HPLC method for
the analysis of anthocyanidins.

The following chemicals were supplied fiom EM Science (Gibbstown, NJ):
sulfuric acid, HPLC grade water, HPLC grade MeOH, HPLC grade ACN, hydrochloric
acid, ammonium hydroxide, and glacial acetic acid. Chemicals fiom Fisher Scientific
Co. (Fair Lawn, NJ) included 2-propanol, n-propanol, potassium phosphate, and
phosphoric acid. Chemicals fiom J.T. Baker Chemical Co. (Phillipsburg, NJ) included
meta-phosphoric acid and sodium bicarbonate. L-ascorbic acid and 2,6-
dichloroindophenol sodium salt were supplied fiom Sigma Chemicals (St. Louis, MO),
and ACY standards were fiom Indofine Chemical Co. (Somerville, NJ). The C18 Sep-
Pak@ Plus cartridges came fiom Waters (Milford, MA), and the deionized water (dH20)
was made by glass distillation in the Food Science Analytical Chemistry Lab (Orono,
ME).
ANALYSES PERFORMED
The fiesh and fiozen harvested cranberries were analyzed for the following:
anthocyanin content, anthocyanidin content, organic acid content (citric, malic, quinic,
and ascorbic acids), and moisture content. The 1999 harvested berries were analyzed for
ACY content only.

Anthocyanin Extraction
The extraction procedure for ACY was adapted fiom Sapers et al. (1983a). Fresh
cranbemes were macerated in a Cuisinart. In triplicate, 5-gram samples were weighed
out into cylindrical tubes and wrapped with aluminum foil to block light. Approximately
20g of extraction solvent (95% EtOH:1.5 M HC185:15) was added to the bemes and then
polytroned for three minutes at 45 x 100 rpm. The slurry was then centrifuged for 10- 12
minutes at 15,000 x g. The supernatant was collected into an amber beaker. The residue
was extracted two more times with approximately 20g of solvent. All three supernatants
were combined and a 10:l dilution was made with dH20. This mixture was then
subjected to a clean up step by loading it onto a C18 Sep-Pal@, activated with 5ml of 2-
propanol and lOml of dH20. The pigments were then eluted with 2ml of 1% HC1 in
MeOH. Samples were not filtered prior to injection into the High Performance Liquid
Chromatograph (HPLC) due to loss of pigment on the filter paper.
HPLC Conditions for Anthocyanin Analysis
Samples were analyzed on an HP 1050 HPLC system equipped with an HP 1050
series isocratic pump and an HP 1040A PhotoDiode Array Detector (Hewlett-Packard
Co.; Avondale, PA). The column used was a Columbus C18; 150x4.6m1-n; 5pm
(Phenomenex,; Torrance, CA). The mobile phase consisted of HPLC grade water,
acetonitrile, acetic acid, and phosphoric acid in the ratio 81.7:8.4:8.4: 1.5. The volume of
the sample injected was 10p1, and flow rate was 1.0 myminute. The DAD was set to

monitor at a wavelength of 520 nrn. Each sample was injected once with a standard
injected after every third sample. The temperature of the room reflected the temperature
of the HPLC system; and therefore, it was difficult to control. One standard (Cy-3-Gal)
was made up in 1% HC1 in MeOH at a concentration of approximately O.Olmg/mL.
Sample calculations were based on peak areas.
Acid Hvdrolysis of Anthocyanins
The extraction procedure for isolating the two anthocyanidins in cranbemes
followed that for anthocyanins up to and including the step combining the three
successive extraction supernatants. After this step, 3mL of supernatant were combined
with 15mL of 1% HC1 in MeOH in an amber, flat-bottomed round flask. The flask was
weighted down and placed in a hot water bath (-100°C) for 30 minutes. The flask was
then put immediately into a cold water bath until cool enough to be handled. The dark
liquid was then loaded onto an activated C18 Sep-Pak@ (5ml 2-propanol, lOml dH20),
eluted with 1% HCl in MeOH, and injected onto the HPLC.
HPLC Conditions for Anthocyanidin Analysis
HPLC analysis for anthocyanidins was similar to that of the anthocyanins except
for the mobile phase. More organic solvent was needed to resolve the peaks and maintain
efficient retention times. The ratio of the mobile phase used was 70:20:7.5:1.5 (HPLC
grade water:acetonitrile:acetic acid:phosphoric acid). The two standards were made up in

1% HC1 in MeOH at a concentration of approximately O.Olmg/rnL. Calculations were
based on peak areas.
CE Conditions for Anthocyanidin Analysis
Anthocyanidin content for cranberries was analyzed on an HP 3D Capillary
Electrophoresis System with an HP ChemStation and an on-line DAD detector (Hewlett-
Packard Co.; Waldbronn, Germany). The capillary dimensions were 48.5cm with an
effective length of 48.0cm, an inner diameter of 75pm, a bubble factor of 2.7, and an
optical path length of 200pm. The system was conditioned each day with 0.1M
phosphoric acid for 15 minutes at 40°C, HPLC grade water for 15 minutes at 40°C, and
running buffer for 15 minutes at 27OC. The composition of the running buffer was
150mM phosphoric acid, 50mM P-cyclodextrin, and 3M urea with a pH of -2.1 1.
Hydrodynamic injection involved applying 5OmBar of pressure for five seconds. The
system was then run at a constant voltage of 20kV, which resulted in a current of
approximately 11OpA. The temperature remained steady at the specified 27OC. The
DAD was set to monitor a wavelength of 525nm. Impurities were expelled from the
capillary during the post-conditioning, which involved flushing the capillary with 0.1M
phosphoric acid for five minutes, HPLC grade water for five minutes, and then the run
buffer for five minutes. All post-conditioning rinses were at 27OC. The buffer vials, as
well as the post-conditioning vials, were replenished after every fourth run to maintain a
consistent pH.

Organic Acid Extraction
The extraction procedure for organic acids was adapted from that of Bushway et
al. (1984) and Riaz and Bushway (1994). Fresh cranberries were again macerated in a
Cuisinart, and three 12.5g samples were put in a conical centrifuge tube along with
approximately 25g of solvent (95% EtOH:H20:H2S04 60:40:0.2). This mixture was
polytroned for four minutes at 55 x 100 rpm. The supernatant was collected by vacuum
filtration. A 2mL aliquot was taken, dried under nitrogen, and reconstituted in 3mL of
dH20. The pH was adjusted to 6-7 with 5% N&OH and then put on an ion-exchange
column. The column was prepared by packing it with a 2mL slurry of a Bio-Rad #5
Anion Exchange Resin (100-200 mesh) (Bio-Rad Laboratories; Richmond, CA) and
capping it with a fiit. The resin was good for only one application.
Before applying the sample, the resin was rinsed with 3mL of dH20. The sample
was applied and then washed with 3mL of dH20. The acids were eluted with 3.5mL of
10% H2SO4 and 3.5mL of dH20. This approximate 7mL volume was then passed
through an activated C18 Sep-PakB for fiuther clean up. It was activated with 5mL 95%
EtOH and 5mL dH20. Samples were filtered prior to injection on the HPLC.
HPLC Conditions for Organic Acid Analysis
Samples were analyzed on the same HPLC system as the ACY. The RP column
was a BetaBasic 18; 250~4.6 mm; 5mm (Keystone Scientific, Inc.; Bellefonte, PA). The
mobile phase was adapted fi-om an article in BASELINE Chromatography Newsletter by

Keystone Scientific, Inc. (1998) and consisted of 0.05M KH2P04, 0.03M H3P04, and
0.1% n-Propanol. The flow rate was 1.0 mL/min; injection volume was 10.OpL; and the
DAD was set to monitor at 214nm. Standards were prepared according to the method
outlined by Bushway et al. (1984).
L-Ascorbic Acid Extraction
L-Ascorbic acid was extracted from fresh cranberries by polytroning a log
sample and approximately 20g of 3% meta-phosphoric acid for three minutes at 55 x 100
rpm in a conical centrifuge cone wrapped in aluminum foil. The supernatant was
collected by vacuum filtration. A 5mL aliquot of the supernatant was diluted with lOmL
of 3% meta-phosphoric acid. This was then passed through an activated C18 Sep-PakB
(4mL MeOH, 1 OmL dH20, and 1 OmL sample). A 5mL aliquot was collected after the
initial 2mL were allowed to pass through the Sep-PakB.
Quantification of L-Ascorbic Acid
The AOAC method of titration was used to determine the quantity of L-ascorbic
acid in the sample. The amount of titrant needed for the sample analysis was compared
to a standard curve, which was also described in the AOAC method for vitamin C
determination.

Moisture Content Determination
The moisture content of cranbemes was determined by weighmg a 2g sample into
a pre-weighed crucible and drying it for 14 hours in a forced air oven (Fisher IsotempB
Oven Model 350) at 105OC. The sample and container were allowed to cool in a
desiccator before reweighing. .

RESULTS & DISCUSSION
ANTHOCYANIN & ANTHOCYANIDIN CONTENT
In this study, cranberry pigments were analyzed in both the fiesh and fiozen state
by HPLC. Of the 16 original cultivars fiom the 1998 harvest, 14 were analyzed in the
fiesh state and 13 in
analytical testing. A1
ACY profiles of the
he fiozen due to small sample size and sample depletion for other
cultivars showed similar ACY profiles, but varied in content. The
cranbenies were consistent with those reported in the literature,
which have been discussed earlier in this paper. A typical chromatogram of the purified
pigment extract is illustrated in Figure 13. Unlike its close relative, the Small Cranberry,
which has the 0-3-glucosides of cyanidin (Cy), peonidin (Pn), delphinidin @el),
petunidin (Pet), and malvidin (Mal) (Andersen, 1989), the American Cranberry has only
the 0-3-glucosides of Cy and Pn.

FIGURE 13.
HPLC CHROMATOGRAM OF CRANBERRY ANTHOCYANINS
Peak assignment: 1 - Cy-3-Gal, 2 - Unknown, 3 - Cy-3-Arab, 4 - Pn-3-Gal, 5 - Unknown, 6 - Pn-3-Arab.
The chromatogram above shows the detection of four major peaks (1,3,4,6) and
two minor peaks (2, 5). The analysis time was just under 12 minutes. The average
retention times for individual ACY, along with %CV values are listed in Table 9. The
small %CV values for individual retention times indicated the reproducibility of this

method from run to run and day to day (Table 9). Retention times for the individual
ACY on any of the dates shown in Table 9 varied less than 20%.
Listed in Table 10 are the absorbency maxima, collected by DAD. The
absorbency spectra provided insurance that the compounds detected were indeed
anthocyanins, based on the characteristic spectra of anthocyanic compounds reported in
the literature. ACY with attached glycosides in the 3-position followed the typical
TABLE 9.
AVERAGE RETENTION TIMES JIN MINUTES) FOR CRANBERRY ANTHOCYANINS BY HPLC
All Dates
Date Stats
# of cases Mean % cv
# of cases Mean % cv
# of cases Mean % cv
# of cases Mean % cv
# of cases Mean % cv
# of cases Mean % cv
Cy-3-Gal Cy-3-Arab Pn-3-Gal Pn-3-Arab

TABLE 10.
UV-Vis MAXIMA OF CRANBERRY ANTHOCYANINS & AGLYCONES
W-Vis ANTHOCYANIN MAXIMA (nm)
Cy-3-Gal Cy-3 -Arab Pn-3-Gal Pn-3-Arab
Cyanidin Peonidin
a In H20:ACN:Acetic Acid:Phosphoric Acid (81.?:8.4:8.4:1.5) pH<2.0. In H20:ACN:Acetic Acid:Phosphoric Acid (70:20:8.5:1.5) pHC2.0.
spectra shown in Figure 14a-d. Slight differences in the absorbency maxima existed with
the attachment of different sugar moieties. The galactosides of both Cy and Pn expressed
maxima at 280 and 520 nm; whereas, the arabinosides absorbed at 285 and 518 nrn.
These values differed even further fiom the individual aglycones, which showed maxima
at 275 and 525 nm.
Besides spectral analysis, peaks were identified by comparing retention times of
peaks fiom previous studies (Sapers et al., 1983a; Sapers & Hargrave, 1987) and one
available standard, Cy-3-Gal. The four major peaks were identified as Cy-3-Gal, Cy-3-
Arab, Pn-3-Gal, and Pn-3-Arab. Due to the lack of standards, results were reported in
Cy-3-Gal equivalents. One cultivar, which was yellow, showed no ACY detection. The
results fiom this yellow cultivar were not included in any of the calculations for total
ACY content or determination of significant differences between cultivars.

FIGURE 14.
SPECTRA OF THE FOUR MAJOR ANTHOCYANINS IN CRANBERRIES*
* In H20:A(=N:Acetic Acid:Phosphoric Acid (81.7:8.4:8.4: 1.5) pH < 2.0. A Cy-3-Gal
Cy-3-Arab Pn-3-Gal Pn-3-Arab

As previously mentioned, the content of ACY varied greatly among different
cultivars. This was evident by the large %CV values obtained when all data entries were
compiled. The %CV was 59.8% (bases on 38 samples) for fiesh total ACY and 64.4%
(32 samples) for frozen total ACY. The content of individual ACY also varied greatly
among cultivars with a range of %CVs fiom 56.2-104.9% (both fiesh and fiozen samples
considered). The total ACY content of the four major peaks ranged fiom 9.64 to 126.05
mg/100g for fiesh samples and 13.1 1 to 94.48 mg/100g for frozen samples (Figure 15).
The mean content of the four major peaks was 43.49 and 35.17 mg/100g for fiesh and
fiozen samples, respectively. The cultivar labeled 'CM 100' expressed the highest
average ACY content for fiesh samples with 103.85 mg/100g; whereas, 'Early Black'
had the highest content for the fiozen samples with 79.12 mg/100g. Cultivar 'CM 95'
showed the lowest average ACY content for both fiesh and fiozen samples with 10.76
and 14.47 mg/100g, respectively. These values fell within the ranges reported in other
studies (Sapers & Hargrave, 1987; Sapers et al., 1986; Sapers et al., 1983a; Fuleki &
Francis, l968b).

FIGURE 15.
TOTAL ACY CONTENT IN FRESH & FROZEN WILD MAINE CRANBERRIES~
I W Fresh OFrozen *
Cranberry Cultivar
a Total content reflects the content of the four major ACY. 1998 harvest. * Significantly different, ~~0 .05 . ** Not enough data to conduct t-test for MC 17, CM 25/26, CM 95, CM 97, CM 11 111 12.
I would like to point out four of the cultivars in Figure 15: 'CM 24', 'CM 76',
'CM 94', and 'CM 100.' These cultivars showed large differences in their total ACY
content between the fresh and frozen states. Consequently, they were the first samples
extracted and followed the original dilution factors of 150 (samp1e:water) ('CM 76') and
1:25 ('CM 24'' 'CM 94', 'CM 100'). These proved to be too dilute and resulted in a very
weakly colored solution. The rest of the fresh samples and all of the frozen samples were
diluted 1:lO. The calculations for total ACY content accounted for the dilution factor,
but not the large difference between the fresh and frozen samples for these four cultivars.
It has been well documented that ACY do not follow the Beer-Lambert law where

absorbency increases linearly with concentration. But this does not explain why the more
dilute samples were higher in content then the less dilute samples. If anything, it should
be the reverse for a couple of reasons: 1) as pigment concentration increases the color . ..
may increase more than proportionally (Jackman et al.; 1987), and 2) in weakly acidic
solutions of water, ACY are unstable and will degrade under nucleophilic attack; thus,
decreasing their color intensity. This would be an interesting issue to look into fiuther. It
was also noteworthy to point out that if these four pairs of means were set aside, there
would be only one significant difference in mean total ACY content from fiesh to frozen
berries. The fi-ozen berries for 'Early Black' showed higher total ACY content than fresh
'Early Black' berries.
An increase in ACY content was expected from the fiesh to fiozen samples due to
an increase in extraction caused by cell wall rupture and continued ACY production in
the frozen state. This was not the case in this study, as evident fiom Figure 15. Possible
reasons may be that the storage time andlor temperature were not adequate for further
ACY development, or because of the presence and activity of degradative enzymes in
macerated berries, allowing enzyme and ACY to come in contact with each other.
There were slight increases in total ACY content for five of the sixteen frozen
cultivars, but they were not significant (p<0.05). The average content of individual ACY
followed a similar pattern as the average total content in Figure 15. Graphs for individual
ACY contents are shown in Figure 16. Significant differences existed (p<0.05). Pairs of
bars with asterisks (*) were significantly different as computed with the two-tailed t-test.
As with the average total content, the individual ACY content of the berries also varied
greatly between cultivars. Figure 17 represents the sorted data of individual ACY to

facilitate distinguishing significant differences (data for frozen berries not shown). Bars
with different letters were significantly different, determined by one-way ANOVA and
Tukey's Multiple Comparison Test ( ~ ~ 0 . 0 5 ) .

FIGURE 16.
INDIVIDUAL ACY CONTENTS IN FRESH & FROZEN WILD MAINE CRANBERRIES~
Cranberry Cultivar
Cranbeny Cultivar
a 1998 Harvest. * Significantly different, p<0.05. ** Not enough data to conduct t-test for CM17, CM25126, CM95, CM97, CM1111112.

FIGURE 16. CONTINUED
F r e s h Frozen -- --
I* i I
Cranberry Cultivar
Cranberry Cultivar
a 1998 Harvest. Significantly different, p<0.05.
** Not enough data to conduct t-test for CM17, CM25126, CM95, CM97, CM1111112.

FIGURE 17.
SIGNIFICANT DIFFERENCES IN INDIVIDUAL & TOTAL ACY CONTENTS IN FRESH WILD MAINE CRANBERRIES*
w Cranberry Cultivar
Cranberry Cultivar
* 1998 Harvest. Bars with different letters are significantly different, pC0.05.

FIGURE 17. CONTINUED
Cranberry Cultivar
Cranberry Cultivar
* 1998 Harvest. Bars with different letters are significantly different, pC0.05.

FIGURE 17. CONTINUED
Cranberry Cultivar
* 1998 Harvest. Bars with different letters are significantly different, ~ ~ 0 . 0 5 .
Unlike the findings of Sapers and Hargrave (1987) who reported that the relative
proportions of individual ACY for most clones varied within narrow limits, the
proportion of individual ACY in this study varied significantly among cultivars and
between fiesh and fiozen samples (Figure 18). In this study, Cy-3-Gal made up an
average of 29% (21-37%) and 25% (17-33%) for fiesh and fiozen samples, respectively;
Cy-3-Arab 20% (11-26%) and 18% (13-25%); Pn-3-Gal 41% (31-59%) and 40% (33-
51%); and Pn-3-Arab 10% (5-25%) and 17% (12-20%). On the other hand, Sapers et al.
(1983a) reported average percentages similar to results obtained in this study with 25%
for Cy-3-Gal; 15% cy-3-Arab; 40% Pn-3-Gal; and 16% Pn-3-Arab. Where other
researchers reported little variation in proportions of individual ACY and suggested that
the rate of pigment development was rather constant throughout the growth and

development of the berry, my data did not support this reasoning. In order to draw
conclusions, more data should be generated fiom subsequent growing seasons on the
same cultivars.
FIGURE 18.
AVERAGE % OF TOTAL ACY IN FRESH & FROZEN WILD MAINE CRANBERRIES*
Fresh Frozen
* 1998 Harvest.
Near the end of this project, cranberry samples from the next growing season
(1999) were sent to the Food Science Department and extracted for ACY content only.
Table 11 compares the ACY content between the two growing seasons. It is of interest to
evaluate successive growing seasons for variations in pigment content as well as other
berry characteristics. Comparing berries of different seasons may tell how hardy the
berry is or if it is greatly affected by environmental and/or growth conditions.

TABLE 11.
COMPARISON OF INDIVIDUAL & TOTAL ACY CONTENTS IN CRANBERRIES FROM TWO CONSECUTIVE SEASONS
a Based on 29 samples from 10 cultivars. Based on 20 samples fiom the same 10 cultivars analyzed in the 1998 harvest. Reported in mgA00g.
It is evident that ACY content was higher in the 1999 berries. There are several
possibilities for difference in ACY content fiom one season to the next, as already
explained. It may also have been due to the long holding period of the 1998 berries in
their extraction solvent while performing vitamin C and moisture content analyses. The
berries fiom the 1998 harvest were held for a couple of weeks in solvent in the
refrigerator before they were extracted; whereas, the 1999 berries were extracted directly
after maceration in the solvent. Despite the all organic and acidic solvent, the ACY in the
1998 harvested berries most likely underwent some degradation during that holding time.
Therefore, the 1999 berries were probably more accurate in measuring the ACY content
in these cultivars.
Seven of the twelve cultivars for the 1999 season averaged over 67mgI100g of
ACY; whereas, only two of the fourteen cultivars for the 1998 season averaged ACY
contents over 67mgI100g. (Recall that Mazza and Miniati (1993) reported that the
optimum ACY content in cranberries was 67mgI100g or higher.) Because of time
Total
46.26 72.65
YEAR
1998" 1 99gb
Cy-3-Gal
1 3.00~ 14.24
Cy3-Arab
8.78 11.50
Pn-3-Gal
18.78 33.64
Pn-3-Arab
5.69 13.26

restraints, the 1999 berries were not analyzed for their aglycone content, which is
discussed below for the 1998 berries.
Fortunately, standards were available for the aglycones (Cy and Pn); and thus, the
ACY were subjected to an acid hydrolysis treatment (outlined in the 'Methods and
Materials' section). Only eight of the frozen samples remained of the original samples to
be analyzed for their anthocyanidin content by HPLC. An HPLC chromatogram of the
aglycones is represented in Figure 19 along with the spectra of each component. The
analysis time was under five minutes, which offset the long extraction and acid
hydrolysis procedures. The absorbency maxima were previously listed in Table 10 (pp.
61), but from Figure 19 it is evident that the maxima are 275 nm and 525 nm for each
compound.
Table 12 lists the average retention times and %CV's for the HPLC analysis of
cranberry anthocyanidins. The coefficients of variance were small for this HPLC
method, but they varied more than those for the ACY HPLC method. Nonetheless, the
%CV values hovered around 8-10% for individual dates of analysis.

FIGURE 19.
HPLC CHROMATOGRAM & SPECTRA OF CRANBERRY ANTHOCYANIDINS
6 8 m i n
A HPLC Chromatogram. Peak assignment: 1 - Cyanidin, 2 - Peonidin. Cyanidin spectra. Peonidin spectra.

TABLE 12.
AVERAGE RETENTION TIMES (IN MINUTES) FOR CRANBERRY ANTHOCYANIDINS BY HPLC
Date Cyanidin Peonidin Stats
All Dates 111 111 # ofcases 3.186 4.829 Mean
15.0 15.2 % CV
713 1/99 26 26 # ofcases 2.900 4.38 Mean
8.7 5.6 % CV
1 1/6/99 6 6 # of cases 3.408 5.803 Mean
8.8 21.6 % CV
The total content for anthocyanidins ranged from 3.44 to 77.46 mgJ100g and
averaged 29.18 mgI100g (Figure 20). Individual mean values for Cy and Pn were 18.99
and 10.19 mgI1 OOg, respectively (Figure 20). On the average, Cy contributed 65%, while
Pn contributed 35%. It was interesting to note that the peonidin glycosides appeared to

contribute more to the total ACY content than did the cyaniding glycosides (Figure 18.
pp. 72) on the same berries. As previously mentioned, peonidin appeared very sensitive
to processing conditions, and possibly degraded under the intense boiling temperatures of
the acid hydrolysis; thus, explaining the differences in results between aglycone contents.
The acid hydrolysis and HPLC separation performed by Hong and Wrolstad
(1986) on single strength cranbeny juice pigments resulted in much smaller values for
aglycone content then reported in this study. (Keep in mind that the procedure I followed
used three sequential extractions to collect the cranbeny pigments.) They reported
average anthocyanidin contents of 12.3 and 8.9 mg/100g (as Cy-3-Glu) for Cy and Pn,
respectively. Average total content was 21.2 mg/100g. Their LC chromatogram, which
is represented in Figure 9 (pp. 33) showed wide, tailing peaks. The chromatographic data
in thls study was very good for quantitative evaluation because of the sharp peaks and
minimal tailing.

FIGURE 20.
TOTAL & INDIVIDUAL ANTHOCYANIDIN CONTENTS IN FROZEN WILD MAINE CRANBERRIES*
Cranberry Cultivar * 1998 Harvest.
The main goal of this research project was to develop a method to separate and
quantify ACY by capillary electrophoresis (CE). Because standards were not available, it
was not possible to identify the ACY peaks from the electropherogram since the order of
migration in CE may not be the same as the order of elution in HPLC. Therefore, a
method was developed to analyze the two aglycones present in cranberries. The
extraction procedure and CE conditions were outlined in the 'Methods & Materials'
section, but are presented here in Table 13.

TABLE 13.
CAPILLARY ELECTROPHORESIS CONDITIONS FOR CRANBERRY ANTHOCYANIDIN ANALYSIS
CAPILLARY
L=48.5 cm 1=40.0 cm id=75 rnrn
TEMPERATURE
25" C
WAVELENGTH
525 nm
BUFFER
150 mM H3PO4, 3 M Urea
50 mM Pcyclodextrin pH2.11
CONDITIONING
0.1 M HC1, 15min 0.1 M H3P04,15 min
Buffer, 15 min
INJECTION
Hydrodynamic 5 seconds 50 mbar
BTWN RUNS
0.1 M H3P04, 3 m Buffer, 5 min
ELECTRIC FIELD
SAMPLE SOLVENT
50% MeOH 50% HPLC Hz0 pH 1.0 w/HCI
Two of the methods previously described in the literature review under
'Anthocyanin Content: Capillary Electrophoresis' by da Costa et al. (1998) and Bicarrd et
al. (1999) were applied to the analysis of anthocyanidins for cranberries in this study, but
the compounds were not separated in some instances or detected in others. The method
outlined in Talbe 13 has not been applied to the analysis of anthocyanic compounds or
any other compounds to my knowledge. It was the product of several different methods
applied to an array of compounds: P-cyclodextrin (Chandra et al., 1993; Luong &
Nguyen, 1997; Esaka & Kano, 1997); and urea (Terabe, 1991). Organic solvents such as
methanol and acetonitrile added to the run buffer did not prove helpful in the resolution
of the aglycones.

The most important parameter regarding CE analysis of anthocyanins was the pH
of the run buffer. Initially a pH of less than 2.0 was strived for to ensure that the
compounds were kept in the flavyliurn cation form, but after 60 minutes no peaks were
detected. Once the present method was developed, it was necessary to measure the pH of
the run buffer each time it was made. Even slight changes in pH caused shifts in
migration time or affected resolution of the aglycones. Therefore, it was necessary to
also accurately weigh the amount of urea that was added to the buffer solution since it
caused the increase in pH. The initial pH of the 150 mM phosphoric acid was -1.5, but
with the addition of 3 M urea, the final pH was - 2.1. It was the addition of the urea that
caused the initial separation of the two aglycones once a level of 2 M was reached. When
more than 3 M of urea was added to the solution peak broadening occurred, which was
most likely due to structural transformations of the pigments at the higher pH values.
The P-cyclodextrin proved beneficial in sharpening the peaks as well as
preserving the compounds. Preservation of anthocyanic compounds by P-cyclodextrin
was investigated by Chandra et al. (1993). In this study, several concentrations of P-
cyclodextrin were experimented with to obtain the best peak shape without
compromising migration time. Because P-cyclodextrin added an element of
chromatography to CE in the form of size exclusion and hydrophobic interaction, the
more P-cyclodextrin that was added to the buffer the longer the run time became. There
appeared to be no additional increase in peak sharpness with concentrations of P-
cyclodextrin higher than 50 mM, but the migration time increased to -30 minutes.
In this application, the main problem with peak shape was that of peak tailing.
When looking at the on-line spectra, it was evident fiom continued detection at 275 nrn

that there were several structural forms of the aglycones passing through the detection
window. This wavelength is the maxima of the degraded products. Therefore, higher
concentrations of P-cyclodextrin did not resolve the problem of peak tailing. It is evident
from the electropherogram represented in Figure 2 1, that the peaks were sharp and rather
symmetrical. This was achieved by increasing the voltage of the system. Increasing the
voltage has been known to not only decrease migration time (by increasing the EOF), but
also increasing the current and sometimes resolution and sensitivity of the analytes
(Baker, 1995). It was beneficial to get the migration time as short as possible without
compromising resolution because anthocyanic compounds degrade quickly. Table 14
lists the average migration times for each compound, along with their respective %CV's.
Based on one day's values of successive runs, the small %CV values showed promise for
this CE method. Because the cyanidin aglycone appeared to experience more fluctuation
in migration time, and it was significantly larger in concentration than peonidin, it would
be of interest of investigate the effect of sample concentration on different CE
parameters. It has been reported that the sample plug length does affect resolution of
analytes and possibly other parameters of the analysis (Baker, 1995). This may be due to
the "stress" placed on the system when the voltage is applied.

FIGURE 21.
ELECTROPHEROGRAM OF CRANBERRY ANTHOCYANIDINS*
* Analysis performed on commercial cranberries. Peak assignment: 1 - Peonidin, 2 - Cyanidin.

TABLE 14.
AVERAGE MIGRATION TIMES (IN MINUTES) FOR CRANBERRY ANTHOCYANIDINS BY CE
There was a large amount of background noise, as evident from the noisy baseline
in the electropherogram. This decreased the sensitivity of the method and hindered the
detection of peonidin, which is sometimes present in cranberries in smaller
concentrations than cyanidin. Peonidin also appeared to be more labile than cyanidin to
processing conditions, which increased the need for speedy extraction and analysis times.
This was seen in the comparison of CE to HPLC. Two of the 23 samples showed no
peonidin detection by CE, but were detected by the HPLC method. Consequently, the
HPLC method had minimal baseline noise. The noisy baseline of the CE method may
also have resulted from a dirty capillary. The capillary used for this application had been
previously used for other applications for which alkaline run buffers were employed.
Normally, one capillary is used for one application, and run buffers of acidic nature are
kept separate from those of neutral or basic run buffers. Switching from low pH to high
pH with the same capillary is very stressful on the capillary and requires long
equilibration time as well as thorough clean up. Unfortunately, capillaries are costly, and
Date
11/19/99
it was not feasible to get another capillary.
Peonidin
26 14.736
2.9
Cyanidin
26 18.014
10.7
Stats
# of cases Mean % CV

Another point to mention involves the extraction procedure. The final step of the
acid hydrolysis of the ACY was to clean up the pigments on an activated C18 Sep-Pak@
and to elute them with 1% HC1 in MeOH. In this solvent, the pigments were injected
onto the HPLC system, but with the CE system, they were first dried down and
reconstituted in 50:50 water:MeOH (pH 1.0 with HCl). While being dried down and
stored in the fieezer overnight, the pigments experienced some breakdown, peonidin
more so than cyanidin. Therefore, for future analysis it may be necessary to elute the
pigments off of the C18 cartridge with the CE solvent to eliminate the drymg step. This
would be advantageous for a couple of reasons: it would cut down on extraction time and
decrease the risk of pigment breakdown.
It is also evident form Figure 21 that the order of detection was reversed in CE
compared to that of HPLC. Because peonidin is more hydrophobic due to the methoxy
group at position 3', it eluted second fiom the HPLC reversed-phase column. In CE
where compounds traveled under the influence of charge and electro-osmotic flow and
since capillary wall-analyte interactions were almost eliminated, peonidin was the first to
migrate through the capillary, followed by cyanidin.
Figure 22 shows the results obtained by injecting or introducing the same pigment
extracts into both the HPLC and CE systems. (The pigments originally injected into the
HPLC were in the 1% HCl in MeOH solvent, but because of the degradation of the
pigments upon drying for the CE system, they were reinjected in the HPLC system in the
5050 water:MeOH (pH 1.0 with HC1) solvent; the same pigment extract that was
analyzed by CE.) Therefore, the two methods of anthocyanidin analysis were able to be
compared quantitatively.

FIGURE 22.
COMPARISON OF ANTHOCYANIDIN CONTENTS BY HPLC & CEa
30 1-
Anthocyanidins 1s
Ow100g) ,o
1 2 3 4 5 6 7 8 9 1 0 1 1 1 2 A v e
Cranberry Variety 1999 Fresh commercial benies. Significantly different, pC0.05.
** Not enough data to conduct t-test.
For every cultivar, the total anthocyanidin content was higher for the HPLC
method than for the CE method, but significant differences existed for only three of the
twelve cases (25%), which are represented by asterisks (*) in Figure 22. Nonetheless, the
correlation coefficient was high at 0.967 and suggested that the two methods were indeed
comparable for the quantitation of cranberry anthocyanidins. Further studies should
include analyses on a variety of fruits that have more complex anthocyanidin profiles
than the two aglycones presented here to determine the true applications of this method.
Will other aglycones be able to be resolved by this method? I would have liked to
conduct these trials if time had allowed.

ORGANIC ACID CONTENT
Three of the five major organic acids in cranberries (L-ascorbic acid is discussed
in the next section) (16 fresh; 13 frozen) were analyzed by HPLC. Benzoic acid was not
detected by this method and was believed to have adsorbed on to the column wall. A
typical chromatogram is illustrated in Figure 23. The extraction procedure followed that
outlined by Riaz and Bushway (1994); whereas, the HPLC conditions originated from
studies conducted by Keystone Scientific, Inc. on their BetaBasicO 18 column (Keystone
Scientific, Inc., 1998).
The mean analysis time differed between the fresh and frozen runs by nearly five
minutes. From Table 15, it can be seen that average retention times for quinic and malic
acids differed within one minute, but citric acid differed within five minutes. Possible
reasons might be slight differences in mobile phase composition from batch to batch,
changes in temperature of the room and thus the HPLC instrument, which would affect
analyte-column interactions, or changes in column wall integrity. It was interesting to
note, though, that the %CV values for the individual retention times for both fresh and
frozen trials were very small. This suggested that the method was reproducible and that
each compound eluted off of the column at nearly the same time for each run.

FIGURE 23.
HPLC CHROMATOGRAM OF THE MAJOR ORGANIC ACIDS IN CRANBERRIES*
* Chromatogram of fresh cranberries from 1998 harvest. Peak assignment: 1 - Quinic acid, 2 - Malic acid, 3 - Citric acid.

TABLE 15.
AVERAGE RETENTION TIMES FOR CRANBERRY ORGANIC ACIDS BY HPLC
ORGANIC RETENTION ACID TIME (min) % CV
Quinic Acid 4.65a, 5.16~ 4Sa, 3.1b Malic Acid 5.80,6.72 4.9,2.8 Citric Acid 10.80, 14.62 6.9,2.1
' Average retention time and % CV of fresh cranberries. Average retention time and % CV of frozen cranberries.
The chromatographic results in this study were similar to those by Coppola et al.
(1978) on cranberry juice, with acids eluting from the column in the same order and at
approximately the same retention times. Research by Hong and Wrolstad (1986) also
analyzed cranbeny acids and detected four compounds: quinic, malic, citric, and
shikimic. Shikimic acid is a compound metabolically related to quinic acid. Shikimic
acid was not detected in this study.
The content of organic acids ranged from 1467-3040 mg/100g and 1605-2469
mg/100g for fresh and frozen samples, respectively. The mean acid content was 2041
mg/100g for fresh samples and 2035 mg/100g for frozen samples. Significant differences
0><0.05) existed among cultivars and between fresh and frozen samples for their acid
content (Figure 24 & 25). Cultivar 'CM 97' expressed the highest acid content in fresh
berries; whereas, 'CM 17' was highest in frozen samples. 'CM 25/26' and 'Ben Lear'
were lowest in acid content for fresh and frozen samples, respectively. Analysis by
ANOVA showed no relationship existed between the acid content and pigment
concentration (data not shown).

FIGURE 24.
SIGNIFICANT DIFFERENCES IN TOTAL ORGANIC ACIDS IN FRESH & FROZEN WILD MAINE CRANBERRIES*
2700
2400
2100
1 so0
Fresh 1500 Organic Acids 1200
600
300
0
I ab ab bcd bcd bcd cd I
Cranberry Cultivar
a a a a a a a
2000 Frozen Organic Acids 1500
(md1 oQi9 loo0
* 1998 Harvest. Bars with different letters are significantly different, pc0.05.
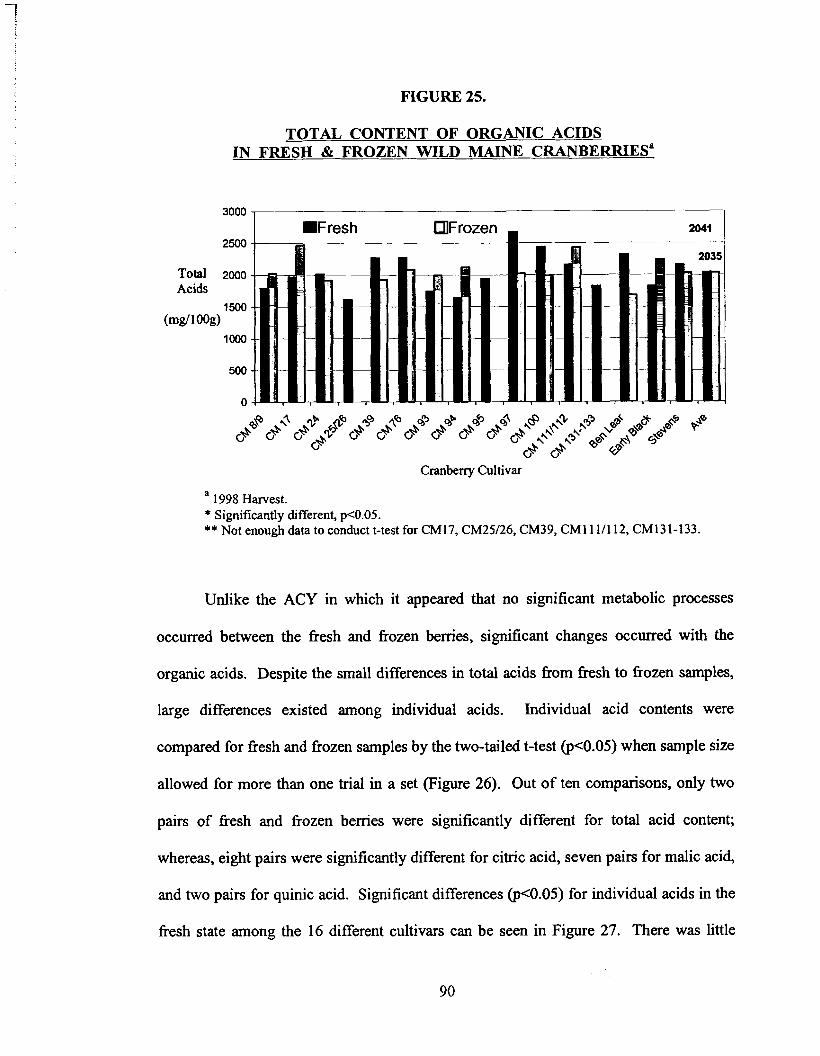
FIGURE 25.
TOTAL CONTENT OF ORGANIC ACIDS IN FRESH & FROZEN WILD MAINE CR4NBERRIESP
I Fresh Frozen , 2500
Total 2000 Acids
1500 (mg/ 1
1000
500
0
Cranberry Cultivar
a 1998 Harvest. * Significantly different, p<0.05. ** Not enough data to conduct t-test for CM17, CM25126, CM39, CM1111112, CM131-133.
Unlike the ACY in which it appeared that no significant metabolic processes
occurred between the fresh and fiozen bemes, significant changes occurred with the
organic acids. Despite the small differences in total acids fiom fiesh to fiozen samples,
large differences existed among individual acids. Individual acid contents were
compared for fiesh and fiozen samples by the two-tailed t-test (pc0.05) when sample size
allowed for more than one trial in a set (Figure 26). Out of ten comparisons, only two
pairs of fiesh and fiozen bemes were significantly different for total acid content;
whereas, eight pairs were significantly different for citric acid, seven pairs for rnalic acid,
and two pairs for quinic acid. Significant differences Q60.05) for individual acids in the
fiesh state among the 16 different cultivars can be seen in Figure 27. There was little

variation between different cultivars for the frozen samples - citric acid showed no
significant differences; malic acid was sigruficantly lower in the "Ben Lear" cultivar; and
few differences existed for quinic acid. This may have been due to the small number of
sample replicates for each cultivar as sample size diminished with each analysis
performed. Fresh samples, on the other hand, showed a greater number of significant
differences. "CM 100" was much higher in citric acid content than the other cultivars;
whereas "CM 25/26" and "CM 94" were significantly lower in citric acid content. Malic
acid appeared to vary less in the fiesh berries, but was split into two groups of high and
low content. For malic acid, "CM 97" was higher in content than 11 of the other fiesh
samples. Quinic acid showed only four significant differences among all comparisons of
means in fiesh berries.
FIGURE 26.
COMPARISON OF INDIVIDUAL ORGANIC ACIDS IN FRESH & FROZEN WILD MAINE CRANBERRIES~
loo0
Citric 800
Acid 600
(mdlooe) 4,
200
0
Cranberry Cultivar
a 1998 Harvest. * Significantly different, p<0.05. ** Not enough data to conduct t-test for CM17, CM25126, CM39, CM95, CM1111112, CM131-133.

FIGURE 26. CONTINUED
2000
1800
1600
1400
Malic 1200 Acid
1000 (mg1100g)
800
600
400
200
0
Cranbeny Cultivar
Quinic Acid
, - .Fresh- fl Frozen
Cranbeny Cultivar
' 1998 Harvest. * Significantly different, p<0.05. ** Not enough data to conduct t-test for CM17, CM25126, CM39, CM1111112, CM131-133.

FIGURE 27.
SIGNIFICANT DIFFERENCES IN INDIVIDUAL ORGANIC ACIDS IN FRESH WILD MAINE CRANBERRIES*
Cranberry Cultivar
* 1998 Harvest. Bars with.different letters are significantly different, ~ ~ 0 . 0 5 .

FIGURE 27. CONINTUED
Quinic Acid
(mgl1 OOg)
* 1998 Harvest. Bars with different letters are significantly different, p4.05.
In the fresh cranberry, malic was the dominant acid comprising 64% (1317
mg/100g) of the total, followed by citric at 25% (501 mg/100g) and quinic at 11% (223
mg/100g) (Figure 28). In the frozen cranberry, the proportion of acids changed to reflect
a decrease in malic acid, which was offset by increases in citric and quinic acids. The
composition of the frozen berry was 42% (854 mg/100g) citric, 41% (832 mg/100g)
malic, and 17% (350 mg/100g) quinic. On the large scale, the mean total acid content of
the fresh and frozen berries varied slightly; but on the small scale, individual acid
composition underwent significant changes. Reasons for these changes between fresh
and frozen berries were most likely metabolic in nature. I did not find documentation or
further explanation of this observation in cranberries or other h i t s . It may be that earlier
studies conducted analysis on frozen whole cranberries rather than macerated berries.

FIGURE 28.
AVERAGE % OF TOTAL ORGANIC ACIDS IN FRESH & FROZEN WILD MAINE CRANBERRIES*
Fresh
* 1998 Harvest.
Frozen
The results obtained in this study differed from those of Hong and Wrolstad
(1986) on single strength cranberry juice. They determined the proportion of total acids
to be 32.3% (860 mg/100g) citric, 27.2% (720 mg/100g) malic, and 39.2% (1050
mg/100g) quinic. Table 16 compares results from this study and that of Hong and
Wrolstad (1986). Quinic acid was the dominant acid in their study and more than
doubled the mean percentage of total acids reported in this study. It is important to take
into account the methods of analysis followed by each researcher in order to help explain
any differences in results that may arise.

TABLE 16.
COMPARISON OF CRANBERRY ORGANIC ACIDS FROM TWO STUDIES
STUDY
Watson, 1999 Fresh Frozen
Hong & Wrolstad 1986
' mg/1 OOg. % of total acids.
ORGANIC ACID
Citric Malic Ouinic
Even though differences in results existed between the two studies, earlier work
by Morse (1930) concluded that total acid content varied little among regions and
cultivars of cranberries. To explain these contradictions in results, differences in
extraction procedures between the studies should be looked at, as well as the type of
cranberry. Cranberries used in this study were young and wild; whereas, the cranberries
used by Hong and Wrolstad (1986) were frozen commercial berries from Ocean Spray
Cranberries, Inc.
L-ASCORBIC ACID CONTENT
L-ascorbic acid (L-AA), better known as vitamin C, is abundantly found in h i t s .
Table 1 (pp. 4) listed the typical vitamin C content of cranberries to be in the range of
7.5-10.5 mg/100g. But just as environmental factors and growing conditions affect the

quality and composition of plant foods, such as pigments and organic acids, so too do
they affect vitamin C content.
The results obtained in this study by titration gave a range of 32.9 to 72.3
mg/100g for fresh bemes and 6.8 to 22.2 mg/100g for frozen bemes. The mean L-AA
content was 47.6 and 13.2 mg/100g for fresh and frozen bemes, respectively. The huge
difference in L-AA content from fresh to frozen samples was expected since vitamin C is
labile to light, extremes in temperature, oxygen, other food constituents, changes in pH,
and metals. The large value for the fresh bemes was uncharacteristic, but not unheard of
since there are many factors affecting the metabolism of plants, especially the unique
growing conditions of cranberries, which has previously been described in 'Cranberry
Growth and Harvesting.' There may also have been other substances in the L-AA
solution that reacted with the 2,6-dichlorophenolindophenol titrant, which would result in
larger than actual values for vitamin C content.
Figure 29 shows the sorted order of L-AA content in fresh and frozen samples.
Bars with different letters were significantly different for L-AA content, pC0.05. Despite
the lack of data to perform the two-tailed t-test for all pairs of fresh and frozen bemes, it
was assumed that all pairs were significantly different (Figure 30). Data that was
available for seven of the cultivars showed uncontested significant differences ( ~ ~ 0 . 0 5 )
between fresh and frozen samples. It was interesting to note that the average loss of L-
AA in frozen samples was 72.2%.
Except for "CM 11 111 12," "CM 76" was significantly higher in L-AA content for
fresh berries. At the other end of the scale, "CM 100" was significantly lower than 73%
of the other cultivars. In the frozen bemes, L-AA content varied little.

FIGURE 29.
SIGNIFICANT DIFFERENCES IN L-ASCORBIC ACID CONTENT IN FRESH & FROZEN WILD MAINE CRANBERRIES*
Cranbeny Cultivar
- bc bc c
Frozen
- a ab abc abc abc abc abc abc 1 3 2
- - -
- - - - - - -
I I I -
Cranbeny Cultivar
* 1998 Harvest. Bars with different letters are significantly different, p<O.OS.

FIGURE 30.
L-ASCORBIC ACID CONTENT IN FRESH & FROZEN WILD MAINE CRANBERRIES*
Cranberry Cultivar
1998 Harvest.
MOISTURE CONTENT
Determination of moisture content in cranberries was a very sinlple procedure, yet
one of importance. It allowed for accurate and consistent calculations of other
components, such as the ones researched for this study. Moisture content may vary fiom
one cultivar to another, as well as one berry to another; therefore, it was more reliable to
report values on a dry weight basis. The moisture content for the berries in this study
averaged 87% for both fresh and fiozen states. Significant differences existed for fiesh
berries, but the overall variation was less than 1% (0.7% CV). The frozen berries
showed no significant differences even though the %CV was larger, 2.2%.

CONCLUSIONS
It has been shown through the research conducted and reported in this paper that
wild Maine cranberries are comparable to other cranberries reported in the literature in
their anthocyanin, organic acid, and moisture contents. Despite the immaturity of these
cranberries ( 4 years), they showed great potential for breeding with established
cultivated berries. The fresh berries expressed a high average anthocyanin content of
46.26 and 72.65 mg/100g in the harvests from 1998 and 1999, respectively. The average
anthocyanin content for the 1999 harvest season was already above the level Mazza and
Miniati (1993) described as optimal for cranberry quality (>67 mg/lOOg).
A method for separating and quantitating cranberry pigments (aglycones) by
capillary electrophoresis was developed. The method employed an acidic run buffer,
which was advantageous in the analysis of anthocyanic compounds because it exploited
the flavylium cation. The method proved to be comparable to its HPLC counterpart with
a 0.967 correlation coefficient. The method would be more suitable and efficient in
quantitating the anthocyanidins if a reduction in baseline noise could be achieved.
The major organic acids in cranberries, citric, malic, and quinic, were analyzed by
HPLC. The average total content for fiesh and frozen berries fiom the 1998 harvest were
2041 and 2035 mg/100g, respectively. The average total organic acid content did not
change from fiesh to frozen samples, but the individual acid content did change. Citric
acid contributed 25% of the total in the fiesh berries and 42% in the fiozen berries. Malic
acid made up 64% and 41%; and quinic acid made up 11% and 17% in the fresh and
fiozen berries, respectively. No explanation was found in the literature for this change in

individual acid composition between the fresh and frozen samples. It was most likely
due to metabolic processes since the berries were macerated before frozen storage.
Further research should be conducted.
Because the presence and abundance of organic acids are responsible for
cranberries characteristically low pH, which aid in the stabilization and protection of
anthocyanins, a relationship between the two groups was looked into. A very low
correlation coefficient showed there was little or no effect of the presence of one group
on the other.
Vitamin C, or L-ascorbic acid, content of cranberries was also analyzed. The . . .
method used was a titration method. Results were very high for the 1998 harvested
berries with the fresh berry samples averaging 47.6 mg/100g. There was a significant
loss in vitamin C content in the frozen berries, which averaged 13.2 mg/100g. This loss
was expected since vitamin C is a very labile compound.
The research conducted and reported in this paper offers information about the
hardiness and quality of cranberries grown in the wild in Maine. Continuing research
should be conducted on the maturing crops to determine if the berries express certain
traits that may enhance the quality of commercial cranberries.

BIBLIOGRAPHY
Andersen, 0.M. (1989) Anthocyanins in h i t s of Vaccinium oxycoccus L. (Small cranbeny). J Food Sci. 54(2), 383-384.
Andersen, 0.M. (1985) Chromatographic separation of anthocyanins in cowbeny (Lingonbeny) Vaccinium vites-idaea L. J Food Sci. 50, 1230- 1232.
Baj, A., Bombardelli, E., Gabetta, B., and Martinelli, E.M. (1983) Qualitative and quantitative evaluation of Vaccinium myrtillus anthocyanins by high-resolution gas chromatography and high-perfomlance liquid chromatography. J Chromatogr. 279, 365-372.
Baker, D.R. (1995) Instrumental Considerations. In Capillary Electrophoresis. Wiley- Interscience Publication, New York. Chapter 4, pp. 95- 1 12.
Bakker, J., Bridle, P., and Koopman, A. (1992) Strawberry juice colour: The effect of some processing variables on the stability of anthocyanins. J Sci Food Agric. 60, 47 1-476.
Baldi, A., Romani, A., Mulinacci, N., Vincieri, F., and Casetta, B. (1995) HPLC/MS application to anthocyanins of Vitis vinifera L. J Agric Food Chem. 43,2104-2109.
Ballington, J.R., Kirkrnan, W.B., Ballinger, W.E., and Maness, E.P. (1988) Anthocyanin, aglycone, and aglycone-sugar content in the h i t s of temperate North American species of four sections in Vaccinium. JAmer Soc Hort Sci. 113(5), 746- 749.
Ballington, J.R., Ballinger, W.E., and Maness, E.P. (1987) Interspecific differences in the percentage of anthocyanins, aglycones, and aglycon-sugars in the h i t of seven species of blueberries. JAmer Soc Hort Sci. 112(5), 859-864.
Baranac, J.M., PetranoviC, N.A., and DirnitriC-MarkoviC, J.M. (1 996) Spectrophotometric study of anthocyan copigmentation reactions. J Agric Food Chem. 44,1333-1336.
BartolomC, A.P., RupCrez, P., and FGster, C. (1996) Non-volatile organic acids, pH and titratable acidity changes in pineapple fruit slices during frozen storage. J Sci Food Agric. 70,475-480.
Baublis, A., Spomer, A., and Berber-JimCnez. (1994) Anthocyanin pigments: Comparison of extract stability. J Food Sci. 59(6), 121 9-122 1.

Bicard, V., Fougerousse, A., and Brouillard, R. (1999) Analysis of natural anthocyanins by capillary zone electrophoresis in acidic media. J Liq Chromatogr & Re1 Technol. 22(4), 541-550.
Blanco, D., Quintanilla, M.E., Mangas, J.J., and Gutierrez, M.D. (1996) Determination of organic acids in apple juice by capillary liquid chromatography. J Liq Chromatogr & Rel Technol. lg(l6), 26 15-262 1.
Boyce, M.C. and Bennett, I.J. (1996). Complimentary role of micellar electrokinetic capillary chromatography and high performance liquid chromatography in the separation of plant phenolics. Anal Letters. 29(l O), 1805- 18 15.
Boyles, M.J. and Wrolstad, R.E. (1993) Anthocyanin composition of red raspberry juice: Influences of cultivar, processing, and environmental factors. J Food Sci. 58(5), 1135-1 141.
Bridle, P. and Garcia-Viguera, C. (1997) Analysis of anthocyanins in strawberries and elderberries. A comparison of capillary zone electrophoresis and HPLC. Food Chem. 59(2), 299-304.
Bridle, P., Garcia-Viguera, C., and Tomh-Barberh, F.A. (1996) Analysis of anthocyanins by capillary zone electrophoresis. J Liq Chromatogr & Rel Technol. 19(4), 537-545.
Britton, G. (1983) 0-Heterocyclic Pigments - In The Biochemistry of Natural Pigments. Cambridge University Press; Cambridge, New York. Chapter 4, pp. 102-1 29.
Bushway, R.J., Bureau, J.L., and McGann, D.F. (1984) Determinations of organic acids in potatoes by high performance liquid chromatography. J Food Sci. 49(1), 75-77 & 81.
CCCGA. (Cape Cod Cranberry Growers Association). [Online] Available <www.cranberries.or-> June 20,1999.
Chandra, A., Nair, M.G., and Iezzoni, A.F. (1993) Isolation and stabilization of anthoycanins from tart cherries (Prunus cerasus L.). JAgric Food Chem. 41, 1062- 1065.
Chen, L.-J. and Hrazdina, G. (1982) Structural transformation reactions of anthocyanins. Experientia. 38, 1030-1032.
Coppola, E.D. (1984) Use of HPLC to monitor juice authenticity. Food Technol. 38, 88-9 1.

Coppola, E.D., Conrad, E.C., and Cotter, R. (1978) Fruits and Fruit Products: High pressure liquid chromatographic detem~ination of major organic acids in cranberry juice. J AOAC. 61(6), 1490-1492.
da Costa, C.T., Nelson, B.C., Margolis, S.A., and Horton, D. (1998) Separation of blackcurrant anthocyanins by capillary zone electrophoresis. J Chromatogr A. 799, 321-327.
Dao, L.T., Takeoka, G.R., Edwards, R.H., and De J. Berrios, J. (1 998) Improved method for the stabilization of anthocyanidins. JAgric Food Chem. 46,3565-3569.
Delgado, C., Tomh-Barberh, F.A., Talou, T., and Gaset, A. (1994) Capillary electrophoresis as an alternative to HPLC for determination of honey flavonoids. Chromatographia. 38(1/2), 71-78.
Esaka, Y. and Kano, K. (1997) Hydrophilic selectors for selectivity enhancement in capillary electrophoresis. J Chromatogr A. 792,445-454.
Femindez de Simon, B., Estrella, I., and Hemindez, T. (1995) Flavonoid separation by capillary electrophoresis. Effect of temperature and pH. Chromatographia. 41(7/8), 389-392.
Ferreres, F., Blhzquez, M.A., Gil, M.I., and Tomh-Barberh, F.A. (1994) Separation of honey flavonoids by micellar electrokinetic capillary chromatography. J Chromatogr A. 669,268-274.
Frqtlog, C., Slimestad, R., and Andersen, O.M. (1998) Combination of chromatographic techniques for the preparative isolation of anthocyanins - applied on blackcurrant (Ribes nigrum) h i t s . J Chromatogr A. 825,89-95.
Francis, F.J. (1989) Food Colorants: Anthocyanins. Crit Rev Food Sci Nutr. 28(4), 273-3 14.
Frankel, E.N., Kanner, J., German, J.B., Parks, E., and Kinsella, J.E. (1993) Inhibition of oxidation of human low-density lipoprotein by phenolic substances in red wine. Lancet. 341,454-457.
Fuhrrnan, B., Lavy, A., and Avirarn, M. (1995) Consumption of red wine with meals reduces the susceptibility of human plasma and low-density lipoprotein to lipid peroxidation. Amer J Clin Nutr. 61,549-554.
Fuleki, T. and Francis, F.J. (1968a) Quantitative methods for anthocyanins. 1. Extraction and determination of total anthocyanin in cranberries. J Food Sci. 33, 72- 77.

Fuleki, T. and Francis, F.J. (1968b) Quantitative methods for anthocyanins. 2. Determination of total anthocyanin and degradation index for cranberry juice. J Food Sci. 33, 78-83.
Gao, L. and Mazza, G. (1995) Characterization of acetylated anthocyanins in lowbush blueberries. JLiq Chromatogr. 18(2), 245-259.
Gao, L. and Mazza, G. (1994) Quantitation and distribution of simple and acylated anthocyanins and other phenolics in blueberries. JFood Sci. 59(5), 1057-1 059.
Gao, L. and Mazza, G. (1994) Rapid method for complete chemical characterization of simple and acylated anthocyanins by high-performance liquid chromatography and capillary gas-liquid chromatography. J Agric Food Chem. 42, 1 18- 125.
Garcia-Viguera, C., Zafrilla, P., and Tomhs-Barberh, F.A. (1997) Determination of authenticity of fruit jams by HPLC analysis of anthocyanins. J Sci Food Agric. 73, 207-2 13.
Gil, M.I., Ferreres, F., and Tom&-Barberh, F.A. (1995) Micellar electrokinetic capillary chromatography of methylated flavone aglycones. J Liq Chromatogr. l8(l5), 3007-301 9.
Goiffon, J.-P., Brun, M., and Bourrier, M.-J. (1991) High-performance liquid chromatography of red fruit anthocyanins. J Chromatogr. 537, 10 1 - 12 1.
Hale, M.L., Francis, F.J., and Fagerson, I.S. (1986) Detection of enocyanin in cranberry juice cocktail by HPLC anthocyanin profile. J Food Sci. 5l(6), 15 1 1 - 15 13.
Harbome, J.B. (1988) The Flavonoids: Recent Advances. In Plant Pigments. ed. T.W. Goodwin. Academic Press Ltd., London; New York. Chapter 7, pp. 308-337.
Hertog, M.G.L., Feskens, E.J.M., Hollman, P.C.H., Katan, M.B., and Kromhout, D. (1993) Dietary antioxidant flavonoids and risk of coronary heart disease: The Zutphen Elderly Study. Lancet. 342, 1007- 1 0 1 1.
Hong, V. and Wrolstad, R.E. (1990) Use of HPLC separationlphotodiode array detection for characterization of anthocyanins. J Agric Food Chem. 38,708-7 15.
Hong, V. and Wrolstad, R.E. (1986) Fruit and h i t products. J Assoc OflAnal Chem. 69(2), 199-207.
Hoshino, T. (1992) Self-association of flavylium cations of anthocyanidin 3,5- diglucosides studied by circular dichroism and 'H NMR. Phytochem. 31(2), 647- 653.

Hunter, J.J., Visser, J.H., and De Villiers, O.T. (1991). Preparation of grapes and extraction of sugars and organic acids for determination by high performance liquid chromatography. Am JEnol Vitic. 42(3), 237-244.
Inami, O., Tamura, I., Kikuzaki, H., and Nakatani, N. (1996) Stability of anthocyanins of Sambucus canadensis and Sambucus nigra. JAgric Food Chem. 44,3090-3096.
Jackman, R.L., Yada, R.Y., Tung, M.A., and Speers, R.A. (1987) Anthocyanins as food colorants - A review. JFood Biochem. 11,201-247.
Keystone Scientific, Inc. (1998) Organic Acid Analysis. Baseline Chromatography Newsletter. 11(2), 1-2.
Kovics, E. and Djedjro, G.A. (1994) Changes in organic acids of fruits after different treatments. Acta Hort. 368,25 1-260.
Kraemer-Schafhalther, A., Fuchs, H., and Pfannhauser, W. (1998) Solid-phase extraction (SPE) - a comparison of 16 materials for the purification of anthocyanins from Aronia melanocarpa var Nero. JSci Food Agric. 78,435-440.
Lbpez, E.F. and Gomez, E.F. (1996) Simultaneous determination of the major organic acids, sugars, glycerol, and ethanol by HPLC in grape musts and white wines. J Chromatographic Sci. 34,254-257.
Loung, J.H.T. and Nguyen, A.L. (1997) Achiral selectivity in cyclodextrin-modified capillary electrophoresis. J Chromatogr A. 792,43 1-444.
Lucy, C.A. and Underhill, R.S. (1996) Characterization of the cationic surfactant induced reversal of electroosmotic flow in capillary electrophoresis. Anal Chem. 68(2), 300-305.
Malic Attributes [Onlin] Available <http://www.bartek.on.caAmalic\descript\attribut.htm> September 9, 1999.
Mazza, G. and Miniati, E. (1993) Small Fruits. In Anthocyanins in Fruits, Vegetables, and Grains. CRC Press Inc.; Boca Raton, FL. Chapter 4, pp. 92-97.
Mazza, G. and Brouillard, R. (1987) Color stability and structural transformations of Cyanidin 3,5-Diglucoside and four 3-Deoxyanthocyanins in aqueous solutions. J Agric Food Chem. 35,422-426.
Morin, Ph., Archambault, J.C., Andrk, P., Drew, M., and Gaydou, E. (1997) Separation of hydroxylated and methoxylated flavonoids by micellar electokinetic capillary chromatography. Determination of analyte partition coeficients between aqueous and sodium dodecyl sulfate micellar phases. J Chromatogr A. 791,289-297.

Morin, P. and Dreux, M. (1993) Factors influencing the separation of ionic and non-ionic chemical natural compounds in plant extracts by capillary electrophoresis. J Liq Chromatogr. l6(l7), 3735-3755.
Morse, F.W. (1930) A chemical study of cranbemes. ed. F.W. Morse. Massachusetts Agricultural Experiment Station. Amherst. pp. 89- 102.
Ng, C.L., Ong, C.P., Lee, H.K., and Li, S.F.Y. (1992) Systematic optimization of micellar electrokinetic chromatographic separation of flavonoids. Chromatographia.. 34(3/4), 166-1 72.
Nisperos-Carriedo, M.O., Buslig, B.S., and Shaw, P.E. (1992) Simultaneous detection of dehydroascorbic, ascorbic, and some organic acids in fruits and vegetables by HPLC. JAgric Food Chem. 40,1127-1 130.
Ocean Spray Cranbemes. [Online] Available ~www.oceanspray.com/> June 20, 1999.
Phippen, W.B. and Simon, J.E. (1998) Anthocyanins in basil (Ocimum basilicum L.) J Agric Food Chem. 46,1734- 1738.
Revilla, E., Ryan, J-M., and Martin-Ortega, G. (1998) Comparison of several procedures used for the extraction of anthocyanins from red grapes. J Agric Food Chem. 46,4592-4597.
Rim, M.N. and Bushway, A:A. (1994) Determinations of organic acids in raspberry cultivars grown in Maine. Fruit Varieties J. 48(4), 206-21 1.
Romero Rodriguez, M.A., Vazquez Oderiz, M.L., Lopez Hernandez, J., and Simal Lozano, J. (1992) Determination of vitamin C and organic acids in various fruits by HPLC. J Chromatographic Sci. 30,433-437.
Sapers, G.M. and Hargrave, D.L. (1987) Proportions of individual anthocyanins in h i t s of cranberry cultivars. J Amer Soc Hort Sci. 112(1), 100-1 04.
Sapers, G.M., Graff, G.R., Phillips, J.G., and Deubert, K.H. (1986) Factors affecting the anthocyanin content of cranberry. JAmer Soc Hort Sci. 11 1(4), 612-617.
Sapers, G.M., Phillips, J.G., Rudolf, H.M., and DiVito, A.M. (1983a) Cranberry quality: Selection procedures for breeding programs. J Amer Soc Hort Sci. 1 O8(2), 24 1-246.
Sapers, G.M., Jones, S.B., and Maher, G.T. (1983b) Factors affecting the recovery of juice and anthocyanin from cranbemes. JAmer Soc Hort Sci. 108(2), 246-249.
Sarma, A.D., Sreelakshmi, Y., and Sharma, R. (1997) Antioxidant ability of anthocyanins against ascorbic acid oxidation. Phytochem. 45(4), 671 -674.

Sannini, K. and Kenndler, E. (1997) Influence of organic solvents on the separation selectivity in capillary electrophorsis. J Chromatogr A. 792,3-11.
SatuC-Garcia, M.T., Heinonen, M., and Frankel, E.N. (1997) Anthocyanins as antioxidants on human low-density lipoprotein and lecithin-liposome systems. J Agric Food Chem. 45,3362-3367.
Seitz, U., Oefher, P.J., Nathakarnkitkool, S., Popp, M., and Bonn, G.K. (1992) Capillary electrophoretic analysis of flavonoids. Electrophoresis. 13, 35-38.
Strack, D. and Wray, V. (1994) The Anthocyanins. In The Flavonoids: Advances in Research Since 1986. ed. J.B. Harbome. Chapman and Hall, London; New York. Chapter 1, pp. 1-22.
Strack, D. and Wray, V. (1989) Anthocyanins. In Methods in Plant Biochemistry. Volume I . ed. J.B. Harborne. Academic Press, London; New York. Chapter 9, pp. 325-356.
Takeda, K., Kariuda, M., and Itoi, H. (1985) Blueing of sepal colour of Hydrangea macrophylla. Phytochem. 24(1 O), 225 1-2254.
Tamura, H. and Yamagami, A. (1994) Antioxidative activity of monoacylated anthocyanins isolated from Muscat Bailey A grape. J Agric Food Chem. 42(8), 1612-1615.
Teissedre, P.L., Frankel, E.N., Waterhouse, A.L., Peleg, H., and German, J.B. (1996) Inhibition of in vitro human LDL oxidation by phenolic antioxidants from grapes and wines. J Sci Food Agric. 70, 55-6 1.
Terabe, S., Ishihama, Y., Nishi, H., Fukuyama, T., and Otsuka, K. (1991) Effect of urea addition in micellar electrokinetic chromatography. J Chromatogr A. 545,359-368.
Toldam-Andersen, T.B. and Hansen, P. (1997) Growth and development in black currant (Ribes nigrum). 111. Seasonal changes in sugars, organic acids, chlorophyll and anthocyanins and their possible metabolic background. J Hort Sci. 72(1), 155- 169.
Vazquez Oderiz, M.L., Vazques Blanco, M.E., Lopez Hernandez, J., Simal Lozano, J., and Romero Rodriguez, M.A. (1993) Simultaneous determination of organic acids and vitamin C in green beans by Liquid Chromatography. J AOAC Internatl. 77(4), 1056-1059.
Wang, H., Cao, G., and Prior, R.L. (1997) Oxygen radical absorbing capacity of anthocyanins. J Agric Food Chem. 45,304-309.

Withy, L.M., Nguyen, T.T., Wrolstad, R.E., and Heatherbell, D.A. (1993) Storage changes in anthocyanin content of red raspberry concentrate. J Food Sci. 58(1), 190- 192.

BIOGRAPHY OF THE AUTHOR
Dolly J. Watson was born in Presque Isle, Maine on July 26, 1975. There she
attended and graduated from Presque Isle High School. She continued her education at
the University of Maine where, in May of 1997, she received a Bachelor of Science
degree in Human Nutrition. In the fall of 1997, she was accepted into the masters
program in Food Science and Human Nutrition at The University of Maine.
During her education at the University of Maine, Dolly was an active member of
Kappa Omicron Nu and Phi Kappa Phi honor societies. She was also involved in the
Food Science Club and attended professional meetings: Institute of Food Technologists
annual meeting in July, 1999 and CESONE in Fall, 1998. She is expected to publish.two
separate papers on the work she completed while she was a research assistant with the
Food Science Department. Dolly is a candidate for the Master of Science degree in Food
Science and Human Nutrition from The University of Maine in August, 2001.