chemical composition measurements of the low activity
TRANSCRIPT

Contract No:
This document was prepared in conjunction with work accomplished under Contract No. DE-AC09-08SR22470 with the U.S. Department of Energy (DOE) Office of Environmental Management (EM).
Disclaimer:
This work was prepared under an agreement with and funded by the U.S. Government. Neither the U. S. Government or its employees, nor any of its contractors, subcontractors or their employees, makes any express or implied:
1 ) warranty or assumes any legal liability for the accuracy, completeness, or for the use or results of such use of any information, product, or process disclosed; or
2 ) representation that such use or results of such use would not infringe privately owned rights; or
3) endorsement or recommendation of any specifically identified commercial product, process, or service.
Any views and opinions of authors expressed in this work do not necessarily state or reflect those of the United States Government, or its contractors, or subcontractors.

Chemical Composition Measurements of
the Low Activity Waste (LAW) EPA-Series
Glasses
K. M. Fox
T. B. Edwards
March 2016
SRNL-STI-2016-00095, Revision 0

SRNL-STI-2016-00095Revision 0
ii
DISCLAIMER
This work was prepared under an agreement with and funded by the U.S. Government. Neither the U.S. Government or its employees, nor any of its contractors, subcontractors or their employees,makes any express or implied:
1. warranty or assumes any legal liability for the accuracy, completeness, or for the use or results of such use of any information, product, or process disclosed; or
2. representation that such use or results of such use would not infringe privately owned rights; or
3. endorsement or recommendation of any specifically identified commercial product, process, or service.
Any views and opinions of authors expressed in this work do not necessarily state or reflect those of the United States Government, or its contractors, or subcontractors.
Printed in the United States of America
Prepared forU.S. Department of Energy

SRNL-STI-2016-00095Revision 0
iii
Keywords: Low activity waste glass, Hanford, WTP
Retention: Permanent
Chemical Composition Measurements of the Low Activity Waste (LAW) EPA-Series Glasses
K. M. FoxT. B. Edwards
March 2016
Prepared for the U.S. Department of Energy undercontract number DE-AC09-08SR22470.

SRNL-STI-2016-00095Revision 0
iv
REVIEWS AND APPROVALS
AUTHORS:
______________________________________________________________________________K. M. Fox, Hanford Mission Programs Date
______________________________________________________________________________T. B. Edwards, Engineering Process Development Date
TECHNICAL REVIEW:
______________________________________________________________________________D. L. McClane, Engineering Process Development, Reviewed per E7 2.60 Date
APPROVAL:
______________________________________________________________________________C. C. Herman, Director, Hanford Mission Programs Date
SRNL-STI-2016-00095Revision 0
v
ACKNOWLEDGEMENTS
The authors thank Phyllis Workman, Madison Caldwell, Kim Wyszynski, Beverly Wall, and Whitney Riley at Savannah River National Laboratory for their assistance with the laboratory analyses described in this report. The authors thank Mike Schweiger at the Pacific Northwest National Laboratory for helpful discussions and review of these data. Funding for this work by the U.S. Department of Energy Office of River Protection Waste Treatment & Immobilization Plant Project through Inter-Entity Work Order M0SRV00101 managed by Albert A. Kruger is gratefully acknowledged.

SRNL-STI-2016-00095Revision 0
vi
EXECUTIVE SUMMARY
In this report, the Savannah River National Laboratory provides chemical analysis results for a series of simulated low activity waste glasses provided by Pacific Northwest National Laboratory as part of an ongoing development task.
The measured chemical composition data are reported and compared with the targeted values for each component for each glass. A detailed review showed no indications of errors in the preparation ormeasurement of the study glasses. All of the measured sums of oxides for the study glasses fell within the interval of 100.2 to 100.8 wt %, indicating recovery of all components. Comparisons of the targeted and measured chemical compositions showed that the measured values for the glasses met the targeted concentrations within 10% for those components present at more than 5 wt %.

SRNL-STI-2016-00095Revision 0
vii
TABLE OF CONTENTS
LIST OF TABLES.....................................................................................................................................viii
LIST OF ABBREVIATIONS...................................................................................................................... ix
1.0 Introduction............................................................................................................................................. 1
2.0 Experimental Procedure.......................................................................................................................... 1
2.1 Glasses Selected for Study .................................................................................................................. 1
2.2 Chemical Composition Analysis ......................................................................................................... 1
2.3 Quality Assurance ............................................................................................................................... 2
3.0 Results and Discussion ........................................................................................................................... 2
3.1 Review and Evaluation of Chemical Composition Measurements ..................................................... 2
3.1.1 Treatment of Detection Limits...................................................................................................... 3
3.1.2 Measurements in Analytical Sequence ......................................................................................... 3
3.1.3 Composition Measurements by Glass Identifier........................................................................... 3
3.1.4 Results for the LRM Standard ...................................................................................................... 4
3.1.5 Measured versus Targeted Compositions ..................................................................................... 4
4.0 Summary................................................................................................................................................. 4
5.0 References............................................................................................................................................... 5
Appendix A Tables and Exhibits Supporting the Chemical Composition Measurements...................A-1

SRNL-STI-2016-00095Revision 0
viii
LIST OF TABLES
Table 2-1. Identifiers for PNNL LAW EPA Glasses Characterized in this Study....................................... 1
Table 2-2. Preparation Methods Used in Reporting the Concentrations of Each of the Components of the Study Glasses......................................................................................................................................... 2

SRNL-STI-2016-00095Revision 0
ix
LIST OF ABBREVIATIONS
BDL Below Detection Limit
DOE U.S. Department of Energy
HLW High Level Waste
IC Ion Chromatography
ICP-MS Inductively Coupled Plasma – Mass Spectroscopy
ICP-OES Inductively Coupled Plasma – Optical Emission Spectroscopy
KH Potassium hydroxide fusion
LAW Low Activity Waste
LM Lithium Metaborate fusion
LRM Low-level Reference Material
ORP U.S. Department of Energy – Office of River Protection
PF Sodium Peroxide Fusion
PNNL Pacific Northwest National Laboratory
SRNL Savannah River National Laboratory
TTQAP Task Technical and Quality Assurance Plan
wt % Weight Percent
WTP Hanford Waste Treatment and Immobilization Plant

SRNL-STI-2016-00095Revision 0
1
1.0 Introduction
The U.S. Department of Energy (DOE) Office of River Protection (ORP) is building the Waste Treatment and Immobilization Plant (WTP) at the Hanford Site in Washington to remediate 55 million gallons of radioactive waste that is temporarily stored in 177 underground tanks. The low-activity waste (LAW) fraction will be partitioned from the high-level waste (HLW). Both the LAW and HLW will then be vitrified in borosilicate glass with Joule-heated ceramic melters.
Efforts are being made to increase the loading of Hanford tank wastes in glass while maintaining theability to meet processing, regulatory compliance, and product quality requirements. DOE-ORP has requested that the Savannah River National Laboratory (SRNL) support the advancement of glass formulations and process control strategies in key technical areas, as defined in the Task Technical and Quality Assurance Plan (TTQAP).1 One of these areas is the development of advanced, predictive models for the chemical durability performance of glasses formulated at high waste concentrations.
In this report, SRNL provides chemical analysis results for a series of simulated LAW glasses providedby Pacific Northwest National Laboratory (PNNL) as part of an ongoing development task.2
2.0 Experimental Procedure
2.1 Glasses Selected for Study
PNNL provided three glasses for the analyses described in this report. The identifiers for these glasses are given in Table 2-1. Heat treatment information for the glasses was not provided.
Table 2-1. Identifiers for PNNL LAW EPA Glasses Characterized in this Study
Glass Identifier
LAWA23-EPALAWA44-EPAORPLB2-EPA
In the sections that follow, the methods used for measuring chemical composition are described and statistical reviews of the resulting data are provided. Detailed data from these analyses are included as appendices.
2.2 Chemical Composition Analysis
Chemical analysis was performed under the auspices of an analytical plan3 on a representative sample of each of the study glasses to allow for comparisons with the targeted compositions. Three preparation techniques, sodium peroxide fusion (PF), lithium metaborate fusion (LM), and potassium hydroxide fusion (KH), were used to prepare the glass samples, in duplicate, for analysis. Note that two preparation methods for iron measurements were requested in the analytical plan3 due to the potential for crystalline phases to be present in the study glasses and uncertainty regarding the dissolution of those phases. The analytical data from each method were reviewed in order to select the most appropriate method for iron.The preparation methods used for each of the reported glass components are summarized in Table 2-2.
Each of the samples prepared in duplicate by PF and LM was analyzed, twice for each element of interest, by Inductively Coupled Plasma – Optical Emission Spectroscopy (ICP-OES). The samples prepared in duplicate by KH were analyzed, twice for each element of interest, by Ion Chromatography (IC). A glass standard was intermittently measured to assess the performance of the ICP-OES and IC instruments over

SRNL-STI-2016-00095Revision 0
2
the course of these analyses. Specifically, several samples of the low-level reference material (LRM)4
were included as part of the analytical plan. The samples of glass ORPLB2-EPA prepared in duplicate by PF were also analyzed for cesium concentrations using Inductively Coupled Plasma – Mass Spectroscopy (ICP-MS).
Table 2-2. Preparation Methods Used in Reporting the Concentrations of Each of the Components of the Study Glasses
Component Preparation MethodAl PFB PFCa LMCl KHCr LMCs PFF KHFe PFK LMLi PF
Mg LMMn LMMo LMNa LMNi LMP LM
Re LMS LMSi PFSn LMTi LMV LMZn LMZr LM
2.3 Quality Assurance
Requirements for performing reviews of technical reports and the extent of review are established in Savannah River Site Manual E7 2.60. SRNL documents the extent and type of review using the SRNL Technical Report Design Checklist contained in WSRC-IM-2002-00011, Rev. 2. Laboratory data for this study were recorded in the SRNL Electronic Laboratory Notebook system, experiment C3489-00079-11.
3.0 Results and Discussion
3.1 Review and Evaluation of Chemical Composition Measurements
Table A-1 in Appendix A provides the elemental concentration measurements in weight percent (wt %) for the study glasses that were prepared by PF and measured by ICP-OES. Table A-2 in Appendix Aprovides the elemental cesium concentration measurements for glass ORPLB2-EPA as prepared by PFand measured by ICP-MS. Table A-3 in Appendix A provides the elemental concentration measurements for the study glasses that were prepared by KH and measured by IC. Table A-4 and Table A-5 in Appendix A provide the elemental concentration measurements for the study glasses that were prepared by LM and measured by ICP-OES. Elemental measurements for samples of the LRM standard glass are

SRNL-STI-2016-00095Revision 0
3
also provided in the tables of Appendix A (with the exception of the ICP-MS measurements). These unprocessed data are provided as appendices to this report so that the values are readily available should they be of interest for future reviews.
In the sections that follow, the analytical sequences of the measurements are explored, the measurements of the LRM standard glass are investigated, the measurements for each glass are reviewed, the average chemical composition for each glass is determined, and comparisons are made between the measurements and the targeted compositions for the glasses. JMP Pro Version 11.2.1 (SAS Institute, Inc.)5 was used to support these analyses.
3.1.1 Treatment of Detection Limits
The elemental concentrations in Table A-1 through Table A-5 of Appendix A were converted to oxide concentrations by multiplying the values for each element by the gravimetric factor for the corresponding oxide.a During the process of converting to oxide concentrations, an elemental concentration that was reported to be below the detection limit of the analytical process used was set to the detection limit as the oxide concentration was determined for the purposes of statistical review and calculating a sum of oxides for each glass. Those oxides with measured concentrations that were below the associated detection limit will be denoted with a less than symbol (<) as the measured compositions are reported.
3.1.2 Measurements in Analytical Sequence
Exhibit A-1 in Appendix A provides plots of the wt % measurements generated for prepared samples by oxide and analytical block. The plots are in analytical sequence within each calibration block with different symbols and colors being used to represent each of the study and standard glasses. These plots include all of the measurement data from Table A-1 through Table A-5 of Appendix A, with each plotted point identified by its Lab ID. Plotting the data in this format provides an opportunity to identify gross trends in performance of the analytical instrument within and among calibration blocks. There do not appear to be any gross patterns or trends in the analytical process that would indicate an issue with performance of the measurements.
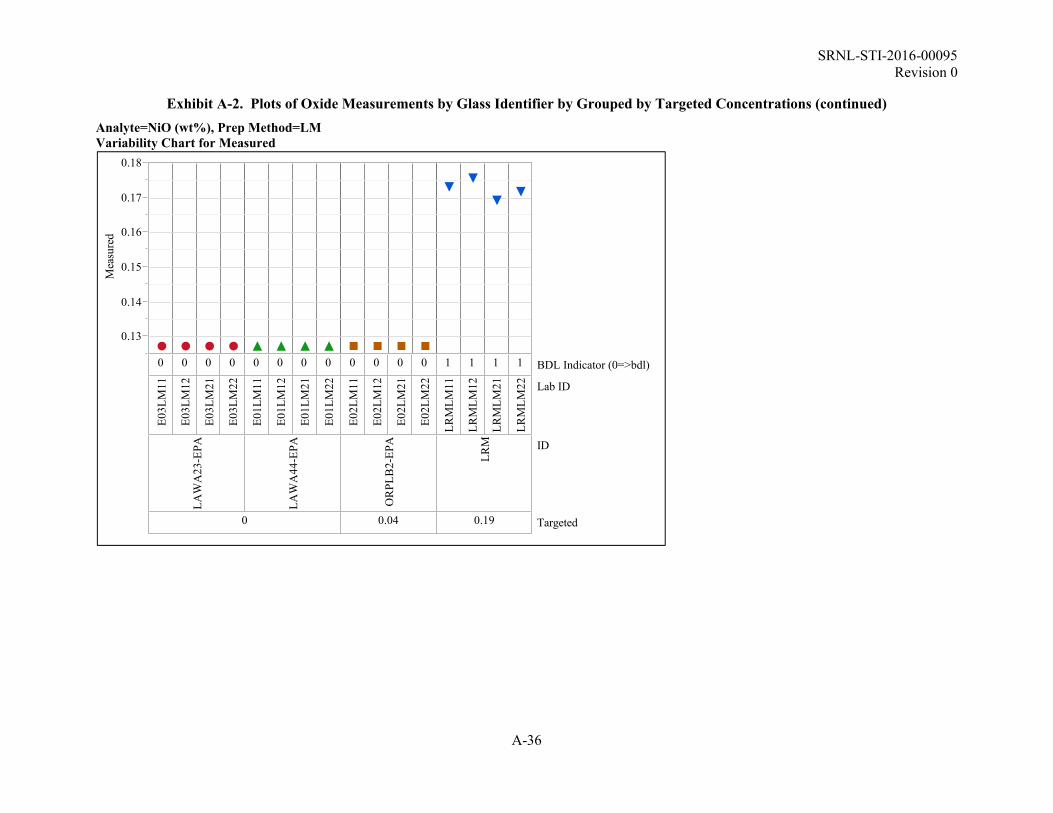
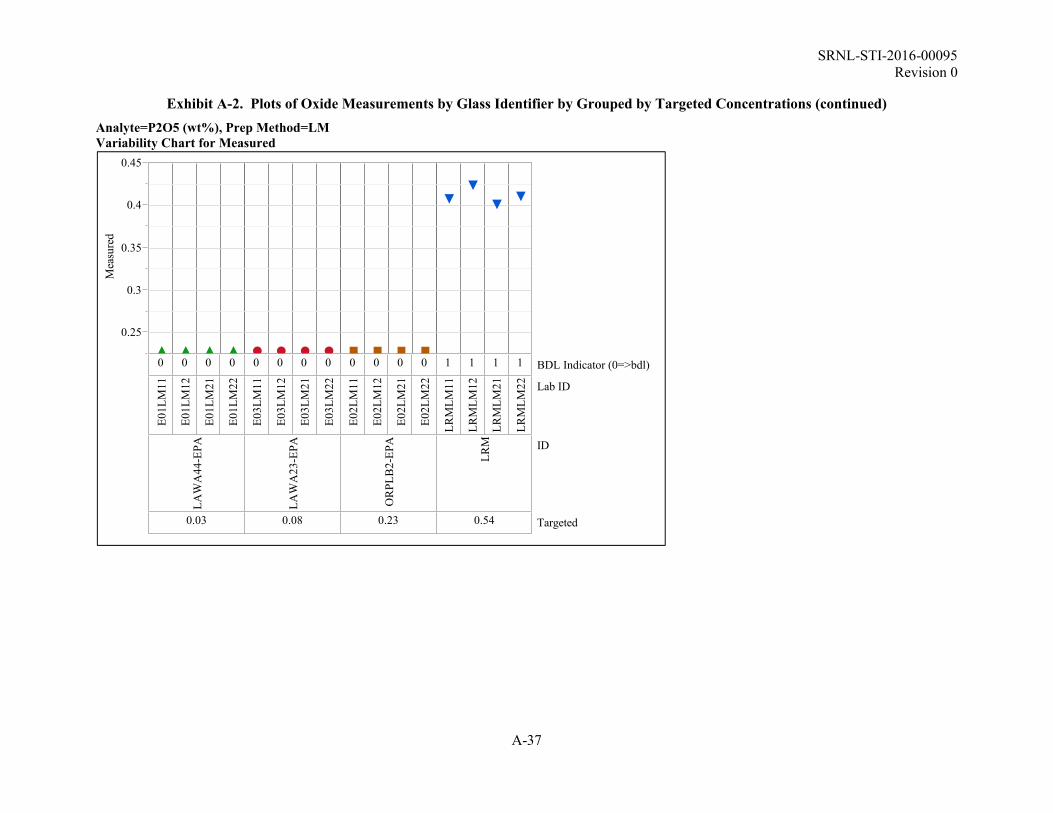
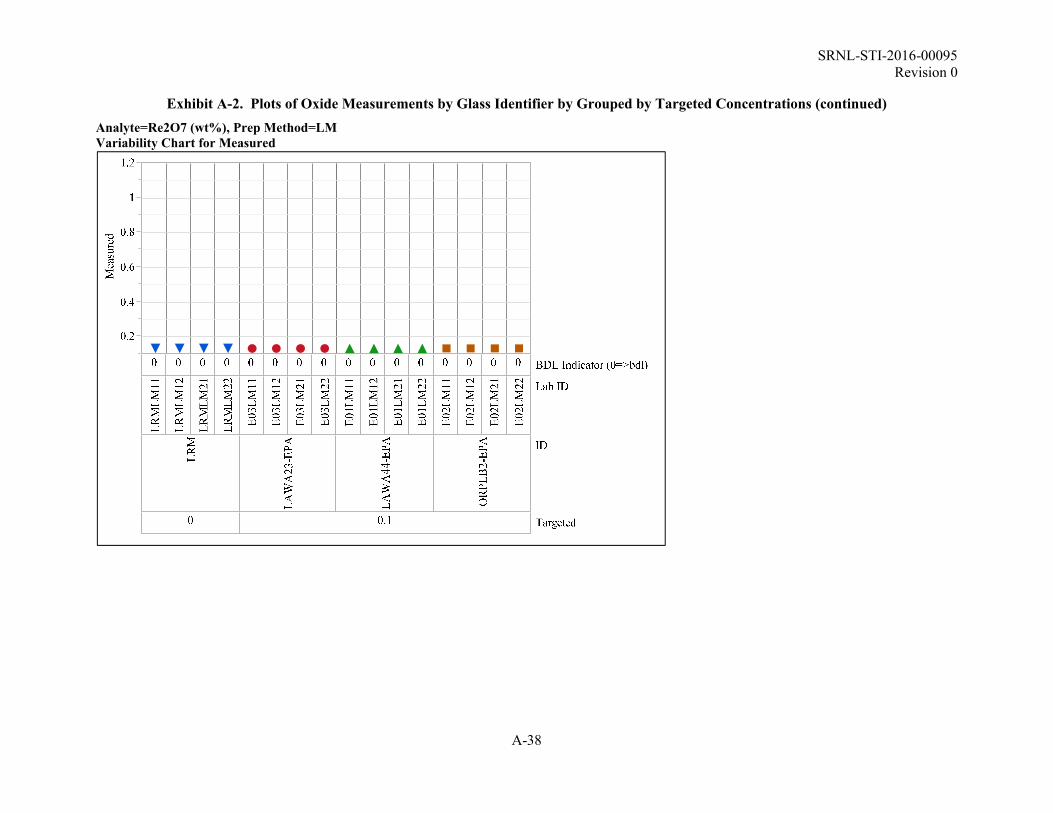
3.1.3 Composition Measurements by Glass Identifier
Exhibit A-2 in Appendix A provides plots of the oxide concentration measurements by the PNNL Glass ID (including the LRM reference glass) by Lab ID grouped by targeted concentration. Different symbols and colors are used to represent the different glasses. These plots show the individual measurements across the duplicates of each preparation method and the two instrument calibrations for each glass. Plotting the data in this format provides an opportunity to review the values for each individual glass as a function of the duplicate preparations and duplicate measurements. A review of the plots presented in these exhibits reveals the repeatability of the four individual values for each oxide for each glass and leads to the following observations:
The measured Cl concentrations are below the targeted values, which may be due to volatilization during melting.
As mentioned earlier, data from the PF preparation method is used in reporting the Fe2O3
concentrations for the study glasses.
None of the observations noted above from Exhibit A-2 indicated an error in preparation or measurement that had to be addressed in treatment of the data. Therefore, the entire set of measurement data was used in determining representative, measured compositions for all of the oxides for the study glasses.
a Note that manganese, typically reported as MnO by SRNL, is reported as MnO2 for consistency with the targeted compositions provided by PNNL.

SRNL-STI-2016-00095Revision 0
4
3.1.4 Results for the LRM Standard
Exhibit A-3 in Appendix A provides a review of the LRM results against acceptability limits utilized by SRNL. The review is in the form of plots of the measurements arranged by preparation method and element, framed by upper and lower acceptability limits for the concentration of the element in question. The results show that all of the measurements for the elements present in the LRM standard glass were within the acceptability limits utilized by SRNL in conducting instrument and procedure assessmentsduring the execution of these measurements.
3.1.5 Measured versus Targeted Compositions
From the discussion of Section 3.1.3, all of the measurements for each oxide for each glass (i.e., all of the measurements in Appendix A, Table A-1 through Table A-5), were averaged to determine a representative chemical composition for each glass. A sum of oxides was also computed for each glass based upon the measured values. Exhibit A-4 in Appendix A provides a graphical representation of the results for each glass for each oxide to allow PNNL to draw comparisons between the measured and targeted values.
Table A-6 in Appendix A provides a summary of the average compositions as well as the targeted compositions and some associated differences and relative differences. All of the measured sums of oxides for the study glasses fall within the interval of 100.2 to 100.8 wt %, indicating recovery of all components. Entries in Table A-6 show the relative differences between the measured values and the targeted values for the oxides with targeted values above 5 wt %. The relative differences are typically shaded if they are 10% or more.a The measurements of the glasses in this study all exceeded these criteria, thus there are no shaded values found in Table A-6.
4.0 Summary
In this report, SRNL provides chemical analysis results for a series of simulated LAW glasses providedby PNNL as part of an ongoing development task.2
The measured chemical composition data are reported and compared with the targeted values for each component for each glass. A detailed review showed no indications of errors in the preparation or measurement of the study glasses. All of the measured sums of oxides for the study glasses fell within the interval of 100.2 to 100.8 wt %, indicating recovery of all components. Comparisons of the targeted and measured chemical compositions showed that the measured values for the glasses met the targeted concentrations within 10% for those components present at more than 5 wt %.
a These criteria were selected arbitrarily for the purpose of highlighting differences from targeted concentrations that may be of practical concern.

SRNL-STI-2016-00095Revision 0
5
5.0 References
1. Fox, K. M. and D. K. Peeler, “Task Technical and Quality Assurance Plan for Hanford HLW Glass Development and Characterization,” U.S. Department of Energy Report SRNL-RP-2013-00692, Revision 0, Savannah River National Laboratory, Aiken, SC (2013).
2. Peeler, D. K., D. S. Kim, J. D. Vienna, M. J. Schweiger, and G. F. Piepel, “Office of River Protection Advanced Low-Activity Waste Glass Research and Development Plan,” U.S. Department of Energy Report PNNL-24883, EWG-RPT-008, Pacific Northwest National Laboratory, Richland, WA (2015).
3. Edwards, T. B., “An Analytical Plan for Measuring the Chemical Compositions of the PNNL EPA LAW Glasses,” U.S. Department of Energy Memorandum SRNL-L3100-2015-00221, Savannah River National Laboratory, Aiken, SC (2015).
4. Ebert, W. L. and S. F. Wolfe, “Round-robin Testing of a Reference Glass for Low-Activity Waste Forms,” U.S. Department of Energy Report ANL-99/22, Argonne National Laboratory, Argonne, IL (1999).
5. JMPTM Pro, Ver. 11.2.1, [Computer Software] SAS Institute Inc., Cary, NC (2014).

SRNL-STI-2016-00095Revision 0
A-1
Appendix A Tables and Exhibits Supporting the Chemical Composition Measurements

SRNL-STI-2016-00095Revision 0
A-2
Table A-1. Measurements from the PF Preparation Method
ID Block Sequence Lab ID Al (wt%) B (wt%) Fe (wt%) Li (wt%) Si (wt%)LRM 1 1 LRMPF11 5.04 2.48 1.00 <0.100 25.1
ORPLB2-EPA 1 2 E02PF21 5.20 2.26 0.757 <0.100 18.8LAWA44-EPA 1 3 E01PF11 3.18 2.67 4.81 <0.100 20.0LAWA23-EPA 1 4 E03PF21 5.12 1.29 5.05 0.895 18.8LAWA44-EPA 1 5 E01PF21 3.20 2.72 4.86 <0.100 20.3ORPLB2-EPA 1 6 E02PF11 5.15 2.21 0.748 <0.100 18.6LAWA23-EPA 1 7 E03PF11 5.03 1.30 5.02 0.881 18.6
LRM 1 8 LRMPF12 5.05 2.38 0.991 <0.100 25.3LRM 2 1 LRMPF21 4.95 2.47 1.03 0.106 24.6
ORPLB2-EPA 2 2 E02PF22 5.17 2.33 0.810 <0.100 18.7LAWA23-EPA 2 3 E03PF12 5.03 1.39 5.04 0.928 18.5LAWA23-EPA 2 4 E03PF22 5.05 1.36 5.06 0.930 18.6LAWA44-EPA 2 5 E01PF22 3.21 2.74 4.88 <0.100 20.2ORPLB2-EPA 2 6 E02PF12 5.18 2.26 0.812 <0.100 18.6LAWA44-EPA 2 7 E01PF12 3.20 2.69 4.83 <0.100 20.0
LRM 2 8 LRMPF22 5.13 2.45 1.05 0.107 25.4
Table A-2. Cesium Measurements, PF Preparation Method
Glass ID Block Sequence Lab ID Cs (wt%)ORPLB2-EPA 1 1 E02PF1 0.1216ORPLB2-EPA 2 1 E02PF2 0.1224
Table A-3. Measurements from the KH Preparation Method
ID Block Sequence Lab ID Cl (wt%) ar F (wt%) arLRM 1 1 LRMKH11 <0.010 0.881
LAWA23-EPA 1 2 E03KH21 0.204 0.097LAWA44-EPA 1 3 E01KH11 0.494 <0.010ORPLB2-EPA 1 4 E02KH21 0.067 0.411LAWA44-EPA 1 5 E01KH21 0.497 <0.010ORPLB2-EPA 1 6 E02KH11 0.066 0.415LAWA23-EPA 1 7 E03KH11 0.201 0.095
LRM 1 8 LRMKH12 <0.010 0.889LRM 2 1 LRMKH21 <0.010 0.879
LAWA44-EPA 2 2 E01KH22 0.495 <0.010LAWA23-EPA 2 3 E03KH12 0.199 0.095ORPLB2-EPA 2 4 E02KH22 0.066 0.409LAWA44-EPA 2 5 E01KH12 0.492 <0.010LAWA23-EPA 2 6 E03KH22 0.203 0.097ORPLB2-EPA 2 7 E02KH12 0.069 0.411
LRM 2 8 LRMKH22 <0.010 0.881

SRNL-STI-2016-00095Revision 0
A-3
Table A-4. Measurements from the LM Preparation Method (part 1)
ID Block Sequence Lab ID Ca (wt%) Cr (wt%) Fe (wt%) K (wt%) Mg (wt%) Mn (wt%) Mo (wt%) Na (wt%) Ni (wt%)LRM 1 1 LRMLM11 0.352 0.135 0.992 1.17 <0.100 <0.100 <0.100 16.2 0.136
LAWA23-EPA 1 2 E03LM21 3.17 <0.100 4.96 2.58 1.09 <0.100 <0.100 15.5 <0.100ORPLB2-EPA 1 3 E02LM11 0.876 0.322 0.738 0.126 0.604 <0.100 <0.100 19.4 <0.100LAWA44-EPA 1 4 E01LM21 1.44 <0.100 4.82 0.495 1.08 <0.100 <0.100 15.8 <0.100LAWA23-EPA 1 5 E03LM11 3.17 <0.100 4.98 2.54 1.10 <0.100 <0.100 14.8 <0.100ORPLB2-EPA 1 6 E02LM21 0.749 0.328 0.719 0.136 0.589 <0.100 <0.100 19.3 <0.100LAWA44-EPA 1 7 E01LM11 1.42 <0.100 4.83 0.489 1.08 <0.100 <0.100 15.6 <0.100
LRM 1 8 LRMLM12 0.366 0.136 1.01 1.21 <0.100 <0.100 <0.100 15.6 0.138LRM 2 1 LRMLM21 0.347 0.131 1.04 1.25 <0.100 <0.100 <0.100 16.0 0.133
ORPLB2-EPA 2 2 E02LM22 0.739 0.325 0.708 0.133 0.585 <0.100 <0.100 19.5 <0.100LAWA23-EPA 2 3 E03LM12 3.17 <0.100 4.99 2.57 1.11 <0.100 <0.100 15.1 <0.100ORPLB2-EPA 2 4 E02LM12 0.892 0.323 0.742 0.130 0.607 <0.100 <0.100 19.1 <0.100LAWA44-EPA 2 5 E01LM12 1.46 <0.100 4.89 0.481 1.11 <0.100 <0.100 15.9 <0.100LAWA23-EPA 2 6 E03LM22 3.15 <0.100 4.96 2.59 1.10 <0.100 <0.100 15.6 <0.100LAWA44-EPA 2 7 E01LM22 1.43 <0.100 4.80 0.504 1.09 <0.100 <0.100 15.5 <0.100
LRM 2 8 LRMLM22 0.352 0.133 1.02 1.22 <0.100 <0.100 <0.100 15.8 0.135

SRNL-STI-2016-00095Revision 0
A-4
Table A-5. Measurements from the LM Preparation Method (part 2)
ID Block Sequence Lab ID P (wt%) Re (wt%) S (wt%) Sn (wt%) Ti (wt%) V (wt%) Zn (wt%) Zr (wt%)LRM 1 1 LRMLM11 0.178 <0.100 0.090 <0.100 <0.100 <0.100 <0.100 0.571
LAWA23-EPA 1 2 E03LM21 <0.100 <0.100 <0.050 <0.100 <0.100 <0.100 2.54 2.12ORPLB2-EPA 1 3 E02LM11 <0.100 <0.100 0.187 0.687 <0.100 1.07 2.86 3.70LAWA44-EPA 1 4 E01LM21 <0.100 <0.100 <0.050 <0.100 1.16 <0.100 2.33 2.15LAWA23-EPA 1 5 E03LM11 <0.100 <0.100 <0.050 <0.100 <0.100 <0.100 2.55 2.14ORPLB2-EPA 1 6 E02LM21 <0.100 <0.100 0.195 0.763 <0.100 1.09 2.87 3.98LAWA44-EPA 1 7 E01LM11 <0.100 <0.100 <0.050 <0.100 1.16 <0.100 2.33 2.16
LRM 1 8 LRMLM12 0.185 <0.100 0.092 <0.100 <0.100 <0.100 <0.100 0.593LRM 2 1 LRMLM21 0.175 <0.100 0.082 <0.100 <0.100 <0.100 <0.100 0.598
ORPLB2-EPA 2 2 E02LM22 <0.100 <0.100 0.189 0.756 <0.100 1.12 2.94 4.00LAWA23-EPA 2 3 E03LM12 <0.100 <0.100 <0.050 <0.100 <0.100 <0.100 2.55 2.15ORPLB2-EPA 2 4 E02LM12 <0.100 <0.100 0.190 0.691 <0.100 1.06 2.82 3.63LAWA44-EPA 2 5 E01LM12 <0.100 <0.100 <0.050 <0.100 1.20 <0.100 2.37 2.19LAWA23-EPA 2 6 E03LM22 <0.100 <0.100 <0.050 <0.100 <0.100 <0.100 2.55 2.13LAWA44-EPA 2 7 E01LM22 <0.100 <0.100 <0.050 <0.100 1.17 <0.100 2.33 2.14
LRM 2 8 LRMLM22 0.179 <0.100 0.085 <0.100 <0.100 <0.100 <0.100 0.602

SRNL-STI-2016-00095Revision 0
A-5
Table A-6. Comparison of Targeted and Measured Glass Compositions
Glass ID OxideBDL(<)
Measured(wt%)
Targeted(wt%)
Difference ofMeasured versus
Targeted
% Differenceof Measured
versus Targeted
LAWA23-EPA Al2O3 9.556 9.840 -0.284 -2.9%LAWA23-EPA B2O3 4.299 4.220 0.079LAWA23-EPA CaO 4.428 4.370 0.058LAWA23-EPA Cl 0.202 0.360 -0.158LAWA23-EPA Cr2O3 < 0.146 0.100 0.046LAWA23-EPA F 0.096 0.120 -0.024LAWA23-EPA Fe2O3 7.209 7.290 -0.081 -1.1%LAWA23-EPA K2O 3.096 3.090 0.006LAWA23-EPA Li2O 1.956 2.040 -0.084LAWA23-EPA MgO 1.824 2.040 -0.216LAWA23-EPA MnO2 < 0.158 0.000 0.158LAWA23-EPA MoO3 < 0.150 0.000 0.150LAWA23-EPA Na2O 20.557 19.970 0.587 2.9%LAWA23-EPA NiO < 0.127 0.000 0.127LAWA23-EPA P2O5 < 0.229 0.080 0.149LAWA23-EPA Re2O7 < 0.130 0.100 0.030LAWA23-EPA SiO2 39.844 40.080 -0.236 -0.6%LAWA23-EPA SnO2 < 0.127 0.000 0.127LAWA23-EPA SO3 < 0.125 0.040 0.085LAWA23-EPA TiO2 < 0.167 0.000 0.167LAWA23-EPA V2O5 < 0.179 0.000 0.179LAWA23-EPA ZnO 3.171 3.270 -0.099LAWA23-EPA ZrO2 2.884 2.980 -0.096LAWA23-EPA Sum 100.661 99.990 0.671 0.7%LAWA44-EPA Al2O3 6.042 6.200 -0.158 -2.6%LAWA44-EPA B2O3 8.710 8.900 -0.190 -2.1%LAWA44-EPA CaO 2.011 1.990 0.021LAWA44-EPA Cl 0.495 0.650 -0.156LAWA44-EPA Cr2O3 < 0.146 0.100 0.046LAWA44-EPA F < 0.010 0.010 0.000LAWA44-EPA Fe2O3 6.927 6.980 -0.053 -0.8%LAWA44-EPA K2O 0.593 0.500 0.093LAWA44-EPA Li2O < 0.215 0.000 0.215LAWA44-EPA MgO 1.808 1.990 -0.182LAWA44-EPA MnO2 < 0.158 0.000 0.158LAWA44-EPA MoO3 < 0.150 0.010 0.140LAWA44-EPA Na2O 21.164 19.990 1.174 5.9%LAWA44-EPA NiO < 0.127 0.000 0.127LAWA44-EPA P2O5 < 0.229 0.030 0.199LAWA44-EPA Re2O7 < 0.130 0.100 0.030LAWA44-EPA SiO2 43.053 44.530 -1.477 -3.3%LAWA44-EPA SnO2 < 0.127 0.000 0.127LAWA44-EPA SO3 < 0.125 0.100 0.025LAWA44-EPA TiO2 1.956 1.990 -0.034LAWA44-EPA V2O5 < 0.179 0.000 0.179

SRNL-STI-2016-00095Revision 0
A-6
Table A-6. Comparison of Targeted and Measured Glass Compositions (continued)
Glass ID OxideBDL(<)
Measured(wt%)
Targeted(wt%)
Difference ofMeasured versus
Targeted
% Differenceof Measured
versus Targeted
LAWA44-EPA ZnO 2.913 2.960 -0.047LAWA44-EPA ZrO2 2.918 2.990 -0.072LAWA44-EPA Sum 100.185 100.020 0.165 0.2%
LRM Al2O3 9.528 9.510 0.018 0.2%LRM B2O3 7.873 7.850 0.023 0.3%LRM CaO 0.496 0.540 -0.044LRM Cl < 0.010 0.000 0.010LRM Cr2O3 0.195 0.190 0.005LRM F 0.883 0.860 0.023LRM Fe2O3 1.455 1.380 0.075LRM K2O 1.461 1.480 -0.019LRM Li2O < 0.222 0.110 0.112LRM MgO < 0.166 0.100 0.066LRM MnO2 < 0.158 0.098 0.060LRM MoO3 < 0.150 0.000 0.150LRM Na2O 21.433 20.030 1.403 7.0%LRM NiO 0.172 0.190 -0.018LRM P2O5 0.411 0.540 -0.129LRM Re2O7 < 0.130 0.000 0.130LRM SiO2 53.696 54.200 -0.504 -0.9%LRM SnO2 < 0.127 0.000 0.127LRM SO3 0.218 0.300 -0.082LRM TiO2 < 0.167 0.000 0.167LRM V2O5 < 0.179 0.000 0.179LRM ZnO < 0.124 0.000 0.124LRM ZrO2 0.798 0.930 -0.132LRM Sum 100.052 98.308 1.744 1.8%
ORPLB2-EPA Al2O3 9.778 10.000 -0.222 -2.2%ORPLB2-EPA B2O3 7.293 7.300 -0.007 -0.1%ORPLB2-EPA CaO 1.139 1.100 0.039ORPLB2-EPA Cl 0.067 0.110 -0.043ORPLB2-EPA Cr2O3 0.474 0.520 -0.046ORPLB2-EPA Cs2O 0.129 0.150 -0.021ORPLB2-EPA F 0.412 0.490 -0.079ORPLB2-EPA Fe2O3 1.118 1.100 0.018ORPLB2-EPA K2O 0.158 0.120 0.038ORPLB2-EPA Li2O < 0.215 0.000 0.215ORPLB2-EPA MgO 0.989 1.100 -0.111ORPLB2-EPA MnO2 < 0.158 0.060 0.098ORPLB2-EPA MoO3 < 0.150 0.000 0.150ORPLB2-EPA Na2O 26.050 25.000 1.050 4.2%ORPLB2-EPA NiO < 0.127 0.040 0.087ORPLB2-EPA P2O5 < 0.229 0.230 -0.001ORPLB2-EPA Re2O7 < 0.130 0.100 0.030ORPLB2-EPA SiO2 39.951 39.880 0.071 0.2%ORPLB2-EPA SnO2 0.920 1.080 -0.160

SRNL-STI-2016-00095Revision 0
A-7
Table A-6. Comparison of Targeted and Measured Glass Compositions (continued)
Glass ID OxideBDL(<)
Measured(wt%)
Targeted(wt%)
Difference ofMeasured versus
Targeted
% Differenceof Measured
versus Targeted
ORPLB2-EPA SO3 0.475 0.520 -0.045ORPLB2-EPA TiO2 < 0.167 0.000 0.167ORPLB2-EPA V2O5 1.937 2.000 -0.063ORPLB2-EPA ZnO 3.576 3.650 -0.074ORPLB2-EPA ZrO2 5.170 5.440 -0.270 -5.0%ORPLB2-EPA Sum 100.813 99.990 0.823 0.8%

SRNL-STI-2016-00095Revision 0
A-8
Exhibit A-1. Plots of Oxide Measurements in Analytical Sequence
Analyte=Al2O3 (wt%), Prep Method=PFVariability Chart for Measured
Analyte=B2O3 (wt%), Prep Method=PFVariability Chart for Measured
5.5
6
6.5
7
7.5
8
8.5
9
9.5
10
1 1 1 1 1 1 1 1 1 1 1 1 1 1 1 1 BDL Indicator (0=>bdl)
Lab ID
1 2 3 4 5 6 7 8 1 2 3 4 5 6 7 8 Sequence
1 2 Block
4
5
6
7
8
9
1 1 1 1 1 1 1 1 1 1 1 1 1 1 1 1 BDL Indicator (0=>bdl)
Lab ID
1 2 3 4 5 6 7 8 1 2 3 4 5 6 7 8 Sequence
1 2 Block

SRNL-STI-2016-00095Revision 0
A-9
Exhibit A-1. Plots of Oxide Measurements in Analytical Sequence (continued)
Analyte=CaO (wt%), Prep Method=LMVariability Chart for Measured
Analyte=Cl (wt%), Prep Method=KHVariability Chart for Measured

SRNL-STI-2016-00095Revision 0
A-10
Exhibit A-1. Plots of Oxide Measurements in Analytical Sequence (continued)
Analyte=Cr2O3 (wt%), Prep Method=LMVariability Chart for Measured
Analyte=Cs2O (wt%), Prep Method=ADVariability Chart for Measured

SRNL-STI-2016-00095Revision 0
A-11
Exhibit A-1. Plots of Oxide Measurements in Analytical Sequence (continued)
Analyte=F (wt%), Prep Method=KHVariability Chart for Measured
Analyte=Fe2O3 (wt%), Prep Method=LMVariability Chart for Measured

SRNL-STI-2016-00095Revision 0
A-12
Exhibit A-1. Plots of Oxide Measurements in Analytical Sequence (continued)
Analyte=Fe2O3 (wt%), Prep Method=PFVariability Chart for Measured
Analyte=K2O (wt%), Prep Method=LMVariability Chart for Measured

SRNL-STI-2016-00095Revision 0
A-13
Exhibit A-1. Plots of Oxide Measurements in Analytical Sequence (continued)
Analyte=Li2O (wt%), Prep Method=PFVariability Chart for Measured
Analyte=MgO (wt%), Prep Method=LMVariability Chart for Measured

SRNL-STI-2016-00095Revision 0
A-14
Exhibit A-1. Plots of Oxide Measurements in Analytical Sequence (continued)
Analyte=MnO2 (wt%), Prep Method=LMVariability Chart for Measured
Analyte=MoO3 (wt%), Prep Method=LMVariability Chart for Measured

SRNL-STI-2016-00095Revision 0
A-15
Exhibit A-1. Plots of Oxide Measurements in Analytical Sequence (continued)
Analyte=Na2O (wt%), Prep Method=LMVariability Chart for Measured
Analyte=NiO (wt%), Prep Method=LMVariability Chart for Measured

SRNL-STI-2016-00095Revision 0
A-16
Exhibit A-1. Plots of Oxide Measurements in Analytical Sequence (continued)
Analyte=P2O5 (wt%), Prep Method=LMVariability Chart for Measured
Analyte=Re2O7 (wt%), Prep Method=LMVariability Chart for Measured

SRNL-STI-2016-00095Revision 0
A-17
Exhibit A-1. Plots of Oxide Measurements in Analytical Sequence (continued)
Analyte=SiO2 (wt%), Prep Method=PFVariability Chart for Measured
Analyte=SnO2 (wt%), Prep Method=LMVariability Chart for Measured
40
45
50
55
1 1 1 1 1 1 1 1 1 1 1 1 1 1 1 1 BDL Indicator (0=>bdl)
Lab ID
1 2 3 4 5 6 7 8 1 2 3 4 5 6 7 8 Sequence
1 2 Block

SRNL-STI-2016-00095Revision 0
A-18
Exhibit A-1. Plots of Oxide Measurements in Analytical Sequence (continued)
Analyte=SO3 (wt%), Prep Method=LMVariability Chart for Measured
Analyte=TiO2 (wt%), Prep Method=LMVariability Chart for Measured

SRNL-STI-2016-00095Revision 0
A-19
Exhibit A-1. Plots of Oxide Measurements in Analytical Sequence (continued)
Analyte=V2O5 (wt%), Prep Method=LMVariability Chart for Measured
Analyte=ZnO (wt%), Prep Method=LMVariability Chart for Measured

SRNL-STI-2016-00095Revision 0
A-20
Exhibit A-1. Plots of Oxide Measurements in Analytical Sequence (continued)
Analyte=ZrO2 (wt%), Prep Method=LMVariability Chart for Measured
1
2
3
4
5
1 1 1 1 1 1 1 1 1 1 1 1 1 1 1 1 BDL Indicator (0=>bdl)
Lab ID
1 2 3 4 5 6 7 8 1 2 3 4 5 6 7 8 Sequence
1 2 Block

SRNL-STI-2016-00095Revision 0
A-21
Exhibit A-2. Plots of Oxide Measurements by Glass Identifier by Grouped by Targeted Concentrations
Analyte=Al2O3 (wt%), Prep Method=PFVariability Chart for Measured
Mea
sure
d
E0
1P
F1
1
E0
1P
F1
2
E0
1P
F2
1
E0
1P
F2
2
LR
MP
F1
1
LR
MP
F1
2
LR
MP
F2
1
LR
MP
F2
2
E0
3P
F1
1
E0
3P
F1
2
E0
3P
F2
1
E0
3P
F2
2
E0
2P
F1
1
E0
2P
F1
2
E0
2P
F2
1
E0
2P
F2
2
LA
WA
44
-EP
A
LR
M
LA
WA
23
-EP
A
OR
PL
B2
-EP
A

SRNL-STI-2016-00095Revision 0
A-22
Exhibit A-2. Plots of Oxide Measurements by Glass Identifier by Grouped by Targeted Concentrations (continued)
Analyte=B2O3 (wt%), Prep Method=PFVariability Chart for Measured
Mea
sure
d
E0
3P
F1
1
E0
3P
F1
2
E0
3P
F2
1
E0
3P
F2
2
E0
2P
F1
1
E0
2P
F1
2
E0
2P
F2
1
E0
2P
F2
2
LR
MP
F1
1
LR
MP
F1
2
LR
MP
F2
1
LR
MP
F2
2
E0
1P
F1
1
E0
1P
F1
2
E0
1P
F2
1
E0
1P
F2
2
LA
WA
23
-EP
A
OR
PL
B2
-EP
A
LR
M
LA
WA
44
-EP
A

SRNL-STI-2016-00095Revision 0
A-23
Exhibit A-2. Plots of Oxide Measurements by Glass Identifier by Grouped by Targeted Concentrations (continued)
Analyte=CaO (wt%), Prep Method=LMVariability Chart for Measured

SRNL-STI-2016-00095Revision 0
A-24
Exhibit A-2. Plots of Oxide Measurements by Glass Identifier by Grouped by Targeted Concentrations (continued)
Analyte=Cl (wt%), Prep Method=KHVariability Chart for Measured

SRNL-STI-2016-00095Revision 0
A-25
Exhibit A-2. Plots of Oxide Measurements by Glass Identifier by Grouped by Targeted Concentrations (continued)
Analyte=Cr2O3 (wt%), Prep Method=LMVariability Chart for Measured
Mea
sure
d
0.1
0.15
0.2
0.25
0.3
0.35
0.4
0.45
0.5
0 0 0 0 0 0 0 0 1 1 1 1 1 1 1 1 BDL Indicator (0=>bdl)
E0
3L
M1
1
E0
3L
M1
2
E0
3L
M2
1
E0
3L
M2
2
E0
1L
M1
1
E0
1L
M1
2
E0
1L
M2
1
E0
1L
M2
2
LR
ML
M1
1
LR
ML
M1
2
LR
ML
M2
1
LR
ML
M2
2
E0
2L
M1
1
E0
2L
M1
2
E0
2L
M2
1
E0
2L
M2
2
Lab ID
LA
WA
23
-EP
A
LA
WA
44
-EP
A
LR
M
OR
PL
B2
-EP
A ID
0.1 0.19 0.52 Targeted

SRNL-STI-2016-00095Revision 0
A-26
Exhibit A-2. Plots of Oxide Measurements by Glass Identifier by Grouped by Targeted Concentrations (continued)
Analyte=Cs2O (wt%), Prep Method=ADVariability Chart for Measured

SRNL-STI-2016-00095Revision 0
A-27
Exhibit A-2. Plots of Oxide Measurements by Glass Identifier by Grouped by Targeted Concentrations (continued)
Analyte=F (wt%), Prep Method=KHVariability Chart for Measured

SRNL-STI-2016-00095Revision 0
A-28
Exhibit A-2. Plots of Oxide Measurements by Glass Identifier by Grouped by Targeted Concentrations (continued)
Analyte=Fe2O3 (wt%), Prep Method=LMVariability Chart for Measured

SRNL-STI-2016-00095Revision 0
A-29
Exhibit A-2. Plots of Oxide Measurements by Glass Identifier by Grouped by Targeted Concentrations (continued)
Analyte=Fe2O3 (wt%), Prep Method=PFVariability Chart for Measured

SRNL-STI-2016-00095Revision 0
A-30
Exhibit A-2. Plots of Oxide Measurements by Glass Identifier by Grouped by Targeted Concentrations (continued)
Analyte=K2O (wt%), Prep Method=LMVariability Chart for Measured

SRNL-STI-2016-00095Revision 0
A-31
Exhibit A-2. Plots of Oxide Measurements by Glass Identifier by Grouped by Targeted Concentrations (continued)
Analyte=Li2O (wt%), Prep Method=PFVariability Chart for Measured

SRNL-STI-2016-00095Revision 0
A-32
Exhibit A-2. Plots of Oxide Measurements by Glass Identifier by Grouped by Targeted Concentrations (continued)
Analyte=MgO (wt%), Prep Method=LMVariability Chart for Measured

SRNL-STI-2016-00095Revision 0
A-33
Exhibit A-2. Plots of Oxide Measurements by Glass Identifier by Grouped by Targeted Concentrations (continued)
Analyte=MnO2 (wt%), Prep Method=LMVariability Chart for Measured

SRNL-STI-2016-00095Revision 0
A-34
Exhibit A-2. Plots of Oxide Measurements by Glass Identifier by Grouped by Targeted Concentrations (continued)
Analyte=MoO3 (wt%), Prep Method=LMVariability Chart for Measured

SRNL-STI-2016-00095Revision 0
A-35
Exhibit A-2. Plots of Oxide Measurements by Glass Identifier by Grouped by Targeted Concentrations (continued)
Analyte=Na2O (wt%), Prep Method=LMVariability Chart for Measured
SRNL-STI-2016-00095Revision 0
A-36
Exhibit A-2. Plots of Oxide Measurements by Glass Identifier by Grouped by Targeted Concentrations (continued)
Analyte=NiO (wt%), Prep Method=LMVariability Chart for Measured
Mea
sure
d
0.13
0.14
0.15
0.16
0.17
0.18
0 0 0 0 0 0 0 0 0 0 0 0 1 1 1 1 BDL Indicator (0=>bdl)
E0
3L
M1
1
E0
3L
M1
2
E0
3L
M2
1
E0
3L
M2
2
E0
1L
M1
1
E0
1L
M1
2
E0
1L
M2
1
E0
1L
M2
2
E0
2L
M1
1
E0
2L
M1
2
E0
2L
M2
1
E0
2L
M2
2
LR
ML
M1
1
LR
ML
M1
2
LR
ML
M2
1
LR
ML
M2
2
Lab ID
LA
WA
23
-EP
A
LA
WA
44
-EP
A
OR
PL
B2
-EP
A
LR
M ID
0 0.04 0.19 Targeted
SRNL-STI-2016-00095Revision 0
A-37
Exhibit A-2. Plots of Oxide Measurements by Glass Identifier by Grouped by Targeted Concentrations (continued)
Analyte=P2O5 (wt%), Prep Method=LMVariability Chart for Measured
Mea
sure
d
0.25
0.3
0.35
0.4
0.45
0 0 0 0 0 0 0 0 0 0 0 0 1 1 1 1 BDL Indicator (0=>bdl)
E0
1L
M1
1
E0
1L
M1
2
E0
1L
M2
1
E0
1L
M2
2
E0
3L
M1
1
E0
3L
M1
2
E0
3L
M2
1
E0
3L
M2
2
E0
2L
M1
1
E0
2L
M1
2
E0
2L
M2
1
E0
2L
M2
2
LR
ML
M1
1
LR
ML
M1
2
LR
ML
M2
1
LR
ML
M2
2
Lab ID
LA
WA
44
-EP
A
LA
WA
23
-EP
A
OR
PL
B2
-EP
A
LR
M ID
0.03 0.08 0.23 0.54 Targeted
SRNL-STI-2016-00095Revision 0
A-38
Exhibit A-2. Plots of Oxide Measurements by Glass Identifier by Grouped by Targeted Concentrations (continued)
Analyte=Re2O7 (wt%), Prep Method=LMVariability Chart for Measured

SRNL-STI-2016-00095Revision 0
A-39
Exhibit A-2. Plots of Oxide Measurements by Glass Identifier by Grouped by Targeted Concentrations (continued)
Analyte=SiO2 (wt%), Prep Method=PFVariability Chart for Measured
Mea
sure
d
E02
PF
11
E02
PF
12
E02
PF
21
E02
PF
22
E03
PF
11
E03
PF
12
E03
PF
21
E03
PF
22
E01
PF
11
E01
PF
12
E01
PF
21
E01
PF
22
LR
MP
F11
LR
MP
F12
LR
MP
F21
LR
MP
F22
OR
PL
B2-
EP
A
LA
WA
23-E
PA
LA
WA
44-E
PA
LR
M

SRNL-STI-2016-00095Revision 0
A-40
Exhibit A-2. Plots of Oxide Measurements by Glass Identifier by Grouped by Targeted Concentrations (continued)
Analyte=SnO2 (wt%), Prep Method=LMVariability Chart for Measured

SRNL-STI-2016-00095Revision 0
A-41
Exhibit A-2. Plots of Oxide Measurements by Glass Identifier by Grouped by Targeted Concentrations (continued)
Analyte=SO3 (wt%), Prep Method=LMVariability Chart for Measured
Mea
sure
d
0.1
0.15
0.2
0.25
0.3
0.35
0.4
0.45
0.5
0 0 0 0 0 0 0 0 1 1 1 1 1 1 1 1 BDL Indicator (0=>bdl)
E0
3L
M1
1
E0
3L
M1
2
E0
3L
M2
1
E0
3L
M2
2
E0
1L
M1
1
E0
1L
M1
2
E0
1L
M2
1
E0
1L
M2
2
LR
ML
M1
1
LR
ML
M1
2
LR
ML
M2
1
LR
ML
M2
2
E0
2L
M1
1
E0
2L
M1
2
E0
2L
M2
1
E0
2L
M2
2
Lab ID
LA
WA
23
-EP
A
LA
WA
44
-EP
A
LR
M
OR
PL
B2
-EP
A ID
0.04 0.1 0.3 0.52 Targeted

SRNL-STI-2016-00095Revision 0
A-42
Exhibit A-2. Plots of Oxide Measurements by Glass Identifier by Grouped by Targeted Concentrations (continued)
Analyte=TiO2 (wt%), Prep Method=LMVariability Chart for Measured

SRNL-STI-2016-00095Revision 0
A-43
Exhibit A-2. Plots of Oxide Measurements by Glass Identifier by Grouped by Targeted Concentrations (continued)
Analyte=V2O5 (wt%), Prep Method=LMVariability Chart for Measured

SRNL-STI-2016-00095Revision 0
A-44
Exhibit A-2. Plots of Oxide Measurements by Glass Identifier by Grouped by Targeted Concentrations (continued)
Analyte=ZnO (wt%), Prep Method=LMVariability Chart for Measured

SRNL-STI-2016-00095Revision 0
A-45
Exhibit A-2. Plots of Oxide Measurements by Glass Identifier by Grouped by Targeted Concentrations (continued)
Analyte=ZrO2 (wt%), Prep Method=LMVariability Chart for Measured

SRNL-STI-2016-00095Revision 0
A-46
Exhibit A-3. Acceptability Evaluations for Measurements of the LRM Standard Glass
Overlay Plot Element=Al
Overlay Plot Element=B
Y
LR
MP
F1
1
LR
MP
F1
2
LR
MP
F2
1
LR
MP
F2
2
Y
LR
MP
F1
1
LR
MP
F1
2
LR
MP
F2
1
LR
MP
F2
2

SRNL-STI-2016-00095Revision 0
A-47
Exhibit A-3. Acceptability Evaluations for Measurements of the LRM Standard Glass (continued)
Overlay Plot Element=F
Overlay Plot Element=Fe

SRNL-STI-2016-00095Revision 0
A-48
Exhibit A-3. Acceptability Evaluations for Measurements of the LRM Standard Glass (continued)
Overlay Plot Element=K
Overlay Plot Element=Na

SRNL-STI-2016-00095Revision 0
A-49
Exhibit A-3. Acceptability Evaluations for Measurements of the LRM Standard Glass (continued)
Overlay Plot Element=Si
Overlay Plot Element=Zr

SRNL-STI-2016-00095Revision 0
A-50
Exhibit A-4. Measured versus Targeted Concentrations by Glass ID by Oxide
Analyte=Al2O3 (wt%)
Analyte=B2O3 (wt%)

SRNL-STI-2016-00095Revision 0
A-51
Exhibit A-4. Measured versus Targeted Concentrations by Glass ID by Oxide (continued)
Analyte=CaO (wt%)
Analyte=Cl (wt%)
Y

SRNL-STI-2016-00095Revision 0
A-52
Exhibit A-4. Measured versus Targeted Concentrations by Glass ID by Oxide (continued)
Analyte=Cr2O3 (wt%)
Analyte=Cs2O (wt%)

SRNL-STI-2016-00095Revision 0
A-53
Exhibit A-4. Measured versus Targeted Concentrations by Glass ID by Oxide (continued)
Analyte=F (wt%)
Analyte=Fe2O3 (wt%)

SRNL-STI-2016-00095Revision 0
A-54
Exhibit A-4. Measured versus Targeted Concentrations by Glass ID by Oxide (continued)
Analyte=K2O (wt%)
Analyte=Li2O (wt%)
YY

SRNL-STI-2016-00095Revision 0
A-55
Exhibit A-4. Measured versus Targeted Concentrations by Glass ID by Oxide (continued)
Analyte=MgO (wt%)
Analyte=MnO2 (wt%)
Y

SRNL-STI-2016-00095Revision 0
A-56
Exhibit A-4. Measured versus Targeted Concentrations by Glass ID by Oxide (continued)
Analyte=MoO3 (wt%)
Analyte=Na2O (wt%)
Y

SRNL-STI-2016-00095Revision 0
A-57
Exhibit A-4. Measured versus Targeted Concentrations by Glass ID by Oxide (continued)
Analyte=NiO (wt%)
Analyte=P2O5 (wt%)
Y

SRNL-STI-2016-00095Revision 0
A-58
Exhibit A-4. Measured versus Targeted Concentrations by Glass ID by Oxide (continued)
Analyte=Re2O7 (wt%)
Analyte=SiO2 (wt%)
Y

SRNL-STI-2016-00095Revision 0
A-59
Exhibit A-4. Measured versus Targeted Concentrations by Glass ID by Oxide (continued)
Analyte=SnO2 (wt%)
Analyte=SO3 (wt%)
YY

SRNL-STI-2016-00095Revision 0
A-60
Exhibit A-4. Measured versus Targeted Concentrations by Glass ID by Oxide (continued)
Analyte=TiO2 (wt%)
Analyte=V2O5 (wt%)
YY

SRNL-STI-2016-00095Revision 0
A-61
Exhibit A-4. Measured versus Targeted Concentrations by Glass ID by Oxide (continued)
Analyte=ZnO (wt%)
Analyte=ZrO2 (wt%)
Y

SRNL-STI-2016-00095Revision 0
A-62
Exhibit A-4. Measured versus Targeted Concentrations by Glass ID by Oxide (continued)
Analyte=Sum of Oxides
SRNL-STI-2016-00095Revision 0
Distribution:
J. W. Amoroso, 999-WT. B. Brown, 773-AH. H. Burns, 773-41AA. S. Choi, 999-WA. D. Cozzi, 999-WC. L. Crawford, 773-42AD. E. Dooley, 999-WA. P. Fellinger. 773-42AS. D. Fink, 773-AK. M. Fox, 999-WV. Gervasio, PNNLE. K. Hansen, 999-WC. C. Herman, 773-AE. N. Hoffman, 999-WJ. E. Hyatt, 773-AC. M. Jantzen, 773-A
F. C. Johnson, 999-WD. S. Kim, PNNLA. A. Kruger, DOE-ORPD. J. McCabe, 773-42AD. L. McClane, 999-WD. H. Miller, 999-WD. K. Peeler, PNNLF. M. Pennebaker, 773-42AM. R. Poirier, 773-42AM. J. Schweiger, PNNLM. E. Stone, 999-WC. L. Trivelpiece, 999-WJ. D. Vienna, PNNLB. J. Wiedenman, 773-42AW. R. Wilmarth, 773-ARecords Administration (EDWS)