chemical composition of surface sediments on the sea floor
TRANSCRIPT

Chemical Composition of Surface Sediments on the Sea Floor Walter E. Dean and James V. Gardner
Summary and Introduction Sediments cover most of the sea floor in the Gulf of the Farallones, with a few areas of
exposed bedrock. To help determine the origin and distribution of these sediments, 112 core samples were taken by the U.S. Geological Survey at sites on the sea floor from the shallow shelf down to a water depth of about 3,000 m (10,000 ft). These samples were analyzed for 28 major and trace elements, organic carbon, and calcium carbonate.
Many factors have affected the history, transport, and distribution of sediments in the Gulf of the Farallones, including the shape of the sea floor, sea-level fluctuations, and current patterns. The Continental Shelf in much of the gulf has a low gradient of about 0.1°, and water depth ranges from less than 50 m (160 ft) to about 120 m (400 ft). The Continental Slope in much of the gulf has a steeper gradient of about 3°, and water depth reaches about 3,200 m (10,500 ft) at its base. Although the shelf is uncut by channels and canyons, the upper slope is incised with numerous gullies and submarine canyons, including Pioneer Canyon (fig. 1).
Before 500,000 years ago, the main sources of sediment to the Gulf of the Farallones were the nearby onshore areas with their variety of sedimentary, metamorphic, and igneous rocks. About 500,000 years ago, drainage from interior California broke through to the Pacific Ocean at the Golden Gate, providing additional sources of sediment from as far away as the Sierra Ne-vada. The Continental Shelf between the Golden Gate and the Farallon Islands is covered with sandy sediment, which has been repeatedly reworked by fluctuations in sea level and great (100-year) storms. Major lowerings of sea level during global glaciations have exposed the shelf in the gulf as dry land several times, most recently from about 20,000 to 15,000 years ago. In these glacial periods, sea level was lowered by hundreds of feet, because of the large amount of water tied up in ice sheets on land. During these lowstands, a river probably coursed across all of what is now the Continental Shelf in the gulf, although no channel has yet been identified. About15,000 years ago, rising sea level caused by the melting of the ice sheets once again drowned the Continental Shelf.
Water movement in the Gulf of the Farallones affects the distribution of sediment on the sea floor and the movement of sediment across the Continental Shelf to the deep sea (see chapter on Current Patterns over the Continental Shelf and Slope). The main oceanographic influences on circulation in the gulf include the southward-flowing California Current during the winter and the northward-flowing California Undercurrent during the summer (fig. 1). Strong offshore currents can also be caused by summer northwesterly winds, leading to coastal upwelling of cold water. Currents generated by tides also help account for the seaward transport of sediment in the gulf.
The results of chemical analysis of the core samples collected from the sea floor in the Gulf of the Farallones can be used as “fingerprints” to identify sources and transport patterns of sediment (see chapter on Heavy-Mineral Provinces on the Continental Shelf). The sandy sedi-ments on the Continental Shelf between the Golden Gate and the Farallon Islands contain abun-dant heavy minerals that are rich in iron, magnesium, titanium, phosphorus, and many trace elements. The sediments immediately adjacent to the Farallon Islands contain low concentrations
101

of heavy minerals and the chemical elements associated with them; instead, these sediments are rich in silica (SiO2). Sediments deposited on the Continental Slope have higher contents of organic matter and clay and, consequently, have higher concentrations of elements associated with clay minerals, such as aluminum, lithium, potassium, and sodium. Calcium carbonate (CaCO3), mainly from the shells of pelecypods (oysters, clams, and mussels), is a very minor constituent of surface sediments in the gulf.
MethodsA total of 93 Soutar Van Veen cores were collected from the shelf in 1989, and 19 gravity
cores were collected from the slope in 1990 (fig. 1). Surface grain-size measurements were made on samples from all Van Veen and gravity cores (Maher and others, 1991; Karl, 1992). Splits of the Van Veen and gravity core samples for geochemical analyses were air dried and ground in a ceramic mill. Concentrations of 10 major elements (Si, Al, Fe, Mg, Ca, Na, K, Ti, P, Mn) were measured by wavelength-dispersive X-ray-fluorescence spectrometry. Concentrations of 27 major and trace elements (Al, Fe, Mg, Ca, Na, K, Ti, P, Mn, Ba, Ce, Co, Cr, Cu, Ga, La, Li, Nd, Ni, Pb, Sc, Sr, Th, V, Y, Yb, Zn) were determined by inductively coupled argon-plasma emission spectrometry (Baedecker, 1987). Results of these analyses were reported by Dean and Gardner (1995), along with a discussion of the precision and accuracy of the analytical methods.
Concentrations of total carbon and carbonate carbon were determined by coulometry (Engleman and others, 1985) on splits of the geochemistry samples. Organic-carbon contents were determined by the difference between total carbon and carbonate carbon. Calcium carbon-ate (CaCO3) content was calculated by dividing the carbonate-carbon content by 0.12, the mole fraction of carbon in CaCO3.
Multivariate analysis of the geochemical data was carried out by Q-mode factor analysis. The computer program used is a modified version of the extended CABFAC program (Klovan and Miesch, 1976; Miesch, 1981).
Distribution of Grain Size Grain-size measurements of surficial sediment on the continental margin in the Gulf of the
Farallones study area were reported by Maher and others (1991) and Karl (1992). Very fine sand dominates the inner shelf and margin (fig. 2), whereas fine to medium sand occurs in a central area of the shelf directly offshore from the Golden Gate. This distribution of coarser sediment on the shelf west of the Golden Gate probably reflects relict sediment from a lowstand deposit or a winnowed lag of San Joaquin-Sacramento River sediment reworked by strong tides and major storms. The area of finer grain size between the Golden Gate and Half Moon Bay probably represents winnowed material that was transported in suspension in the nearshore zone away from the coarser material that lies to the northwest. Some fine sediment is carried as suspended sediment across the San Joaquin-Sacramento River delta, through the Golden Gate, and across the Continental Shelf. As expected, the mean grain size decreases with increasing depth on the slope, with generally coarser grain sizes in Pioneer Canyon (fig. 1).
Distribution of Element Concentrations A multivatiate Q-mode factor analysis was performed on the geochemical data to determine
associations among elements and to objectively determine geographic groupings of samples over
102

the Gulf of the Farallones study area, on the basis of geochemical similarities. The factor analysis reduces the 31 geochemical variables (elements or element oxides) to a much smaller number (typically, three to five) of composite geochemical variables called “factors” based on statistical groupings of elements. The “concentrations” of these composite geochemical variables are called the factor loadings. Several computations were made by using two different similarity coeffi-cients (correlation coefficient and cosine theta) and three different types of factor axes in multidi-mensional space (principal components, varimax rotation, and oblique rotation). Most runs produced two dominant factors: an iron–titanium–rare-earth-element (REE) factor and an or-ganic-clay factor. Most other factors were expressing the variance in one or two elements. Thebest results were obtained using the correlation coefficient as a measure of similarity together with a four-factor model and varimax rotation in four-dimensional space to maximize the vari-ance in the normalized data. To determine which geochemical variables had the most influence in each factor, the factor loadings were correlated with the concentration of each geochemical variable. The results of this correlation analysis are listed in table 1.
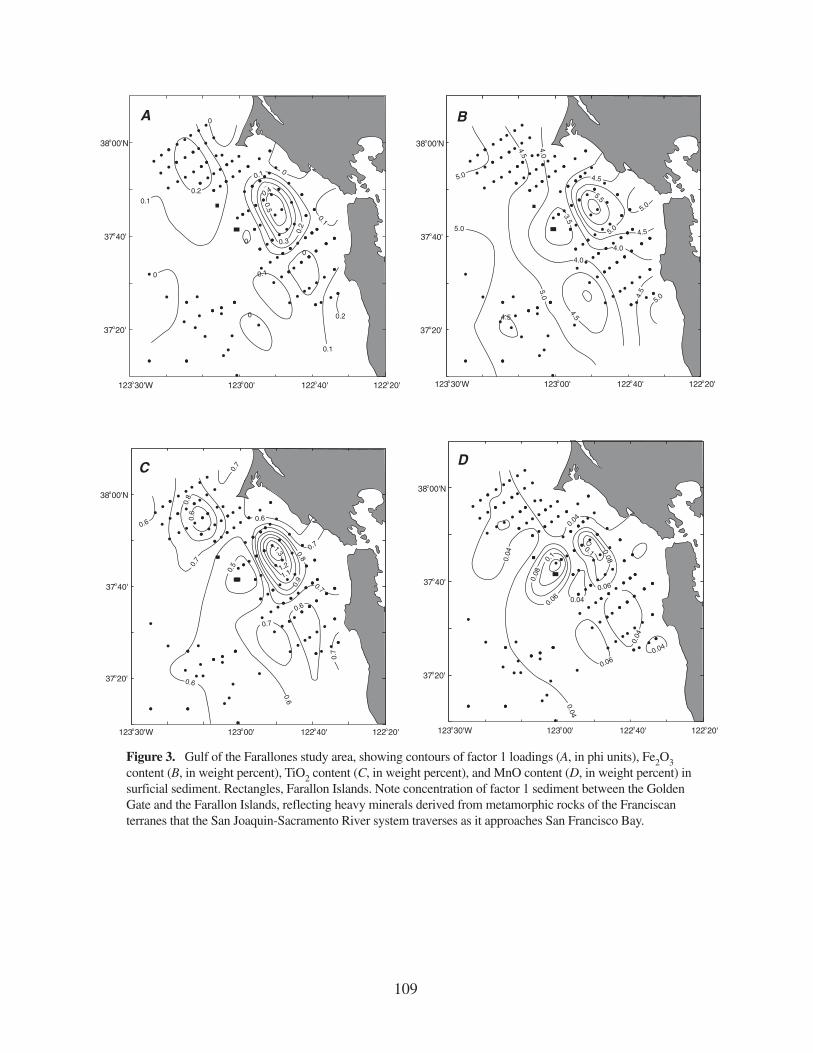
Table 1 shows that factor 1 loadings have high correlation coefficients (r>0.5) with many geochemical variables. Those variables (elements or element oxides) with the most influence on factor 1, in order of decreasing importance (decreasing value of correlation coefficient, table 1), are Nd, Fe2O3, Ce, TiO2, V, La, Y, Yb, MnO, Th, Sc, Cr, Co, P2O5, Zn, and MgO. Contour maps of factor 1 loadings and concentrations of three representative factor 1 element oxides (Fe2O3,TiO2, MnO) over the continental margin in the study area are shown in figure 3.
Sediment with the highest factor 1 loadings (fig. 3A), as typified by Fe2O3 contents greater than 5.0 weight percent and TiO2 contents greater than 1.4 weight percent (figs. 3B, 3C), has maximum concentrations of factor 1 elements in an area between the Golden Gate and the Farallon Islands. Some of the factor 1 elements, illustrated by MnO in figure 3D but also by La, Ce, Th, and Cr (table 1), show a minor concentration of factor 1 centered on the Farallon Islands, whereas other factor 1 elements (Fe2O3, TiO2, P2O5, MgO) have low concentrations in sediment around the Farallon Islands. This distribution of factor 1 sediment falls within the sand-rich belt around the Farallon Islands and reflects deposits of heavy-mineral components in relict sediment that has been continuously reworked by fluctuations in sea level and major (100 yr) storms. Theheavy minerals probably were derived from metamorphic rocks of the Franciscan terranes that the San Joaquin-Sacramento River system traverses as it approaches San Francisco Bay. Thebull’s-eye of relatively low values of Fe2O3 and TiO2 (figs. 3B, 3C), as well as P2O5 and MgO, around the Farallon Islands probably reflects the composition of sand derived from the granitic Farallon Islands.
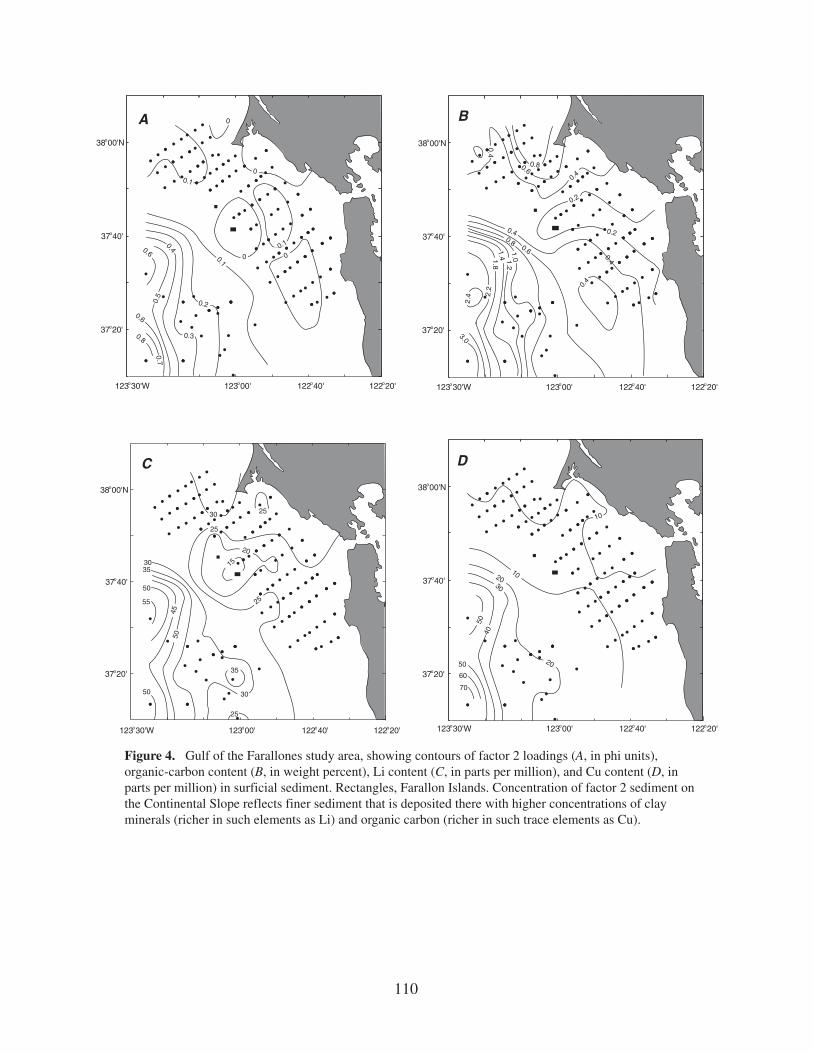
Those variables (elements or element oxides) with the most influence on factor 2, in order of decreasing importance (decreasing value of correlation coefficient, table 1), are Li, organic C, Na2O, Cu, Ni, Ba, Zn, K2O, Al2O3, and MgO. Contour maps of factor 2 loadings and concentra-tions of three representative factor 2 elements (Li, organic C, Cu) over the continental margin in the study area are shown in figure 4.
The distribution of sediment with high factor 2 loadings (fig. 4A) reflects the downslope de-crease in grain size (fig. 2) and the concomitant increase in organic-carbon content (fig. 4B). This relation can be seen in a plot of mean grain size versus organic-carbon content (fig. 5A). The finersediment (higher phi values) contains more organic carbon. The finer sediment contains more clay minerals that commonly are enriched in Li (figs. 4C, 5B), Na2O, K2O, Al2O3, and MgO. Thus, these elements and element oxides had major influences on factor 2 loadings (table 1). The higher Cu, Ni,
103

and Zn contents in factor 2 sediment are related to enrichment of these metals in organic-carbon-rich sediment (Vine and Tourteot, 1970; Holland, 1979). The relations between organic-carboncontent and the concentrations of these three metals (fig. 6) are clearer in the finer, organic-carbon-rich slope sediment. The organic-carbon contents (fig. 5B) are relatively high for a continental shelf and margin, reflecting the high productivity supported by the nutrient-rich seasonal upwelling of the California Current system. Higher Ba contents associated with sili-ceous biogenic debris (Dymond and others, 1992) probably account for the higher Ba contents in organic-carbon-rich factor 2 sediment. MgO is associated with both factors 1 and 2 (table 1), reflecting Fe- and Mg-rich heavy minerals in shelf sand (factor 1) and clay minerals in slope mud (factor 2).
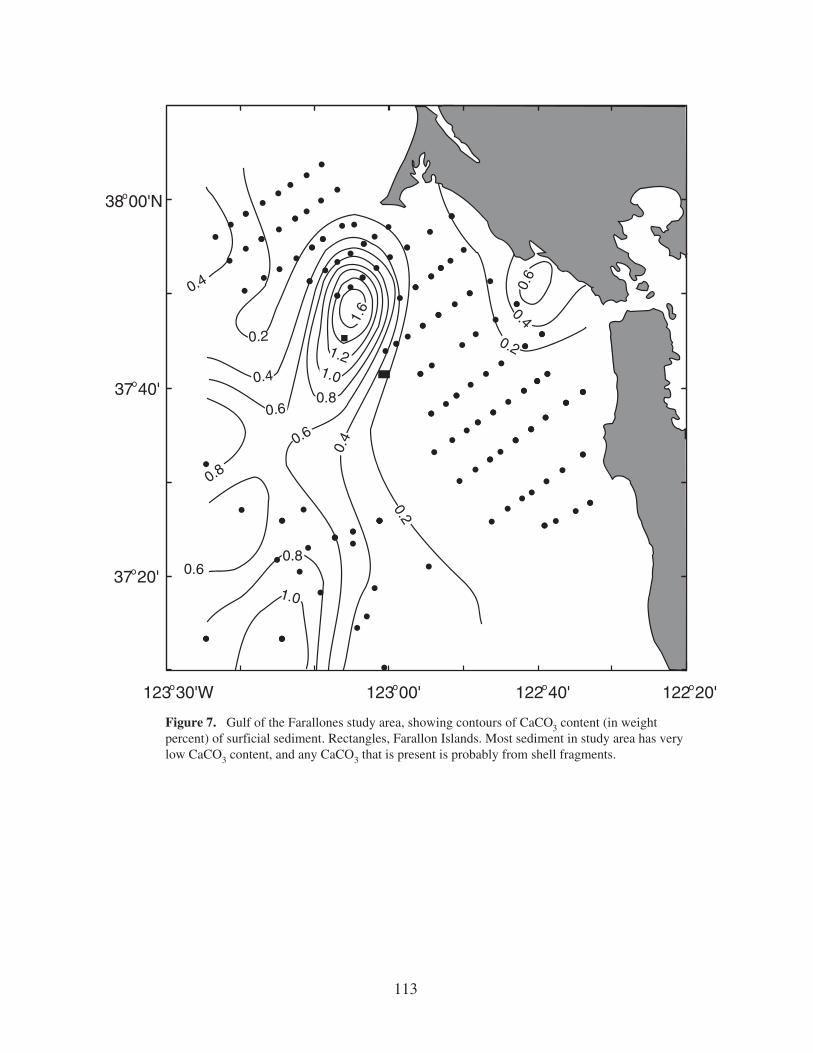
Calcium carbonate is a minor constituent of surficial sediment in the Gulf of the Farallones study area, with values of mostly less than 1 weight percent over the entire continental margin(fig. 7). The distribution of CaCO3 is dominated by a bull’s-eye in the northern part of the study area, probably caused by a few bivalve shell fragments. Factor 3 loadings reflect this distribution of CaCO3 (table 1). Although the Sr content also is correlated with factor 3 loadings (table 1), the distribution of Sr in surficial sediment differs considerably from that of CaCO3, suggesting that most of the Sr is contributed from detrital clastic material rather than from the very little CaCO3that is present.
Table 1 shows that most of the contribution to factor 4 loadings is from SiO2. Minor contri-butions to factor 4 loadings also come from CaO, TiO2, MnO, Ce, La, and Nd, but the variance in these elements and element oxides is mainly accounted for by factor 1 or, for CaO, by factor 3. The SiO2 content over the continental margin in the Gulf of the Farallones study area is mapped in figure 8.
SiO2 contents are generally 67 to 69 weight percent on the shelf and distinctly higher (max 77 weight percent) adjacent to the Farallon Islands, reflecting silica-rich granitic sand shed from the islands. SiO2 contents also tend to decrease downslope, reflecting the downslope increase in clay minerals that generally contain less SiO2 and more Al2O3 than do quartz-rich silt and sand. The higher SiO2 contents on the slope at the south end of the study area probably reflects largeramounts of sand moving down Pioneer Canyon. The contrast in composition between quartz-rich granitic sand and heavy-mineral-rich sand is clearly shown in figure 9 by the negative correlation between SiO2 and Al2O3, Fe2O3, and MgO in shelf sand. Al2O3, Fe2O3, and MgO contents in the fine slope mud are fairly constant, indicating that this mud is more homogeneous than the shelf sand that tends to have pockets of heavy minerals.
ConclusionsThe Continental Shelf between the Golden Gate and the Farallon Islands is covered with
relict sandy sediment that has been repeatedly reworked by fluctuations in sea level and major (100-yr) storms. This sand contains abundant heavy minerals that are rich in Fe, Mg, Ti, P, and many trace elements. The sediments immediately adjacent to the Farallon Islands contain low concentrations of heavy minerals and the chemical elements associated with them. Instead, these sediments are rich in SiO2. Sediments deposited on the Continental Slope (water deeper than 120 m) have higher contents of organic matter and clay, and, consequently, of elements associ-ated with clay minerals, such as Al, Li, K, and Na. A very minor constituent of surface sediments in the Gulf of the Farallones is CaCO3, which constitutes less than 1 percent of sediment over the entire Continental Shelf and Slope in the region.
104

Further Reading Baedecker, P.A., ed., 1987, Geochemical methods of analysis: U.S. Geological Survey Bulletin 1770,
129 p. California Division of Mines and Geology, 1980, Geologic map of California, San Francisco sheet:
Sacramento, scale 1:250,000. Dean, W.E., and Gardner, J.V., 1995, Geochemistry of surface sediments in the Gulf of the Farallones:
U.S. Geological Survey Open-File Report 95–527, 57 p. Dymond, J., Suess, E., and Lyle, M., 1992, Barium in deep-sea sediment; a geochemical proxy for
paleoproductivity: Paleoceanography, v. 7, p. 163–181. Engleman, E.E., Jackson, L.L., Norton, D.R., and Fischer, A.G., 1985, Determination of carbonate
carbon in geological materials by coulometric titration: Chemical Geology, v. 53, p. 125–128. Hall, J.F., 1966, Fleishacker Zoo to Mussel Rock (Merced Formation)—a Plio-Pleistocene nature
walk: California Division of Mines, Geological and Mineral Infomation Service, v. 19, p. S22– S25.
Holland, H.D., 1979, Metals in black shales—a reassessment: Economic Geology, v. 74, p. 1676– 1679.
Huyer, A., Kosro, P.M., Fleischbein, J., Ramp, S.R., Stanton, T., Washburn, L., Chavez, F.P., Cowles, T.J., Pierce, S.D., and Smith, R.L., 1991, Currents and water masses of the coastal transition zone off northern California, June to August, 1988: Journal of Geophysical Research, v. 96, p. 14809–14832.
Karl, H.A., ed., 1992, Comprehensive geological and geophysical survey of the gulf of the Farallones Region, central California: U.S. Geological Survey administrative report to U.S. Environmental Protection Agency, 188 p.
Klovan, J.E., and Miesch, A.T., 1976, Extended CABFAC and QMODEL computer programs for Q-mode factor analysis of compositional data: Computers and Geosciences, v. 1, p. 161–178.
Maher, N.M., Karl, H.A., Chin, J.L., and Schwab, W.C., 1991, Station locations and grain-size analy-sis of surficial sediment samples collected on the continental shelf, Gulf of the Farallones during cruise F2–89–NC, January, 1989: U.S. Geological Survey Open-File Report 91–375–A, 42 p.
Miesch, A.T., 1981, Computer methods for geochemical and petrologic mixing problems, in Merriam,D.F., ed., Computer applications in the earth sciences: New York, Plenum, p. 244–265.
Noble, M., and Gelfenbaum, G., 1990, A pilot study of currents and suspended sediment in the Gulf of the Farallones: U.S. Geological Survey Open-File Report 90–476.
Noble, M., Ramp, S.R., and Kinoshita, K., 1992, Current patterns over the shelf and slope adjacent to the Gulf of the Farallones; executive summary: U.S. Geological Survey Open-File Report 92– 382, 26 p.
Ramp, S.R., Jessen, P.F., Brink, K.H., Niiler, P.P., Daggett, F.L., and Best, J.S., 1991, The physical structure of cold filaments near Point Arena, California, during June, 1987: Journal of Geophysi-cal Research, v. 96, p. 14859–14884.
Strub, P.T., Kosro, P.M., and Huyer, A., 1991, The nature of the cold filaments in the California Current system: Journal of Geophysical Research, v. 96, p. 14743–14768.
Vine, J.D., and Tourtelot, E.B., 1970, Geochemistry of black shales—a summary report: Economic Geology, v. 65, p. 253–272.
Washburn, L., Swenson, M.S., Largier, J.L., Kosro, P.M., and Ramp, S.R., 1993, Cross-shelf sediment transport by an anticyclonic eddy off northern California: Science, v. 261, p. 1560–1564.
105
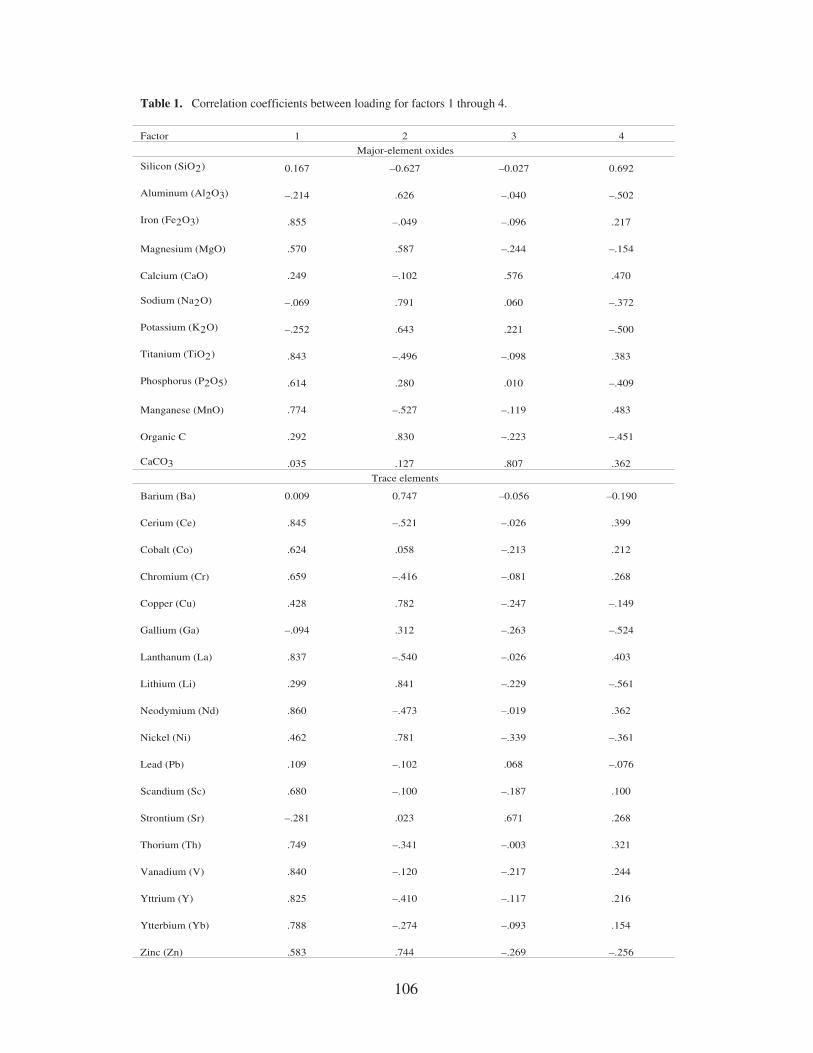
Table 1. Correlation coefficients between loading for factors 1 through 4.
Factor 1 2 3 4
Major-element oxides
Silicon (SiO2) 0.167 –0.627 –0.027 0.692
Aluminum (Al2O3) –.214 .626 –.040 –.502
Iron (Fe2O3) .855 –.049 –.096 .217
Magnesium (MgO) .570 .587 –.244 –.154
Calcium (CaO) .249 –.102 .576 .470
Sodium (Na2O) –.069 .791 .060 –.372
Potassium (K2O) –.252 .643 .221 –.500
Titanium (TiO2) .843 –.496 –.098 .383
Phosphorus (P2O5) .614 .280 .010 –.409
Manganese (MnO) .774 –.527 –.119 .483
Organic C .292 .830 –.223 –.451
CaCO3 .035 .127 .807 .362
Trace elements
Barium (Ba) 0.009 0.747 –0.056 –0.190
Cerium (Ce) .845 –.521 –.026 .399
Cobalt (Co) .624 .058 –.213 .212
Chromium (Cr) .659 –.416 –.081 .268
Copper (Cu) .428 .782 –.247 –.149
Gallium (Ga) –.094 .312 –.263 –.524
Lanthanum (La) .837 –.540 –.026 .403
Lithium (Li) .299 .841 –.229 –.561
Neodymium (Nd) .860 –.473 –.019 .362
Nickel (Ni) .462 .781 –.339 –.361
Lead (Pb) .109 –.102 .068 –.076
Scandium (Sc) .680 –.100 –.187 .100
Strontium (Sr) –.281 .023 .671 .268
Thorium (Th) .749 –.341 –.003 .321
Vanadium (V) .840 –.120 –.217 .244
Yttrium (Y) .825 –.410 –.117 .216
Ytterbium (Yb) .788 –.274 –.093 .154
Zinc (Zn) .583 .744 –.269 –.256
106

••
••
••
•
••
•
• •
• ••
••
••
••
••
••
• •• •
••
••
••
••
••
••
••
•
•••
•
• ••
•
••
••
38°00'N
37°30'
80
80
80
40120
160
200
80010002000
120
200
1000
2000
•
••
••
• ••
•
•
•
••
•
•
•
• •
•
•
••
•
•
•
•
•
•
••
•
••
•
•
•
•
•
••
•
•
•
••
•
•
•
•
••
•
•
•
•
•
•
HalfMoonBay
FarallonIslands
Golden Gate
Pioneer Canyon
SFBay
Sample locations
Surface current
Undercurrent
SanFrancisco
400
CC DC
Pt. Reyes
0 20 km
10 mi 0
123°30'W 123°00' 122°30'
Figure 1. Gulf of the Farallones study area, showing locations of cores, bathymetry, surface currents, and shorelines of the California margin from latitude 37°10' to 38°10' N. and from long 122°20' to 123°30' W. CC, average position of the California Current; DC, seasonal location of the California Undercurrent. Outer edge of the Continental Shelf is at about 120 m (400 ft) water depth. Bathymetry in meters (1 m = 3.281 ft).
107

o38 00'N
o37 40'
o37 20'
5.5 5.
0
2.5
2.0
4.56.06.57.07.5
4.0
3.5
2.5 3.0
3.0
2.53.0
3.0
4.0
3.5
4.5
3.04.0
o o o o123 30'W 123 00' 122 40' 122 20'
Figure 2. Gulf of the Farallones study area, showing contours of mean grain size (in phi units) of surficial sediment: 2–3, fine sand; 3–4, very fine sand; 4–6, coarse silt; 6–7, medium silt; 7–9, fine silt. Rectangle, the main Farallon Islands.
108
o38 00'N
o37 40'
o37 20'
0.1
0.1
0.1
0.2
0.4
0.5
0.2
0
0
0.1
0.3
0.1
0.2
0
0
0
0
A
o o o o123 30'W 123 00' 122 40' 122 20'
o38 00'N
o37 40'
o37 20' 0.6
0.6
0.7
0.7
0.9
0.6
0.50.
7
0.7
0.6
0.6
0.8
0.6
0.71.3
0.7
1.11.2
0.8
C
o o o o123 30'W 123 00' 122 40' 122 20'
o38 00'N
o37 40'
o37 20'
4.5
4.0
4.5
5.0
5.0
4.5
5.0
4.0
4.55.0
5.5
5.0
4.5
3.5
4.0
4.5
5.0
B
o o o o123 30'W 123 00' 122 40' 122 20'
o38 00'N
o37 40'
o37 20'
0.04
0.04
0.04
0.04
0.04
0.06
0.06
0.08
0.10.1
0.08
0.040.06
D
o o o o123 30'W 123 00' 122 40' 122 20'
Figure 3. Gulf of the Farallones study area, showing contours of factor 1 loadings (A, in phi units), Fe2O3content (B, in weight percent), TiO2 content (C, in weight percent), and MnO content (D, in weight percent) in surficial sediment. Rectangles, Farallon Islands. Note concentration of factor 1 sediment between the Golden Gate and the Farallon Islands, reflecting heavy minerals derived from metamorphic rocks of the Franciscan terranes that the San Joaquin-Sacramento River system traverses as it approaches San Francisco Bay.
109
0.1
0.1
0.1
0.40.6
0.6
0.8
0.7
0.5
0.2
0.3
0
0
0
0
A
0.6
0.4
0.8
0.4
0.2
0.2
0.4
0.4
0.6
0.8
1.01.2
3.0
1.41.8
2.4 2.
2
0.4
Bo38 00'N o38 00'N
o o37 40' 37 40'
o o37 20' 37 20'
o o o o o o o o123 30'W 123 00' 122 40' 122 20' 123 30'W 123 00' 122 40' 122 20'
oo38 00'N
30
20
15
25
25
25
3035
55
50
50
35
30
25
5045
C
38 00'N
o o37 40' 37 40'
o o37 20' 37 20'
2030
10
20
10
5040
50
60
70
D
o o o oo o o o123 30'W 123 00' 122 40' 122 20' 123 30'W 123 00' 122 40' 122 20'
Figure 4. Gulf of the Farallones study area, showing contours of factor 2 loadings (A, in phi units), organic-carbon content (B, in weight percent), Li content (C, in parts per million), and Cu content (D, in parts per million) in surficial sediment. Rectangles, Farallon Islands. Concentration of factor 2 sediment on the Continental Slope reflects finer sediment that is deposited there with higher concentrations of clay minerals (richer in such elements as Li) and organic carbon (richer in such trace elements as Cu).
110

4
ppm
Li
Per
cent
Org
anic
C 3
2
1
0 1 2 3 4 5 6 7 8
shelf
slope
A
Mean Grain Size (phi) 60
50
40
30
20
10 1 2 3 4 5 6 7 8
shelf
slope
B
Mean Grain Size (phi) Figure 5. Mean grain size of surficial sediment in Gulf of the Farallones study area from shelf and slope cores (see fig. 2) versus organic-carbon content (A) and Li content (B). Finer sediment (higher phi values) concentrates more clay minerals (richer in such elements as Li) and organic carbon.
111

100
80
60
40
20
0
slope
shelf
A
ppm
Cu
0 0.5 1 1.5 2 2.5 3 3.5Percent Corg
slope
shelf
B
0 0.5 1 1.5 2 2.5 3 3.5Percent Corg
slope
shelf
C
0 0.5 1 1.5 2 2.5 3 3.5Percent Corg
Figure 6. Organic-carbon content versus Cu (A), Ni (B), and Zn (C) contents of surficial sediment in Gulf of the Farallones study area from shelf and slope cores. Organic-carbon-rich sediment commonly is enriched in certain trace elements, such as Cu, Ni, and V.
112
100
80
60
40
20
140
120
100
80
60
40
20
ppm
Zn
ppm
Ni
113
Figure 7. Gulf of the Farallones study area, showing contours of CaCO3 content (in weightpercent) of surficial sediment. Rectangles, Farallon Islands. Most sediment in study area has verylow CaCO3 content, and any CaCO3 that is present is probably from shell fragments.
1.0
0.2
0.2
0.4
0.6
0.8
0.8
1.6
1.21.0
0.8
0.6
0.4
0.6
0.2
0.4
0.6
0.4
123 30'Wo
37 20'o
37 40'o
38 00'No
123 00'o 122 40'o 122 20'o

114
69
66 67
6768
64
65
63
61
6768
66
62
66
74
71
71
70
72 73
69
69
6867
70
69
123 30'Wo
37 20'o
37 40'o
38 00'No
123 00'o 122 40'o 122 20'o
Figure 8. Gulf of the Farallones study area, showing contours of SiO2 content (in weight percent)of surficial sediment. Rectangles, Farallon Islands. SiO2-rich sediment near the Farallon Islandsreflects quartz-rich sand derived from erosion of granitic rocks that make up the islands.

15
10
MgO
Fe2O3
Al 2O3
55 60 65 70 75
Percent SiO2
Figure 9. SiO2 content versus Fe2O3 (circles), MgO (diamonds), and Al2O3 (triangles) contents of surficial sediment in Gulf of the Farallones study area from shelf (open symbols) and slope (solid symbols) cores. Lines through slope and shelf data are linear regressions. Quartz-rich shelf sand, such as that near the Farallon Islands (fig. 8), has lower concentration of heavy minerals rich in Fe2O3, MgO, and Al2O3. Heavy-mineral-rich shelf sand and clay-rich slope mud are relatively poor in quartz and have higher Fe2O3, MgO, and Al2O3 contents. More nearly constant composition of slope mud (little variation in Fe2O3, MgO, and Al2O3 contents) is due to mud being more homogeneous than shelf sand, which tends to have pockets of heavy-mineral-rich or quartz-rich sand. Most variation in SiO2 content of slope mud is probably due to variation in amount of biogenic silica derived from siliceous algae (diatoms) that are predominant phytoplankton on northern California margin.
Per
cent
5
0
115
80