chemical contaminants in oysters and mussels (february 1998)
TRANSCRIPT

Since 1986, the Mussel Watch Project of the National Oceanic and AtmosphericAdministration (NOAA) has chemically analyzed mussels and oysters collectedannually from coastal sites throughout the Nation. Results show that concentrationsof most of the monitored man-made chemicals (e.g., DDT, PCBs) are decreasing.The concentration of cadmium is decreasing as well, but concentrations of othertrace metals have stayed more or less constant. Many chemicals, particularly thosethat are man-made, have high concentration levels near cities. Except in the case oflead, however, there is no apparent association between high concentrations ofother trace elements (e.g., mercury, copper, zine) and urban areas.
To cite this material. This material has been produced by the Government ofthe United States of America and holds no copyright.
The following reference format is suggested:
National Oceanic and Atmospheric Administration (NOAA). 1998 (on-line)."Chemical Contaminants in Oysters and Mussels" by Tom O'Connor. NOAA'sState of the Coast Report. Silver Spring, MD: NOAA.
URL: http://state_of_coast.noaa.gov/bulletins/html/ccom_05/ccom.html

Public concern over the health of the coast led NOAA to initiate its NationalStatus and Trends (NS&T) Program for marine environmental quality.Since 1986, the Mussel Watch Project, one component of the NS&TProgram, has monitored contaminants in the Nation's coastal waters bysampling mollusks (mussels and oysters) and sediments. Its objectives areto determine concentrations of trace metals and groups of organiccompounds at sites on all coasts (Figure 1) and to identify increasing ordecreasing trends. Now, the Mussel Watch Project is providing the longestcontinuous national record of coastal water quality.
Concentrations of chemicals in mollusks are related to the levels ofchemicals in the water that they inhabit and in the food that they filter fromthe water. When chemical concentrations increase or decrease in the waterand in food sources, concentrations increase or decrease in mollusks(Roesijadi et al., 1987; Pruell et al., 1987; Wang et al., 1996). It ispossible to monitor chemical concentrations in water and in suspendedparticles, but for many technical reasons, it is simpler to measureconcentrations in mollusks. This, together with their immobility, makesmussels and oysters ideal for monitoring changes in chemicalconcentrations at fixed locations.
Table 1 lists the contaminants monitored in the Mussel Watch Project.These trace metals and organic compounds can be toxic to marine life andhumans under some conditions. In small quantities, however, trace metalsare essential to the maintenance of life (Nielsen, 1988).
Table 1. Chemicals measured in the Mussel WatchProject
Trace Metals
Arsenic (As) Nickel (Ni) Cadmium (Cd) Mercury (Hg) Copper (Cu) Selenium (Se) Lead (Pb) Zinc (Zn)
Organic Compounds
Total DDT ( DDT)Total Chlordane ( Cdane)Total Dieldrin ( Dield)Total Polychlorinated Biphenyls ( PCBs)Total Polycyclic Aromatic Hydrocarbons ( PAHs)Total Butyltin ( BT)
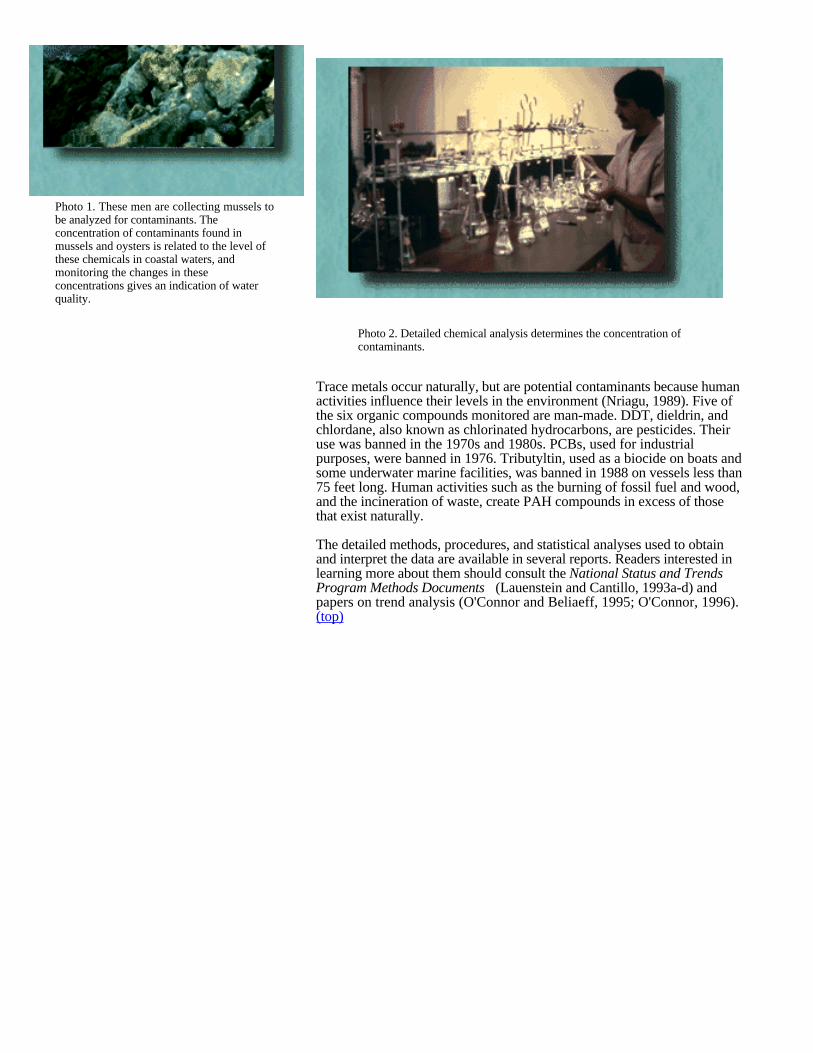
Photo 1. These men are collecting mussels tobe analyzed for contaminants. Theconcentration of contaminants found inmussels and oysters is related to the level ofthese chemicals in coastal waters, andmonitoring the changes in theseconcentrations gives an indication of waterquality.
Photo 2. Detailed chemical analysis determines the concentration ofcontaminants.
Trace metals occur naturally, but are potential contaminants because humanactivities influence their levels in the environment (Nriagu, 1989). Five ofthe six organic compounds monitored are man-made. DDT, dieldrin, andchlordane, also known as chlorinated hydrocarbons, are pesticides. Theiruse was banned in the 1970s and 1980s. PCBs, used for industrialpurposes, were banned in 1976. Tributyltin, used as a biocide on boats andsome underwater marine facilities, was banned in 1988 on vessels less than75 feet long. Human activities such as the burning of fossil fuel and wood,and the incineration of waste, create PAH compounds in excess of thosethat exist naturally.
The detailed methods, procedures, and statistical analyses used to obtainand interpret the data are available in several reports. Readers interested inlearning more about them should consult the National Status and TrendsProgram Methods Documents (Lauenstein and Cantillo, 1993a-d) andpapers on trend analysis (O'Connor and Beliaeff, 1995; O'Connor, 1996).(top)

Contamination Trends
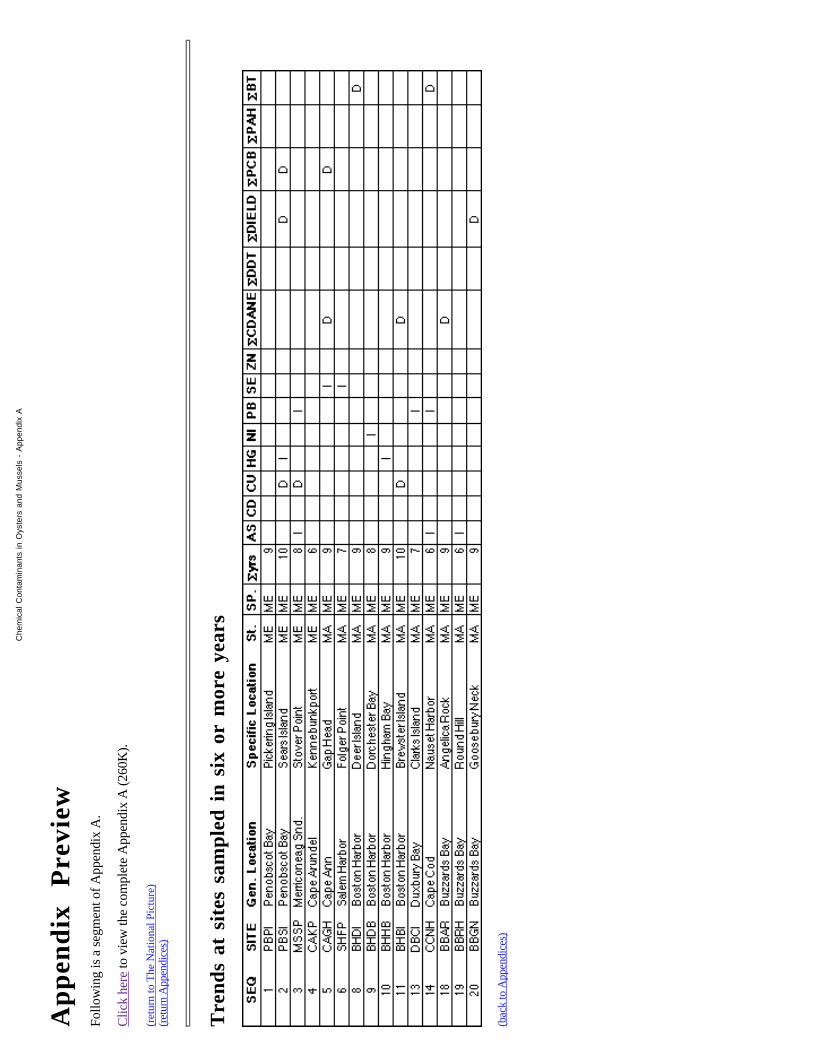
Statistical comparisons of annually measured concentrations in samplesfrom each of the 186 sites that were sampled in at least six years identifiedcontamination trends. Calculations for each chemical at each sampling siteshowed increasing, decreasing, or no trend over time (Appendix A). On thewhole, the most common observation was no trend, but when trends didoccur, decreases greatly outnumbered increases. Contamination isdecreasing for chemicals whose use has been banned (e.g., chlordane,DDT, dieldrin), or severely curtailed (e.g., tributyl tin, cadmium). For otherchemicals, there is no evidence on a national scale for either increasing ordecreasing trends (Table 2).
Table 2. Numbers of sites with increasing,decreasing, or no trend in concentrations of eachchemical.
Chem. Incr. Dec. No Trnd Chem. Incr. Dec. No Trnd
* Cdane 1 81 104 As 11 11 164
* DDT 1 38 147 *Cd 3 28 155
* Dield 1 32 153 Cu 7 14 165
* PCB 1 37 148 Hg 7 9 170
PAH 3 3 180 Ni 6 8 172
* BT 0 18 168 Pb 14 9 163
Se 8 9 169
Zn 7 9 170
*Chemicals with decreasing trends in concentrations in mussels and oysters,1986-1995.
The numbers in Table 2 are the result of a statistical test that identifiesrandom sequences as real trends 5% of the time. Thus, in 186 siteexaminations for each chemical, about 10 of the trends per chemical may bespurious. For this reason, the relatively few trends that appear for most ofthe trace elements and for PAHs have as yet been given little weight.
Statistical correlations were also developed for the median (middle) value ofchemical concentrations among all sites sampled in each year from 1986 to1995. At this national level of aggregation, there were decreasing trendsexist for cadmium, copper in mussels, zinc in mussels, all the chlorinatedorganic compounds, PAH, and BT (Figure 2 and Appendix B). Thecopper, zinc, and ·PAH decreases were not evident in the site-by-siteresults.

Photo 3. Most monitored sites show notrend in chemical concentrations. When atrend was observed, there were far moresites with decreasing than increasingconcentrations.
Photo 4. An oyster is prepared for analysis.
Decreasing trends in contamination are not unexpected. All the chlorinatedhydrocarbons being monitored have been banned for use in the UnitedStates, and tributyl tin has been banned as a biocide on small boats. Theannual industrial use of cadmium in the U.S. decreased during the period of1986 through 1993 (O'Connor and Beliaeff, 1995), and the decreasecontinued through 1996 (Kuck, 1997).
Decreasing trends are good news, but the fact that no chemical has beenincreasing in concentration is perhaps of equal importance. So, at least forthe chemicals monitored by the NS&T Program, contamination of thecoastal United States is not increasing.(top)

Concentration Levels
The 274 Mussel Watch sites are intended to represent large areas rather than"hot spots" of known contamination. Sampling sites (Figure 1) are notuniformly distributed. Within estuaries and embayments, they average about20 km apart; along open ocean coastline, the average separation is 70 km.Almost half the sites are near urban areas within 20 km of urban populationcenters of more than 100,000.
Photo 5. Mussels are sampled at 274 sites around the nation. Halfof those sites are within 20 km of urban areas.
Concentration levels for a chemical are considered high if they exceed thevalues that were established from statistical analyses of all samples taken in1990, the year when the most sites were sampled (Table 3). These levels arenot based on toxic effects of the chemicals on organisms. Instead, a site issaid to have a high concentration of a particular contaminant if the level ofthat contaminant fell within the top 15% of all levels for all sites. A site israted as an area of high concentration if a contaminant's concentration levelexceeds the values in Table 3 in at least half the years in which it wassampled (Appendix C).
Table 3. Concentrations defining the high end of theoverall distribution of concentrations measured inmollusks by the Mussel Watch Project.
Chemical Highconcentration Chemical High
concentration
DDT 140 ppb-dry mercury (Hg) 0.23 ppm-dry
PCB 430 nickel (Ni) 3.3
Chlordane 34 selenium (Se)3.5
Dieldrin 9.1 cadmium(Cd) 6.2
PAH 1100 arsenic (As) 17
BT 300 ppb(as Sn) copper (Cu)1 12 (mussels) 370(oysters)
zinc (Zn)1 200 (mu) 5100 (oy)
lead (Pb)1 4.8 (mu) 0.84 (oy)
1High concentrations for copper, zinc and lead must be calculatedseparately for mussels and oysters.

Many chemicals have high concentrations at sampling sites near cities. Forexample, there is a strong statistical correlation between human populationdensity and chemical concentrations in oysters and mussels for chlordane,DDT, PCBs, PAHs, butyl tins, and lead. For trace metals other than lead,no association of high concentrations with urban areas is evident.
High concentrations of chemicals in mollusks may not diminish the health,longevity, or reproductive capacity of the mollusks or any other organisms.If the organic contaminants or lead are causing biological effects, however,the most likely areas to find these effects would be near the urban areas.(top)

For organic contaminants and lead, there is a clear difference inconcentrations between urban and non-urban sampling sites. For other tracemetals, the differences appear to be more a matter of geography than ofpopulation density. It is important to determine where high concentrationsare not due to human activity, because those concentrations are not subjectto human control.
Urban Sites
Of the 276 Mussel Watch Project sites nationwide, 125 (46%) are urban inthat they are within 20 km of human populations greater than 100,000.Appendix D is a subset of Appendix C containing only the 36 sites in thevicinity of 800,000 or more people; clearly, the organic chemicals, lead,and some other chemicals high concentration levels at many of these sites.Yet, it is not inevitable that mollusks in urban areas have highconcentrations of chemicals. In fact, mollusks at 19 of the 125 urban siteshad no chemical at a high concentration.
Despite the density of people around Seattle, WA, for example, theoccurrences of high concentrations are like those elsewhere in Puget Sound(i.e. common only for PAH). While most sites near San Diego have highconcentrations of several chemicals, there are none at the Mission Bay site.Similarly, mussels from the sites near Los Angeles frequently have highconcentrations of chemicals, but the site in Santa Monica Bay does not.
Photo 6. Many urban sampling sites have high concentrations ofchemicals. However, 15% of urban sites had no highconcentrations at all.
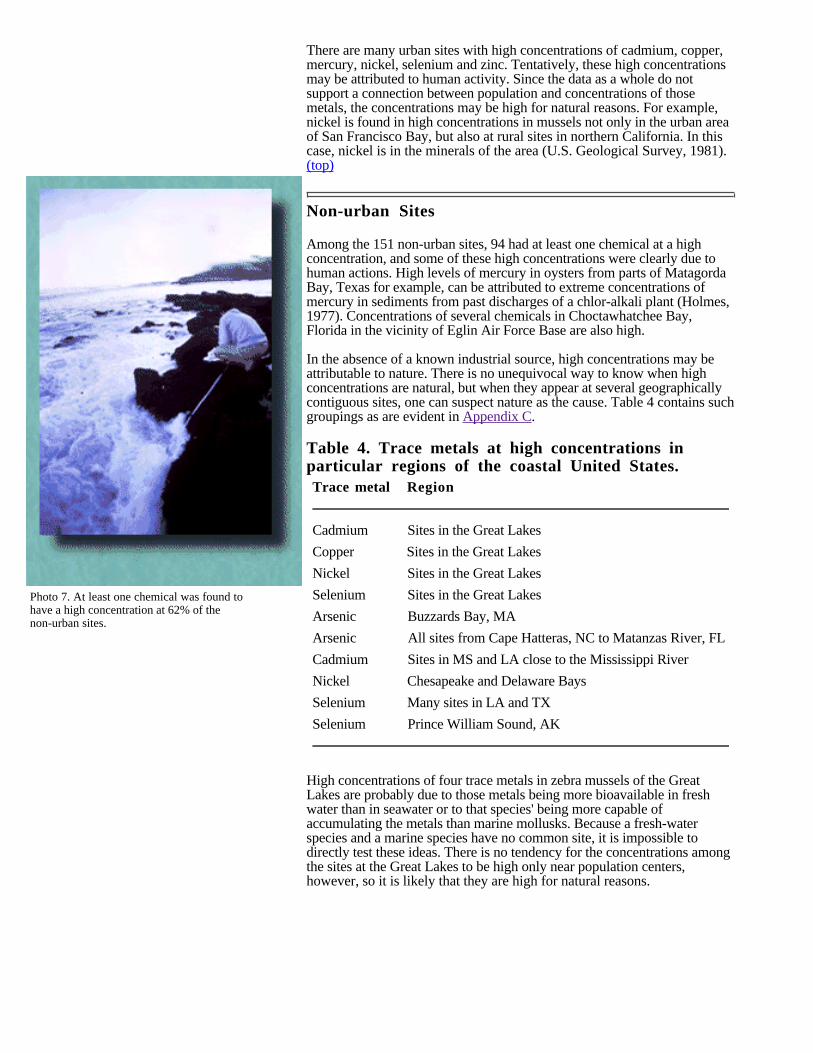
Photo 7. At least one chemical was found tohave a high concentration at 62% of thenon-urban sites.
There are many urban sites with high concentrations of cadmium, copper,mercury, nickel, selenium and zinc. Tentatively, these high concentrationsmay be attributed to human activity. Since the data as a whole do notsupport a connection between population and concentrations of thosemetals, the concentrations may be high for natural reasons. For example,nickel is found in high concentrations in mussels not only in the urban areaof San Francisco Bay, but also at rural sites in northern California. In thiscase, nickel is in the minerals of the area (U.S. Geological Survey, 1981).(top)
Non-urban Sites
Among the 151 non-urban sites, 94 had at least one chemical at a highconcentration, and some of these high concentrations were clearly due tohuman actions. High levels of mercury in oysters from parts of MatagordaBay, Texas for example, can be attributed to extreme concentrations ofmercury in sediments from past discharges of a chlor-alkali plant (Holmes,1977). Concentrations of several chemicals in Choctawhatchee Bay,Florida in the vicinity of Eglin Air Force Base are also high.
In the absence of a known industrial source, high concentrations may beattributable to nature. There is no unequivocal way to know when highconcentrations are natural, but when they appear at several geographicallycontiguous sites, one can suspect nature as the cause. Table 4 contains suchgroupings as are evident in Appendix C.
Table 4. Trace metals at high concentrations inparticular regions of the coastal United States.Trace metal Region
Cadmium Sites in the Great Lakes
Copper Sites in the Great Lakes
Nickel Sites in the Great Lakes
Selenium Sites in the Great Lakes
Arsenic Buzzards Bay, MA
Arsenic All sites from Cape Hatteras, NC to Matanzas River, FL
Cadmium Sites in MS and LA close to the Mississippi River
Nickel Chesapeake and Delaware Bays
Selenium Many sites in LA and TX
Selenium Prince William Sound, AK
High concentrations of four trace metals in zebra mussels of the GreatLakes are probably due to those metals being more bioavailable in freshwater than in seawater or to that species' being more capable ofaccumulating the metals than marine mollusks. Because a fresh-waterspecies and a marine species have no common site, it is impossible todirectly test these ideas. There is no tendency for the concentrations amongthe sites at the Great Lakes to be high only near population centers,however, so it is likely that they are high for natural reasons.
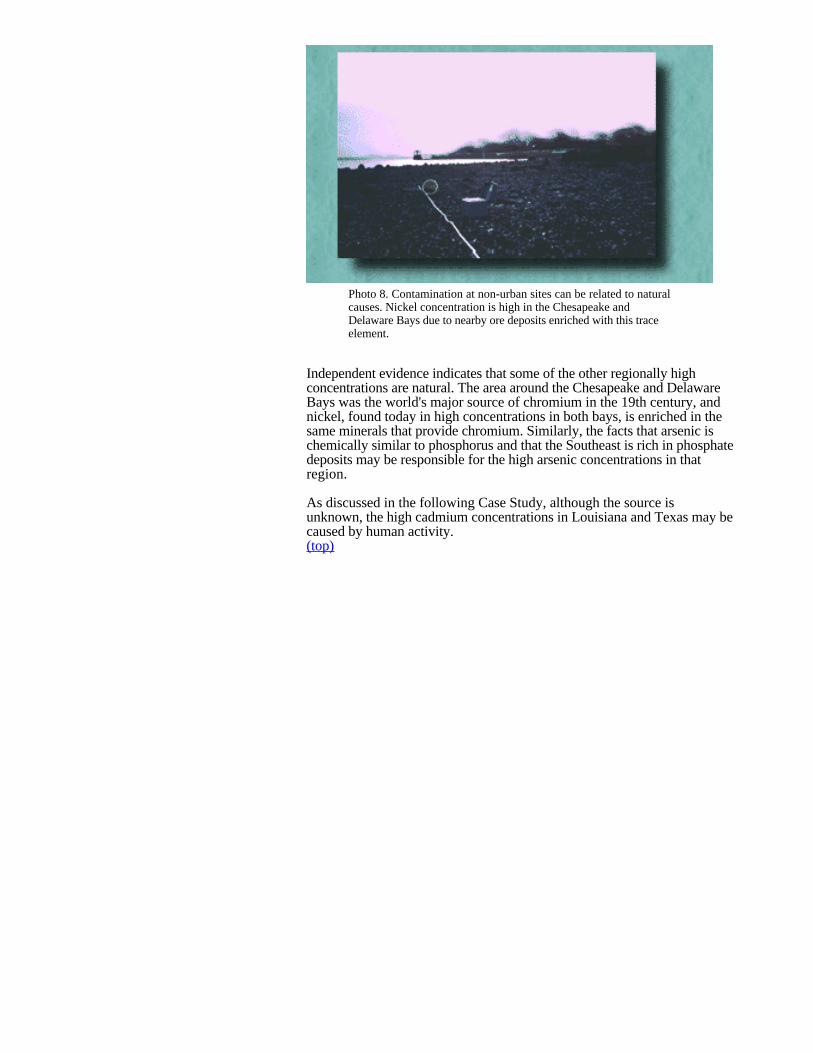
Photo 8. Contamination at non-urban sites can be related to naturalcauses. Nickel concentration is high in the Chesapeake andDelaware Bays due to nearby ore deposits enriched with this traceelement.
Independent evidence indicates that some of the other regionally highconcentrations are natural. The area around the Chesapeake and DelawareBays was the world's major source of chromium in the 19th century, andnickel, found today in high concentrations in both bays, is enriched in thesame minerals that provide chromium. Similarly, the facts that arsenic ischemically similar to phosphorus and that the Southeast is rich in phosphatedeposits may be responsible for the high arsenic concentrations in thatregion.
As discussed in the following Case Study, although the source isunknown, the high cadmium concentrations in Louisiana and Texas may becaused by human activity.(top)

Statistical analyses of concentrations over time identify trends. There isalways a chance that a "trend" is only a random event, but when the samechemical shows the same trend among geographically similar sites, the casefor a statistically valid trend is strong.
Decreases in Cadmium Levels along Populated Coasts
Concentrations of cadmium are decreasing at 11 of the 15 sites betweenNew Haven, Connecticut and the Shark River in New Jersey, the mostdensely populated stretch along the U.S. East Coast. Cadmium levels arealso decreasing at seven of the 13 sites along the densely populated coastbetween Imperial Beach in San Diego and Marina Del Rey in Los Angeles.
Only one of the 28 sites in these two groups is a site with a highconcentration of cadmium. Levels at many other sites are higher, perhapsfor natural reasons. So it is the trend, not the concentration, that reveals thehuman influence.
The trend in the national median, especially these trends in highly populatedareas, should not be natural. In fact, the decreased use of cadmium as ananticorrosive, particularly on automobile bodies, explains the decrease bothacross the nation and along these two highly populated stretches of coast.(top)
Increases in Trace Element Levels near theMississippi River
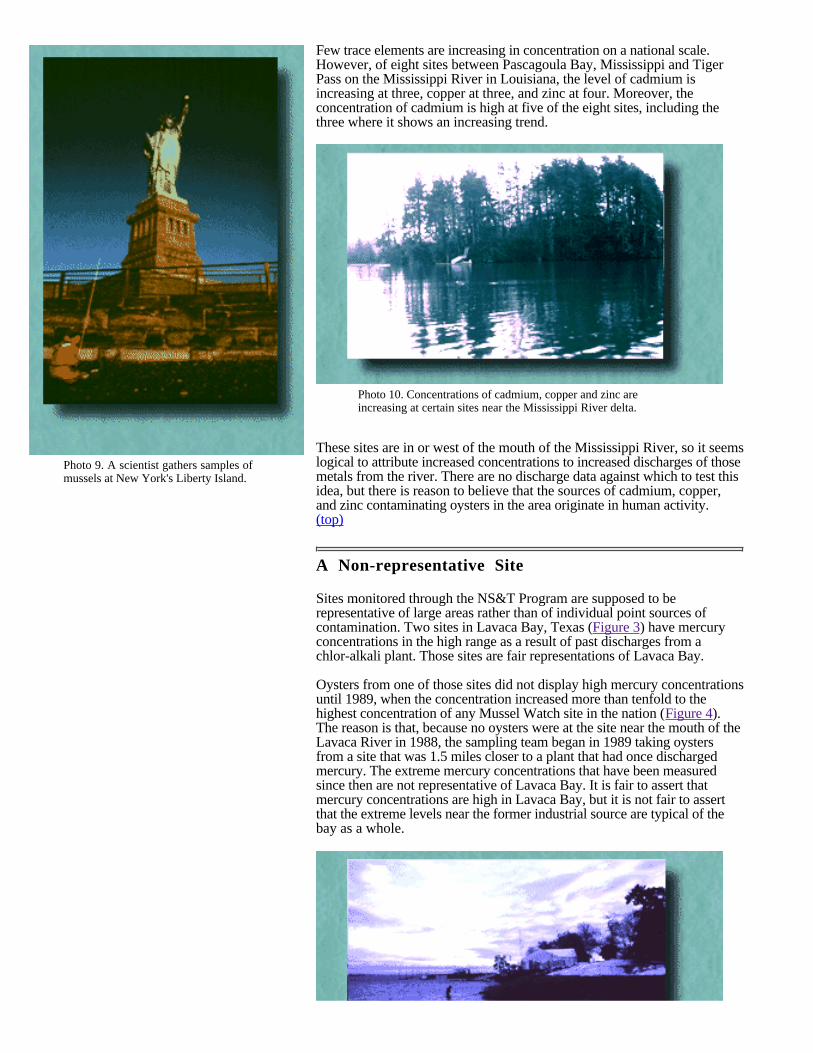
Photo 9. A scientist gathers samples ofmussels at New York's Liberty Island.
Few trace elements are increasing in concentration on a national scale.However, of eight sites between Pascagoula Bay, Mississippi and TigerPass on the Mississippi River in Louisiana, the level of cadmium isincreasing at three, copper at three, and zinc at four. Moreover, theconcentration of cadmium is high at five of the eight sites, including thethree where it shows an increasing trend.
Photo 10. Concentrations of cadmium, copper and zinc areincreasing at certain sites near the Mississippi River delta.
These sites are in or west of the mouth of the Mississippi River, so it seemslogical to attribute increased concentrations to increased discharges of thosemetals from the river. There are no discharge data against which to test thisidea, but there is reason to believe that the sources of cadmium, copper,and zinc contaminating oysters in the area originate in human activity.(top)
A Non-representative Site
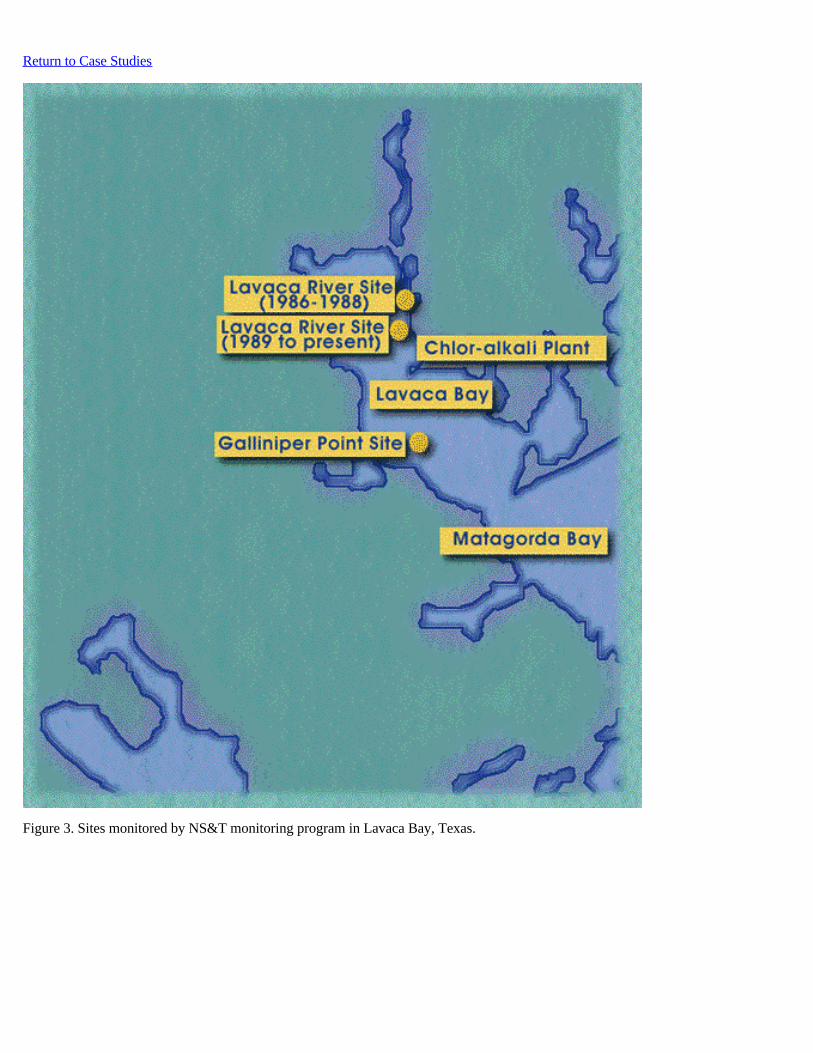
Sites monitored through the NS&T Program are supposed to berepresentative of large areas rather than of individual point sources ofcontamination. Two sites in Lavaca Bay, Texas (Figure 3) have mercuryconcentrations in the high range as a result of past discharges from achlor-alkali plant. Those sites are fair representations of Lavaca Bay.
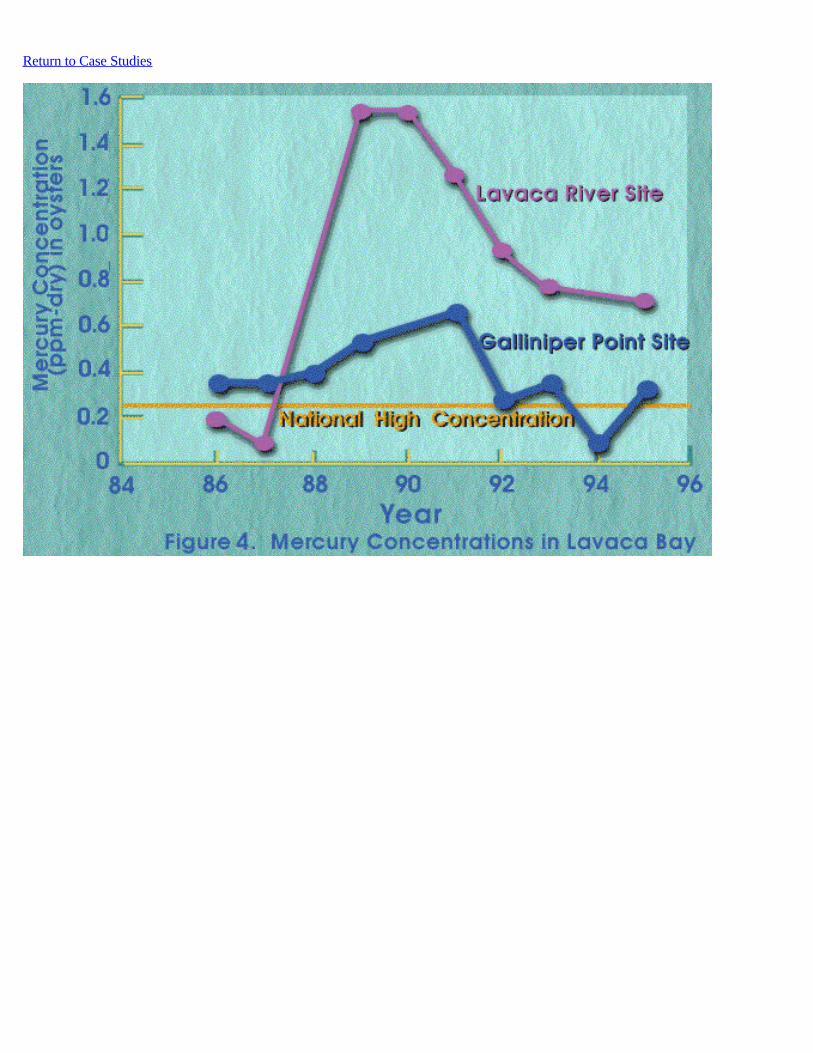
Oysters from one of those sites did not display high mercury concentrationsuntil 1989, when the concentration increased more than tenfold to thehighest concentration of any Mussel Watch site in the nation (Figure 4).The reason is that, because no oysters were at the site near the mouth of theLavaca River in 1988, the sampling team began in 1989 taking oystersfrom a site that was 1.5 miles closer to a plant that had once dischargedmercury. The extreme mercury concentrations that have been measuredsince then are not representative of Lavaca Bay. It is fair to assert thatmercury concentrations are high in Lavaca Bay, but it is not fair to assertthat the extreme levels near the former industrial source are typical of thebay as a whole.

Photo 11. Monitoring sites are intended to be representative oflarge geographic areas. However, past discharges of chemicals cancreate localized concentration anomalies that are not typical of thearea as a whole.
(top)

The three individuals below are experts in the topic of chemical contaminantsin oysters and mussels. Here they voice their opinions on two questionsrelevant to that topic.
Question 1– Do you think that chemical contamination isincreasing or decreasing along your coast?
Question 2 – Do you think that chemical contamination iscausing serious problems along your coast?
Experts
Michael S. Connor Judith McDowell Alan Mearns
Michael S. Connor
Director, Environmental Quality Department,Massachusetts Water Resources Authority
Dr. Connor is an authority on assessing impacts to human and environmentalhealth from the discharge of toxic wastes to marine waters. From 1983 to1986 he developed comprehensive pollution management programs for LongIsland Sound, Narragansett Bay and Buzzards Bay. For the last nine years,Dr. Connor has been responsible for monitoring the recovery of BostonHarbor and the environmental health of the waters in Massachusetts and CapeCod Bays.
Response to Question 1
Response to Question 2
(top)
Question 1. Do you think that chemical contamination isincreasing or decreasing along your coast?
Click here for audio response
(audio requires RealPlayer, see Using this Site)
In the industrialized Northeast, we are seeing great progress in the control ofthe chemicals that most concern us. Generally, the chemical contaminants thatpose the greatest risk to marine life and people are chlorinated pesticides andpolychlorinated biphenyls (PCBs) that can be bioaccumulated in fish andshellfish. Since the use of PCBs and organochlorine pesticides was banned inthe United States in the 1970s, they are slowly disappearing from theenvironment. NOAA's Mussel Watch Program documents this decline. Inaddition, over the last two decades, Boston area scientists have measureddeclining concentrations of PCBs and pesticides in sewage discharges, thewaters of Boston Harbor and Massachusetts Bay, surface sediments in theharbor, and flounder and lobsters growing in the harbor. This decline wasmost accentuated in the 1980s and has slowed somewhat since then. Inaddition, the health of winter flounder growing in the harbor has dramaticallyimproved. In the 1980s, 10% to 15% of these fish had visible liver tumors. Inthe last few years, it's rare to find a tumorous fish.(top)
Question 2. Do you think that chemical contamination is causingserious problems along your coast?
Click here for audio response
(audio requires RealPlayer, see Using this Site)
In the past, polychlorinated biphenyl (PCB) contamination has caused healthadvisories for shellfish in Boston Harbor and has closed the lobster fishery inNew Bedford Harbor. There has been a marked improvement in the health ofwinter flounder growing in the harbor sediments as the sources of chemicalcontamination have been reduced. Ten years ago, much of the harbor bottomwas covered with a "black mayonnaise" of sludge deposits. Since sludgedumping ended in 1991, the harbor has rebounded, and most of the sedimentshave been colonized by amphipods living at the surface-water interface.
As the impact of toxic contamination has decreased due to improvements inpollution prevention and treatment, I believe the relative impact of otherpollution issues is becoming much more important. These issues include thedischarge of nutrients and pathogens, the destruction of marine habitat,overfishing and the release of introduced species.(top)

Judith McDowell
Senior Scientist, Biology Department, WoodsHole Oceanographic Institution
Dr. McDowell joined the Woods Hole Oceanographic Institution in 1975 as apostdoctoral scholar and shortly thereafter was appointed to the scientificstaff. Her research interests have focused on the physiological effects ofcontaminants on marine animals. She has travelled worldwide to examine therelationship of contaminant exposure to biological effects in bivalve molluskpopulations in contaminated estuaries.
Response to Question 1
Response to Question 2
(top)
Question 1. Do you think that chemical contamination isincreasing or decreasing along your coast?
Click here for audio response
(audio requires RealPlayer, see Using this Site)
Toxic chemicals have been discharged to coastal areas from a variety ofsources for decades. During the past two decades, increased efforts in pointsource recovery of contaminants and improved waste treatment as a result ofenforcement of the Clean Water Act have reduced contaminant inputs in manycoastal areas. By most indicators of water quality, coastal habitats areimproving. A major exception to this trend is the accidental spillage ofpetroleum hydrocarbons which continues to present problems in localhabitats.
In spite of these improvements in water quality, many coastal habitatscontinue to be contaminated because of the presence of contaminatedsediments. Approximately 14 to 28 million cubic yards of contaminatedsediments are managed annually in the U.S., an estimated 5% to 10% of allsediments dredged annually in the U.S. Two examples of areas with highlycontaminated sediments are Boston Harbor and New Bedford Harbor, twosites in coastal Massachusetts. For sites such as these where contaminatedsediments pose direct threats to ecological systems and potentially to humanhealth, the problem of managing contaminated sediments is very difficult asdisposal options are not readily available or acceptable.(top)
Question 2. Do you think that chemical contamination is causingserious problems along your coast?
Click here for audio response
(audio requires RealPlayer, see Using this Site)
Although general trends in contaminant distributions in urban areas andadjacent waters, such as Boston Harbor/Massachusetts Bay and New BedfordHarbor, have been defined (e.g., higher concentrations of total polycyclicaromatic hydrocarbons in the inner harbor of Boston, lesser concentrationswith distance from the inner harbor) critical information on the biologicaleffects of chemical contaminants, specifically on population processes, islacking. Because harbor sediments will continue to be a major source ofcontaminants to the ecosystem, even with improvement in water quality fromthe reduction of point source contamination, the potential risks to populationsof marine biota must be defined.
Recent studies of the incidence of tumors and other histopathologicaldisorders in bottom-dwelling fish and shellfish from contaminated coastalareas have suggested a possible link between the levels of lipophilic organiccontaminants and the increased incidence of histopathological conditions. Inaddition to histopathological damage, sublethal toxic effects of contaminantsin marine organisms include impairment of physiological processes that mayalter the energy available for growth and reproduction and other effects onreproductive and developmental processes including direct genetic damage.

Clam populations in Boston Harbor and mussel populations in New BedfordHarbor have reduced reproductive potential and a reduction in physiologicalcondition in addition to a wide range of histopathological conditions.Chemical contamination of fishery resources has also led to fishery closuresor fishery advisories in several areas of the U.S. coastline.(top)
Alan J. Mearns
Biological Assessment Team Leader,Scientific Support Coordination Branch,Hazardous Materials Response andAssessment Division, Office of OceanResources Conservation and Assessment,National Ocean Service, NOAA
For the past 10 years, Dr. Mearns has supported the U.S. Coast Guard withscientific information during the clean-up of oil and hazardous substance spillsin coastal and marine waters. Prior to this he was the leader of a NOAAscientific survery team that conducted a detailed review of long-term historicaltrends in coastal contamination along the entire U.S. coastline. During the1970s he was chief of the Biological Division at the Southern CaliforniaCoastal Water Research Project in Los Angeles.
Response to Question 1
Response to Question 2
(top)
Question 1. Do you think that chemical contamination isincreasing or decreasing along your coast?
Click here for audio response
(audio requires RealPlayer, see Using this Site)
Chemical contamination has been decreasing. In fact, the coasts and coastalresources of California, Oregon, Washington, Hawaii and Alaska are nowcleaner and less contaminated with chemicals than at any time since WorldWar II.
Intensive monitoring indicates that there has been a "parade" of pollutantswashing our shores. In the 1920s, spillage from the on-shore oil industry waswidespread in southern California and San Francisco Bay. In the 1940s, fishand sediments experienced increasing concentrations of PCBs and DDT. Inthe 1950s, radionuclides from atmospheric testing and releases from theColumbia River began showing up in clams and mussels along the coast. Thelatest entry into this "pollutant parade," tributyl tin from vessel antifoulingpaint, reached its peak of contamination in the late 1970s and early 1980s. Thecombined chemical contamination of West Coast marine life, water andsediments reached an overall peak in the early 1970s, followed by dramaticdecreases during the late 1970s and early 1980s.
Most of the decreasing contamination has come as a result of controls on thesale and use of specific chemicals and as a result of pre-treatment or industrialsource control. The bottom line is that the coasts and coastal resources ofCalifornia, Oregon, Washington, Hawaii and Alaska are now cleaner and lesscontaminated with chemicals than at any time since World War II.(top)
Question 2. Do you think that chemical contamination is causingserious problems along your coast?
Click here for audio response
(audio requires RealPlayer, see Using this Site)
Chemical contaminants continue to cause problems to marine life. However,whether these are serious or not depends on your point of view. Compared tothe past, today's problems are minor, are localized and are not caused bycontrollable inputs such as sewage or industrial outfalls.
As we now realize, there were very serious and large-scale ecologicalproblems a quarter century ago. These effects were reversed during the
1970s. Nevertheless, signifi cant problems remain, due largely to seepage oftoxic chemicals from submerged historical deposits. Petroleum hydrocarbons,PCBs and DDT continue to seep out of sediment hot spots, contaminatinglocal fish and shellfish, in some cases causing continued, but localized,reproductive injury and disease. Although many top-level predators such asseals, sea lions and pelicans are thriving, there still is enough DDT in thesouthern California ecosystem to cause reproductive failure in a local baldeagle population. There are also human consumption warnings for severalspecies of nearshore fish in localized coastal areas such as Palos Verdes,Santa Monica Bay, San Francisco Bay and Puget Sound. The greatestclean-up challenges are at sites with historical deposits in portions of bays,harbors and estuaries; at inland hazardous waste sites; and in many of theregion's inland waters.(top)
Text References
On-line References
Text References
Holmes, C. W. 1977. Effects of dredged channels on trace metal migrationin an estuary. Journal of Research of the U.S. Geological Survey5:243-251.
Kuck, P.H. 1997. Mineral commodity summaries. Washington, DC: U.S.Department of the Interior, U.S. Geological Survey (USGS). 6 pp.
Lauenstein, G.G. and A.Y. Cantillo. 1993a. Sampling and analyticalmethods of the NS&T Program national Benthic Surveillance and MusselWatch Projects, vol. I: Overview and summary of methods. NOAAtechnical memorandum NOS ORCA 71. Silver Spring, MD: NationalOceanic and Atmospheric Administration (NOAA), Office of OceanResources Conservation and Assessment (ORCA), Coastal Monitoring andBioeffects Assessment Division (CMBAD). 117 pp.
Lauenstein, G.G. and A.Y. Cantillo. 1993b. Sampling and analyticalmethods of the NS&T Program national Benthic Surveillance and MusselWatch Projects, vol. II: Comprehensive descriptions of complementarymeasurements. NOAA tech. memo. NOS ORCA 71. Silver Spring, MD:NOAA, ORCA, CMBAD. 102 pp.
Lauenstein, G.G. and A.Y. Cantillo. 1993c. Sampling and analyticalmethods of the NS&T Program National Benthic Surveillance and MusselWatch Projects, vol. III: Comprehensive descriptions of elementalanalytical methods. NOAA tech. memo. NOS ORCA 71. Silver Spring,MD: NOAA, ORCA, CMBAD. 219 pp.
Lauenstein, G.G. and A.Y. Cantillo. 1993d. Sampling and analyticalmethods of the NS&T Program National Benthic Surveillance and MusselWatch Projects, vol. IV: Comprehensive descriptions of trace organicanalytical methods. NOAA tech. memo. NOS ORCA 71. Silver Spring,MD: NOAA, ORCA, CMBAD. 182 pp.
Nielsen, F.H. 1988. Possible future implications of ultratrace metals inhuman health and disease. In: Prasad, A.S. (ed.), Current topics in
nutrition and disease, vol. 18: Essential and toxic trace metals in humanhealth and disease. New York: Alan R. Liss pp. 277-292.
Nriagu, J. O. 1989. A global assessment of natural sources of atmospherictrace elements. Nature 338:47-49
O'Connor, T.P. 1996. Trends in chemical concentrations in mussels andoysters collected along the U.S. coast from 1986 to 1993. MarineEnvironmental Research 41:183-200.
O'Connor, T.P. and B. Beliaeff. 1995. Recent trends in coastalenvironmental quality: Results from the Mussel Watch Project. SilverSpring, MD: NOAA. 40 pp.
Pruell, R.J., J.G. Quinn, J.L. Lake, and W.R. Davis. 1987. Availabilityof PCBs and PAHs to Mytilus edulis from artificially resuspendedsediments. pp. 97-108. In: Capuzzo, J.M. and D.R. Kester (eds.), Oceanicprocesses in marine pollution, vol. 1: Biological processes and wastes inthe ocean. Malabar, FL: Krieger.
Roesijadi, G., J.S. Young, A.S. Drum, and J.M. Gurtisen. 1987.Behavior of trace metals in Mytilus edulis during a reciprocal transplantfield experiment. Marine Ecology Program Series 15:155-170.
U.S. Geological Survey. 1981. Metallogenic map of North America.USGS map G79199. Reston,VA: USGS.
Wang, W.-X., N.S. Fisher, and S.N. Luoma. 1996. Kineticdeterminations of trace element bioaccumulation in the mussel Mytilusedulis. Marine Ecology Program Series 140:91-113.(top)
On-line References
The following references were accessed via URL on the World Wide Webbetween June and October 1997.
Downloadable Products
National Oceanic and Atmospheric Administration , Office of OceanResources Conservation and Assessment. ORCA Publication List.
http://www-orca.nos.noaa.gov/cgi-bin/orca_productlist.pl?1
There are six downloadable publications on chemical contamination inoysters and mussels. National listing publication numbers are:
39) Results from the NOAA National Status and Trends Program;
49) Mussel Watch: Recent trends in coastal environmental quality;
59) Sampling and analytical methods of the NS&T Program;
73) NOAA NS&T Mussel Watch Project;
74) Inventory of chemical concentrations;
75 Incidence of adverse biological effects.
U.S. EPA, Office of Science and Technology. Methods for sampling andanalyzing contaminants in fish and shellfish tissue.
http://www.epa.gov/OST/NEW/PDF/doc2ndx.html
Offers downloadable document: Methods for sampling and analyzingcontaminants in fish and shellfish tissue. Document sections include:monitoring strategy, target species, and target analyses.
National Programs
National Oceanic and Atmospheric Administration Office of OceanResources Conservation and Assessment. NOAA's National Status andTrends Program.
http://seaserver.nos.noaa.gov/projects/nsandt/nsandt.html
Explains the National Status and Trends Program for marine environmentalquality. Since 1984, NOAA's National Status and Trends Program hasmonitored, on a national scale, spatial and temporal trends of chemicalcontamination and biological responses to that contamination. Includes anational map with Benthic Surveillance sites and Mussel Watch sites.
Moss Landings Marine Laboratories. California State Mussel WatchProgram.
http://color.mlml.calstate.edu/www/ groups/mpsl/muslwtch.htm
Describes the California State Mussel Watch Program as a tool to helplocate and identify harmful substances in California's coastal waters.Includes program goals, data uses, and techniques.
Shellfish Contaminants
EMAP Estuaries: A report on the condition of the estuaries of the UnitedStates in 1990-1993. Do fish and shellfish contain contaminant residues?
http://www.epa.gov/gumpo/emap/module4.html
Section of the U.S. EPA EMAP Estuaries: Report on the condition of theestuaries of the United States in 1990-1993 . Offers backgroundinformation on contaminant concentrations in fish and shellfish in theUnited States. Lists percentages of contaminants in tissues in variousspecies.
Food and Drug Administration, Center for Food Safety and AppliedNutrition. Guidance documents for trace elements in seafood.
http://vm.cfsan.fda.gov/~frf/guid-sf.html
Provides access to guidance documents on five trace elements (arsenic,cadmium, chromium, lead and nickel) in seafood. The documents containsampling procedures, consumption and exposure assessment, hazardassessment, and levels of concern.
U.S. EPA, Office of Wetlands. Indicator 13: Selected coastal surface waterpollutants in shellfish.
http://www.epa.gov/OWOW/indic/fs13.html
This fact sheet is part of a larger EPA document, Environmental indicatorsof water quality in the United States, June 1996. It describes the percent ofchange in concentrations of six coastal surface water pollutants in shellfish(oysters and mussels) from 1986 to 1993 as a national water qualityindicator. This site describes the indicator, how it will be used to trackprogress, what is being done to improve the indicator, and what is beingdone to improve conditions measured by the indicator.
Florida Bay Management Committee. Oyster and sediment contaminantlevels and trends in South Florida.
http://flabay.saj.usace.army.mil/contaminants.html
Explains the use of oyster and sediment samples to identify trends ofcontaminants in South Florida from 1986-1994.
Internet Data Bases
National Oceanic and Atmospheric Administration, Office of OceanResources Conservation and Assessment. NOAA's National Status andTrends Program.
http://seaserver.nos.noaa.gov/../cgi-bin/orca_prod_details.pl?3_CMBAD_NSandTData
Downloadable data from the National Status and Trends Program. Database can be searched on various parameters, e.g., benthic surveillancesites, metal contaminant data, organic compound contaminant data.
San Francisco Estuary Institute. SFEI regional monitoring program on-linedata base, Wizard.
http://jaguar.sfei.org/ows-bin/owa/webrmp.startit
This on-line regional monitoring program data base includes data collectedin the San Francisco Bay area, e.g., chemical analyses of sediments, water,and caged mollusks collected periodically since 1983.(top)

Chemical Contaminants in Oysters and Mussels - Appendices
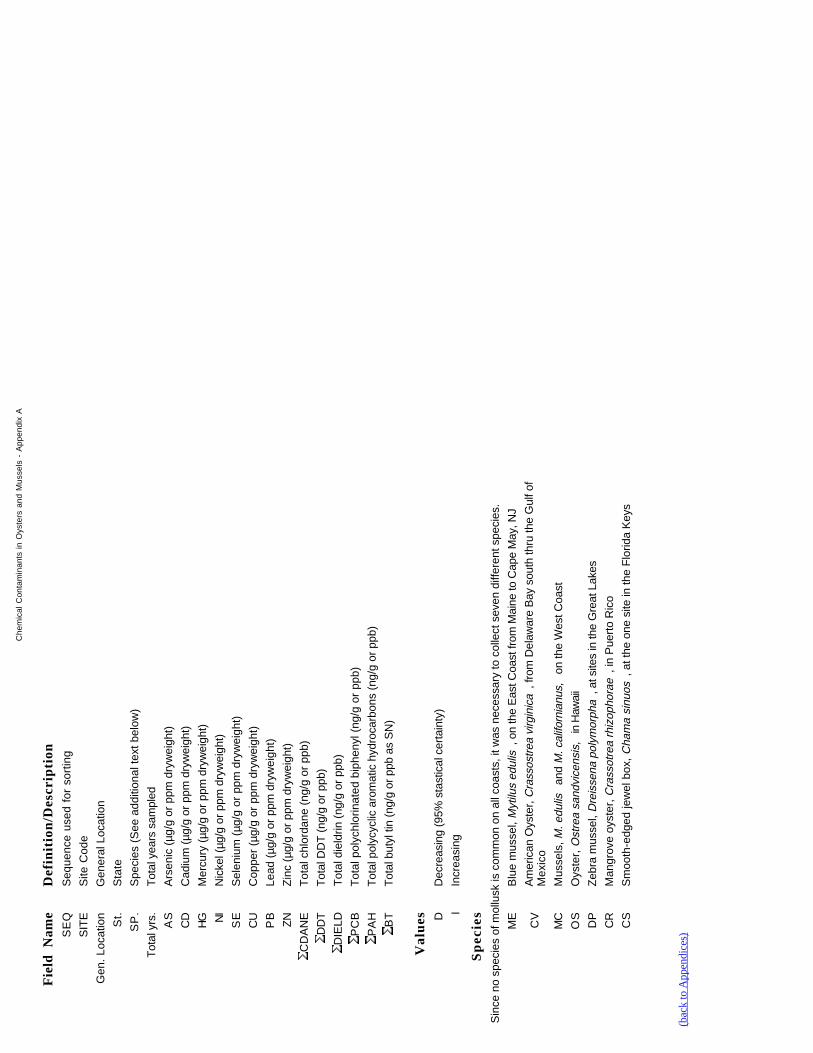
Appendix A Trends at sites sampled in six or more years
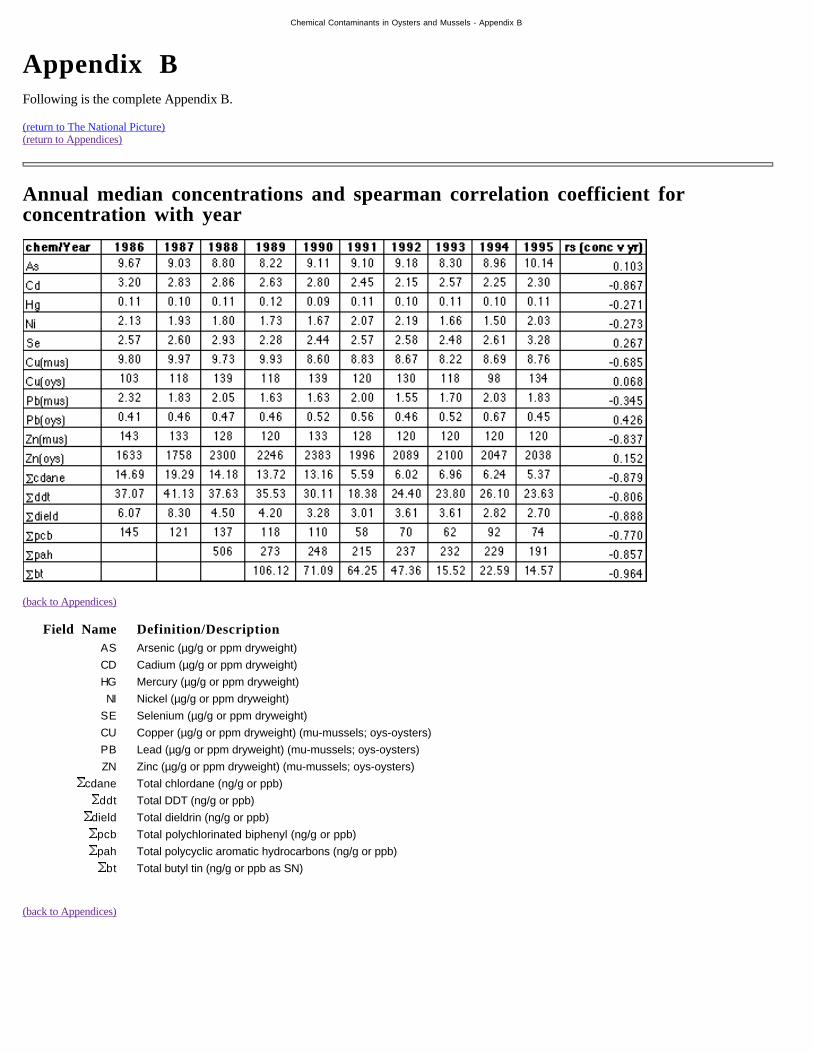
Appendix B Annual median concentrations and spearman correlationcoefficient for concentration with year
Appendix C Indications of sites with 50% or more occurrences of "high"concentrations since 1990
Appendix D High concentrations at 36 most urban sites
Che
mic
al C
onta
min
ants
in
Oys
ters
and
Mus
sels
- A
ppen
dix
A
Ap
pe
nd
ix
Pre
vie
wF
ollo
win
g is
a s
egm
ent o
f App
endi
x A
.
Clic
k he
re to
vie
w th
e co
mpl
ete
App
endi
x A
(26
0K).
(ret
urn
to T
he N
atio
nal P
ictu
re)
(ret
urn
App
endi
ces)
Tre
nds
at s
ites
sam
pled
in
six
or m
ore
year
s
(bac
k to
App
endi
ces)
Che
mic
al C
onta
min
ants
in
Oys
ters
and
Mus
sels
- A
ppen
dix
A
Fie
ld N
am
eD
efi
nit
ion
/De
scri
pti
on
SE
QS
eque
nce
used
for
sor
ting
SIT
ES
ite C
ode
Gen
. Lo
catio
nG
ener
al L
ocat
ion
St.
Sta
te
SP
.S
peci
es (
See
add
ition
al te
xt b
elow
)
Tot
al y
rs.
Tot
al y
ears
sam
pled
AS
Ars
enic
(µg
/g o
r pp
m d
ryw
eigh
t)
CD
Cad
ium
(µg
/g o
r pp
m d
ryw
eigh
t)
HG
Mer
cury
(µg
/g o
r pp
m d
ryw
eigh
t)
NI
Nic
kel (
µg/g
or
ppm
dry
wei
ght)
SE
Sel
eniu
m (
µg/g
or
ppm
dry
wei
ght)
CU
Cop
per
(µg/
g or
ppm
dry
wei
ght)
PB
Lead
(µg
/g o
r pp
m d
ryw
eigh
t)
ZNZ
inc
(µg/
g or
ppm
dry
wei
ght)
CD
AN
ET
otal
chl
orda
ne (
ng/g
or
ppb)
DD
TT
otal
DD
T (
ng/g
or
ppb)
DIE
LDT
otal
die
ldrin
(ng
/g o
r pp
b)
PC
BT
otal
pol
ychl
orin
ated
bip
heny
l (ng
/g o
r pp
b)
PA
HT
otal
pol
ycyc
lic a
rom
atic
hyd
roca
rbon
s (n
g/g
or p
pb)
BT
Tot
al b
utyl
tin
(ng/
g or
ppb
as
SN
)
Va
lue
s DD
ecre
asin
g (9
5% s
tast
ical
cer
tain
ty)
IIn
crea
sing
Sp
ec
ies
Sin
ce n
o sp
ecie
s of
mol
lusk
is c
omm
on o
n al
l coa
sts,
it w
as n
eces
sary
to c
olle
ct s
even
diff
eren
t spe
cies
.
ME
Blu
e m
usse
l, M
ytilu
s ed
ulis
, on
the
Eas
t Coa
st fr
om M
aine
to C
ape
May
, NJ
CV
Am
eric
an O
yste
r, C
rass
ostr
ea v
irgin
ica
, fro
m D
elaw
are
Bay
sou
th th
ru th
e G
ulf o
fM
exic
o
MC
Mus
sels
, M. e
dulis
and
M. c
alifo
rnia
nus,
on
the
Wes
t Coa
st
OS
Oys
ter,
Ost
rea
sand
vice
nsis
, in
Haw
aii
DP
Zeb
ra m
usse
l, D
reis
sena
pol
ymor
pha
, at s
ites
in th
e G
reat
Lak
es
CR
Man
grov
e oy
ster
, Cra
ssot
rea
rhiz
opho
rae
, in
Pue
rto
Ric
o
CS
Sm
ooth
-edg
ed je
wel
box
, Cha
ma
sinu
os, a
t the
one
site
in th
e F
lorid
a K
eys
(bac
k to
App
endi
ces)
Chemical Contaminants in Oysters and Mussels - Appendix B
Appendix BFollowing is the complete Appendix B.
(return to The National Picture)(return to Appendices)
Annual median concentrations and spearman correlation coefficient forconcentration with year
(back to Appendices)
Field Name Definition/DescriptionAS Arsenic (µg/g or ppm dryweight)
CD Cadium (µg/g or ppm dryweight)
HG Mercury (µg/g or ppm dryweight)
NI Nickel (µg/g or ppm dryweight)
SE Selenium (µg/g or ppm dryweight)
CU Copper (µg/g or ppm dryweight) (mu-mussels; oys-oysters)
PB Lead (µg/g or ppm dryweight) (mu-mussels; oys-oysters)
ZN Zinc (µg/g or ppm dryweight) (mu-mussels; oys-oysters)
cdane Total chlordane (ng/g or ppb)
ddt Total DDT (ng/g or ppb)
dield Total dieldrin (ng/g or ppb)
pcb Total polychlorinated biphenyl (ng/g or ppb)
pah Total polycyclic aromatic hydrocarbons (ng/g or ppb)
bt Total butyl tin (ng/g or ppb as SN)
(back to Appendices)

Che
mic
al C
onta
min
ants
in
Oys
ters
and
Mus
sels
- A
ppen
dix
C
Ap
pe
nd
ix
Pre
vie
wF
ollo
win
g is
a s
egm
ent o
f App
endi
x C
.
Clic
k he
re to
vie
w th
e co
mpl
ete
App
endi
x C
(39
4K).
(ret
urn
to T
he N
atio
nal P
ictu
re)
(ret
urn
to R
egio
nal C
ontr
asts
)(r
etur
n to
App
endi
ces)
Indi
catio
ns o
f si
tes
with
50%
or
mor
e oc
curr
ence
s of
hig
h co
ncen
trat
ions
sin
ce 1
990
(bac
k to
App
endi
ces)

Che
mic
al C
onta
min
ants
in
Oys
ters
and
Mus
sels
- A
ppen
dix
C
Fie
ld N
am
eD
efi
nit
ion
/De
scri
pti
on
SE
QS
eque
nce
used
for
sor
ting
SIT
ES
ite C
ode
Gen
. Lo
catio
nG
ener
al L
ocat
ion
St.
Sta
te
SP
.S
peci
es (
See
add
ition
al te
xt b
elow
)
Tot
al y
rs.
Tot
al y
ears
sam
pled
AS
Ars
enic
(µg
/g o
r pp
m d
ryw
eigh
t)
CD
Cad
ium
(µg
/g o
r pp
m d
ryw
eigh
t)
HG
Mer
cury
(µg
/g o
r pp
m d
ryw
eigh
t)
NI
Nic
kel (
µg/g
or
ppm
dry
wei
ght)
SE
Sel
eniu
m (
µg/g
or
ppm
dry
wei
ght)
CU
Cop
per
(µg/
g or
ppm
dry
wei
ght)
PB
Lead
(µg
/g o
r pp
m d
ryw
eigh
t)
ZNZ
inc
(µg/
g or
ppm
dry
wei
ght)
CD
AN
ET
otal
chl
orda
ne (
ng/g
or
ppb)
DD
TT
otal
DD
T (
ng/g
or
ppb)
DIE
LDT
otal
die
ldrin
(ng
/g o
r pp
b)
PC
BT
otal
pol
ychl
orin
ated
bip
heny
l (ng
/g o
r pp
b)
PA
HT
otal
pol
ycyc
lic a
rom
atic
hyd
roca
rbon
s (n
g/g
or p
pb)
BT
Tot
al b
utyl
tin
(ng/
g or
ppb
as
SN
)
P2
0P
opul
atio
n w
ithin
20
kilo
met
ers
Va
lue
s DD
ecre
asin
g (9
5% s
tast
ical
cer
tain
ty)
IIn
crea
sing
Sp
ec
ies
Sin
ce n
o sp
ecie
s of
mol
lusk
is c
omm
on o
n al
l coa
sts,
it w
as n
eces
sary
to c
olle
ct s
even
diff
eren
t spe
cies
.
ME
Blu
e m
usse
l, M
ytilu
s ed
ulis
, on
the
Eas
t Coa
st fr
om M
aine
to C
ape
May
, NJ
CV
Am
eric
an O
yste
r, C
rass
ostr
ea v
irgin
ica
, fro
m D
elaw
are
Bay
sou
th th
ru th
e G
ulf o
fM
exic
o
MC
Mus
sels
, M. e
dulis
and
M. c
alifo
rnia
nus,
on
the
Wes
t Coa
st
OS
Oys
ter,
Ost
rea
sand
vice
nsis
, in
Haw
aii
DP
Zeb
ra m
usse
l, D
reis
sena
pol
ymor
pha
, at s
ites
in th
e G
reat
Lak
es
CR
Man
grov
e oy
ster
, Cra
ssot
rea
rhiz
opho
rae
, in
Pue
rto
Ric
o
CS
Sm
ooth
-edg
ed je
wel
box
, Cha
ma
sinu
os, a
t the
one
site
in th
e F
lorid
a K
eys
(bac
k to
App
endi
ces)

Che
mic
al C
onta
min
ants
in
Oys
ters
and
Mus
sels
- A
ppen
dix
D
Ap
pe
nd
ix
Pre
vie
w
Fol
low
ing
is a
seg
men
t of A
ppen
dix
D.
Clic
k he
re to
vie
w th
e co
mpl
ete
App
endi
x D
(40
3K).
(ret
urn
to R
egin
al C
ontr
asts
)(b
ack
to A
ppen
dice
s)
Hig
h co
ncen
trat
ions
at
36 m
ost
urba
n si
tes
(bac
k to
App
endi
ces)

Che
mic
al C
onta
min
ants
in
Oys
ters
and
Mus
sels
- A
ppen
dix
D
Fie
ld N
am
eD
efi
nit
ion
/De
scri
pti
on
SE
QS
eque
nce
used
for
sor
ting
SIT
ES
ite C
ode
Gen
. Lo
catio
nG
ener
al L
ocat
ion
St.
Sta
te
SP
.S
peci
es (
See
add
ition
al te
xt b
elow
)
Tot
al y
rs.
Tot
al y
ears
sam
pled
AS
Ars
enic
(µg
/g o
r pp
m d
ryw
eigh
t)
CD
Cad
ium
(µg
/g o
r pp
m d
ryw
eigh
t)
HG
Mer
cury
(µg
/g o
r pp
m d
ryw
eigh
t)
NI
Nic
kel (
µg/g
or
ppm
dry
wei
ght)
SE
Sel
eniu
m (
µg/g
or
ppm
dry
wei
ght)
CU
Cop
per
(µg/
g or
ppm
dry
wei
ght)
PB
Lead
(µg
/g o
r pp
m d
ryw
eigh
t)
ZNZ
inc
(µg/
g or
ppm
dry
wei
ght)
CD
AN
ET
otal
chl
orda
ne (
ng/g
or
ppb)
DD
TT
otal
DD
T (
ng/g
or
ppb)
DIE
LDT
otal
die
ldrin
(ng
/g o
r pp
b)
PC
BT
otal
pol
ychl
orin
ated
bip
heny
l (ng
/g o
r pp
b)
PA
HT
otal
pol
ycyc
lic a
rom
atic
hyd
roca
rbon
s (n
g/g
or p
pb)
BT
Tot
al b
utyl
tin
(ng/
g or
ppb
as
SN
)
P2
0P
opul
atio
n w
ithin
20
kilo
met
ers
Va
lue
s DD
ecre
asin
g (9
5% s
tast
ical
cer
tain
ty)
IIn
crea
sing
Sp
ec
ies
Sin
ce n
o sp
ecie
s of
mol
lusk
is c
omm
on o
n al
l coa
sts,
it w
as n
eces
sary
to c
olle
ct s
even
diff
eren
t spe
cies
.
ME
Blu
e m
usse
l, M
ytilu
s ed
ulis
, on
the
Eas
t Coa
st fr
om M
aine
to C
ape
May
, NJ
CV
Am
eric
an O
yste
r, C
rass
ostr
ea v
irgin
ica
, fro
m D
elaw
are
Bay
sou
th th
ru th
e G
ulf o
fM
exic
o
MC
Mus
sels
, M. e
dulis
and
M. c
alifo
rnia
nus,
on
the
Wes
t Coa
st
OS
Oys
ter,
Ost
rea
sand
vice
nsis
, in
Haw
aii
DP
Zeb
ra m
usse
l, D
reis
sena
pol
ymor
pha
, at s
ites
in th
e G
reat
Lak
es
CR
Man
grov
e oy
ster
, Cra
ssot
rea
rhiz
opho
rae
, in
Pue
rto
Ric
o
CS
Sm
ooth
-edg
ed je
wel
box
, Cha
ma
sinu
os, a
t the
one
site
in th
e F
lorid
a K
eys
(bac
k to
App
endi
ces)
Chemical Contaminants in Oysters and Mussels - Glossary
annual trend: a statistically validated correlation between a chemicalconcentration and a certain year.
chlor-alkali plant: an industrial plant producing chlorine and causticsoda.
contamination: the presence of a chemical due to human activities.
man-made chemicals: organic chemicals that would not exist if notsynthesized.
mollusks: in general, a phylum; in this article, however, the term pertainsonly to bivalve mollusks that are either mussels or oysters (see "species").
monitoring: periodic measurements of the same parameters.
organic compounds: in general, all chemical compounds containing theelement carbon (except as a carbonate); in this article, it pertains to specificcompounds.
sediment: particulate material lying on the seafloor.
species: in this article, one of seven different species of mollusk: the bluemussel Mytilus edulis on the East Coast from Maine to Cape May, NewJersey; the American oyster Crassostrea virginica from Delaware Baysouthward and throughout the Gulf of Mexico; the mussels M. edulis andM. californianus on the West Coast; the oyster Ostrea sandvicensis inHawaii; the zebra mussel Dreissena polymorpha at sites in the GreatLakes; the mangrove oyster Crassostrea rhizophorae in Puerto Rico; andthe smooth-edged jewel box Chama sinuos at one site in the FloridaKeys.(top)
statistical: related to a rigorous mathematical test for a correlation.
status: in the context of chemical concentrations in mollusks, thegeographic distribution of concentrations.
total butyl tin (·BT): the sum of the concentrations of tributyl tin and itsbreakdown products, dibutyl tin and monobutyl tin.
total chlordane (·Cdane): the sum of concentrations of two majorconstituents of chlordane mixtures, cis-chlordane and trans-nonachlor, andtwo minor components, heptachlor and heptachlorepoxide.
total dichlorodiphenyltrichloroethane (·DDT): The sum ofconcentrations of DDT and its metabolites, DDE(dichlorodiphenyltrichloroethylene) and DDD(dichlorodiphenyldichloroethylene).
total dieldrin (·Dield): the sum of concentrations of two compounds:aldrin and dieldrin.
total polychlorinated biphenyls (·PCBs): the sum of theconcentrations of di-, tri-, tetra-, penta-, hexa-, hepta-, octa-, andnonachlorobiphenyls. Since 1988, the equivalent ·PCB has been calculatedfrom the sum of concentrations of 18 individual PCB congeners.
total polycyclic aromatic hydrocarbons (·PAHs): the sum ofconcentrations of 24 PAH compounds: twelve 2- and 3-ring compounds

Chemical Contaminants in Oysters and Mussels - Glossary
(biphenyl, naphthalene, 1-methylnaphthalene, 2-methylnaphthalene,2,6-dimethylnaphthalene, 1,6,7-trimethylnaphthalene, acenaphthylene,acenaphthene, fluorene, phenanthrene, 1-methylphenanthrene, andanthracene); and twelve 4-, 5- , and 6-ring compounds (fluoranthene,pyrene, benz[a]anthracene, chrysene, benzo[a]pyrene, benzo[e]pyrene,perylene, benzo[b]fluoranthene, benzo[k]fluoranthene,dibenz[a,h]anthracene, indeno[1,2,3-cd]pyrene and benzo[ghi]perylene).
trace metals: a general term for all elements (even non-metallic elements)that are usually found in concentrations of less than 1,000 parts per millionin sediments or animal tissue.(top)

Chemical Contaminants in Oysters and Mussels - Credits
Acknowledgments
The NS&T Program Mussel Watch samples have been collected andanalyzed by the Texas A&M University Geochemical and EnvironmentalResearch Group in College Station, Texas; the Battelle Laboratories inDuxbury, Massachusetts and Sequim, Washington; and the La Jolla,California laboratory of the Scientific Applications InternationalCorporation.(top)
About the Author
Tom O'Connor is Chief ofthe Coastal MonitoringBranch in the CoastalMonitoring and BioeffectsAssessment Division, Officeof Ocean ResourcesConservation andAssessment, NationalOceanic and AtmosphericAdministration (NOAA). Heinitially joined the NOAAOcean Dumping Program in1977, and in 1987 becamemanager of the NationalStatus and Trends Programfor marine environmentalquality. In all of thesepositions, hisresponsibilities havecentered on quantifying theextent and effects ofchemical contamination inthe marine environment.(top)

Chemical Contaminants in Oysters and Mussels - Figure 1
Return to IntroductionReturn to National Picture
Figure 1. Monitoring sites for National mussel watch project.

Return to National Picture
Return to Case Studies
Figure 3. Sites monitored by NS&T monitoring program in Lavaca Bay, Texas.
Return to Case Studies