chemical investigations of secondary metabolites from ...may provide benefits to the host plant...
TRANSCRIPT
University of IowaIowa Research Online
Theses and Dissertations
Fall 2011
Chemical investigations of secondary metabolitesfrom selected fungi and from peanut seedschallenged by Aspergillus caelatusScott Andrew NeffUniversity of Iowa
Copyright 2011 Scott Andrew Neff
This dissertation is available at Iowa Research Online: http://ir.uiowa.edu/etd/2750
Follow this and additional works at: http://ir.uiowa.edu/etd
Part of the Chemistry Commons
Recommended CitationNeff, Scott Andrew. "Chemical investigations of secondary metabolites from selected fungi and from peanut seeds challenged byAspergillus caelatus." PhD (Doctor of Philosophy) thesis, University of Iowa, 2011.http://ir.uiowa.edu/etd/2750.
CHEMICAL INVESTIGATIONS OF SECONDARY METABOLITES
FROM SELECTED FUNGI AND FROM PEANUT SEEDS
CHALLENGED BY ASPERGILLUS CAELATUS
by
Scott Andrew Neff
An Abstract
Of a thesis submitted in partial fulfillment of the requirements for the Doctor of
Philosophy degree in Chemistry in the Graduate College of
The University of Iowa
December 2011
Thesis Supervisor: Professor James B. Gloer
1
ABSTRACT
Many years of study have revealed that fungi are excellent sources of novel
bioactive secondary metabolites. Some of these secondary metabolites possess
therapeutic qualities that improve the quality of life for millions of people. Such
metabolites include well known classes such as the penicillins, cephalosporins, and
statins, yet many fungi remain underexplored as sources of biologically active
metabolites. The research described in this thesis employs an ecology-based approach to
targeting fungi for chemical investigation, and describes studies of fungi from two niche
groups, fungicolous/mycoparasitic and endophytic fungi, as possible sources of new
secondary metabolites with biological activities. In a parallel project, the structures of
bioactive compounds isolated from peanut seeds that had been subjected to fungal attack
were elucidated in the pursuit of compounds with beneficial bioactivities.
Mycoparasitic fungi are those that colonize other fungi by parasitizing the host,
often leading to damage to the host fungus. Fungicolous fungi are those that colonize
other fungi, but have not been proven to be true mycoparasites. The damage often caused
by colonization of host fungi indicates that mycoparasitic and fungicolous fungi can
produce antifungal compounds. Chemical investigations of such fungi described in this
thesis afforded 37 compounds representing various biosynthetic types, seven of which
were new. Many of these compounds show antifungal, antimicrobial, and/or cytotoxic
effects. Endophytic fungi live asymptomatically within plant tissues and in some cases
may provide benefits to the host plant through the production of secondary metabolites.
Chemical investigations of corn, wheat, and sorghum endophytes described in this thesis
led to the isolation and characterization of 20 compounds, seven of which were identified
as being new. Many of the fungal metabolites encountered in this work showed
antifungal, antimicrobial, and/or cytotoxic effects.

2
Seven new secondary metabolites, isolated from peanut seeds, were produced in
response to fungal attack by an Aspergillus caelatus strain. All of these compounds were
stilbene-derived phytoalexins, which are considered to be inducible chemical defenses
whose production is elicited or enhanced upon microbial attack. Further studies of these
newly identified compounds and their production could lead a better understanding of
how the plant defends itself. Such knowledge could enable researchers to manipulate this
mechanism to obtain greater peanut resistance to invasion by pests. Additionally, the
health benefits from related stilbene-derived compounds (e.g., resveratrol) from peanuts
and other plants have been widely established. Knowledge about the presence of
compounds of this type could add to the importance of peanut crop production.
The compounds identified in this work were isolated using multiple
chromatographic techniques, and the structures were established based on analysis of 1D
and 2D NMR data combined with MS, chemical derivatization, and/or optical
measurement data. Absolute configuration assignments were achieved by application of
Mosher’s method, CD spectral analysis, computational investigation, and/or chemical
derivatization. Details of the isolation, structure elucidation, and biological activity of
these compounds are presented in this thesis.
Abstract Approved: _______________________________ Thesis Supervisor _______________________________ Title and Department _______________________________ Date
CHEMICAL INVESTIGATIONS OF SECONDARY METABOLITES
FROM SELECTED FUNGI AND FROM PEANUT SEEDS
CHALLENGED BY ASPERGILLUS CAELATUS
by
Scott Andrew Neff
A thesis submitted in partial fulfillment of the requirements for the Doctor of
Philosophy degree in Chemistry in the Graduate College of
The University of Iowa
December 2011
Thesis Supervisor: Professor James B. Gloer
Graduate College The University of Iowa
Iowa City, Iowa
CERTIFICATE OF APPROVAL
_______________________
PH.D. THESIS
_______________
This is to certify that the Ph.D. thesis of
Scott Andrew Neff
has been approved by the Examining Committee for the thesis requirement for the Doctor of Philosophy degree in Chemistry at the December 2011 graduation.
Thesis Committee: ___________________________________ James B. Gloer, Thesis Supervisor
___________________________________ Ned B. Bowden
___________________________________ Christopher M. Cheatum
___________________________________ Gregory K. Friestad
___________________________________ Horacio F. Olivo

ii
To All of My Coaches and Teachers who Laid
the Foundation for Me to Reach as High as I Desired
iii
ACKNOWLEDGEMENTS
The idea of attending graduate school was a distant thought, even as my
undergraduate career at St. Ambrose University was coming to a close. It was Dr. Art
Serianz, an individual who also received his Ph.D. from the University of Iowa and the
first person who believed that I would do well in graduate school, who helped me pursue
a graduate school education. Without his guidance, and the guidance of the chemistry
department at St. Ambrose University, including Dr. Marge Legg, Dr. Andy Axup, and
Dr. George Bailey, I certainly would not be in the position I am today. I am grateful to
all of them for their support and belief in me.
I would like to thank my research advisor, Dr. James B. Gloer, for his guidance
and advice during the course of my graduate studies. His knowledge of natural products
chemistry in certainly unparalleled, and without his patience, my understanding of natural
product chemistry would not be what it is today.
I would like to acknowledge the current and former Gloer group members.
Without their willingness to answer questions and give advice on a daily basis, I would
have been lost on many different occasions. I offer them many thanks for all they have
done and the time they have sacrificed.
I would also like to thank the multiple professors that I had the pleasure of getting
to know through being a TA, as well as those who I the pleasure of learning from as a
student. The guidance I was given from them during my time in graduate school is
greatly appreciated.
A special thanks goes out to Dr. Donald T. Wicklow, our research group’s
mycological collaborator from the USDA in Peoria, IL, whose hard work and dedication
allows the Gloer group to continue working with samples that are of the highest quality.
Dr. Wicklow and his team collected, identified, and cultured fungal material that was
crucial to my research, as well as many others who preceded me. He also supervised

iv
crucial bioassays on the collected material, which was the driving force for the majority
of this research.
I would like to thank Dr. Victor S. Sobolev of the USDA’s National Peanut
Research Laboratory in Dawson, GA for affording me the opportunity to collaborate with
him for a good portion of my research. He has graciously allowed me to include much of
this collaboration material within the pages of this thesis.
Having grown up in Iowa, I certainly felt the need to expand my horizons by
attending college outside of the state or even the Midwest. However, with opportunities
to do just that, I ended up choosing my undergraduate institutions within the borders of
the state that I knew so well. It was no different when I chose to attend graduate school
at the University of Iowa. The first-hand experience that I had of the city and campus
when making my decision was only enhanced with the warm welcome that I received
from various individuals in the chemistry department when I first arrived. I realized
quickly that individuals like Janet and Sharon were willing to go the extra mile to assist
me during my education and growth as a professional. This was not only demonstrated
by the administrative staff, but also by the professors and fellow graduate students that I
have had the pleasure of knowing. For going above and beyond, thank you to all of the
people who were “behind the scenes” during my education at the University of Iowa.
I would also like to thank the individuals in the NMR and MS facilities for all of
their hard work. They were able to assist me whenever I needed them to, and more
importantly; they were able to do so in a timely manner that allowed my research to move
forward smoothly. Financial support from the National Science Foundation and the
National Institutes of Health are also appreciated.
Finally, this thesis is dedicated to my family who, in all ways possible, supported
me in my journey to achieve this goal. To my mother, Dorothy; you not only helped to
support me financially throughout all my years of college, but you were also the one who
pushed me to achieve more academically than anyone else. To my dad, Mike; you were
v
the one who taught me what hard work and dedication means and what it can yield. Both
of you were proud of me every step of the way and I cannot thank you both enough for
that. To my brother, Ryan; you kept me grounded and focused not only in my education
but also in life in general, my deepest thanks goes to you.
Para Amber: hemos pasado por dificultades, y a veces los dos hemos andado
como perdidos, pero al final, encontramos el amor que tenemos. Tu apoyo y amor fueron
monumentales para mi empeño en lograr esta meta final. Del fondo de mi corazón,
gracias.
vi
TABLE OF CONTENTS
LIST OF TABLES ............................................................................................................. ix
LIST OF FIGURES .............................................................................................................x
LIST OF SCHEMES........................................................................................................ xiv
LIST OF ABBREVIATIONS ............................................................................................xv
CHAPTER
1. INTRODUCTION ............................................................................................1
2. SCREENING OF FUNGI ...............................................................................24
3. ISOLATION AND CHARACTERIZATION OF AFLAQUINOLONES A-G: SECONDARY METABOLITES FROM FUNGICOLOUS AND MARINE ISOLATES OF ASPERGILLUS SPP. ................................................................................................................38
Structure Elucidation of Aflaquinolones A (43) and B (44) ..................40 Structure Elucidation of Aflaquinolones C-G (47-51) ...........................49
4. CHEMICAL INVESTIGATIONS OF A CRYPTIC FUNGICOLOUS ISOLATE OF ASPERGILLUS SP. (SECTION FLAVIPEDES; MYC-1580 = NRRL 58569) .....................................................................................60
Structure Elucidation of Asperlarin A (52) and Flavipeptide A (53) ......63 Structure Elucidation of PF1233B (54) ..................................................69
5. CHEMICAL INVESTIGATIONS OF AN ENDOPHYTIC ISOLATE OF EMERICELLA NIDULANS (ENDO-3111 = NRRL 58893) ....................75
Structure Elucidation of Emeridin A (65) ..............................................80 Structure Elucidation of O-Methylsecoemestrin C1 (66) .......................87 Structure Elucidation of Compounds 67 and 68 .....................................90
6. ADDITIONAL NEW SECONDARY METABOLITES OBTAINED FROM OTHER FUNGICOLOUS FUNGI ....................................................93
Chemical Investigation of a Fungicolous Isolate of Trichoderma longibrachiatum (MYC-1515 = NRRL 54514) ................93
Structure Elucidation of Tetrahydrosorbicillinol (71) ..................95 Chemical Investigations of a Fungicolous Isolate of Stachybotrys parvispora (MYC-2013 = NRRL 54531) .........................98
Structure Elucidation of Agistatine F (77) ..................................100 Chemical Investigations of an Unidentified Fungicolous Fungus (MYC-1991) ..........................................................................................103
Structure Elucidation of Dihydrosporothriolide (82) ..................104
vii
7. NEW STILBENE-DERIVED PHYTOALEXINS FROM PEANUT (ARACHIS HYPOGAEA) SEEDS CHALLENGED BY ASPERGILLUS CAELATUS ...................................................................................................108
Structure Elucidation of Chiricanine A (84) and Arahypins 1-7 (85-91) ..................................................................................................110
8. NEW PTEROCARPENES ELICITED FROM PEANUT (ARACHIS HYPOGAEA) SEEDS UPON COLONIZATION BY ASPERGILLUS CAELATUS ...................................................................................................126
Structure Elucidation of Aracarpenes 1 (92) and 2 (93) .......................129
9. SUMMARY AND CONCLUSIONS ...........................................................135
10. EXPERIMENTAL ........................................................................................138
General Experimental Procedures ................................................................138 Solvents and Reagents ...........................................................................138 Mass Measurements ..............................................................................138 Evaporation ............................................................................................138
General Chromatography Information .........................................................139 Chromatography of Plant Metabolites – Chiricanine A (84) and Arahypins 1-5 (85-89) ...........................................................................140 Chromatography of Plant Metabolites – Arahypins 6-7 (90 and 91) ....141 Chromatography of Plant Metabolites – Aracarpenes 1-2 (92 and 93) ..........................................................................................................141
General Spectroscopic Information ..............................................................142 GCMS Conditions for Amino Acid Derivative Analysis ......................144 Electronic Circular Dichroism (ECD) Analysis ....................................144 Additional Details of Spectroscopic Measurments in Studies of Marine Aspergillus sp. Isolate (Chapter 3) ............................................144 Additional Details of Spectroscopic Measurments in Studies of Plant Metabolites – Chiricanine A (84), Arahypins 1-7 (85-91), and Aracarpenes (92 and 93) .................................................................145
General Procedures for Individual NMR Experiments ................................146 DEPT Experiment .................................................................................146 Homonuclear Decoupling Experiment ..................................................146 NOESY Experiment ..............................................................................147 HMQC Experiment ...............................................................................147 HMBC Experiment ................................................................................149
General Procedures for Solid-Substrate Fermentaions .................................149 General Procedures for Antifungal Assays ...................................................150 General Procedures for Antiinsectan Assays ................................................151 General Procedures for Antibacterial Assays ...............................................152
Bacillus subtilis .....................................................................................152 Staphlococcus aureus ............................................................................153 Escherichia coli .....................................................................................153
General Procedures for Cell Proliferation Assay ..........................................154 Procedures for the Isolation and Characterization of Metabolites from Fungicolous and Marine Isolates of Aspergillus spp. (MYC-2048 = NRRL 58570 and Aspergillus sp. SF-5044) .................................................154
Sodium Borohydride Reduction of Aflaquinolone A (43) ....................159 Preparation of Aflaquinolone B (44) Mosher Esters .............................160
viii
Energy Minimizations and ECD Calculations ......................................160 Procedures for the Isolation and Characterization of Metabolites from a Cryptic Fungicolous Isolate of Aspergillus sp (secion Flavipedes; MYC-1580 = NRRL 58569) .........................................................................161
Amino Acid Analysis of Asperlarin A (52) and Flavipeptide (53) .......164 Procedures for the Isolation and Characterization of Metabolites from an Endophytic Isolate of Emericella nidulans (ENDO-3111 = NRRL 58893) ...........................................................................................................165
Attempted Chemical Degradations of Emeridin A (65) using OsO4 and KMnO4 ...........................................................................................167 Ozonolysis of Emeridin A (65) .............................................................168
Procedures for the Isolation and Characterization of Metabolites from Various Fungicolous Fungi (MYC-1515 = NRRL 54514, MYC-2013 = NRRL 54531, and MYC-1991) ....................................................................169
MYC-1515 (= NRRL 54514) Fungal Material .....................................169 MYC-2013 (= NRRL 54531) Fungal Material .....................................170 MYC-1991 Fungal Material ..................................................................171
Procedures for the Isolation and Characterization of Pseudocitreoindole (23) from MYC-1805 (Penicillim sp.) ..........................................................172 Procedures for the Isolation and Characterization of Stilbene-Derived Phytoalexins Chiricanine A (84) and Arahypins 1-5 (85-89) .......................174 Procedures for the Isolation and Characterization of Stilbenoid Dimers 90 and 91 .......................................................................................................177 Procedures for the Isolation and Characterization of Pterocarpenes 92 and 93 ............................................................................................................179
APPENDIX SELECTED NMR SPECTRA ................................................................182
REFERENCES ................................................................................................................231
ix
LIST OF TABLES
Table
1. Antifungal and Antiinsectan Bioassay Results for the EtOAc Extracts of Selected Fungicolous/Mycoparasitic (MYC) and Endophytic (ENDO) Fungal Cultures. .....................................................................................................27
2. 1H and 13C NMR Data for Aflaquinolones A (43) and B (44) in CDCl3 ..............41
3. NMR Spectroscopic Data for Aflaquinolones C (47) and D (48) in Acetone-d6 ............................................................................................................................50
4. 1H and 13C NMR Data for Aflaquinolones E-G (49-51) in CD3OD. ....................54
5. Growth Inhibitory Activity of Compounds 43, 44, 47, and 49-51 on Tumor Cell Lines. ..............................................................................................................59
6. 1H and 13C NMR Data for Asperlarin A (52) in CD3OD. .....................................64
7. 1H and 13C NMR Data for Flavipeptide A (53) in Actone-d6. ...............................67
8. NMR Spectroscopic Data for PF1233B (54) in Acetone-d6. ................................70
9. NMR Spectroscopic Data for Emeridin A (65) in CDCl3. ....................................82
10. NMR Spectroscopic Data for O-Methylsecoemestrin C1 (66) in CDCl3. .............89
11. 1H and 13C NMR Data for Compounds 67 and 68 in CD3OD. ..............................91
12. NMR Spectroscopic Data for Tetrahydrosorbicillinol (71) in CD3OD. ................96
13. NMR Spectroscopic Data for Agistatine F (77) in CDCl3. .................................101
14. 1H and 13C NMR Data for Dihydrosporothriolide (82) in CDCl3. ......................105
15. 1H NMR Data (400 MHz) for Compounds 86-89. ..............................................112
16. 13C NMR Data (100 MHz) for Compounds 86-89. .............................................113
17. NMR Spectroscopic Data for Arahypin-6 (90) in CDCl3. ..................................119
18. NMR Spectroscopic Data for Aracarpene-1 (92) and Aracarpene-2 (93). ..........131

x
LIST OF FIGURES
Figure
1. Depiction of Right-Handed Circularly Polarized Light (Perpendicular Waves are of Equal Amplitude) ...............................................................................6
2. Depiction of Right-handed Elliptically Polarized Light (Perpendicular Waves are of Unequal Amplitude) ..........................................................................8
3. Experimental and Calculated CD Spectra of (+)-Diversonol (6).............................9
4. Experimentally Measured CD Spectrum of S-Parazoanthine A (7) (Top) and TDDFT-Calculated CD Spectra of the S (7) and R (8) Enantiomers (Bottom) .................................................................................................................13
5. Solution and Solid-State CD Spectra of Tetrahydropyrenophorol (9), and TDB3LYP/TZVP-Calculated CD of the Conformation Reflected in its X-ray Structure. ..........................................................................................................15
6. Isolation Scheme for Aflaquinolones A (43) and B (44) .......................................39
7. Key NOESY Correlations of the Cyclohexanone Unit of Aflaquinolone A (43) .........................................................................................................................43
8. Experimental ECD Curve (Top) and TDDFT-Calculated ECD Curve (Bottom) for Aflaquinolone A (43)........................................................................45
9. Key NOESY Correlations for the Cyclohexane Unit of Aflaquinolone B (44). ........................................................................................................................47
10. Experimental ECD Spectrum of Aflaquinolone B (44) .........................................48
11. Observed Chemical Shift Differences (Δδ = δS – δR, ppm; 400 MHz) for the S- (44a) and R-MTPA (44b) Esters of Aflaquinolone B (44). ..............................48
12. Combined Experimental ECD Curves for Aflaquionolone A (43) and C (47). ........................................................................................................................51
13. Combined Experimental ECD Curves for Aflaquinolones A-E (43, 44, and 47-49). ....................................................................................................................55
14. Experimental ECD Spectrum (Top) and TDDFT-Calculated ECD Spectrum (Bottom) for Aflaquinolone G (51)........................................................................57
15. Isolation Scheme for Metabolites 52-54 from MYC-1580 ....................................61
16. HMBC Correlations for Asperlarin A (52) ............................................................65
17. Isolation Scheme for Metabolites 65-68 from ENDO-3111 ..................................79
xi
18. Key NOESY Correlations of the Bicyclic Ring System (A) and Cyclopentanone Ring (B) of Emeridin A (65). ......................................................83
19. Key HMBC Correlations for Compounds 67 and 68.............................................91
20. Isolation Scheme for Metabolites 71-73 from MYC-1515 ....................................94
21. Isolation Scheme for Metabolites 77-79 from MYC-2013 ....................................99
22. Isolation Scheme for Dihydrosporothriolide (82) from MYC-1991 ....................104
23. Isolation Scheme for the MeOH Extract of Peanut Seeds Challenged by Aspergillus caelatus that Yielded Stilbenoids 84-89. ..........................................110
24. Isolation Scheme for the MeOH Extract of Peanut Seeds Challenged by Aspergillus caelatus that Yielded Dimeric Stilbenoids 90 and 91. .....................117
25. Experimental ECD Curves of 90, 91, and a MeOH Blank ..................................122
26. Antifungal Properties of Compounds 84-89 against P. viticola and P. obscurans. Captan is Used as the Standard. Antifungal Assays were Performed (and Chart Produced) by D. E. Wedge and Co-Workers. ..................125
27. Formation of a Pterocarpan Skeleton. ..................................................................127
28. Isolation Scheme for the MeOH Extract of Peanut Seeds Challenged by Aspergillus caelatus that Yielded Compounds 92 and 93. ..................................129
29. Antimicrobial Properties of Aracarpenes 1 (92) and 2 (93) against Bacillus subtilis, Escherichia coli, Staphylococcus aureus, and Aspergillus flavus. *Data were not Collected at 20 µM. Antifungal Tests were Performed (and Charts Produced) by A. J. De Lucca and Co-Workers. .............133
A1. 1H NMR Spectrum of Aflaquinolone A (43, 600 MHz, CDCl3) .........................183
A2. 13C NMR Spectrum of Aflaquinolone A (43, 100 MHz, CDCl3) .......................184
A3. 1H NMR Spectrum of Aflaquinolone B (44, 400 MHz, CDCl3) .........................185
A4. 1H NMR Spectrum of Aflaquinolone B (44, 400 MHz, Acetone-d6) .................185
A5. 13C NMR Spectrum of Aflaquinolone B (44, 100 MHz, CDCl3) ........................186
A6. 1H NMR Spectrum of Aflaquinolone C (47, 400 MHz, Acetone-d6) .................187
A7. 13C NMR Spectrum of Aflaquinolone C (47, 100 MHz, Acetone-d6) ................188
A8. 1H NMR Spectrum of Aflaquinolone D (48, 400 MHz, Acetone-d6) .................189
A9. 1H NMR Spectrum of Aflaquinolone E (49, 400 MHz, CD3OD) .......................190
A10. 13C NMR Spectrum of Aflaquinolone E (49, 100 MHz, CD3OD) ......................191
A11. 1H NMR Spectrum of Aflaquinolone F (50, 400 MHz, CD3OD) .......................192

xii
A12. 13C NMR Spectrum of Aflaquinolone F (50, 100 MHz, CD3OD) ......................193
A13. 1H NMR Spectrum of Aflaquinolone G (51, 400 MHz, CD3OD) .......................194
A14. 13C NMR Spectrum of Aflaquinolone G (51, 100 MHz, CD3OD) .....................195
A15. 1H NMR Spectrum of Asperlarin A (52, 400 MHz, CD3OD) .............................196
A16. 13C NMR Spectrum of Asperlarin A (52, 100 MHz, CD3OD) ............................197
A17. 1H NMR Spectrum of Flavipeptide A (53, 400 MHz, Acetone-d6) ....................198
A18. HMBC Spectrum of Flavipeptide A (53, 600 MHz, Acetone-d6) .......................199
A19. 1H NMR Spectrum of PF1233B (54, 400 MHz, Acetone-d6) .............................200
A20. 13C NMR Spectrum of PF1233B (54, 100 MHz, CDCl3) ...................................201
A21. 1H NMR Spectrum of Emeridin A (65, 400 MHz, CDCl3) .................................202
A22. 13C NMR Spectrum of Emeridin A (65, 100 MHz, CDCl3) ................................203
A23. 1H NMR Spectrum of O-Methylsecoemestrin C1 (66, 400 MHz, CDCl3) .........204
A24. HMBC Spectrum of O-Methylsecoemestrin C1 (66, 600 MHz, CDCl3) ............205
A25. 1H NMR Spectrum of 5-(Hydroxymethyl)-2,4-dimethylbenzene-1,3-diol (67, 400 MHz, CD3OD) .......................................................................................206
A26. HMBC Spectrum of 5-(Hydroxymethyl)-2,4-dimethylbenzene-1,3-diol (67, 600 MHz, CD3OD) ..............................................................................................207
A27. 1H NMR Spectrum of 5-(Hydroxymethyl)-3-methoxy-2,4-dimethylphenol (68, 400 MHz, CD3OD) .......................................................................................208
A28. 13C NMR Spectrum of 5-(Hydroxymethyl)-3-methoxy-2,4-dimethylphenol (68, 100 MHz, CD3OD) .......................................................................................209
A29. 1H NMR Spectrum of Tetrahydrosorbicillinol (71, 400 MHz, CD3OD).............210
A30. HMBC Spectrum of Tetrahydrosorbicillinol (71, 600 MHz, CD3OD) ...............211
A31. 1H NMR Spectrum of Agistatine F (77, 600 MHz, CDCl3) ................................212
A32. 13C NMR Spectrum of Agistatine F (77, 100 MHz, CDCl3) ...............................213
A33. 1H NMR Spectrum of Dihydrosporothriolide (82, 400 MHz, CDCl3) ................214
A34. 13C NMR Spectrum of Dihydrosporothriolide (82, 100 MHz, CDCl3) ...............215
A35. 1H NMR Spectrum of Arahypin-1 (86, 400 MHz, CDCl3) .................................216
A36. 13C NMR Spectrum of Arahypin-1 (86, 100 MHz, CDCl3) ................................217

xiii
A37. 1H NMR Spectrum of Arahypin-3 (87, 400 MHz, CD3OD) ...............................218
A38. 13C NMR Spectrum of Arahypin-3 (87, 100 MHz, CD3OD) ..............................219
A39. 1H NMR Spectrum of Arahypin-4 (88, 400 MHz, CD3OD) ...............................220
A40. 13C NMR Spectrum of Arahypin-4 (88, 100 MHz, CD3OD) ..............................221
A41. 1H NMR Spectrum of Arahypin-5 (89, 400 MHz, CDCl3) .................................222
A42. 13C NMR Spectrum of Arahypin-5 (89, 100 MHz, CDCl3) ................................223
A43. 1H NMR Spectrum of Arahypin-6 (90, 400 MHz, CDCl3) .................................224
A44. HMBC Spectrum of Arahypin-6 (90, 600 MHz, CDCl3) ....................................225
A45. 1H NMR Spectrum of Arahypin-7 (91, 400, Acetone-d6) ...................................226
A46. 1H NMR Spectrum of Aracarpene-1 (92, 400 MHz, CDCl3) ..............................227
A47. 13C NMR Spectrum of Aracarpene-1 (92, 100 MHz, Acetone-d6) .....................228
A48. 1H NMR Spectrum of Aracarpene-2 (93, 400 MHz, Acetone-d6) ......................229
A49. HMBC Spectrum of Aracarpene-2 (93, 600 MHz, Acetone-d6) .........................230
xiv
LIST OF SCHEMES
Scheme
1. Equations that Relate Ellipticity and Molar Ellipticity to the Beer-Lambert Law and the Interactions Chiroptical Molecules with Circularly Polarized Light in a CD Experiment. .......................................................................................8
2. Proposed OsO4/NaIO4 and KMnO4 Oxidative Cleavage Reactions of Emeridin A (65) and the Potential Products. .........................................................85
3. Ozonolysis of Emeridin A (65) with Reductive Work-Up Using Me2S. ..............86

xv
LIST OF ABBREVIATIONS
~ approximately
[α]D specific rotation
Ac acetyl
Ar Argon
ATCC American Type Culture Collection
ax axial
BBI broadband inverse
BBO broadband observe
br broad
°C degrees Celsius
C18 octadecylsilyl
calcd calculated
CD circular dichroism
CE Cotton effect
cm centimeter
COSY correlation spectroscopy
cz clear zone
d doublet
δ chemical shift
DEPT distortionless enhancement by polarization transfer
DMSO dimethyl sulfoxide
DS dummy scans
DW dwell time
ε extinction coefficient

xvi
ECD electronic circular dichroism
EIMS electron impact mass spectrometry
eq equatorial
ESIMS electrospray ionization mass spectrometry
EtOAc ethyl acetate
eV electron volt
EXPO experiment number
FID free induction decay
g gram(s)
GCMS gas chromatography – mass spectrometry
hr hour(s)
HMBC heteronuclear multiple bond correlation
HMQC heteronuclear multiple quantum correlation
HPLC high performance/pressure liquid chromatography
HREIMS high-resolution electron impact mass spectrometry
HRESIMS high-resolution electrospray ionization mass
spectrometry
HRESITOFMS high-resolution electrospray ionization time-of-
flight mass spectrometry
HRESITOFMSMS high-resolution electrospray ionization time-of-
flight tandem mass spectrometry
Hz hertz
IR infrared
IUPAC International Union of Pure and Applied Chemistry
J coupling constant
kcal kilocalories

xvii
L liter(s)
μ micro
m multiplet
M+ molecular ion
mg milligram
MHz megahertz
min minute(s)
mL milliliter(s)
mm millimeter
mol mole(s)
mp melting point
MS mass spectrometry
m/z mass-to-charge ratio
mz mottled zone
NCI National Cancer Institute
NCAUR National Center for Agricultural Utilization
Research
nm nanometer
NMR nuclear magnetic resonance
NOE nuclear Overhauser effect (1D)
NOESY nuclear Overhauser effect spectroscopy (2D)
NRRL Northern Regional Research Laboratory
NS number of scans
obsd observed
OR optical rotation
PDA potato dextrose agar
xviii
ppm parts per million
PW pulse width
q quartet
RD relaxation delay
rel int relative intensity
rg reduced growth
RP reversed phase
rpm revolutions per minute
rt room temperature
s singlet
sec second(s)
SF spectral frequency
sh shoulder
SI size of real spectrum
SW spectral width
t triplet
TD number of data points to acquire
TDDFT time-dependent density functional theory
TLC thin-layer chromatography
TMS tetramethylsilane
tR retention time
USDA United States Department of Agriculture
UV ultraviolet
VLC vacuum liquid chromatography
wk weak
1
CHAPTER 1
INTRODUCTION
In terms of the estimated number of species, Kingdom Fungi is second only to
that of Kingdom Animalia. Conservative estimates suggest that there are more than 1.5
million fungal species, of which only approximately 5% have been identified by
taxonomists (~72, 000 known species).1,2 Fungi are abundant, biologically diverse, and
play many different roles. For example, they play crucial roles in both the health and
maintenance of ecosystems through their ability to degrade organic waste such as forest
leaf litter. Fungi can also act as pathogens, predators, parasites, hosts, and/or symbionts
of animals, plants, and other microorganisms.3 Fungi have garnered a widespread
negative connotation since they were first reported to cause disease in 1839.4 In
particular, fungi are known to produce mycotoxins, which have been linked to numerous
types of human and animal diseases.4 Mycotoxins are especially problematic in
agriculture because fungi (and the metabolites they produce) can contaminate both cereal
crops and stored grains. On the other hand, fungi can also be used in a beneficial manner.
For example, some fungi (e.g., yeasts) are used in fermentation processes in the
preparation of certain foods/drinks, while others are important to the industrial production
of beneficial enzymes.5
Perhaps more importantly, fungi have long been recognized as possessing the
ability to produce novel bioactive secondary metabolites, some of which have enabled
significant advances in human health and agriculture, with vast impacts on societal and
economic growth.6 Although fungi have proven to be prolific producers of diverse
bioactive secondary metabolites, a great many fungi remain to be chemically explored.
These observations argue strongly for continued exploration of fungal chemistry in order
to help meet the increasing demand for new medicinally and agriculturally beneficial
agents.
2
HN
O N
S
O
OOH
CH3
CH3
1
Fungi are often categorized into various ecological groups. Some of these groups
include freshwater fungi (fungi isolated from both flowing and still freshwater habitats),
fungicolous/mycoparasitic fungi (fungi isolated from tissues of other fungi), endophytic
fungi (fungi living symbiotically with plants), and plant pathogenic fungi (fungi that
cause disease/damage to host plants).
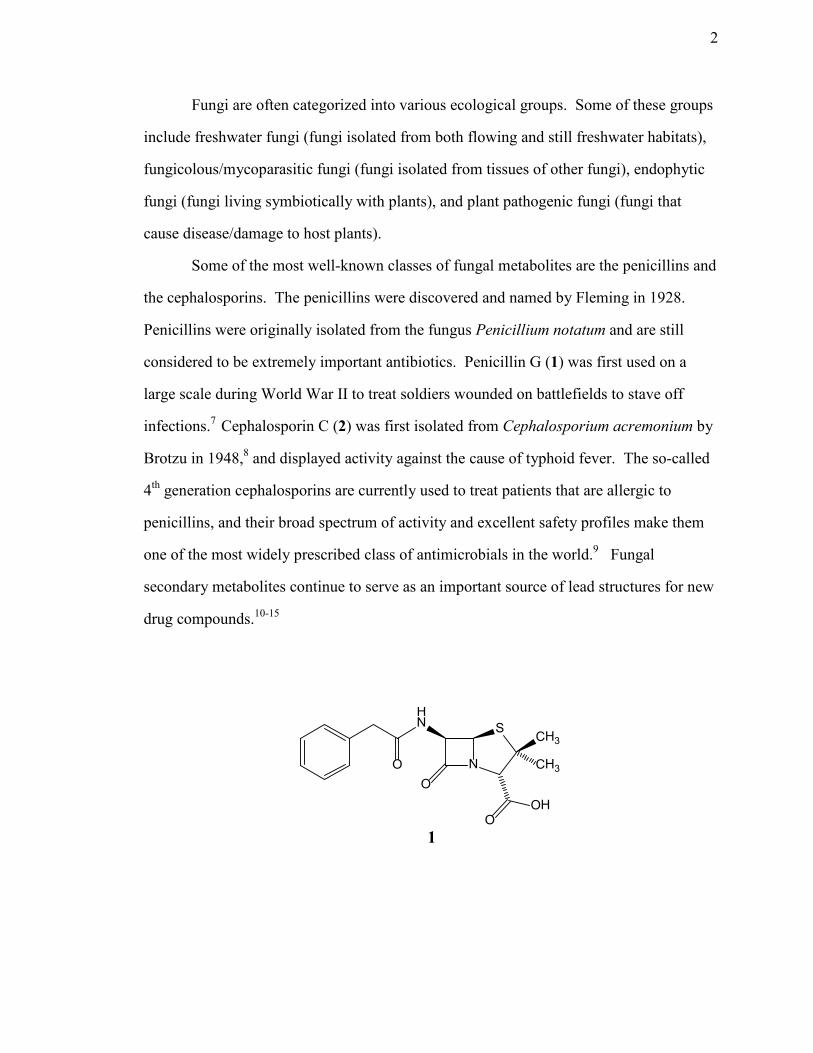
Some of the most well-known classes of fungal metabolites are the penicillins and
the cephalosporins. The penicillins were discovered and named by Fleming in 1928.
Penicillins were originally isolated from the fungus Penicillium notatum and are still
considered to be extremely important antibiotics. Penicillin G (1) was first used on a
large scale during World War II to treat soldiers wounded on battlefields to stave off
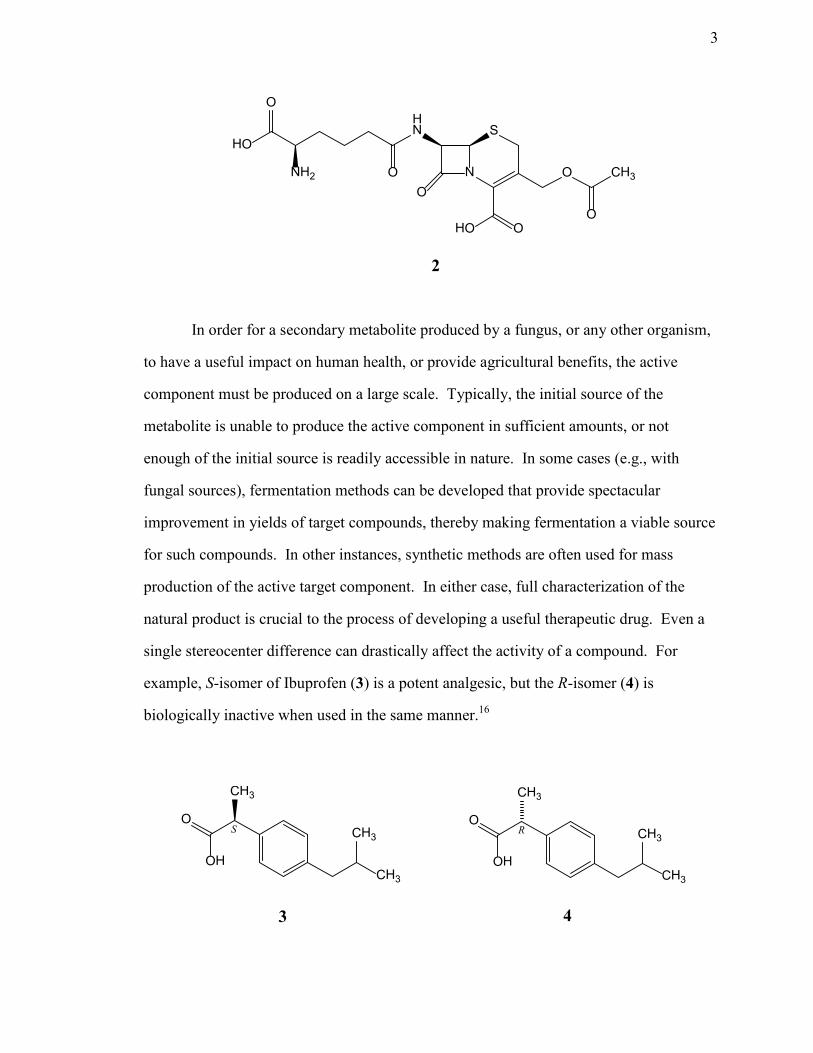
infections.7 Cephalosporin C (2) was first isolated from Cephalosporium acremonium by
Brotzu in 1948,8 and displayed activity against the cause of typhoid fever. The so-called
4th generation cephalosporins are currently used to treat patients that are allergic to
penicillins, and their broad spectrum of activity and excellent safety profiles make them
one of the most widely prescribed class of antimicrobials in the world.9 Fungal
secondary metabolites continue to serve as an important source of lead structures for new
drug compounds.10-15
3
O
OHCH3
CH3
CH3
S
3
O
OHCH3
CH3
CH3
R
4
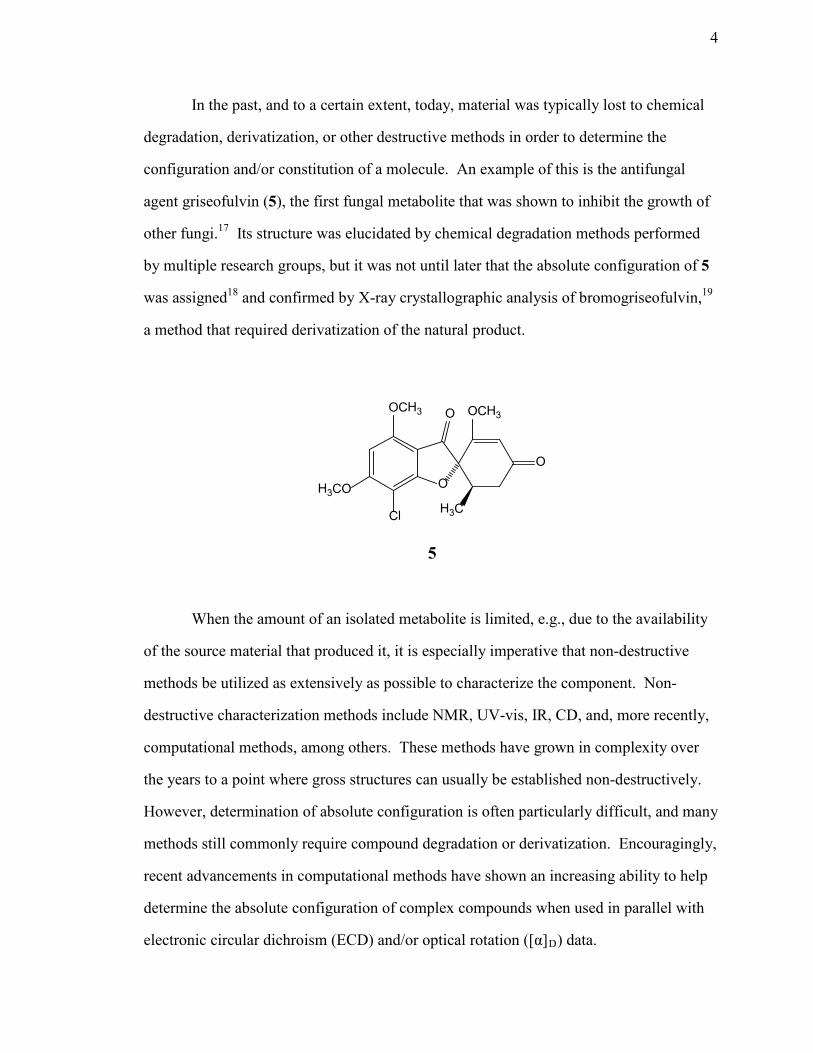
In order for a secondary metabolite produced by a fungus, or any other organism,
to have a useful impact on human health, or provide agricultural benefits, the active
component must be produced on a large scale. Typically, the initial source of the
metabolite is unable to produce the active component in sufficient amounts, or not
enough of the initial source is readily accessible in nature. In some cases (e.g., with
fungal sources), fermentation methods can be developed that provide spectacular
improvement in yields of target compounds, thereby making fermentation a viable source
for such compounds. In other instances, synthetic methods are often used for mass
production of the active target component. In either case, full characterization of the
natural product is crucial to the process of developing a useful therapeutic drug. Even a
single stereocenter difference can drastically affect the activity of a compound. For
example, S-isomer of Ibuprofen (3) is a potent analgesic, but the R-isomer (4) is
biologically inactive when used in the same manner.16
N
S
O CH3
OOHO
HN
HO
O
NH2 OO
2
4
O
O
H3CCl
H3CO
OCH3 O OCH3
5
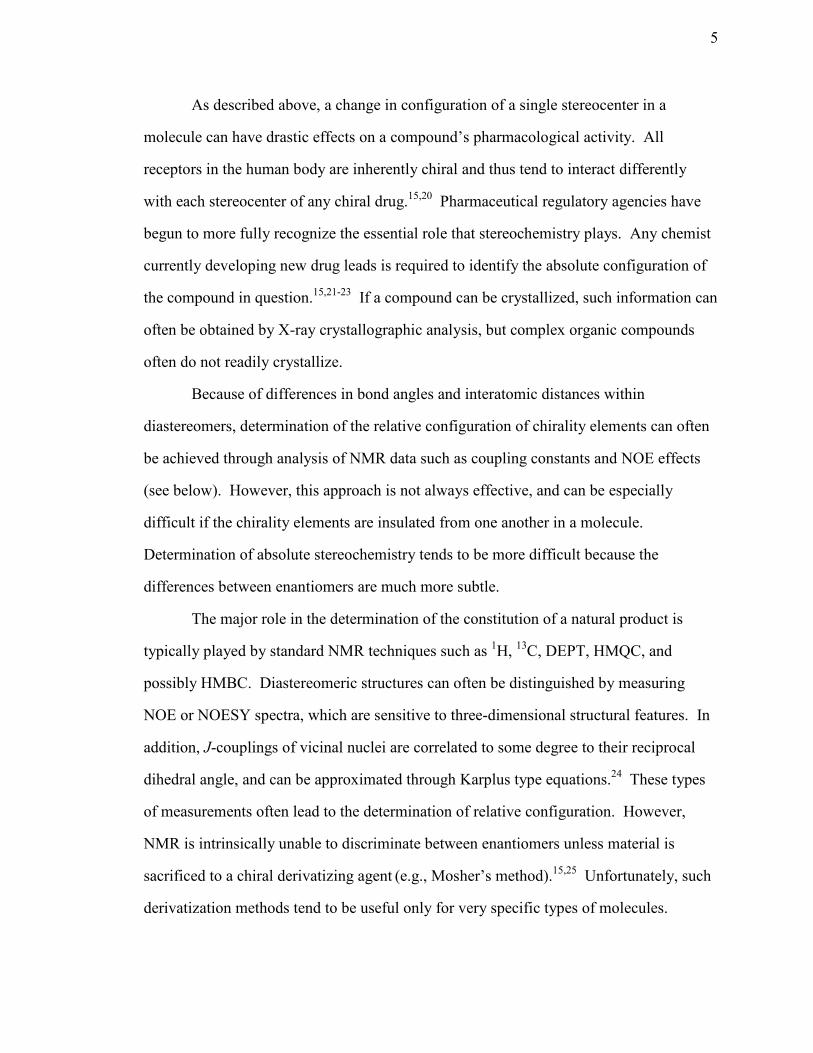
In the past, and to a certain extent, today, material was typically lost to chemical
degradation, derivatization, or other destructive methods in order to determine the
configuration and/or constitution of a molecule. An example of this is the antifungal
agent griseofulvin (5), the first fungal metabolite that was shown to inhibit the growth of
other fungi.17 Its structure was elucidated by chemical degradation methods performed
by multiple research groups, but it was not until later that the absolute configuration of 5
was assigned18 and confirmed by X-ray crystallographic analysis of bromogriseofulvin,19
a method that required derivatization of the natural product.
When the amount of an isolated metabolite is limited, e.g., due to the availability
of the source material that produced it, it is especially imperative that non-destructive
methods be utilized as extensively as possible to characterize the component. Non-
destructive characterization methods include NMR, UV-vis, IR, CD, and, more recently,
computational methods, among others. These methods have grown in complexity over
the years to a point where gross structures can usually be established non-destructively.
However, determination of absolute configuration is often particularly difficult, and many
methods still commonly require compound degradation or derivatization. Encouragingly,
recent advancements in computational methods have shown an increasing ability to help
determine the absolute configuration of complex compounds when used in parallel with
electronic circular dichroism (ECD) and/or optical rotation ([α]D) data.
5
As described above, a change in configuration of a single stereocenter in a
molecule can have drastic effects on a compound’s pharmacological activity. All
receptors in the human body are inherently chiral and thus tend to interact differently
with each stereocenter of any chiral drug.15,20 Pharmaceutical regulatory agencies have
begun to more fully recognize the essential role that stereochemistry plays. Any chemist
currently developing new drug leads is required to identify the absolute configuration of
the compound in question.15,21-23 If a compound can be crystallized, such information can
often be obtained by X-ray crystallographic analysis, but complex organic compounds
often do not readily crystallize.
Because of differences in bond angles and interatomic distances within
diastereomers, determination of the relative configuration of chirality elements can often
be achieved through analysis of NMR data such as coupling constants and NOE effects
(see below). However, this approach is not always effective, and can be especially
difficult if the chirality elements are insulated from one another in a molecule.
Determination of absolute stereochemistry tends to be more difficult because the
differences between enantiomers are much more subtle.
The major role in the determination of the constitution of a natural product is
typically played by standard NMR techniques such as 1H, 13C, DEPT, HMQC, and
possibly HMBC. Diastereomeric structures can often be distinguished by measuring
NOE or NOESY spectra, which are sensitive to three-dimensional structural features. In
addition, J-couplings of vicinal nuclei are correlated to some degree to their reciprocal
dihedral angle, and can be approximated through Karplus type equations.24 These types
of measurements often lead to the determination of relative configuration. However,
NMR is intrinsically unable to discriminate between enantiomers unless material is
sacrificed to a chiral derivatizing agent (e.g., Mosher’s method).15,25 Unfortunately, such
derivatization methods tend to be useful only for very specific types of molecules.

6
Moreover, non-destructive methods would be preferable for the assignment of absolute
configuration of molecules that are in limited supply.
An overwhelming majority of biologically important molecules, including
secondary metabolites from fungi, are chiral.26-28 Chirality of molecules is manifested in
chiroptical effects such as specific rotation ([α]D) and ECD data, both of which can be
measured without the loss of material. Optical rotation is observed when plane-polarized
light is passed through a chiral environment, which causes the light plane to rotate in a
particular direction.29-31 Optical rotatory dispersion (ORD) – variations seen in the
rotation of plane-polarized light when the wavelength of light is changed – can be of use
if additional information is required. Circular dichroism (CD) is based on the differential
interaction of a chiral sample with left-helical and right-helical circularly polarized
light.32,33 Circularly polarized light and the more familiar plane-polarized light are
readily interconvertible through the implementation of a quarter-wave retarder. Plane-
polarized light consists of right-and left-circularly polarized beams of equal intensity,
while circularly polarized light consists of two orthogonal plane-polarized beams of equal
intensity that are 90° out of phase (Figure 1).33
Figure 1. Depiction of Right-Handed Circularly Polarized Light (Perpendicular Waves are of Equal Amplitude).33
7
A CD spectrum has a general appearance that bears resemblance to a UV
spectrum, except that a CD spectrum incorporates both positive and negative values.
When a material absorbs left-handed and right-handed circularly polarized light
unequally, due to molecular asymmetry involving a chromophore, a differential
absorption manifests itself in the form of elliptically polarized light (Figure 2). As
modeled in the equations in Scheme 1, the shape of the CD curve is the result of this
unequal absorption at varying wavelengths.34 For example, if a material absorbs right-
handed circularly polarized light more than left-handed circularly polarized light, at a
particular wavelength, a negative value in the CD spectrum will result and is reported as
molar ellipticity (θ) on the y-axis. When analyzing a CD-active compound, a particular
configuration of the molecule will result in a unique CD spectrum, and if one were to
analyze the enantiomer of the compound, one would observe a CD curve that is the
inverse of the original. This is due to the fact that if a molecule absorbs right-handed
circularly polarized light more at a particular wavelength, its enantiomer (opposite
configuration) will absorb left-handed circularly polarized light more at the same
wavelength, resulting in a θ that is exactly opposite. This difference is one of the reasons
why CD can distinguish between enantomeric forms of chiroptical compounds. A series
of simple mathematical equations (Scheme 1) that relates CD to the Beer-Lambert law,
where ε l is the molar extinction coefficient of the solute measured using the ellipticity
value reported in CD data, is shown below.34 In these equations, ΔA is the difference in
absorbance, c is the concentration, and 𝑙 is the path length.

8
∆𝐴 = ∆𝜀𝑐𝑙, where ∆𝜀 = 𝜀𝑙 − 𝜀𝑟
𝜃 = 33 ∆A, (θ = ellipticity, approximated in radians)
(enables direct correlation of CD to ellipticity)
[𝜃] = 100𝜃/𝑐𝑙, ([θ] = the molar ellipticity)
∴, [𝜃] = 3300∆𝜀
Scheme 1. Equations that Relate Ellipticity and Molar Ellipticity to the Beer-Lambert Law and the Interactions Chiroptical Molecules with Circularly Polarized Light in a CD Experiment.34
Figure 2. Depiction of Right-handed Elliptically Polarized Light (Perpendicular Waves are of Unequal Amplitude).33
Djerassi pioneered the application of ORD and CD to the determination of
absolute configuration in which he related ORD to CD, and vice versa.35,36 CD is
generally simpler to interpret than ORD and is by far more commonly used. As
9
O
OOHOH
OH
CH3OH
H3C
6
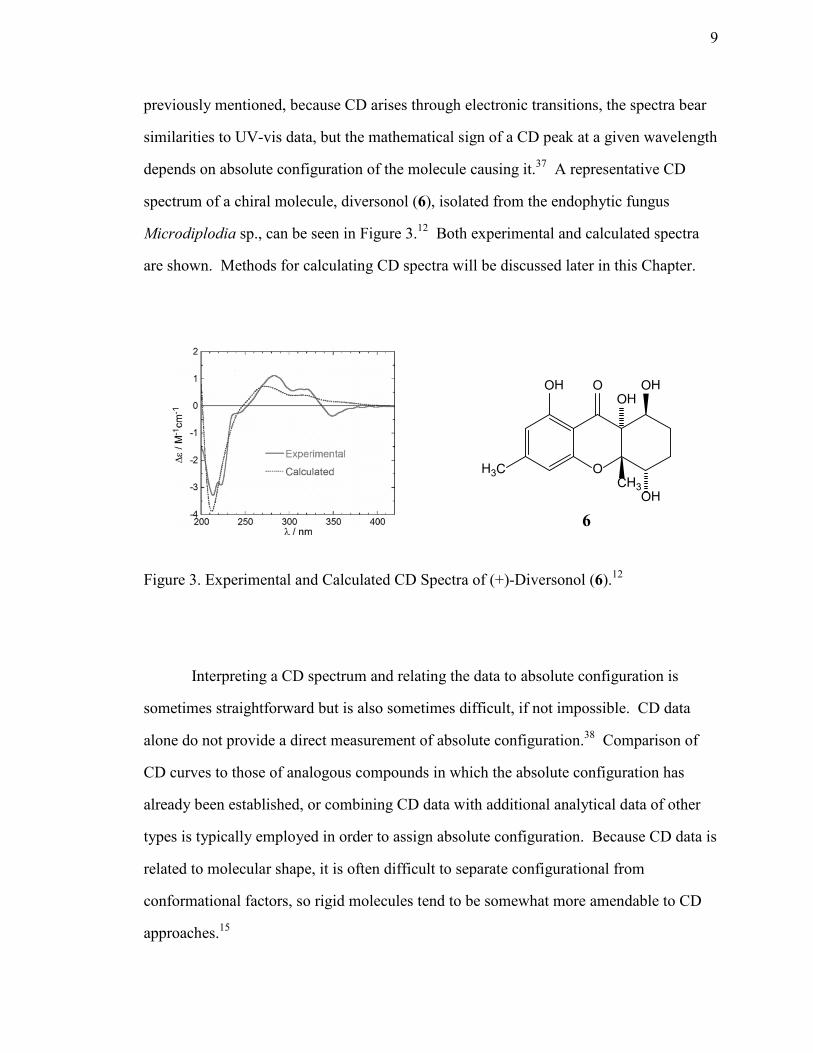
previously mentioned, because CD arises through electronic transitions, the spectra bear
similarities to UV-vis data, but the mathematical sign of a CD peak at a given wavelength
depends on absolute configuration of the molecule causing it.37 A representative CD
spectrum of a chiral molecule, diversonol (6), isolated from the endophytic fungus
Microdiplodia sp., can be seen in Figure 3.12 Both experimental and calculated spectra
are shown. Methods for calculating CD spectra will be discussed later in this Chapter.
Figure 3. Experimental and Calculated CD Spectra of (+)-Diversonol (6).12
Interpreting a CD spectrum and relating the data to absolute configuration is
sometimes straightforward but is also sometimes difficult, if not impossible. CD data
alone do not provide a direct measurement of absolute configuration.38 Comparison of
CD curves to those of analogous compounds in which the absolute configuration has
already been established, or combining CD data with additional analytical data of other
types is typically employed in order to assign absolute configuration. Because CD data is
related to molecular shape, it is often difficult to separate configurational from
conformational factors, so rigid molecules tend to be somewhat more amendable to CD
approaches.15
10
Traditionally, analysis of CD data involved application of various empirical and
semi-empirical rules for individual molecule classes enable proposal of the
stereochemistry of a molecule. Empirical and semi-empirical approaches are, in some
cases, the simplest way of interpreting CD spectra, although their application has
diminished in recent years as complimentary computational methods have emerged.15
Evaluation of the Cotton effect (CE)43-45 observed in the CD spectrum lead to the
development of these well-established empirical “rules”, which include the octant rules,
first described by Djerassi et al. in 1960,36,42 and the exciton chirality method, pioneered
by Nakanishi, et al.,42-45 which sometimes requires chemical derivatization of the
compound in order to incorporate additional chromophores. Each of these methods are
reviewed in detail in other publications,36,42-45 so they are not addressed here, and neither
is applicable to all cases.
In principle, any chiral compound that contains even a weak chromophore, such
as a ketone, that absorbs in the UV-vis region of the spectrum (190-700 nm) is liable to
show some features in its CD spectrum that are likely to be related in some way to
absolute configuration. However, many such compounds do not have the structural
features required to enable straightforward application of the above empirical “rules”.
Over the past couple of decades, computational chemistry based on ab initio
(first-principles) theory has gone from being a highly specialized endeavor to mainstream
practice.26 These first-principle methods can be used to predict, confirm, and even assign
experimental data. Chiroptical data (i.e., CD and [α]D) can now be predicted using semi-
empirical quantum mechanical methods such as density functional theory (DFT) or time-
dependent DFT (TDDFT) for moderately complex molecules.46-49 Thus, comparison of
experimental CD spectra with spectra calculated using such methods offers an emerging
method for non-destructive assignment of absolute stereochemistry, even for molecules
that do not lend themselves well to analysis by empirical methods.

11
The calculations associated with determining energy minimized structures and
then computing chiroptical properties are somewhat daunting for non-specialists. A wide
variety of mathematical equations are used in the calculation of chiroptical properties, but
detailed discussion of these protocols are beyond the scope of this thesis. Reviews and
additional examples that contain in-depth mathematical descriptions of these methods can
be found in the literature.26,32,50-55
The mathematical equations that are employed for these calculations include a
wide variety of functionals, the most popular of which is B3LYP (Becke, 3-parameter,
Lee-Yang-Parr implicit density functional).53 Functionals comprise a map from a vector
space (three-dimensional space) to the field underlying the vector space, (i.e., a functional
takes a vector as the input and returns a scalar – a “projection”). In the quantum
mechanics of chemical structures, this means that functionals search for a state of the
system that minimizes the energy functional (i.e., they seek to determine a structure’s
global energy minimum). Other typically used functionals include PBE0,56
BH&HLYP,57,58 and BP86,58,59 as well as basis sets such as TZYP,60 aug-TZYP,61
ADZP,62 and aug-cc-pVDZ.63 Basis sets are sets of linearly independent vectors that, in
combination, represent all vectors for a given space or coordinate system. This allows
the computational process to uniquely express every element (“atom in a molecule”)
within that space, thus allowing for structural identification of a molecule within the
defined space.
Input parameters and various aspects of the state, conformation, stereochemistry,
and flexibility of a given compound dictates how complex and computationally intensive
these calculations will be. Even with the vast computer capabilities available today,
calculations for energy minimization and subsequent CD spectra calculations at a suitable
level of theory can take days. In addition, such calculations often prove reliable only on
molecules of moderate size (~30 non-hydrogen atoms).45,64,65 However, due to continued
improvements in both hardware and software, and the availability of clusters, the time
12
spent on calculations can be substantially decreased. When taking into consideration the
costs and benefits of being able to make absolute configuration assignments with the aid
of calculations, this method is rapidly becoming a premier, and increasingly reliable, way
in which to acquire such information.
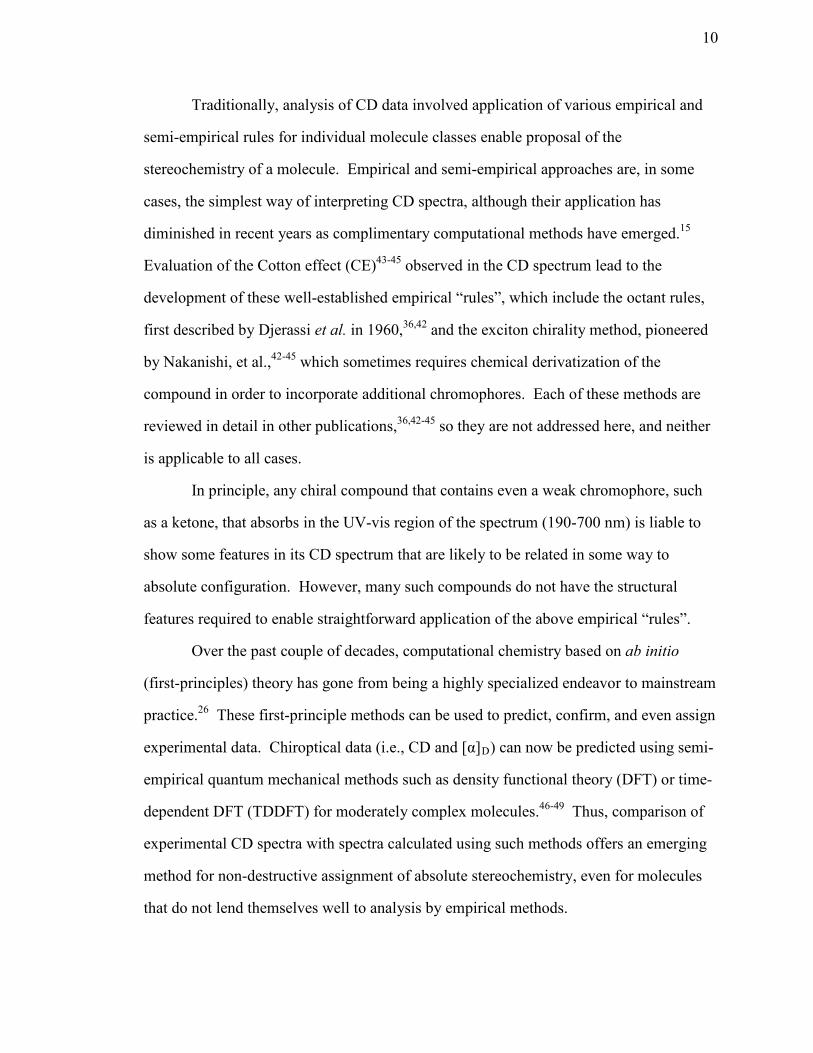
A recent paper by Cachet, N., et al.,66 exemplifies the benefits of TDDFT
calculations. Parazoanthine A was isolated as a major constituent of the Mediterranean
sea anemone Parazoanthus axinellae, and its structure was elucidated through the use of
NMR spectroscopic and mass spectrometric analyses.66 In order to assign the absolute
configuration of parazoanthine A as either S (7) or R (8), a comparison was made
between the experimental and TDDFT-calculated CD spectra. Both of the enantiomers
were subjected to energy minimization and subsequent CD spectral calculations using the
B3LYP/6-31++G functional approach (Figure 4).66 The experimental CD curve of
parazoanthine A exhibited a negative Cotton effect (CE) at 281 nm, and was therefore in
agreement with the calculated CD spectrum of the S-enantiomer, enabling assignment of
the structure of parazoanthine A as 7 (Figure 4).
7
8
NH
N
HO
O
O
NH NH2
NHS
NH
N
HO
O
O
NH NH2
NHR

13
Figure 4. Experimentally Measured CD Spectrum of S-Parazoanthine A (7) (Top) and TDDFT-Calculated CD Spectra of the S (7) and R (8) Enantiomers (Bottom).66
CD spectra can be collected for samples in various physical phases, including gas,
solid, and solution.10,67,68 Each have their virtues and drawbacks when attempting to
characterize natural products, but when it comes to utilizing calculations to assign the
absolute configuration, a CD measurement in the solid state is far superior. The reasons
for this are tied largely to the fact that a CD spectrum collected for a solution will be a
weighted average of the contributions from all populated conformations, whereas in the
solid state, especially in a crystalline lattice, configurations present tend to be much more
homogeneous.15 However, most of the time, natural products are available in only small
quantities (and seldom tend to be crystalline), making solution spectra the only kind that
can readily be obtained. Because of this, a large set of input structures must be
considered in the calculations, and the results must be representative of the entire group.
An obvious pitfall to this approach is the heavy reliance on calculations to determine

14
which conformers contribute to the overall spectrum and to what degree, before the CD
spectra themselves can even be calculated. Once all conformers of interest are
determined, CD calculations must then be run on each structure at the same level of
theory, resulting in significant additional calculation time when the molecule being
analyzed is flexible. Moreover, in order to deal with solute-solvent interactions, CD
calculations require a solvent model to be considered,64 adding further computation time
and sophistication.
Compounds that are able to be crystallized and undergo X-ray analysis have
inherent advantages to solute-solvent CD experiments. In the solid state, the overall
structure is determined with a high amount of accuracy by X-ray single-crystal
diffraction, and the molecular conformation is fixed (except for polymorphs).15 Both of
these advantages allow the prediction of the solid-state CD spectrum to be relatively
straightforward because the conformation has already been determined, thereby avoiding
the need for energy minimization calculations.69,70 Thus, it is typical that one sees
excellent agreement between experiment and theory in CD calculations for crystalline
solids, allowing the absolute configuration to be assigned with higher confidence.
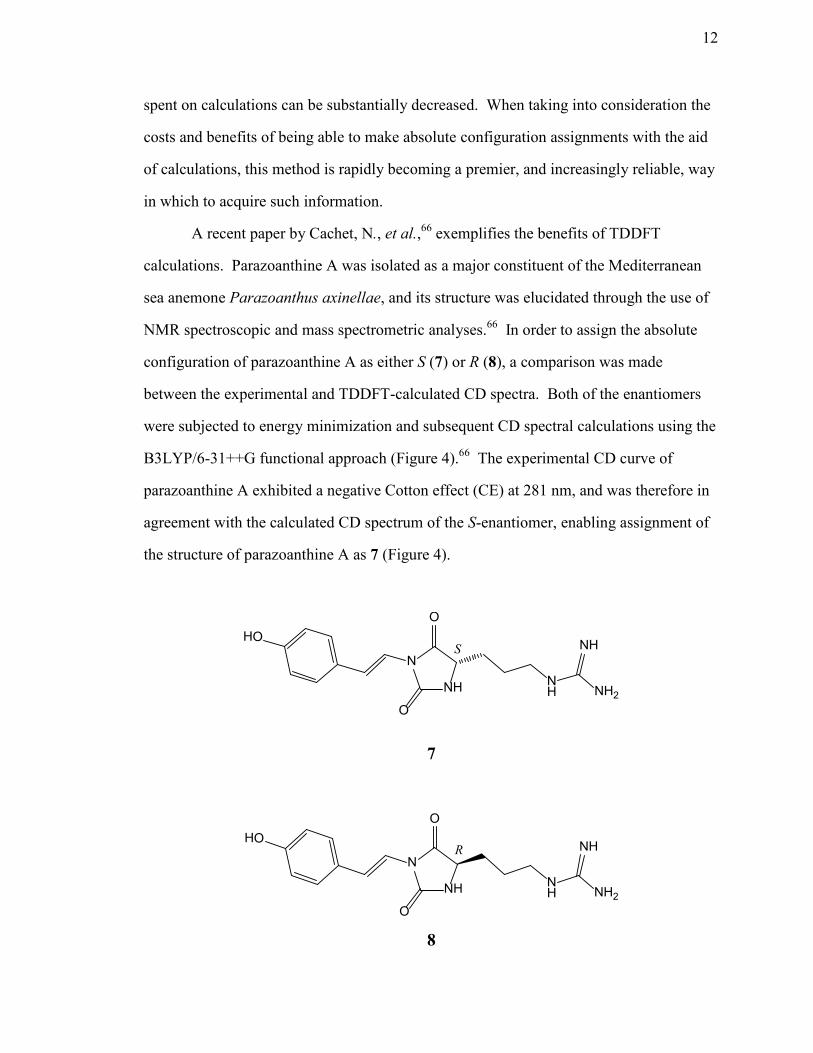
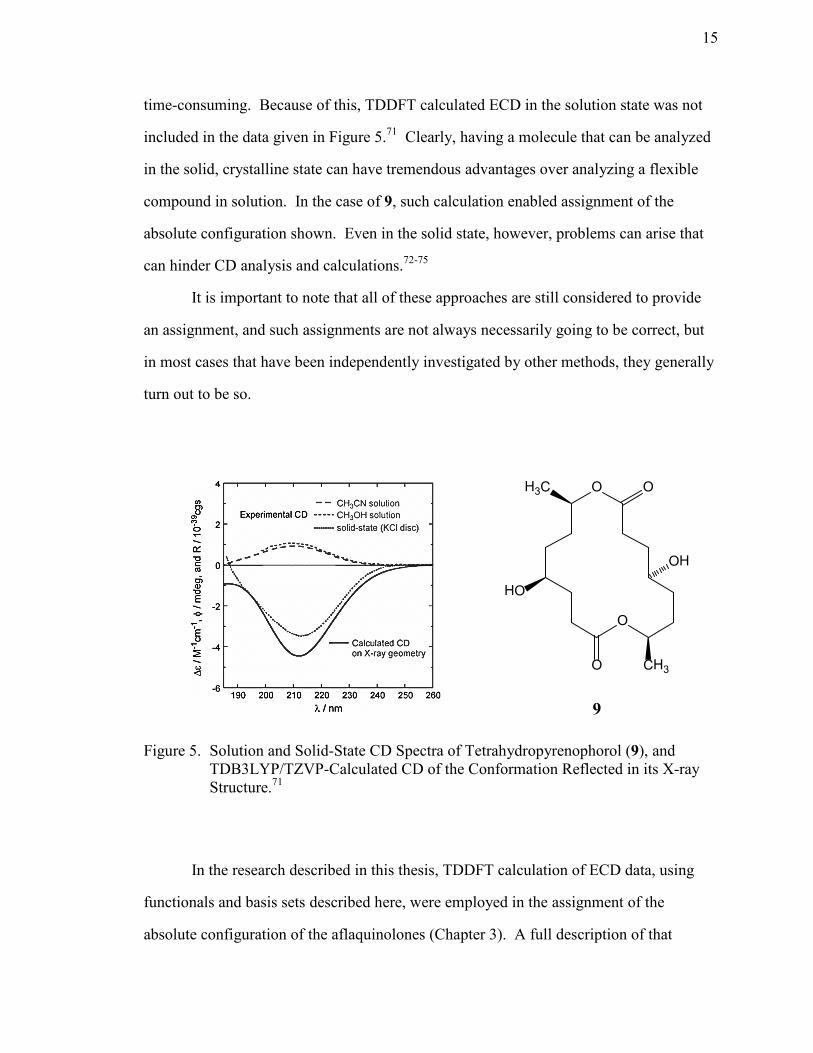
The absolute configuration assignment of tetrahydropyrenophorol (9), a bioactive
secondary metabolite from an endophytic Phoma sp., using the solid-state/TDDFT
methodology is a prime example of the difference in results obtained for solid state vs.
solution state data. (Figure 5).71 In this example, the experimental CD data collected in
the solution state is more or less inverted from that of the experimental CD data collected
in the solid state. This is caused by the extreme flexibility of the macrocycle in 9, leading
to a very different situation in the solution state. Through structure optimization using
AM1 energy calculations, it was discovered that there were at least 60 conformers in
solution that were within 3 kcal/mol of one another for 9.71 If one were to try and
produce a calculated CD spectrum for all of the identified conformers in the solution
state, and generate a relevant weighted average spectrum, it would be overwhelming
15
OH3C
HO
O
O
CH3
OH
O
9
time-consuming. Because of this, TDDFT calculated ECD in the solution state was not
included in the data given in Figure 5.71 Clearly, having a molecule that can be analyzed
in the solid, crystalline state can have tremendous advantages over analyzing a flexible
compound in solution. In the case of 9, such calculation enabled assignment of the
absolute configuration shown. Even in the solid state, however, problems can arise that
can hinder CD analysis and calculations.72-75
It is important to note that all of these approaches are still considered to provide
an assignment, and such assignments are not always necessarily going to be correct, but
in most cases that have been independently investigated by other methods, they generally
turn out to be so.
Figure 5. Solution and Solid-State CD Spectra of Tetrahydropyrenophorol (9), and TDB3LYP/TZVP-Calculated CD of the Conformation Reflected in its X-ray Structure.71
In the research described in this thesis, TDDFT calculation of ECD data, using
functionals and basis sets described here, were employed in the assignment of the
absolute configuration of the aflaquinolones (Chapter 3). A full description of that

16
process and results will be presented in Chapter 3. Such an approach may also ultimately
be useful in assign the absolute configuration of emeridin A (Chapter 5) although further
complexities are present in that case.
As was stated above, other chiroptical properties, such as [α]D, can also be
calculated based on similar quantum mechanics functionals and mathematical equations
used for CD calculations. Even calculation of theoretical CD spectra is a relatively new
capability in the field, the ability of increasingly advanced calculations to predict
stereochemistry directly from [α]D would be beneficial, as [α]D is a simpler measurement
than CD and does not require the molecule have a particular chromophore. It has long
been understood that one can relate [α]D and its dispersion (ORD) to CD, and vice versa,
through Kramers-Kronig (KK) transformations.76-79 The KK transformations provide the
foundation for determining absolute configuration of a compound directly from [α]D.
Through the application of simple mathematical equations, in tandem with ab
initio TDDFT and gauge-invariant atomic orbitals (GIAOs),50,80 Stephens, et al. have
developed a methodology for calculating [α]D.55 In doing so, they also used the hybrid
functionals, mentioned above, as well as additional base functions. Using the sodium D
line for measurements, they were able to establish an average deviation between
calculated and experimental specific rotation of 20–25 degrees.55 One obvious problem
given these results is that molecules that have specific rotations less than 25 degrees, or
values of similar magnitude would not be amenable to reliable analysis by this method.
For example, an attempt was made to calculate the [α]D of endo-isocamphane (10),81 and
a value of -11 was determined. When compared to the experimental value of +6.3 for 10,
the unreliability of this method is obvious.81 However, when an attempt was made to
calculate the [α]D of prezizaene (11), originally isolated by Anderson and co-workers,82 a
value of +54 was determined, and when compared to the experimental value of +55
clearly demonstrating the promise this method could have in assigning the absolute
configuration directly from [α]D for small, rigid molecules. Overall, Stevens and co-
17
O
OH
H3C
H3CO CH3
OCH3
O
N
N
O
CH3
H3C CH3
12
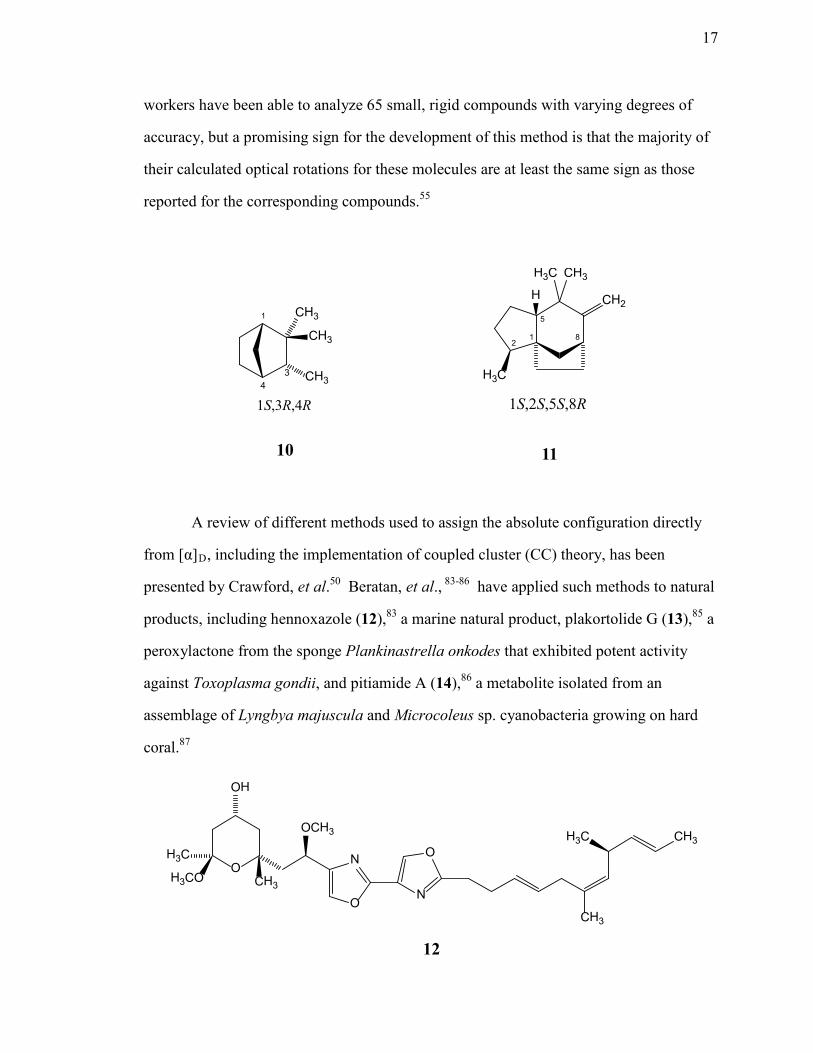
workers have been able to analyze 65 small, rigid compounds with varying degrees of
accuracy, but a promising sign for the development of this method is that the majority of
their calculated optical rotations for these molecules are at least the same sign as those
reported for the corresponding compounds.55
A review of different methods used to assign the absolute configuration directly
from [α]D, including the implementation of coupled cluster (CC) theory, has been
presented by Crawford, et al.50 Beratan, et al., 83-86 have applied such methods to natural
products, including hennoxazole (12),83 a marine natural product, plakortolide G (13),85 a
peroxylactone from the sponge Plankinastrella onkodes that exhibited potent activity
against Toxoplasma gondii, and pitiamide A (14),86 a metabolite isolated from an
assemblage of Lyngbya majuscula and Microcoleus sp. cyanobacteria growing on hard
coral.87
CH3
CH3
CH3
1S,3R,4R 4
3
1
10
H
H3C CH3
H3C
CH2
1S,2S,5S,8R
1 2
5 8
11

18
CH3 CH3
O
O
H
H
CH3
Cl
HN
CH3
O CH3 O
14
It is important to note that the protocols for determination of absolute
configuration directly from [α]D are in their infancy, even more so than the employed for
CD calculations. The molecules in which these approaches have been tested upon are
quite small, and the majority of the compounds tested are rigid. Even so, new ideas have
already begun to emerge as improvements to the “old” methods. For example, recent
studies have shown that using the Kohn-Sham density matrix method with London
atomic orbital theory, rather than the relatively well-established Hartree-Frock
method,88,89 has shown promise when used with the B3LYP functional.53
As will be discussed in Chapter 3, we employed the use of calculations to
estimate rotations of individual aflaquinolones, but the limitations mentioned above came
into play in this effort. Most natural products are significantly larger than the test
compounds typically used in developing these calculations, and they are far from rigid.
Ultimately, CD calculations have advantages over [α]D calculations in the inherent
13
19
measurement of values at many wavelengths, rather than a single wavelength data point.
Thus, conclusions are based how an overall shape of a curve rather than how a single data
point compares with a measured value.
This section has focused on providing a background summary of how chiroptical
data, in combination with calculations based on quantum mechanics, can assist
researchers in assigning absolute configuration of chiral natural products. These
techniques are becoming invaluable to the characterization process for bioactive natural
products because they provide new avenues for elucidating stereochemistry, which is
traditionally one of the most difficult features of a structure to determine. The methods
described provide non-destructive, and increasingly more accurate and less time-
consuming methods to fully characterize stereochemical features of a wide variety of
metabolites. The use of these techniques provided us with the ability to assign the
absolute configuration of the aflaquinolones (Chapter 3) without having to destroy a
significant portion of the limited amount of sample that was available.
Up to this point, this introduction has focused on the application of modern
chiroptical methods in combination with computational methods to assign absolute
configuration. Another substantial portion of this thesis (Chapters 7 and 8) discusses the
details of the characterization of secondary metabolites from Arachis hypogaea (peanut)
seeds that were challenged by the fungal species Aspergillus caelatus.90-93 The remainder
of this introduction provides a brief background on secondary metabolites previously
isolated from A. hypogaea. Similarities between our chemical investigations of fungi and
peanut seeds are evident, as both projects involve efforts to discover new bioactive
natural products. However, the peanut research did not require detailed stereochemical
investigations, and was facilitated to some degree by the background information
available on previously described peanut metabolites summarized here.
Peanut crops are a significant source of income for local and state economies in
the Southeastern United States. In 2010, the nation-wide peanut harvest brought in

20
O
O
OH
OH
OH
HO
15
O
OH
H
HO
OCH3
16
nearly $1 billion.94 Continued yields that are this high, or higher ($1.2 billion in 2008),94
depend heavily on the crop’s ability to resist invasion by fungi or other pests, especially
during reproductive stages. Peanut plants naturally produce secondary metabolites that
help to protect from outside invasion (phytoalexins). These antibiotic phytoalexins
include both flavonoids and stilbenes.95 One of the major functions of flavonoids in the
peanut plant is to kill or inhibit the growth or reproduction of prospective pathogenic
bacterial, fungal, and viral invaders, as well as protozoans.95,96 Examples of flavonoids
isolated from peanut plants include eriodicyol (15),97 medicapin (16),98 and quercetin-3-
glucoside (17).96
O
O
OH
OH
O OHO
OH
OH
OHOH
HO
17
21
OCH3
OCH3
CH3
CH3
HO
HO
18
OH
OH
HO
HO
19
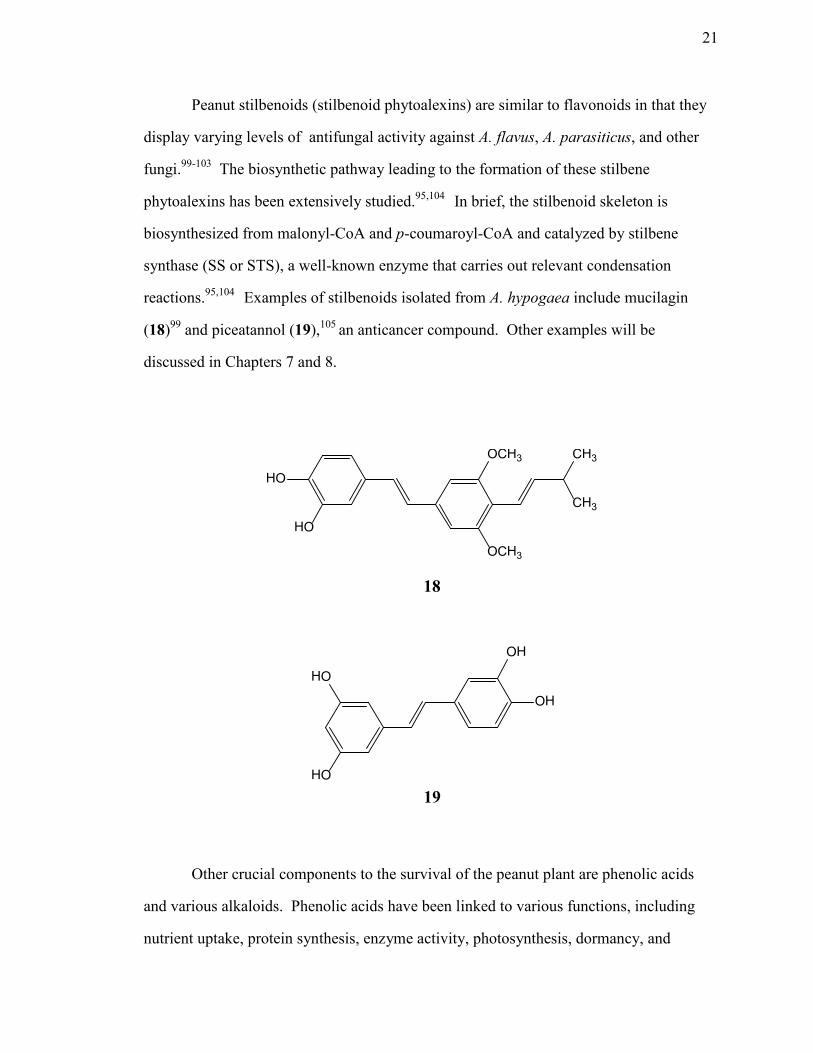
Peanut stilbenoids (stilbenoid phytoalexins) are similar to flavonoids in that they
display varying levels of antifungal activity against A. flavus, A. parasiticus, and other
fungi.99-103 The biosynthetic pathway leading to the formation of these stilbene
phytoalexins has been extensively studied.95,104 In brief, the stilbenoid skeleton is
biosynthesized from malonyl-CoA and p-coumaroyl-CoA and catalyzed by stilbene
synthase (SS or STS), a well-known enzyme that carries out relevant condensation
reactions.95,104 Examples of stilbenoids isolated from A. hypogaea include mucilagin
(18)99 and piceatannol (19),105 an anticancer compound. Other examples will be
discussed in Chapters 7 and 8.
Other crucial components to the survival of the peanut plant are phenolic acids
and various alkaloids. Phenolic acids have been linked to various functions, including
nutrient uptake, protein synthesis, enzyme activity, photosynthesis, dormancy, and
22
21
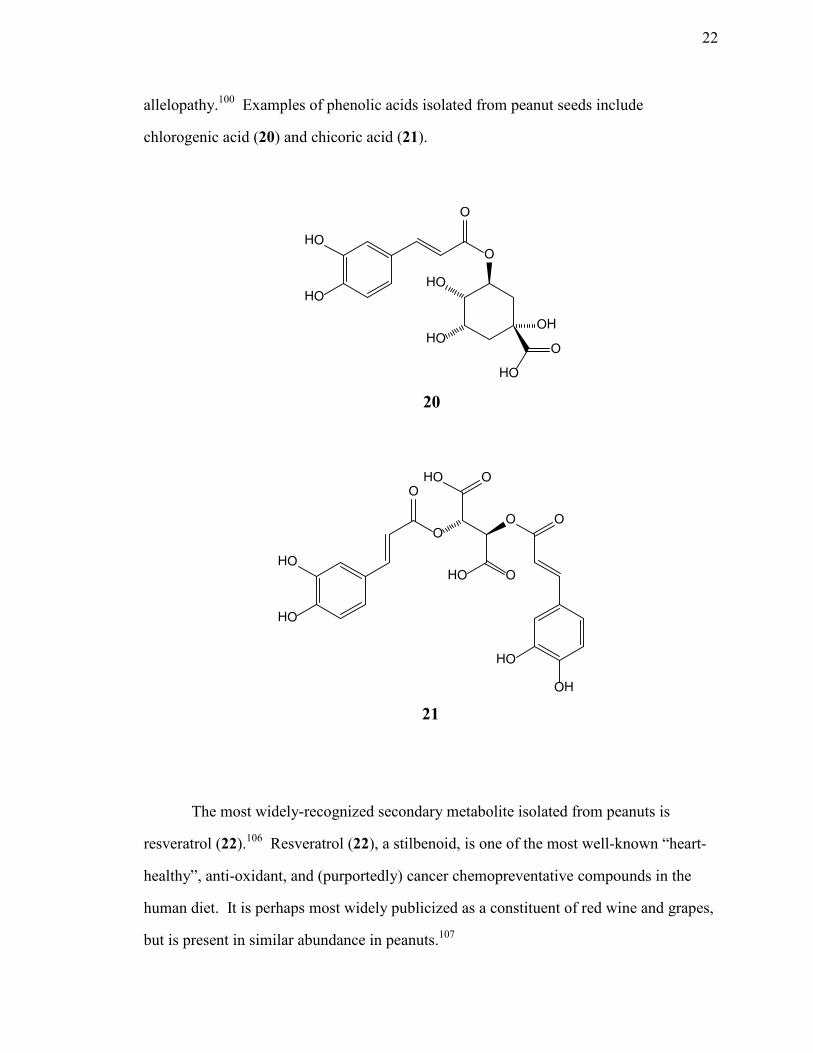
allelopathy.100 Examples of phenolic acids isolated from peanut seeds include
chlorogenic acid (20) and chicoric acid (21).
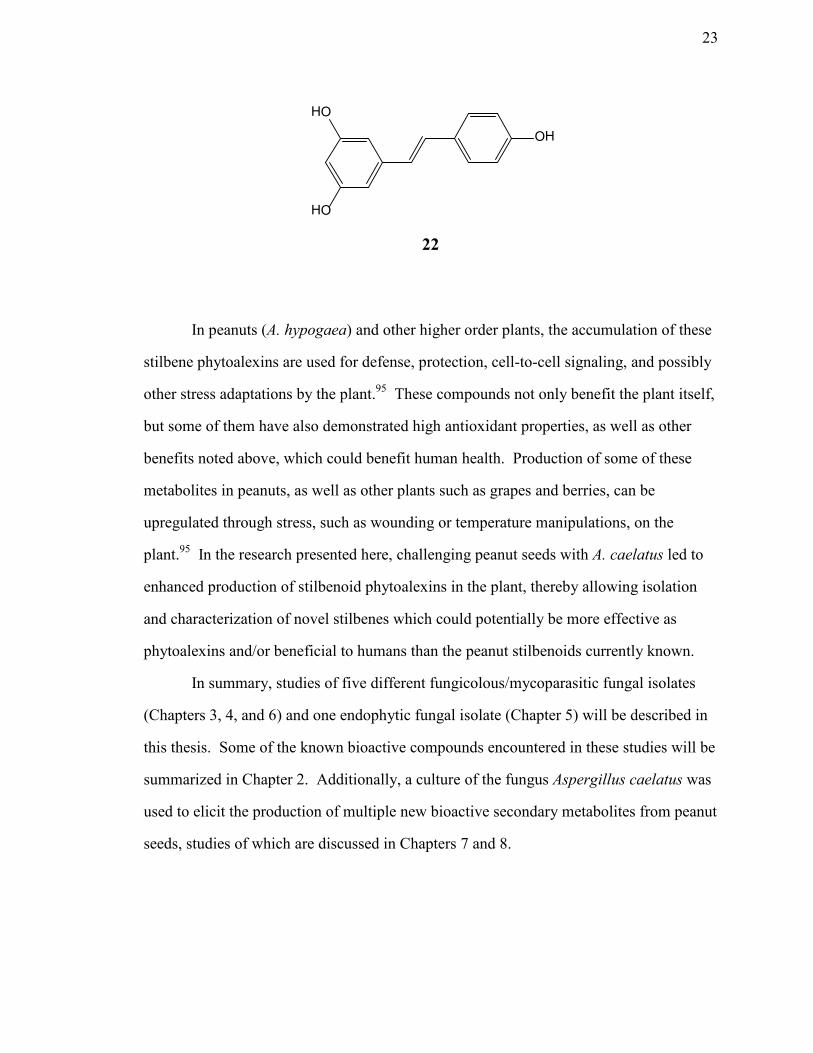
The most widely-recognized secondary metabolite isolated from peanuts is
resveratrol (22).106 Resveratrol (22), a stilbenoid, is one of the most well-known “heart-
healthy”, anti-oxidant, and (purportedly) cancer chemopreventative compounds in the
human diet. It is perhaps most widely publicized as a constituent of red wine and grapes,
but is present in similar abundance in peanuts.107
O
OHO
O
HO O
O
OH
HO
O
HO
HO
O
O
HO
HOHO
HOOH
O
HO
20
23
HO
HO
OH
In peanuts (A. hypogaea) and other higher order plants, the accumulation of these
stilbene phytoalexins are used for defense, protection, cell-to-cell signaling, and possibly
other stress adaptations by the plant.95 These compounds not only benefit the plant itself,
but some of them have also demonstrated high antioxidant properties, as well as other
benefits noted above, which could benefit human health. Production of some of these
metabolites in peanuts, as well as other plants such as grapes and berries, can be
upregulated through stress, such as wounding or temperature manipulations, on the
plant.95 In the research presented here, challenging peanut seeds with A. caelatus led to
enhanced production of stilbenoid phytoalexins in the plant, thereby allowing isolation
and characterization of novel stilbenes which could potentially be more effective as
phytoalexins and/or beneficial to humans than the peanut stilbenoids currently known.
In summary, studies of five different fungicolous/mycoparasitic fungal isolates
(Chapters 3, 4, and 6) and one endophytic fungal isolate (Chapter 5) will be described in
this thesis. Some of the known bioactive compounds encountered in these studies will be
summarized in Chapter 2. Additionally, a culture of the fungus Aspergillus caelatus was
used to elicit the production of multiple new bioactive secondary metabolites from peanut
seeds, studies of which are discussed in Chapters 7 and 8.
22
24
CHAPTER 2
SCREENING OF FUNGI
Most programs that seek to discover new bioactive fungal metabolites usually
screen large numbers of uncharacterized fungal isolates that are collected at random.
Individual isolates are then selected for chemical investigation on the basis of ensuing
bioassay results. However, this approach often leads to frequent encounters with known
compounds because different extracts may show similar activities due to the same
common component. In any such work, efficient dereplication processes are needed in
order to identify known compounds quickly and efficiently, leaving more time for the
analysis of novel compounds.
Most of our ongoing research projects employ an ecology-based approach to
explore the chemistry of fungi that compete with other fungi within specific ecological
niches.6,108 In certain types of fungal interactions, one or both of the competing fungi
display antagonism towards the other. This can be caused by the production of chemical
agents by one or both of the species that inhibit the growth of the other.6 Mycoparasitic
fungi are a group of fungal species that act as parasites of others, and the invaded fungi
often suffer damage from this colonization, suggesting the possible production of
antifungal metabolites by the mycoparasite.6 A true parasitic relationship is difficult to
prove in most cases,109 and therefore the term “fungicolous” is used to describe a fungus
found colonizing another, but for which a true parasitic relationship has not been
unambiguously established.
Our group has shown that studies of fungicolous fungi can lead to the isolation of
a variety of new bioactive fungal metabolites, including antifungal agents.110-115 In the
course of our ongoing studies of fungicolous/mycoparasitic fungi, several additional
bioactive isolates were selected for chemical investigation in the work described here.
Some of these produced known compounds, while others yielded new metabolites.

25
In order to obtain fungicolous isolates for investigation, field collections are
performed primarily by a team lead by Dr. Donald T. Wicklow of the USDA, NCAUR in
Peoria, Illinois. Collections are most often made from the surfaces of long-lasting fungal
physiological structures such as stromata and basidiomata. The long-lived nature of these
kinds of nutrient-rich fungal bodies makes them especially prone to colonization by
fungicolous fungi. Fungicolous fungi are harvested from the surface of these structures
and cultured on potato dextrose agar (PDA) slants. Individual colonies are subsequently
isolated and cultured again until spores form. A spore suspension is then prepared and
added to autoclaved rice for solid-substrate fermentation lasting approximately 30 days.
The cultures are then extracted with EtOAc, and the resulting extracts are screened for
activity in standard disk assays against the fungi Aspergillus flavus (NRRL 6541) and
Fusarium verticillioides (NRRL 25457), as well as against Spodoptera frugiperda (the
fall armyworm), an economically important crop pest. A. flavus is not only an
opportunistic pathogen in humans,116 but it is also known to produce crop-contaminating
aflatoxins (carcinogenic metabolites),117 while F. verticillioides is a plant pathogen that
can damage cereal crops and produces fumonisins, which are also considered
carcinogenic.118
In addition to screening fungicolous and mycoparasitic fungi, our research group
also actively explores the chemistry of certain types of endophytic fungi.119,120
Endophytes are fungi that occur within the tissues of plants, often without causing
damage to the host. Our initial interest in fungal endophytes related to those found in
corn plants because of the prominence of corn in the economy of the Midwest, and
because endophytes of corn are underexplored. Corn (maize; Zea mays L.) is one of the
most important grains grown in the United States, valued at over $66 billion for the 2010
harvest alone.121 Iowa is the producer of approximately one fifth of the U.S. corn crop,
making it especially important to our state’s economy. Fungal endophytes have a
widespread presence across plant taxa and frequently produce structurally and

26
biologically intriguing compounds. The presence of any such types of compounds in
corn would take on added significance due to the likely exposure of livestock and
humans, either directly or indirectly, to their various effects. Therefore, metabolites
produced by these fungi in corn could be important to economics and public health.
Investigations of EtOAc extracts of both fungicolous/mycoparasitic and
endophytic fungi that were selected for study, due to their initial bioactivity, typically
begins by partitioning between acetonitrile and hexanes to partially de-fat the sample.
A 1H NMR spectrum of the acetonitrile-soluble portion is evaluated and if it is deemed to
be potentially interesting, e.g., to consists of metabolites other than simple aromatics,
lipids, or other well-known metabolites, it is further separated by NMR- and/or bioassay-
guided fractionation to assist in isolation of the compounds of interest and the
identification of known compounds that might be present. Dereplication of known
compounds is accomplished through comparisons of collected NMR and MS data and
evident partial structures to data available in-house and in commercial databases.122,123
Ideally, this can be accomplished at an early stage before extensive efforts are
undertaken. If no matches are encountered, the structures of the novel compounds are
determined using various spectroscopic techniques, including 2D NMR and HRMS.
Novel compounds that are isolated in sufficient amounts are tested for bioactivity.
Fifteen fungal extracts, including both endophytic and fungicolous isolates, were
selected for chemical investigation based on initial bioassay results (Table 1). Of those
fifteen, six of the isolates yielded various new secondary metabolites and the studies of
these isolates are described in this thesis.

27
Table 1. Antifungal and Antiinsectan Bioassay Results for the EtOAc Extracts of Selected Fungicolous/Mycoparasitic (MYC) and Endophytic (ENDO) Fungal Cultures
Organism (Culture Number)
Aspergillus flavusa
Fusarium verticillioidesa
Spodoptera frugiperdab
Chaetomium sp. (ENDO-3063)
mg/rg=21 cz/mz=8 na
Emericella nidulans (ENDO-3111)
mz=17 + rg=29 mz=17 + rg=23 90% rgr
Unidentified (ENDO-3191)
cz/mz=33 cz=33 50% rgr
Trichoderma longibrachiatum (MYC-1515)
mz=17 rg=57 25% rgr
Aspergillus sp. (section Flavipedes) (MYC-1580)
na rg=33 >75% rgr
Unidentified (MYC-1645)
na rg=21 na
Penicillium sp. (MYC-1729)
rg/mz=19 mz=23 + rg=27 na
Penicillium sp. (MYC-1805)
rg=33 rg/mz=25 75% rgr
Aspergillus puniaceus (MYC-1817)
cz=23 mz=17 + rg=31 75% rgr
Unidentified (MYC-1991)
na mz/rg=23 na
Stachybotrys parvispora (MYC-2013)
na mz=23 na
Penicillium sp. (MYC-2032)
cz=23 + mz=19 rg=21 na
Aspergillus sp. (section Flavipedes) (MYC-2048)
mz/rg=25wk mz=17 + rg=37 75% rgr
Unidentified (MYC-2109)
cz=37 mz/rg=27 na
Aspergillus sp. (section Flavipedes) (MYC-2144)
na mz=17 + rg=35 58%M; >75% rgr
aAntifungal assays were performed at test levels of 500 µg/disk (disk diameter = 12.5 mm; the diameters of the resulting inhibition zones are measured after 48 hr and given in mm). cz = clear zone (no growth throughout the zone from agar surface to the petri dish bottom); mz = mottled zone (mosaic of clear zone areas and appearance of patchy colony growth as a result of retarded development of small individual colonies); rg = reduced growth (fungus covers entire agar surface, but colony development is suppressed when contrasted with colony development outside the zone of inhibition); wk = weak; na = not active. bAntiinsectan assays of crude extracts were usually performed at an approximate dietary level of 2000 ppm. Results are expressed as % rgr (reduced growth rate) relative to controls, and when appropriate, % M (mortality).

28
N
HO N
HN
O
ONH
H
HO
O
23
NH
CH3O
N
OHN O
H3C CH3
O
NO
NH
HO
CH3
CH3
24
Studies of the remaining nine extracts, listed in Table 1, yielded only known
metabolites from various classes. Twelve other extracts (not listed in the table) were not
investigated after partitioning and preliminary 1H NMR analysis due to the appearance of
the spectrum. For example, if the data suggested the presence of only simple metabolites
or fat (Aspergillus clavatus ENDO-3047, Spegazzina tessarthra ENDO-3107,
Paecilomyces variotii ENDO-3135, Fusarium chlamydosporum ENDO-3172, and
unidentified isolates MYC-1738, MYC-1750, and MYC-2148) the extract was
abandoned. Results arising from studies of the extracts that yielded known fungal
metabolites, but did not afford novel compounds, are discussed briefly below.
Chemical investigation of a Penicillium sp. (MYC-1805) that showed modest
antifungal activity against A. flavus, F. verticillioides, and significant antiinsectan activity
against the fall armyworm, afforded the known compounds pseudocitreoindole (23)124
and cycloaspeptide A (24),125 the latter being a major metabolite of the culture. Although
diketopiperazines are commonly encountered as secondary metabolites, the occurrence of
β-Phe is relatively rare.124 Compound 23 was reported to show no activity against A.
flavus (NRRL 6541) at 200 µg/disk or in various disk assays against B. subtilis (ATCC
6051), S. aureus (ATCC 29213), and C. albicans (ATCC 90029).124 Cycloaspeptide A
(24) is not considered to be antifungal or antibacterial,125 but it does show modest
antiplasmodial activity against the malarial parasite Plasmodium falciparum.126

29
HN
OO
H3C
CH3
H
H3C
CH3
OH
OH
CH3H
26 25
OO CH3
O
HO
OH
Studies of a cryptic Aspergillus sp. (section Flavipedes; MYC-2144) extract
afforded the known compound trans-dehydrocurvularin (25)127 as well as multiple
compounds from the aspochalasin family, including aspochalasins C (26),128 E (27),129 I
(28),130 and J (29),130 and TMC-169 (30).131 The extract showed moderate antifungal
activity against F. verticillioides but showed potent antiinsectan activity against the fall
armyworm, killing 58% of the test insects while reducing the growth of the survivors by
more than 75%. Compound 25 is known to display a wide variety of activities including
antifungal,132 and anti-tumor effects,133 inhibition of plant pathogens,127 and antibacterial
activity against Pseudomonas syringae.133 Members of the aspochalasin family are
known to exhibit cytotoxicity against tumor cell lines130,131 and antimicrobial activity
against bacteria, fungi, and yeasts.128,134 However, literature does not describe any
antiinsectan activity for any of these compounds. Compound 25, 28, and 29 were also
isolated from the organic extracts of MYC-2048 (Chapter 3) and MYC-1580 (Chapter 4),
both of which were also cryptic Aspergillus sp. (section Flavipedes) extracts. The cause
of the antiinsectan activity of this extract has yet to be accounted for, as these known
bioactive compounds were not tested for antifungal activity against the fall armyworm at
the time of this report.

30
HN
OO
H3C
CH3
H
H3C
CH3
OH
OH
CH3H
OH
27
HN O
O
H3C
CH3
H
H3C
CH3
CH3H
O OHR
28 R = OH 29 R = H
The extract from MYC-1729, a Penicillium sp., showed moderate antifungal
activity against both A. flavus and F. verticillioides. Chemical investigations afforded the
known compound citrinin (31)135,136 as the major component of the extract. Citrinin (31)
was originally isolated from the fungus Penicillium citrinum and has subsequently been
isolated from other fungi. The compound is known to show phytotoxic activity.137
Compound 31 showed activity in our assay against F. verticillioides, exhibiting an
mottled inhibition zone of 22 mm after 48 hr when tested at 200 µg/disk. It also caused a
limited reduction (16%) in growth rate relative to controls in assays against the fall
armyworm when tested at a dietary level of 320 ppm.138
HN
OO
H3C
CH3
H
H3C
CH3
OH
CH3H
30

31
N
H3C
CH3
N
O
H3C
OH3C
CH3 NH3C
O
NH
H3C
O
CH3
HN
CH3 O
N
CH3
H3C
CH3
OHN
CH3H3CO
N
H3C CH3
H3CO
NH3C
ONH
O
H3CCH3
O
N
CH3
HO
H
CH3
CH3
CH3
Chemical investigation of the extract of an unidentified fungal culture (MYC-
2109) that showed antifungal activity against both A. flavus and F. verticillioides,
afforded the well-known compound cyclosporin A (32)139 as the major component.
Compound 32 is an immunosuppressive agent that is used clinically after transplant
surgery,139-141 and it also possesses antifungal and antiinsectan activity.140-142
32
O
O
HO
O OH
CH3 CH3
CH3
31

32
O OCH3
CH3
O
HO
H3C
34
O N
N
NH
O
CH3
CH3
O
H3C CH3
33
An Apsergillus puniaceus (MYC-1817) extract showed significant antifungal
activity against A. flavus, as well as moderate antifungal activity against F. verticillioides.
The extract also reduced the growth rate of the fall armyworm by 75%, when compared
to controls in a dietary assay. Chemical investigation yielded the known compounds
cinereain (33)143 and dihydropergillin (34).144 Compound 33 reportedly does not possess
any antimicrobial activity,145 but compounds 33 and 34 both show significant inhibition
of the growth of wheat coleoptiles.143,144 Although not a direct antifungal test, wheat
coleoptile bioassays have been used to detect mycotoxins, immunosuppressants, and
antifungal agents.143 Literature for compounds 33 and 34 do not mention antiinsectan
activity, so the component(s) responsible for the observed activity against the fall
armyworm in the crude extract were not explicitly identified.
A fermentation extract from a Chaetomium sp. (ENDO-3063), isolated as a corn
endophyte, showed modest antifungal activity against both A. flavus and F.
verticillioides. The extract afforded multiple known compounds from the well-
characterized chaetoglobosin family, including chaetoglobosins A (35)141 and F (36).141
Members of the chaetoglobosin family are well-known for having significant antifungal
activity,146 cytotoxicity,147,148 antiinsectan activity,149 and antibacterial effects.146
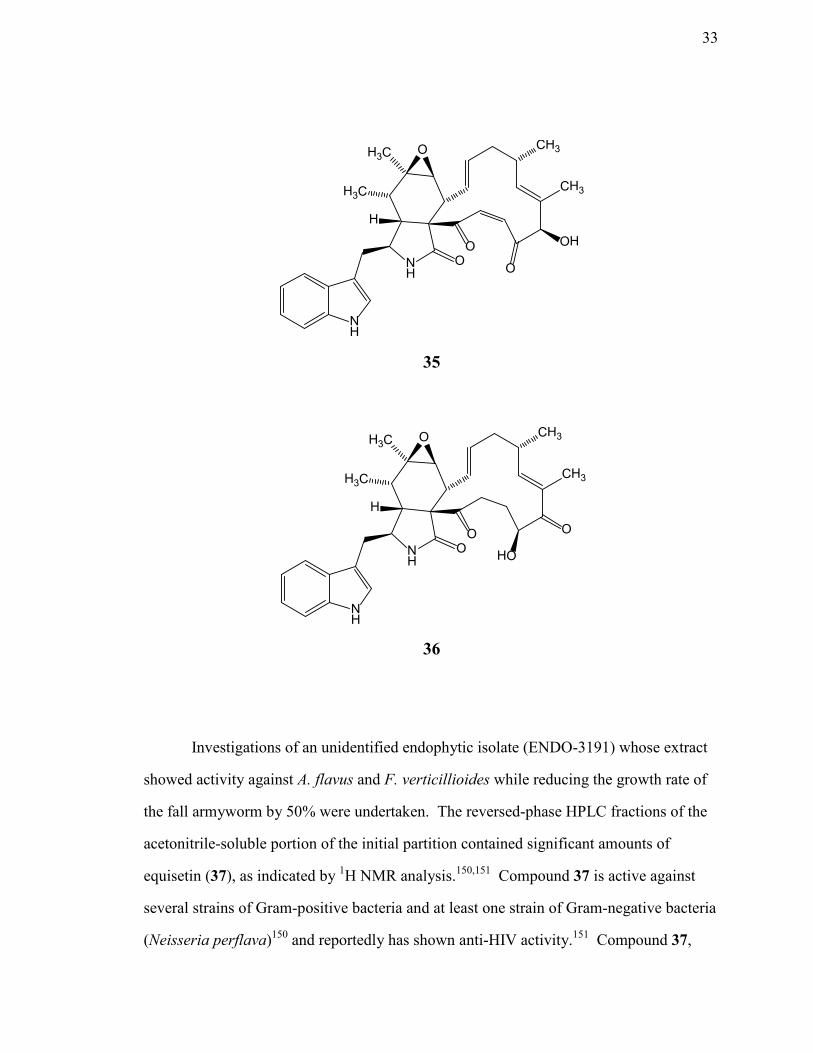
33
NH
NH
O
H
H3C
H3C O
O
CH3
CH3
O
OH
35
NH
NH
O
H
H3C
H3C O
O
CH3
CH3
HO
O
Investigations of an unidentified endophytic isolate (ENDO-3191) whose extract
showed activity against A. flavus and F. verticillioides while reducing the growth rate of
the fall armyworm by 50% were undertaken. The reversed-phase HPLC fractions of the
acetonitrile-soluble portion of the initial partition contained significant amounts of
equisetin (37), as indicated by 1H NMR analysis.150,151 Compound 37 is active against
several strains of Gram-positive bacteria and at least one strain of Gram-negative bacteria
(Neisseria perflava)150 and reportedly has shown anti-HIV activity.151 Compound 37,
36

34
CH3
H
H
H3C
H3C N
O
O
HO OH
CH3
37
isolated from solid cultures of Fusarium equiseti FO-68, was also reported to possess
antifungal activity against plant pathogenic fungi in vitro and in vivo.152 The abundance
of 37 in the extract is very likely to have been the cause of the moderate antifungal and
antiinsectan activity observed in our assays.
Studies of extracts of an unidentified fungicolous/mycoparasitic fungal isolate
(MYC-1645) that showed modest activity against F. verticillioides resulted in the
isolation of two known compounds; the cyclohexadepsipeptide pullularin A (38)153 and
verticillin D (39).154 Compound 38 is known to display both antiplasmodial and antiviral
activities.153 Compound 39 showed antibacterial activity at 100 µg/disk in standard Petri-
plate assays, causing inhibition zones ranging from 23 to 26 mm against B. subtilis
(ATCC 6051) and 11 mm to 14 mm against S. aureus (ATCC 14053).154 The compound
responsible for the antifungal activity was not identified and further investigations were
abandoned once these major components had been identified due to the limited activity
seen in the crude extract.

35
O O
O
N
NH3C
CH3
O
NH
O CH3
CH3
O
N
CH3
CH3
O
HN
O CH3
OH
38
39
HN
N
N
O
O
S
S CH3
OH
CH3
OH
H
NH
N
N
OH O
S
S
O
CH3
CH3
OHH
A Penicillium sp. isolate (MYC-2032) showed moderate antifungal activity
against A. flavus and trace antifungal activity against F. verticillioides. Chemical
investigations of this extract yielded the known compound cephalochromin (40).155
Compound 40 comprised nearly the entire acetonitrile-soluble portion of the extract (870

36
O
OH
OH
OHO
H3C
O CH3
OOHOH
HO
40
mg). Cephalochromin (40) is a known compound that is often encountered during our
research and it is known to possess antimicrobial activity against S. aureus, B. subtilis,
and Streptococcus pyogenes.155 However, to our knowledge, there have been no reports
of antifungal activity for 40. Compound 40 was not tested in our bioassays against fungi
because the crude extract showed only relatively limited antifungal activity. While the
presence of a minor component with antifungal activity is possible, the presence of such
copious amounts of 40 in the extract would complicate their isolation and identification,
therefore, further investigations were not pursued. The absolute configuration of 40, only
recently assigned, was established using the same TDDFT calculations described in
Chapter 1 when compared to experimental ECD, optical rotation, and vibrational circular
dichroism (VCD) data.156
Chemical investigations of the extracts obtained from the other endophytic and
fungicolous/mycoparasitic fungal isolates listed in Table 1 led to the isolation of novel
metabolites, as well as some additional known compounds. The known compounds
described here were identified through comparison of 1H NMR, 13C NMR, and/or MS
data with literature values. Details of the isolation, structure elucidation, and biological
37
activities of the novel compounds from this research will be discussed in Chapters 3-6 of
this thesis.
In addition to the work done with fungicolous/mycoparasitic and endophytic
fungi, a collaboration with Dr. Victor Sobolev of the USDA National Peanut Research
Laboratory yielded eight novel secondary metabolites from peanuts seeds. Two known
metabolites that had not previously been reported as being produced by the peanut plant
were also encountered. The structure elucidation and characterization of these
metabolites will be discussed in detail in Chapters 7 and 8. The culturing and separation
techniques used for the isolation of these metabolites are different from those employed
in our own fungal metabolites work, and are also detailed in Chapter 10.
38
CHAPTER 3
ISOLATION AND CHARACTERIZATION OF AFLAQUINOLONES A–G:
SECONDARY METABOLITES FROM FUNGICOLOUS AND
MARINE ISOLATES OF ASPERGILLUS SPP.
Our long-term studies of fungi from a variety of ecological groups have resulted
in the discovery of many new bioactive natural products.6,111,120 Fungicolous and
mycoparasitic isolates from Hawaii have been a productive source of such compounds
over the last few years,112-115 as have marine fungi. Chemical investigations of two
isolates of Aspergillus sp. (Trichocomaceae) obtained from these two different habitats
carried out independently in our laboratory and that of a collaborator led to the isolation
of seven new dihydroquinolin-2-one-containing natural products that we named
aflaquinolones A-G. These compounds are members of a known general class of fungal
metabolites that includes aspoquinolones and penigequinolones.157-159 Details of the
isolation and structure elucidation of these compounds are presented here.
A culture of Aspergillus sp. (MYC-2048 = NRRL 58570) was obtained from a
basidioma of Rigdoporus microsporus found on a dead hardwood branch in a Hawaiian
alien wet forest. The fungus was cultured by solid-substrate fermentation on rice, and the
EtOAc extract of the resulting fermentation mixture showed antifungal activity against A.
flavus (NRRL 6541) and F. verticillioides (NRRL 25457) as well as the ability to reduce
the growth rate of the fall armyworm (S. frugiperda) in a dietary assay. The extract was
therefore subjected to chemical investigation (Figure 7), leading to the isolation of the
known metabolites alantrypinone (41),160 aspochalasins I (28) and J (29),130 methyl-
3,4,5-trimethoxy-2((2-((3-pyridinylcarbonyl)amino)benzoyl)amino)benzoate (42),161 and
trans-dehydrocurvularin (25),127 all of which were identified by analysis of MS and
NMR spectroscopic data in comparison with literature values.127,130,160,161 Chemical
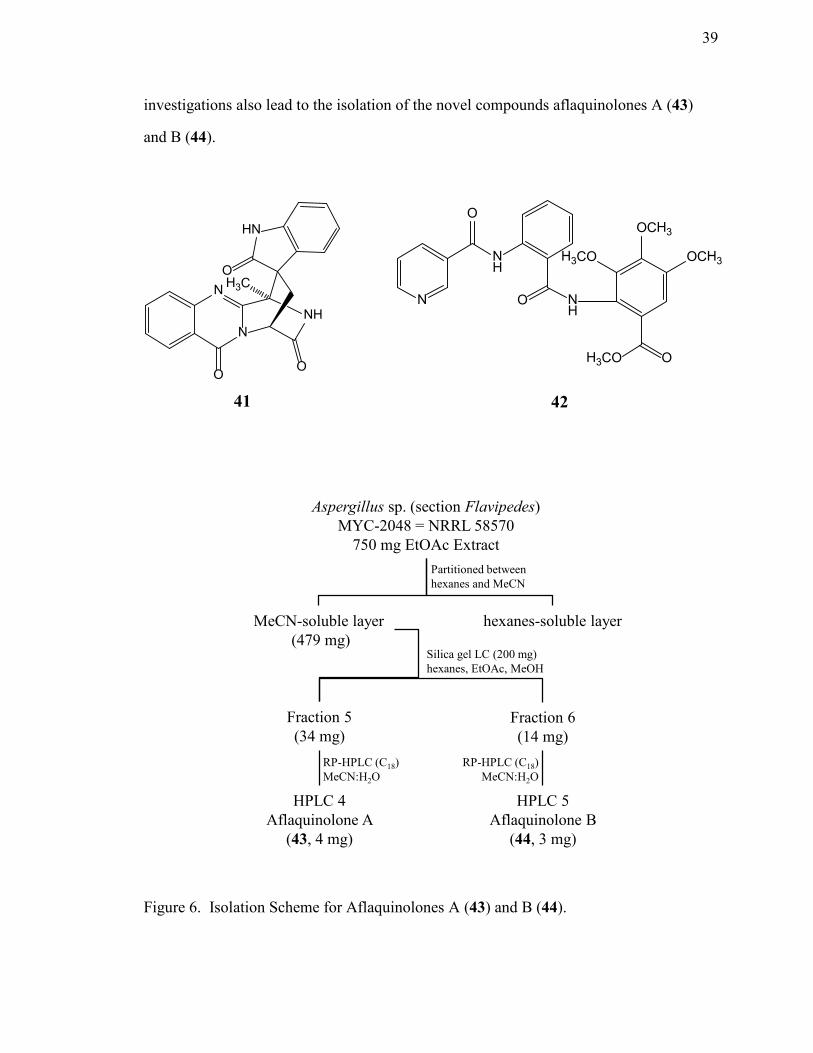
39
N
N
NH
HN
O
OH3C
O
41 42
Aspergillus sp. (section Flavipedes)MYC-2048 = NRRL 58570
750 mg EtOAc ExtractPartitioned betweenhexanes and MeCN
MeCN-soluble layer(479 mg)
hexanes-soluble layer
Fraction 5(34 mg)
Fraction 6(14 mg)
RP-HPLC (C18)MeCN:H2O
RP-HPLC (C18)MeCN:H2O
Silica gel LC (200 mg)hexanes, EtOAc, MeOH
HPLC 4Aflaquinolone A
(43, 4 mg)
HPLC 5Aflaquinolone B
(44, 3 mg)
investigations also lead to the isolation of the novel compounds aflaquinolones A (43)
and B (44).
Figure 6. Isolation Scheme for Aflaquinolones A (43) and B (44).
N
NH
NH
O
O
H3CO
OCH3
OCH3
H3CO O
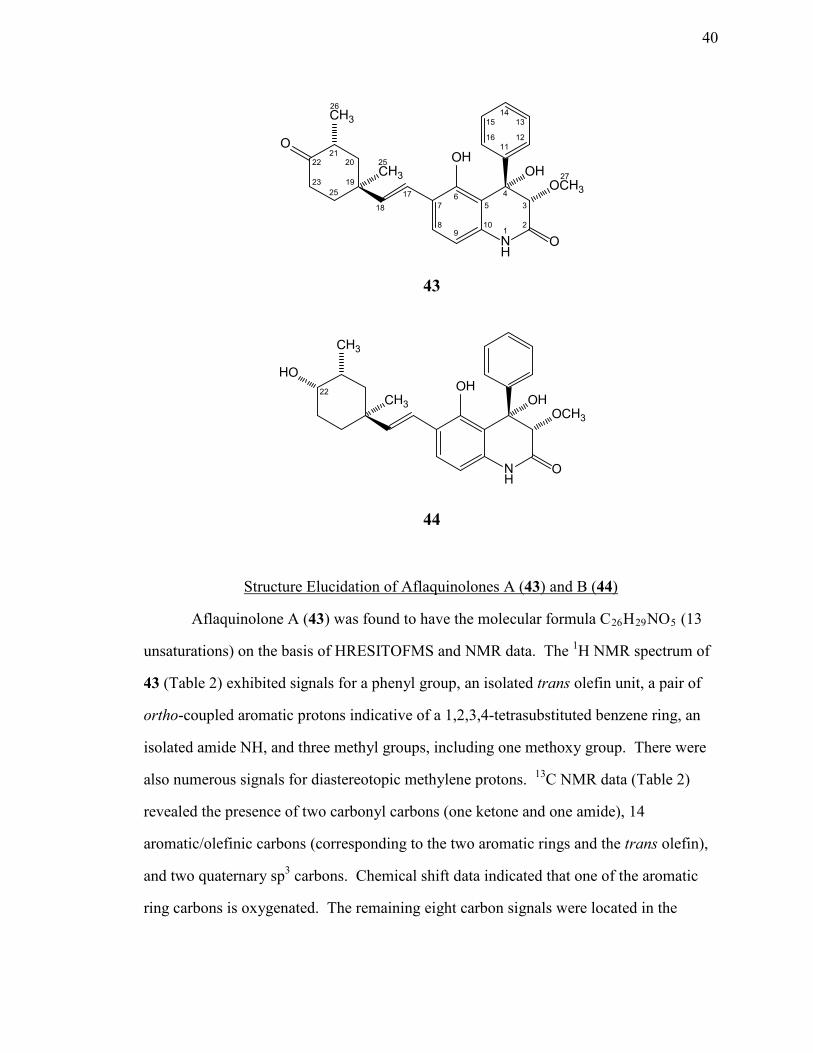
40
Structure Elucidation of Aflaquinolones A (43) and B (44)
Aflaquinolone A (43) was found to have the molecular formula C26H29NO5 (13
unsaturations) on the basis of HRESITOFMS and NMR data. The 1H NMR spectrum of
43 (Table 2) exhibited signals for a phenyl group, an isolated trans olefin unit, a pair of
ortho-coupled aromatic protons indicative of a 1,2,3,4-tetrasubstituted benzene ring, an
isolated amide NH, and three methyl groups, including one methoxy group. There were
also numerous signals for diastereotopic methylene protons. 13C NMR data (Table 2)
revealed the presence of two carbonyl carbons (one ketone and one amide), 14
aromatic/olefinic carbons (corresponding to the two aromatic rings and the trans olefin),
and two quaternary sp3 carbons. Chemical shift data indicated that one of the aromatic
ring carbons is oxygenated. The remaining eight carbon signals were located in the
43
44
O
CH3
CH3
NH
OHOCH3
OH
O
23
1 2 3
4 5 6
7 8
9 10
11 12 13 14
15 16
17 18
19 20 21
25
22 27
25
26
HO
CH3
CH3
NH
OHOCH3
OH
O
22
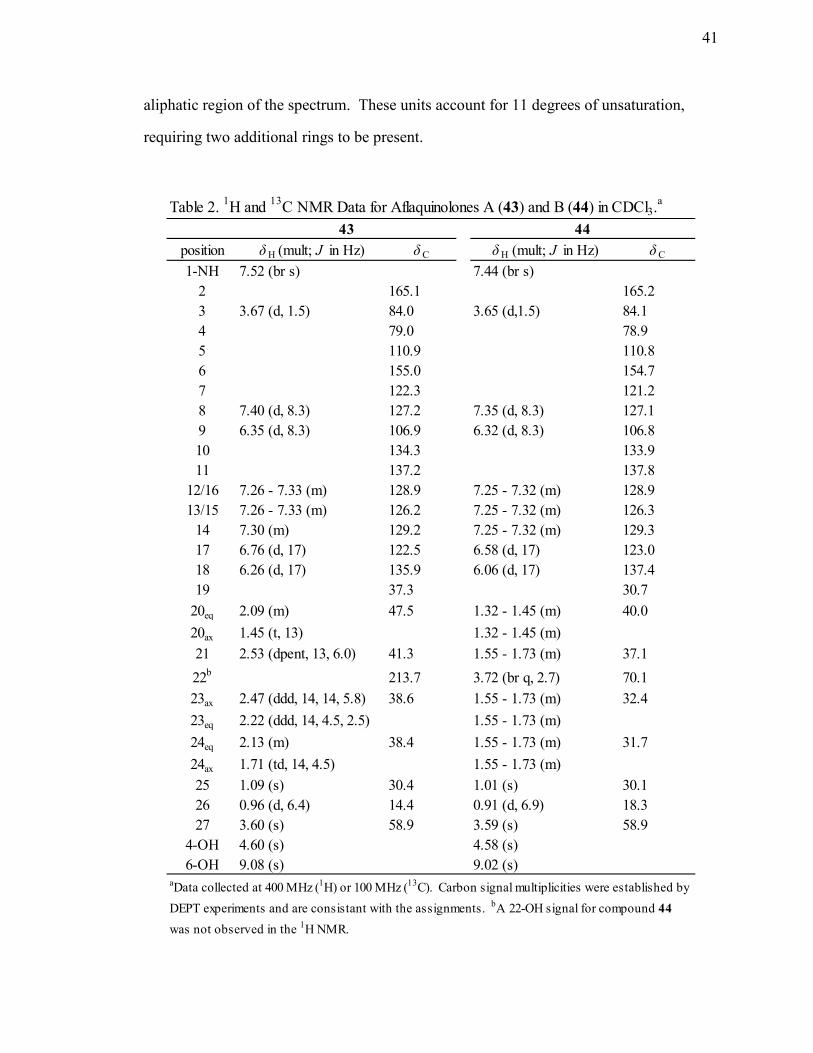
41
position δ H (mult; J in Hz) δ C δ H (mult; J in Hz) δ C
1-NH 7.52 (br s) 7.44 (br s)2 165.1 165.23 3.67 (d, 1.5) 84.0 3.65 (d,1.5) 84.14 79.0 78.95 110.9 110.86 155.0 154.77 122.3 121.28 7.40 (d, 8.3) 127.2 7.35 (d, 8.3) 127.19 6.35 (d, 8.3) 106.9 6.32 (d, 8.3) 106.810 134.3 133.911 137.2 137.8
12/16 7.26 - 7.33 (m) 128.9 7.25 - 7.32 (m) 128.913/15 7.26 - 7.33 (m) 126.2 7.25 - 7.32 (m) 126.3
14 7.30 (m) 129.2 7.25 - 7.32 (m) 129.317 6.76 (d, 17) 122.5 6.58 (d, 17) 123.018 6.26 (d, 17) 135.9 6.06 (d, 17) 137.419 37.3 30.7
20eq 2.09 (m) 47.5 1.32 - 1.45 (m) 40.020ax 1.45 (t, 13) 1.32 - 1.45 (m)21 2.53 (dpent, 13, 6.0) 41.3 1.55 - 1.73 (m) 37.122b 213.7 3.72 (br q, 2.7) 70.123ax 2.47 (ddd, 14, 14, 5.8) 38.6 1.55 - 1.73 (m) 32.423eq 2.22 (ddd, 14, 4.5, 2.5) 1.55 - 1.73 (m)24eq 2.13 (m) 38.4 1.55 - 1.73 (m) 31.724ax 1.71 (td, 14, 4.5) 1.55 - 1.73 (m)25 1.09 (s) 30.4 1.01 (s) 30.126 0.96 (d, 6.4) 14.4 0.91 (d, 6.9) 18.327 3.60 (s) 58.9 3.59 (s) 58.9
4-OH 4.60 (s) 4.58 (s)6-OH 9.08 (s) 9.02 (s)
Table 2. 1H and 13C NMR Data for Aflaquinolones A (43) and B (44) in CDCl3.a
43 44
aData collected at 400 MHz (1H) or 100 MHz (13C). Carbon signal multiplicities were established by DEPT experiments and are consistant with the assignments. bA 22-OH signal for compound 44 was not observed in the 1H NMR.
aliphatic region of the spectrum. These units account for 11 degrees of unsaturation,
requiring two additional rings to be present.

42
The structure of the dihydroquinolone portion of 43 was established by analysis of
2D NMR data and through comparison to a known series of compounds that includes the
aspoquinolines and penigequinolones.157-159 HMBC correlations from the H-12/H-16
signal for the phenyl group to C-4; from the isolated oxymethine H-3 to C-2, C-4, C-5,
and C-11; and from the amide NH to C-5 and C-10 were consistent with the
corresponding features of the structure of aspoquinolone C (45), albeit without the para-
methoxy group on the aromatic ring substituent.157
The remaining portion of the structure was significantly different from those of
the aforementioned compounds. HMBC correlations of H3-25 to C-20 and C-24, and
correlations of H3-26 to C-20 and C-22, with the last remaining methylene unit (C-23)
bridging C-22 and C-24, complete a cyclohexane ring, accounting for the remaining unit
of unsaturation. This ring was connected to the trans olefin unit at C-18 on the basis of
correlations of H-17 and H-18 to C-19, and of H3-25 to C-18. Finally, the two main
structural units of 43 were linked on the basis of HMBC correlations of both trans
olefinic protons to C-7 to complete the gross structure as shown. Additional HMBC data
were fully consistent with this conclusion. The differences in structures relative to those
of the aspoquinolones led to the proposal of the distinct name aflaquinolone A for 43.
However, the numbering system shown is consistent with that of the aspoquinolones.157
Analysis of NOESY data and 1H NMR J-values enabled assignment of the
relative configuration of each half of 43. The dihydroquinolone unit of 43 exhibited
NMR shifts and J-values virtually identical to those of the aspoquinolones. In addition,
the appearance of the H-3 signal as a doublet long-range-coupled to the NH (J = 1.5 Hz)
matched a characteristic signal described for these compounds in the literature.157
NOESY results for this structural unit were also analogous to those previously reported.
Key NOESY data included correlations of H-3 with signals for both the phenyl group and
the 4-OH (requiring H-3 to be pseudoequatorial), as well as a correlation from the
methoxy group (C-27) to the 4-OH, all of which are consistent with literature
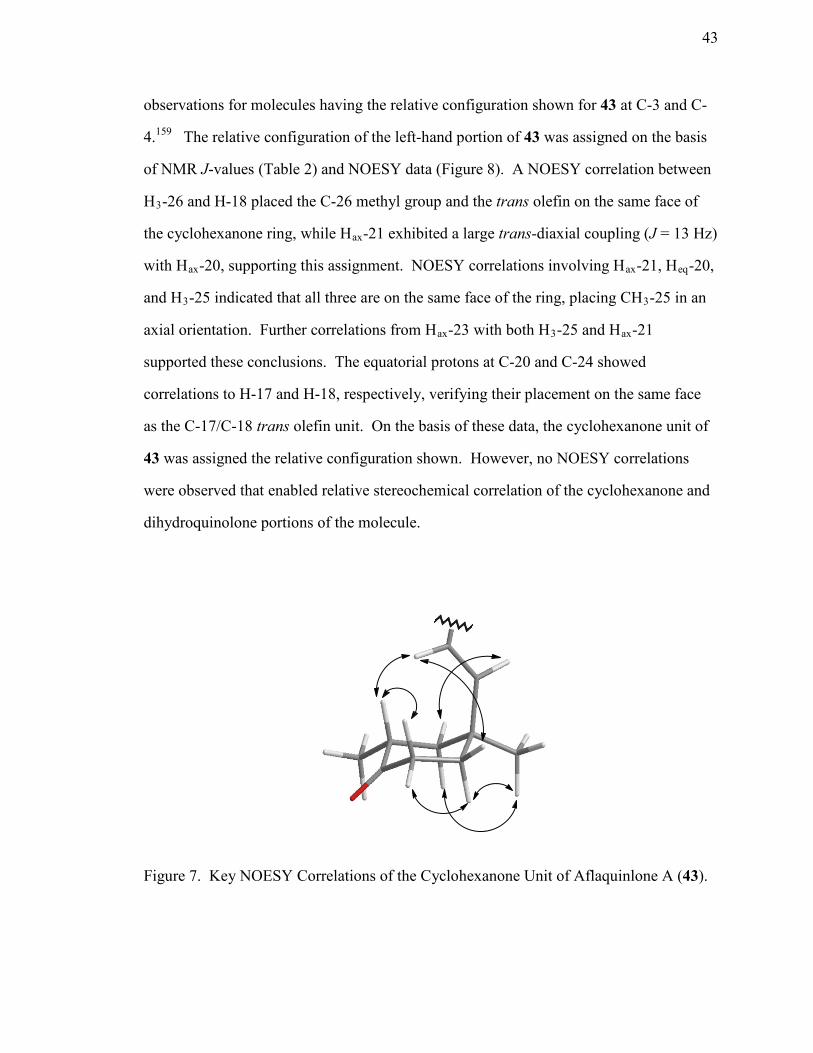
43
observations for molecules having the relative configuration shown for 43 at C-3 and C-
4.159 The relative configuration of the left-hand portion of 43 was assigned on the basis
of NMR J-values (Table 2) and NOESY data (Figure 8). A NOESY correlation between
H3-26 and H-18 placed the C-26 methyl group and the trans olefin on the same face of
the cyclohexanone ring, while Hax-21 exhibited a large trans-diaxial coupling (J = 13 Hz)
with Hax-20, supporting this assignment. NOESY correlations involving Hax-21, Heq-20,
and H3-25 indicated that all three are on the same face of the ring, placing CH3-25 in an
axial orientation. Further correlations from Hax-23 with both H3-25 and Hax-21
supported these conclusions. The equatorial protons at C-20 and C-24 showed
correlations to H-17 and H-18, respectively, verifying their placement on the same face
as the C-17/C-18 trans olefin unit. On the basis of these data, the cyclohexanone unit of
43 was assigned the relative configuration shown. However, no NOESY correlations
were observed that enabled relative stereochemical correlation of the cyclohexanone and
dihydroquinolone portions of the molecule.
Figure 7. Key NOESY Correlations of the Cyclohexanone Unit of Aflaquinlone A (43).
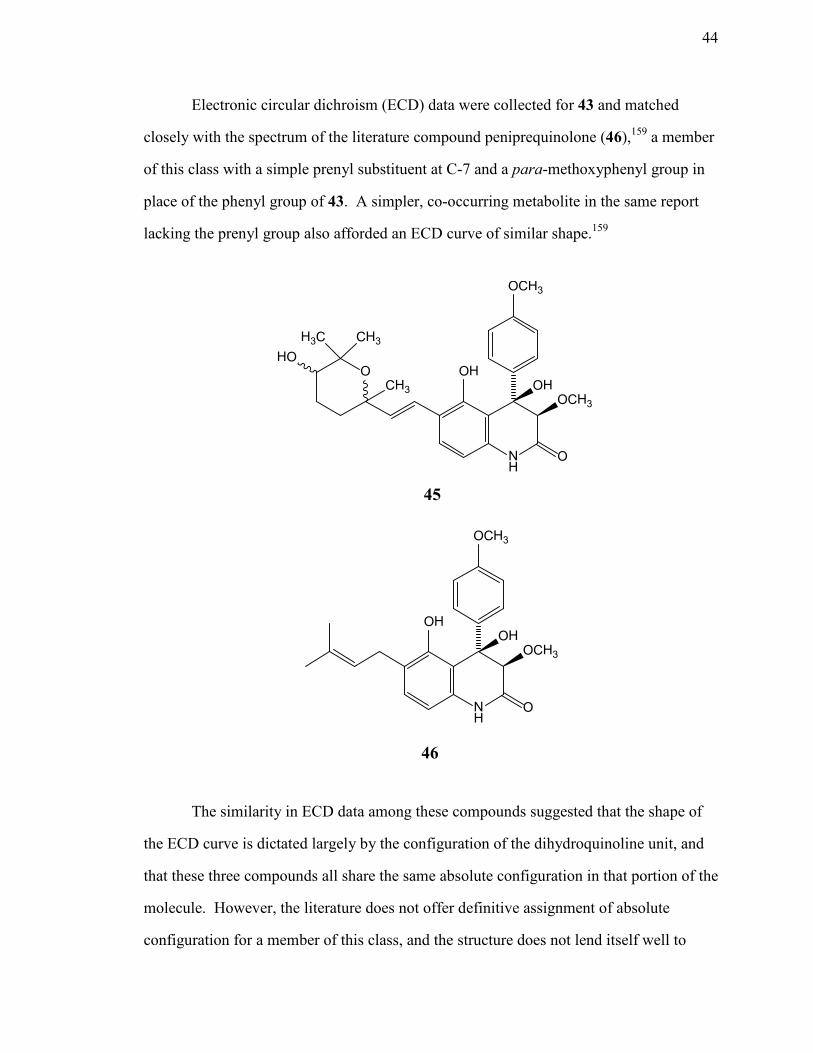
44
45
46
Electronic circular dichroism (ECD) data were collected for 43 and matched
closely with the spectrum of the literature compound peniprequinolone (46),159 a member
of this class with a simple prenyl substituent at C-7 and a para-methoxyphenyl group in
place of the phenyl group of 43. A simpler, co-occurring metabolite in the same report
lacking the prenyl group also afforded an ECD curve of similar shape.159
The similarity in ECD data among these compounds suggested that the shape of
the ECD curve is dictated largely by the configuration of the dihydroquinoline unit, and
that these three compounds all share the same absolute configuration in that portion of the
molecule. However, the literature does not offer definitive assignment of absolute
configuration for a member of this class, and the structure does not lend itself well to
NH
OHOCH3
O
OCH3
OHO
CH3H3CHO
CH3
NH
OHOCH3
O
OCH3
OH
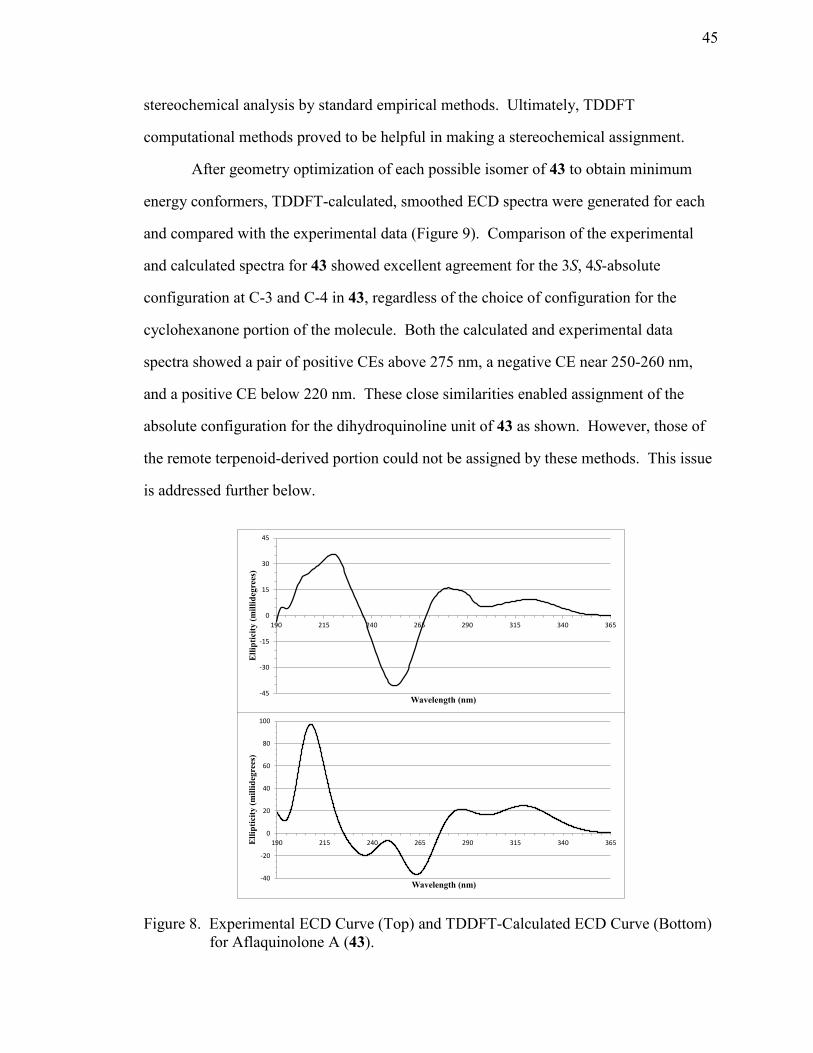
45
stereochemical analysis by standard empirical methods. Ultimately, TDDFT
computational methods proved to be helpful in making a stereochemical assignment.
After geometry optimization of each possible isomer of 43 to obtain minimum
energy conformers, TDDFT-calculated, smoothed ECD spectra were generated for each
and compared with the experimental data (Figure 9). Comparison of the experimental
and calculated spectra for 43 showed excellent agreement for the 3S, 4S-absolute
configuration at C-3 and C-4 in 43, regardless of the choice of configuration for the
cyclohexanone portion of the molecule. Both the calculated and experimental data
spectra showed a pair of positive CEs above 275 nm, a negative CE near 250-260 nm,
and a positive CE below 220 nm. These close similarities enabled assignment of the
absolute configuration for the dihydroquinoline unit of 43 as shown. However, those of
the remote terpenoid-derived portion could not be assigned by these methods. This issue
is addressed further below.
Figure 8. Experimental ECD Curve (Top) and TDDFT-Calculated ECD Curve (Bottom) for Aflaquinolone A (43).
-45
-30
-15
0
15
30
45
190 215 240 265 290 315 340 365
Elli
ptic
ity (m
illid
egre
es)
Wavelength (nm)
-40
-20
0
20
40
60
80
100
190 215 240 265 290 315 340 365Elli
ptic
ity (m
illid
egre
es)
Wavelength (nm)
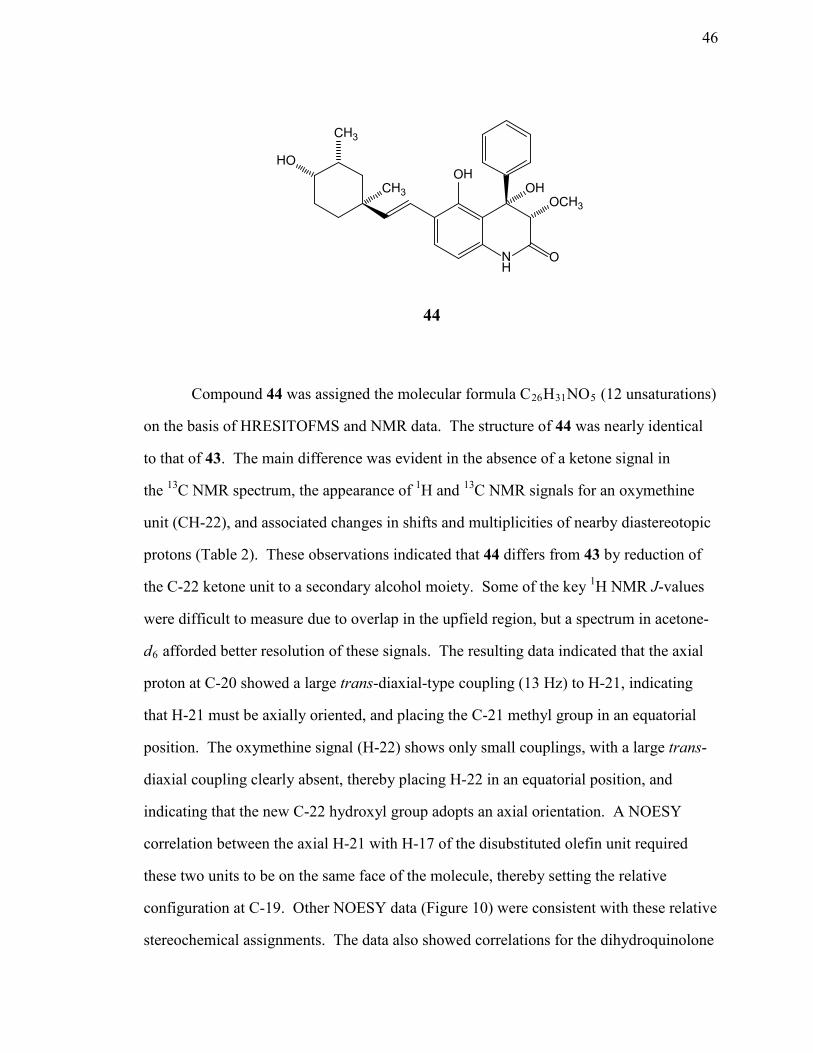
46
Compound 44 was assigned the molecular formula C26H31NO5 (12 unsaturations)
on the basis of HRESITOFMS and NMR data. The structure of 44 was nearly identical
to that of 43. The main difference was evident in the absence of a ketone signal in
the 13C NMR spectrum, the appearance of 1H and 13C NMR signals for an oxymethine
unit (CH-22), and associated changes in shifts and multiplicities of nearby diastereotopic
protons (Table 2). These observations indicated that 44 differs from 43 by reduction of
the C-22 ketone unit to a secondary alcohol moiety. Some of the key 1H NMR J-values
were difficult to measure due to overlap in the upfield region, but a spectrum in acetone-
d6 afforded better resolution of these signals. The resulting data indicated that the axial
proton at C-20 showed a large trans-diaxial-type coupling (13 Hz) to H-21, indicating
that H-21 must be axially oriented, and placing the C-21 methyl group in an equatorial
position. The oxymethine signal (H-22) shows only small couplings, with a large trans-
diaxial coupling clearly absent, thereby placing H-22 in an equatorial position, and
indicating that the new C-22 hydroxyl group adopts an axial orientation. A NOESY
correlation between the axial H-21 with H-17 of the disubstituted olefin unit required
these two units to be on the same face of the molecule, thereby setting the relative
configuration at C-19. Other NOESY data (Figure 10) were consistent with these relative
stereochemical assignments. The data also showed correlations for the dihydroquinolone
44
HO
CH3
CH3
NH
OHOCH3
OH
O
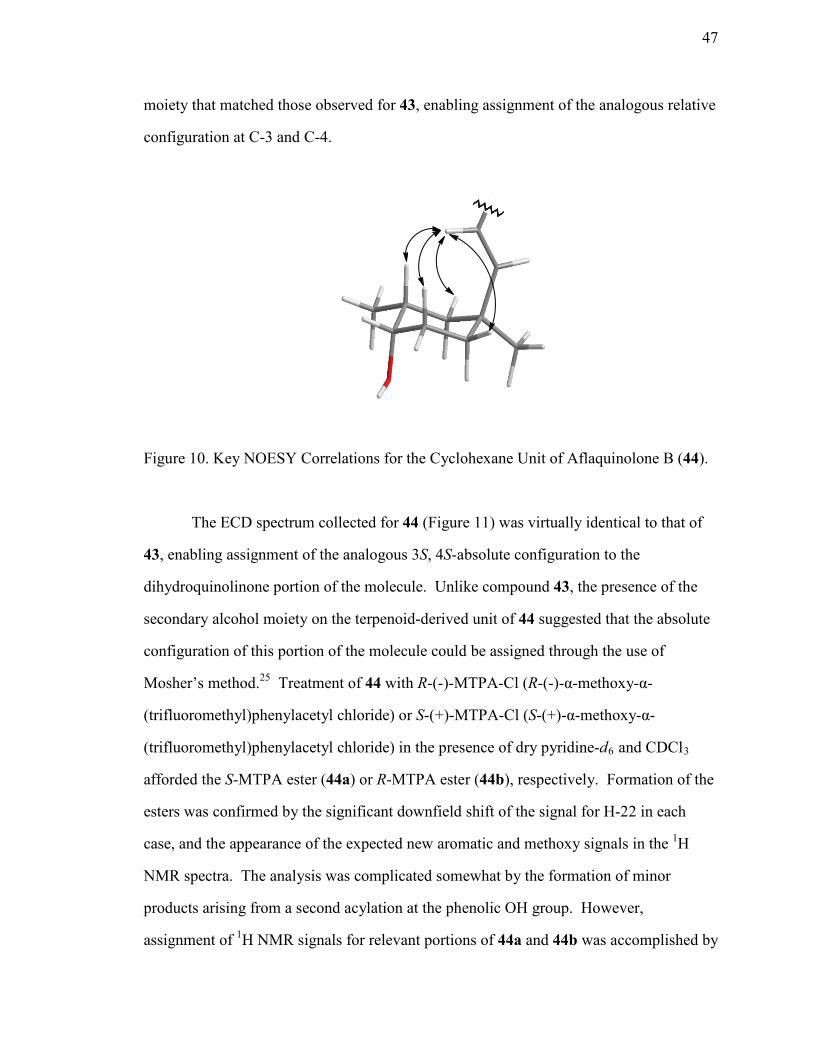
47
moiety that matched those observed for 43, enabling assignment of the analogous relative
configuration at C-3 and C-4.
Figure 10. Key NOESY Correlations for the Cyclohexane Unit of Aflaquinolone B (44).
The ECD spectrum collected for 44 (Figure 11) was virtually identical to that of
43, enabling assignment of the analogous 3S, 4S-absolute configuration to the
dihydroquinolinone portion of the molecule. Unlike compound 43, the presence of the
secondary alcohol moiety on the terpenoid-derived unit of 44 suggested that the absolute
configuration of this portion of the molecule could be assigned through the use of
Mosher’s method.25 Treatment of 44 with R-(-)-MTPA-Cl (R-(-)-α-methoxy-α-
(trifluoromethyl)phenylacetyl chloride) or S-(+)-MTPA-Cl (S-(+)-α-methoxy-α-
(trifluoromethyl)phenylacetyl chloride) in the presence of dry pyridine-d6 and CDCl3
afforded the S-MTPA ester (44a) or R-MTPA ester (44b), respectively. Formation of the
esters was confirmed by the significant downfield shift of the signal for H-22 in each
case, and the appearance of the expected new aromatic and methoxy signals in the 1H
NMR spectra. The analysis was complicated somewhat by the formation of minor
products arising from a second acylation at the phenolic OH group. However,
assignment of 1H NMR signals for relevant portions of 44a and 44b was accomplished by
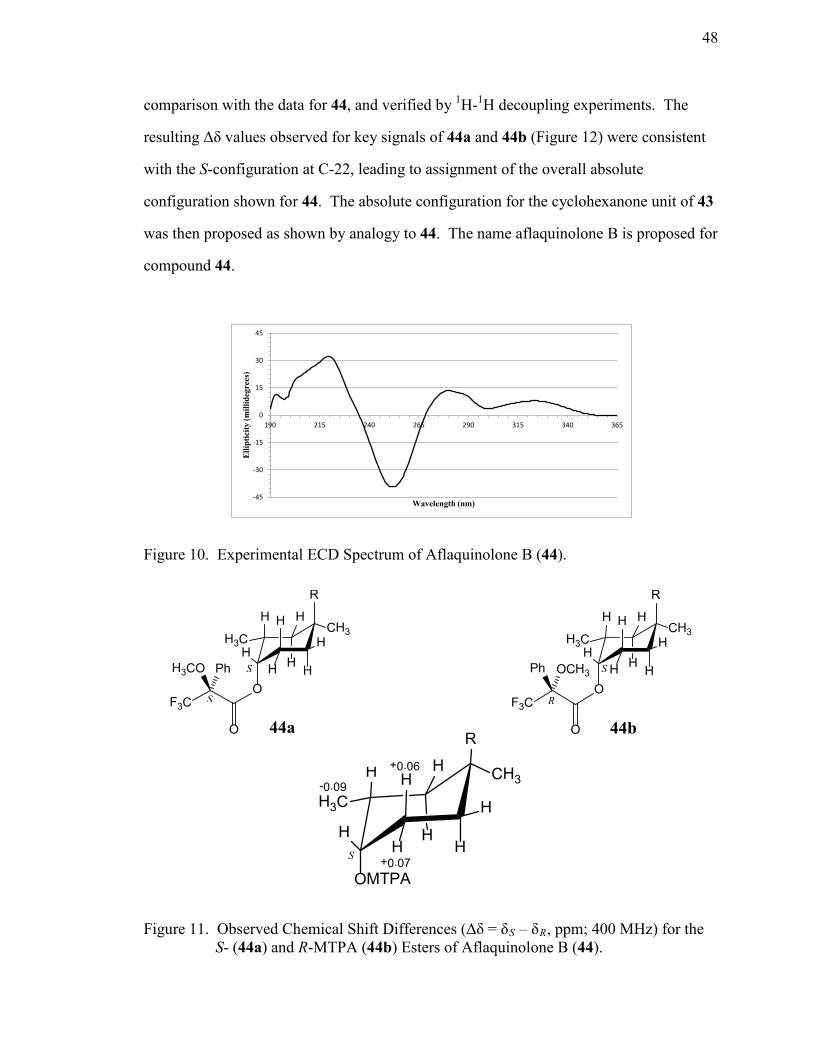
48
R
H H
HO
H3CH
H
HCH3
HH
O
F3C
H3CO Ph
S
S
R
H H
HO
H3CH
H
HCH3
HH
O
F3C
Ph OCH3
R
S
-45
-30
-15
0
15
30
45
190 215 240 265 290 315 340 365
Ellip
ticity
(mill
ideg
rees
)
Wavelength (nm)
44a 44b
H
OMTPA
H
H
HH
H
CH3
R
H
H
H3C-0.09
+0.07
-0.03 +0.06
S
comparison with the data for 44, and verified by 1H-1H decoupling experiments. The
resulting Δδ values observed for key signals of 44a and 44b (Figure 12) were consistent
with the S-configuration at C-22, leading to assignment of the overall absolute
configuration shown for 44. The absolute configuration for the cyclohexanone unit of 43
was then proposed as shown by analogy to 44. The name aflaquinolone B is proposed for
compound 44.
Figure 10. Experimental ECD Spectrum of Aflaquinolone B (44).
Figure 11. Observed Chemical Shift Differences (Δδ = δS – δR, ppm; 400 MHz) for the S- (44a) and R-MTPA (44b) Esters of Aflaquinolone B (44).
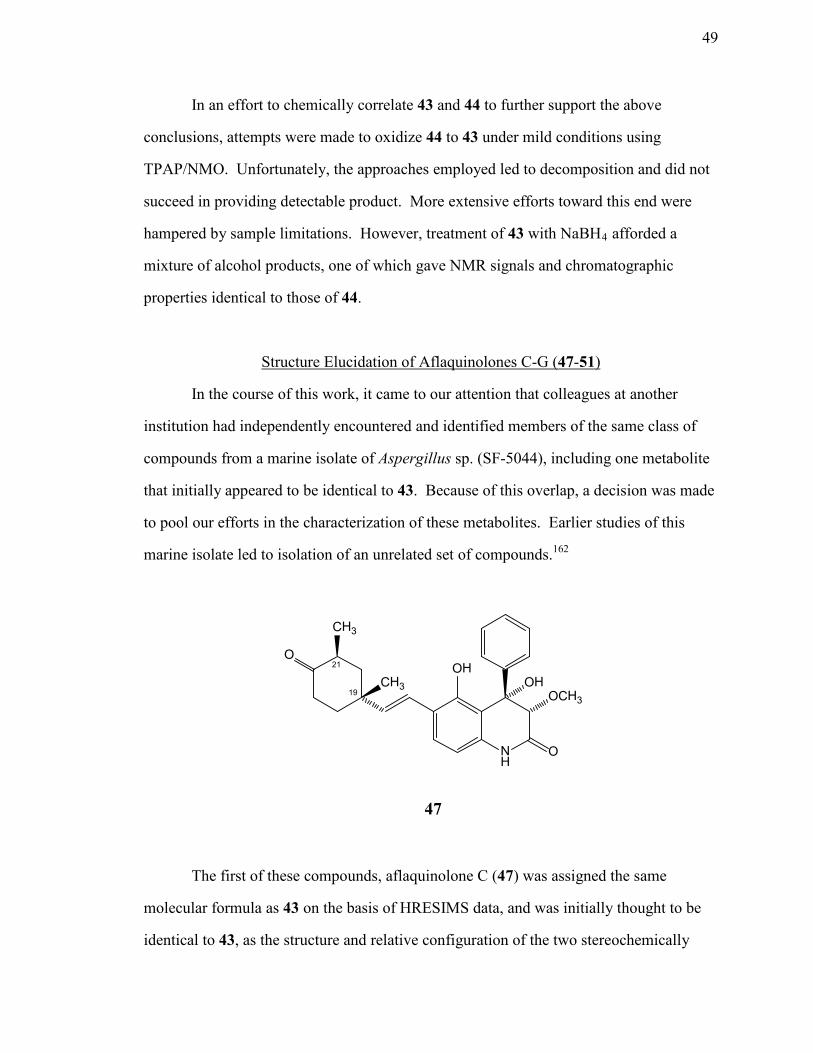
49
In an effort to chemically correlate 43 and 44 to further support the above
conclusions, attempts were made to oxidize 44 to 43 under mild conditions using
TPAP/NMO. Unfortunately, the approaches employed led to decomposition and did not
succeed in providing detectable product. More extensive efforts toward this end were
hampered by sample limitations. However, treatment of 43 with NaBH4 afforded a
mixture of alcohol products, one of which gave NMR signals and chromatographic
properties identical to those of 44.
Structure Elucidation of Aflaquinolones C-G (47-51)
In the course of this work, it came to our attention that colleagues at another
institution had independently encountered and identified members of the same class of
compounds from a marine isolate of Aspergillus sp. (SF-5044), including one metabolite
that initially appeared to be identical to 43. Because of this overlap, a decision was made
to pool our efforts in the characterization of these metabolites. Earlier studies of this
marine isolate led to isolation of an unrelated set of compounds.162
The first of these compounds, aflaquinolone C (47) was assigned the same
molecular formula as 43 on the basis of HRESIMS data, and was initially thought to be
identical to 43, as the structure and relative configuration of the two stereochemically
O
CH3
CH3
NH
OHOCH3
OH
O
21
19
47

50
48position δ H (mult; J in Hz) δ C δ H (mult; J in Hz)1-NH 9.36 (br s) 9.40 (br s)
2 166.43 3.67 (s) 85.8 3.66 (s)4 80.15 112.26 156.17 122.08 7.52 (d, 8.3) 127.9 7.44 (d, 8.4)9 6.60 (d, 8.3) 107.8 6.58 (d, 8.4)10 137.211 140.3
12/16 7.34 - 7.37 (m) 129.6 7.31-7.38 (m)13/15 7.34 - 7.37 (m) 127.5 7.31-7.38 (m)
14 7.34 - 7.37 (m) 129.8 7.31-7.38 (m)17 6.83 (d, 17) 123.6 6.64 (d, 17)18 6.44 (d, 17) 135.9 6.24 (d, 17)19 37.9
20eq 2.13 (m) 48.3 1.89 (m)20ax 1.45 (t, 13) 1.54 (t, 13)21 2.58 (dq, 13, 6.4) 41.7 2.69 (dq, 13, 6.6)22 212.1
23ax 2.51 (dt, 14, 6.3) 39.1 2.62 (dt, 14, 7.3)23eq 2.15 (m) 2.17 (m)
24eq 2.11 (m) 39.3 1.86 (m)a
24ax 1.71 (dt, 14, 4.4) 1.81 (m)a
25 1.11 (s) 30.8 1.43 (s)26 0.92 (d, 6.4) 14.9 0.94 (d, 6.6)27 3.52 (s) 58.9 3.51 (s)
47Table 3. NMR Spectroscopic Data for Aflaquinolones C (47) and D (48) in Acetone-d 6.a
aData collected at 400 MHz (1H) or 100 MHz (13C). aThese assignments may be interchanged.
insulated portions of the molecule were found to be identical to those of 43 by
independent analysis of COSY, HMBC, and NOESY data, as well as 1H NMR J-values.
Moreover, direct comparison of the 1H and 13C NMR shifts for the two compounds (as
measured for both samples in acetone-d6) were identical (Table 3).
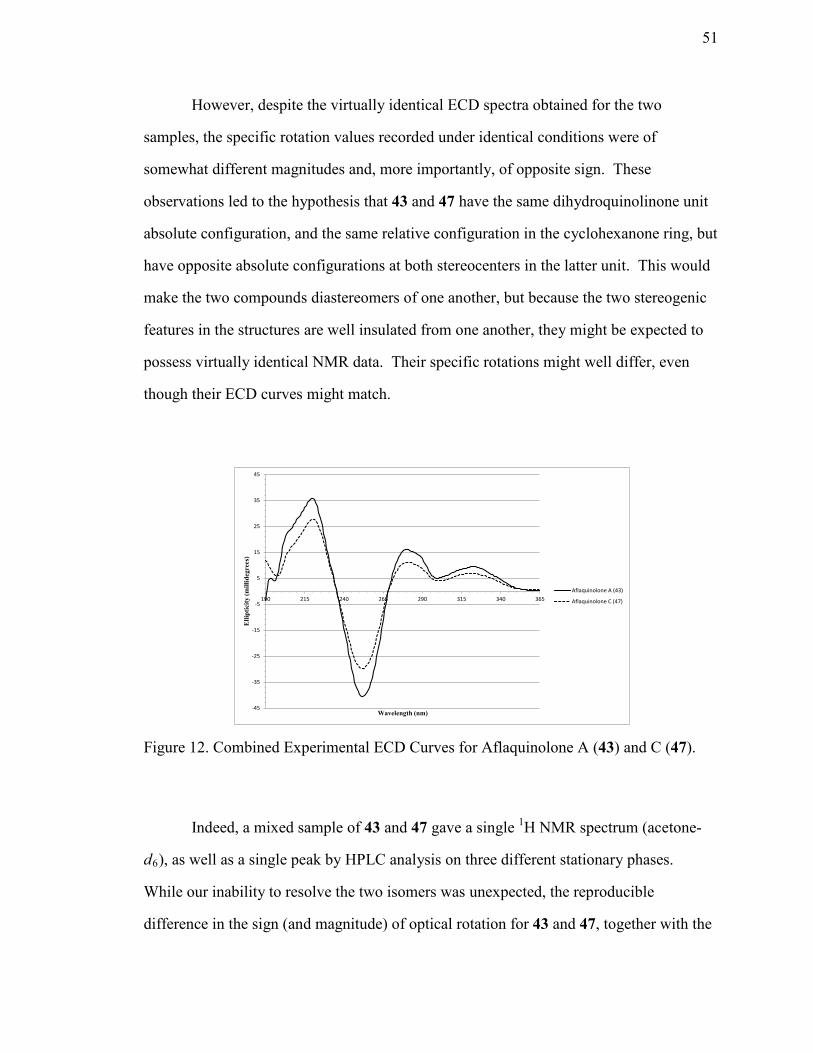
51
However, despite the virtually identical ECD spectra obtained for the two
samples, the specific rotation values recorded under identical conditions were of
somewhat different magnitudes and, more importantly, of opposite sign. These
observations led to the hypothesis that 43 and 47 have the same dihydroquinolinone unit
absolute configuration, and the same relative configuration in the cyclohexanone ring, but
have opposite absolute configurations at both stereocenters in the latter unit. This would
make the two compounds diastereomers of one another, but because the two stereogenic
features in the structures are well insulated from one another, they might be expected to
possess virtually identical NMR data. Their specific rotations might well differ, even
though their ECD curves might match.
Figure 12. Combined Experimental ECD Curves for Aflaquinolone A (43) and C (47).
Indeed, a mixed sample of 43 and 47 gave a single 1H NMR spectrum (acetone-
d6), as well as a single peak by HPLC analysis on three different stationary phases.
While our inability to resolve the two isomers was unexpected, the reproducible
difference in the sign (and magnitude) of optical rotation for 43 and 47, together with the
-45
-35
-25
-15
-5
5
15
25
35
45
190 215 240 265 290 315 340 365
Ellip
ticity
(mill
ideg
rees
)
Wavelength (nm)
Aflaquinolone A (43)
Aflaquinolone C (47)

52
48
accompanying virtually identical ECD spectra could not be explained in any other way.
Isolation of reduced analogue 44 from the same source as 43, and the assignment of its
absolute configuration by Mosher's method as noted above led us to propose that 43 has
the absolute configuration analogous to that of 44, thereby enabling proposal of the
opposite cyclohexanone unit absolute configuration for 47, as shown.
The 1H NMR spectrum of aflaquinolone D (48), another isomer of 43 and 47 as
established by HRESIMS data, was almost identical to those of 43 and 47 except for
some further chemical shift variations of signals corresponding to the C-17 to C-26
portion of the molecule (Table 3). Therefore, 48 was suggested to be another
stereoisomer of compounds 43 and 47.
Detailed analysis of 1D- and 2D-NMR data supported the conclusion that 48 has
the same planar structure as 43 and 47, and NOESY correlation of H-3 with the aromatic
protons of the phenyl group, along with ECD analysis, indicated that the quinolin-2-one
unit in 48 has the same absolute configuration as in compounds 43, 44, and 47. However,
comparisons of the NOESY data and J-values of 48 with those of 43 and 47 revealed a
difference in relative configuration in the cyclohexanone unit. A trans-diaxial J-value
(13 Hz) for H-21 and Hax-20 again indicated an axial orientation for H-21 and an
O
CH3
CH3
NH
OHOCH3
OH
O
21
19

53
49
NH
OHOCH3
OH
O1 2
3 4
5 6 7 8
9 10
11 12 13 14
15 16
17
equatorial orientation for CH3-26. However, in this instance, the H-21 signal showed a
NOESY correlation with H3-25, rather than H-17 as in 43, 44, and 47, placing CH3-25 in
an axial orientation cis to H-21 and trans to CH3-26. Correlations of Hax-20 with H-18
and H3-26 were consistent with location of all of these protons on the same face of the
cyclohexanone ring. Therefore, aflaquinolone D (48) was assigned as a diastereomer of
43 and 47 possessing an inverted configuration at one of the centers in the cyclohexanone
ring. The structure shown for 48 displays an inverted orientation at C-21 (α to the ketone
carbonyl) relative to that of 47, but the other possible diastereomer (i.e., with inversion at
C-19 instead) could not be ruled out. Unlike the case for 43 and 47, an isomer with the
same relative configuration in the cyclohexanone unit that would have enabled an
analogous comparison was not obtained from the fungicolous fungal culture, and sample
limitations precluded further study of the issue for this compound.
The molecular formula of aflaquinolone E (49) was established as C16H15NO4 on
the basis of HRESIMS analysis and NMR data, making it significantly smaller than
compounds 43, 44, 47, and 48. Analysis of the 1H and 13C NMR data for 49 and
comparison with those of compounds 43, 44, 47, and 48 suggested that 49 retains the
phenylquinolin-2-one skeleton, but lacks the terpenoid side-chain appended to the
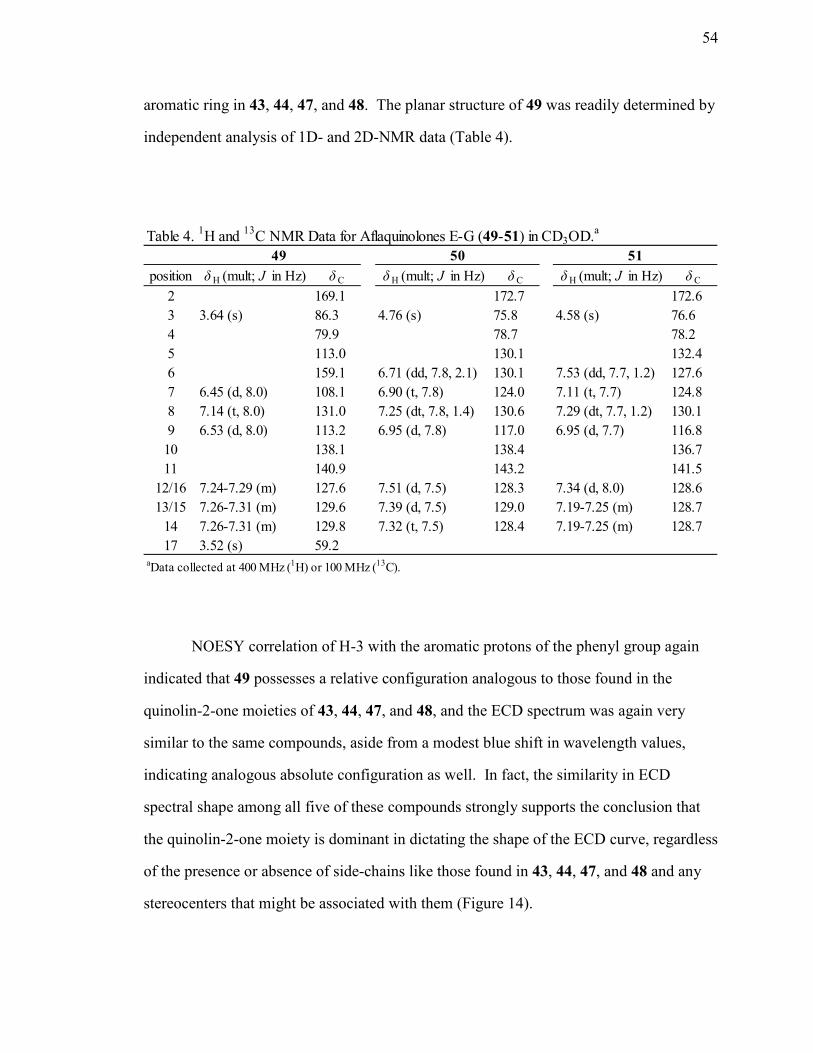
54
position δ H (mult; J in Hz) δ C δ H (mult; J in Hz) δ C δ H (mult; J in Hz) δ C
2 169.1 172.7 172.63 3.64 (s) 86.3 4.76 (s) 75.8 4.58 (s) 76.64 79.9 78.7 78.25 113.0 130.1 132.46 159.1 6.71 (dd, 7.8, 2.1) 130.1 7.53 (dd, 7.7, 1.2) 127.67 6.45 (d, 8.0) 108.1 6.90 (t, 7.8) 124.0 7.11 (t, 7.7) 124.88 7.14 (t, 8.0) 131.0 7.25 (dt, 7.8, 1.4) 130.6 7.29 (dt, 7.7, 1.2) 130.19 6.53 (d, 8.0) 113.2 6.95 (d, 7.8) 117.0 6.95 (d, 7.7) 116.8
10 138.1 138.4 136.711 140.9 143.2 141.5
12/16 7.24-7.29 (m) 127.6 7.51 (d, 7.5) 128.3 7.34 (d, 8.0) 128.613/15 7.26-7.31 (m) 129.6 7.39 (d, 7.5) 129.0 7.19-7.25 (m) 128.7
14 7.26-7.31 (m) 129.8 7.32 (t, 7.5) 128.4 7.19-7.25 (m) 128.717 3.52 (s) 59.2
49Table 4. 1H and 13C NMR Data for Aflaquinolones E-G (49-51) in CD3OD.a
aData collected at 400 MHz (1H) or 100 MHz (13C).
50 51
aromatic ring in 43, 44, 47, and 48. The planar structure of 49 was readily determined by
independent analysis of 1D- and 2D-NMR data (Table 4).
NOESY correlation of H-3 with the aromatic protons of the phenyl group again
indicated that 49 possesses a relative configuration analogous to those found in the
quinolin-2-one moieties of 43, 44, 47, and 48, and the ECD spectrum was again very
similar to the same compounds, aside from a modest blue shift in wavelength values,
indicating analogous absolute configuration as well. In fact, the similarity in ECD
spectral shape among all five of these compounds strongly supports the conclusion that
the quinolin-2-one moiety is dominant in dictating the shape of the ECD curve, regardless
of the presence or absence of side-chains like those found in 43, 44, 47, and 48 and any
stereocenters that might be associated with them (Figure 14).

55
50 51
NH
OHOH
O
3 4 6
NH
OHOH
O
3 4
Figure 13. Combined Experimental CD Curves for Aflaquinolones A-E (43, 44, 47-49).
HRESIMS data established the molecular formula C15H13NO3 for both
aflaquinolones F (50) and G (51). 1H and 13C NMR data of 50 and 51 showed almost
identical patterns with some minor chemical shift variations. Comparison of these data
with the 1H and 13C NMR data for 49 indicated replacement of the phenolic OH group
with an additional aromatic proton, and also revealed the absence of the methoxy group
-45
-35
-25
-15
-5
5
15
25
35
45
190 215 240 265 290 315 340 365
Elli
ptic
ity (m
illid
egre
es)
Wavelength (nm)
Aflaquinolone A (43)
Aflaquinolone B (44)
Aflaquinolone C (47)
Aflaquinolone D (48)
Aflaquinolone E (49)
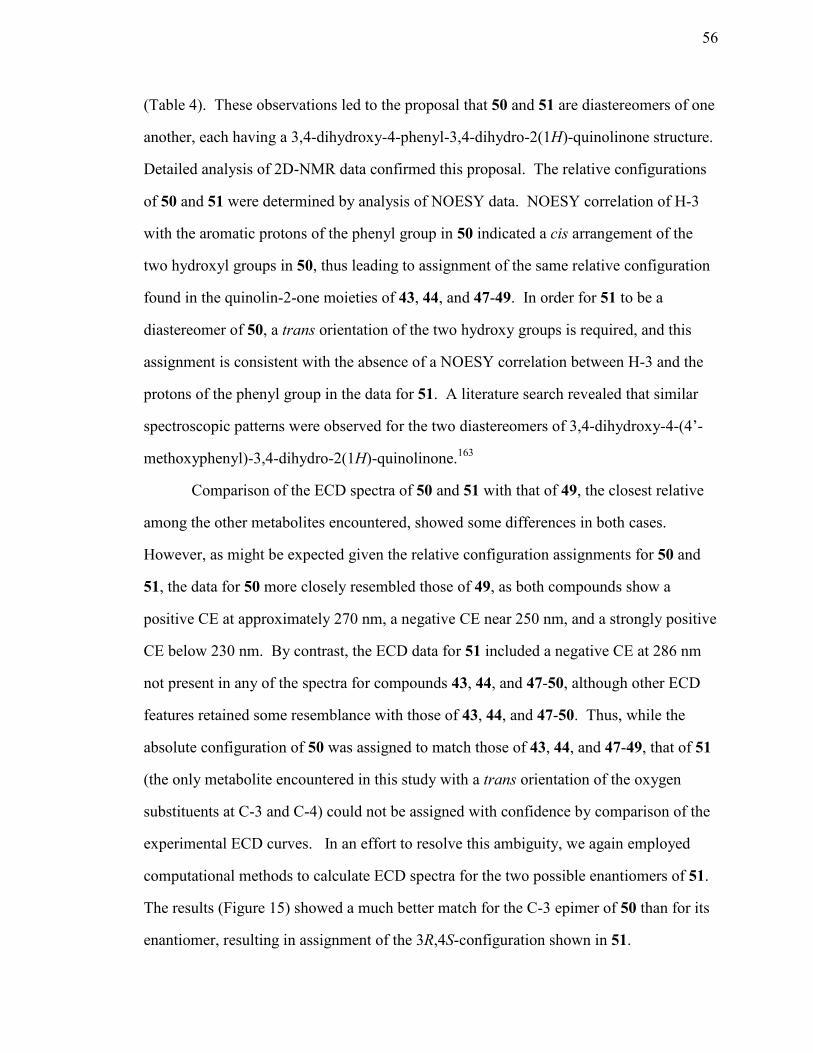
56
(Table 4). These observations led to the proposal that 50 and 51 are diastereomers of one
another, each having a 3,4-dihydroxy-4-phenyl-3,4-dihydro-2(1H)-quinolinone structure.
Detailed analysis of 2D-NMR data confirmed this proposal. The relative configurations
of 50 and 51 were determined by analysis of NOESY data. NOESY correlation of H-3
with the aromatic protons of the phenyl group in 50 indicated a cis arrangement of the
two hydroxyl groups in 50, thus leading to assignment of the same relative configuration
found in the quinolin-2-one moieties of 43, 44, and 47-49. In order for 51 to be a
diastereomer of 50, a trans orientation of the two hydroxy groups is required, and this
assignment is consistent with the absence of a NOESY correlation between H-3 and the
protons of the phenyl group in the data for 51. A literature search revealed that similar
spectroscopic patterns were observed for the two diastereomers of 3,4-dihydroxy-4-(4’-
methoxyphenyl)-3,4-dihydro-2(1H)-quinolinone.163
Comparison of the ECD spectra of 50 and 51 with that of 49, the closest relative
among the other metabolites encountered, showed some differences in both cases.
However, as might be expected given the relative configuration assignments for 50 and
51, the data for 50 more closely resembled those of 49, as both compounds show a
positive CE at approximately 270 nm, a negative CE near 250 nm, and a strongly positive
CE below 230 nm. By contrast, the ECD data for 51 included a negative CE at 286 nm
not present in any of the spectra for compounds 43, 44, and 47-50, although other ECD
features retained some resemblance with those of 43, 44, and 47-50. Thus, while the
absolute configuration of 50 was assigned to match those of 43, 44, and 47-49, that of 51
(the only metabolite encountered in this study with a trans orientation of the oxygen
substituents at C-3 and C-4) could not be assigned with confidence by comparison of the
experimental ECD curves. In an effort to resolve this ambiguity, we again employed
computational methods to calculate ECD spectra for the two possible enantiomers of 51.
The results (Figure 15) showed a much better match for the C-3 epimer of 50 than for its
enantiomer, resulting in assignment of the 3R,4S-configuration shown in 51.
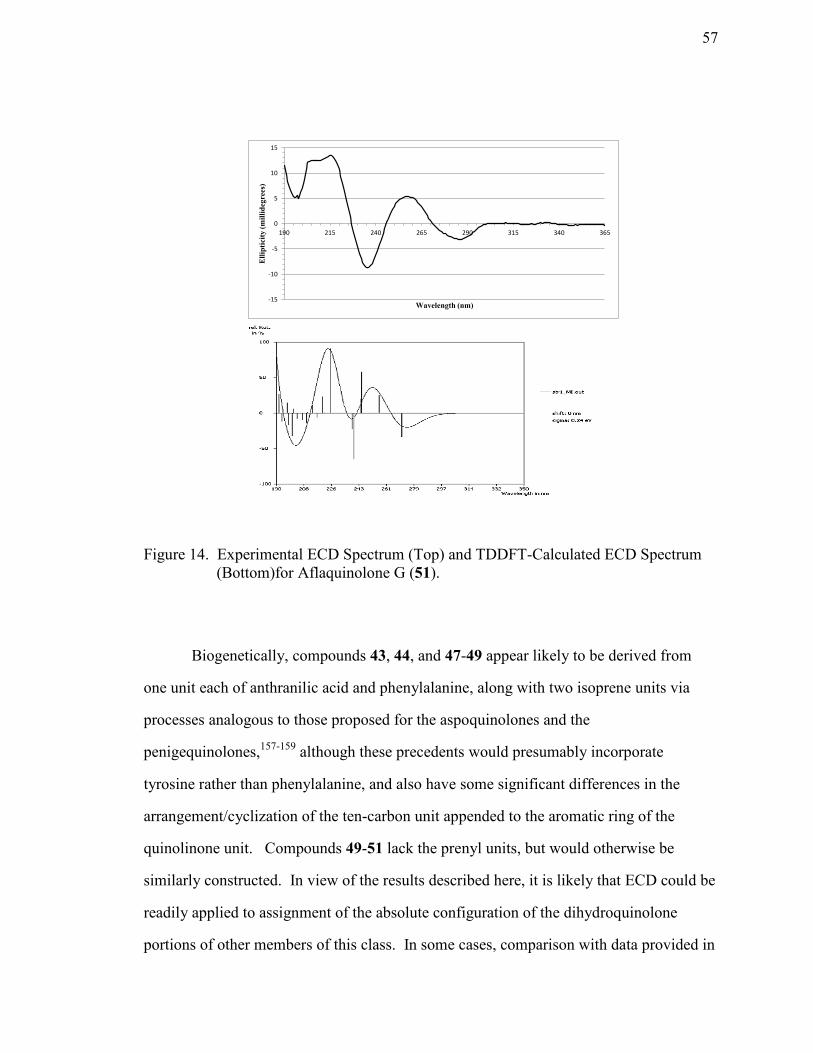
57
-15
-10
-5
0
5
10
15
190 215 240 265 290 315 340 365
Ellip
ticity
(mill
ideg
rees
)
Wavelength (nm)
Figure 14. Experimental ECD Spectrum (Top) and TDDFT-Calculated ECD Spectrum (Bottom)for Aflaquinolone G (51).
Biogenetically, compounds 43, 44, and 47-49 appear likely to be derived from
one unit each of anthranilic acid and phenylalanine, along with two isoprene units via
processes analogous to those proposed for the aspoquinolones and the
penigequinolones,157-159 although these precedents would presumably incorporate
tyrosine rather than phenylalanine, and also have some significant differences in the
arrangement/cyclization of the ten-carbon unit appended to the aromatic ring of the
quinolinone unit. Compounds 49-51 lack the prenyl units, but would otherwise be
similarly constructed. In view of the results described here, it is likely that ECD could be
readily applied to assignment of the absolute configuration of the dihydroquinolone
portions of other members of this class. In some cases, comparison with data provided in

58
the literature now enable such an assignment.159 However, establishment of the
configurations of any centers that are remote from this unit remains a complicated issue,
and would still require independent analysis on a case-by-case basis.
The fungicolous Aspergillus isolate from Hawaii (MYC-2048 = NRRL 58570)
was initially suggested to be Aspergillus flavipes (section Flavipedes) on the basis of
morphological characteristics. However, DNA sequence information and subsequent
BLAST queries of GenBank produced a 100% match with an undescribed species of
Aspergillus sp. NRRL 32683 (= MYC-1580 = NRRL 58569), another isolate from our
own collection that was shown to be most closely related to Aspergillus aureofulgens
section Flavipedes (NRRL 6326).164 The NRRL 6326 isolate was originally described
from truffle soil in France.164 Its occurrence in truffle soil is intriguing because this
environment is also suggestive of a possible fungicolous origin.
Neither compounds 43 nor 44 showed bioactivity that would account for the
initial activity seen in the extract of the Hawaiian isolate. However, numerous known
compounds were also encountered in the extract, including compounds 25, 28, 29, 41,
and 42.127,130,160,161 The presence of these bioactive compounds, along with their
abundance in the extract, likely explains the bioactivity originally observed. The
aflaquinolones were evaluated for growth inhibitory activity against chronic
myelogenous leukemia cells (K562), murine melanoma cells (B16F10), human acute
promyelocytic leukemia cells (HL-60), human breast cancer adenocarcinoma cells
(MDA-MB-231), and hepatocellular carcinoma cells (Hep3B) using in vitro cell viability
assays, although 48 was not tested due to sample limitations. As shown in Table 5,
aflaquinolone C (47) was the most active, showing weak inhibitory activity against all
five cell lines, with IC50 values ranging from 36.4 to 62.2 µg/mL. On the other hand, the
simpler quinolin-2-one analogues 49-51 showed little or no inhibitory activity against
these cells up to the 100 µg/mL level, which may indicate that the terpenoid side chain
plays an important role in the cytotoxicity of these compounds.
59
Cell Line 43 44 47 49 50 51K562 63.9 > 100 62.2 > 100 > 100 82.5B16F10 38.3 80.9 40.2 > 100 > 100 > 100HL-60 72.2 > 100 36.4 > 100 89.8 80.7MDA-MB-231 > 100 > 100 49.3 > 100 > 100 > 100Hep3B 71.7 > 100 43.5 > 100 > 100 > 100
Table 5. Growth Inhibitory Activity of Compounds 43, 44, 47, and 49-51 on Tumor Cell Lines.
IC50 (μg/mL)a
aThe concentrations of compounds needed to inhibit cell growth by 50% relative to controls.

60
CHAPTER 4
CHEMICAL INVESTIGATIONS OF A CRYPTIC FUNGICOLOUS
ISOLATE OF ASPERGILLUS SP. (SECTION FLAVIPEDES)
(MYC-1580 = NRRL 58569)
Our ongoing studies of fungicolous and mycoparasitic fungi have resulted in the
discovery of numerous novel bioactive natural products.6,110,111 Hawaiian isolates have
been a productive source of such compounds over the last few years.112,115,138 Chemical
investigation of an undescribed Aspergillus sp. (section Flavipedes) from Hawaii (MYC-
1580 = NRRL 58569) led to the isolation of two novel peptides (52 and 53). Asperlarin
A (52) incorporates an unusual 3-hydroxy-2-aminobenzoic acid (HABA) unit, and this
uncommon unit is new among compounds isolated from fungi in our group and has rarely
been reported as a constituent of any natural product.165 Flavipeptide A (53) is a cyclic
tetrapeptide peptide that bears close resemblance to the cyclic pentapeptide
cycloaspeptide A (24).125 Known bioactive metabolite PF1233B (54) was also isolated
from the extract. Literature data for this compound were incomplete,166 but complete
data were gathered for our sample, and are presented here. In addition, alantrypinone
(41),160 aspochalasins I (28) and J (29),130 curvularin (55),167 four curvularin analogues
(25, 56-58),127,168 and an asteriquinone-like compound (42)161 were also encountered in
the extract and identified by comparison of spectral data with literature values. Details
regarding the isolation and structure elucidation of asperlarin A (52), flavipeptide A (53),
and PF1233B (54) constitute the main focus of this chapter.
The fungicolous fungal isolate MYC-1580 was obtained from a basidioma of
Earliella scarbrosa found on a dead hardwood branch collected in a Hawaiian alien wet
forest. The fungus was cultured by solid-substrate fermentation on rice, and the EtOAc
extract of the resulting fermentation mixture showed antifungal activity against F.
verticillioides as well as the ability to reduce the growth rate of S. frugiperda (fall
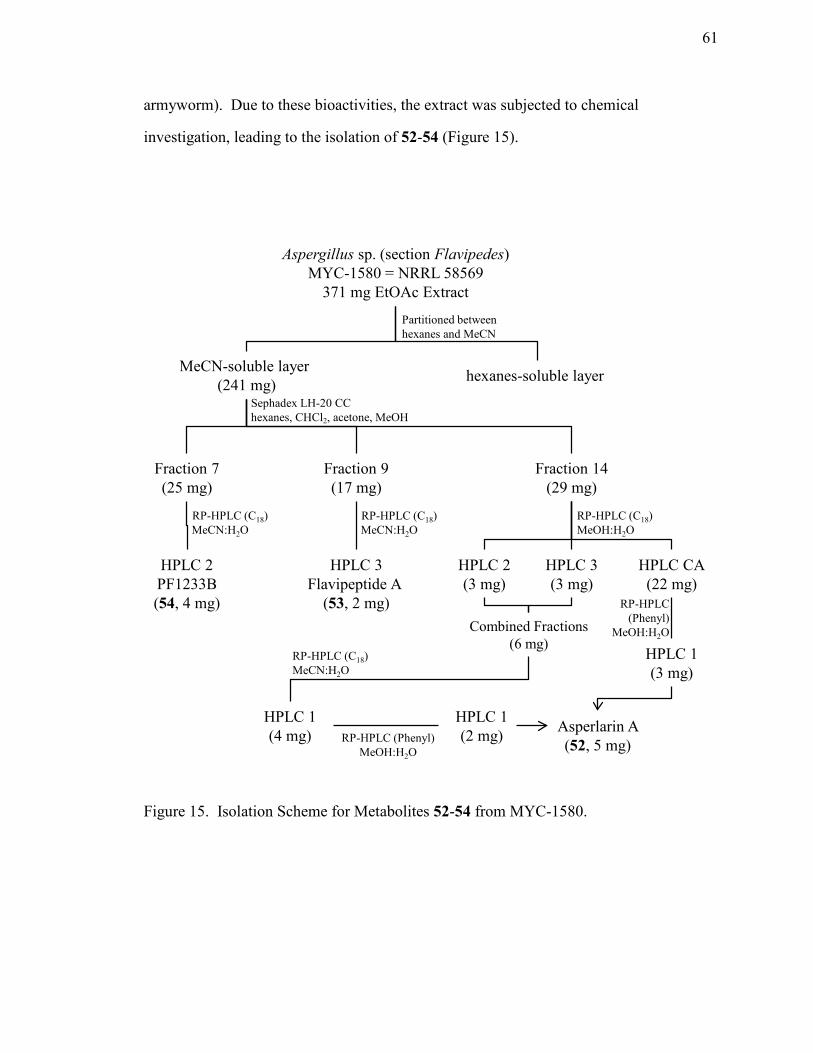
61
RP-HPLC (Phenyl)MeOH:H2O
Aspergillus sp. (section Flavipedes)MYC-1580 = NRRL 58569
371 mg EtOAc Extract
MeCN-soluble layer (241 mg) hexanes-soluble layer
Fraction 7(25 mg)
Sephadex LH-20 CC hexanes, CHCl2, acetone, MeOH
RP-HPLC (C18)MeCN:H2O
HPLC 2PF1233B(54, 4 mg)
Fraction 14(29 mg)
RP-HPLC (C18)MeOH:H2O
HPLC 2(3 mg)
HPLC 3(3 mg)
Combined Fractions(6 mg)
RP-HPLC (C18)MeCN:H2O
HPLC CA(22 mg)
RP-HPLC(Phenyl)
MeOH:H2O
HPLC 1(3 mg)
HPLC 1(4 mg)
HPLC 1(2 mg) Asperlarin A
(52, 5 mg)
Fraction 9(17 mg)
HPLC 3Flavipeptide A
(53, 2 mg)
RP-HPLC (C18)MeCN:H2O
Partitioned betweenhexanes and MeCN
armyworm). Due to these bioactivities, the extract was subjected to chemical
investigation, leading to the isolation of 52-54 (Figure 15).
Figure 15. Isolation Scheme for Metabolites 52-54 from MYC-1580.
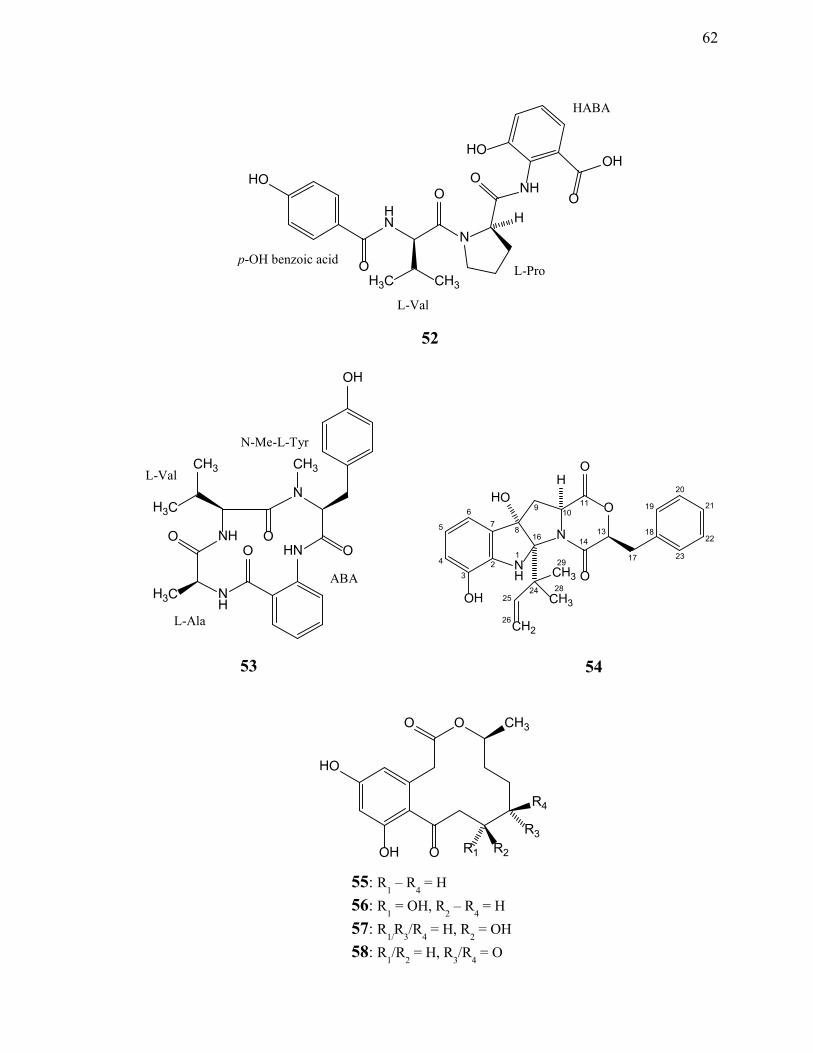
62
HN
OCH3H3C
N
OO
NH
HO
O
OHHO
H
p-OH benzoic acid
L-Val
L-Pro
HABA
52
54
NH
H
CH3
CH3
CH2
OH
O
O
HOO
N 22
11
25
16 4
5
1 2
6 8
14 17
18 19
20
23
7 13
3 29
28
9 21
24
10
26
O O
O R1 R2
CH3
HO
OH
R3
R4
55: R1 – R4 = H 56: R1 = OH, R2 – R4 = H 57: R1/R3/R4 = H, R2 = OH 58: R1/R2 = H, R3/R4 = O
O
NH
H3C
O NH
H3C
CH3
HN O
N
CH3
O
OH
L-Val
N-Me-L-Tyr
L-Ala
ABA
53
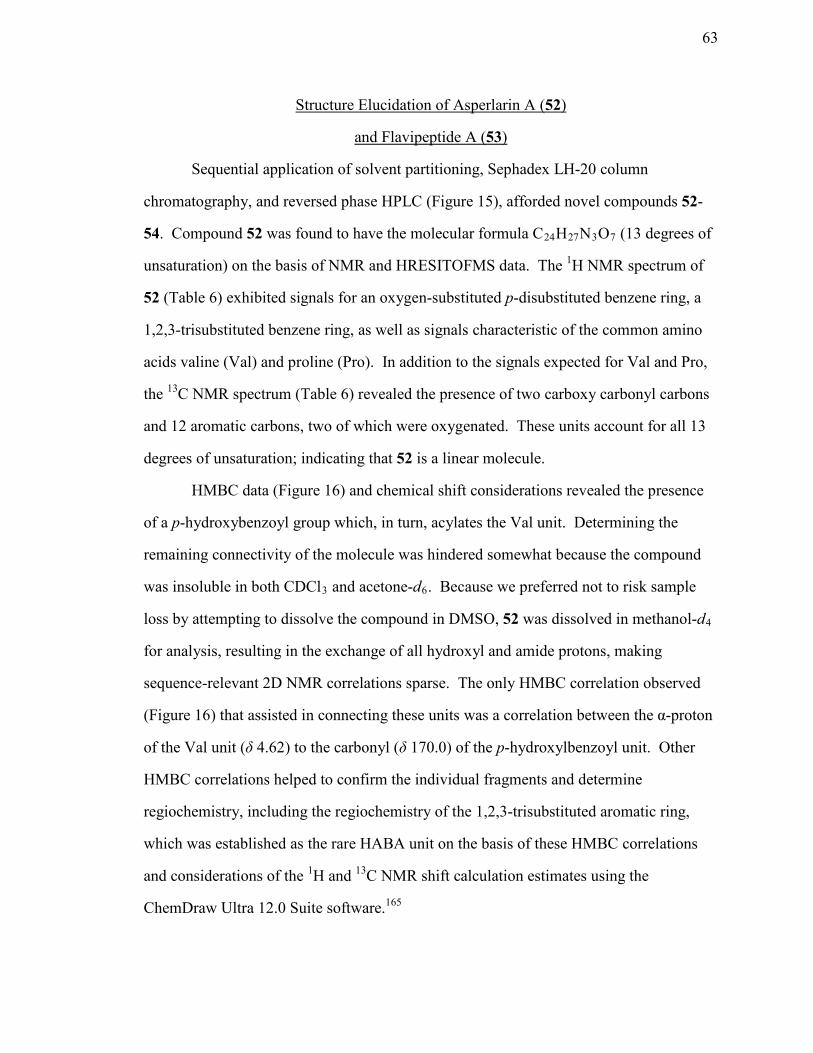
63
Structure Elucidation of Asperlarin A (52)
and Flavipeptide A (53)
Sequential application of solvent partitioning, Sephadex LH-20 column
chromatography, and reversed phase HPLC (Figure 15), afforded novel compounds 52-
54. Compound 52 was found to have the molecular formula C24H27N3O7 (13 degrees of
unsaturation) on the basis of NMR and HRESITOFMS data. The 1H NMR spectrum of
52 (Table 6) exhibited signals for an oxygen-substituted p-disubstituted benzene ring, a
1,2,3-trisubstituted benzene ring, as well as signals characteristic of the common amino
acids valine (Val) and proline (Pro). In addition to the signals expected for Val and Pro,
the 13C NMR spectrum (Table 6) revealed the presence of two carboxy carbonyl carbons
and 12 aromatic carbons, two of which were oxygenated. These units account for all 13
degrees of unsaturation; indicating that 52 is a linear molecule.
HMBC data (Figure 16) and chemical shift considerations revealed the presence
of a p-hydroxybenzoyl group which, in turn, acylates the Val unit. Determining the
remaining connectivity of the molecule was hindered somewhat because the compound
was insoluble in both CDCl3 and acetone-d6. Because we preferred not to risk sample
loss by attempting to dissolve the compound in DMSO, 52 was dissolved in methanol-d4
for analysis, resulting in the exchange of all hydroxyl and amide protons, making
sequence-relevant 2D NMR correlations sparse. The only HMBC correlation observed
(Figure 16) that assisted in connecting these units was a correlation between the α-proton
of the Val unit (δ 4.62) to the carbonyl (δ 170.0) of the p-hydroxylbenzoyl unit. Other
HMBC correlations helped to confirm the individual fragments and determine
regiochemistry, including the regiochemistry of the 1,2,3-trisubstituted aromatic ring,
which was established as the rare HABA unit on the basis of these HMBC correlations
and considerations of the 1H and 13C NMR shift calculation estimates using the
ChemDraw Ultra 12.0 Suite software.165

64
residue position δ H (mult; J in Hz) δ C
p -Hydroxybenzoic Acid C1 125.9C2/C6 7.74 (d, 8.8) 130.5C3/C5 6.82 (d, 8.8) 116.1C4 162.5CO 170.0
Valine Cα 4.72 (d, 7.5) 58.3Cβ 2.31 (m) 31.7Cγ 0.98 (d, 6.8) 18.8Cγ 1.08 (d, 6.8) 19.9CO 171.0
Proline Cα 4.62 (dd, 8.3, 5.1) 63.2Cβ 2.21 m 31.0
2.37 mCγ 2.08 m 26.2
2.08 mCδ 3.99 m 49.0
3.46 mCO 173.9
3-Hydroxy-2-Aminobenzoic Acid C1 123.0(HABA) C2 128.1
C3 150.3C4 6.94 (dd, 7.8, 1.6) 122.8C5 7.09 (t, 7.8) 126.5C6 7.56 (dd, 7.8, 1.6) 124.2CO 170.0
Table 6. 1H and 13C NMR Data for Asperlarin A (52) in CD3OD.a
aData collected at 400 MHz (1H) or 100 MHz (13C). 13C NMR assignments were established by analysis of HMQC and HMBC data.
Because HMBC correlations were unable to determine the sequence of the
structure HRESITOFMSMS data were employed to complete the gross structure of 52.
Key HRESITOFMSMS fragments corresponding to the loss of the p-hydroxylbenzoyl
unit from the peptide (m/z 384.1572), as well as fragment ions corresponding to Val – Pro
(m/z 195.1142), requiring the Pro unit to be acylated by the Val unit, and Pro – HABA
(m/z 249.0885), requiring the HABA unit to be acylated by the Pro unit, were observed.

65
p-OH benzoic acid
L-Val
HABA
L-Pro
The linkage of the HABA unit with the Pro unit was determined to be through acylation
of the HABA nitrogen atom based on a close similarity of both the 1H and 13C NMR
calculations using the ChemDraw Ultra 12.0 Suite software to the experimental data
(Table 6). These data confirmed the connectivity of the four units of 52 as shown.
Figure 16: HMBC Correlations for Asperlarin A (52).
Acid hydrolysis of 52 was performed to afford a mixture of the individual amino
acids present, and the absolute configurations of the resulting amino acids were
determined by GCMS analysis of the corresponding trifluoroacetyl (+)-S-sec-butyl ester
derivatives of the individual amino acids.
The hydrolyzate of 52 was treated with (+)-S-sec-butanolic HCl and then heated
at 110°C for 30 min. The solvent was completely removed before the product was
redissolved in CH2Cl2 and trifluoroacetic anhydride (TFAA), and then heated at 150°C
for 5 min. The resulting solution was only partially evaporated before additional CH2Cl2
HN
OCH3H3C
N
OO
NH
HO
O
OHHO
H
H
H
H
HH
HH
H
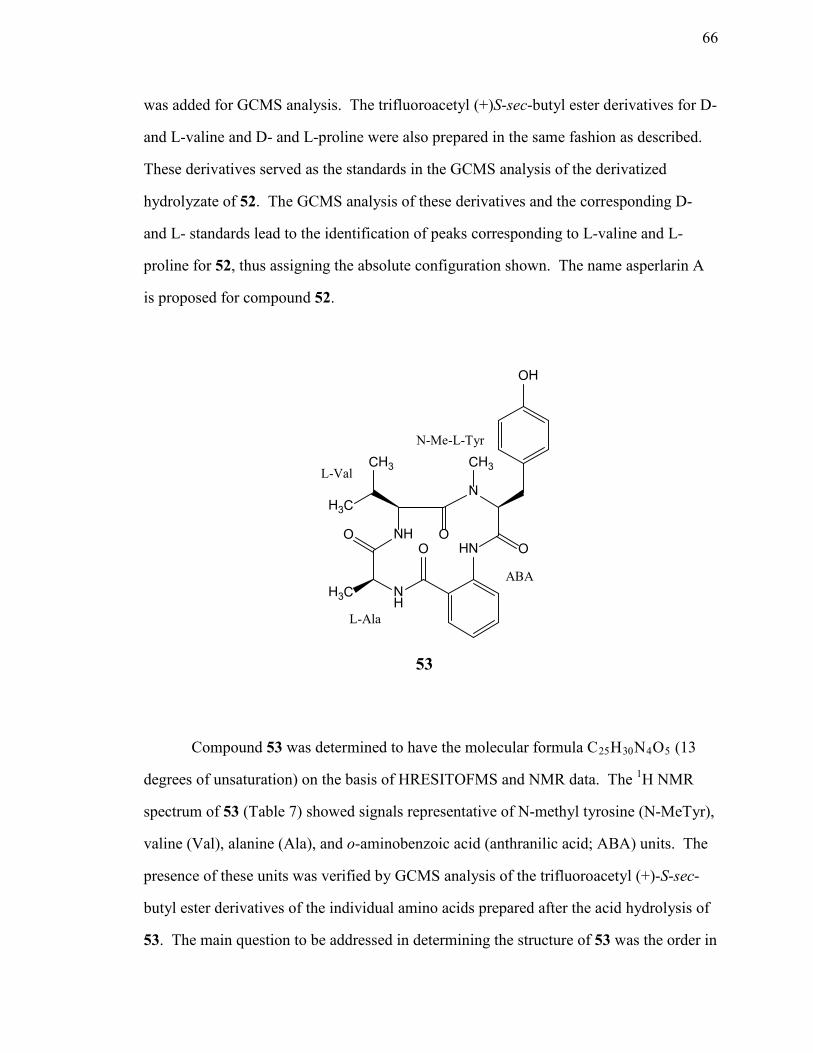
66
O
NH
H3C
O NH
H3C
CH3
HN O
N
CH3
O
OH
L-Val
N-Me-L-Tyr
L-Ala
ABA
53
was added for GCMS analysis. The trifluoroacetyl (+)S-sec-butyl ester derivatives for D-
and L-valine and D- and L-proline were also prepared in the same fashion as described.
These derivatives served as the standards in the GCMS analysis of the derivatized
hydrolyzate of 52. The GCMS analysis of these derivatives and the corresponding D-
and L- standards lead to the identification of peaks corresponding to L-valine and L-
proline for 52, thus assigning the absolute configuration shown. The name asperlarin A
is proposed for compound 52.
Compound 53 was determined to have the molecular formula C25H30N4O5 (13
degrees of unsaturation) on the basis of HRESITOFMS and NMR data. The 1H NMR
spectrum of 53 (Table 7) showed signals representative of N-methyl tyrosine (N-MeTyr),
valine (Val), alanine (Ala), and o-aminobenzoic acid (anthranilic acid; ABA) units. The
presence of these units was verified by GCMS analysis of the trifluoroacetyl (+)-S-sec-
butyl ester derivatives of the individual amino acids prepared after the acid hydrolysis of
53. The main question to be addressed in determining the structure of 53 was the order in

67
which the amino acyl units were connected. Due to the poor solubility of 53 in CDCl3,
HMBC data were collected in acetone-d6, leading to gradual exchange of the NH
protons. This gradual exchange of NH protons in acetone-d6 could be seen most clearly
in the Val α-proton signal at δ 4.49 which occurred as a doublet (for the exchanged
version) overlapping with a triplet (for the non-exchanged proton). (Figure A17 and
Table 7) Over time, this signal was gradually simplified to a doublet, indicating that the
exchange of the NH proton had proceeded to completion.
residue position δ H (mult; J H in Hz) δ C
N-Me Tyrosine N-Me 2.94 (s) 40.8Cα 4.04 (dd, 11, 4.0) 70.2Cβ 3.37 (dd, 14, 4.0) 33.9
3.17 (dd, 14, 11)C1 131.0
C2, C6 7.12 (d, 8.6) 131.8C3, C5 6.81 (d, 8.6) 116.3
C4 157.5CO 169.0OH 8.19 (br s)
o -Aminobenzoic acid NH 9.79 (br s)b
(ABA) C1 128.8C2 139.0C3 8.42 (br d, 8.3) 121.9C4 7.46 (td, 8.3, 1.4) 132.5C5 7.09 (td, 7.6, 1.4) 123.5C6 7.57 (dd, 7.6, 1.4) 127.9CO 171.2
Alanine NH 8.21 (br s)b
Cα 4.16 (dq, 1.5, 7.5)b 55.0Cβ 1.54 (d, 7.5) 16.6CO 173.5
Valine NH 7.96 (br d)b
Cα 4.49 (t, 10)b 55.9Cβ 1.96 (dsep, 10, 6.8) 31.3Cγ 0.89 (d, 6.8) 18.9Cγ 0.93 (d, 6.8) 20.2CO 172.6
aData were collected at 400 MHz (1H) or 100 MHz (13C). bPartially exchanged (see text).
Table 7. 1H and 13C NMR Data for Flavipeptide A (53) in Acetone-d 6.a
68
Due in part to this gradual exchange of amide protons, there was only a single
useful HMBC correlation to link to individual units together. The HMBC correlation
from the N-methyl group of the N-MeTyr unit to the carbonyl carbon of Val indicated
that the Val unit acylates the N-MeTyr unit, but ultimately, HMBC data were
inconclusive in completing the structure of 53. HRESITOFMSMS data were therefore
again used to determine the remainder of the sequence. HRESITOFMSMS fragments
corresponding to Val – N-MeTyr (m/z 277.1555), the connection which had previously
been established via HMBC correlations, ABA – Ala (m/z 191.0825), accounting for the
other two identified fragments, and N-MeTyr – ABA (m/z 297.1245), which indicated
that N-MeTyr must acylate ABA. This, in turn, meant that ABA must acylate Ala based
on the ABA – Ala fragment identified above. The only possible remaining connection
for 53 is the one in which Ala acylates Val, thus completing the gross structure of 53 as
shown. Interestingly, the assigned sequence matches that of the known fungal cyclic
pentapeptide cycloaspeptide A (24), with the difference being the absence of the
phenylalanine unit.125 Even though compound 53 bears this similarity to 24, compound
24 was not detected as a constituent of this extract. In fact, no other cyclic peptides were
encountered in the extract.
Determination of the absolute configuration of compound 53 was accomplished
through the same acid hydrolysis and trifluoroacetyl S-sec-butyl ester derivatization
process that was used for 52. GCMS analysis, and comparison to authentic D- and L-
standards prepared in the same manner allowed for the assignment of the absolute
configuration of each individual amino acid. Peaks corresponding to L-val, L-ala, and N-
Me-L-tyr were observed, thereby enabling assignment of the absolute configuration of 53
as shown. The name flavipeptide A is proposed for compound 53.
69
Structure Elucidation of PF1233B (54)
Compound 54166 was determined to have the molecular formula C25H26N2O5 (14
degrees of unsaturation) on the basis of NMR and HRESITOFMS data. The 1H NMR
spectrum of 54 (Table 8) exhibited signals for a phenyl group, a vinyl group, a 1,2,3-
trisubstuted benzene ring, and two protons attached to heteroatom-bearing carbons. Two
methyl singlets, two sp3 methylene signals, and three exchangeable proton signals were
also present in the spectrum. In addition to signals for the aforementioned units, the 13C
NMR spectrum (Table 8) contained four oxygenated sp2 or carbonyl carbon signals, two
downfield-shifted aromatic carbons, a downfield-shifted sp3 carbon suggestive of
multiple heteroatoms connected to a single carbon, and three aliphatic carbons. These
units account for nine degrees of unsaturation. This requires the presence of three
additional rings, and the four sp2 carbons noted above still needed to be assigned as
either oxygenated or carbonyl carbons.
Two-dimensional NMR data (Table 8) were used to determine the structure of
compound 54. The phenyl group was located at C-17 on the basis of HMBC correlations
of H2-17 to C-18 and C-23. In turn, H2-17 showed correlations to oxygenated sp3 carbon
C-13 and carbonyl carbon C-14. Correlations from H-13 to C-17 and C-14 confirmed
this connection. H-13 also showed a correlation to another carbonyl carbon (C-11)
requiring acylation of the C-13 oxygen to form an ester linkage. This portion of the
molecule was extended by correlations from mutually coupled protons H2-9 and H-10 to
C-11. H-10 showed correlations to oxygenated carbon C-8, carbonyl carbon C-14, and
heteroatom-bearing carbon C-16. Additional correlations from H2-9 to quaternary
carbons C-8 and C-16 were suggestive of a five-membered ring attached to a modified
diketopiperazine ring system, completing two of the three additional rings that were
needed for 52.
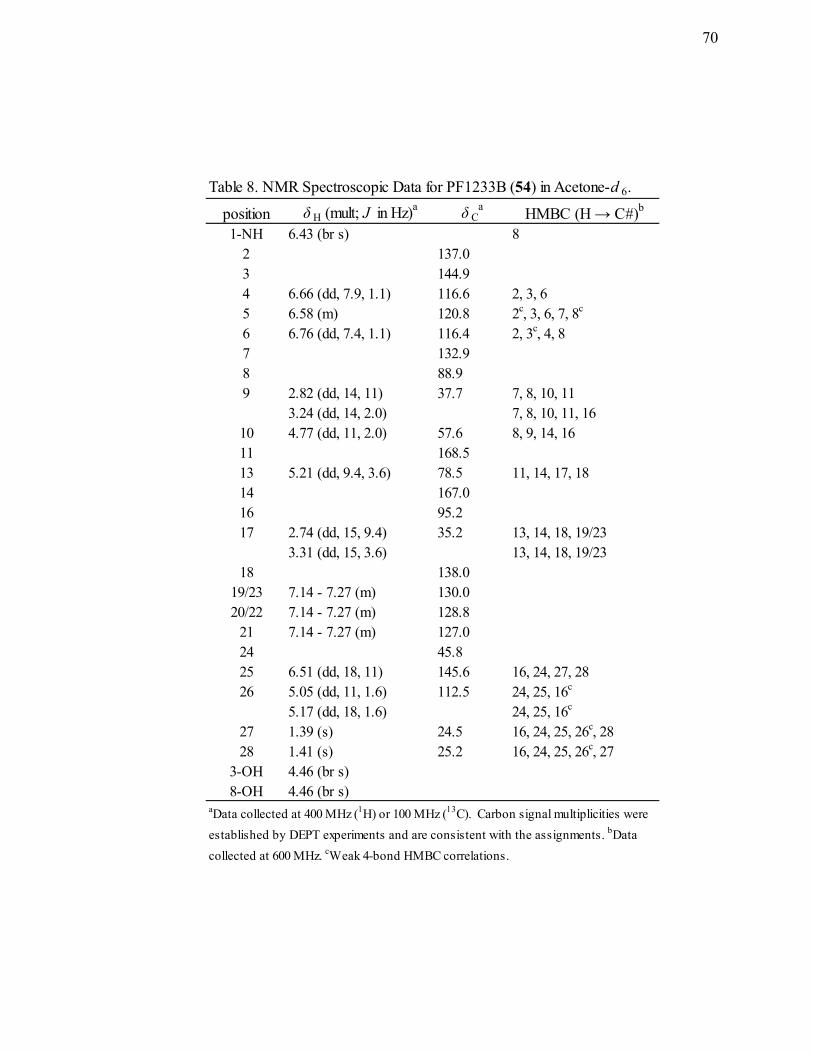
70
position δ H (mult; J in Hz)a δ Ca HMBC (H → C#)b
1-NH 6.43 (br s) 82 137.03 144.94 6.66 (dd, 7.9, 1.1) 116.6 2, 3, 65 6.58 (m) 120.8 2c, 3, 6, 7, 8c
6 6.76 (dd, 7.4, 1.1) 116.4 2, 3c, 4, 87 132.98 88.99 2.82 (dd, 14, 11) 37.7 7, 8, 10, 11
3.24 (dd, 14, 2.0) 7, 8, 10, 11, 1610 4.77 (dd, 11, 2.0) 57.6 8, 9, 14, 1611 168.513 5.21 (dd, 9.4, 3.6) 78.5 11, 14, 17, 18 14 167.016 95.217 2.74 (dd, 15, 9.4) 35.2 13, 14, 18, 19/23
3.31 (dd, 15, 3.6) 13, 14, 18, 19/2318 138.0
19/23 7.14 - 7.27 (m) 130.020/22 7.14 - 7.27 (m) 128.8
21 7.14 - 7.27 (m) 127.024 45.825 6.51 (dd, 18, 11) 145.6 16, 24, 27, 2826 5.05 (dd, 11, 1.6) 112.5 24, 25, 16c
5.17 (dd, 18, 1.6) 24, 25, 16c
27 1.39 (s) 24.5 16, 24, 25, 26c, 2828 1.41 (s) 25.2 16, 24, 25, 26c, 27
3-OH 4.46 (br s)8-OH 4.46 (br s)
aData collected at 400 MHz (1H) or 100 MHz (13C). Carbon signal multiplicities were established by DEPT experiments and are consistent with the assignments. bData collected at 600 MHz. cWeak 4-bond HMBC correlations.
Table 8. NMR Spectroscopic Data for PF1233B (54) in Acetone-d 6.

71
54
Two-dimensional NMR data (Table 8) were used to determine the structure of
compound 54. The phenyl group was located at C-17 on the basis of HMBC correlations
of H2-17 to C-18 and C-23. In turn, H2-17 showed correlations to oxygenated sp3 carbon
C-13 and carbonyl carbon C-14. Correlations from H-13 to C-17 and C-14 confirmed
this connection. H-13 also showed a correlation to another carbonyl carbon (C-11),
requiring acylation of the C-13 oxygen to form an ester linkage. This portion of the
molecule was extended by correlations from mutually coupled protons H2-9 and H-10 to
C-11. H-10 showed correlations to oxygenated carbon C-8, carbonyl carbon C-14, and
heteroatom-bearing carbon C-16. These data, together with additional correlations from
H2-9 to quaternary carbons C-8 and C-16, were suggestive of a five-membered ring
attached to a modified diketopiperazine ring system, completing two of the three
additional rings that were needed for 54.
Correlations from H-6 to C-8 and from H2-9 to C-7 located the 1,2,3-
trisubstituted aromatic ring by connecting it to the aforementioned unit via C-8. HMBC
correlations within the 1,2,3-trisubstituted ring set the regiochemistry of the oxygenated
aromatic carbon (C-3) and another downfield-shifted aromatic carbon (C-2). A
correlation from an exchangeable signal (δ 6.43, NH-1) to C-8 completed a
NH
H
CH3
CH3
CH2
OH
O
O
HOO
N
72
dihydroindole-type structure and closed the final, required ring at C-16. Interestingly,
one of the 1,2,3-trisubstituted aromatic ring protons (δ 6.58, H-5) exhibited a splitting
pattern that was unusual for its location in 54. (Figure A19) Due to its coupling with
protons H-4 and H-6, H-5 was expected to be a triplet or a doublet of doublets, but it
exhibited an unexpected additional small splitting. Decoupling experiments were
unsuccessful in determining the source of the additional splitting, but it could be caused
by long-range coupling to the hydroxyl proton (OH-3) or the amine proton (NH-1), both
of which are broad singlets that could mask small splitting characteristics and slight
changes expected during decoupling experiments. In either case, the connectivity
proposed thus far for 54 is fully consistent with all of the other data obtained.
The remaining nitrogen was placed within the modified diketopiperazine ring
system as shown, allowing for an amide linkage. This modification also explains the
downfield-shifted nature of C-16, as it is linked to two heteroatoms. It also rationalizes
the downfield shift of H-10 in the 1H NMR spectrum. The remaining units of 54 were
linked by HMBC correlations from the terminal olefinic signals (H2-26) to C-24 and C-
25, establishing a prenyl moiety. This prenyl group was attached to the core structure at
C-16 via HMBC correlations from H-25, H3-27, and H3-28, thereby completing the gross
structure of 54. All of these conclusions were also supported by additional HMBC data.
Once the structure had been established, an extensive literature search led to a match with
compound 54, called PF1233B, a bioactive metabolite previously described only briefly
in a Japanese patent.166 In this patent, PF1233B (54) is said to have the potential for use
in treating an irregular heartbeat, as a pain reliever, as a sodium channel blocker, and for
protection from seizures.166
The stereochemistry shown for 54 matches that of the structure from the literature
because 1H NMR J-values and [α]D data were the same as those of the previously
described sample.166 Due to the inability to translate the Japanese patent information into
English, the method in which the configuration, whether relative or absolute, for 54 was

73
assigned in the patent could not be determined. The patent literature for compound 54
provides 1H NMR, 13C NMR, UV, IR, HRFABMS, and rotational data, but it is
incomplete with regard to the description of 1H NMR multiplicities and J-values and does
not provide 13C NMR assignments. Thus, complete 1H and 13C NMR data for this
metabolite are provided here.
Neither asperlarin A (52) nor flavipeptide A (53) showed antifungal activity
against A. flavus or F. verticillioides at 100 µg/disk. Flavipeptide A (53) was not tested
for activity against the fall armyworm, but asperlarin A (52) reduced the growth rate of
the fall armyworm by 14% in a dietary assay at 100 ppm. PF1233B (54) was not tested
against A. flavus and it did not show activity against F. verticillioides. However,
compound 54 did show weak, but statistically significant activity against the fall
armyworm at P < 0.05 (13% reduced growth rate) when it was incorporated into the diet
at 160 ppm. Curvularin (55) and various curvularin derivatives (including 25, 56-58)
have been isolated from various fungal species, including Penicillium citreoviride and
Eupenicillium sp.,133 and reported to possess antifungal, antitumor, and antibacterial
activity against Staphylococcus aureus,133 as well as cytotoxicity against sea urchin
embryo cells.168 Aspochalasins I (28) and J (29), originally reported from and isolate of
Aspergullus flavipes, are reported to exhibit weak to moderate cytotoxicity against cancer
cell lines, but no antifungal activity was described in the literature.130 Alantrypinone (41)
was originally reported from an isolate of Penicillium thymicola, with no biological
activity data provided.160 It was later described as an antiinsectan alkaloid that is highly
selective for insect (vs. mammalian) GABA (γ-aminobutyric acid) receptors, an
important site for insecticidal activity.169 No antifungal activity has been reported in the
literature for 41. Compound 42 was isolated from an isolate of Aspergillus terreus and is
said to exhibit contractive activity for smooth (bronchial and intestinal) muscles and
cardinal muscles of guinea pigs, but no anti-inflammatory activity. No antifungal or
antiinsectan activity was reported for 42. Ultimately, the presence of these known

74
bioactive compounds (25, 28, 29, 41, 42, and 55-58), along with their abundance in the
extract, especially that of 25 and 56-58, is likely to explain the moderate antifungal and
antiinsectan activity originally observed for the crude extract.

75
CHAPTER 5
CHEMICAL INVESTIGATIONS OF AN ENDOPHYTIC ISOLATE OF
EMERICELLA NIDULANS (ENDO-3111 = NRRL 58893)
By analogy to fungal endophytes found in corn plants, fungal endophytes of
wheat (Triticum aestivum) could also play an important role in the health of these
economically important crop plants. The U.S. wheat harvest in 2010 was valued at
nearly $13 billion.170 Like other plants, living wheat plants typically contain a host of
fungal endophytes, and the metabolites they produce could conceivably be relevant to
plant health, and could also affect livestock and humans, either directly or indirectly. Our
research group has shown that fungal endophytes of corn are prolific producers of
bioactive secondary metabolites,118-120 and it is likely that fungal endophytes of wheat
also produce a variety of active compounds. In the course of our ongoing project on
endophytic fungi, we investigated a fungal endophyte of wheat identified as Emericella
nidulans (anamorph: Aspergillus nidulans). This isolate (ENDO-3111) was obtained
from a wheat seed that was collected in Arizona, and was fermented on rice for 30 days at
25 °C. The EtOAc extract of the resulting fermentation cultures displayed moderate
antifungal activity against A. flavus and F. verticillioides, as well as the ability to
significantly reduce the growth rate of the fall armyworm (S. frugiperda) and was
therefore targeted for chemical investigation. Distinctive metabolites that exhibit
biological activity have been isolated from E. nidulans before,171 and the possibility that
E. nidulans might produce additional novel bioactive metabolites was also a contributing
factor in choosing this isolate for chemical investigation.
The initial crude extract (and later a subsequent scale-up fermentation) was
partitioned between MeCN and hexanes, thereby removing most of the lipids, and the
resulting MeCN-soluble layer was fractionated using silica gel chromatography and
76
reversed-phase HPLC techniques, ultimately yielding six known compounds and four
novel compounds (Figure 17) that will be discussed in this chapter.
The six known compounds were identified by comparison of 1H NMR, 13C NMR,
and MS data with literature values. They were determined to be sterigmatocystin (59),172
emindole DA (60),173 emestrin (61),174 microperfuranone (62),175 3-benzyl-4-phenyl-2,5-
furadione (63,an acid anhydride precursor of 62),176 and silvaticol (64),177 also known as
porriolide.178 Sterigmatocystin (59) has been isolated from E. nidulans previously, and is
a carcinogenic polyketide mycotoxin produced by many fungi. Sterigmatocystin (59) is
considered to be a precursor to the more potent carcinogenic mycotoxins known as
aflatoxins, which are among of the most widely studied fungal metabolites due to their
considerable economic impact as crop contaminents.179 In contrast to its activity as a
carcinogenic mycotoxin, 59 has also been reported to possess antitumor activity against
multiple human solid tumor cell lines.180 Compound 59 is also reported to exhibit
antiinsectan properties.181 Emindole DA (60) has also been previously isolated from E.
nidulans, and is also reported to exhibit antitumor activity against multiple tumor cell
lines.171 The literature does not describe the antifungal or antiinsectan activity for 60.
The known macrocyclic epidithiodioxopiperazine emestrin (61), biogenetically derived
from the combination of benzoic acid and two units of phenylalanine, was a major
constituent of this extract and is known to display a wide range of biological activities.
Effects of 61 reportedly include acute poisoning in mice,182 inducing DNA clevage,183
ability of neutralizing the binding of 125I-MCP (a chemoattractant protein) to the
chemokine receptor CCR2, which is associated with inflammation in the lungs and
several other organs,184 and antifungal effects against Gibberella zeae and Penicillium
expansum at concentrations of 1.0 µg/disk (MICs were 10 and 2.5 µg/mL,
respectively).185 In our own disk diffusion assays, 61 showed significant antifungal
activity against both A. flavus and F. verticillioides, causing clear inhibition zones after
two days with diameters of 23 and 33 mm, respectively, at 100 µg/disk. Compound 61

77
O
O
O OH
O
OCH3
H
H
H CH3
OH
CH3
H2C
NH
CH3
CH3
60
also exhibited significant activity against the fall armyworm causing a 28% reduction in
growth rate at the 100 ppm dietary level. Due to the abundance of 60 and 61 in the
ENDO-3111 extract, the majority of antifungal and antiinsectan activity exhibited by the
extract can be attributed to the presence of these bioactive metabolites.
Microperfuranone (62) was originally isolated from cultures of the ascomycete
Anixiella micropertusa175 and was tested for antibacterial, antifungal, and antialgal
activity at 50 µg/disk in standard disk diffusion assays,171 but it did not exhibit any
effects. The acid anhydride 63, originally isolated from the anamorph of E. nidulans,
stimulated the elongation of the roots of radish and lettuce seedlings when tested at 100
μg/mL.176 Silvaticol (64), originally isolated from the fungus Aspergillus silvaticus,177
was also isolated from Alternaria porri (Ellis) Ciferri, the casual fungus of black spot
disease in the stone-leek and onion, and mistakenly given a different name, porriolide.178
Phthalide 64 exhibited minimal phytotoxicity against lettuce and stone-leek seedlings,
inhibiting root elongation by 53 and 48%, respectively, when tested at 400 ppm,178 but no
discussion of antifungal or antiinsectan activity of this compound is reported in the
literature.
59

78
O
NO
N
O
O
O
H3CO
CH3
SS
H
O
HO
OH
OH
61
64
OO O
O
OHO
H3C
OCH3
63
OO OH
62
The novel secondary metabolites isolated from this extract were assigned the
names emeridin A (65), O-methylsecoemestrin C1 (66), 5-(hydroxymethyl)-2,4-
dimethylbenzene-1,3-diol (67), and 5-(hydroxymethyl)-3-methoxy-2,4-dimethylphenol
(68), and the details of the isolation (Figure 17) and structure elucidation of these new
natural products are the focus of the remainder of this Chapter.

79
65
O
CH3
O
O
CH3
CH3H3C
CH3
OCH3
CH3
OO
H3C
H
CH3
25
22
11
4 5 1
2 6
8 14 17
18
19 20
23
7 13
3 29
28
9
21
24
10 26
27
12 15 16
Emericella nidulansENDO-3111 = NRRL 58893
1.01 g EtOAc Extract
MeCN-soluble layer(847 mg)
hexanes-soluble layer
Fraction 7(172 mg)
Partitioned betweenhexanes and MeCN
Silica gel LC (540 mg)hexanes, CHCl2, EtOAc, MeOH
Fraction 9(59 mg)
Silica gel LChexanes, CHCl2, EtOAc
HPLC 9Emeridin A (65, 6 mg)
RP-HPLC (C18) (26 mg)MeCN:H2O
HPLC 6O-Methylsecoemestrin C1
(66, 2 mg)
Fraction 8(40 mg)
HPLC 25-(Hydroxymethyl)-2,4-
dimethylbenzene-1,3-diol(67, 1 mg)
HPLC 35-(Hydroxymethyl)-3-methoxy-
2,4-dimethylphenol(68, 6 mg)
RP-HPLC (C18) MeCN:H2O
Figure 17. Isolation Scheme for Metabolites 65-68 from ENDO-3111.

80
Structure Elucidation of Emeridin A (65)
Emeridin A (65) was found to possess the elemental composition C27H36O6 (ten
degrees of unsaturation) on the basis of NMR (Table 9) and HRESIMS data. The 1H
NMR spectrum of 65 contained resonances that corresponded to a conjugated triene
system, three sp3 CH protons, a single proton attached to an oxygenated carbon, and nine
methyl groups, one of which (δ 1.74) was identified as an vinyl methyl, and another (δ
2.02) as an acetyl group methyl. Two of the remaining seven methyl signals were
doublets (J = 7 Hz) while the last five were singlets representative of methyl groups
attached to quaternary sp3 carbons, one of which was an oxygenated sp3 carbon. Of the
remaining six carbons, two were quaternary sp3 carbons and the others were identified as
carbonyls, two of which were ketones and two of which were esters. The triene
functionality was assembled as shown in 65 on the basis of 1H, 13C, HMQC, and HMBC
NMR data. The corresponding J-values (11 to 16 Hz) established the E geometry of the
two disubstituted olefinic moieties, while the C-12–C-13 double bond was identified as
being trisubstituted, bearing the aforementioned vinyl methyl group.
All proton-bearing carbons were correlated to signals for their directly-connected
protons using HMQC data and these assignments are reflected in Table 9. The
cyclopentanone ring, on the right side portion of 65, was assembled by analysis of
HMBC correlations (Table 9). The previously identified acetyl methyl (H3-21) was
established as part of an acetate group due to its HMBC correlations to ester carbon C-20
and C-16, an oxygenated sp3 carbon. HMBC correlations from H3-23 to C-16, C-15, and
ketone carbon C-17 located the only methyl group attached to an oxygenated sp3 carbon
as shown. HMBC correlations from H3-24 to C-17, C-18, and C-14 indicated that the
methine CH-18 connected to methyl group H3-24 was attached to a quaternary sp3
carbon, as well as to C-17. Methyl carbon H3-22 exhibited correlations to C-14,
quaternary sp3 carbon C-15, and oxygenated carbon C-16. Together, these HMBC
correlations required a cyclopentanone ring, with an acetate unit attached at C-16. The

81
structure of 65 was extended though correlations from H-13 to C-14 and from H-14 to
olefinic carbons C-12 and C-13, indicating that the triene system was attached to the
cyclopentanone ring via C-14. HMBC correlations from vinyl methyl H3-25 to C-12, C-
13, and C-14 confirmed this connection. The structure of 65 was extended at the
opposite end of the triene system by HMBC correlations from olefinic proton H-8 to
quaternary sp3 carbons C-3 and C-7, oxygenated methine carbon C-6, and methyl carbon
C-26. Correlations from H3-26 to C-3, C-6, C-7, and C-8 confirmed its connection at C-
7. Methyl group H3-29 was attached at C-3 through is HMBC correlations to C-3, C-7,
ester carbon C-2, and ketone carbon C-4. Additional HMBC correlations from H3-27 to
C-4, C-5, C-6, and C-28, and from H3-28 to C-4, C-5, C-6, and C-27 indicate that the H3-
27 and H3-28 methyl groups are both attached to the same quaternary sp3 carbon (C-5),
which is situated between ketone carbon C-4 and oxygenated carbon C-6. These
correlations and the correlations from H-6 to ester carbon C-2, ketone carbon C-4, C-5,
and to methyl groups C-27 and C-28 indicate a ketolactone ring. The last degree of
unsaturation, as indicated by spectroscopic and HRESIMS data for 65, was established by
a strong HMBC correlation from H-6 to C-3, which indicated that C-7 a bridgehead
carbon, forming the final ring. Additionally, H-6 also showed a weak long-range
correlation to C-29, which would be consistent with such a bicyclic ring structure, as 2-
type long-range couplings in such systems are often observed, thereby completing the
gross structure of 65. This type of bicyclic ring system has been previously described as
being part of a bioactive natural product produced by Penicillium rugulosum, isolated by
Jayasuriya and co-workers.186 The numbering system of 65 is also based on this
literature report.186 All of these conclusions were supported by additional HMBC data.
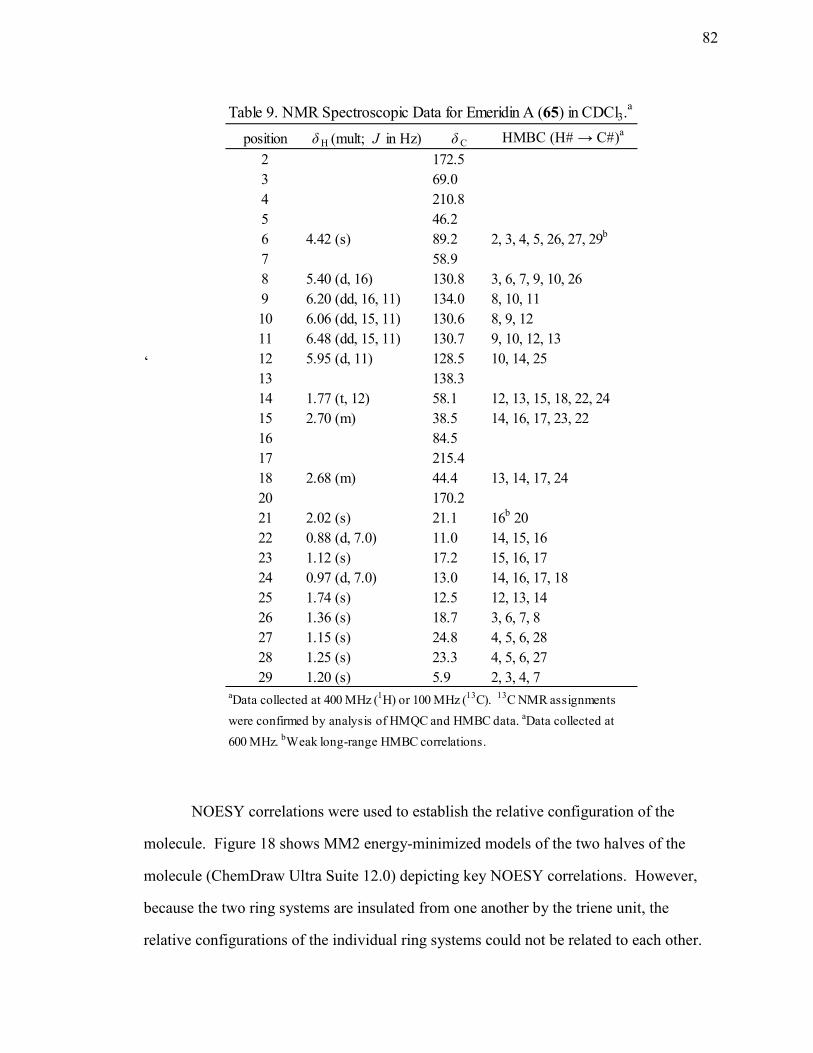
82
position δ H (mult; J in Hz) δ C HMBC (H# → C#)a
2 172.53 69.04 210.85 46.26 4.42 (s) 89.2 2, 3, 4, 5, 26, 27, 29b
7 58.98 5.40 (d, 16) 130.8 3, 6, 7, 9, 10, 269 6.20 (dd, 16, 11) 134.0 8, 10, 1110 6.06 (dd, 15, 11) 130.6 8, 9, 1211 6.48 (dd, 15, 11) 130.7 9, 10, 12, 1312 5.95 (d, 11) 128.5 10, 14, 2513 138.314 1.77 (t, 12) 58.1 12, 13, 15, 18, 22, 2415 2.70 (m) 38.5 14, 16, 17, 23, 2216 84.517 215.418 2.68 (m) 44.4 13, 14, 17, 2420 170.221 2.02 (s) 21.1 16b 2022 0.88 (d, 7.0) 11.0 14, 15, 1623 1.12 (s) 17.2 15, 16, 1724 0.97 (d, 7.0) 13.0 14, 16, 17, 1825 1.74 (s) 12.5 12, 13, 1426 1.36 (s) 18.7 3, 6, 7, 827 1.15 (s) 24.8 4, 5, 6, 2828 1.25 (s) 23.3 4, 5, 6, 2729 1.20 (s) 5.9 2, 3, 4, 7
Table 9. NMR Spectroscopic Data for Emeridin A (65) in CDCl3.a
aData collected at 400 MHz (1H) or 100 MHz (13C). 13C NMR assignments were confirmed by analysis of HMQC and HMBC data. aData collected at 600 MHz. bWeak long-range HMBC correlations.
‘
NOESY correlations were used to establish the relative configuration of the
molecule. Figure 18 shows MM2 energy-minimized models of the two halves of the
molecule (ChemDraw Ultra Suite 12.0) depicting key NOESY correlations. However,
because the two ring systems are insulated from one another by the triene unit, the
relative configurations of the individual ring systems could not be related to each other.

83
Due to the geometric constraints of the bridgehead carbon present in the bicyclic ring
system, the relative configurations at C-3 and C-6 must be assigned as shown. Therefore,
NOESY correlations are only needed to assign the relative configuration at the
bridgehead carbon, C-7. NOESY correlations from H3-28 to both H-8 and H-9 indicate
that the triene system and the methyl groups at C-5 are orientated on the same side of the
bridgehead carbon, C-7. This enables the assignment of the relative configuration at C-7
as shown in 65. The relative configuration of the cyclopentanone ring in 65 was also
assigned through a series of NOESY correlations (Figure 18). H-14 showed NOESY
correlations to both H3-22 and H3-24, and H3-22 showed a correlation to H3-23,
indicating that all of these hydrogens are on the same face of the ring. In addition, H-12
exhibited strong correlations to H-15 and H-18, confirming that H-14 is cis to both H3-22
and H3-24. This relationship was further supported by the typical large trans coupling
exhibited by H-14 (J = 12 Hz) to both protons H-15 and H-18. On the basis of these data,
the relative configuration of emeridin A (65) was assigned as shown.
Figure 18. Key NOESY Correlations of the Bicyclic Ring System (A) and Cyclopentanone Ring (B) of Emeridin A (65).
7 26 8
9
28
5
27
6
2
A B
12
25
14
18
22 23
15
24
16
29
84
Several strategies to assign the absolute configuration of compound 65 and to
relate the relative configuration of the two halves of the molecule to one another were
considered. Multiple attempts were made at crystallization, application of chemical
degradation, and circular dichroism (CD) measurements. Noted above, the two ring
systems are insulated from each other and no NOESY correlations between the two units
were observed. Because of this, assignment of the absolute configuration of the molecule
was expected to require assignment of the absolute configuration of each of the ring-
containing subunits independently. In an effort to accomplish this, chemical degradation
of the triene unit was attempted in order to separate the two halves. If the separation was
successful, each portion could then be individually analyzed by CD (using empirical
and/or semi-empirical approaches – see Chapter 1) and/or through the application of
Mosher’s method in an effort to assign the absolute configuration.
The initial attempt at chemical degradation involved reaction of 65 with excess
OsO4,187,188 in an effort to generate a polyhydroxylation product, which could then
undergo oxidative cleavage with NaIO4 to afford products characteristic of the two
halves (Scheme 2). However, after 24 hr of exposure to OsO4, no reaction had taken
place and only starting material 65 was recovered.
The next attempt at cleaving the triene involved treatment of the recovered 65
from the previous reaction with NaHCO3 and KMnO4 (Scheme 2).189-191 After 24 hr, 1H
NMR analysis revealed that 65 has completely degraded, but there were no signals
suggestive of products along the lines of those expected.

85
Scheme 2. Proposed OsO4/NaIO4 and KMnO4 Oxidative Cleavage Reactions of Emeridin A (65) and the Potential Products.187-191
The next attempt employed ozone (O3) as the oxidizing agent.192-194 Another
sample of 65 was dissolved in CH2Cl2 and a stream of O3 was bubbled through the
solution at low temperature. During this process, the solution was observed changing
from a bright yellow to a completely colorless solution, suggesting that the conjugated
olefins had reacted. Reductive work-up with Me2S, afforded a product mixture that had
characteristics expected for a successful degradation as depicted in Scheme 3. 1H NMR
analysis of the reaction mixture showed the absence of the olefinic signals observed for
65, as well as the emergence of an aldehyde signal (δ 9.67) and a methyl group exhibiting
a chemical shift characteristics of a ketone methyl (δ 2.24), while all other signals
remained relatively unchanged, indicating that the chemical degradation had proceeded to
completion. However, because the reductive work-up using Me2S afforded the bicyclic
aldehyde, rather than the corresponding carboxylic acid, a simple polar/non-polar
A B
OCH3
CH3
O
H3C
H
CH3
O
O
OCH3
CH3
OO
H3C
H
CH3
OH
O
HO CH3
CH3
OO
H3C
H
CH3
OH
O
HO O
CH3
O
O
CH3
CH3H3C
CH3
O
1) 3 eq. OsO4 (t-BuOH, 0.02 M)w/trace of H2O, 2-4 hr, rt
2) NaIO4,
OR
1) 20 eq. NaHCO3, 5 eq. KMnO4Acetone, 4-6 hr, rt
O
CH3
O
O
CH3
CH3H3C
CH3
OCH3
CH3
OO
H3C
H
CH3

86
extraction process to separate the products from one another was not feasible. Due to
sample limitations, no attempt was made to oxidize the corresponding aldehyde to the
carboxylic acid, as any additional reaction upon the product mixture would be extremely
difficult to control and could result in unwanted side-products and degradation of the
other half. Unfortunately, extensive efforts to separate the products by HPLC using
different mobile and stationary phases were unsuccessful in separating these two
components of the product mixture.
Scheme 3. Ozonolysis of Emeridin A (65) with Reductive Work-Up Using Me2S.192-194
Even though the ozonolysis appeared to be successful, the inability to separate the
products, together with sample limitations, did not allow for further stereochemical
analysis of 65 and, therefore, only the relative configurations of the two subunits were
assigned. Isolated from an extract of Penicillium rugulosum, Coccidiostatin A (69) is a
previously reported compound that consists of the same type of ketolactone bicyclic ring
system with a polyene system insulating another ring feature, similar to 65,186 but the
literature did not provide any information regarding the assignment of the absolute
configuration for 69.186 Compound 69 is reportedly active against Eimeria acervulina at
150 ppm in a MAC (mycobacterium avium complex) assay.
1) CH2Cl2, O3 20 min2) 250 µL Me2S
OCH3
CH3
OO
H3C
H
CH3
H
O
+O
CH3
O
O
CH3
CH3H3C
CH3
O
O
CH3
O
O
CH3
CH3H3C
CH3
OCH3
CH3
OO
H3C
H
CH3
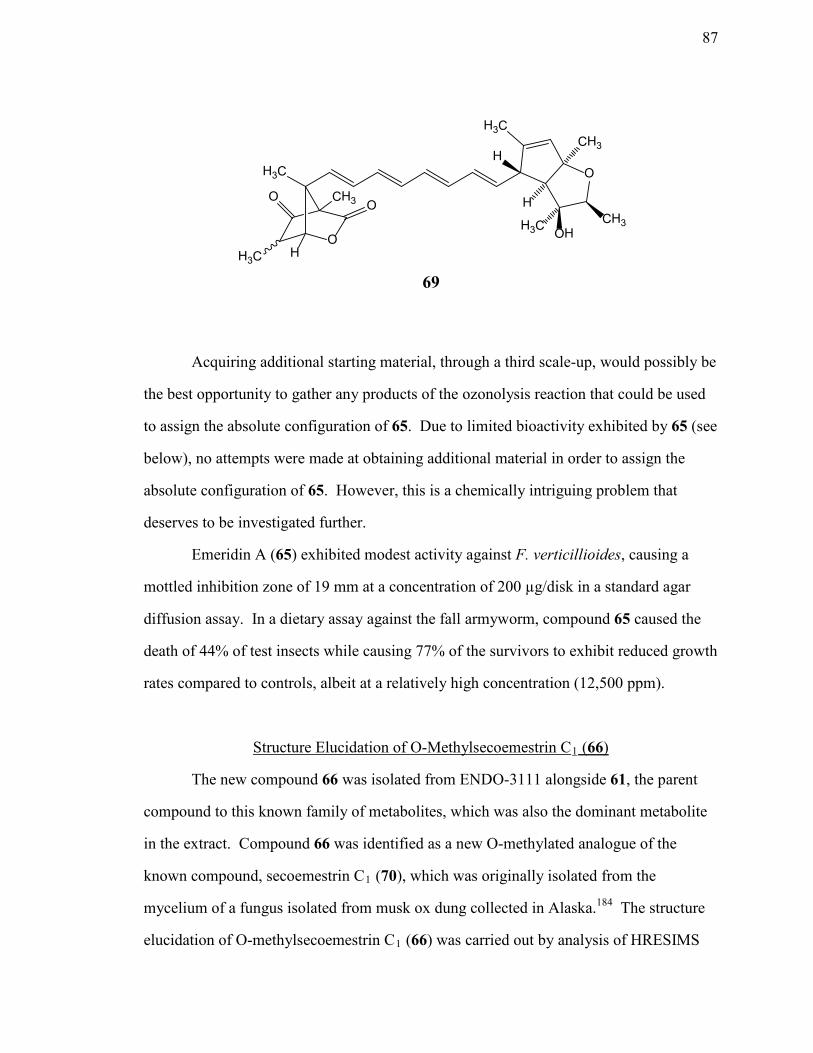
87
Acquiring additional starting material, through a third scale-up, would possibly be
the best opportunity to gather any products of the ozonolysis reaction that could be used
to assign the absolute configuration of 65. Due to limited bioactivity exhibited by 65 (see
below), no attempts were made at obtaining additional material in order to assign the
absolute configuration of 65. However, this is a chemically intriguing problem that
deserves to be investigated further.
Emeridin A (65) exhibited modest activity against F. verticillioides, causing a
mottled inhibition zone of 19 mm at a concentration of 200 µg/disk in a standard agar
diffusion assay. In a dietary assay against the fall armyworm, compound 65 caused the
death of 44% of test insects while causing 77% of the survivors to exhibit reduced growth
rates compared to controls, albeit at a relatively high concentration (12,500 ppm).
Structure Elucidation of O-Methylsecoemestrin C1 (66)
The new compound 66 was isolated from ENDO-3111 alongside 61, the parent
compound to this known family of metabolites, which was also the dominant metabolite
in the extract. Compound 66 was identified as a new O-methylated analogue of the
known compound, secoemestrin C1 (70), which was originally isolated from the
mycelium of a fungus isolated from musk ox dung collected in Alaska.184 The structure
elucidation of O-methylsecoemestrin C1 (66) was carried out by analysis of HRESIMS
O
CH3
H
H
H3C
CH3H3C OH
H3C
O
O CH3 O
H3C H
69

88
and 2D NMR data, and supported by comparisons to the data reported for 70.184
The 1H, 13C, and HMBC NMR data for 66 are summarized in Table 10.
Most of the 1H NMR data for 66 were analogous to those of 70. The only
significant differences were the presence of an additional methoxy singlet at δ 3.95 and
the appearance of two protons (H2-7”) that were resolved in the spectrum of 70, showing
germinal coupling (J = 16 Hz), but were coincident in the spectrum of 66, occurring as a
two-proton singlet at δ 3.65. The signal corresponding to H2-7” in 66 exhibited a 1H
NMR shift that was the average of the two locations reported for 70 (δ 3.68 and 3.62).184
An additional interesting feature of the 1H NMR of 66 was the long-range coupling
observed between H2-11 and H-5a (J = 1.5 Hz). This small coupling was not directly
measured for 70, but the reported broadening of the proton signals for H2-11 and H-5a in
70 indicate a similar effect was seen in 70 as in 66. These observations, in conjunction
with 13C NMR data and an HMBC correlation (Table 10) from the new methoxy signal to
C-5’, allowed assignment of a methoxy group in 66 in place of the hydroxy group at C-5’
in 70. All of the HMBC data, including correlations from H2-7” to C-3, C-4, C-1”, and
C-2”/6”, were also consistent with assignment of the structure as shown in 66.
66: R = CH3 70: R = H
O
NO
N
O
O
O
RO
HO CH3
SS
H
5’ 7” 2”
6”
3
1’ 1
5a 10a
11a
7
3’
11
10
6
12 8’
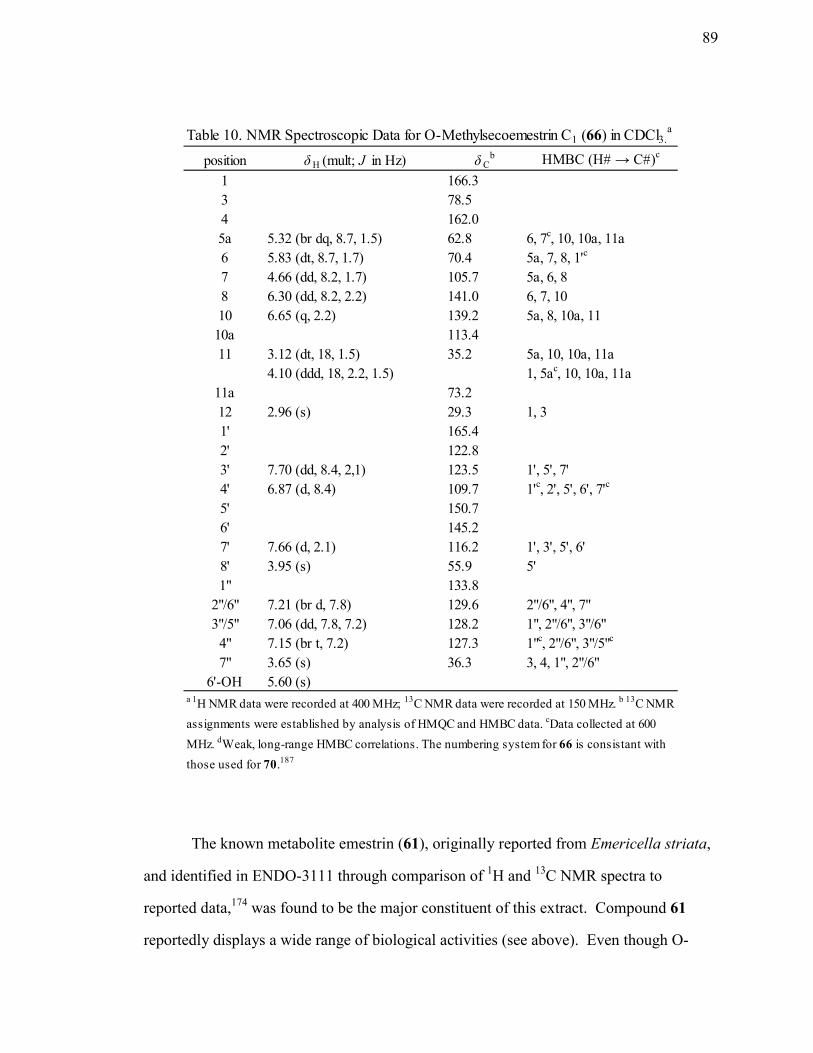
89
The known metabolite emestrin (61), originally reported from Emericella striata,
and identified in ENDO-3111 through comparison of 1H and 13C NMR spectra to
reported data,174 was found to be the major constituent of this extract. Compound 61
reportedly displays a wide range of biological activities (see above). Even though O-
position δ H (mult; J in Hz) δ Cb HMBC (H# → C#)c
1 166.33 78.54 162.05a 5.32 (br dq, 8.7, 1.5) 62.8 6, 7c, 10, 10a, 11a6 5.83 (dt, 8.7, 1.7) 70.4 5a, 7, 8, 1'c
7 4.66 (dd, 8.2, 1.7) 105.7 5a, 6, 88 6.30 (dd, 8.2, 2.2) 141.0 6, 7, 1010 6.65 (q, 2.2) 139.2 5a, 8, 10a, 11
10a 113.411 3.12 (dt, 18, 1.5) 35.2 5a, 10, 10a, 11a
4.10 (ddd, 18, 2.2, 1.5) 1, 5ac, 10, 10a, 11a11a 73.212 2.96 (s) 29.3 1, 31' 165.42' 122.83' 7.70 (dd, 8.4, 2,1) 123.5 1', 5', 7'4' 6.87 (d, 8.4) 109.7 1'c, 2', 5', 6', 7'c
5' 150.76' 145.27' 7.66 (d, 2.1) 116.2 1', 3', 5', 6'8' 3.95 (s) 55.9 5'1" 133.8
2"/6" 7.21 (br d, 7.8) 129.6 2"/6", 4", 7"3"/5" 7.06 (dd, 7.8, 7.2) 128.2 1", 2"/6", 3"/6"
4" 7.15 (br t, 7.2) 127.3 1"c, 2"/6", 3"/5"c
7" 3.65 (s) 36.3 3, 4, 1", 2"/6"6'-OH 5.60 (s)
a 1H NMR data were recorded at 400 MHz; 13C NMR data were recorded at 150 MHz. b 13C NMR assignments were established by analysis of HMQC and HMBC data. cData collected at 600 MHz. dWeak, long-range HMBC correlations. The numbering system for 66 is consistant with those used for 70.187
Table 10. NMR Spectroscopic Data for O-Methylsecoemestrin C1 (66) in CDCl3.a
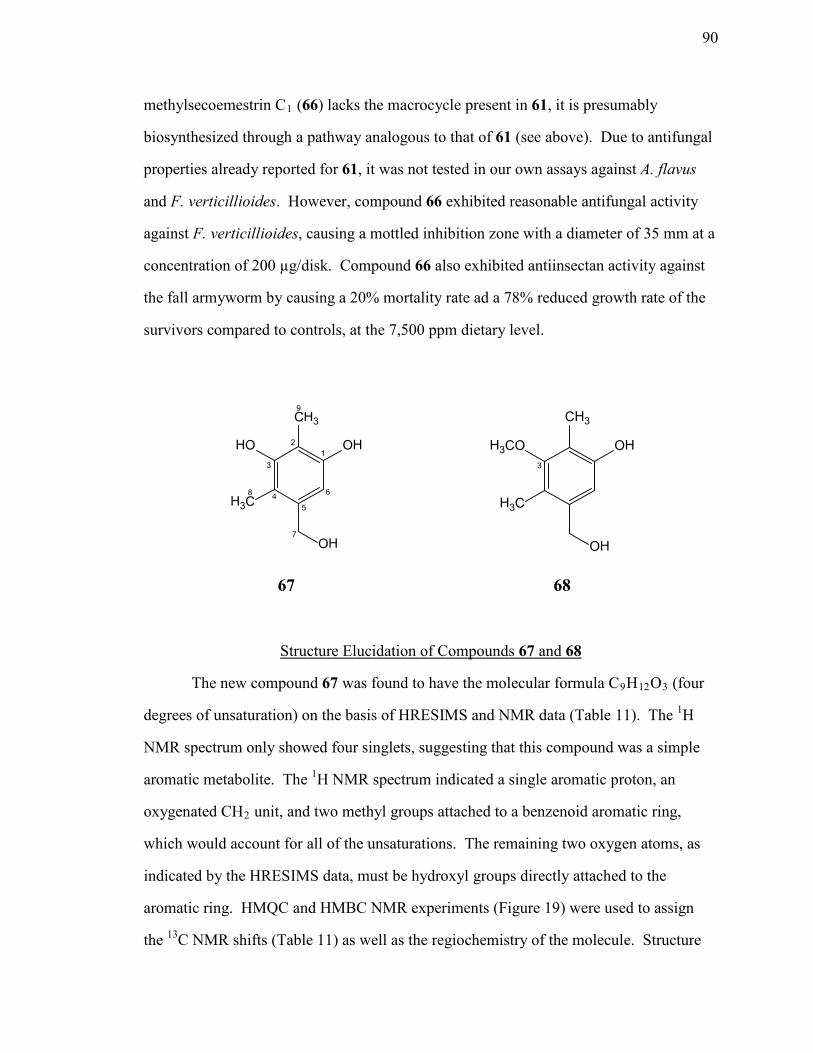
90
methylsecoemestrin C1 (66) lacks the macrocycle present in 61, it is presumably
biosynthesized through a pathway analogous to that of 61 (see above). Due to antifungal
properties already reported for 61, it was not tested in our own assays against A. flavus
and F. verticillioides. However, compound 66 exhibited reasonable antifungal activity
against F. verticillioides, causing a mottled inhibition zone with a diameter of 35 mm at a
concentration of 200 µg/disk. Compound 66 also exhibited antiinsectan activity against
the fall armyworm by causing a 20% mortality rate ad a 78% reduced growth rate of the
survivors compared to controls, at the 7,500 ppm dietary level.
Structure Elucidation of Compounds 67 and 68
The new compound 67 was found to have the molecular formula C9H12O3 (four
degrees of unsaturation) on the basis of HRESIMS and NMR data (Table 11). The 1H
NMR spectrum only showed four singlets, suggesting that this compound was a simple
aromatic metabolite. The 1H NMR spectrum indicated a single aromatic proton, an
oxygenated CH2 unit, and two methyl groups attached to a benzenoid aromatic ring,
which would account for all of the unsaturations. The remaining two oxygen atoms, as
indicated by the HRESIMS data, must be hydroxyl groups directly attached to the
aromatic ring. HMQC and HMBC NMR experiments (Figure 19) were used to assign
the 13C NMR shifts (Table 11) as well as the regiochemistry of the molecule. Structure
67
CH3
OHHO
H3C
OH7
1 2
3
4 5
6 8
9
68
CH3
OHH3CO
H3C
OH
3

91
67 was assigned on the basis of HMBC correlations observed from H-6 to C-4, and
oxygenated carbons C-1 and C-7, from H2-7 to C-4, C-5, and C-6, from H3-8 to C-4, C-
5, and oxygenated carbon C-3, and from H3-9 to C-1, C-2, and C-3. Compound 67 was
thus identified as 5-(hydroxymethyl)-2,4-dimethylbenzene-1,3-diol.
Figure 19. Key HMBC Correlations for Compounds 67 and 68.
The 1H NMR spectrum of an additional new compound (68) was similar to that of
67, but contained an additional three-proton singlet at δ 3.65, indicating the presence of a
CH3
OHHO
H3C
OH
H
HH
67
CH3
OHH3CO
H3C
OH
H
HH
68
position δ H (multiplicity) δ C δ H (multiplicity) δ C
1 154.6 155.12 112.1 117.53 153.4 158.84 115.2 120.35 138.2 139.16 6.42 (s) 107.9 6.64 (s) 111.57 4.50 (s) 63.5 4.50 (s) 63.48 2.11 (s) 11.0 2.14 (s) 10.99 2.05 (s) 8.9 2.10 (s) 9.310 3.65 (s) 60.4
aData collected at 400 MHz (1H) or 100 MHz (13C). 13C NMR assignments were established by analysis of HMQC and HMBC data.
67 68Table 11. 1H and 13C NMR Data for Compounds 67 and 68 in CD3OD.a
92
methoxy group. Analysis of HRESIMS data established the molecular formula of 68 as
C10H14O3 (four degrees of unsaturation), which is consistent with replacement of a
phenolic OH group with a methoxy group when compared to 67. The only question
regarding the structure of 68 was the location of the new methyl group. HMBC
correlations (Figure 19) from H-6 to C-2, C-4, C-5, and oxygenated carbons C-1 and C-7,
from H2-7 to C-4, C-5, and C-6, from H3-8 to C-4, C-5, and oxygenated carbon C-3,
from H3-9 to C-1, C-2, and C-3, and from the new methoxy signal (H3-10) to C-3,
indicated that the new methyl group must be attached to the oxygen at C-3, establishing
the structure shown for 68, 5-(hydroxymethyl)-3-methoxy-2,4-dimethylphenol.
Although lacking a second ring, both 67 and 68 are similar to the fungal
metabolite 64 in both simplicity and oxygenation pattern. Due to this similarity, both 67
and 68 would presumably possess a biogenetic origin similar to that of 64, as well as
related compounds described in the literature.187 Compound 68 was tested for antifungal
activity against A. flavus and F. verticillioides, causing zones of inhibition of 15 mm and
21 mm, respectively, against the two fungi at 200 µg/disk. Compound 68 also exhibited
modest activity against the fall armyworm, reducing the growth rate by 54%, albeit at a
rather high dietary concentration of 15,000 ppm. Compound 67 caused a clear inhibition
zone of 15 mm in diameter at 200 µg/disk against F. verticillioides and, interestingly,
caused an unusual enhanced growth rate (39%) when tested against the fall armyworm at
5,000 ppm.
All of the novel compounds identified from this E. nidulans isolate (65-68)
exhibited some level of antifungal activity against A. flavus and/or F. verticillioides. The
presence of these novel bioactive compounds, together with the previously described
known carcinogenic mycotoxin 59, the known anticancer metabolite 60, and the abundant
known bioactive compound 61, would likely explain the bioactivity originally observed
for the ENDO-3111 extract (Table 1).
93
CHAPTER 6
ADDITIONAL NEW SECONDARY METABOLITES OBTAINED FROM
OTHER FUNGICOLOUS FUNGI
In addition to the metabolites described in detail in the preceding chapters, several
additional new metabolites were isolated through investigations of additional isolates of
fungicolous fungi. These metabolites, although new, were closely related to previously
known compounds, so extensive analysis was not required in order to solve their
structures. Details of the isolation and structure elucidation of these compounds are
summarized in this chapter.
Chemical Investigation of a Fungicolous Isolate of
Trichoderma longibrachiatum (MYC-1515 = NRRL 54514)
During the course of our ongoing studies of fungicolous fungi, we investigated
cultures of a fungicolous isolate of Trichoderma longibrachiatum (MYC-1515) that was
obtained from a basidioma of Gloeophyllum trabeum found growing on a dead hardwood
branch on the island of Hawaii. The EtOAc extract of fermentation cultures of this
isolate showed modest antifungal activity against A. flavus and F. verticillioides, as well
as limited activity against the fall armyworm (S. frugiperda). This extract also exhibited
activity in an anti-HIV assay that was conducted by researchers at the National Cancer
Institute (NCI). Although the corresponding NCI assay program was terminated, so this
activity could not be followed, this result was a contributing factor in the selection of this
extract for further investigation. Such activity was not commonly observed among our
extracts, suggesting that the effect might be due to the presence of an uncommon or novel
compound. Sequential solvent partitioning, silica gel column chromatography, and
reversed-phase HPLC (Figure 20) of this extract afforded one new metabolite,
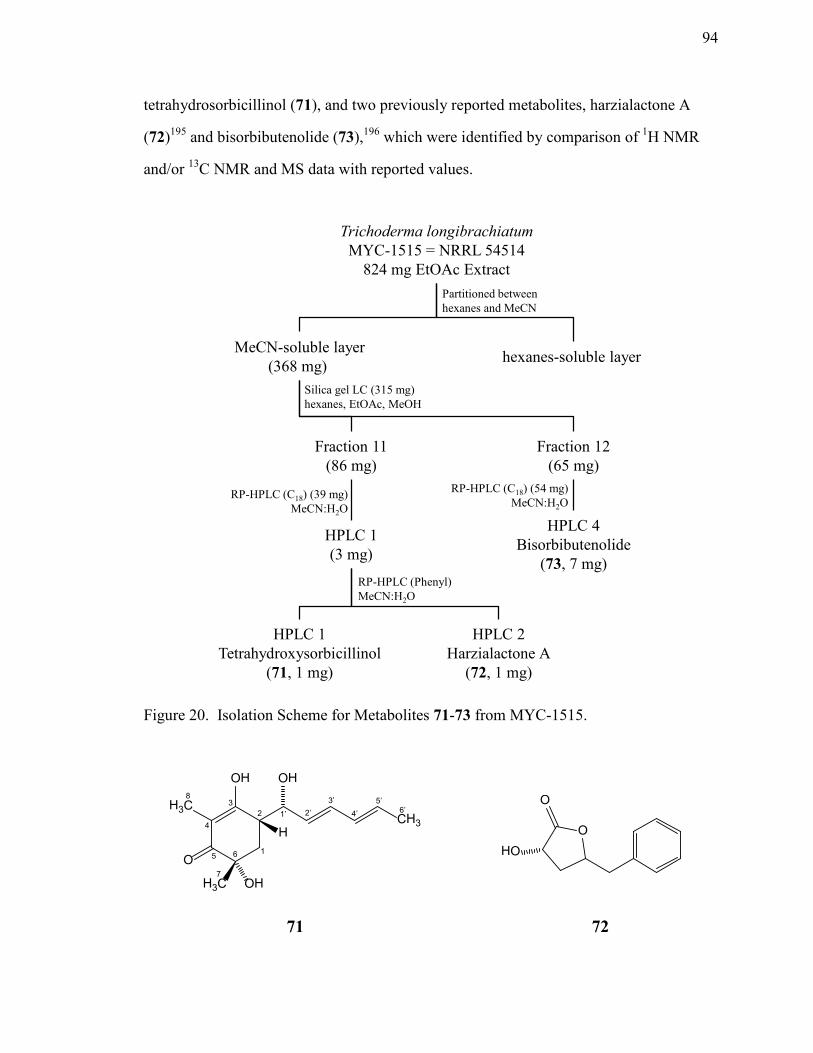
94
tetrahydrosorbicillinol (71), and two previously reported metabolites, harzialactone A
(72)195 and bisorbibutenolide (73),196 which were identified by comparison of 1H NMR
and/or 13C NMR and MS data with reported values.
Figure 20. Isolation Scheme for Metabolites 71-73 from MYC-1515.
71
OH
H3C
O
H3C OH
CH3
OH
H1
2 3
4
5 6 7
8 1’ 2’
3’ 4’
5’ 6’
O
O
HO
72
Trichoderma longibrachiatumMYC-1515 = NRRL 54514
824 mg EtOAc Extract
MeCN-soluble layer(368 mg) hexanes-soluble layer
Silica gel LC (315 mg)hexanes, EtOAc, MeOH
Fraction 11(86 mg)
Partitioned betweenhexanes and MeCN
HPLC 1(3 mg)
RP-HPLC (C18) (39 mg)MeCN:H2O
HPLC 1Tetrahydroxysorbicillinol
(71, 1 mg)
RP-HPLC (Phenyl)MeCN:H2O
Fraction 12(65 mg)
HPLC 2Harzialactone A
(72, 1 mg)
HPLC 4Bisorbibutenolide
(73, 7 mg)
RP-HPLC (C18) (54 mg)MeCN:H2O

95
Structure Elucidation of Tetrahydrosorbicillinol (71)
Analysis of HRESIMS and 1H NMR data established the molecular formula of
compound 71 as C14H20O4 (five degrees of unsaturation). The 1H NMR spectrum (Table
12) revealed the presence of a conjugated diene system linked to a terminal vinyl methyl
croup, an oxygenated CH unit, a CH2CH unit, and two additional methyl groups, one of
which was attached to a third double bond. Chemical shifts observed in the 13C NMR
spectrum (δ 192.1, 106.8, and 196.1) suggested that this third double bond was a
tautomerized (i.e., enolized) β-diketone unit. These signals account for 12 of the 14
carbons and three of the five unsaturations. Due to sample limitations, the 13C NMR
signals were located and the connectivity of the molecule was assigned through the use of
HMBC correlations (Table 12).
Olefinic proton H-3’ showed correlations to C-1’ and C-5’, thereby linking the
diene and terminal vinyl methyl unit to oxygenated carbon C-1’. H-1’ showed
correlations to non-protonated oxygenated olefinic carbon C-3, as well as C-2’ and C-3’,
confirming the connection of the diene unit to C-1’. H3-8 showed correlations to C-3, C-
4, and C-5, confirming that the remaining double bond must be part of an α,β-unsaturated
ketone unit, accounting for one of the two remaining unsaturations. Correlations from
H3C
OH O
H
OOHH3C
O
CH3
O
CH3
OCH3
OH
CH3H
73
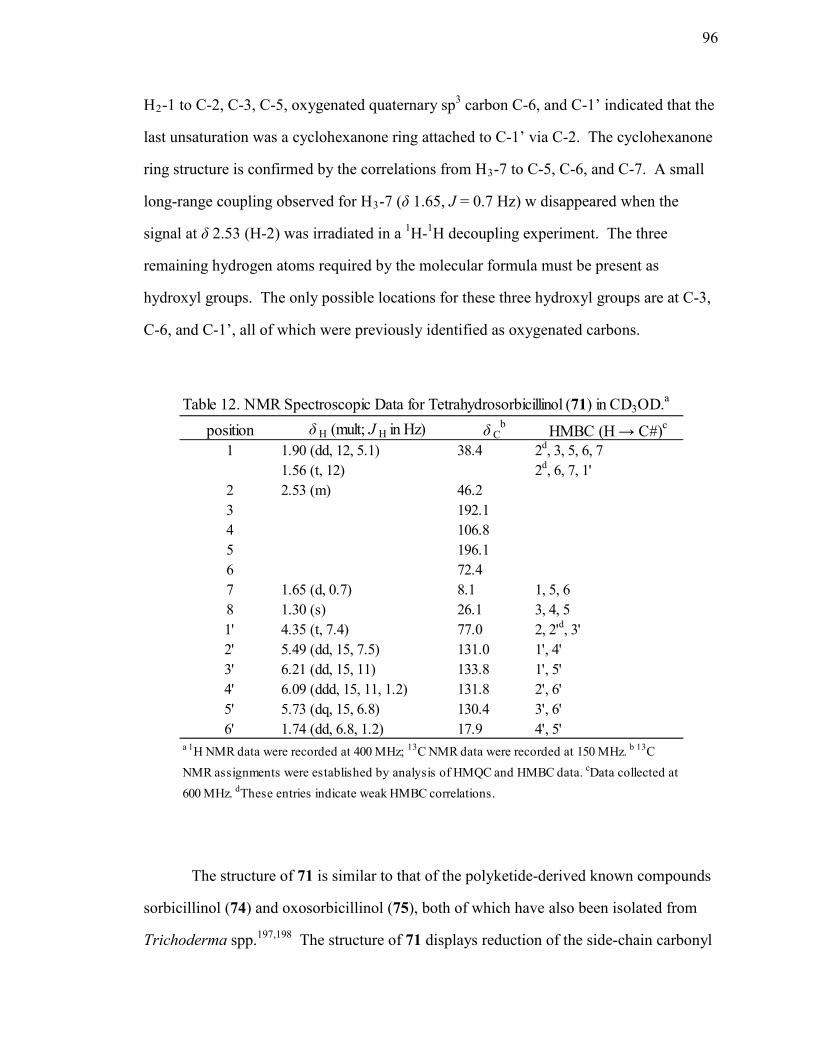
96
H2-1 to C-2, C-3, C-5, oxygenated quaternary sp3 carbon C-6, and C-1’ indicated that the
last unsaturation was a cyclohexanone ring attached to C-1’ via C-2. The cyclohexanone
ring structure is confirmed by the correlations from H3-7 to C-5, C-6, and C-7. A small
long-range coupling observed for H3-7 (δ 1.65, J = 0.7 Hz) w disappeared when the
signal at δ 2.53 (H-2) was irradiated in a 1H-1H decoupling experiment. The three
remaining hydrogen atoms required by the molecular formula must be present as
hydroxyl groups. The only possible locations for these three hydroxyl groups are at C-3,
C-6, and C-1’, all of which were previously identified as oxygenated carbons.
The structure of 71 is similar to that of the polyketide-derived known compounds
sorbicillinol (74) and oxosorbicillinol (75), both of which have also been isolated from
Trichoderma spp.197,198 The structure of 71 displays reduction of the side-chain carbonyl
position δ H (mult; J H in Hz) δ Cb HMBC (H → C#)c
1 1.90 (dd, 12, 5.1) 38.4 2d, 3, 5, 6, 71.56 (t, 12) 2d, 6, 7, 1'
2 2.53 (m) 46.23 192.14 106.85 196.16 72.47 1.65 (d, 0.7) 8.1 1, 5, 68 1.30 (s) 26.1 3, 4, 51' 4.35 (t, 7.4) 77.0 2, 2'd, 3'2' 5.49 (dd, 15, 7.5) 131.0 1', 4'3' 6.21 (dd, 15, 11) 133.8 1', 5'4' 6.09 (ddd, 15, 11, 1.2) 131.8 2', 6'5' 5.73 (dq, 15, 6.8) 130.4 3', 6'6' 1.74 (dd, 6.8, 1.2) 17.9 4', 5'
a 1H NMR data were recorded at 400 MHz; 13C NMR data were recorded at 150 MHz. b 13C NMR assignments were established by analysis of HMQC and HMBC data. cData collected at 600 MHz. dThese entries indicate weak HMBC correlations.
Table 12. NMR Spectroscopic Data for Tetrahydrosorbicillinol (71) in CD3OD.a
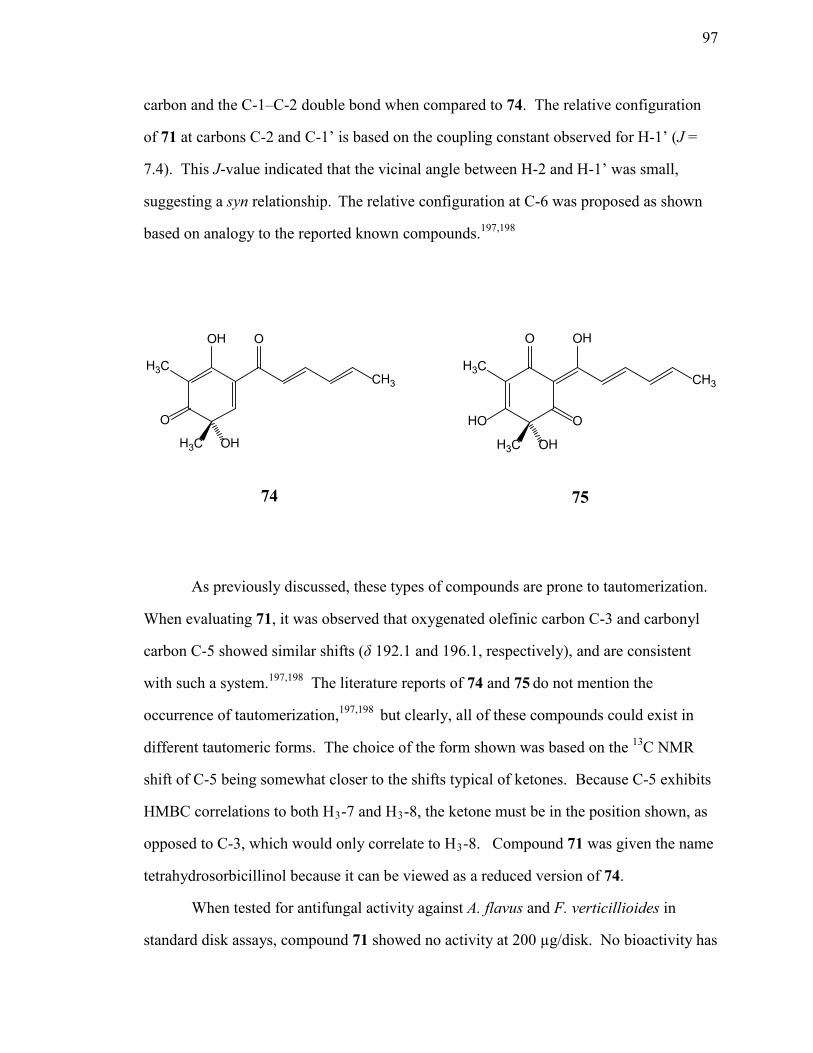
97
OH
H3C
O
H3C OH
CH3
O
74
O
H3C
HO
H3C OH
CH3
OH
O
75
carbon and the C-1–C-2 double bond when compared to 74. The relative configuration
of 71 at carbons C-2 and C-1’ is based on the coupling constant observed for H-1’ (J =
7.4). This J-value indicated that the vicinal angle between H-2 and H-1’ was small,
suggesting a syn relationship. The relative configuration at C-6 was proposed as shown
based on analogy to the reported known compounds.197,198
As previously discussed, these types of compounds are prone to tautomerization.
When evaluating 71, it was observed that oxygenated olefinic carbon C-3 and carbonyl
carbon C-5 showed similar shifts (δ 192.1 and 196.1, respectively), and are consistent
with such a system.197,198 The literature reports of 74 and 75 do not mention the
occurrence of tautomerization,197,198 but clearly, all of these compounds could exist in
different tautomeric forms. The choice of the form shown was based on the 13C NMR
shift of C-5 being somewhat closer to the shifts typical of ketones. Because C-5 exhibits
HMBC correlations to both H3-7 and H3-8, the ketone must be in the position shown, as
opposed to C-3, which would only correlate to H3-8. Compound 71 was given the name
tetrahydrosorbicillinol because it can be viewed as a reduced version of 74.
When tested for antifungal activity against A. flavus and F. verticillioides in
standard disk assays, compound 71 showed no activity at 200 µg/disk. No bioactivity has

98
been reported for either of the known compounds 72195 and 73.196 Compounds 72 and 73
have not yet been tested for bioactivity in our own assays, due to time limitations.
Therefore, the metabolite(s) that were responsible for the modest bioactivity of the crude
extract in this case have yet to be identified.
Chemical Investigations of a Fungicolous Isolate of
Stachybotrys parvispora (MYC-2013 = NRRL 54531)
Stachybotrys parvispora Hughes (Dermatiaceae) is a relatively unexplored
member of the Stachybotrys genus, as only a few prior reports of metabolites from this
species, such as parvisporin (76), from this species have appeared.199 By contrast, a more
commonly explored species of this genus (S. chartarum) is known to produce mycotoxins
known as satratoxins.200 Satratoxins are known to cause pulmonary inflammation and
hemorrhaging in infants when individuals are exposed to S. chartarum spores that have
grown in damp structures.200 A fungicolous isolate of S. parvispora (MYC-2013) was
obtained from a white mycelial growth on the undersurface of a dead hardwood branch
near Mackenzie State Park in Hawaii. The EtOAc extract of solid-substrate fermentation
cultures of this isolate showed moderate antifungal activity against F. verticillioides in a
disk diffusion assay. Chemical studies of this extract afforded a new metabolite that was
named agistatine F (77). Compound 77 was obtained through silica gel chromatographic
fractionation of the crude extract, followed by reversed-phase HPLC (Figure 21). In
addition to 77, a known compound from the same family, agistatine B (78) was also
encountered in the extract. Parvisporicin (79), a metabolite previously isolated by a
member of our group from a different isolate of S. parvisporia, was identified as the
major component of the extract through 1H NMR and 13C NMR data analysis and by
comparison to reported values.201

99
H3C
CH3HO
CH3 CH3 OH O
H
HOOH
76
Figure 21. Isolation Scheme for Metabolites 77-79 from MYC-2013.
Stachybotrys parvisporaMYC-2013 = NRRL 54531
1.5 g EtOAc Extract
MeCN-soluble layer(1.2 g) hexanes-soluble layer
Silica gel LC (415 mg)hexanes, EtOAc, MeOH
Fraction 6(49 mg)
Partitioned betweenhexanes and MeCN
RP-HPLC (C18) (17 mg)MeCN:H2O
HPLC 3Agistatine F(77, 11 mg)
Fraction 10Parvisporicin(79, 38 mg)
Fraction 5(50 mg)
RP-HPLC (C18) (34 mg)MeCN:H2O
HPLC 3Agistatine B(78, 3 mg)

100
Structure Elucidation of Agistatine F (77)
The molecular formula of 77 was determined to be C11H18O5 (three degrees of
unsaturation) on the basis of NMR (Table 13) and HREIMS data. The 1H NMR spectrum
indicated the presence of four methylene units, one of which was coupled to a methyl
group, and four methine protons, three of which were on oxygen-bearing carbons.
The 13C and DEPT NMR data showed signals for 11 carbons including a ketone, three
oxygenated sp3 methines, one oxygenated quaternary carbon, one non-oxygenated
methine carbon, four methylene carbons, and a methyl group (Table 13). Comparison of
the 1H NMR and DEPT data with the molecular formula indicated that the three broad
singlets from δ 3.10 to 3.40 must correspond to three free hydroxyl groups.
OHO
HO
H
O
OCH3
79
O
OOH
OH
OH
H3C
H
2 3
4
1
4a 8a
5 6 7
9 10
77
O
CH3
OHOH
O
H
78
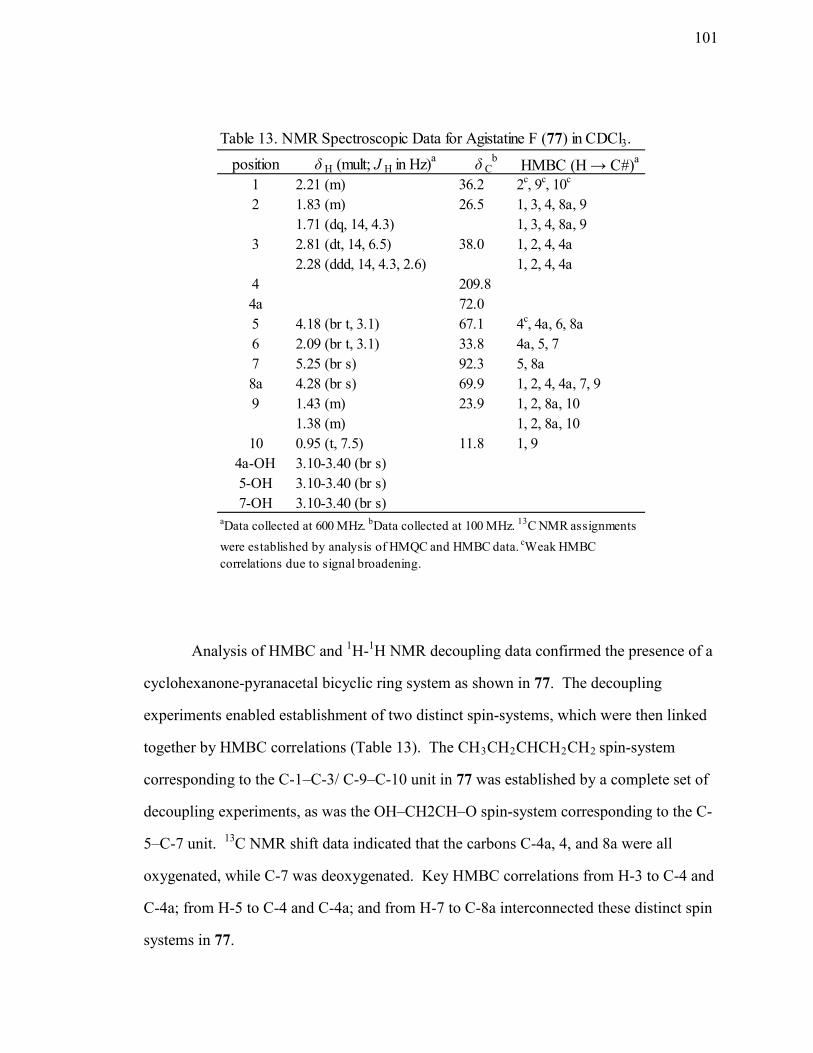
101
Analysis of HMBC and 1H-1H NMR decoupling data confirmed the presence of a
cyclohexanone-pyranacetal bicyclic ring system as shown in 77. The decoupling
experiments enabled establishment of two distinct spin-systems, which were then linked
together by HMBC correlations (Table 13). The CH3CH2CHCH2CH2 spin-system
corresponding to the C-1–C-3/ C-9–C-10 unit in 77 was established by a complete set of
decoupling experiments, as was the OH–CH2CH–O spin-system corresponding to the C-
5–C-7 unit. 13C NMR shift data indicated that the carbons C-4a, 4, and 8a were all
oxygenated, while C-7 was deoxygenated. Key HMBC correlations from H-3 to C-4 and
C-4a; from H-5 to C-4 and C-4a; and from H-7 to C-8a interconnected these distinct spin
systems in 77.
position δ H (mult; J H in Hz)a δ Cb HMBC (H → C#)a
1 2.21 (m) 36.2 2c, 9c, 10c
2 1.83 (m) 26.5 1, 3, 4, 8a, 91.71 (dq, 14, 4.3) 1, 3, 4, 8a, 9
3 2.81 (dt, 14, 6.5) 38.0 1, 2, 4, 4a2.28 (ddd, 14, 4.3, 2.6) 1, 2, 4, 4a
4 209.84a 72.05 4.18 (br t, 3.1) 67.1 4c, 4a, 6, 8a6 2.09 (br t, 3.1) 33.8 4a, 5, 77 5.25 (br s) 92.3 5, 8a8a 4.28 (br s) 69.9 1, 2, 4, 4a, 7, 99 1.43 (m) 23.9 1, 2, 8a, 10
1.38 (m) 1, 2, 8a, 1010 0.95 (t, 7.5) 11.8 1, 9
4a-OH 3.10-3.40 (br s)5-OH 3.10-3.40 (br s)7-OH 3.10-3.40 (br s)
Table 13. NMR Spectroscopic Data for Agistatine F (77) in CDCl3.
aData collected at 600 MHz. bData collected at 100 MHz. 13C NMR assignments were established by analysis of HMQC and HMBC data. cWeak HMBC correlations due to signal broadening.
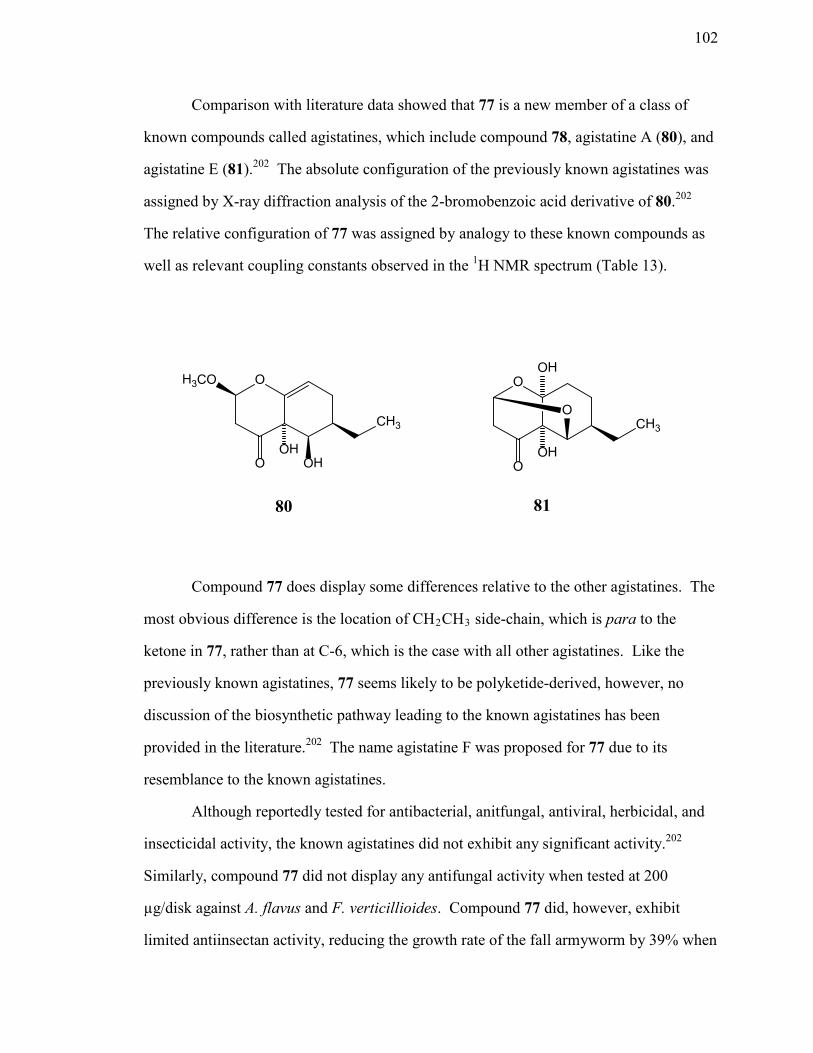
102
OH3CO
CH3
OHO OH
80
Comparison with literature data showed that 77 is a new member of a class of
known compounds called agistatines, which include compound 78, agistatine A (80), and
agistatine E (81).202 The absolute configuration of the previously known agistatines was
assigned by X-ray diffraction analysis of the 2-bromobenzoic acid derivative of 80.202
The relative configuration of 77 was assigned by analogy to these known compounds as
well as relevant coupling constants observed in the 1H NMR spectrum (Table 13).
Compound 77 does display some differences relative to the other agistatines. The
most obvious difference is the location of CH2CH3 side-chain, which is para to the
ketone in 77, rather than at C-6, which is the case with all other agistatines. Like the
previously known agistatines, 77 seems likely to be polyketide-derived, however, no
discussion of the biosynthetic pathway leading to the known agistatines has been
provided in the literature.202 The name agistatine F was proposed for 77 due to its
resemblance to the known agistatines.
Although reportedly tested for antibacterial, anitfungal, antiviral, herbicidal, and
insecticidal activity, the known agistatines did not exhibit any significant activity.202
Similarly, compound 77 did not display any antifungal activity when tested at 200
µg/disk against A. flavus and F. verticillioides. Compound 77 did, however, exhibit
limited antiinsectan activity, reducing the growth rate of the fall armyworm by 39% when
O
CH3
OHO
O
OH
81
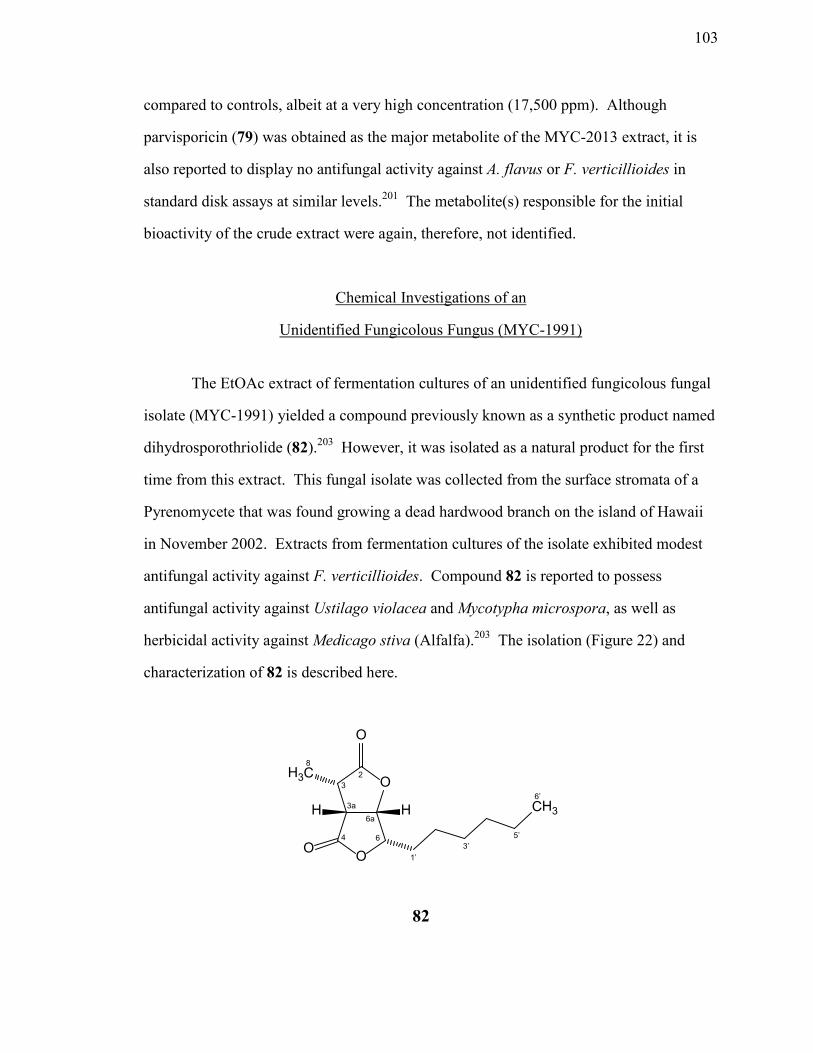
103
82
O
O
O
H3C
HH
O
CH3
2
3a
4 6a
8
1’ 3’
5’
6’ 3
6
compared to controls, albeit at a very high concentration (17,500 ppm). Although
parvisporicin (79) was obtained as the major metabolite of the MYC-2013 extract, it is
also reported to display no antifungal activity against A. flavus or F. verticillioides in
standard disk assays at similar levels.201 The metabolite(s) responsible for the initial
bioactivity of the crude extract were again, therefore, not identified.
Chemical Investigations of an
Unidentified Fungicolous Fungus (MYC-1991)
The EtOAc extract of fermentation cultures of an unidentified fungicolous fungal
isolate (MYC-1991) yielded a compound previously known as a synthetic product named
dihydrosporothriolide (82).203 However, it was isolated as a natural product for the first
time from this extract. This fungal isolate was collected from the surface stromata of a
Pyrenomycete that was found growing a dead hardwood branch on the island of Hawaii
in November 2002. Extracts from fermentation cultures of the isolate exhibited modest
antifungal activity against F. verticillioides. Compound 82 is reported to possess
antifungal activity against Ustilago violacea and Mycotypha microspora, as well as
herbicidal activity against Medicago stiva (Alfalfa).203 The isolation (Figure 22) and
characterization of 82 is described here.

104
Figure 22. Isolation Scheme for Dihydrosporothriolide (82) from MYC-1991.
Structure Elucidation of Dihydrosporothriolide (82)
The molecular formula of compound 82 was determined to be C13H20O4 (four
degrees of unsaturation) on the basis of 1H NMR and HRESIMS data. The 1H NMR
spectra exhibited signals (Table 14) corresponding to two methyl groups (one doublet and
one triplet), two sets of overlapping aliphatic multiplets, one integrating to two protons,
the other integrating to eight, and four sp3 methine protons, two of which were on
oxygen-bearing carbons. Comparison of HRESIMS data and partial structures obtained
from 1H NMR analysis to literature and database information initially yielded no known
matches. Therefore 13C, DEPT, and homonuclear decoupling NMR experiments were
performed to elucidate the structure of 82. Evaluation of the 13C and DEPT NMR spectra
(Table 14) accounted for all hydrogen atoms in the formula as CH-type hydrogens
(requiring the absence of exchangeable hydrogens). These data also confirmed the
presence of 13 carbons, including two ester carbonyl carbons (δ 176.3 and 172.2), two
oxygenated sp3 methine carbons (δ 81.9 and 78.1), two non-oxygenated sp3 methine
MYC-1991472 mg EtOAc Extract
MeCN-soluble layer(235 mg) hexanes-soluble layer
Silica gel LC (225 mg)hexanes, EtOAc, MeOH
Fraction 5Dihydrosporothriolide
(82, 17 mg)
Partitioned betweenhexanes and MeCN

105
carbons (δ 45.9 and 37.0), two methyl groups (δ 14.2 and 11.1), and five aliphatic
methylene carbons (δ 35.5, 31.9, 29.0, 29.0, and 22.6).
Decoupling experiments were used to establish the connectivity of these units to
determine the gross structure of 82. Irradiating the muliplet at δ 1.85 (H2-1’) caused the
signal at δ 4.48 (H-6, ddd) to sharpen and change to a doublet of doublets. Irradiation of
H-6 caused the proton on oxygen-bearing carbon C-6a (H-6a , δ 5.00, dd) to collapse to a
doublet. Decoupling H-6a resulted in simplification of H-3a (δ 3.40, dd) to a doublet and
H-6 to a doublet of doublets. Irradiating H-3a simplified the signal for H-6a and caused
the H-3 signal (δ 3.02, dq) to sharpen slightly. The final methyl doublet was attached to
the core structure via CH-3, as irradiation of H-3 caused H3-8 (δ 1.45, d) to collapse to a
singlet. The last two unsaturations that had yet to be accounted for required the presence
of two ester linkages (O-1 to C-6a and O-5 to C-6) in 82. The resulting bicyclic ring
position δ H (mult; J H in Hz) δ C
2 172.23 3.02 (dq, 10, 7.5) 37.03a 3.40 (dd, 10, 6.0) 45.94 176.36 4.48 (ddd, 6.0, 4.0, 1.5) 78.16a 5.00 (dd, 6.0, 4.0) 81.98 1.45 (d, 7.5) 14.21' 1.85 (m) 31.92' 1.21-1.42 (m) 29.03' 1.21-1.42 (m) 29.04' 1.21-1.42 (m) 35.55' 1.21-1.42 (m) 22.66' 0.93 (t, 6.7) 11.1
Table 14. 1H and 13C NMR Data for Dihydrosporothriolide (82) in CDCl3.a
aData collected at 400 MHz (1H) and 100 MHz (13C).
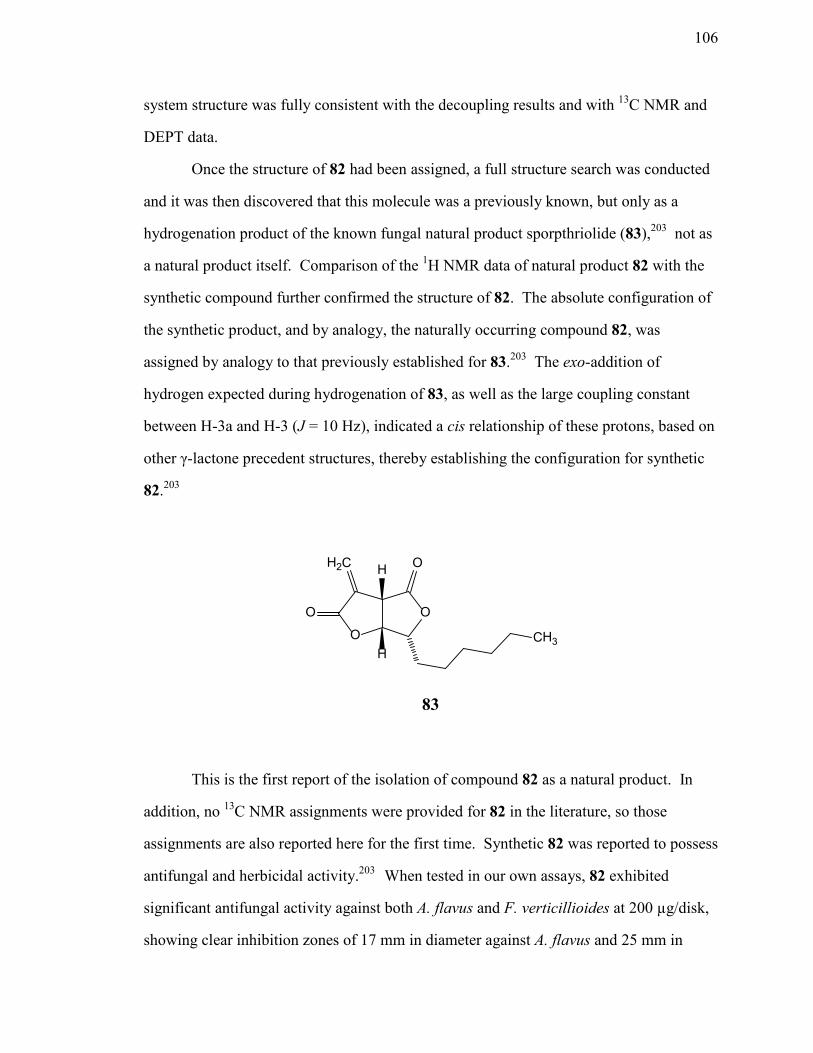
106
O
O
H2C
O
OH
HCH3
83
system structure was fully consistent with the decoupling results and with 13C NMR and
DEPT data.
Once the structure of 82 had been assigned, a full structure search was conducted
and it was then discovered that this molecule was a previously known, but only as a
hydrogenation product of the known fungal natural product sporpthriolide (83),203 not as
a natural product itself. Comparison of the 1H NMR data of natural product 82 with the
synthetic compound further confirmed the structure of 82. The absolute configuration of
the synthetic product, and by analogy, the naturally occurring compound 82, was
assigned by analogy to that previously established for 83.203 The exo-addition of
hydrogen expected during hydrogenation of 83, as well as the large coupling constant
between H-3a and H-3 (J = 10 Hz), indicated a cis relationship of these protons, based on
other γ-lactone precedent structures, thereby establishing the configuration for synthetic
82.203
This is the first report of the isolation of compound 82 as a natural product. In
addition, no 13C NMR assignments were provided for 82 in the literature, so those
assignments are also reported here for the first time. Synthetic 82 was reported to possess
antifungal and herbicidal activity.203 When tested in our own assays, 82 exhibited
significant antifungal activity against both A. flavus and F. verticillioides at 200 µg/disk,
showing clear inhibition zones of 17 mm in diameter against A. flavus and 25 mm in
107
diameter against F. verticillioides in standard disk assays. This bioactivity is most likely
the cause of the activity of the crude extract against F. verticillioides, but interestingly,
the crude extract did not show any antifungal activity against A. flavus even though 82
showed significant activity. Compound 82 also exhibited weak antiinsectan activity by
reducing the growth rate of the fall armyworm by 62% when compared to controls, albeit
again at a rather high concentration at a concentration (17,500 ppm).
The studies of new metabolites presented in this Chapter demonstrate that even
close analogues of known compounds can be chemically interesting. In the case of 82, a
known compound was revealed to possess bioactivity that was not previously known,
which can sometimes be as important as the initial isolation of the metabolite itself. The
isolation of such analogues can add to the information about a family of compounds not
only in their identification, but also to information about the types of compounds
produced by fungi of certain taxa from specific environments.
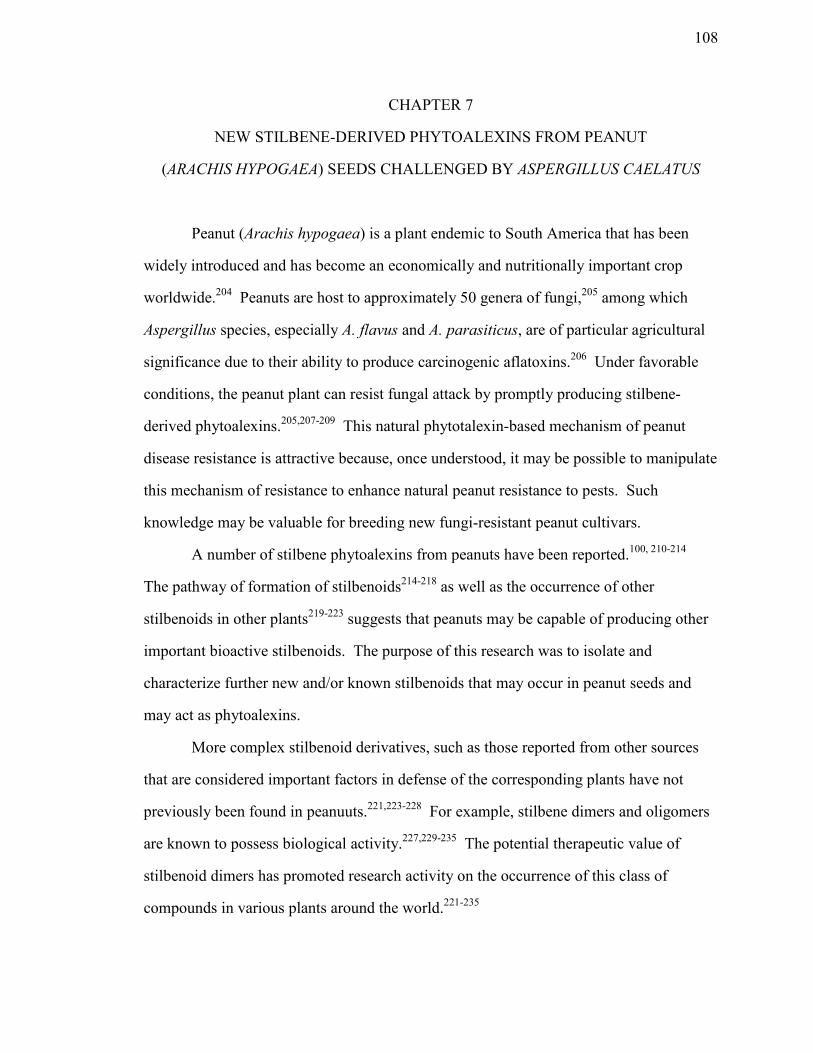
108
CHAPTER 7
NEW STILBENE-DERIVED PHYTOALEXINS FROM PEANUT
(ARACHIS HYPOGAEA) SEEDS CHALLENGED BY ASPERGILLUS CAELATUS
Peanut (Arachis hypogaea) is a plant endemic to South America that has been
widely introduced and has become an economically and nutritionally important crop
worldwide.204 Peanuts are host to approximately 50 genera of fungi,205 among which
Aspergillus species, especially A. flavus and A. parasiticus, are of particular agricultural
significance due to their ability to produce carcinogenic aflatoxins.206 Under favorable
conditions, the peanut plant can resist fungal attack by promptly producing stilbene-
derived phytoalexins.205,207-209 This natural phytotalexin-based mechanism of peanut
disease resistance is attractive because, once understood, it may be possible to manipulate
this mechanism of resistance to enhance natural peanut resistance to pests. Such
knowledge may be valuable for breeding new fungi-resistant peanut cultivars.
A number of stilbene phytoalexins from peanuts have been reported.100, 210-214
The pathway of formation of stilbenoids214-218 as well as the occurrence of other
stilbenoids in other plants219-223 suggests that peanuts may be capable of producing other
important bioactive stilbenoids. The purpose of this research was to isolate and
characterize further new and/or known stilbenoids that may occur in peanut seeds and
may act as phytoalexins.
More complex stilbenoid derivatives, such as those reported from other sources
that are considered important factors in defense of the corresponding plants have not
previously been found in peanuuts.221,223-228 For example, stilbene dimers and oligomers
are known to possess biological activity.227,229-235 The potential therapeutic value of
stilbenoid dimers has promoted research activity on the occurrence of this class of
compounds in various plants around the world.221-235
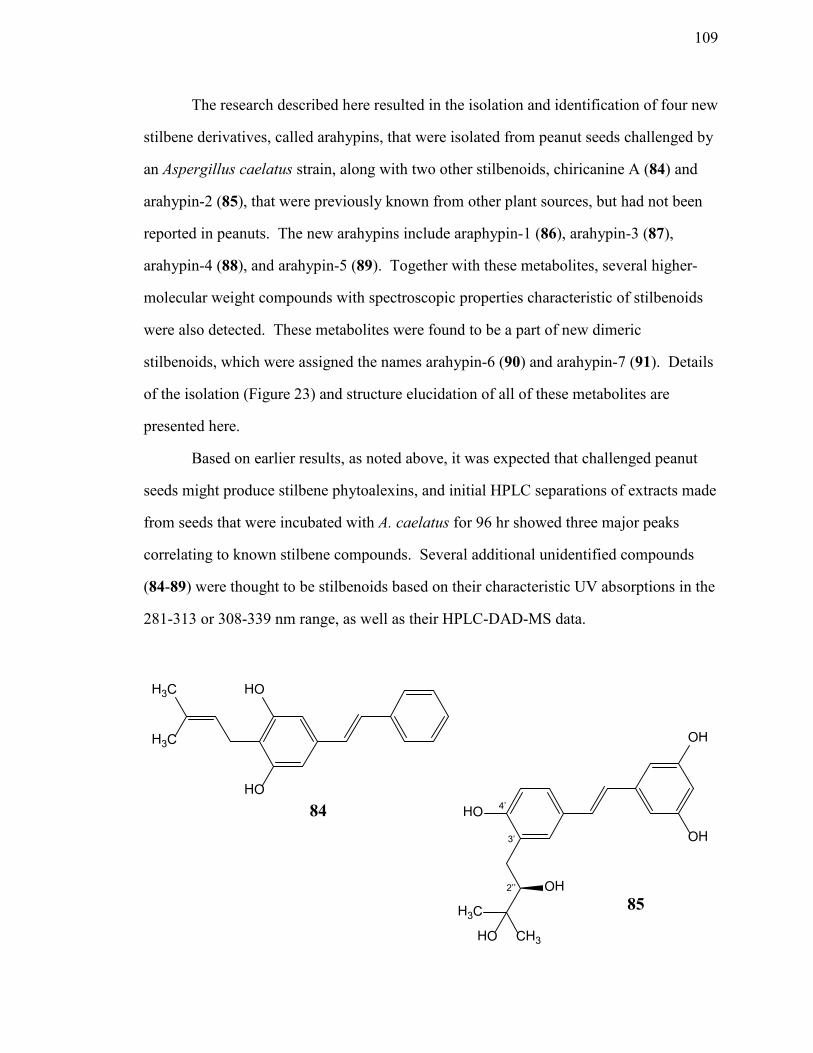
109
H3C
H3C
HO
HO84
85
The research described here resulted in the isolation and identification of four new
stilbene derivatives, called arahypins, that were isolated from peanut seeds challenged by
an Aspergillus caelatus strain, along with two other stilbenoids, chiricanine A (84) and
arahypin-2 (85), that were previously known from other plant sources, but had not been
reported in peanuts. The new arahypins include araphypin-1 (86), arahypin-3 (87),
arahypin-4 (88), and arahypin-5 (89). Together with these metabolites, several higher-
molecular weight compounds with spectroscopic properties characteristic of stilbenoids
were also detected. These metabolites were found to be a part of new dimeric
stilbenoids, which were assigned the names arahypin-6 (90) and arahypin-7 (91). Details
of the isolation (Figure 23) and structure elucidation of all of these metabolites are
presented here.
Based on earlier results, as noted above, it was expected that challenged peanut
seeds might produce stilbene phytoalexins, and initial HPLC separations of extracts made
from seeds that were incubated with A. caelatus for 96 hr showed three major peaks
correlating to known stilbene compounds. Several additional unidentified compounds
(84-89) were thought to be stilbenoids based on their characteristic UV absorptions in the
281-313 or 308-339 nm range, as well as their HPLC-DAD-MS data.
HO
CH3
H3C
HO
OH
OH
OH
4’
3’
2’’

110
Figure 23. Isolation Scheme for the MeOH Extract of Peanut Seeds Challenged by Aspergillus caelatus that Yielded Stilbenoids 84-89.
Structure Elucidation of Chiricanine A (84)
and Arahypins 1-7 (85-91)
The APCI mass spectrum of 84 showed a molecular mass of 280 Da, and a
characteristic loss of 56 Da, corresponding to a loss of C4H8, as is typical for prenylated
stilbenes.90 An absorption in the UV spectrum in the 301-312 nm range suggested the
absence of a conjugated double bond in the prenyl side chain.100,210,211 This was
1.2 kg of Peanut Seeds Challenged by Aspergillus caelatus
Extracted with MeOH
MeOH-soluble layer n-hexane-soluble layer
6 Fractions Collected
RP-HPLC (C18) MeCN:H2O w/0.6% HCOOH
Fractions w/similar compounds
Stilbenoid-containing fractions
19 Fractions Collected
Chiricanine A (84, 16 mg)
Silica gel LC(as above)
Arahypin-5 (89, 10 mg)
RP-HPLC (C18)(as HPLC above)
Fractions w/89
Arahypin-1 (86, 2 mg)
Arahypin-2(85, 7 mg)
Arahypin-3 (87, 8 mg)
Arahypin-4 (88, 4 mg)
Partitioned between MeOH and n-hexane
Silica gel LCCHCl3, EtOAc, Acetone, MeOH

111
supported by the 1H NMR spectrum in which the methyl groups of the prenyl side chain
were no longer doublets and were shifted slightly downfield. Upon further evaluation of
the data, the structure of 84 was found to match that of chiricanine A, a compound
previously reported from the root bark of the leguminous tree Lonchocarpus
chiricanus.219 Similarly, compound 85 (molecular mass 330 Da), whose structure was
determined though 1H NMR,13C NMR, HMQC, HMBC, and HRESIMS data analysis,
had been reported as a constituent of the evergreen tree Artocarpus dadah.220 Compound
85 was not given a common name by the original authors, so the name arahypin-2 was
proposed for it in order to reflect its relationship to other similar compounds encountered
in this work. Neither of these compounds has been reported previously as a peanut
metabolite. All of the new compounds described below are similar to these known
compounds, and their structure assignments were facilitated by this resemblance.
The APCI-MS data for 86 matched very closely with those of 84 which is an
isomer of 86. However, a UV absorption at 327 nm suggested the presence of a
conjugated double bond in the side chain in the compound in this instance. Analysis
of 1H, 13C, and DEPT NMR data (Tables 15 and 16) for 86, when compared to 84,
confirmed very close structural similarities. Similarities included 1H NMR signals
consistent with a monosubstituted phenyl group, a symmetrical 1,3,4,5-tetrasubstituted
benzene ring, a trans double bond, and two methyl groups. The difference between
86
H3C
H3C
HO
HO
2
3’ 2’
1’ 4’
5’ 6’
1”
3”
4”
5” 1
2 3
4 5 6
7
8
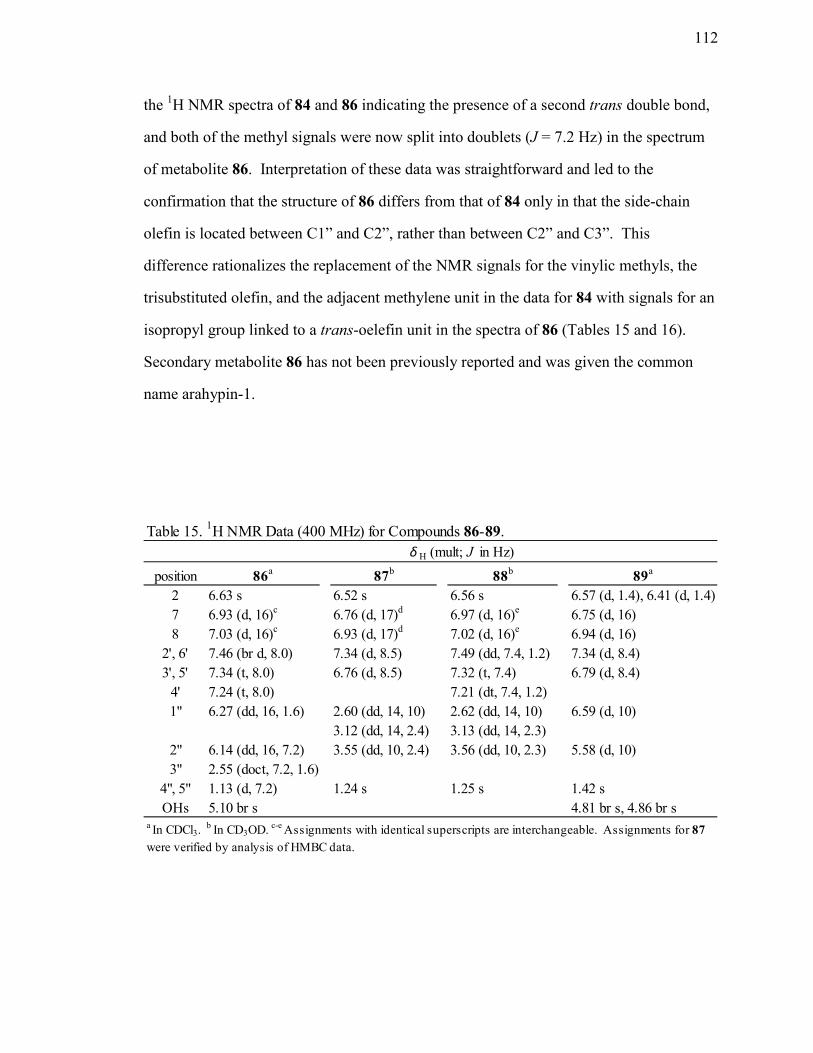
112
position 86a 87b 88b 89a
2 6.63 s 6.52 s 6.56 s 6.57 (d, 1.4), 6.41 (d, 1.4)7 6.93 (d, 16)c 6.76 (d, 17)d 6.97 (d, 16)e 6.75 (d, 16)8 7.03 (d, 16)c 6.93 (d, 17)d 7.02 (d, 16)e 6.94 (d, 16)
2', 6' 7.46 (br d, 8.0) 7.34 (d, 8.5) 7.49 (dd, 7.4, 1.2) 7.34 (d, 8.4)3', 5' 7.34 (t, 8.0) 6.76 (d, 8.5) 7.32 (t, 7.4) 6.79 (d, 8.4)
4' 7.24 (t, 8.0) 7.21 (dt, 7.4, 1.2)1" 6.27 (dd, 16, 1.6) 2.60 (dd, 14, 10) 2.62 (dd, 14, 10) 6.59 (d, 10)
3.12 (dd, 14, 2.4) 3.13 (dd, 14, 2.3)2" 6.14 (dd, 16, 7.2) 3.55 (dd, 10, 2.4) 3.56 (dd, 10, 2.3) 5.58 (d, 10)3" 2.55 (doct, 7.2, 1.6)
4", 5" 1.13 (d, 7.2) 1.24 s 1.25 s 1.42 sOHs 5.10 br s 4.81 br s, 4.86 br s
δH (mult; J in Hz)
a In CDCl3. b In CD3OD. c-e Assignments with identical superscripts are interchangeable. Assignments for 87 were verified by analysis of HMBC data.
Table 15. 1H NMR Data (400 MHz) for Compounds 86-89.
the 1H NMR spectra of 84 and 86 indicating the presence of a second trans double bond,
and both of the methyl signals were now split into doublets (J = 7.2 Hz) in the spectrum
of metabolite 86. Interpretation of these data was straightforward and led to the
confirmation that the structure of 86 differs from that of 84 only in that the side-chain
olefin is located between C1” and C2”, rather than between C2” and C3”. This
difference rationalizes the replacement of the NMR signals for the vinylic methyls, the
trisubstituted olefin, and the adjacent methylene unit in the data for 84 with signals for an
isopropyl group linked to a trans-oelefin unit in the spectra of 86 (Tables 15 and 16).
Secondary metabolite 86 has not been previously reported and was given the common
name arahypin-1.
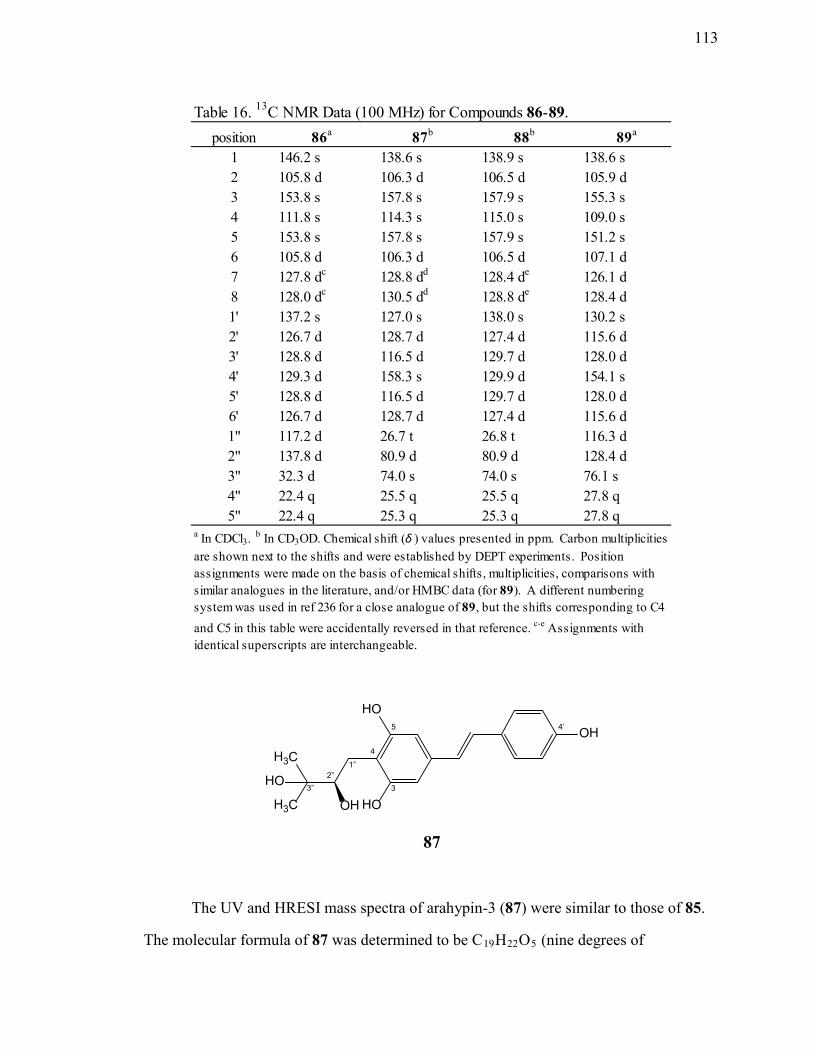
113
The UV and HRESI mass spectra of arahypin-3 (87) were similar to those of 85.
The molecular formula of 87 was determined to be C19H22O5 (nine degrees of
HO
HOH3C
H3C
HO
OH
OH
2”
4’
1” 3” 3
4 5
87
position 86a 87b 88b 89a
1 146.2 s 138.6 s 138.9 s 138.6 s2 105.8 d 106.3 d 106.5 d 105.9 d3 153.8 s 157.8 s 157.9 s 155.3 s4 111.8 s 114.3 s 115.0 s 109.0 s5 153.8 s 157.8 s 157.9 s 151.2 s6 105.8 d 106.3 d 106.5 d 107.1 d7 127.8 dc 128.8 dd 128.4 de 126.1 d8 128.0 dc 130.5 dd 128.8 de 128.4 d1' 137.2 s 127.0 s 138.0 s 130.2 s2' 126.7 d 128.7 d 127.4 d 115.6 d3' 128.8 d 116.5 d 129.7 d 128.0 d4' 129.3 d 158.3 s 129.9 d 154.1 s5' 128.8 d 116.5 d 129.7 d 128.0 d6' 126.7 d 128.7 d 127.4 d 115.6 d1" 117.2 d 26.7 t 26.8 t 116.3 d2" 137.8 d 80.9 d 80.9 d 128.4 d3" 32.3 d 74.0 s 74.0 s 76.1 s4" 22.4 q 25.5 q 25.5 q 27.8 q5" 22.4 q 25.3 q 25.3 q 27.8 q
Table 16. 13C NMR Data (100 MHz) for Compounds 86-89.
a In CDCl3. b In CD3OD. Chemical shift (δ ) values presented in ppm. Carbon multiplicities are shown next to the shifts and were established by DEPT experiments. Position assignments were made on the basis of chemical shifts, multiplicities, comparisons with similar analogues in the literature, and/or HMBC data (for 89). A different numbering system was used in ref 236 for a close analogue of 89, but the shifts corresponding to C4 and C5 in this table were accidentally reversed in that reference. c-e Assignments with identical superscripts are interchangeable.

114
unsaturation) on the basis of 1H NMR,13C NMR, DEPT, and HRESIMS data. Analysis
of the 1H, 13C, and DEPT NMR data (Tables 15 and 16) revealed that 87 contained a
dihydroxylated prenyl group identical to that of 86. More specifically, this unit was
recognized on the basis of NMR signals for a dimethylated oxygen-bearing quaternary
carbon and an isolated CH2–CHOH unit in place of signals corresponding to the prenyl
groups found in the spectra of 84 and 86. The NMR spectra for 87 also clearly indicated
the presence of the trans olefin unit characteristic of a stilbene structure, an oxygenated
para-substituted benzene ring, and the same type of symmetrical 1,3,4,5-tetrasubstituted
ring found in 84 and 86. These results indicate that the dihydroxylated prenyl group in
87 is located on the dihydroxylated ring, by analogy to both 84 and 86, rather than on the
monooxygenated ring, as in 85. Compound 87 is also a novel natural product and was
assigned the named arahypin-3.
Compound 88 has a molecular formula of C19H22O4 (nine degrees of
unsaturation), as established by analysis of NMR (Tables 15 and 16) and HRESIMS data.
It differs from 85 only in the absence of the hydroxyl group at C4’. The presence of one
fewer oxygen atom in the molecular formula relative to that of 85, together with the
replacement of the para-disubstituted pattern present in the 1H and 13C NMR spectra of
85 with diagnostic monosubstituted phenyl group NMR signals in the data for 88, made
the assignment particularly straightforward. This structure assignment for 88 is
HO
HOH3C
H3C
HO
OH
88

115
HO
OH3C
CH3
OH
3”
4’ 5
3 4
1” 7
8 1’
89
consistent with its significantly lower polarity, as reflected by a considerable difference
in the retention times between 84 and 88. Compound 88 is also a new natural product,
and was assigned the name arahypin-4.
Compound 89 was assigned the molecular formula C19H18O3 (11 degrees of
unsaturation) by analysis of NMR and HRESIMS data and clearly contained a unit not
found in any of compounds 84-88. Unlike compounds 84 and 86, which displayed a
characteristic loss of 56 Da (C4H8) in the EI mass spectrum, and compounds 86 and 87,
each of which showed an abundant M-H2O ion, compound 89 produced a highly
fragmented mass spectrum that included a distinctive loss of 28 Da (CO or C2H4). In
addition to signals indicating the presence of a p-disubstituted oxygenated benzene ring
and a trans olefin stilbene bond, the 1H NMR spectrum included signals representative of
an isolated cis-olefin unit that was suggestive of the cyclization of a prenyl unit with an
ortho position of the aromatic ring to form a dimethyl coumarin unit.236 The location of
this new ring was based on comparison of NMR data (Tables 15 and 16) with those of
similar compounds,236 together with the fact that all of the other stilbenoids in the mixture
that have a prenyl group linked to the dihydroxylated ring place the group in a position
analogous to that shown for 89. In order to verify this regiochemical assignment and to
enable unambiguous NMR shift assignments for all positions, an HMBC experiment was
performed. As expected, the signal for the olefinic H-1” showed correlations to both of
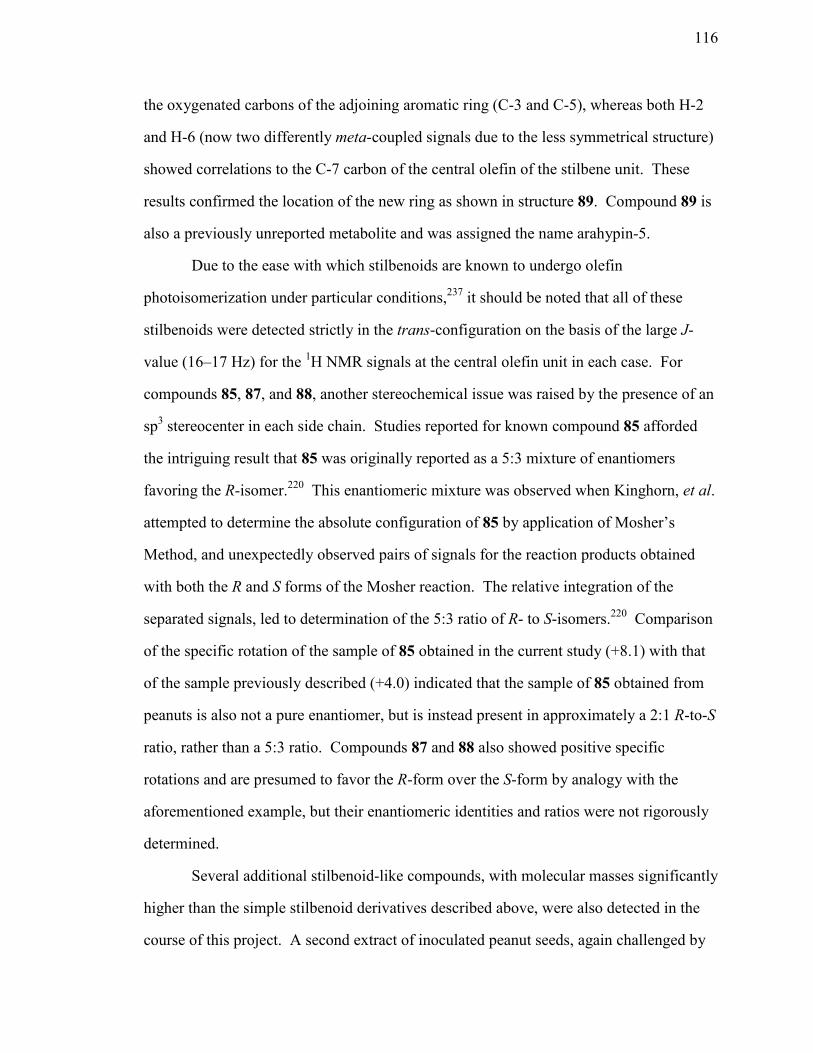
116
the oxygenated carbons of the adjoining aromatic ring (C-3 and C-5), whereas both H-2
and H-6 (now two differently meta-coupled signals due to the less symmetrical structure)
showed correlations to the C-7 carbon of the central olefin of the stilbene unit. These
results confirmed the location of the new ring as shown in structure 89. Compound 89 is
also a previously unreported metabolite and was assigned the name arahypin-5.
Due to the ease with which stilbenoids are known to undergo olefin
photoisomerization under particular conditions,237 it should be noted that all of these
stilbenoids were detected strictly in the trans-configuration on the basis of the large J-
value (16–17 Hz) for the 1H NMR signals at the central olefin unit in each case. For
compounds 85, 87, and 88, another stereochemical issue was raised by the presence of an
sp3 stereocenter in each side chain. Studies reported for known compound 85 afforded
the intriguing result that 85 was originally reported as a 5:3 mixture of enantiomers
favoring the R-isomer.220 This enantiomeric mixture was observed when Kinghorn, et al.
attempted to determine the absolute configuration of 85 by application of Mosher’s
Method, and unexpectedly observed pairs of signals for the reaction products obtained
with both the R and S forms of the Mosher reaction. The relative integration of the
separated signals, led to determination of the 5:3 ratio of R- to S-isomers.220 Comparison
of the specific rotation of the sample of 85 obtained in the current study (+8.1) with that
of the sample previously described (+4.0) indicated that the sample of 85 obtained from
peanuts is also not a pure enantiomer, but is instead present in approximately a 2:1 R-to-S
ratio, rather than a 5:3 ratio. Compounds 87 and 88 also showed positive specific
rotations and are presumed to favor the R-form over the S-form by analogy with the
aforementioned example, but their enantiomeric identities and ratios were not rigorously
determined.
Several additional stilbenoid-like compounds, with molecular masses significantly
higher than the simple stilbenoid derivatives described above, were also detected in the
course of this project. A second extract of inoculated peanut seeds, again challenged by

117
A. caelatus, was separated in the hopes of isolating these higher-mass stilbenoids in
larger quantities (Figure 24), as the previous isolation scheme (Figure 23) failed to
produce these larger stilbenoids in sufficient quantities for characterization. All of these
higher mass compounds were eluted from an analytical reversed phase HPLC column
after elution of all of the major simple stilbenoids. These compounds (90 and 91) were
suggested to be stilbenoid derivatives based on their characteristic UV absorptions in the
340 nm region, as well as their HRESIMS data. Both ESI and APCI MS of 90 revealed a
molecular weight of 606 Da and a characteristic loss of 56 Da (C4H8), as observed for
several of the prenylated stilbene derivatives described above. The structure of 90 was
ultimately deduced by detailed analysis of HRESIMS and NMR data.
Figure 24. Isolation Scheme for the MeOH Extract of Peanut Seeds Challenged by Aspergillus caelatus that Yielded Dimeric Stilbenoids 90 and 91.
1.1 kg of Peanut Seeds Challenged by Aspergillus caelatus
Extracted with MeOH
MeOH-soluble layer n-hexane-soluble layer
6 Fractions Collected Fractions containing 90 and 91
Silica gel LCCHCl3, EtOAc, Acetone, MeOH
Acetone and MeOH Fractions
Silica gel LC (as above)
Arahypin-6 (90, 3 mg)
CHCl3:EtOAc Fractions
Arahypin-7 (91, 1 mg)
RP-HPLC (C18)(see adjacent)
Partitioned between MeOH and n-hexane
RP-HPLC (C18)MeOH:H2O w/0.6% HCOOH
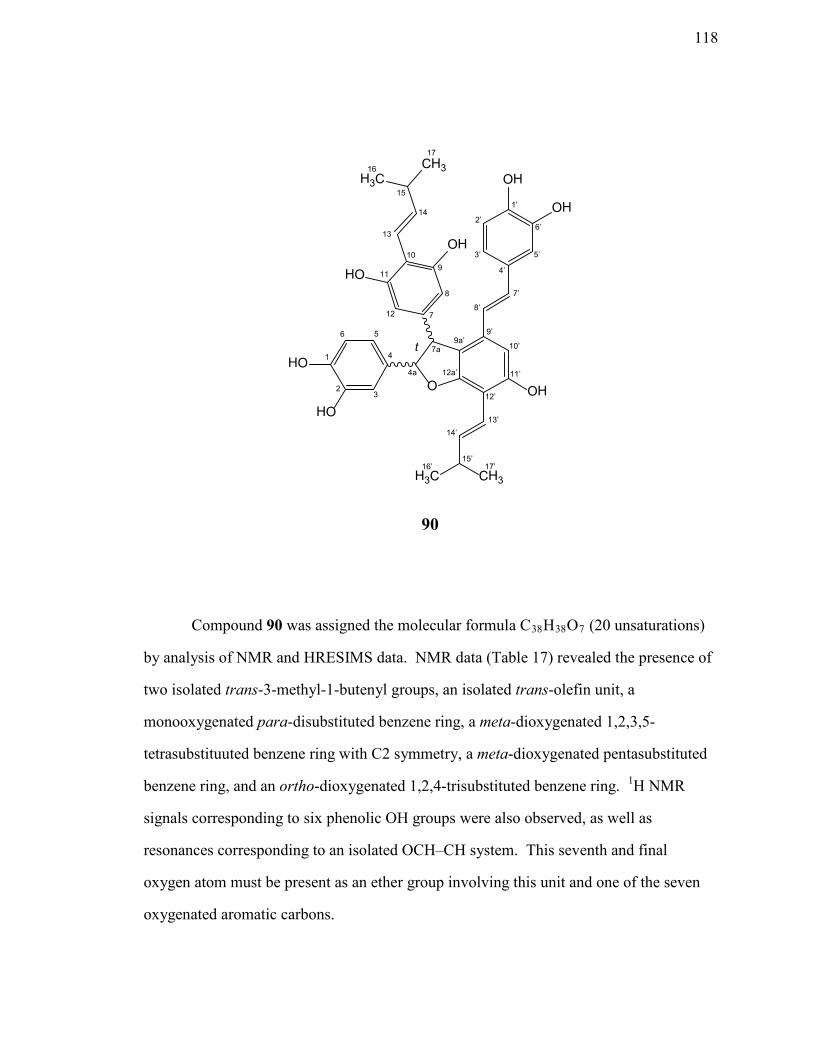
118
OH
O
HO
HO
H3C CH3
CH3H3C
OH
HO
OH
OH
3’
2’ 1’
4’ 5’
6’
4a 1
2 3
4 5 6
7 8
7a t
9 10
11
12
13 14
15 16
17
7’ 8’
9’ 10’
11’ 12’
12a’
9a’
13’ 14’
15’ 16’ 17’
90
Compound 90 was assigned the molecular formula C38H38O7 (20 unsaturations)
by analysis of NMR and HRESIMS data. NMR data (Table 17) revealed the presence of
two isolated trans-3-methyl-1-butenyl groups, an isolated trans-olefin unit, a
monooxygenated para-disubstituted benzene ring, a meta-dioxygenated 1,2,3,5-
tetrasubstituuted benzene ring with C2 symmetry, a meta-dioxygenated pentasubstituted
benzene ring, and an ortho-dioxygenated 1,2,4-trisubstituted benzene ring. 1H NMR
signals corresponding to six phenolic OH groups were also observed, as well as
resonances corresponding to an isolated OCH–CH system. This seventh and final
oxygen atom must be present as an ether group involving this unit and one of the seven
oxygenated aromatic carbons.

119
position δ H (mult; J in Hz) δ Cb HMBC (H# → C#)
1 5.12 s, OH 143.8 1c
2 5.13 s, OH 143.8 2c
3 6.83 (d, 2.0) 112.5 1, 5 4 135.2
4a 5.45 (d, 5.3) 92.7 3, 5, 7, 12a' 5 6.76 (dd, 8.3, 2.0) 118.2 1, 2 wk, 36 6.82 (d, 8.3) 115.5 2, 47 144.5
7a 4.36 (d, 5.3) 56.6 4, 4a, 7, 8/12, 9a', 12a' 8, 12 6.30 s 107.0 7, 8/12, 9/11, 10 9, 11 5.08 s, OH 154.2 8/12, 9/11, 10c
10 111.013 6.24 (dd, 17, 1.2) 117.2 9/11, 1514 6.10 (dd, 17, 6.7) 146.0 10, 13, 15, 16/1715 2.54 m 32.316 1.102 (d, 6.8) 22.7 14, 15, 16/1717 1.106 (d, 6.8) 22.7 14, 15, 16/171' 4.71 s, OH 155.5
2', 6' 6.70 (d, 8.7) 115.5 1', 2'/6', 4'3', 5' 7.09 (d, 8.7) 127.8 1', 3'/5', 7'
4' 130.37' 6.79 (d, 16) 129.0 4', 3'/5', 9' 8' 6.510 (d, 16) 122.8 4', 7', 9a', 10'9' 133.59a' 119.210' 6.66 s 104.0 8', 9a', 11', 12' 11' 5.14 s, OH 154.012' 108.0
12a' 159.013' 6.512 md 117.2 11', 12a', 14', 15'14' 6.512 md 142.7 12', 15', 16'/17'15' 2.54 m 32.7
16', 17' 1.11 (d, 6.8) 22.4 14', 15', 16'/17'
Table 17. NMR Spectroscopic Data for Arahypin-6 (90) in CDCl3.a
a 1H NMR data were recorded at 400 MHz; 13C NMR data were recorded at 150 MHz. b 13C NMR assignments were established by analysis of HMQC and HMBC data. cThese entries indicate correlations from the corresponding phenolic OH signal. dThese signals are coincident in the spectrum, resulting in an apparent doublet.

120
HMQC and HMBC NMR data (Table 17) were used to establish the connectivity
of these units. One of the para-disubstituted ring 1H NMR signals (H-3’/H-5’) correlated
to C-7’ of the isolated olefin unit in the HMBC spectrum, linking the para-disubstituted
benzene ring to the isolated double bond. H-8’ of the same olefin unit showed
correlations to C-9a’ and C-10’ of the pentasubstituted benzene ring, while H-7’ showed
a correlation to C-9. These data required the connection of C-8’ to C-9’. The oxygenated
carbons of the pentasubstituted ring (C-12a’ and C-11’) were correlated with an olefinic
proton signal of one of the 3-methyl-1-butenyl side-chains (H-13’), thereby locating this
side-chain at C-12’. The other 3-methyl-1-butnyl side-chain showed a correlation from
one of its olefin protons (H-13) to the oxygenated carbon signals of the symmetrical
1,2,3,5-tetrasustituted benzene ring (C-9/C-11), thereby locating the second side-chain at
C-10 in 90. The sp3 methine H-7a showed correlations to C-8/C-12 of this same
symmetrical benzene ring, requiring its attachment to C-7. H-7a also showed correlations
to C-9a’ and C-12a’, linking C-7a to the pentasubstitiuted benzene ring at C-9a’. The
remaining 1,2,4-trisubstituted benzene ring was connected to the oxygenated carbon (C-
4a) of the OCH–CH system on the basis of correlations of H-4a to C-3 and C-5. The
presence of an ether unit linking C-4a and C-12a’ was established on the basis of an
HMBC correlation of H-4a with C-12a’. This requires all of the other oxygen atoms to
be present as OH groups, thereby enabling completion of the assignment of the structure
as shown in 90. Only four of the six phenolic OH signals showed HMBC correlations to
nearby carbons, but all observed correlations were consistent with the proposed structure.
Compound 90 appears to be comprised of one unit each of arachidin-1 and arachidin-3.
The relative configuration of 90 at C-7a and C-4a was determined on the basis of
the corresponding vicinal 1H NMR J-value of 5.3 Hz, which is indicative of a trans
orientation in a ring system of this type.238 In contrast, the J-value for a cis orientation
has been reported as 8.3 Hz.239 Compound 90 is a new natural product, for which the
common name arahypin-6 is proposed.
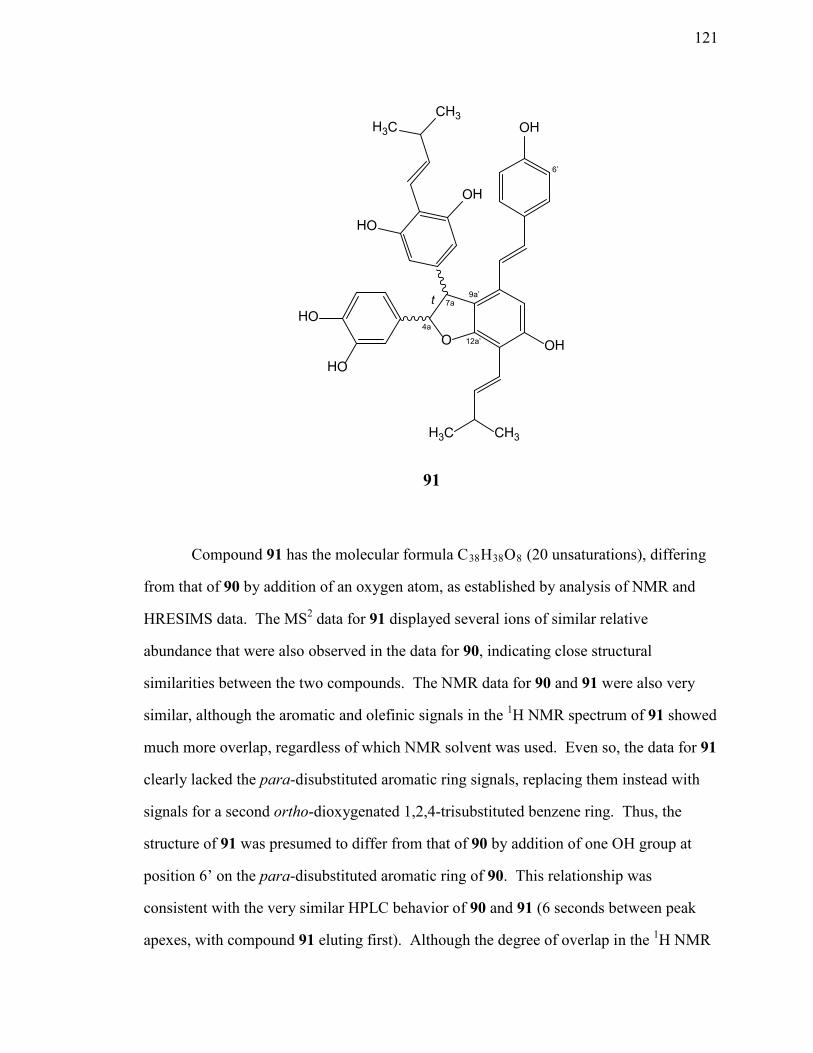
121
OH
O
HO
HO
H3C CH3
CH3H3C
OH
HO
OH4a
7a t
12a’
9a’
6’
91
Compound 91 has the molecular formula C38H38O8 (20 unsaturations), differing
from that of 90 by addition of an oxygen atom, as established by analysis of NMR and
HRESIMS data. The MS2 data for 91 displayed several ions of similar relative
abundance that were also observed in the data for 90, indicating close structural
similarities between the two compounds. The NMR data for 90 and 91 were also very
similar, although the aromatic and olefinic signals in the 1H NMR spectrum of 91 showed
much more overlap, regardless of which NMR solvent was used. Even so, the data for 91
clearly lacked the para-disubstituted aromatic ring signals, replacing them instead with
signals for a second ortho-dioxygenated 1,2,4-trisubstituted benzene ring. Thus, the
structure of 91 was presumed to differ from that of 90 by addition of one OH group at
position 6’ on the para-disubstituted aromatic ring of 90. This relationship was
consistent with the very similar HPLC behavior of 90 and 91 (6 seconds between peak
apexes, with compound 91 eluting first). Although the degree of overlap in the 1H NMR
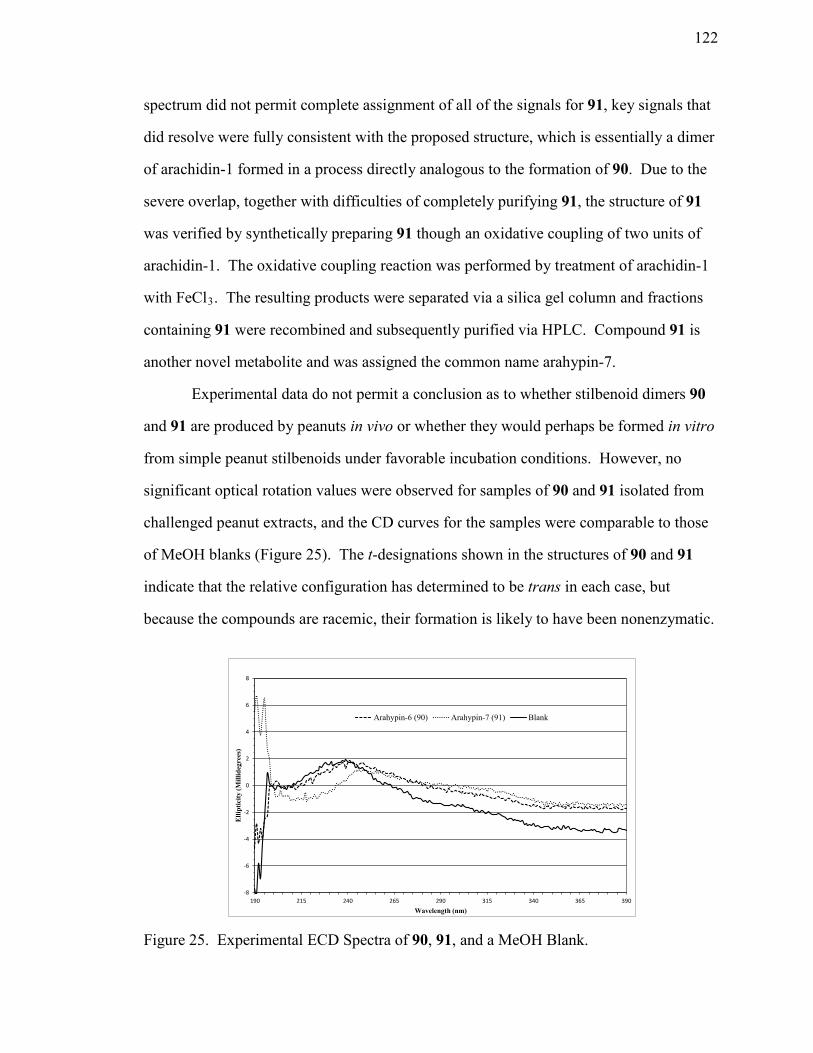
122
spectrum did not permit complete assignment of all of the signals for 91, key signals that
did resolve were fully consistent with the proposed structure, which is essentially a dimer
of arachidin-1 formed in a process directly analogous to the formation of 90. Due to the
severe overlap, together with difficulties of completely purifying 91, the structure of 91
was verified by synthetically preparing 91 though an oxidative coupling of two units of
arachidin-1. The oxidative coupling reaction was performed by treatment of arachidin-1
with FeCl3. The resulting products were separated via a silica gel column and fractions
containing 91 were recombined and subsequently purified via HPLC. Compound 91 is
another novel metabolite and was assigned the common name arahypin-7.
Experimental data do not permit a conclusion as to whether stilbenoid dimers 90
and 91 are produced by peanuts in vivo or whether they would perhaps be formed in vitro
from simple peanut stilbenoids under favorable incubation conditions. However, no
significant optical rotation values were observed for samples of 90 and 91 isolated from
challenged peanut extracts, and the CD curves for the samples were comparable to those
of MeOH blanks (Figure 25). The t-designations shown in the structures of 90 and 91
indicate that the relative configuration has determined to be trans in each case, but
because the compounds are racemic, their formation is likely to have been nonenzymatic.
Figure 25. Experimental ECD Spectra of 90, 91, and a MeOH Blank.
-8
-6
-4
-2
0
2
4
6
8
190 215 240 265 290 315 340 365 390
Elli
ptic
ity (M
illid
egre
es)
Wavelength (nm)
Arahypin-6 (90) Arahypin-7 (91) Blank
123
Stilbene derivatives in general are known for their biological activity.102,207,240,241
The prior literature report of compound 84 indicated that it shows antifungal effects
against Cladisporium cucumerinum, exhibiting a MIC value of 30 μg/mL, and toxicity
toward the yellow fever-transmitting mosquito Aedes aegypti by killing 100% of the
larvae within 24 h at only 6 ppm.219 It was also demonstrated that the presence of the
prenyl chain in 84 was required for the antifungal properties of this metabolite.219 It
seems likely that prenylated compound 86 may possess antifungal properties as well,
since other prenylated stilbenes, which differ from each other only in the position of the
side-chain double bond, as do 84 and 86, possess antifungal properties and inhibit spore
germination and hyphal extension of A. flavus.102 A similar comparison may be valid for
87 and 88, which bear the same dihydroxydimethylpropyl group as compound 85.
Compound 85 reportedly demonstrated inhibitory effects against cyclooxygenases,
particularly against cyclooxygenase-1.220
Stilbenoid dimers that show similarities to 90 and 91 are known, and represent the
most abundant group in the class of stilbenoid-derived oligomers. Such compounds are
known to show antifungal, antinematodal, antioxidant, cancer chermopreventive, anti-
inflammatory, anti-HIV, antimutagenic, cytotoxic, hepatoprotective, blood glucose
reductive, and tyrosinase inhibitory effects.225,227-231,233,234,242 Based on the similarity of
structures 90 and 91 with known natural oligomers, it is likely that 90 and 91 would show
some of the same kinds of biological activities. Taking into account the importance of
knowledge about natural plant defense mechanisms, as well as these published biological
activities of known stilbenoid oligomers, a systematic study of the biological activity of
compounds 90 and 91 is underway.
Arahypins 1-5 (85-89), as well as chiricanine A (84) were tested in a variety of
assays, including tests for antifungal effects against Botrytis cinera, Colletotrichum
acutatum, C. fragariae, C. gloeosporioides, Phomopsis viticola, P. pnscurans, and
Fusarium oxysporum, cytotoxic activity against four human tumor cell lines and
124
noncancerous cell lines, anti-inflammatory activity, opioid receptor activity, and
mosquito larvae toxicity.93 Log P values were also established (through the comparison
to standards) for each of the tested compounds. Log P values (in the octanol/H2O
system) quantitatively determine the difference in affinity of a molecule for the lipophilic
octanol/H2O system over the hydrophilic H2O/octanol system. Presumably, the higher
the log P value of an individual molecule, the easier it should be for that molecule to
penetrate microbial cell membranes, thereby fostering biological effects. The log P
values for 84-89 are given here in parentheses and were determined to be: 84 (3.46), 85
(1.36), 86 (3.71), 87 (1.59), 88 (2.59), and 89 (3.34). These numbers suggest that the
analogues possessing the dihydroxy prenyl group are less likely to result in biological
activity that is equivalent to the other compounds.
Of the compounds tested for antifungal activity, only compounds 84, 86, and 89
were active, showing effects against P. obscurans, P. viticola, and B. cinera (Figure 26).
This is consistent with the log P values (< 3) for these compounds, which is considered to
be an indicator of potential activity in such assays.
When tested up to 25 μg/mL, none of these compounds inhibited NF-κB, a
protein that controls the transcription of DNA. There was also no statically relevant
activity seen in the cytotoxicity assays against the human cell lines (both cancerous and
noncancerous) at similar concentrations. However, compounds 85-89 did demonstrate
significant antioxidant properties comparable to the standard, Trolox.93 Trolox
demonstrated antioxidant activity at an IC50 of 0.11 µg/mL, compounds 85-89 showed
IC50 values of 0.35, 0.19, 0.4, 9.5, and 1.3 µg/mL, respectively.93

125
Figure 26. Antifungal Properties of Compounds 84-89 against P. viticola and P. obscurans. Captan is Used as the Standard. Antifungal Assays were Performed (and Charts Produced) by D. E. Wedge and Co-Workers.93
None of the compounds showed any significant activity in assays for insecticidal
activity against mosquito larvae and adult mosquitos. This was also the case when the
compounds were tested for effects on opioid receptors (Δ, µ, and κ).93
In addition to the novel stilbene-derived compounds described in this Chapter,
additional stilbene-derived compounds with different structural features were
encountered in further experiments and they will be discussed in the next Chapter.
84 8685 87 88 89
144 hr
120 hr
144 hr
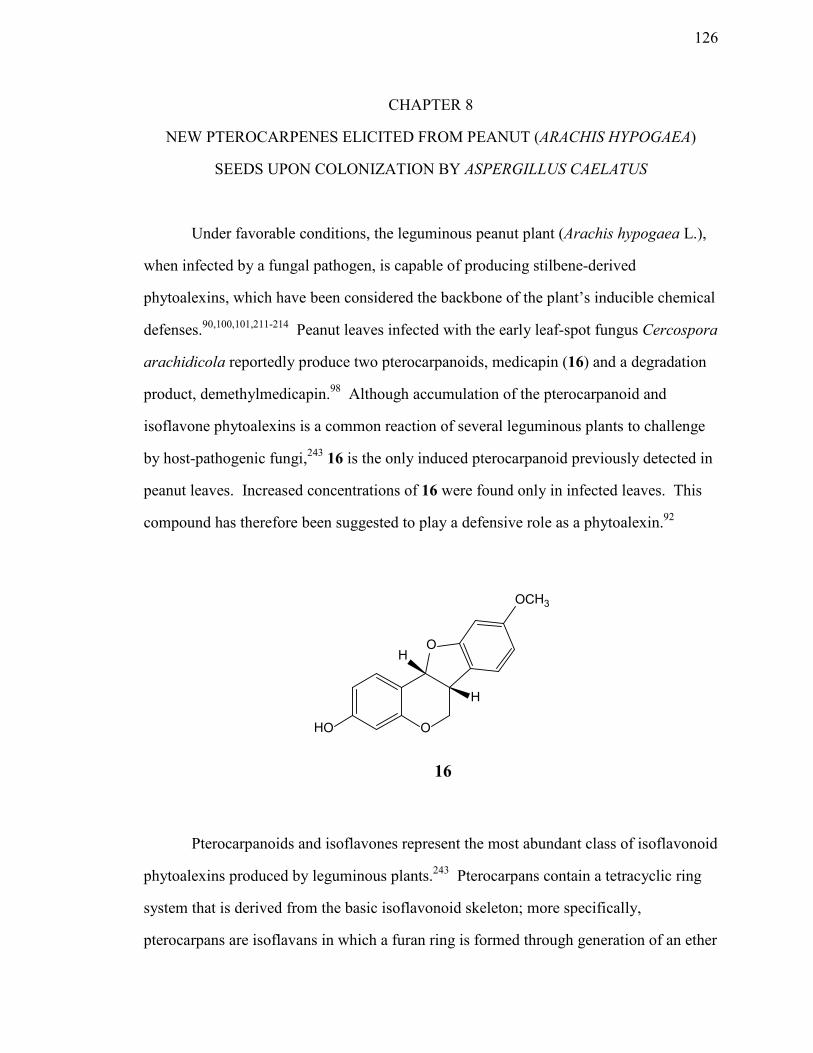
126
O
OH
H
HO
OCH3
16
CHAPTER 8
NEW PTEROCARPENES ELICITED FROM PEANUT (ARACHIS HYPOGAEA)
SEEDS UPON COLONIZATION BY ASPERGILLUS CAELATUS
Under favorable conditions, the leguminous peanut plant (Arachis hypogaea L.),
when infected by a fungal pathogen, is capable of producing stilbene-derived
phytoalexins, which have been considered the backbone of the plant’s inducible chemical
defenses.90,100,101,211-214 Peanut leaves infected with the early leaf-spot fungus Cercospora
arachidicola reportedly produce two pterocarpanoids, medicapin (16) and a degradation
product, demethylmedicapin.98 Although accumulation of the pterocarpanoid and
isoflavone phytoalexins is a common reaction of several leguminous plants to challenge
by host-pathogenic fungi,243 16 is the only induced pterocarpanoid previously detected in
peanut leaves. Increased concentrations of 16 were found only in infected leaves. This
compound has therefore been suggested to play a defensive role as a phytoalexin.92
Pterocarpanoids and isoflavones represent the most abundant class of isoflavonoid
phytoalexins produced by leguminous plants.243 Pterocarpans contain a tetracyclic ring
system that is derived from the basic isoflavonoid skeleton; more specifically,
pterocarpans are isoflavans in which a furan ring is formed through generation of an ether

127
OO
O
O
Chromane Substructure
3-phenylchomane (Isoflavan Skeleton)
Ether Linkage (Furan Ring Formation)
linkage between the chromane and the 3-phenyl unit (Figure 27). Pterocarpans generally
tend to possess the highest antifungal activity among the leguminous plant phytoalexins
in the flavonoid-based class of compounds.244 In addition to their defensive antifungal
functions, pterocarpans display other diverse biological effects, such as antibacterial,244-
248 anti-inflammatory,249,250 antitumor,251,252 antioxidant and antiallergenic,253 and
antiparasitic activities,254,255 as well as activity against Anopheles gambiae adult
mosquitoes256 and the common cutworm, Spodoptera litura.257
Figure 27. Formation of a Pterocarpan Skeleton.
Pterocarpenes differ from pterocarpans by incorporation of a double bond
between C-6a and C-11a (Figure 27). In contrast to hundreds of pterocarpans known
from various plant sources,243,244,258 only six members of the pterocarpene (pterocarp-6a-
ene) group were known just 10 years ago.243 A few more pterocarpenes have been
isolated since that time, and the biological activities of some of these have been
investigated.245-247,249,259 Antibacterial activity similar to that of pterocarpans seems to be
the most common and important quality of pterocarpenes described to date. Despite their
scarce distribution in plants, pterocarpenes may play important roles in the disease
resistance of plants in which they are produced due to the bioactivities they display.

128
O
O
R1 OCH3
OH
HO
R2
1 2
3 4
4a 6
7 8
6a 7a
10a
11a 1a
10 9
12
92: R1 = OH, R2 = H 93: R1 = H, R2 = OH
An Aspergillus caelatus strain (NRRL 25528, ex type) was chosen as a biotic
phytoalexin elicitor because it demonstrated a high growth rate and rapid stimulation of
phytoalexin biosynthesis in previous experiments.92 Compared to other strains, A.
caelatus produced only a few known secondary metabolites under the conditions
employed, which were easily detected and did not interfere with detection of elicited
peanut metabolites. The compounds of interest in this study were initially detected in
earlier experiments with wounded, challenged peanut seeds. In this contest, the concept
of “challenging” refers to inoculating with a fungus to purposefully infect a host in hopes
that it will produce metabolites that fend off the infection.92 Because the compounds
were observed only in inoculated seed extracts, they were suspected as possible
phytoalexins. When the experimental conditions were changed from high temperature –
short incubation time to low temperature – long incubation time, the production of the
two major compounds of this type increased significantly. These two compounds,
ultimately identified as aracarpene-1 (92) and aracarpene-2 (93), were targeted for further
investigation and isolated from the extracts by column chromatography and reversed-
phase HPLC (Figure 28).
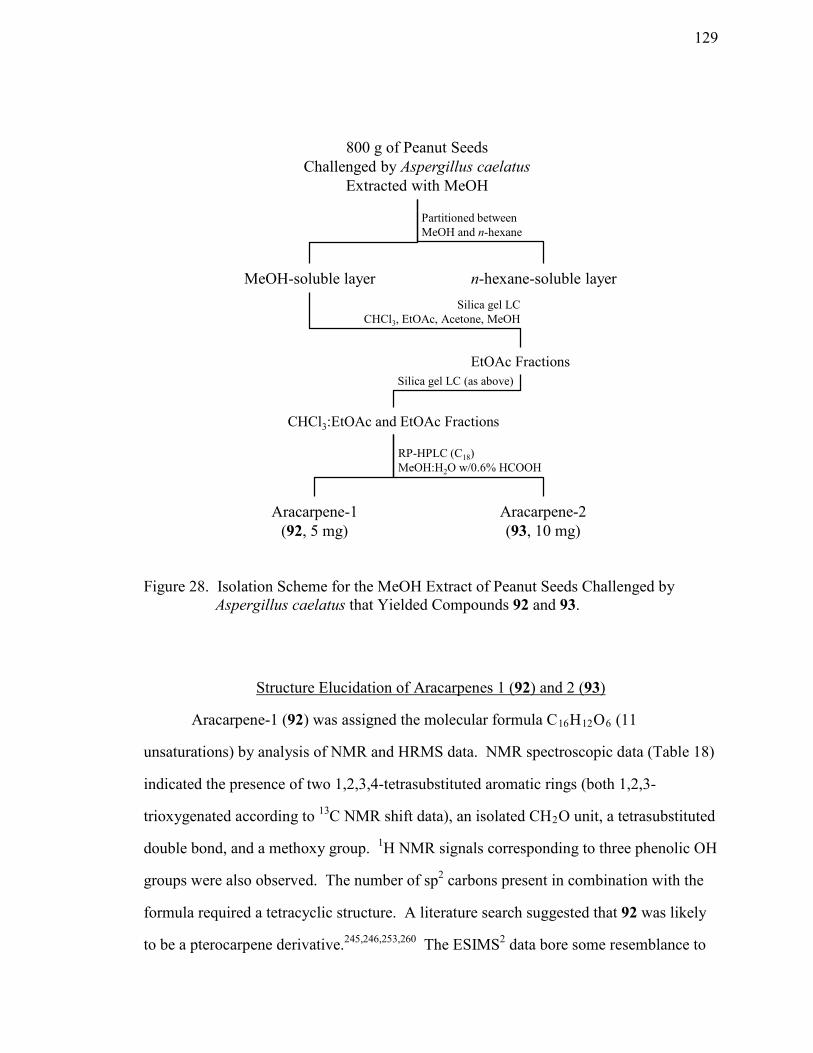
129
Figure 28. Isolation Scheme for the MeOH Extract of Peanut Seeds Challenged by Aspergillus caelatus that Yielded Compounds 92 and 93.
Structure Elucidation of Aracarpenes 1 (92) and 2 (93)
Aracarpene-1 (92) was assigned the molecular formula C16H12O6 (11
unsaturations) by analysis of NMR and HRMS data. NMR spectroscopic data (Table 18)
indicated the presence of two 1,2,3,4-tetrasubstituted aromatic rings (both 1,2,3-
trioxygenated according to 13C NMR shift data), an isolated CH2O unit, a tetrasubstituted
double bond, and a methoxy group. 1H NMR signals corresponding to three phenolic OH
groups were also observed. The number of sp2 carbons present in combination with the
formula required a tetracyclic structure. A literature search suggested that 92 was likely
to be a pterocarpene derivative.245,246,253,260 The ESIMS2 data bore some resemblance to
800 g of Peanut Seeds Challenged by Aspergillus caelatus
Extracted with MeOH
Partitioned between MeOH and n-hexane
MeOH-soluble layer n-hexane-soluble layer
EtOAc Fractions
Silica gel LCCHCl3, EtOAc, Acetone, MeOH
Silica gel LC (as above)
Aracarpene-1 (92, 5 mg)
CHCl3:EtOAc and EtOAc Fractions
Aracarpene-2 (93, 10 mg)
RP-HPLC (C18)MeOH:H2O w/0.6% HCOOH
130
spectra reported for 3,9-dihydroxypterocarp-6a-ene261 and were also consistent with such
a structure. More specifically, the units present and the molecular formula were
consistent with a pterocarpene system substituted with three OH groups and a methoxy
group.
HMQC and HMBC NMR spectroscopic data (Table 18) were used to
independently verify this conclusion, to determine the substitution pattern, and to locate
the methoxy group on compound 92. The methoxy signal at δ 3.94 showed an HMBC
correlation to an oxygenated aromatic carbon (C-9) which was also correlated with a
phenolic OH at δ 5.70. This phenolic OH showed additional HMBC correlations to C-10
and C-10a, both of which are also oxygenated aromatic carbons of the same 1,2,3-
trioxygenated aromatic ring. One of the aryl protons of this ring (H-7) showed strong
correlations to two of the oxygenated carbons (C-9 and C-10a) and a weak correlation to
the third (C-10), which is para to H-7. H-8 (ortho-coupled to H-7) also shows strong
correlations to two of the oxygenated carbons (C-9 and C-10) and a weak correlation to
the third (C-10a), which is para to H-8. The remaining carbon of this ring (C-7a) was
located via its correlations with H-7 and H-8. C-7a was further linked to a sp2 carbon C-
6a on the basis of a strong correlation of H-7 to C-6a. The isolated CH2–O (CH2-6) was
connected to C-6a by virtue of it correlations to C-6a and C-7a. H2-6 also showed strong
correlations to two other oxygenated sp2 carbons, which must correspond to C-4a and C-
11a in 92, although these two assignments could not be distinguished. Even so, these
data require C-6 to be connected to the second aromatic ring via an ether linkage. The
signals for the second tetrasubstituted aromatic ring could be assigned on the basis of
HMBC correlations of H-1 and H-2 (Table 18). Strong correlations of H-1 to two other
oxygenated carbons, aside from C-3 and C-4, required C-1a to be connected to an
additional oxygenated sp2 carbon. This was supported by weak correlations of H-2 to the
same two carbons. The only ambiguity was the assignment of C-4a and C-11a.
Although these two signal assignments were interchangeable, the formula requires
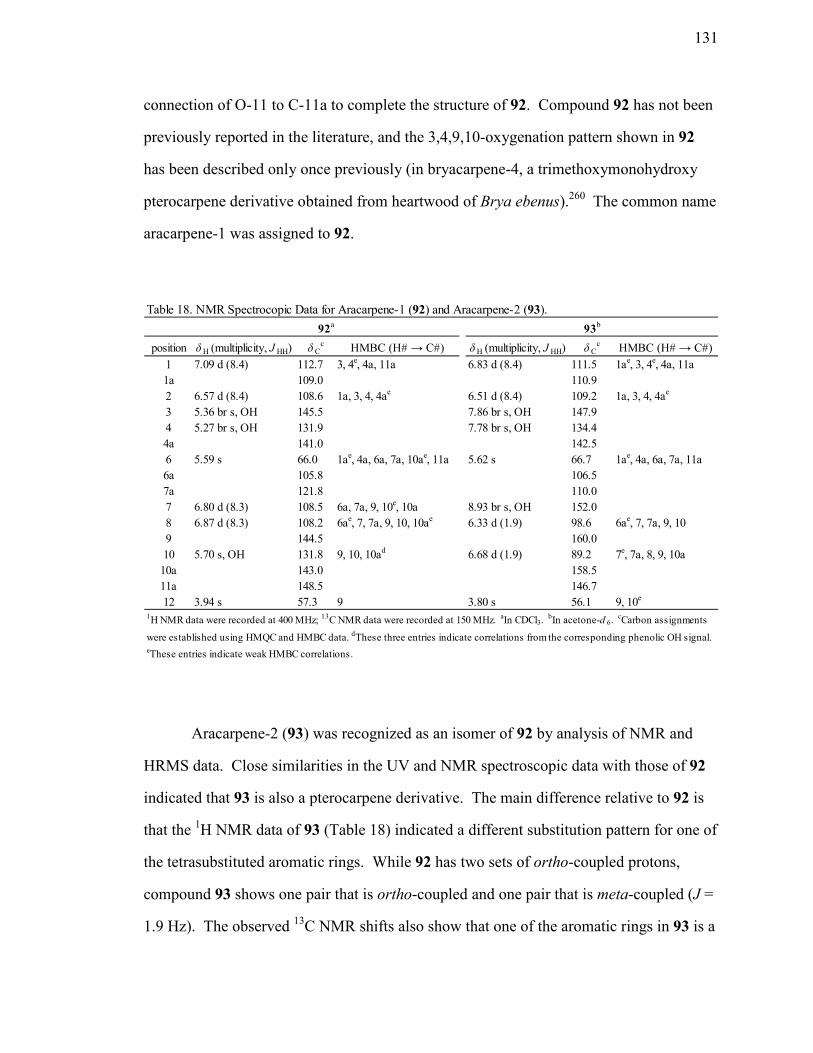
131
position δ H (multiplicity, J HH) δ Cc HMBC (H# → C#) δ H (multiplicity, J HH) δ C
c HMBC (H# → C#)1 7.09 d (8.4) 112.7 3, 4e, 4a, 11a 6.83 d (8.4) 111.5 1ae, 3, 4e, 4a, 11a1a 109.0 110.92 6.57 d (8.4) 108.6 1a, 3, 4, 4ae 6.51 d (8.4) 109.2 1a, 3, 4, 4ae
3 5.36 br s, OH 145.5 7.86 br s, OH 147.94 5.27 br s, OH 131.9 7.78 br s, OH 134.44a 141.0 142.56 5.59 s 66.0 1ae, 4a, 6a, 7a, 10ae, 11a 5.62 s 66.7 1ae, 4a, 6a, 7a, 11a6a 105.8 106.57a 121.8 110.07 6.80 d (8.3) 108.5 6a, 7a, 9, 10e, 10a 8.93 br s, OH 152.08 6.87 d (8.3) 108.2 6ae, 7, 7a, 9, 10, 10ae 6.33 d (1.9) 98.6 6ae, 7, 7a, 9, 109 144.5 160.010 5.70 s, OH 131.8 9, 10, 10ad 6.68 d (1.9) 89.2 7e, 7a, 8, 9, 10a
10a 143.0 158.511a 148.5 146.712 3.94 s 57.3 9 3.80 s 56.1 9, 10e
92a 93b
Table 18. NMR Spectrocopic Data for Aracarpene-1 (92) and Aracarpene-2 (93).
1H NMR data were recorded at 400 MHz; 13C NMR data were recorded at 150 MHz. aIn CDCl3. bIn acetone-d 6. cCarbon assignments
were established using HMQC and HMBC data. dThese three entries indicate correlations from the corresponding phenolic OH signal. eThese entries indicate weak HMBC correlations.
connection of O-11 to C-11a to complete the structure of 92. Compound 92 has not been
previously reported in the literature, and the 3,4,9,10-oxygenation pattern shown in 92
has been described only once previously (in bryacarpene-4, a trimethoxymonohydroxy
pterocarpene derivative obtained from heartwood of Brya ebenus).260 The common name
aracarpene-1 was assigned to 92.
Aracarpene-2 (93) was recognized as an isomer of 92 by analysis of NMR and
HRMS data. Close similarities in the UV and NMR spectroscopic data with those of 92
indicated that 93 is also a pterocarpene derivative. The main difference relative to 92 is
that the 1H NMR data of 93 (Table 18) indicated a different substitution pattern for one of
the tetrasubstituted aromatic rings. While 92 has two sets of ortho-coupled protons,
compound 93 shows one pair that is ortho-coupled and one pair that is meta-coupled (J =
1.9 Hz). The observed 13C NMR shifts also show that one of the aromatic rings in 93 is a
132
1,3,5-trioxygenated aromatic ring. Once again, HMBC NMR data were used to
determine the substitution pattern of 93. The methoxy group (δ 3.80) showed a
correlation to C-9, an oxygenated carbon of the 1,3,5-trioxygenated aromatic ring, as well
as a weak correlation to C-10, a protonated aromatic carbon. H-10 was also strongly
correlated with two oxygenated carbons (C-10a and C-9) and two non-oxygenated
carbons (C-7a and C-8), and (weakly) to a third oxygenated carbon (C-7), which is para
to H-10. H-8 was correlated with two oxygenated carbons (C-7 and C-9) and two non-
oxygenated carbons (C-7a and C-10), but lacked a weak correlation to the third
oxygenated carbon (C-10a). H-8 did, however, show a weak correlation to non-
oxygenated sp2 carbon C-6a. Other correlations were analogous to those described above
for 92.
Thus, compound 93 differs from 92 only in that one of the OH groups is located
at C-7 rather than C-10. No other pterocarpene skeleton with a 3,4,7,9-tetraoxygenated
substitution pattern has been previously reported in the literature.
Because compounds 92 and 93 did not display potent antifungal activity and
showed only minimal activity against Phomopsis viticola and Phomopsis obscurans, it
was suggested that they may possess antibacterial activity. In standard Petri plate disk
assays against Bacillus subtilis (ATCC 6051) and Staphylococcus aureus (ATCC 29213)
at 100 µg/disk, compound 93 showed zones of inhibition with diameters of 13 and 10
mm, respectively. By comparison, a gentamicin standard afforded zone sizes of 21 and
35 mm in these assays, respectively, at a concentration of 25 µg/disk. Interestingly,
compound 92 showed no activity in either assay at the 100 µg/disk level, in spite of the
close resemblance to 93. In order to explore this further, a more quantitative method to
investigate the antimicrobial activity was chosen to test compounds 92 and 93.262
Aracarpene-2 (93) was found to possess significant antibacterial properties (Figure 29)
against gram-positive and gram-negative bacteria. It was especially active against B.
subtilis and S. aureus with 100% loss of viability observed at 10 and 15 µM, respectively.
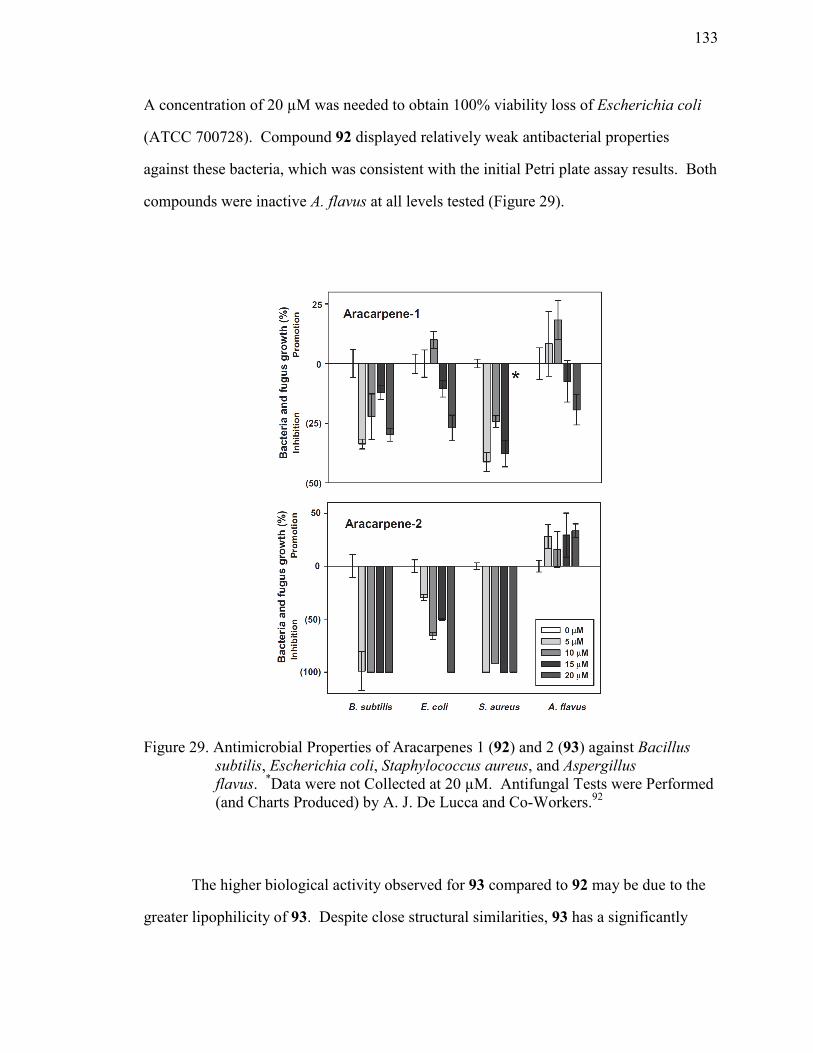
133
A concentration of 20 µM was needed to obtain 100% viability loss of Escherichia coli
(ATCC 700728). Compound 92 displayed relatively weak antibacterial properties
against these bacteria, which was consistent with the initial Petri plate assay results. Both
compounds were inactive A. flavus at all levels tested (Figure 29).
Figure 29. Antimicrobial Properties of Aracarpenes 1 (92) and 2 (93) against Bacillus
subtilis, Escherichia coli, Staphylococcus aureus, and Aspergillus flavus. *Data were not Collected at 20 µM. Antifungal Tests were Performed (and Charts Produced) by A. J. De Lucca and Co-Workers.92
The higher biological activity observed for 93 compared to 92 may be due to the
greater lipophilicity of 93. Despite close structural similarities, 93 has a significantly

134
higher log P value (2.28) than 92 (1.47), as determined by an HPLC method using
additional standards with known log P values. This means that 93, when compared to 92,
has about 6.5 times greater affinity for the lipophilic octanol/H2O system than the
hydrophilic H2O/octanol system. Presumably, the high lipophilicity of 93 would make it
easier for 93 to penetrate microbial cell membranes and exert biological effects.
Compounds 92 and 93 were also tested for anti-inflammatory, cytotoxic, and antioxidant
activities, but were found to be inactive in all of the assays employed.92
The detection of 92 and 93 in peanut seeds challenged by a fungus, but not in
uninoculated controls, suggests that these pterocarpenes may be biosynthesized in
addition to the stilbene phytoalexins (Chapter 7) to jointly fight invasion by
microorganisms. Interestingly, these antimicrobial compounds did not show activity
against an Aspergillus species, even though a member of the group was uses as the
“challenger”. Although some limited antifungal effects were observed against a pair of
Phomopsis species, it was not clear why challenge by a fungal species would stimulate
production of additional compounds. Perhaps such compounds might be synergistic with
other metabolites present and could act against a fungal invasion in that sense, but this
concept has not been investigated. In any event, these results are consistent with
previously published data, and support the idea that pterocarpenes 92 and 93 represent a
new class of low-molecular weight peanut compounds that could play defensive roles
against pathogenic microorganisms.

135
CHAPTER 9
SUMMARY AND CONCLUSIONS
This thesis describes chemical investigations of three distinct sources that yielded
structurally interesting, and biologically relevant, secondary metabolites: endophytic
fungi, fungicolous/mycoparasitic fungi, and peanut seeds.
The two fungal niche groups were selected for investigation based on the fact that
such organisms engage in complex interactions with other host organisms that may be
linked in some respects to their chemistry, and similar organisms have proven to produce
bioactive secondary metabolites that have interesting and/or unique structural features.
The preceding chapters describe the chemical investigation of 28 fungicolous or
endophytic fungal isolates from which 50 fungal secondary metabolites were identified.
Seventeen of these secondary metabolites were determined to be new compounds.
Most of the fungicolous/mycoparasitic fungi described here were obtained from
the nutrient-rich fruiting bodies of wood-decay fungi (polypores) that were collected on
the island of Hawaii. The endophytic fungi were obtained from corn (Zea mays), wheat
(Triticum aestivum), or sorghum (Sorghum vulgare) plants that were growing in Arizona,
Illinois, Kentucky, or Nebraska, or under controlled conditions at the NCAUR plot in
Peoria, IL. Isolates of both fungal types were selected for chemical investigation on the
basis of antifungal and antiinsectan activities of their crude fermentation extracts against
Aspergillus flavus, Fusarium verticillioides, and Spodoptera frugiperda (the fall
armyworm). In addition to the known antifungal and antiinsectan agents that were
isolated, several of the new secondary metabolites that were tested also exhibited
antifungal and/or antiinsectan activity.
In some cases, the antifungal or antiinsectan activity observed for the crude fungal
metabolite extracts could be accounted for by the effects of known compounds.
However, this was not the case in all instances. If the activity of an extract cannot be

136
attributed to novel or known compounds encountered, there are various reasons that
could explain a lack of activity after separation. First, the active compound(s) could be
present in vanishingly small quantities and it therefore might not have been possible to
identify or isolate them under the conditions used. Alternatively, the active components
could decompose during what is often a lengthy isolation process. It is also possible that
the initial activity could have been the result of synergistic effects of a combination of
multiple components present, and not caused by a single compound.
Identification of known metabolites was generally achieved through database
searches in combination with preliminary NMR and/or MS data. Structure elucidation of
novel compounds required application of more advanced NMR techniques such as
HMQC, HMBC, and NOESY. Assigning absolute configuration was often the most
difficult task in characterizing individual metabolites. To assign absolute configuration
of the novel peptides encountered, a process of a hydrolysis, derivatization of the
resulting amino acids, and subsequent analysis of the products by GCMS in comparison
to standards was employed.
In two other cases, non-traditional methods for assigning the absolute
configuration were required. Unlike the analysis of a single-crystal X-ray diffraction by
incorporating a “heavy” atom, which can enable assignment of absolute configuration of
an entire molecule, independent analysis of structurally insulated parts of the same
molecule was required on multiple occasions. For alflaquinones A (43) and B (44), each
region of the compound was separately and independently evaluated, with the absolute
configuration of one portion assigned by using Mosher’s Method, while the absolute
configuration of the other was assigned by using CD measurements in comparison to
calculated CD data on energy-minimized models. Chemical interconversion was also
helpful in one case. Some of the aflaquinolones were also evaluated using theoretical
optical rotation calculations in an effort to assist in the absolute configuration assignment.
137
Another novel compound that required extensive efforts to assign absolute
configuration was emeridin A (65). A successful ozonolysis was carried out on a
subsample of the isolated material to effectively divide the molecule in half, but efforts to
separate the resulting products by HPLC were unsuccessful. Thus, only the relative
configuration of 65 has been assigned at this point, but it is noted that the relative
configurations of the two halves of the molecule could not be related to one another,
leaving an additional undefined element. Other research groups reporting similar
compounds also failed to establish the absolute configuration.
Previous members of our research group have occasionally collaborated with Dr.
Sobolev in the characterization of secondary metabolites from Arachis hypogaea (peanut)
seeds. However, this the first time that the extent of such work has risen to the level of
inclusion in a thesis from a member of our group. Metabolites characterized in this
portion of the research described here were isolated from peanut seeds challenged by
Aspergillus caelatus, which were grown under controlled conditions at the USDA
National Peanut Research Laboratory in Dawson, GA. Chapters 7 and 8 include the
discovery and characterization of eight new metabolites, along with two additional
previously known metabolites that were reported for the first time from peanut seeds. All
of the compounds encountered exhibited similar structural features, as all are stilbene-
derived, and all approximately were of similar molecular size, except for two dimeric
compounds.
While the three main projects described in this thesis are distinct from one
another, the common theme is that fungi can both produce or elicit secondary metabolites
that are novel, interesting, and biologically active. Because fungicolous/mycoparasitic
and endophytic fungi are underexplored, the likelihood of discovering new bioactive
metabolites from such fungi remains high. Even when novel compounds were isolated
that were not especially active in our assays, the new chemistry encountered posed
challenges in structure determination that had to be overcome.
138
CHAPTER 10
EXPERIMENTAL
General Experimental Procedures
Solvents and Reagents
Solvents used for partitioning and chromatographic purposes were purchased
from Fisher Scientific. General lab procedures were undertaken using reagent grade
solvents, whereas analytical separations on HPLC instrumentation employed HPLC-
grade solvents. Distilled water for HPLC applications was purified using a
SYBRON/Barnstead NANOpure system with a pre-treatment cartridge (catalog number
D08350, two ultra-pure cartridges (D0809), and a 0.2-μm hollow fiber filter (D3750).
All HPLC solvents were degassed under vacuum using a Branson 1510 sonicator prior to
use. Reagents and deuterated solvents were purchased from either Aldrich Chemical
Company or Cambridge Isotope Laboratories.
Mass Measurements
Masses of reagents, crude extracts, partitions, column fractions, and pure
compounds were measured using either a Mettler AE 160 or Mettler AE 200 balance. All
before and after measurements were performed on the same balance.
Evaporation
Removal of solvents was primarily accomplished by evaporation under a flow of
air. Prolonged exposure to airflow was necessary during periods of higher humidity
during the course of a year. Occasionally, partial evaporations were carried out on a
Büchi RE-11 Rotavapor with assistance from an antifreeze-filled Neslab RTE-110.
139
General Chromatography Information
Silica gel TLC separations were carried out using pre-coated plastic sheets
(Sorbent Technologies, 200-μm thickness silica gel with fluorescent indicator, 40 × 80
mm). TLC spots were visualized by exposure to UV light at 254 nm or 365 nm, as well
as exposure to iodine vapor. Column chromatography and VLC separations were
performed with Scientific Adsorbent, Inc. 63-200-μm silica gel or with J.T. Baker 40-μm
silica gel. VLC separations were conducted using a column with a ground-glass fitting,
side arm, and a frit that was, in turn, secured onto a 500-mL round-bottom flask. Gel
filtration column chromatography was accomplished using Sephadex LH-20 (Sigma).
Fractions from column chromatography were collected manually using beakers.
Semipreparative reversed-phase HPLC separations were performed using one of
two Beckman Instrument systems: (1) System Gold 125 solvent delivery module, with a
photodiode array detector, model 168, both of which were controlled by System Gold 32
Karat software using an IBM 300PL PC; (2) System Gold 127P solvent delivery module
with a model 166P variable wavelength UV detector, both controlled by System Gold
software (version 5.1). Both of the described HPLC systems employed Rheodyne model
7725 injectors, which were used in conjunction with Hamilton syringes (100- or 500-μL,
blunt). Separations were conducted using an Alltech HS Hyper Prep 100 BDS C18 (8-μm
particle size, 250 × 10.0 mm), Alltech Apollo Phenyl (5-μm particle size, 250 × 10.0
mm), Alltech Platinum CN 100A (5-μm particle size, 250 × 10.0 mm), or Grace Apollo
C18 (5-μm particle size, 250 × 10.0 mm) columns at a flow rate of 2.0 mL/min; or Grace
Adsorbosphere HS C18 (5-μm particle size, 250 × 4.6 mm) column at a flow rate of 1.0
mL/min. All HPLC chromatograms were recorded using a Linear model 1200 chart
recorder, and were monitored at selected wavelengths, typically between 210-260 nm.

140
Chromatography of Plant Metabolites –
Chiricanine A (84) and Arahypins 1-5 (85-89)
HPLC-DAD-MS Analyses
Analyses were performed using an HPLC system equipped with a model LC-
10ATvp pump (Shimadzu), a model SPD-M10Avp DAD covering the 200-600 nm range
with Shimadzu Client/Server software, version 7.3, and a model 717 plus autosampler
(Waters). Separations of seed extracts and purified stilbenoids were performed on a 50
mm x 4.6 mm i.d., 2.5 µm, XTerra MS C18 analytical column (Waters). H2O (A), MeOH
(B), 2% HCOOH in H2O (C), and MeCN (D) were used in the following gradient
(mobile phase 4): initial conditions 67% A/30% B/3% C, changed linearly to 2% A/95%
B/3% C in 12 min, held isocratic for 4 min, and then changed to initial conditions in 0.01
min. The flow rate was 1.3 mL/min. The column was maintained at 40 °C in a model
105 column heater (Timberline Instruments, Boulder, CO). For tandem HPLC-MS
analyses, a Surveyor HPLC system equipped with MS Pump Plus, Autosampler Plus, a
PDA Plus Detector (Thermo Electron Corp., San Jose, CA) and a 50 mm x 4.6 mm i.d.,
2.5 µm, XTerra MS C18 analytical column (Waters) was used. The column was
maintained at 40 °C. The same solvents that were used to mobile phase 4 were used for
the HPLC-MS analyses. The solvents were mixed in the following gradient: mobile
phase 5, initial conditions 67% A/30% B/3% C, changed linearly to 2% A/95% B/3% C
in 12 min, held isocratic for 2 min, changed to initial conditions in 0.01 min, mobile
phase 6, initial conditions 70% A/27% B/3% C, changed linearly to 2% A/95% B/3% C
in 12 min, held isocratic for 2 min, changed to initial conditions in 0.01 min. The flow
rate for both systems was 0.8 mL/min.
Preparative HPLC Separations
Preparative HPLC separations for the stilbenoids were performed using a 100 mm
x 19 mm i.d., 5-µm XTerra Prep RP18 OBD column (Waters). The column temperature
was 40 °C. The following isocratic mobile phases were used: mobile phase 1, 74%
141
MeCN, 3% of 2% HCOOH in H2O and 21% of H2O; mobile phase 2, 55% MeOH, 5%
of 2% HCOOH in H2O, and 40% H2O; mobile phase 3, 55% MeCN, 3% of 2% HCOOH
in H2O, and 42% H2O. The flow rate was 8.0 mL/min.
Chromatography of Plant Metabolites – Arahypins 6-7 (90 and 91)
HPLC-DAD-MS Analyses
Separations of seed extracts and purified stilbenoids were performed using a
tandem HPLC-MS Surveyor system equipped with MS Pump Plus, Autosampler Plus, a
PDA Plus Detector (Thermo Electron Corporation, San Jose, CA), and a 50 mm x 4.6
mm i.d., 2.5 μm XTerra MS C18 analytical column (Waters). H2O (A), MeOH (B), and
2% HCOOH in H2O (C) were used in the following gradient: initial conditions 68% A/
30% B/ 2% C, increased linearly to 0% A/ 98% B/ 2% C in 12 min, held isocratic for 5
min, decreased to initial conditions in 0.01 min (mobile phase 7). The flow rate was 0.8
mL/min. The column was maintained at 40 °C.
Preparative HPLC Separations
Preparative HPLC separations for the dimeric stilbenoids were performed using a
100 mm × 19 mm i.d., 5-µm XTerra Prep RP18OBD preparative column (Waters). The
column temperature was 40 °C. The following isocratic mobile phases were used:
mobile phase 8, 75% MeCN, 3% of 2% HCOOH in H2O, and 22% H2O; mobile phase 9,
60% MeCN, 3% of 2% HCOOH in H2O, and 37% H2O; mobile phase 10, 70 % MeOH,
3% of 2% HCOOH in H2O, and 27% H2O. The flow rate was also 8.0 mL/min.
Chromatography of Plant Metabolites – Aracarpenes 1-2 (92 and 93)
HPLC-DAD-MS Analyses
Analyses of seed extracts and purified substituted pterocarpenes were performed
using a tandem HPLC-MS Surveyor HPLC system equipped with MS Pump Plus,
Autosampler Plus, a PDA Plus Detector (Thermo Electron Corp., San Jose, CA), and an
XBridge C18 analytical column (2.5-µm, 3.0 x 50 mm; Waters). H2O (A), MeOH (B),
and 2% HCOOH in H2O (C) were mixed in the following gradient: initial conditions,

142
68% A/30% B/2 % C, increased linearly to 0% A/98% B/2% C in 12 min, held isocratic
for 5 min, decreased to initial conditions in 0.01 min (mobile phase 11). The flow rate
was 0.5 mL/min. The column was maintained at 40 °C in a column heater (model 105,
Timberline Instruments). Retention times of 92 and 93 were 3.3 and 5.4 min,
respectively.
Preparative HPLC Separations
Preparative HPLC separations were performed using an XTerra Prep RP18 OBD
(5-µm, 19 x 100 mm; Waters). The column temperature was maintained at 40 °C. The
following mobile phases were used: initial conditions, 57% A/40% B/3% C, increased
linearly to 7% A/90% B/3% C in 12 min, held isocratic for 3 min, decreased to initial
conditions in 0.01 min (mobile phase 12); 34% A/63% B/3% C (mobile phase 13). The
flow rate was 8.5 mL/min.
General Spectroscopic Information
Optical rotations were measured with a Rudolph Research Autopol III automatic
polarimeter. Melting points were obtained on a Fisher-Johns micro melting point
apparatus, and are uncorrected. UV Spectra were recorded using either a Hewlett
Packard 8453 UV-Visible or a Varian Cary 100 Bio UV-Visible spectrophotometer.
Low-resolution EI mass spectra, including those obtained by GC-MS, were acquired at
70 eV on a Thermo Voyager single-quadrupole mass spectrometer. Low-resolution
ESIMS data were obtained using a Thermo LCQ Deca quadrupole ion trap spectrometer.
MS facility personnel (Mr. Vic Parcell or Dr. Lynn Teesch) recorded all high-resolution
EI and ESI mass spectra. HREIMS data were acquired on a Waters Autospec double-
focusing magnetic-sector Waters mass spectrometer. HRESIMS and HRESIMSMS data
were acquired on a Waters Q-ToF Premier mass spectrometer.
1H NMR data were recorded on Bruker Avance III-600 (1.77-mm probe),
Avance-600, Avance-400, DRX-400, or Avance-300 spectrophotometers (5-mm probes)
143
at room temperature unless otherwise noted. 13C NMR and DEPT experiments were
performed on either the DRX-400 or Avance-400 instruments. Homonuclear decoupling
and COSY experiments were performed on the DRX-400 instrument. NOESY
experiments were performed on the DRX-400, Avance-400, Avance-600, or AvanceIII-
600 instruments. The Avance-300, DRX-400, and Avance-600 instruments were
controlled by Bruker TopSpin 1.3 software. The Avance-400 instrument was controlled
by TopSpin 2.1 software. The Avance III-600 instrument was controlled by TopSpin 3.0
software. Some early homonuclear decoupling experiments on the DRX-400 were
performed using the XWinNMR 3.5 software. Both the Avance III-600 and Avance-600
NMRs operate at 1H and 13C frequencies of 600.1422 and 150.9203 MHz,
respectively. 1H NMR and inverse detection experiments (HMBC and HMQC) were
recorded on the Avance-600 instrument using a 5-mm inverse probe (BBI) and on the
Avance III-600 instrument using a 1.77-mm inverse probe (TXI). The DRX-400
spectrometer operates at a proton frequency of 400.1355 MHz and a carbon frequency of
100.6230 MHz using a 5-mm multinuclear broadband probe (BBO). The Avance-400
spectrometer operates at 1H and 13C frequencies of 400.1320 and 100.6230 MHz,
respectfully, and also utilizes a 5-mm, BBO probe. The Avance-300 spectrometer
operates at a proton frequency of 300.1675 MHz and a carbon frequency of 75.4786
MHz, and it utilizes a 5-mm proton-carbon-phosphorus probe (HCFP).
All NMR spectra were recorded in the deuterated equivalents of CHCl3, acetone,
MeOH, DMSO, MeCN, or benzene, and the chemical shifts (δ) are reported in ppm
downfield from TMS, with the appropriate residual protonated solvent peaks used as
internal reference standards (δH/δC, 7.24/77.16, 2.05/29.84 or 206.26, 3.31/49.0,
2.50/39.51, 1.94/1.32 or 118.26, and 7.16/128.06, respectively). 2D NMR data were
processed using XWinNMR 3.1 on a Silicon Graphics workstation (SGI O2) or using
TopSpin versions 1.3, 2.1, or 3.0. 1D NMR data were processed using the NUTS
program (Acorn NMR Inc., version 5.02). Five-mm 535-PP and 5-mm 528-J4-7 NMR
144
tubes purchased from the Wilmad Glass Company were among the NMR tubes used for
analysis. Microprobe (1.77-mm) NMR tubes were purchased from Bruker Instruments.
Appropriate NMR tube ratings were met or exceeded for each experiment performed on a
given spectrometer.
GCMS Conditions for Amino Acid Derivative Analysis
A Thermo Voyager single quadrupole mass spectrometer interfaced with a
Trace2000 GC, equipped with an Agilent Technologies DB-1701 capillary column (30 m
x 0.25 mm ID; 0.25 µm film) was used for GC-MS analysis. The GC temperature
program started at 70°C for one minute then ramped up at 10°C/min to 280°C and was
held there for 18 minutes. Helium was used as the GC carrier gas (1 mL/min flow rate).
The GC inlet temperature was set at 280°C. The attached autosampler was set to inject 1
µL for each sample and standard. EIMS data (70 eV) were collected over the mass range
50-700 Da. Thermo’s Xcalibur 1.4 software was used for data acquisition and
processing.
Electronic Circular Dichroism (ECD) Analysis
ECD analysis was carried out on an Olis Cary 17 instrument. Samples analyzed
on the ECD instrument were prepared in such a way that the maximum UV absorbance
was one (1) absorbance unit (AU).
Additional Details of Spectroscopic Measurements in
Studies of Marine Aspergillus sp. Isolate (Chapter 3)
Optical rotations were recorded on a Perkin Elmer 341 digital polarimeter. NMR
spectra were recorded using a JEOL JNM ECP-400 spectrometer (400 MHz for 1H and
100 MHz for 13C), and chemical shifts were referenced relative to relative to the
corresponding residual solvents signals (acetone-d6: δ 2.05/29.9; CD3OD: δ 3.31/49.0).
145
HMQC and HMBC experiments were optimized for 1JCH = 140 Hz and nJCH = 8 Hz,
respectively. ESIMS data were obtained using a Q-TOF micro LC-MS/MS instrument
(Waters, USA) at Korea University, and a hybrid ion-trap time-of flight mass
spectrometer (Shimadzu, Japan) at the Korean Basic Science Institute (KBSI).
Additional Details of Spectroscopic Measurements in
Studies of Plant Metabolites – Chiricanine A (84),
Arahypins 1-7 (85-91), and Aracarpenes 1-2 (92 and 93)
UV measurements were performed with a Varian Cary 100 Bio UV-Visible
spectrophotometer. APCI-MSn data were obtained on a Finnigan LCQ Advantage MAX
ion trap mass spectrometer equipped with and APCI interface and operated with
Xcalibur, version 1.4, software (Thermo Electron Corp.). All data were acquired in the
full-scan positive polarity mode from m/z 100 to 2000. Capillary temperature was 165
°C, APCI vaporizer temperature 240 °C, sheath gas flow 55 units, auxiliary/sweep gas
flow 5 units, source voltage 6 kV, and source current 6 µA. In MS2 analyses using the
Finnigan LCQ, the [M + H]+ ions observed for each chromatographic peak in full-scan
analyses were isolated and subjected to source collision-induced dissociation (CID) using
He buffer gas. In all CID analyses, the isolation width, relative fragmentation energy,
relative activation Q, and activation time were m/z 2.8, 35%, 0.25, and 30 ms,
respectively. Concentrations of compounds of interest were approximated by reference
to peak areas of corresponding pure compounds. The results of APCI-MS2 experiments
are represented in the discussion of peanut metabolites (Chapters 7 and 8) in the
following format: m/z aaa@bb: aaa, ccc, ddd, where aaa is the parent ion, bb is
normalized collision energy (%), and ccc and ddd are fragment ions.
146
General Procedures for Individual NMR Experiments
DEPT Experiment
DEPT experiments were used to establish carbon multiplicities. Data were
recorded on either the DRX-400 or Avance-400 spectrometer using a file size of 64k and
a suitable RG for a carbon spectrum. The results of a DEPT-135 experiment depict CH
and CH3 carbons as positive signals and CH2 carbons as negative signals in the observed
spectrum. Experimental parameters were preset for the DRX-400 instrument (Bruker
software, version 1.3) using the program DEPT135 and for the Avance-400 instrument
(Bruker software, version 2.1) using the program AA_13C-DEPT. Once the program is
loaded, a suitable number of scans are entered and typing “zg” starts the experiment.
Homonuclear Decoupling Experiment
This experiment was used to determine which protons were mutually coupled
within a molecule and/or to help establish 1H-1H coupling constants for individual proton
signals. These experiments were carried out exclusively on the DRX-400 spectrometer.
A preloaded program, AA_HomoDecouple, with standard experimental parameters in the
XwinNMR software (version 3.1) was used. Alternatively, the preloaded program zghd.2
was used with the Bruker TopSpin software (version 1.3) that achieved the same results.
A standard proton spectrum was initially obtained with a suitable number of scans and
saved as the file entry “1” in the cell labeled EXPO. The frequencies (O2 values in Hz)
of all proton signals to be irradiated were recorded. Multiple files were created in
accordance with the number of protons to be irradiated and saved with successive
numbers entered in the EXPO cell. The decoupling power, P24, was set between 50 and
70, usually 55 to 60, and the frequency to be irradiated was then entered for each EXPO
experiment. The entire experiment was initiated in EXPO 2 by typing “xau”, which
opens a new cell requesting the number of experiments to be strung together, which must

147
be equivalent to the number of proton signals to be irradiated. Each experiment employs
the same number of scans used for the standard 1H NMR spectrum in EXPO 1. The
resulting data were processed using the NUTS software (Acorn NMR Inc., version 5.02).
NOESY Experiment
The relative configuration of certain compounds could sometimes be determined
based on the results of NOESY experiments. This 2D version of the NOE experiment
provides through-space 1H-1H correlations based on the nuclear Overhauser effect.
Either the DRX-400 or the Avance-600 spectrometers were used to carry out NOESY
experiments. The procedure starts by properly tuning the NMR probe, followed by
obtaining a well-shimmed 1H NMR spectrum. Suitable SW and O2 values can be
calculated from the 1H NMR spectrum. A proton pulse calibration was then carried out
using the pulse program “zg” (Bruker TopSpin, version 1.3 software), from which the
parameters P0 (90° pulse), P1 (90° pulse), and P2 (180° pulse) were determined. A
second pulse calibration was done using the pulse program “t1ir1d” to determine the
appropriate mixing time by varying the parameter D7 to nullify the spectrum. Once
done, D8, the mixing time, is set to the value of D7/0.7. The following parameters were
then set with the “noesyph-i” pulse program: D1 (relaxation delay, RD) = 4 sec, D8 =
value determined by pulse calibration, TD = 2k or 4k, NS = 8,16, or 32, DS = 16. The
DW is a preexisting parameter and the IN_010 parameter is set at double the value of the
DW. The dimensional parameter was then changed from 1D to 2D, changing ND_010 =
1 and FnMODE = TPPI. After verifying that the SW in Hz (SWH) is the same for both
F1 and F2, and setting TD in F1 to 256 or 512, acquisition is initiated by typing “zg.”
HMQC Experiment
The HMQC experiment is used to provide one-bond proton to carbon correlations.
This method relies on indirect detection of 13C nuclei by observing their effects on the
148
more sensitive 1H nuclei to which they are coupled; an inverse detection method. HMQC
experiments were conducted both on the Avance III-600 and on the Avance-600
spectrometers using the BBI and TXI inverse detection probes, respectively. After
loading the sample, the probe was tuned and matched for both the 1H and 13C nuclei.
This process was automated when using the Avance III-600 NMR. For the Avance-600
NMR, the spinner was engaged and a well-shimmed proton NMR spectrum was acquired.
For the Avance III-600 NMR, these shimming and data acquisition steps were automated.
The resulting 1H NMR spectrum was used as a reference for projection of the 1H
dimension during processing (F2). The following parameters were set for a proton pulse
calibration using the pulse program “zg” (Bruker TopSpin, versions 1.3 and 3.0
software): OFSX1 = 20 Hz, SFO = 152.92 MHz, DS = 0, N = 1, S1 = 16k, P0/P1 (90°
transmitter high-power pulse) and P2 (180° transmitter high-power pulse). The following
parameters were set with the pulse program “hmqcgpnd1d” on the Avance-600 NMR:
D1 = 4 sec, D2 [1/(2 × JXH)] = 3.33 sec (if experiment is optimized for J = 150 Hz), D13
= 3 µsec, DS = 4, NS = 16, and TD = 8k. After the acquisition was completed, the
command “fmc” was entered in order to observe the signals of protons bound to 13C
atoms and determine signal intensity (allowing for a prediction of the NS needed for the
actual HMQC experiment). When using the Avance III-600 NMR, all parameters were
preset by the Bruker TopSpin 3.0 software pulse program.
The HMQC experiment was then conducted using the pulse program “hmqcgpqf”
with multiple parameter changes on the Avance-600 NMR. Once the mode was switched
from 1D to 2D, the following parameters were used for the experiment: FnMODE = QF,
F1 Nucleus set to 13C, DS = 96, TD = 2k or 4k, NS = any multiple of 8, RG = 16k, TD
(F1 dimension) = 256 or 512, SI = 1k, SFO (F1 dimension) = 150.92, ND_010 = 2,
IN_010 = 15 µsec, and O2P = 80. The HMQC acquisition was initiated by typing “zg.”
As with the pulse calibration, the parameter changes were preset by the Bruker TopSpin

149
3.0 software when using the Avance III-600 NMR instrument with the pulse program
simply named HSQC.
HMBC Experiment
Long-range two-, three-, and occasionally four-bond 1H to 13C correlations were
obtained from this type of experiment. The experiment was conducted on both the
Avance-600 as well as the Avance III-600 spectrometers using a 5-mm (BBI) or 1.77-mm
(TXI) inverse detection probe, respectively. The pulse program used for the HMBC
experiment on the Avance-600 was labeled “hmbcgplpndqf.” The parameters for the
HMBC experiment were nearly identical to those of the HMQC, with the exception of
changing IN_010 to 13 µsec if 13C peaks were expected past 200 ppm and changing the
O2P parameter to 100. The D6 parameter was used to optimize the experiment for the
desired J-value. In most cases, a typical value of 8 Hz was used, corresponding to a D6
value of 60 msec. As with the HMQC parameters and pulse calibrations, the Avance III-
600 NMR, controlled by Bruker TopSpin 3.0, had many of these parameters preset in the
selected program simply named HMBC.
General Procedures for Solid-Substrate Fermentations
Fermentations of mycoparasitic/fungicolous and endophytic fungi were conducted
in the laboratory of Dr. D. T. Wicklow of the Mycotoxin Research Unit, Agricultural
Research Service, NCAUR, USDA in Peoria, Illinois. The fungal strains were cultured
on slants of PDA at 25 °C for 14 days. Spore inoculum from these slants was suspended
in sterile distilled water to give a final spore/cell suspension of 1 × 10⁶/mL. Fermentaion
was typically carried out in duplicate 2.8 L Fernbach flasks, each containing 100 g of
rice. Distilled water (200 mL) was added to each flask and the contents were soaked
overnight before autoclaving at 15 lb/in2 for 30 min. After cooling to rt, each was
inoculated with 3.0 mL of the spore inoculum and incubated at 25 °C for 15-30 days.

150
After incubation, the fermented substrate was mechanically fragmented and extracted
with EtOAc (3 × 500 mL). The combined EtOAc extracts were filtered and concentrated
under vacuum to give a crude extract. In cases where additional material was needed,
this process was scaled up using a greater number of flasks in an effort to obtain a
targeted amount of crude extract for a given species.
General Procedures for Antifungal Assays
Antifungal assays against Aspergillus flavus (NRRL 6541) and Fusarium
verticillioides (NRRL 25457) were conducted in the laboratory of Dr. Donald T.
Wicklow of the NCAUR. A portion of the crude EtOAc extract of the solid-substrate
fermentation cultures (approximately 6 mg) was redissolved in EtOAc. One-mg and 0.5-
mg equivalents of extractable residue were pipetted into individual Petri dish lids and
dried for 30 min in a laminar flow hood. After each disk was allowed to dry, up to four
disks were placed equidistant from one another on the surface of freshly poured and
solidified yeast-malt-glycerol (YMG) agar that was seeded with a spore suspension of A.
flavus (NRRL 6541) conidia to give a final spore suspension of 100 cells per mL.
Bioassay plates were incubated at 25 °C for four days and any inhibition of A. flavus was
indicated by the presence of a cz, mz, or rg region around the disk (see Table 1 for zone
definitions), which is indicative of the inhibition of germination and/or a measure of
fungistatic activity (observations were typically noted after two and four days). An
analogous procedure was employed for the assay against F. verticillioides (NRRL
25457).
Antifungal assays against Candida albicans (ATCC 10231) were conducted in
our own laboratory. C. albicans test plates were freshly prepared as needed. One C.
albicans BBL Quali Swab (Becton Dickinson) was used to inoculate 50 mL of sterile
(MarketForge Sterilmatic Autoclave) Difco yeast maintenance broth. The culture was
allowed to aerate on an orbital shaker at 150 rpm at rt for 36-48 hr. One hundred mL of
151
Tryptic soy agar (Difco) was prepared according to the product instructions, sterilized by
autoclaving, and cooled to ~45 °C. One mL of the C. albicans inoculum suspension was
transferred to the warm agar and mixed thoroughly by gently swirling to avoid bubbles.
The inoculated agar was then poured into Petri plates (100 × 15 mm). The plates were
allowed to set and were then stored in a refrigerator at 4 °C.
In conducting the disk diffusion assay, each filter paper disk (6.25 mm in
diameter) was impregnated with the sample to be tested (25 or 100 µg/disk). After
evaporation of the solvent, the disk was placed on the agar surface and incubated at rt for
24-96 hr. This same solvent was also used as a control blank for each test. Activity was
reported by measuring the diameter (in mm) of the inhibition zone around each disk. A
stock solution of the control antifungal agent filipin (Sigma Chemical Co.) was used as a
positive control at a level of 25 µg/disk.
General Procedures for Antiinsectan Assays
Antiinsectan assays were developed and conducted by Dr. P. F. Dowd of the
NCAUR. Selection of crude extracts for chemical investigation in search of antiinsectan
metabolites was based on bioactivity against the fall armyworm, Spodoptera frugiperda.
The diet used to feed S. frugiperda was a standard pinto bean diet, consisting of
the following ingredients: 120 g dried pinto beans, 43 g wheat germ, 28 g brewer’s yeast,
8 g Vanderzant’s vitamin mis, 2.8 g ascorbic acid, 1.75 g methylparaben, 0.9 g sorbic
acid, 12 g sugar, 12 g formaldehyde (39%), 1.5 mL propionic-phosphoric acid solution
(42 % propionic acid, 4.2 % phosphoric acid), and 550 mL of water. Crude extracts were
incorporated into the diet at levels of at least 200 ppm. If deemed necessary, column
fractions and pure compounds were sometimes tested at levels of 1000 ppm or more (wet
weight). The samples were added in 125-μL of acetone to test tubes (100 × 16 mm)
containing 5-mL aliquots of molten diet (60 °C). The mixture was then blended with a
vortex mixer for 20 seconds. The diets were dispensed into Petri plates, allowed to cool
152
to rt, and placed in a fume hood for ca. 20 min to remove residual solvent. The diet was
cut into equal blocks (ca. 250 mg each). Each block was placed into a well of a 24-well
immunoassay plate, and then a single neonate S. frugiperda was added to each well. To
prevent desiccation of the diet, a sheet of Parafilm, a sheet of cardboard, and a plastic
cover covered the plate. The cover was secured with rubber bands. A solvent blank
under the same conditions was used as a control.
Bioassays were conducted at 27 °C for seven days at 40% humidity with a 7:5
(light:dark) photoperiod. The insects were inspected at two, four, and seven days for
mortality, and seven-day survivors were weighed. Each sample was tested on a total of
40 nenoate larvae. Antiinsectan activity was measured by comparison of the test larval
weights relative to those of the controls. Data were reported as present reduction in
weight gained relative to controls. Percent mortality was recorded in cases where
mortality was observed.
General Procedures for Antibacterial Assays
Bacillus subtilis
Bacillus subtilis (ATCC 6051) assay plates were prepared every 14 days during
heavy testing cycles or as needed during slow cycles. A sterile spore suspension of B.
subtilis (1 mL sterile H2O added to vial containing a pellet of B. subtilis – LyfoCults by
PMLmicrobiologicals) was prepared. A 250-µL portion of this spore suspension was
then pipetted directly into 100 mL of sterile Penassay seed agar (Difco – prepared as per
product instructions) in a 250-mL Erlenmeyer flask once the agar had cooled to ~ 45 °C.
The flask was gently swirled by hand to mix the spore suspension thoroughly. The agar
was then poured into Petri plates (100 × 15 mm, approximately 5 mL each) and allowed
to solidify before being stored in a refrigerator at 4 °C.
In conducting the assay, sterile filter paper disks (6.25 mm in diameter) were
impregnated with 25 or 100 µg of sample. The solvent used to dissolve the sample was

153
evaporated and the disks were placed on the agar surface of the B. subtilis-seeded Petri
dish. This same solvent was also used as a control blank for each test. The test plates
were incubated at rt for 24-72 hr. The control antibiotic agent gentamycin (Sigma
Chemical Co.) was used as a control at a level of 25 µg/disk.
Staphylococcus aureus
Staphylococcus aureus (ATCC 29213) plates were prepared as needed. A sterile
spore suspension of S. aureus (1 mL sterile H2O added to vial containing a pellet of S.
aureus – LyfoCults by PML Microbiologicals) was prepared. A 250-µL portion of this
spore suspension was then pipetted directly into 100 mL of sterile Tryptic soy agar (Difco
– prepared as per product instructions) in a 250-mL Erlenmeyer flask once the agar had
cooled to ~45 °C. The assay was otherwise conducted and evaluated in the same manner
as the B. subtilis assay.
Escherichia coli
Escherichia coli (ATCC 25922) plates were prepared as needed. One E. coli
bactrol disk (Difco) was dissolved in 50 mL of sterile Difco nutrient broth in a 250 mL
Erlenmeyer flask and the culture was then aerated at 150 rpm for 36-48 hr at rt. One
hundred mL of sterile Tryptic soy agar (Difco) was prepared according to the product
instructions and then cooled to ~45 °C. Two mL of the E. coli inoculum suspension was
transferred to the warm agar and the flask was gently swirled by hand to mix the spore
suspension thoroughly. The assay was otherwise conducted and evaluated in the same
manner as the B. subtilis assay.
In all of the above antibacterial assays, the antimicrobial activity of the sample
was reported by measuring the diameter (in mm) on the inhibition zone around the disk in
which no growth of the test organism was observed.
154
General Procedures for Cell Proliferation Assay
Chronic myelogenous leukemia (K562, 3×10⁴ cell per well), murine melanoma
(B16F10, 3×10³ cell per well), human acute promyelocutic leukemia cells (HL-60, 1×10⁵
cell per well), human breast cancer adenocarcinoma (MDA-MB-231, 5×10³ cell per well)
and hepatocellular carcinoma (Hep3B, 5×10³ cell per well) cells were seeded on 96-well
microplate. Test compounds were dissolved in DMSO at appropriate concentrations and
were treated for 48 hr. Cell proliferation assays were carried out using the Enhanced Cell
Viability Assay Kit EZ-CyTox (Daeil Lab Service Co., Ltd. Korea) protocol. The
absorbance (450 nm) of each well was measured using a Power WaveX 340 (Bio-Tek
Instruments, Winooski, VT).
Procedures for the Isolation and Characterization of
Metabolites from Fungicolous and Marine Isolates of
Aspergillus spp. (MYC-2048 = NRRL 58570
and Aspergillus sp. SF-5044)
Fungicolous Fungal Material
MYC-2048 (= NRRL 58570) was originally obtained by D.T.W. from a
basidioma of Rigidoporus microsporus found on a dead hardwood branch in an alien wet
forest near milepost 7 on Scenic Route 19, Onomea Bay, Hawaii Co., HI, in November,
2002. This isolate was initially identified as Aspergillus flavipes (section Flavipedes)
based on in vitro colony growth and micromorphology. The culture was subjected to
partial sequence analysis of the internal transcribed spacer region (ITS) and domains D1
and D2 of the nuclear large subunit (28S) rDNA gene using ITS5 and NL4 as polymerase
chain reaction and sequencing primers.263,264 A nucleotide-to-nucleotide BLAST query
of the GenBank database (http://www.ncbi.nlm.nih.gov/BLAST) recovered EF669595
Aspergillus sp. NRRL 32683164 (= MYC-1580; NRRL 58569) as the closest match to the
ITS rDNA of NRRL 58570 (100%). This undescribed species of Aspergillus (section
155
Flavipedes) was also initially identified as A. flavipes and also came from our Hawaiian
collection (isolated by D.T.W. from a basidioma of Earliella scabrosa found on a dead
hardwood branch, alien wet forest, Hilo Zoo, Hawaii Co., HI). It was shown to be a
sibling species to the clade containing Aspergillus aureofulgens NRRL 6326, which, in
turn, was originally described from a single known isolate obtained from truffle soil in
France.164 The occurrence of this taxonomically related isolate in truffle soil is intriguing
because this environment is also suggestive of a possible fungicolous origin. These
results suggest that NRRL 58570 and NRRL 32683 represent separate Hawaiian isolates
of the same undescribed species of Aspergillus (section Flavipedes). Because the isolate
that matched has not been taxonomically described, we characterize this isolate at present
only as "Aspergillus sp."
Marine Fungal Material
Aspergillus sp. SF-5044 (deposited at the College of Medical and Life Sciences
fungal strain repository, Silla University) was isolated from an intertidal sediment sample
collected from Dadaepo Beach, Busan, Korea in April, 2006 using procedures that have
been described.162 Analysis of 28S rRNA sequences (Genbank accession number
FJ935999) and a subsequent GenBank search indicated Aspergillus protuberus
(FJ176897) and Aspergillus asperescens (EF652495) as the closest matches, showing
sequence identities of 99.64% and 98.22%, respectively. Therefore, the marine-derived
fungal strain SF-5044 was identified as an Aspergillus sp., but could not be assigned to
species, and is not the same species as the Hawaiian isolate.
Aspergillus sp. MYC-2048 was grown in 2.8 L Fernbach flasks on 100 g of
autoclaved rice for 30 days at 25°C. The EtOAc extract (802 mg) of the resulting
fermentation mixture showed antifungal activity against A. flavus and F. verticillioides.
The extract also caused significant reduction in the growth rate of the fall armyworm.
This fungicolous isolate yielded aflaquinolones A (43) and B (44). Aspergillus sp. SF-
5044 was cultured on 110 petri plates (90-mm), each containing 20 mL of PDA with 3%
156
NaCl. Plates were individually inoculated with 2 mL seed cultures of the fungal strain
and incubated at 25 °C for a period of 10 days. Extraction of the combined agar media
with EtOAc (2 L) provided an organic phase, which was then concentrated in vacuo to
yield 2.0 g of an extract. This marine isolate yielded aflaquinolones C-G (47-51).
Extraction and Isolation of Metabolites
The extract from Aspergillus sp. MYC-2048 (= NRRL 58570) was partitioned
between MeCN and hexanes (~8 mL of MeCN and 3 to 4 successive washes of ~8 mL of
hexanes to remove the fat). A portion (200 mg) of the resulting MeCN fraction (478 mg)
was then chromatographed on a silica gel column using a hexanes/EtOAc/MeOH step
gradient (hexanes, hexanes:EtOAc, EtOAc, EtOAc:MeOH, and MeOH, ratios used:
hexanes, 3:1, 1:1, 1:3, 100% EtOAc, 99:1, 49:1, 19:1 9:1, and 100% MeOH) to give 15
100-mL fractions. Fraction 5 (34 mg), eluted with 1:1 hexanes:EtOAc, was further
separated by reversed-phase HPLC (C18; 25-100% MeCN in H2O over 25 min with UV
detection at 244 nm) to afford trans-dehydrocurvularin (25, 15 mg, tR 19.0 min),127
aflaquinolone A (43; 4 mg, tR 20.4 min), and an additional sample of compound 44 (1
mg, tR 17.0 min). Fraction 6 (14 mg), eluted with 1:1 hexanes:EtOAc, was further
separated by reversed-phase HPLC (C18; 25-100% MeCN in H2O over 25 min with UV
detection at 250 nm) to afford aflaquinolone B (44; 4 mg, tR 17.8 min), aspochalasin J
(29, 3 mg, 24.0 min),130 and additional material of compound 43 (2 mg, tR 20.9 min).
Fraction 8 (19 mg), eluted with 1:3 hexanes:EtOAc, was further separated by reversed-
phase HPLC (C18, 25-100@ MeCN in H2O over 25 min with UV detection at 244 nm) to
afford alantripinone (41, 1 mg, tR 14.1 min)160 and methyl-3,4,5-trimethoxy-2((2-
((3pyridinylcarbonyl)amino)benzoyl)amino)benzoate (42, 2 mg, tR 22.2 min).161
Fraction 10 (17 mg), eluted with 100% EtOAc, contained only aspochalasin I (28).130
The EtOAc extract (2.0 g) of the marine Aspergillus sp. isolate was subjected to
C18 flash column chromatography (5 × 26 cm), eluting with a stepwise gradient of 20%,
40%, 60%, 80%, and 100% (v/v) MeOH in H2O (500 mL each). The fraction eluted at
157
60% MeOH was re-subjected to C18 flash column chromatography (4.5 × 12 cm), eluting
with a stepwise gradient of 20-70% MeOH in H2O (250 mL each, 10% increment from
20%, to 50%, followed by two additional 50% MeOH fractions, 60% MeOH, and 70%
MeOH). The fraction eluted with the first 50% MeOH in H2O elution solvent (29.9 mg)
was further purified by semi-preparative reversed-phase HPLC eluting with a gradient
from 30-60% MeOH in H2O (0.1% formic acid) over 40 min to yield 48 (3.5 mg, tR 30.9
min). The fraction eluted with the second 50% MeOH elution solvent (35 mg) was
purified by semi-preparative reversed-phase HPLC eluting with a gradient from 45-65%
MeOH in H2O (0.1% formic acid) over 65 min to yield compounds 47 (3.4 mg, tR 27.5
min) and 49 (16 mg, tR 25.1 min). The fraction from C18 flash column chromatography
on the crude extract eluted at 80% MeOH (261 mg) was subjected to silica flash column
chromatography (3.5 × 10 cm), eluting with a stepwise gradient of 0% to 20% (v/v)
MeOH in CH2Cl2 (200 mL each, 1% increment for each fraction). The fraction eluted
with 1 % MeOH (30 mg) was further purified by semi-preparative reversed-phase HPLC
eluting with 75% MeOH in H2O (0.1% formic acid) to yield 50 (3.0 mg, tR 19.5 min).
Compound 51 was purified from reversed -phase HPLC of the fraction collected between
1 to 10 min of the above HPLC procedure using a gradient from 50 to 100% MeOH in
H2O (0.1% formic acid) over 50 min (1.5 mg, tR 33.5 min).
All of the known metabolites (25, 28, 29, 41, and 42) were identified by
comparison of their 1H NMR, 13C NMR, and/or MS data with literature values.
Aflaquinolone A (43): pale orange amorphous solid; [α]22D +14 (c 0.19, MeOH);
UV (MeOH) λmax (log ε) 213 (4.3), 233sh (4.2), 278 (4.1), 324 (4.1) nm; CD (MeOH) Δε
220 (+36), 252 (-41), 280 (+16), 286 (+15), 323 (+9.5); 1H and 13C NMR data (CDCl3),
see Table 2; 1H and 13C NMR (400 MHz, acetone-d6) data were the same as 47; HMBC
data (600 MHz, CDCl3): NH → C-2, 3, 5, 9, 10; H-3 → C-2, 4, 5, 11; H-8 → C-5, 6, 7,
10, 17; H-9 → C-4, 5, 6, 7, 10; H-12/16 → C-11, 12/16, 13/15, 14; H-13/15 → C-11,
12/16, 13/15, 14; H-14 → C-11, 12/16, 13/15; H-17 → C-6, 7, 8, 18, 19, 25; H-18 → C-

158
7, 19, 20, 25; Hax-20 → C-18, 19, 21, 22, 25, 26; Heq-20 → C-19, 21, 22, 24; H-21 → C-
20, 22, 26; Hax-23 → C-22, 24; Heq-23 → C-19, 21, 22; Hax-24 → C-19, 23, 25; Heq-24
→ C-19, 21, 22; H3-25 → C-18, 20, 23, 24; H3-26 → C-20, 21, 22; H3-27 → C-3; Key
NOESY data (400 MHz, CDCl3): 4-OH ↔ H3-27; 4-OH ↔ H-3; H-3 ↔ H-12/16, Hax-
20 ↔ H3-25; Heq-20 ↔ H-18; H-21 ↔ H-17; Hax-24 ↔ Heq-23; Hax-24 ↔ H3-25; Heq-
24 ↔ H-17; HRESITOFMS obsd m/z 458.1941 [M+Na]+, calcd 458.1943 for
C26H29NO5Na [M+Na]+.
Aflaquinolone B (44): pale yellow amorphous solid; [α]22D +20 (c 0.14, MeOH);
UV (MeOH) λmax (log ε) 213 (4.3), 233sh (4.1), 278 (4.0), 288sh (3.9), 324 (4.0) nm; CD
(MeOH) Δε 220 (+32), 252 (-39), 280 (+14), 286 (+12), 323 (+7.9); 1H and 13C NMR
data (CDCl3), see Table 2; Key NOESY data (400 MHz; acetone-d6): H-3 ↔ H-12/16;
H-17 ↔ Heq-20; H-17 ↔ H-21; H-17 ↔ Hax-23; H-17 ↔ Heq-24; Additional NOESY
data (400 MHz; CDCl3): 4-OH ↔ H3-27; 4-OH↔H-3; HRESITOFMS obsd m/z
460.2089 [M+Na]+, calcd 460.2091 for C26H31NO5Na [M+Na]+.
Aflaquinolone C (47): pale yellow solid; [α]25D -33 (c 0.30, MeOH); UV (MeOH)
λmax (log ε) 203 (4.2), 212sh (4.1), 235sh (4.0), 278 (3.8), 324 (3.8) nm; CD (MeOH) Δε
220 (+28), 252 (-30), 281 (+11), 286 (+10), 322 (+6.8); 1H and 13C NMR data, see Table
3; HMBC data: H-3 → C-2, 4, 5, 6, 11, 27; H-8 → C-5, 6, 10, 11; H-9 → C-4, 5, 6, 7, 10;
H-12/16 → C-4; H-17 → C-6, 8, 19, 25; H-18 → C-7, 19, 20, 24, 25; H2-20 → C-18, 19,
21, 25, 26; H-21 → C-20, 22, 26; H2-23 → C-22, 24; H2-24 → C-18, 19, 25; H3-25 →
C-18, 19, 20, 24; H3-26 → C-20, 21, 22; H3-27 → C-3; NOESY data: H-3 ↔ H-12/16;
H-17 ↔ H-23ax, H-21; H-23ax ↔ H-24ax, H3-25, H3-26; HRESIMS obsd m/z 434.1954
[M-H]-, calcd for C26H28NO5, 434.1967.
Aflaquinolone D (48): pale yellow solid; [α]25D -10 (c 0.10, MeOH); UV (MeOH)
λmax (log ε) 204 (4.3), 212sh (4.3), 235sh (4.2), 278 (4.0), 323 (4.0) nm; CD (MeOH) Δε
220 (+31), 252 (-32), 282 (+12), 286 (+12), 324 (+7.6); 1H NMR data, see Table 3;
159
NOESY data: H-3 ↔ H-12/16; H-17 ↔ H-20ax; H-20ax ↔ H3-26; H-21 ↔ H3-25; H-
23ax ↔ H3-25; HRESIMS obsd m/z 434.1954 [M-H]-, calcd for C26H28NO5, 434.1967.
Aflaquinolone E (49): white solid; [α]25D -41 (c 1.1, MeOH); UV (MeOH) λmax
(log ε) 208 (4.2), 252 (3.5), 295 (3.5) nm; CD (MeOH) Δε 218 (+19), 245 (-23), 270
(+9.2), 295 (+5.7); 1H and 13C NMR data, see Table 4; HMBC data: H-3 → C-2, 4, 5, 6,
11, 27; H-7 → C-5, 6; H-8 → C-5, 6, 7, 10; H-9 → C-5, 6, 7, 10; H-12/16 → C-4, 11, 14;
H3-17 → C-3; HRESIMS obsd m/z 308.0893 [M+Na]+, calcd for C16H15NO4Na,
308.0899.
Aflaquinolone F (50): white solid; [α]25D +10 (c 0.19, MeOH); UV (MeOH) λmax
(log ε) 208 (4.2), 252 (3.6), 295 (3.5) nm; CD (MeOH) Δε 200 (-9.5), 223 (+13), 252 (-
3.2), 269 (+2.1), 290 (+0.8); 1H and 13C NMR data, see Table 4; HMBC data: H-3 → C-
2, 4, 5, 11; H-6 → C-4, 8, 10; H-7 → C-6, 9; H-8 → C-6, 10; H-9 → C-5, 7; H-12/16 →
C-4; H-13/15 → C-11, 12/16; H-14 → C-12/16; HRESIMS obsd m/z 256.0975 [M+H]+,
calcd for C15H14NO3, 256.0974.
Aflaquinolone G (51): white solid; [α]25D -6 (c 0.18, MeOH); UV (MeOH) λmax
(log ε) 208 (4.2), 253 (3.7), 285sh (3.3) nm; CD (MeOH) Δε 206 (+13), 216 (+14), 235 (-
8.6), 257 (+5.4), 286 (-3.1); 1H and 13C NMR data, see Table 4; HMBC data: H-3 → C-2,
4, 11; H-6 → C-4, 8, 10; H-7 → C-5, 6, 9, 10; H-8 → C-6, 9, 10; H-9 → C-5, 7; H-12/16
→ C-4, 13/15; HRESIMS obsd m/z 278.0788 [M+Na]+, calcd for C15H13NO3Na,
278.0793.
Sodium Borohydride Reduction of Aflaquinolone A (43)
A 0.7-mg sample of aflaquinolone A (43) was transferred to a 0.5-mL Reacti-vial.
To this vial, 0.75 mg of NaBH4 and 75 µL of MeOH were added, and small triangular
stir bar was placed into the vial. The vial was then sealed under Ar and monitored by
TLC (9:1 Et2O:MeOH). After 1 hr, all of the starting material had reacted. The solvent
was then evaporated with air flow and worked-up using aqueous NH4Cl and ether. The
ether layer was collected and evaporated to dryness. 1H NMR analysis of the ether-
160
soluble material indicated the presence of a mixture of products, which was separated by
reversed-phase HPLC (C18, column: 4.6 x 250 mm, 1.0 mL/min, 50 - 100% ACN in H2O
over 25 min), resulting in the collection of two peaks (tR = 11.2 and 12.8 min,
respectively). 1H NMR analysis of the first fraction to elute exhibited signals matching
those of aflaquinolone B (44), indicating that reduction of 43 to 44 had occurred. HPLC
co-injection with a sample of 44 supported this conclusion.
Preparation of Aflaquinolone B (44) Mosher Esters
A solution of 44 (0.2 mg) in CDCl3 (100 µL) was treated with dry pyridine-d6 (10
µL) and R-(-)-α-methoxy-α-(trifluoromethyl)phenylacetyl chloride (R-MTPA-Cl, 5 µL).
The mixture was allowed to react at rt for 24 hr in a Teflon-lined screw-cap vial, resulting
in the S-MTPA ester 44a. An additional 500 µL of CDCl3 was then added directly to the
vial and the resulting solution was placed in a NMR tube for analysis. Analogous
treatment of an additional portion of 44 (0.2 mg) using S-MTPA-Cl afforded the R-
MTPA ester 44b. In both reactions, the pyridine-d6 and MTPA-Cl were in excess.
S-MTPA ester 44a: faint purple oil; Key 1H NMR data (400 MHz, CDCl3) δ
0.736 (d, J = 6.9 Hz, H3-26), 1.29 (m, Hax-23), 1.71 (m, Heq-23).
R-MTPA ester 44b: faint purple oil; Key 1H NMR data (400 MHz, CDCl3) δ
0.822 (d, J = 6.9 Hz H3-26), 1.23 (m, Hax-23), 1.64 (m, Heq-23).
Precise δ values for other potentially relevant signals (e.g., H-21) could not be
established due to signal overlap for both 44a and 44b.
Energy Minimizations and ECD Calculations
All geometry optimizations were performed in gas phase using resolution-of-
identity (RI) approximation and BP functional,58,59 combined with SV(P) basis set265 and
the corresponding auxiliary basis set.266,267 No symmetry constraints were used during
the optimization. Electronic circular dichroism (ECD) spectra were calculated for
geometries obtained from the RI-BP/SV(P) calculations. Time-dependent density
functional (TDDFT) calculations were used with B3LYP functional268,269 using
161
RIJCOSX approximation270 and TZVP basis set265 with the corresponding auxiliary basis
set.266,267 in gas phase and in MeOH solution (COSMO solvation model).271 A total of 80
excited states were calculated and only singlet excited states were considered. All of the
quantum chemical calculations were performed with ORCA version 2.8.272 ECD spectra
were obtained using SpecDis version 1.50 software.273 A broadening factor of 0.24 was
used in an effort to match the resolution level of the experimental data as closely as
possible.
Procedures for the Isolation and Characterization of
Metabolites from a Cryptic Fungicolous Isolate of
Aspergillus sp. (section Flavipedes; MYC-1580 = NRRL 58569)
Fungal Material
The isolate for this study (MYC-1580) was obtained by Dr. D. T. Wicklow from a
basidioma of Earliella scabrosa on a dead hardwood branch that was collected from an
alien wet forest near Hilo Zoo, Hawaii Co., Hawaii on November 12, 2002. Initially, this
isolate was identified as Aspergillus flavipes based on cultural characteristics and
micromorphology following the protocol of Raper and Fennell.274 It was then deposited
with ARS Culture Collection and given the number NRRL = 58569. MYC-1580 was an
undescribed, or cryptic, Aspergillus sp. (section Flavipedes) that is closely associated
with Aspergillus aureofulgens and Aspergillus terreaus.164 Fermentation conditions are
described above and lasted for 30 days at 25 °C. The resulting culture material was then
extracted with EtOAc, affording 371 mg of crude extract upon evaporation of the solvent.
The EtOAc extract showed moderate antifungal activity against F. verticillioides. The
extract also caused significant reduction in the growth rate of fall armyworm when the
crude extract was incorporated into the worm's diet, compared to controls.

162
Extraction and Isolation of Metabolites
The extract was partitioned between MeCN and hexanes (~8 mL of MeCN and 3
to 4 successive washes of ~8 mL of hexanes to remove the fat). The resulting MeCN
fraction (241 mg) was then chromatographed on a Sephadex LH-20 column (Sigma)
using a hexanes/CH2Cl2/acetone/MeOH step gradient (hexanes, hexanes:CH2Cl2,
CH2Cl2:acetone, and MeOH, ratios used: hexanes, 1:4 hexanes:CH2Cl2, 3:2
CH2Cl2:acetone, 1:4 CH2Cl2:acetone, and 100% MeOH) to give 14 50-mL fractions.
The entire fraction 1 (7 mg), eluted with 1:4 hexanes:CH2Cl2, was determined to be the
known compound methyl-3,4,5-trimethoxy-2((2-((3-pyridinylcarbonyl)amino)benzoyl)
amino)benzoate (42).161 Fraction 4 (12 mg), also eluted with 1:4 hexanes:CH2Cl2, was
found to consist of a sample of the known compound aspochalasin J (29).130 Fraction 7
(25 mg), eluted with 3:2 CH2Cl2:acetone, was further separated by reversed-phase HPLC
(C18; 45-100% MeCN in H2O over 25 min at 2.0 mL/min with UV detection at 236 nm)
to afford trans-dehydrocurvularin (25, 3 mg, tR 14.2 min)127 and PF1233B (54, 4 mg, tR
15.5 min). Fraction 8 (67 mg), eluted with 3:2 CH2Cl2:acetone, was further separated by
reversed-phase HPLC (C18; 25-100% MeCN in H2O over 25 min at 2.0 mL/min with UV
detection at 244 nm) to afford alantrypinone (41, 2 mg, tR 13.7 min),160 additional 25 (10
mg, tR 17.1 min), and aspochalasin I (28, 17 mg, tR 20.5 min).130 Fraction 9 (17 mg),
eluted with 3:2 CH2Cl2:acetone, was further separated by reversed-phase HPLC (C18;
25-100% MeCN in H2O over 30 min at 2.0 mL/min with UV detection at 244 nm) to
afford flavipeptide A (53, 2 mg, tR 14.1 min). Fraction 12 (8 mg), eluted with 1:4
CH2Cl2:acetone, was further separated by reversed-phase HPLC (C18; 25-100% MeCN
in H2O over 35 min at 2.0 mL/min with UV detection at 224 nm) to afford 12-
oxocurvularin (58, 1 mg, tR 14.2 min)168 and curvularin (55, 1 mg, tR 15.9 min).167
Fraction 13 (16 mg), eluted with 1:4 CH2Cl2:acetone, was further separated by reversed-
phase HPLC (C18; 25-100% MeCN in H2O over 25 min at 2.0 mL/min with UV
detection at 266 nm) to afford HPLC fraction 2 (6 mg, tR 11.6 min) which was a mixture
163
of α-11-hydroxycurvularin (56) and β-11-hydroxycurvularin (57)168 along with an
additional sample of 25 (1 mg, tR 19.0 min). Fraction 14 (29 mg), eluted with the MeOH
wash, was further separated by reversed-phase HPLC (C18, 50-100% MeOH in H2O over
10 min, 100% MeOH isocratic for 8 min at 2.0 mL/min with UV detection at 308 nm)
yielding four subfractions. HPLC subfractions two and three were recombined (6 mg)
and further separated by reversed-phase HPLC (C18; 70-100% MeOH in H2O over 20
min at 1.0 mL/min with UV detection at 248 nm) yielding two fractions. Subsequent
HPLC subfraction one (4 mg) was further purified by additional reversed-phase HPLC
(Phenyl; 50-100% MeOH in H2O over 25 min at 2.0 mL/min with UV detection at 254
nm) to afford asperlarin A (52, 2 mg, tR 8.0 min). Sephadex fraction 14, subfraction four
(22 mg), was further separated by reversed-phase HPLC (C18; 50-100% MeOH in H2O
over 25 min at 2.0 mL/min with UV detection at 232 nm) to afford and additional sample
of asperlarin A (52, 3 mg, tR 6.4 min) material.
All of the known compounds (25, 28, 29, 41, 42, and 55-58) were identified by
comparison of their 1H NMR, 13C NMR, and/or MS data with literature values.
Asperlarin A (52): light brown oil; [α]22D -55 (c 0.11), MeOH); UV (MeOH) λmax
(log ε) 204 (4.3), 253 (4.0), 309 (3.3) nm; 1H and 13C NMR data, see Table 6;
HRESITOFMS obsd m/z 468.1773 [M-H]-, calcd for C24H26N3O7, 468.1770.
Flavipeptide A (53): white amorphous solid; [α]22D -60 (c 0.10, MeOH); UV
(MeOH) λmax (log ε) 217sh (4.3), 248 (3.9), 286 (3.5) nm; 1H and 13C NMR data, see
Table 7; HRESITOFMS obsd m/z 467.2300 [M+H]+, calcd for C25H31N4O5, 467.2294.
PF1233B (54): yellow oil; [α]22D +70 (c 0.20, MeOH); UV (MeOH) λmax (log ε)
209 (4.4), 235sh (3.7), 245sh (3.5), 300 (3.2) nm; 1H, 13C, and HMBC NMR data, see
Table 8; HRESITOFMS obsd m/z 435.1921 [M+H]+, calcd for C25H27N2O5, 435.1920.
164
Amino Acid Analysis of Asperlarin A (52) and Flavipeptide A (53)
Acid hydrolysis of Asperlarin A (52) and Flavipeptide A (53).
In separate vacuum-sealed hydrolysis tubes, solutions of 52 (0.3 mg) and 53 (0.3
mg) were dissolved in 1.0 mL of 6 N HCl and heated at 110°C for 24 hr. After
completion, each tube was cooled in ice and the solutions were dried down directly in the
hydrolysis tube under a flow of air.
Preparation of trifluoroacetyl (+)-S-sec-butyl ester derivatives.
The absolute configuration of the constituent amino acids of 52 and 53 were
determined by GCMS analysis of the trifluoroacetyl (+)-S-sec-butyl ester derivatives
when compared to authentic D- and L- standards prepared under the same conditions.
The hydrolyzate of 52, still in the hydrolysis tube, was treated with ~1.0 mL of (+)-S-sec-
butanolic HCl. (Preparation of (+)-S-sec-butanolic HCl: 1.0 mL (+)-S-sec-butanol and 35
µL acetyl chloride mixed directly in the hydrolysis tube.) The tube was sealed under
vacuum and the sample was then heated at 110°C for 30 min, cooled in ice, and then
dried down directly in the hydrolysis tube. The product mixture was then dissolved in
1.0 mL of CH2Cl2 and 500 µL of trifluoroacetic anhydride (TFAA), sealed under
vacuum, and then heated at 150°C for 5 min. The resulting solution was removed from
the hydrolysis tube, placed into a vial, and dried to near-completion before 1 mL of
CH2Cl2 was added to prepare for GCMS analysis. The procedure for preparing the
derivatives of the amino acids in the hydrolysate of 53 was exactly the same as above.
The trifluoroacetyl (+)-S-sec-butyl ester derivatives for L-valine and L-proline
(for 52) and L-valine, L-alanine, and N-Me-L-tyrosine (for 53), and well as the D- and L-
mixtures of the corresponding amino acids were also prepared as described above (except
that the acid hydrolysis step was not necessary). The derivatized D- and L- mixtures of
the individual standards resulted in two resolved peaks in the GCMS data for each form
of amino acid. Retention times for the appropriate amino acids include: Alanine (D tR =
7.90 min, L tR = 8.00 min), Proline (D tR = 11.86 min, L tR = 11.93 min), N-Me Tyrosine
165
(D tR = 16.60 min, L tR = 16.67 min), and Valine (D tR = 9.10 min, L tR = 9.23 min).
Co-injection of the L- form of each amino acid with its corresponding D- and L- mixture
enabled identification of the specific form of each amino acid. These derivatives served
as the standards for the GCMS analysis of the derivatized hydrolyzates of 52 and 53.
Procedures for the Isolation and Characterization of
Metabolites from an Endophytic Isolate of
Emericella nidulans (ENDO-3111 = NRRL 58893)
Fungal Material
The isolate for this study (ENDO-3111) was obtained by Dr. D. T. Wicklow on
July 7, 2005 from a wheat seed of the variety “WH-3” produced in Patagonia, Arizona.
The gain sample was purchased from Native Seeds Search in Tucson, Arizona in 2005.
The culture was subsequently identified as Emericella nidulans and was deposited with
the ARS Culture Collection and assigned the accession number NRRL = 58893.
Fermentation conditions are described above and lasted for 30 days at 25 °C. The
resulting culture material was then extracted with EtOAc, affording 442 mg of crude
extract upon evaporation of the solvent. The EtOAc extract showed moderate antifungal
activity against A. flavus and F. verticillioides. The extract also caused significant
reduction in the growth rate of fall armyworm when compared to controls when crude
extract material was incorporated into the diet.
Extraction and Isolation of Metabolites
The extract was partitioned between MeCN and hexanes (~8 mL of MeCN and 3
to 4 successive washes of ~8 mL of hexanes to remove the fat). The resulting MeCN
fraction (245 mg) was then chromatographed on a silica gel column using a
hexanes/CH2Cl2/EtOAc/MeOH step gradient (hexanes, hexanes:CH2Cl2, CH2Cl2,
CH2Cl2:EtOAc, EtOAc, EtOAc:MeOH, and MeOH, ratios used: hexanes, 3:1, 1:1, 1:3,
100% CH2Cl2, 3:1, 1:1, 1:3, 100% EtOAc, 32:1, 19:1, 9:1, 5:1, and 100% MeOH) to give
166
14 150-mL fractions. Fraction 2 (25 mg), eluted with 3:1 hexanes:EtOAc, was further
separated by reversed-phase HPLC (C18; 100% MeCN held isocratically for 15 min at 2.0
mL/min with UV detection at 212 nm) to afford 3-benzyl-4-phenyl-2,5-furadione (63, 1
mg, tR 6.8 min).176 Fraction 2, HPLC subfraction 5 (10 mg), was again separated by
reversed-phase HPLC (Phenyl, 50-100% MeCN in H2O over 25 min at 2.0 mL/min with
UV detection at 240 nm) to afford emindole DA (60, 4 mg, tR 20.8 min).173 Fraction 3
(68 mg), eluted with 3:1 hexanes:EtOAc, was subsequently separated on a similar silica
gel column using a hexanes/CH2Cl2/EtOAc step gradient (hexanes, hexanes:CH2Cl2,
CH2Cl2, CH2Cl2:EtOAc, and EtOAc, ratios used: hexanes, 19:1, 9:1, 4:1, 3:2, 1:1, 1:3,
1:4, 100% CH2Cl2, 3:1, 1:1, 1:3, 100% EtOAc) to give 13 50-mL fractions. The 9th
subfraction (10 mg) from the silica gel column separation of fraction 3, eluted with 100%
CH2Cl2, was identified as an additional sample of 60. The 10th subfraction (26 mg) from
the silica gel separation of fraction 3, eluted with 1:3 EtOAc:CH2Cl2, was further
separated by reversed-phase HPLC (C18; 60-100% MeCN in H2O over 25 min and 100%
MeCN isocratic for 10 min at 2.0 mL/min with UV detection at 234 nm) to afford
microperfuranone (62, 2 mg, tR 13.6 min),175 sterigmatocystin (59, 3 mg, tR 17.2 min),172
and an additional sample of 60 (6 mg, tR 31.2 min). The 11th subfraction (13 mg) from
the silica gel separation of fraction 3, eluted with 1:1 CH2Cl2:EtOAc, was further
separated by reversed-phase HPLC (C18; 50-100% MeCN in H2O over 25 min at 2.0
mL/min with UV detection at 254 nm) to afford silvaticol (64, 2 mg, tR 10.4 min).177,178
Fractions 5 (38 mg), eluted with 1:1 hexanes:EtOAc, and 6 (10 mg), eluted with 1:3
hexanes:EtOAC, were both identified as containing pure emestrin (61).174 Fraction 7
(172 mg), eluted with 1:1 CH2Cl2:EtOAc, was further separated on a similar silica gel
column, as described above, using a hexanes/CH2Cl2/EtOAc step gradient (hexanes,
hexanes:CH2Cl2, CH2Cl2, CH2Cl2:EtOAc, and EtOAc, ratios used: hexanes, 9:1, 5:1,
1.5:1, 1:1, 1:3, 1:4, 100% CH2Cl2, 3:1, 1:1, 1:3, and 100% EtOAc) to give 12 100-mL
fractions. A portion (26 mg) of subfraction 9 (59 mg) was further separated by reversed-

167
phase HPLC (C18; 50-100% MeCN over 25 min and 100% MeCN isocratic for 10 min at
2.0 mL/min with UV detection at 240 nm) to afford O-methylsecoemestrin C1 (66, 2 mg,
tR 18.8 min) and emeridin A (65, 6 mg, tR 25.2 min). Original silica gel fraction 8 (40
mg) was separated using reversed-phase HPLC (C18; 40-100% MeCN over 25 min at 2.0
mL/min with UV detection at 242 nm) to afford 5-(hydroxymethyl)-2,4-
dimethylbenzene-1,3-diol (67, 1 mg, tR 5.6 min) and 5-(hydroxymethyl)-3-methoxy-2,4-
dimethylphenol (68, 6 mg, tR 9.6 min).
All of the known metabolites (59-64) were identified by comparison of their 1H
NMR, 13C NMR, and/or MS data with reported values.
Emeridin A (65): bright yellow amorphous solid; [α]22D -73 (c 0.13, MeOH); UV
(MeOH) λmax (log ε) 289 (4.4) nm; 1H, 13C, and HMBC NMR data, see Table 9;
HRESITOFMS obsd m/z 457.2593 [M+H]+, calcd for 457.2590, C27H37O6.
O-Metylsecoemestrin C1 (66): pale yellow amorphous solid; [α]22D -10 (c 0.40,
MeOH); UV (MeOH) λmax (log ε) 206 (4.6), 218sh (4.5), 256 (4.1), 296 (3.8), 330sh (3.3)
nm; 1H, 13C, and HMBC NMR data, see Table 10; HRESITOFMS obsd m/z 575.0924
[M+Na]+, calcd for C27H24N2O7S2Na, 575.0923.
5-(Hydroxymethyl)-2,4-dimethylbenzene-1,3-diol (67): pale brown oil; UV
(MeOH) λmax (log ε) 209 (4.2), 263 (3.4), 278sh (3.4), 302sh (3.0) nm; 1H and 13C NMR
data, see Table 11.
5-(Hydroxymethyl)-3-methoxy-2,4-dimethylphenol (68): pale brown glass; UV
(MeOH) λmax (log ε) 208 (4.2), 222sh (3.9), 279 (3.3) nm; 1H and 13C NMR data, see
Table 11; HRESITOFMS obsd m/z 165.0919 [M-H2O+H]+, calcd for C10H13O2,
165.0916.
Attempted Chemical Degradations of Emeridin A (65) using OsO4 and KMnO4
The attempted oxidative cleavage of 65 using OsO4 was performed on 0.7 mg of
65. This material (0.0015 moles) was combined with 3 eq. of OsO4 (0.0046 moles; 230
μL of 0.02 M OsO4 in t-BuOH) and a trace of H20 and then placed into a Teflon-capped
168
vial. The mixture was stirred for approximately 26 hr without any visual indications that
a reaction had occurred. The mixture was dried down and analyzed by 1H NMR, which
indicated that the starting material of 65 went unreacted. This recovered material was
used for the attempted KMnO4 reaction described below.
The attempted oxidative cleavage of 65 using KMnO4 was performed on 0.7 mg
of 65. This material (0.0015 moles) was dissolved in 1.5 mL of acetone and placed into a
vial. Approximately 20 eq of NaHCO3 was then added to the solution and stirred
vigorously. KMnO4 (5 eq.; 0.00765 moles, 1.21 mg) was then added and the mixture
was allowed to stir at rt. The initial purple color was expected to dissipate over time,
creating a black precipitate, however no color change or precipitate was observed. The
reaction was allowed to continue for 24 hr, resulting in no visual change. The reaction
was quenched with isopropyl alcohol and filtered through a small silica gel column using
approximately 2 mL of isopropyl alcohol followed by careful addition of 1 mL of a 95%
acetone/5% acetic acid solution. Each of the solvent fractions were collected in separate
vials. 1H NMR analysis of the separated material indicated that the original 65 material
was completely degraded, but no relevant signals for expected products were observed in
either 1H NMR spectrum.
Ozonolysis of Emeridin A (65)
A portion of 65 (0.7 mg) was dissolved in ~4 mL of CH2Cl2 and placed into a
small (15 mL) conical flask. The flask was then chilled to approximately -15 °C in an
NaCl/Ice bath. Working in a hood and behind a blast shield, pure oxygen was bubbled
into the solution for 20 min before the ozonator was enabled. The ozonolysis of 65 was
performed using a Welsbach Ozonator T-408 (115 V, 2.4 A, 60 Hz; Welsbach Ozone
Systems Corp., Philadelphia, PA.). Once the ozonator was switched on, O3 was bubbled
into the solution for 5 min. The ozonator was then switched off and O2 was allowed to
bubble into the solution for 2 min, thus purging any remaining O3. The ozonolysis
products then underwent a reductive work-up with the addition of ~0.5 mL of Me2S to
169
the cold solution. The worked-up solution was swirled for 5 min and then evaporated
under a stream of air. The resulting 1H NMR spectrum strongly suggested that the
products present in the mixture were the products expected (see Scheme 3). For example,
all olefinic signals were absent. Instead, an aldehyde signal was present at δ 9.67, which
would correspond to the anticipated bicyclic subunit product, and the methyl group H3-
25 was shifted downfield to δ 2.40, as would be expected for a methyl ketone that would
arise from the cyclopentanone portion. Unfortunately, efforts to separate this mixture by
HPLC were unsuccessful.
Procedures for the Isolation and Characterization of
Metabolites from Other Fungicolous Fungi
(MYC-1515 = NRRL 54514, MYC-2013 = NRRL 54531, and MYC-1991)
MYC-1515 (= NRRL 54514) Fungal Material
The isolate for this study (MYC-1515) was obtained by Dr. D. T. Wicklow from a
basidioma of Gloephyllum trabeum that formed on a dead hardwood branch in a
Subalpine Dry Forest Pu’u la’au near milepost 43 on Highway 200, Mamane (Sophora),
Hawaii Co., Hawaii on November 12, 2002. The isolate was identified as Trichoderma
longibrachiatum based on cultural characteristics and micromorphology following the
protocol of Samuels,275 and confirmed by a DNA BLAST search. It was deposited with
ARS Culture Collection and assigned the accession number NRRL = 54514.
Fermentation conditions are described above and lasted for 30 days at 25 °C. The
resulting culture material was then extracted with EtOAc, affording 824 mg of crude
extract upon evaporation of the solvent. The EtOAc extract showed modest antifungal
activity against A. flavus and F. verticillioides. The extract also caused reduction in the
growth rate of fall armyworm when compared to controls.
170
Extraction and Isolation of Metabolites
The extract was partitioned between MeCN and hexanes (~8 mL of MeCN and 3
to 4 successive washes of ~8 mL of hexanes to remove the fat). A portion (315 mg) of
the resulting MeCN fraction (368 mg) was then chromatographed on a silica gel column
using a hexanes/CH2Cl2/MeOH step gradient (hexanes, hexanes:CH2Cl2, CH2Cl2,
CH2Cl2:MeOH, and MeOH, ratios used: hexanes, 12:1, 6:1, 4:1, 1.2:1, 1:4, 100%
CH2Cl2, 99:1, 66:1, 32:1, 13:1, 7:1, 4:1, and 100% MeOH) to give 14 200-mL fractions.
A portion (39 mg) of fraction 11 (86 mg), eluted with 13:1 CH2Cl2:MeOH, was further
separated by reversed-phase HPLC (C18; 60-100% MeCN over 25 min at 2.0 mL/min
with UV detection at 248 nm) to give nine subfractions. HPLC subfraction 1 (3 mg) was
purified using an additional reversed-phase HPLC separation (Phenyl; 50-100% MeCN
over 25 min at 2.0 mL/min with UV detection at 212 nm) to afford tetrahydrosorbicillinol
(71, 1 mg, tR 8.8 min) and the known metabolite harzialactone A (72, 1 mg, tR 10.3
min).195 Fraction 12 (7 mg), eluted with 7:1 CH2Cl2:MeOH, contained only the known
compound bisorbibutenolide (73).196
Both of the known compounds (72 and 73) were identified by comparison of
their 1H NMR, 13C NMR, and/or MS data with literature values.
Tetrahydrosorbicillinol (71): pale yellow oil; [α]22D +6 (c 0.04, MeOH); UV
(MeOH) λmax (log ε) 228 (3.7), 264 (3.4), 325sh (2.7) nm; 1H, 13C, and HMBC NMR
data, see Table 12; HRESITOFMS obsd m/z 2.75.1247 [M+Na]+, calcd for C14H20O4Na,
275.1259.
MYC-2013 (= NRRL 54531) Fungal Material
This isolate (MYC-2013) was obtained by Dr. D. T. Wicklow from a white
mycelial growth on the undersurface of a dead hardwood branch in the Costal Mesic
Forest, Casurina, Mackenzie State Park, Puna District, Hawaii on November 5, 2002. It
was identified as Stachybotrys parvispora based on cultural characteristics and
micromorphology following the protocol of Ellis.276 It was then deposited with ARS
171
Culture Collection and assigned the accession number NRRL = 54531. Fermentation
conditions are described above and lasted for 30 days at 25 °C. The resulting culture
material was then extracted with EtOAc, affording 1492 mg of crude extract upon
evaporation of the solvent. The EtOAc extract showed moderate antifungal activity
against F. verticillioides.
Extraction and Isolation of Metabolites
The extract was partitioned between MeCN and hexanes (~8 mL of MeCN and 3
to 4 successive washes of ~8 mL of hexanes to remove the fat). A portion (415 mg) of
the resulting MeCN fraction (1203 mg) was then chromatographed on a silica gel column
using a hexanes/EtOAc/MeOH step gradient (hexanes, hexanes:EtOAc, EtOAc, and
MeOH, ratios used: hexanes, 3:1, 1:1, 1:3, 100% EtOAc, and 100% MeOH) to give 11
150-mL fractions. Fraction 5, eluted with 1:1 hexanes:EtOAc, was further separated by
reversed-phase HPLC (C18; 100% MeCN isocratic for 10 min at 2.0 mL/min with UV
detection at 248 nm) to afford agistatine B (78, 3 mg, tR 7.4 min).202 A portion (17 mg)
of fraction 6 (51 mg) was further separated by reversed-phase HPLC (C18; 100% MeCN
isocratic for 10 min at 2.0 mL/min with UV detection at 248 nm) to yield three
subfractions. HPLC subfraction 3 contained the new metabolite agistatine F (77, 11 mg,
tR 7.2 min). Fraction 10 (38 mg), eluted with 100% EtOAc, was identified as the known
compound parvisporicin (79).201
Both of the known metabolites (77 and 79) were identified by comparison of
their 1H NMR, 13C NMR, and/or MS data with reported values.
Agistatine F (77): colorless oil; [α]22D +82 (c 0.55, MeOH); UV (MeOH) λmax
(log ε) 202 (2.7), 243sh (2.5) nm; 1H, 13C, and HMBC NMR data, see Table 13;
HREIMS obsd m/z 230.1169 [M∙]+, calcd for C11H18O5, 230.1154.
MYC-1991 Fungal Material
The fungal isolate MYC-1991 was isolated by Dr. D. T. Wicklow from black
stroma of a Pyenomycete found on a dead hardwood branch in the Costal Mesic Forest,
172
Casuarina, Mackenzie State Park, Puna District, Hawaii on November 5, 2002. The
isolate is unidentified because the initial culture was found to have died in storage, and
thus could not be sequenced for species identification. Fermentation conditions are
described above and lasted for 30 days at 25 °C. The resulting culture material was then
extracted with EtOAc, affording 472 mg of crude extract upon evaporation of the solvent.
The EtOAc extract showed modest antifungal activity against F. verticillioides.
Extraction and Isolation of Metabolites
The extract was partitioned between MeCN and hexanes (~8 mL of MeCN and 3
to 4 successive washes of ~8 mL of hexanes to remove the fat). The resulting MeCN
fraction (235 mg) was then chromatographed on a silica gel column using a
hexanes/EtOAc/MeOH step gradient (hexanes, hexanes:EtOAc, EtOAc, EtOAc:MeOH,
and MeOH, ratios used: hexanes, 3:1, 1:1, 1:3, 100% EtOAc, 99:1, 49:1, 19:1, 9:1, and
100% MeOH) to give 15 100-mL fractions. Fraction 5 (17 mg), eluted with 1:1
hexanes:EtOAc, afforded the synthetically known compound dihydrosporothriolide
(82).203
Dihydrosporothriolide (82): yellow-orange oil; [α]22D +7 (c 0.90, MeOH); UV
(MeOH) λmax (log ε) 201 (2.8), 221 (2.7), 258sh (2.1), 310sh (2.0) nm; 1H and 13C NMR
data, see Table 14; HRESITOFMS obsd m/z 241.1440 [M+H]+, calcd for C13H21O4,
241.1440.
Procedures for the Isolation and Characterization of
Pseudocitreoindole (23) from MYC-1805 (Penicillium sp.)
Fungal Material
The fungal isolate MYC-1805 was isolated by Dr. D. T. Wicklow from an area of
red mycelial growth on the undersurface of a dead hardwood branch in a Subalpine dry
forest, Pu’u la’au Highway 200 (near milepost 43), Hawaii Co., HI on November 4, 2002.
Fermentation conditions are described above and lasted for 30 days at 25 °C. The

173
resulting culture material was then extracted with EtOAc, affording 1.202 g of crude
extract upon evaporation of the solvent. The EtOAc extract showed modest antifungal
activity against both A. flavus and F. verticillioides, as well as significant ability to
reduce the growth rate of the fallarmyworm (Table 1).
Isolation and Characterization of Pseudocitreoindole (23)
The crude extract (1.202 g), was partitioned between MeCN and hexanes (~8 mL
of MeCN and 3 to 4 successive washes of ~8 mL of hexanes to remove lipids). A portion
(177 mg) of the resulting MeCN fraction (277 mg) was then chromatographed on a silica
gel column using a hexanes/EtOAc/MeOH step gradient (hexanes, hexanes:EtOAc,
EtOAc, EtOAc:MeOH, and MeOH, ratios used: hexanes, 3:1, 1:1, 1:3, 100% EtOAc,
99:1, 49:1, 32:1, 19:1, 9:1, and 100% MeOH) to give 15 100-mL fractions. Fraction 9
(26 mg), eluted with 100% EtOAc, was further separated by reversed-phase HPLC (C18:
25-100% MeCN in H2O over 25 min at 2.0 mL/min with UV detection at 238 nm) to
afford pseudocitreoindole (23, 3 mg, tR 22.4 min). Pseudocitreoindole (23) was
identified by comparison of 1H NMR, 13C NMR, and MS data to reported values.124
In order to unambiguously distinguish 23 from the structurally and
spectroscopically similar known metabolite citreoindole,124 acid hydrolysis was
performed on a portion (0.5 mg) of 23 and the resulting hydrolyzate was derivatized to
afford trifluoroacetyl n-butyl esters of any amino acids present. Conditions for the
preparation of the trifluoroacetyl n-butyl ester derivatives were analogous to those
described above. Through GCMS analysis and comparison to phenylalanine (Phe) and β-
Phe standards, derivatized in the same manner, it was determined that both Phe and β-Phe
were present in the sample of 23, thus distinguishing it from citreoindole, which contains
two units of Phe and no β-Phe unit.

174
Procedures for the Isolation and Characterization of
Stilbene-Derived Phytoalexins Chiricanine A (84)
and Arahypins 1-5 (85-89)
All manipulations of plant material, including the growth of material, inoculation
of peanut seeds by the fungal strains, extractions of viable and nonviable seeds, and all
purifications were performed by Dr. Victor S. Sobolev at the USDA National Peanut
Research Laboratory in Dawson, GA. Structure elucidation and characterization (except
for acquisition of APCI-MSn data) of all purified stilbenoids were performed at the
University of Iowa.
Plant Material
The plant material examined in this study came from the 31-1314 peanut runner
breeding line, 2007 harvest, from the National Peanut Research Laboratory (Dawson,
GA). In order to elicit phytoalexins production from the peanuts, spores of an
Aspergillus caelatus NRRL 25528 (ex type) fungal culture were used. Peanut seeds were
allowed to imbibe distilled water for 16 hr at rt. They were then chopped with a sharp
hand cutter into 3-6 mm pieces, washed with distilled water, blotted with a paper towel,
air-dried to the condition where sliced peanuts did not leave water spots on filter paper,
and placed on stainless steel trays so that the thickness of the layer did not exceed 1 cm.
The trays were evenly sprayed with the fungal spores (see above), placed into autoclave
bags, and incubated at 30 °C for 96 hr. To obtain nonviable peanut material as a control,
a portion of the sliced seeds were placed into distilled boiling water for 90 s, blotted with
a paper towel, and air-dried under sterile conditions. Viable peanut material, as a second
control, was prepared as previously described;217 whole axenic peanut seeds were
aseptically sliced. Nonviable (inoculated and uninoculated) and viable (inoculated and
unincoculated) peanut material was placed into Petri dishes in triplicate (12 dishes total)
and incubated in the same autoclave bag at 30 °C for 96 hr. 1H, MS, and UV-guided
fractionation and identification of this plant material lead to the isolation of the four new

175
compounds (86-89) and identification of two compounds (84 and 85) not reported from
peanuts.
Uninoculated peanut material, the control, was prepared as follows: whole kernels
from the same batch of seeds that were previously used were surface-sterilized by
shaking for 2 min with 2% NaOCl, rinsed three times with sterile distilled H2O, blotted
with a sterile paper towel, and aseptically sliced into 2-3 mm pieces. Control peanut
material was placed into Petri dishes in triplicate and incubated in an autoclave bag at 30
°C for 96 hr. A portion of untreated sliced peanuts, a 2nd control, was kept frozen at -28
°C until the analysis.
Extraction and Isolation
For analytical purposes, 6 g of inoculated and incubated peanut seeds was
aseptically collected from the trays every 24 hr and extracted with 30 mL of MeOH in a
high-speed blender for 1 min. Filtered aliquots of the extracts were then used for direct
determination of target constituents by HPLC. A similar extraction procedure was
applied to the nonviable and viable control sliced seeds.
For preparative isolation of stilbenoids, 1.2 kg of inoculated and incubated peanut
seeds was extracted with 6.0 L of MeOH in a high-speed blender for 1 min (300 mL for
each portion of 60 g of seeds). The combined mixture was filtered through filter paper
under reduced pressure. The solid residue was resuspended in 1.5 L of MeOH, and the
extraction procedure was repeated twice. The combined extracts were filtered through
filter paper and defatted three times with n-hexane. The MeOH layer was evaporated to
dryness. The residue was redissolved in CHCl3 and applied to a chromatographic
column (34 mm i.d.) packed with silica gel. The column was subsequently eluted with
0.3 L of CHCl3, 1.2 L of EtOAc, 1.2 of acetone, and 1.2 L of MeOH. Six fractions were
collected from the column and analyzed by HPLC. HPLC fractions containing similar
stilbenoids of interest were recombined and subjected to further purification on another
silica gel column. This column was eluted with 0.3 L of CHCl3, 1.2 L of CHCl3:EtOAc
176
(1:1), 1.5 L of EtOAc, 0.7 L of acetone, and 0.3 L of MeOH, resulting in nineteen
fractions. Combined fractions containing compounds 84 and 86, 85 and 87, and 88 were
evaporated to dryness on a rotary evaporator, redissolved in MeOH, filtered, and
subjected to purification by preparative HPLC using isocratic mobile phase 1 (see above)
for compounds 84 and 86, mobile phase 2 (see above) for compounds 85 and 87, and
mobile phase 3 (see above) for compound 88, respectively. Combined fractions
containing 89 were dried, redissolved in CHCl3, and subjected to purification on a silica
gel column using the following solvents: 500 mL CHCl3, 250 + 50 mL hexane/acetone,
250 + 70 mL hexane/acetone, 500 + 200 mL hexane/acetone, 250 + 250 mL
hexane/acetone, and 250 + 250 acetone/MeOH. Combined fractions containing purified
compound 89 were dried, redissolved in MeOH, and purified on a prep-HPLC column
using mobile phase 1 (see above). All pure fractions were transferred to separate vials,
dried with a stream of N2, and then placed into a lyophilizer for 2 hr at rt to remove all
traces of solvent.
All manipulations of purified compounds from this source were carried out under
minimal lighting conditions to avoid any possible photoisomerization of the stilbenoid
olefinic double bond.
Chiricanine A (84): slightly yellowish oil; UV (mobile phase 4) λmax (nm) 209,
301sh, 312, 326sh; 1H and 13C NMR data, see Tables 15 and 16; APCI-MS, m/z 281 ([M
+ H]+; rel int 100), 225 (17), APCI-MS2, m/z 281@35: 281 ([M + H]+; rel int 4), 225
(100). The UV, MS, and NMR values agree with published values.222
Arahypin-1 (86): yellowish oil; UV (mobile phase 4) λmax (nm) 217, 327; 1H
and 13C NMR data, see Tables 15 and 16; APCI-MS, m/z 281 ([M + H]+; rel int 100), 225
(21); APCI-MS2, m/z 281@35: 281 ([M + H]+; rel int 3), 225 (100); HRESIMS, obsd m/z
279, 1387, calcd for C19H20O2 – H, 279.2385.
Arahypin-2 (85): yellowish oil; UV (mobile phase 4) λmax (nm) 213, 229sh,
296sh, 306, 217; [α]22D +8.1 (c 0.45; MeOH); 1H and 13C NMR data, see Tables 15 and

177
16; APCI-MS, m/z 331 ([M + H]+; rel int 100), 327 (38), 313 (68), 295 (58), 241 (4);
APCI-MS2, m/z 331@35: 313 ([M + H – H2O]+; rel int 100), 295 (11); UV, MS, and
NMR data matched published values.223
Arahypin-3 (87): yellowish crystals from EtOAc; mp 213-216 °C; UV (mobile
phase 4) λmax (nm) 210, 230sh, 298sh, 306, 320, 335sh; [α]22D +20 (c 0.49; MeOH); 1H
and 13C NMR data, see Tables 15 and 16; APCI-MS, m/z 331 ([M + H]+; rel int 100), 313
(28), 295 (5), 241 (18); APCI-MS2, m/z 331@35: 313 ([M + H – H2O]+; rel int 100), 241
(11); HRESIMS, obsd m/z 329.1390, calcd for C19H22O5 – H, 329.1389.
Arahypin-4 (88): yellowish oil; UV (mobile phase 4) λmax (nm) 206sh, 226sh,
234sh, 301sh, 311, 327sh; [α]22D +9.5 (c 0.25; MeOH); 1H and 13C NMR data, see Tables
15 and 16; APCI-MS, m/z 315 ([M + H]+; rel int 100), 297 (28), 279 (7), 225 (15); APCI-
MS2, m/z 315@35: 297 ([M + H – H2O]+; rel int 100), 225 (7); HRESIMS, obsd m/z
313.1439, calcd for C19H22O4 – H, 313.1440.
Arahypin-5 (89): off-white oil; UV (mobile phase 4) λmax (nm) 217, 270, 339,
346sh; APCI-MS, m/z 295 ([M + H]+; rel int 100); 1H and 13C NMR data, see Tables 15
and 16; Key HMBC correlations, H-2 → C-3, C-4, C-6, and C-7; H-6 → C-2, C-3, C-4,
C-5, and C-7; H-7 → C-1, C-2, and C-6; H-8 → C-1’, C-2’, and C-6’; H-1” → C-3, C-4,
C-5, C-3”, C-4”, and C-5”; H-2” → C-3, C-4, C-3”, C-4”, and C-5 “; H3-4” → C-1”, C-
2”, C-3”, and C-5”; H3-5” → C-1”, C-2”, C-3”, and C-4; APCI-MS2, m/z 295@35: 295
([M + H]+; rel int 100), 267 (36), 253 (16), 201 (47), 175 (4), 159 (5), 107 (5);
HRESIMS, obsd m/z 293.1175, calcd for C19H18O3 – H, 293.1178.
Procedures for the Isolation and Characterization of
Stilbenoid Dimers 90 and 91
Plant Material
The plant material examined in this study again came from the 31-1314 peanut
runner breeding line, 2007 harvest, from the National Peanut Research Laboratory

178
(Dawson, GA). The process in which phytoalexin production was elicited from the
peanut seeds is analogous to process previously described for compounds 84-89 above.
Extraction and Isolation
For preparative isolation of the stilbenoid dimers, 1.1 kg of inoculated and
incubated peanut seeds was extracted with 5.4 L of MeOH (300 mL for each portion of
60 g of seeds) in a high-speed blender for 1 min. The combined mixture was filtered
through a filter paper under reduced pressure. The solid residue was resuspended in 1.4
L of MeOH, and the extraction procedure was repeated two more times. The combined
extract solutions were filtered through a filter paper and defatted three times with 500 mL
of n-hexane. The MeOH layer was then evaporated to dryness. The residue was
redissolved in CHCl3 and applied to a silica gel column. The column was subsequently
eluted with 250 mL of CHCl3 (1 fraction), 1.3 L of EtOAc (3 fractions), 1.1 L of acetone
(1 fraction), and 1.0 L of MeOH (1 fraction). Fractions eluted with EtOAc, containing
dimers 90 and 91, were separately combined, dried, and subjected to further purification
on a similar silica gel column to the one described above. This 2nd column was eluted
with 250 mL of CHCl3, 1.4 L of CHCl3:EtOAc (1:1), 1.2 L of EtOAc, 750 mL of
acetone, and 300 mL of MeOH. One of the fractions from this 2nd column, eluted with
1:1 CHCl3:EtOAc contained 90 and was subjected to a 3rd silica gel column like the one
above. This 3rd column was eluted portion wise (350 mL each) with hexane:acetone (7:1,
6:1, 5:1, 4:1, 3:1, 2:1; 1:1, and 100% acetone), respectively. Combined fractions eluted
from the 3rd column with hexane:acetone 4:1 through 2:1 and containing compound 90
were dried, redissolved in MeOH, filtered, and subjected to prep-HPLC column using
isocratic mobile phase 8 (see above). Combined fractions eluted from the 2nd column
with acetone and MeOH, containing compound 91, were dried, redissolved in MeOH,
filtered, and subjected to prep-HPLC column using isocratic mobile phase 9 (see above).
Fractions from the HPLC and containing pure compounds 90 and 91 were separately

179
dried under streams of N2 after transfer to vials. The vials were then placed into a
lyophilizer for 2 hr at rt to remove any traces of solvent.
Arahypin-6 (90): yellow-brownish glass; UV (CH3OH) λmax (nm) (log ε) 224
(4.71), 272 (4.41), 339 (4.43); 1H, 13C, and HMBC NMR data, see Table 17; ESI-MS,
obsd m/z 607 ([M + H]+; rel int 100); HREIMS, m/z 606.2615 [M]+∙; calcd for C38H38O7,
606.2616.
Arahypin-7 (91): yellow-brownish glass; UV (CH3OH) λmax (nm) (log ε) 224
(4.71), 270 (4.47), 310sh (4.17), 347 (4.42); 1H NMR (acetone-d6, 400 MHz) δ 6.27 (s,
H2-8/12), 5.43 (d, J = 4.3 Hz, H-4a), 4.37 (d, J = 4.3 Hz, H-7a), 2.46 (m, H-15’), 2.39 (m,
H-15), 1.09 (d, J = 6.7 Hz, H3-17), 1.08 (d, J = 6.7 Hz, H3-16), 1.047 (d, J = 6.7 Hz, H3-
16’), 1.046 (d, J = 6.7 Hz, H3-17’). The remaining signals in the 1H NMR spectrum were
severely overlapped in the region from δ 6.61 to 6.84 and could not be distinguished for
accurate assignments. However, integration of this region indicated that the appropriate
number of protons in present. ESIMS, obsd. m/z 623 ([M + H]+; rel int 100); HRESIMS,
obsd. m/z 623.2641 [M + H]+; calcd for C38H38O8 + H, 623.2644.
Procedures for the Isolation and Characterization
of Pterocarpenes 92 and 93
Plant Material
The plant material examined in this study came from the 31-1314 peanut runner
breeding line, 2007 harvest, from the National Peanut Research Laboratory (Dawson,
GA). The process in which phytoalexin production was elicited from the peanut seeds is
analogous to process previously described for compounds 84-89 above.
Extraction and Isolation
Inoculated and incubated peanut seeds (0.8 kg) were extracted with 4 L of MeOH
(250 mL for each 50 g portion of seeds) in a high-speed blender for 1 min. The
combined mixture was filtered through filter paper under reduced pressure. The solid

180
residue was resuspended in MeOH (1.5 L), and the extraction procedure was repeated
twice. The combined extract solutions were filtered through filter paper and defatted
twice with n-hexane (400 mL). The MeOH was then evaporated to dryness. The residue
was resuspended in CHCl3 and applied to a chromatographic column (34 mm i.d.) and
packed with silica gel. The column was subsequently eluted with CHCl3 (200 mL),
CHCl3:EtOAc (500 mL) (1:1), EtOAc (1.0 mL), EtOAc:acetone (600 mL) (1:1), acetone
(1.4 L), and MeOH (800 mL). Fractions eluted with EtOAc and containing 92 and 93
were combined, evaporated to dryness with a rotary evaporator, and subjected to further
purification on a second silica gel column. This column was subsequently eluted with
CHCl3 (100 mL), CHCl3:EtOAc (3:1, 2.5:1, 2:1, respectively), EtOAc (300 mL),
EtOAc:acetone (1:1), acetone (100 mL), and MeOH (300 mL). Three fractions from this
second column with CHCl3/EtOAc and EtOAc, containing 92 and 93, were evaporated to
dryness on a rotary evaporator, redissolved in MeOH, filtered, and subjected to a final
purification on a preparative HPLC column. Compound 92 was isolated using mobile
phase 12 (see above) and 93 was isolated using mobile phase 13 (see above).
Fractions obtained from HPLC and containing chromatographically-pure 92 were
evaporated with a rotary evaporator to near complete dryness. The remaining aqueous
mixture containing 92 was extracted four times with EtOAc (H2O/EtOAc, 3:2). The
combined EtOAc layers were evaporated nearly to dryness. The residue was transferred
into a 16 mL vial with MeOH and dried under a stream of N2. The residues were
redissolved in acetone, filtered, transferred into a 4 mL vial, and once again dried under a
stream of N2. The vial was then placed into a lyophilizer for 2 hr at rt to remove traces of
solvent, affording 92 (5 mg) as a yellowish glass.
HPLC fractions containing chromatographically-pure 93 were concentrated with a
rotary evaporator to near dryness. Compound 93 gradually emerged as an off-white solid
precipitate. The solution was placed into a refrigerator at 4 °C for 6 hr, and then the
resulting precipitate was collected, resuspended in H2O, and transferred into a 16 mL
181
vial. The vial was centrifuged at 4000 rpm for 10 min, the supernatant was decanted, and
the precipitate was collected into a small vial, which was placed in a freezer for 2 hr. The
frozen suspension of 93 in water was lyophilized overnight to obtain a pure sample of 93
(10 mg) as a fluffy off-white solid.
Aracarpene-1 (92): yellowish glass; UV (mobile phase 12): λmax (nm) 217, 243sh,
314, 327, 342sh, 380, 670; UV (MeOH) λmax (log ε) 227 (4.29), 250sh (4.10), 319sh
(4.23), 330 (4.27), 345sh (4.07); 1H, 13C, and HMBC NMR data, see Table 18; Positive
ESIMS m/z 302 (rel int 14%), 301 ([M + H]+; 80), 300 (100), 299 (29), 285 (15).
Positive ESIMS2 m/z 301@38: 301 ([M + H]+; rel int 17%), 286 (23), 285 (100), 283
(25); Negative ESIMS2 m/z 299@35: 299 ([M - H]-; rel int 15%), 284 (100); Positive
ESIMS3 m/z 301@40 → 285@40: 285 (rel int 35), 266 (16), 257 (22), 240 (18), 239
(100); Negative ESIMS3 m/z 299@40 → 284@40: 284 (rel int 100), 256 (96), 228 (37);
HRESIMS [M]+⋅ at m/z 300.0629, calcd for C16H12O6, 300.0633.
Aracarpene-2 (93): off-white powder; UV (mobile phase 13): λmax (nm) 314, 326,
342sh, 402, 639; UV (MeOH) λmax (log ε) 223 (4.40), 313 (4.26), 329 (4.35), 346
(4.24); 1H, 13C, and HMBC NMR data, see Table 18; Positive ESIMS m/z 302 (rel int
11%), 301 ([M + H]+; 82), 300 (100), 299 (41), 97 (26); Positive ESIMS2 m/z 301@40:
301 ([M + H]+; rel int 54%), 300 (21), 299 (100), 286 (10), 285 (41), 284 (12), 283 (41),
282 (23), 272 (9), 255 (9), 254 (12), 245 (8); Negative ESIMS2 m/z 299@40: 299 ([M –
H]-; rel int 26%), 284 (100), 271 (48), 256 (7), 243 (5); Positive ESIMS3 m/z 301@40 →
285@40: 285 (rel int 26), 255 (20), 239 (100); Negative ESIMS3 m/z 299@40 →
284@40: 284 (rel int 84), 256 (100), 240 (10), 228 (62), 227 (28); HRESIMS [M]+⋅ at
m/z 300.0636, calcd for C16H12O6, 300.0633.
182
APPENDIX
SELECTED NMR SPECTRA
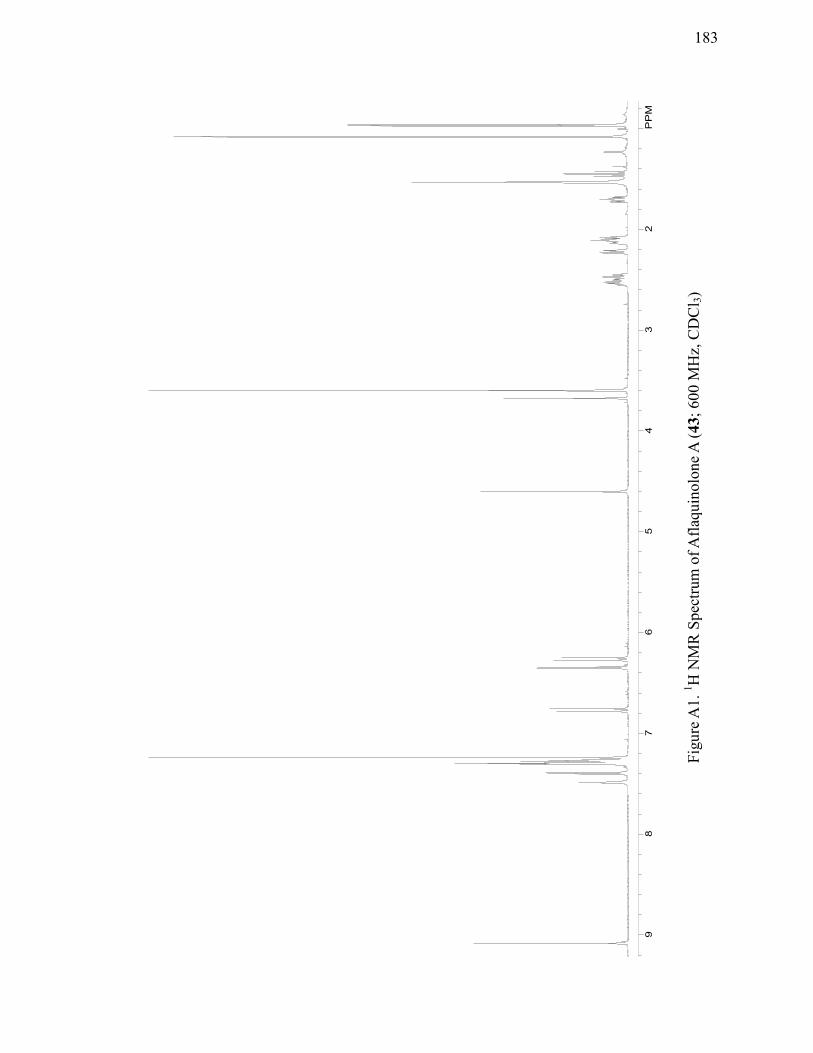
183
Figu
re A
1. 1 H
NM
R S
pect
rum
of A
flaqu
inol
one A
(43;
600
MH
z, C
DC
l 3)
98
76
54
32
PP
M

184
Figu
re A
2. 13
C N
MR
Spe
ctru
m o
f Afla
quin
olon
e A (4
3; 1
00 M
Hz,
CD
Cl 3)
200
150
100
50
PP
M

185
98
76
54
32
PP
M
Figu
re A
4. 1 H
NM
R S
pect
rum
of A
flaqu
inol
one
B (4
4; 4
00 M
Hz,
Ace
tone
-d6)
Figu
re A
3. 1 H
NM
R S
pect
rum
of A
flaqu
inol
one
B (4
4; 4
00 M
Hz,
CD
Cl 3)
98
76
54
32
PP
M
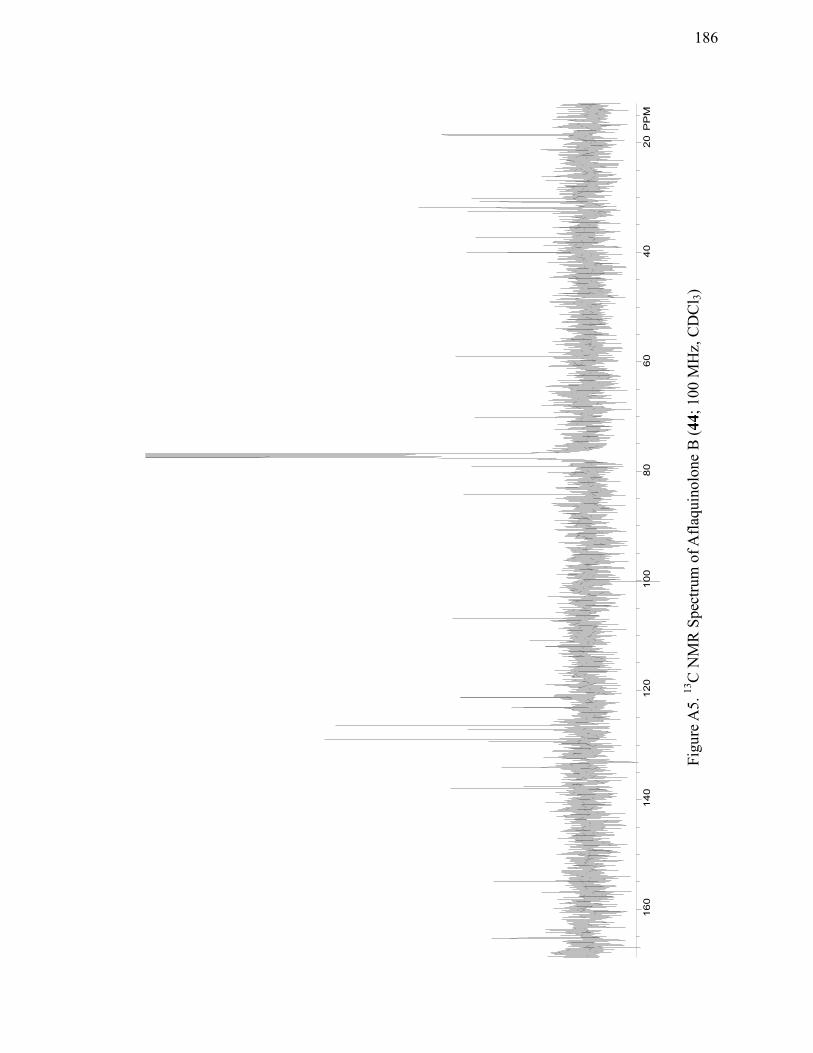
186
Figu
re A
5. 13
C N
MR
Spe
ctru
m o
f Afla
quin
olon
e B
(44;
100
MH
z, C
DC
l 3)
160
140
120
100
80
60
40
20
PP
M
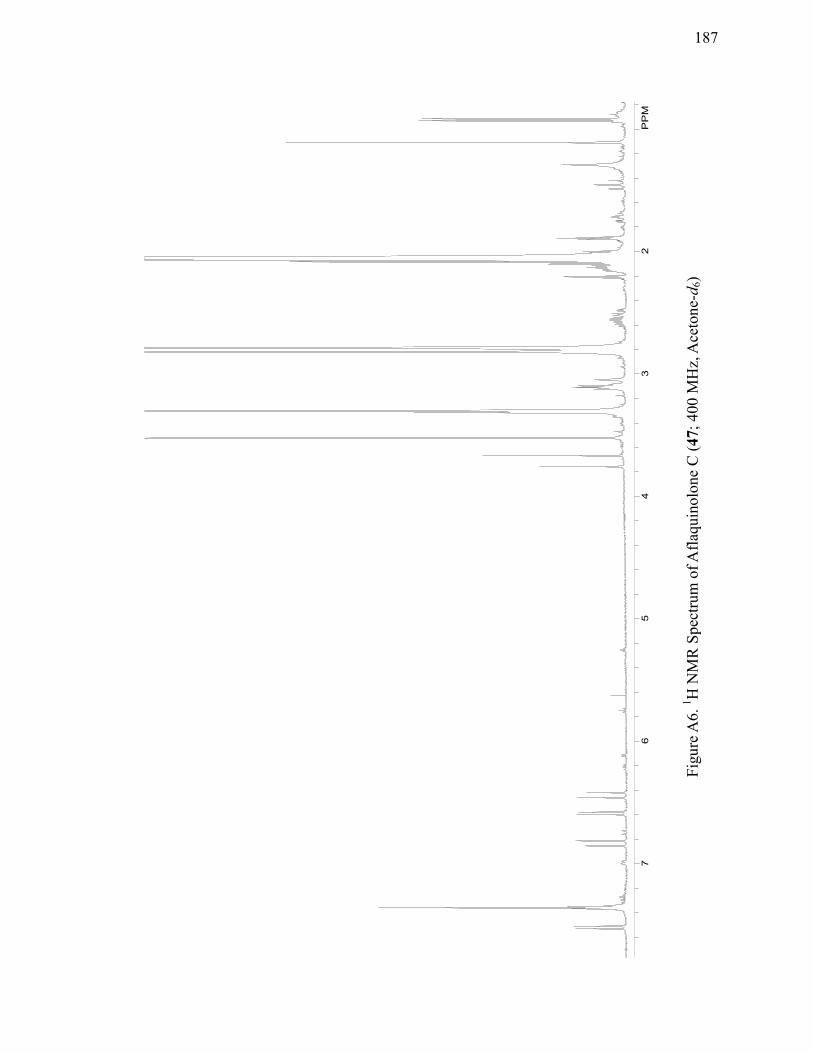
187
76
54
32
PP
M
Figu
re A
6. 1 H
NM
R S
pect
rum
of A
flaqu
inol
one
C (4
7; 4
00 M
Hz,
Ace
tone
-d6)

188
Figu
re A
7. 13
C N
MR
Spe
ctru
m o
f Afla
quin
olon
e C
(47;
100
MH
z, A
ceto
ne-d
6)
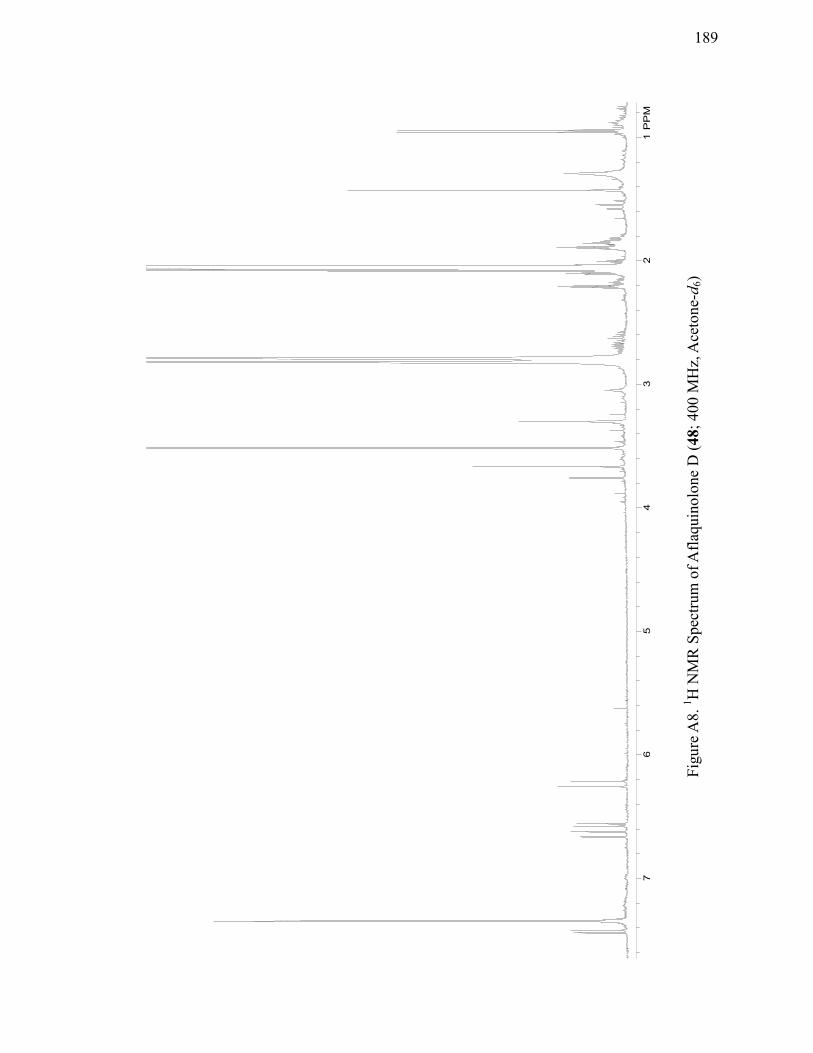
189
Figu
re A
8. 1 H
NM
R S
pect
rum
of A
flaqu
inol
one
D (4
8; 4
00 M
Hz,
Ace
tone
-d6)
76
54
32
1P
PM
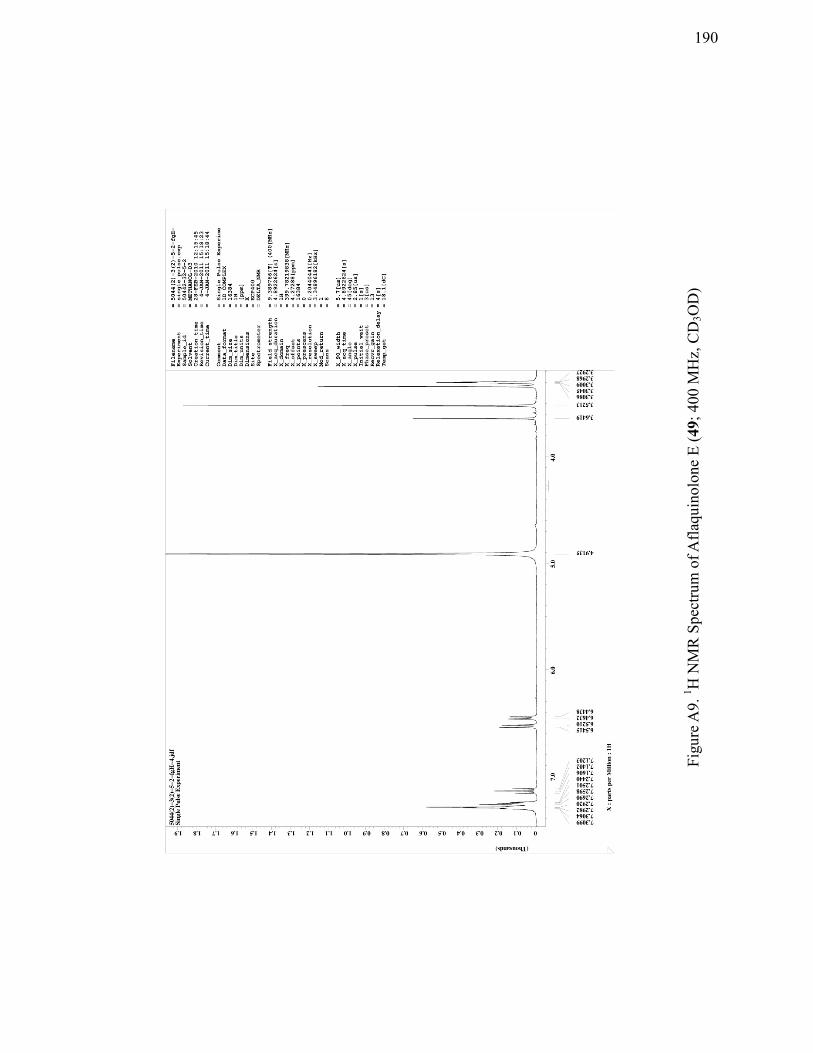
190
Figu
re A
9. 1 H
NM
R S
pect
rum
of A
flaqu
inol
one
E (4
9; 4
00 M
Hz,
CD
3OD
)
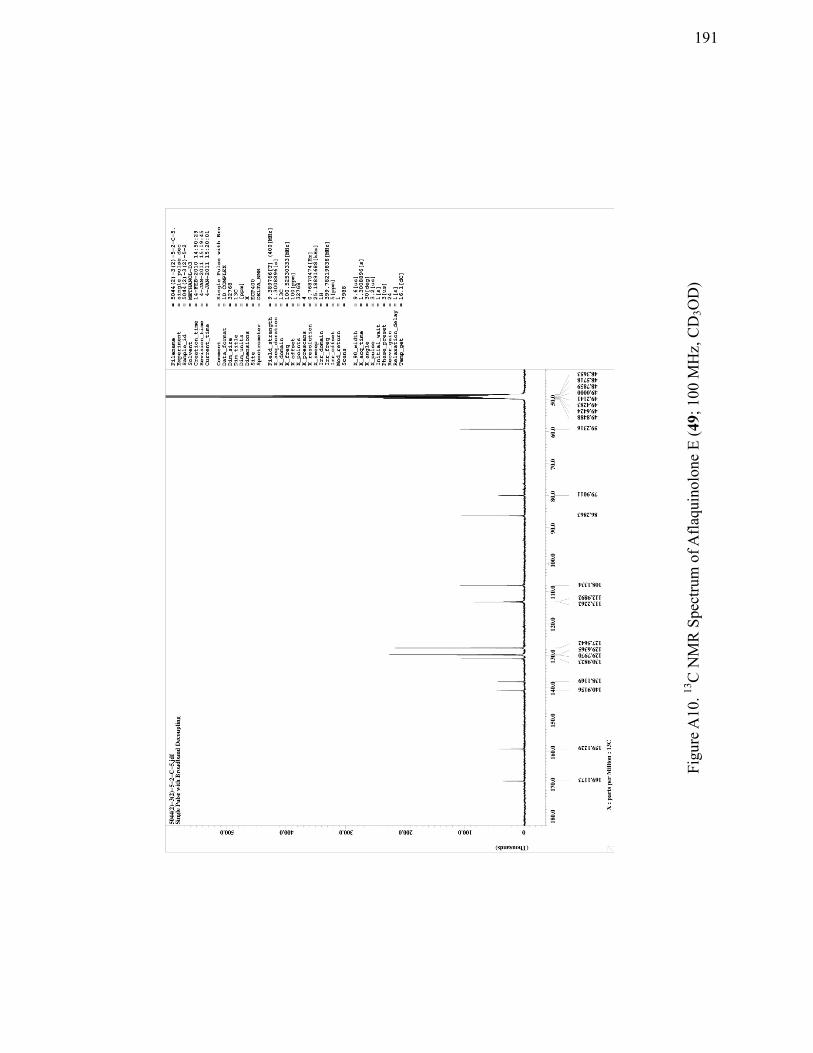
191
Figu
re A
10. 13
C N
MR
Spe
ctru
m o
f Afla
quin
olon
e E
(49;
100
MH
z, C
D3O
D)

192
Figu
re A
11. 1 H
NM
R S
pect
rum
of A
flaqu
inol
one
F (5
0; 4
00 M
Hz,
CD
3OD
)
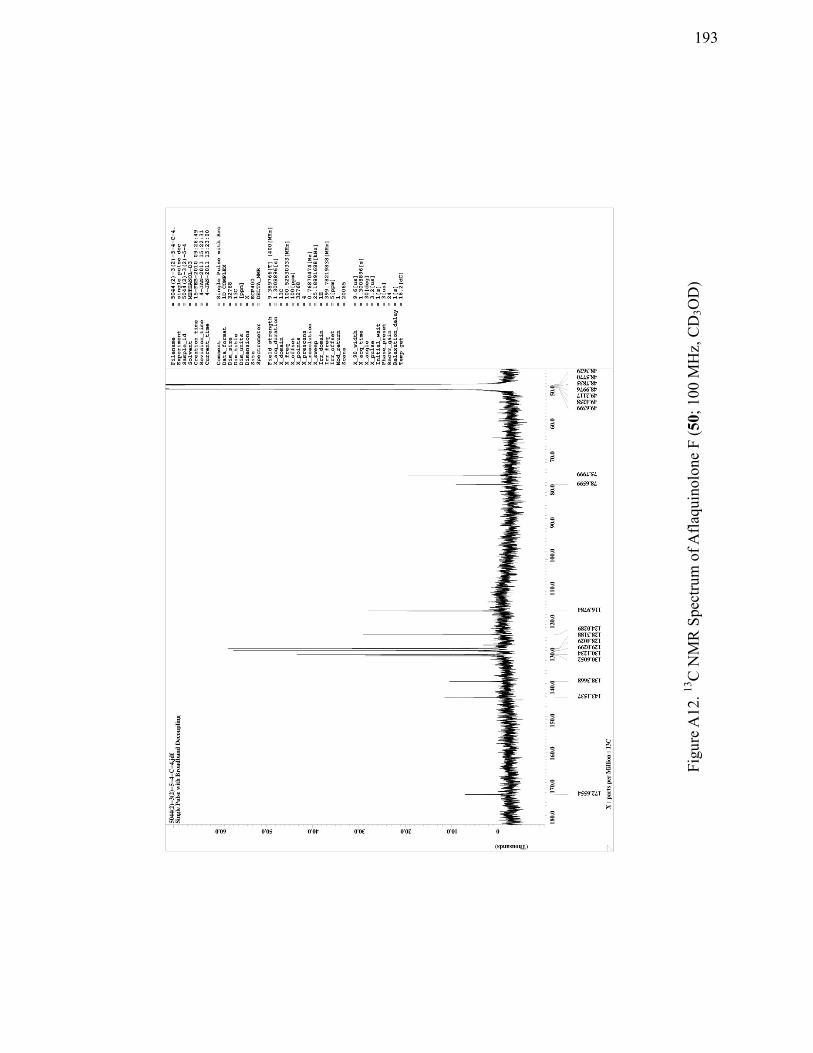
193
Figu
re A
12. 13
C N
MR
Spe
ctru
m o
f Afla
quin
olon
e F
(50;
100
MH
z, C
D3O
D)
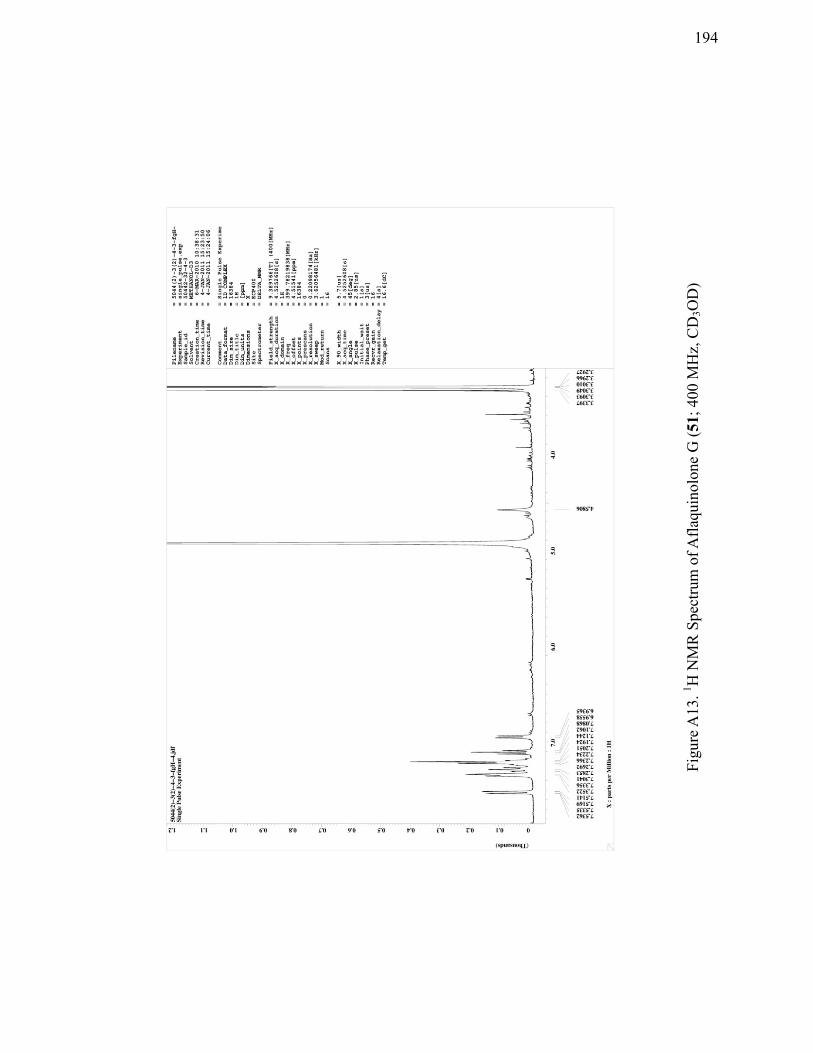
194
Figu
re A
13. 1 H
NM
R S
pect
rum
of A
flaqu
inol
one
G (5
1; 4
00 M
Hz,
CD
3OD
)
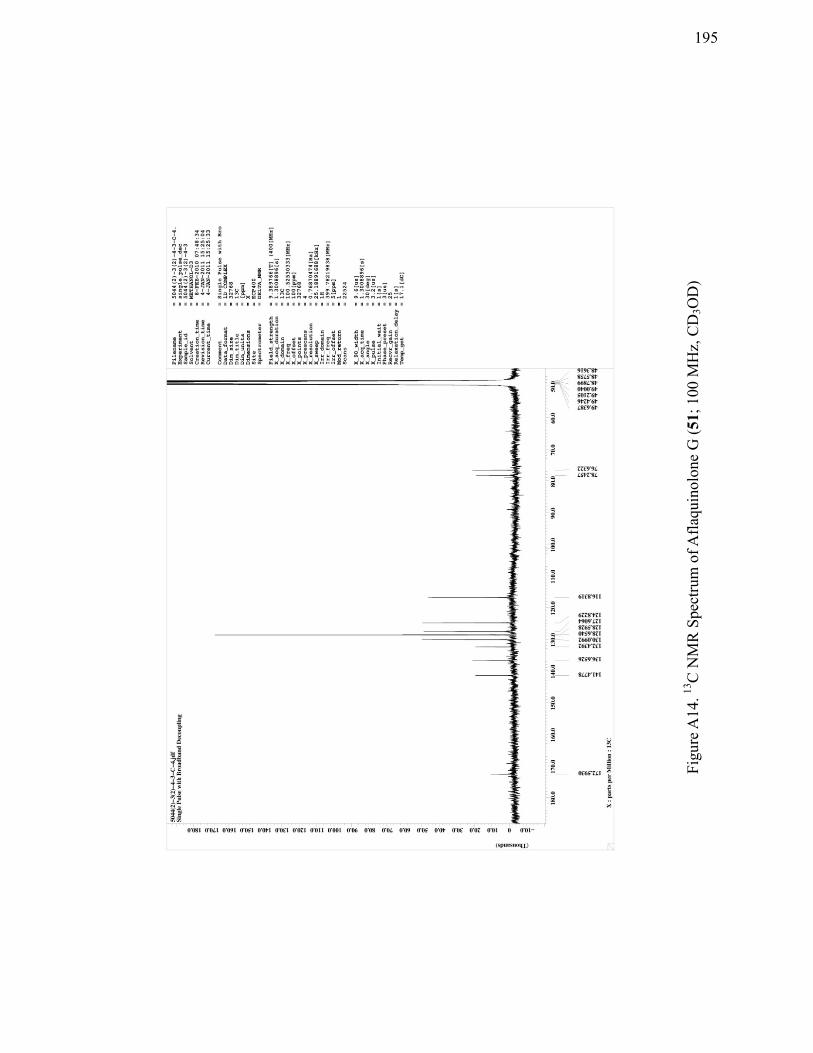
195
Figu
re A
14. 13
C N
MR
Spe
ctru
m o
f Afla
quin
olon
e G
(51;
100
MH
z, C
D3O
D)

196
76
54
32
PP
M
Figu
re A
15. 1 H
NM
R S
pect
rum
of A
sper
larin
A (5
2; 4
00 M
Hz,
CD
3OD
)

197
1
80
160
140
120
100
80
60
40
20
PP
M
Figu
re A
16. 13
C N
MR
Spe
ctru
m o
f Asp
erla
rin A
(52;
100
MH
z, C
D3O
D)

198
98
76
54
32
1P
PM
Figu
re A
17. 1 H
NM
R S
pect
rum
of F
lavi
pept
ide A
(53;
400
MH
z, A
ceto
ne-d
6)
4.55
4.50
4.45
4.40
4.50
4.45
Sam
e R
egio
n A
fter
Com
plet
e Ex
chan
ge in
CD
3OD
Ex
pans
ion
of R
egio
n at
δ 4
.48
Sho
win
g Pa
rtial
Exc
hang
e

199
Figu
re A
18. H
MB
C S
pect
rum
of F
lavi
pept
ide A
(53;
600
MH
z, A
ceto
ne-d
6)
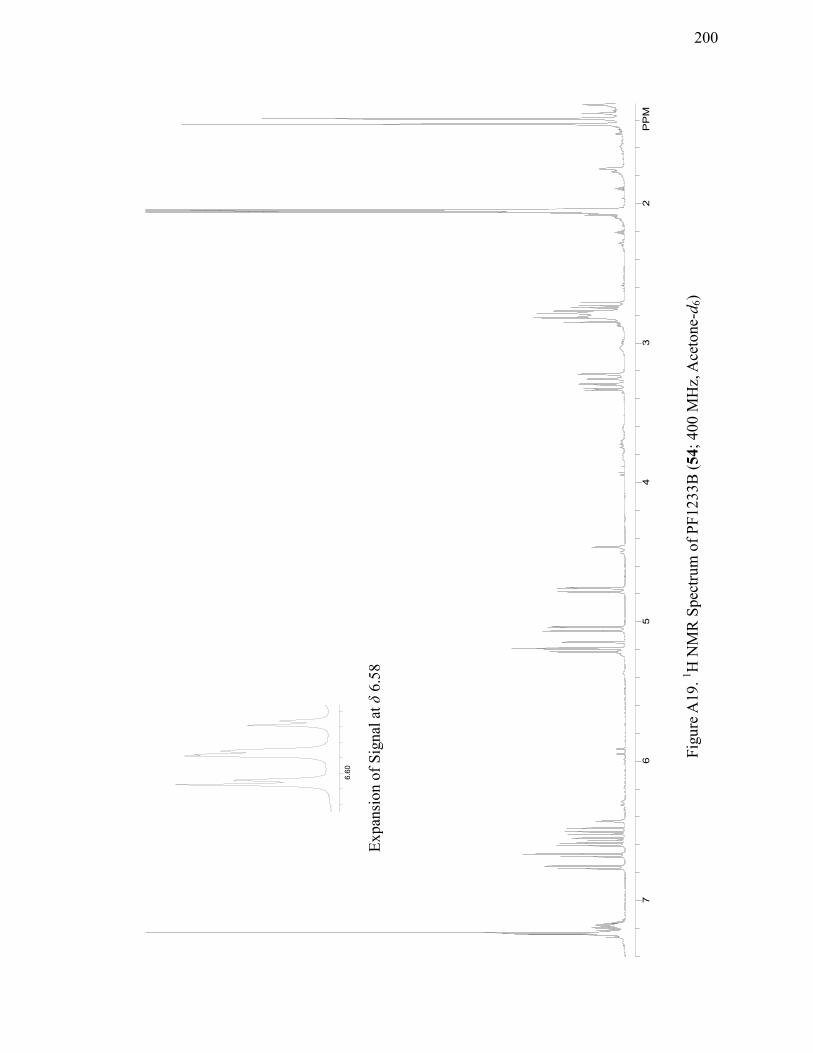
200
76
54
32
PP
M
Figu
re A
19. 1 H
NM
R S
pect
rum
of P
F123
3B (5
4; 4
00 M
Hz,
Ace
tone
-d6)
6.60
Expa
nsio
n of
Sig
nal a
t δ 6
.58
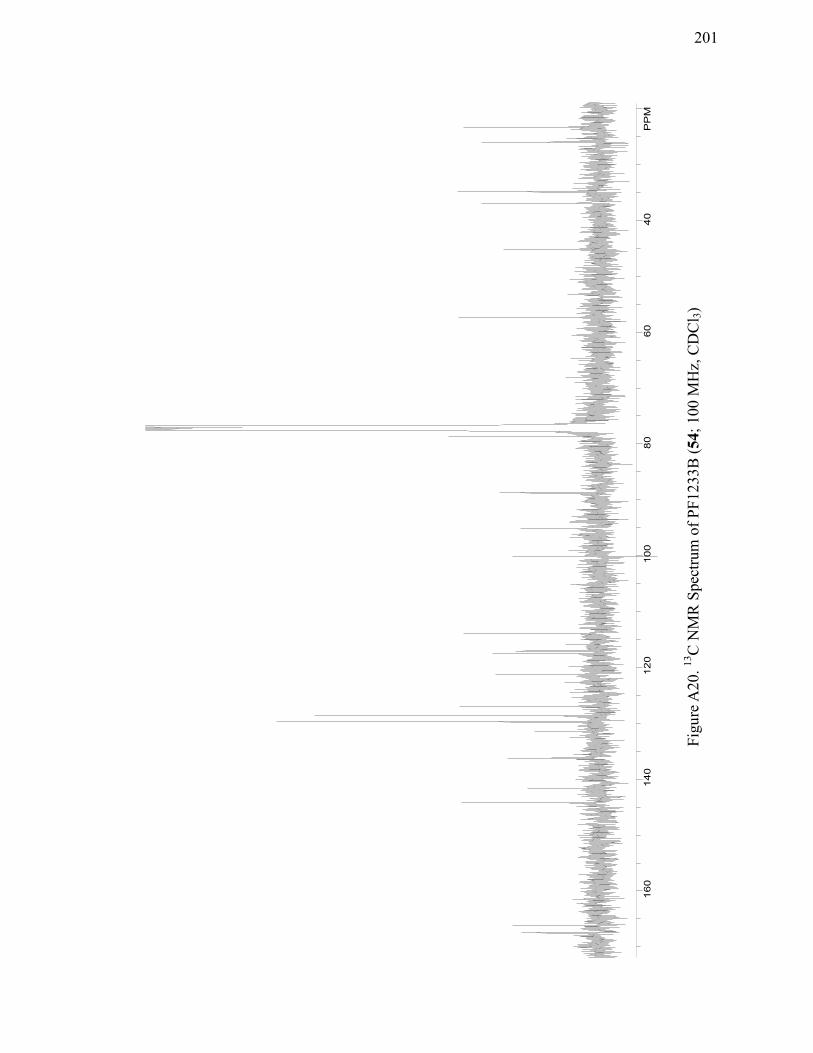
201
160
140
120
100
80
60
40
PP
M
Figu
re A
20. 13
C N
MR
Spe
ctru
m o
f PF1
233B
(54;
100
MH
z, C
DC
l 3)

202
65
43
21
PP
M
Figu
re A
21. 1 H
NM
R S
pect
rum
of E
mer
idin
A (6
5; 4
00 M
Hz,
CD
Cl 3)

203
200
150
100
50
PP
M
Figu
re A
22. 13
C N
MR
Spe
ctru
m o
f Em
erid
in A
(65;
100
MH
z, C
DC
l 3)
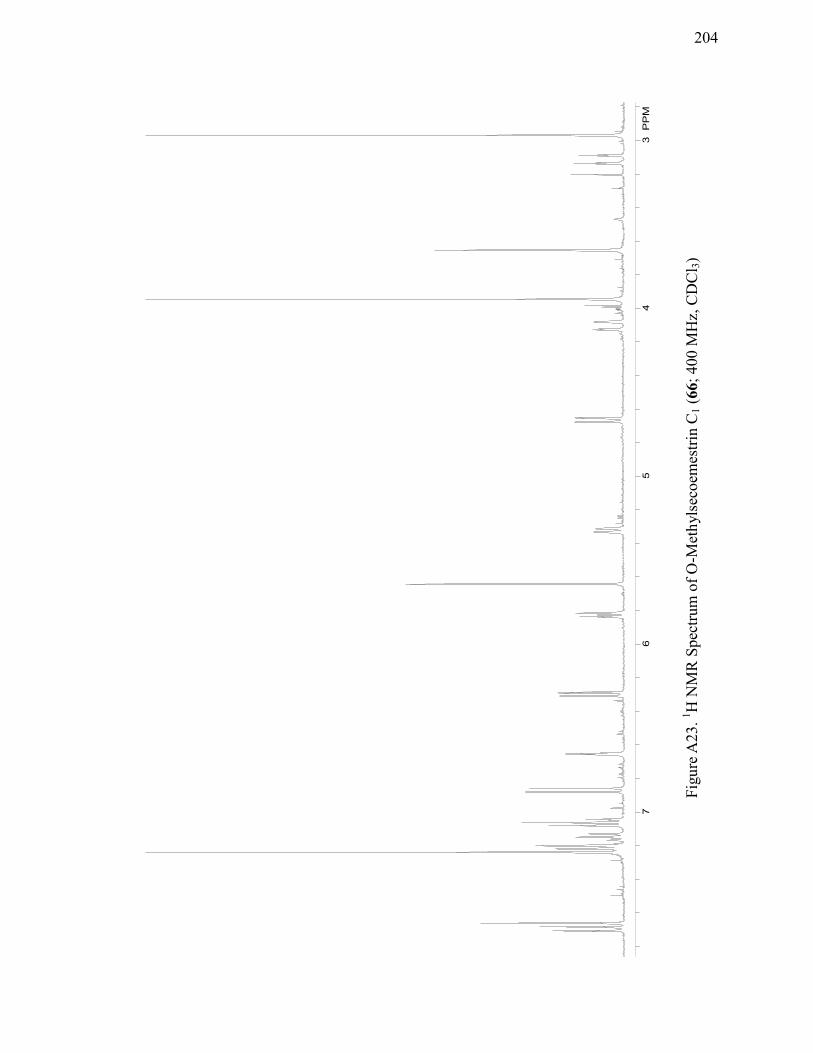
204
76
54
3P
PM
Figu
re A
23. 1 H
NM
R S
pect
rum
of O
-Met
hyls
ecoe
mes
trin
C1 (
66; 4
00 M
Hz,
CD
Cl 3)

205
Figu
re A
24. H
MB
C S
pect
rum
of O
-Met
hyls
ecoe
mes
trin
C1 (
66; 6
00 M
Hz,
CD
Cl 3)
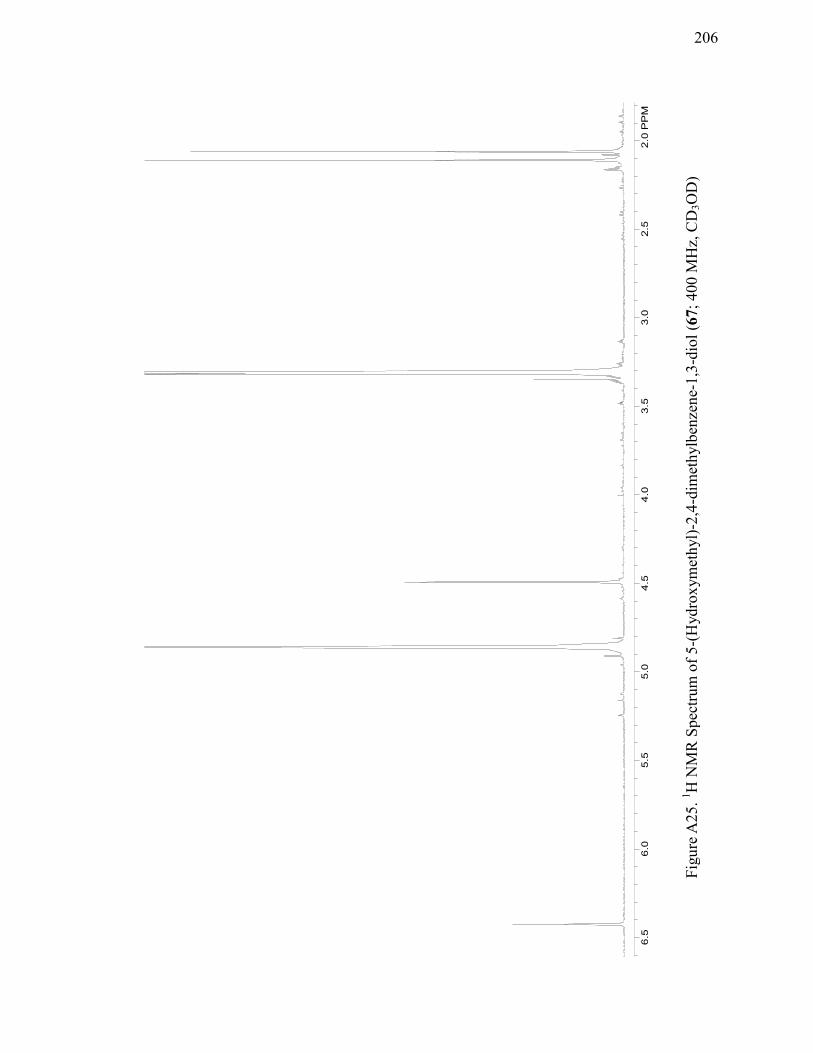
206
6
.56.0
5.5
5.0
4.5
4.0
3.5
3.0
2.5
2.0
PP
M
Figu
re A
25. 1 H
NM
R S
pect
rum
of 5
-(H
ydro
xym
ethy
l)-2,
4-di
met
hylb
enze
ne-1
,3-d
iol (
67; 4
00 M
Hz,
CD
3OD
)

207
Figu
re A
26. H
MB
C S
pect
rum
of 5
-(H
ydro
xym
ethy
l)-2,
4-di
met
hylb
enze
ne-1
,3-d
iol (
67; 6
00 M
Hz,
CD
3OD
)
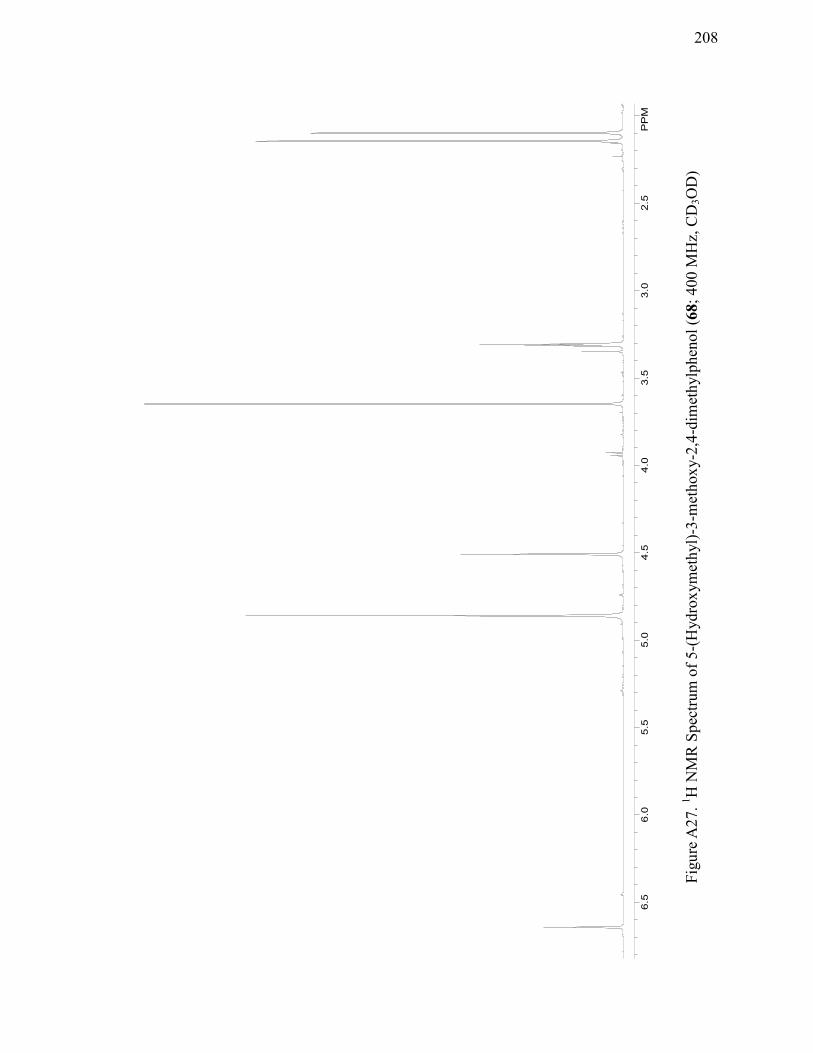
208
6.5
6.0
5.5
5.0
4.5
4.0
3.5
3.0
2.5
PP
M
Figu
re A
27. 1 H
NM
R S
pect
rum
of 5
-(H
ydro
xym
ethy
l)-3-
met
hoxy
-2,4
-dim
ethy
lphe
nol (
68; 4
00 M
Hz,
CD
3OD
)
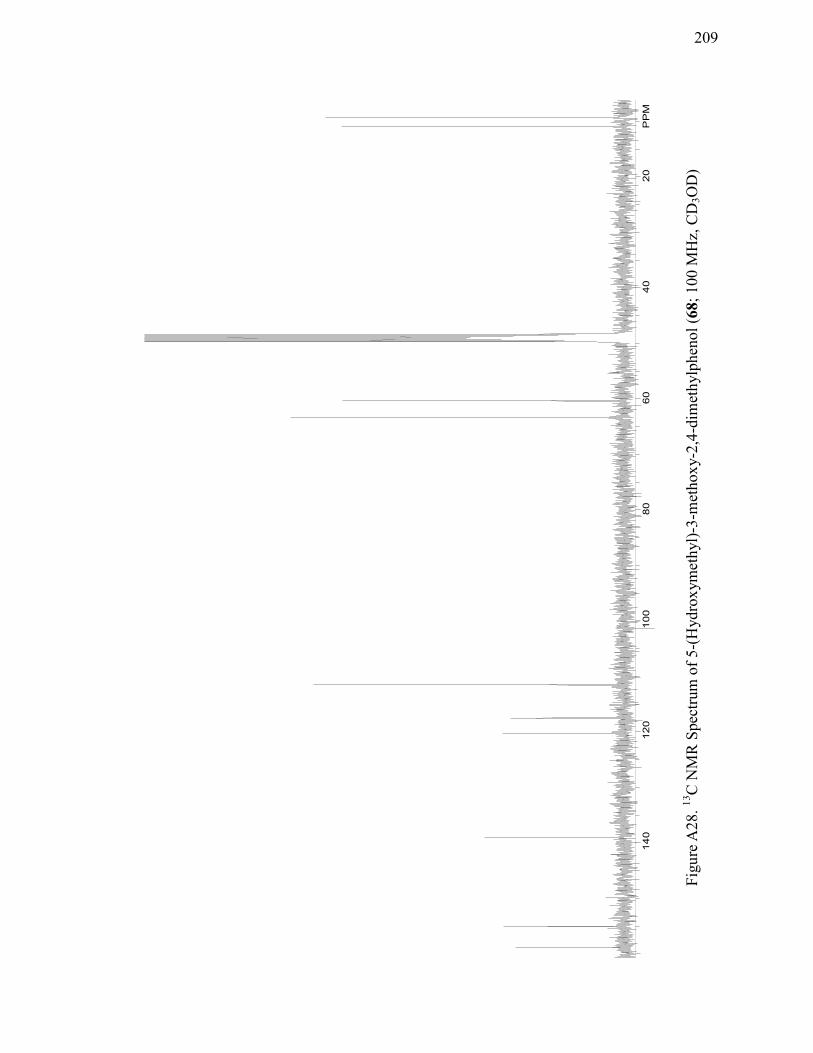
209
140
120
100
80
60
40
20
PP
M
Figu
re A
28. 13
C N
MR
Spe
ctru
m o
f 5-(
Hyd
roxy
met
hyl)-
3-m
etho
xy-2
,4-d
imet
hylp
heno
l (68
; 100
MH
z, C
D3O
D)
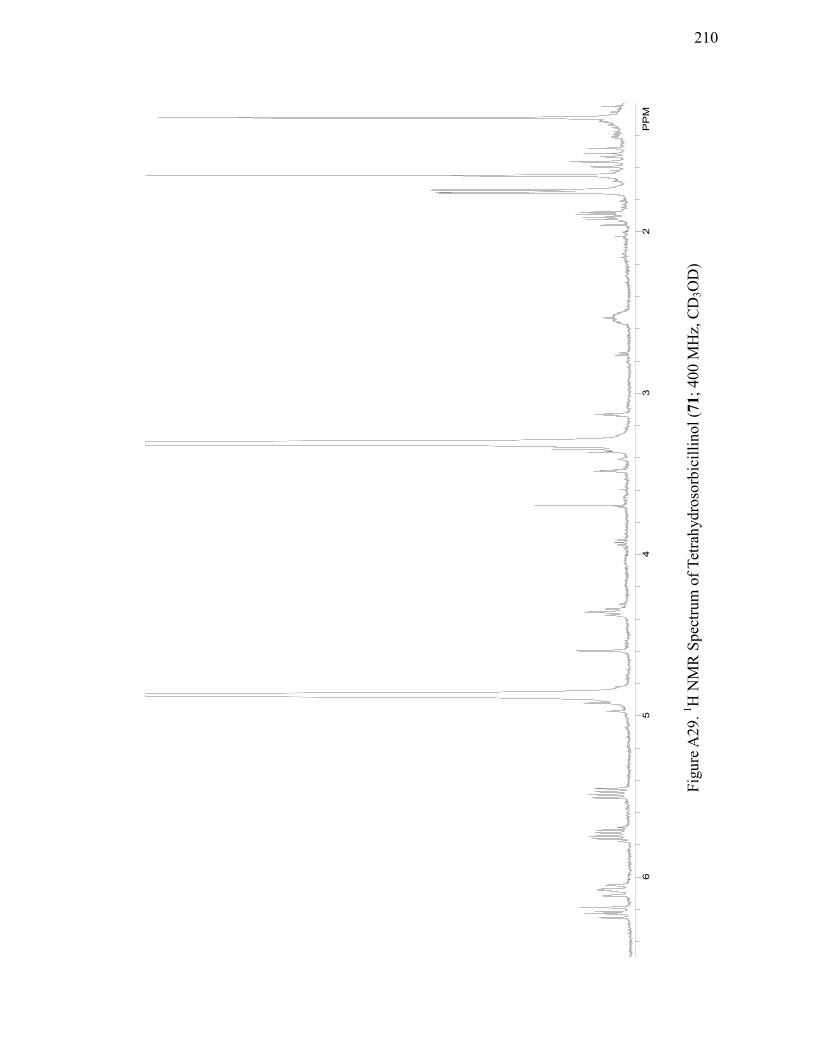
210
65
43
2P
PM
Figu
re A
29. 1 H
NM
R S
pect
rum
of T
etra
hydr
osor
bici
llino
l (71
; 400
MH
z, C
D3O
D)
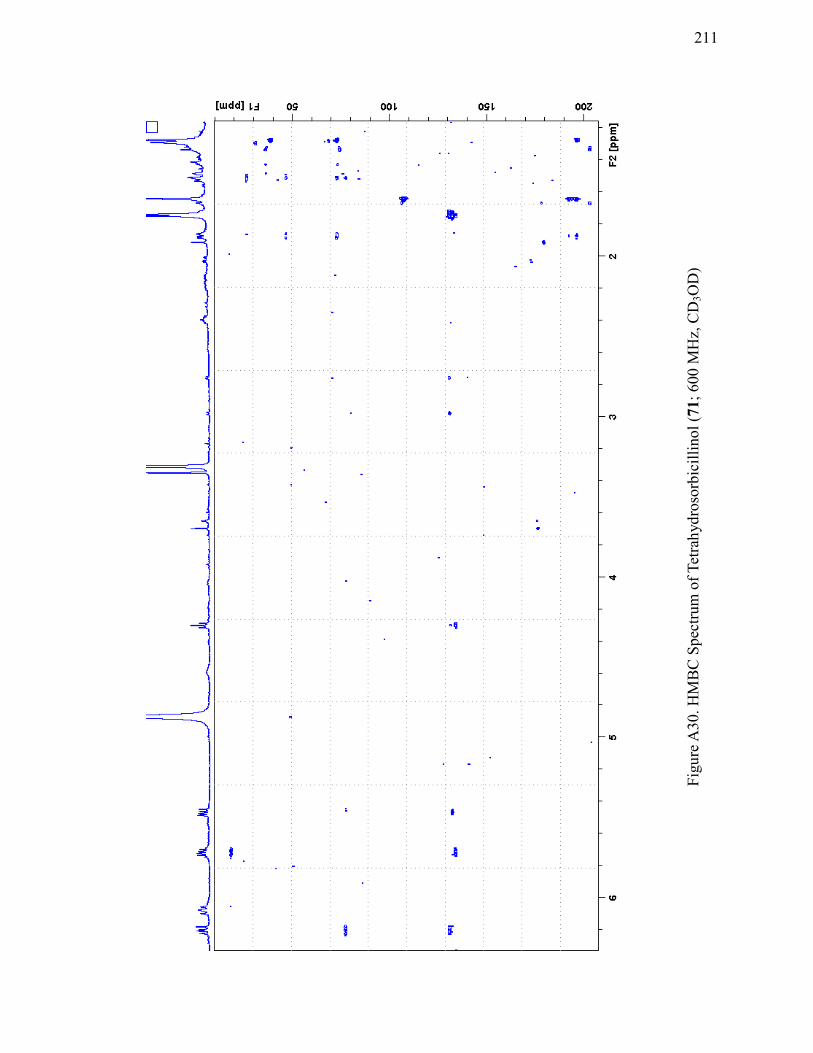
211
Figu
re A
30. H
MB
C S
pect
rum
of T
etra
hydr
osor
bici
llino
l (71
; 600
MH
z, C
D3O
D)
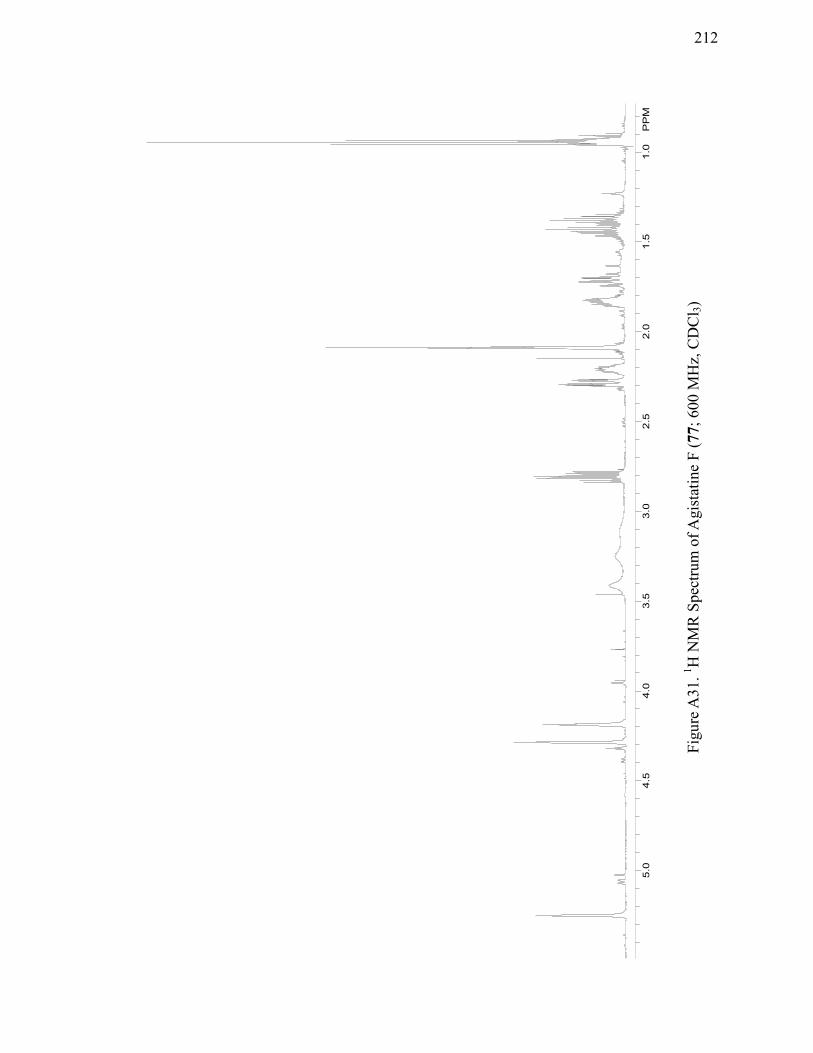
212
5.0
4.5
4.0
3.5
3.0
2.5
2.0
1.5
1.0
PP
M
Figu
re A
31. 1 H
NM
R S
pect
rum
of A
gist
atin
e F
(77;
600
MH
z, C
DC
l 3)
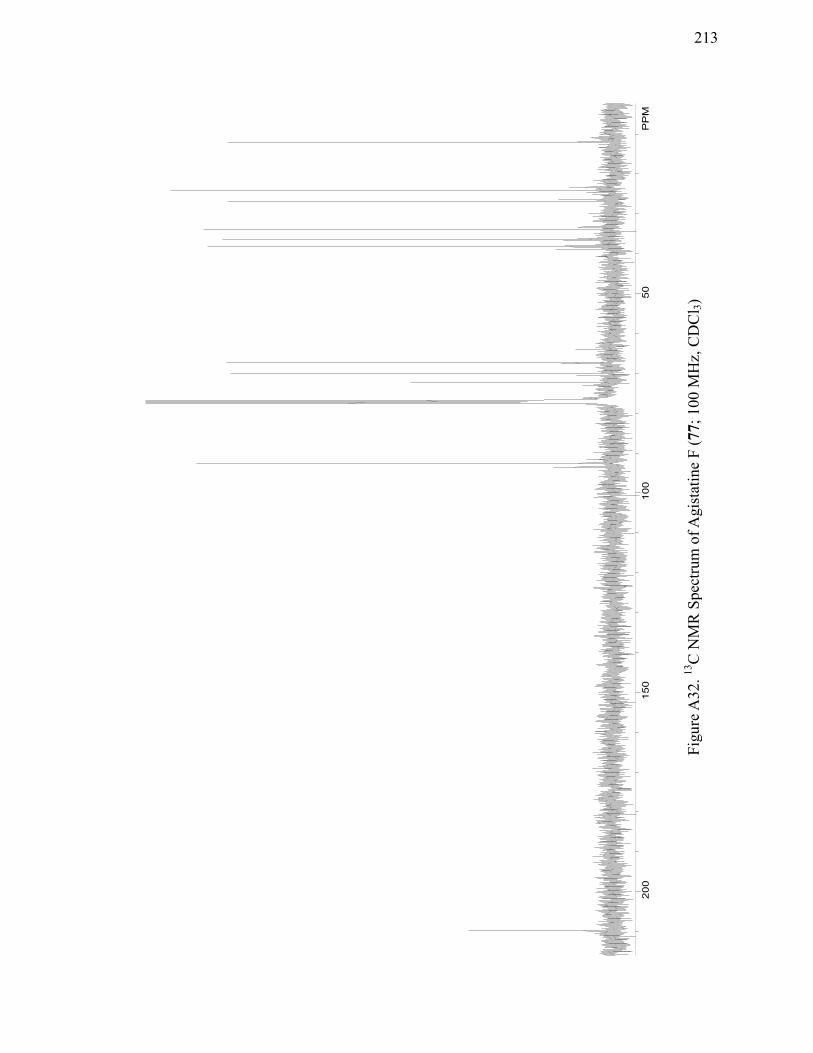
213
200
150
100
50
PP
M
Figu
re A
32. 13
C N
MR
Spe
ctru
m o
f Agi
stat
ine
F (7
7; 1
00 M
Hz,
CD
Cl 3)

214
5.0
4.5
4.0
3.5
3.0
2.5
2.0
1.5
1.0
PP
M
Figu
re A
33. 1 H
NM
R S
pect
rum
of D
ihyd
rosp
orot
hrio
lide
(82;
400
MH
z, C
DC
l 3)

215
Figu
re A
34. 13
C N
MR
Spe
ctru
m o
f Dih
ydro
spor
othr
iolid
e (8
2; 4
00 M
Hz,
CD
Cl 3)
180
160
140
120
100
80
60
40
20
PP
M

216
76
54
32
PP
M
Figu
re A
35. 1 H
NM
R S
pect
rum
of A
rahy
pin-
1 (8
6; 4
00 M
Hz,
CD
Cl 3)
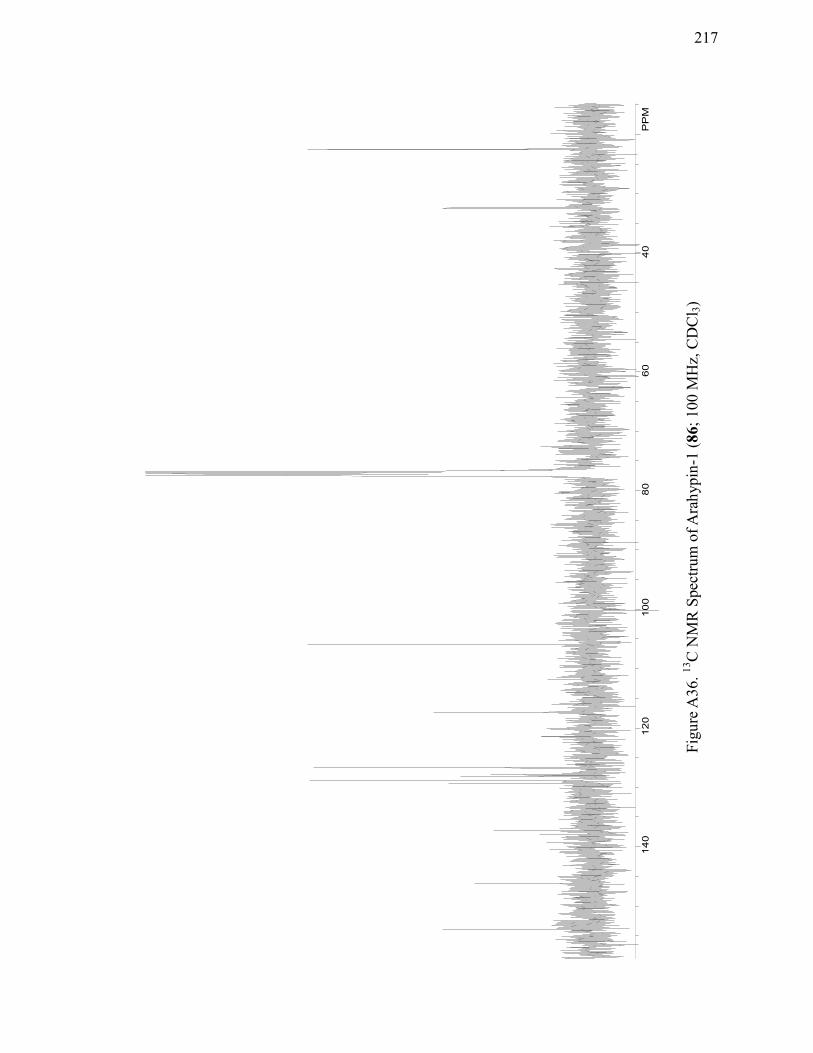
217
140
120
100
80
60
40
PP
M
Figu
re A
36. 13
C N
MR
Spe
ctru
m o
f Ara
hypi
n-1
(86;
100
MH
z, C
DC
l 3)

218
76
54
32
PP
M
Figu
re A
37. 1 H
NM
R S
pect
rum
of A
rahy
pin-
3 (8
7; 4
00 M
Hz,
CD
3OD
)
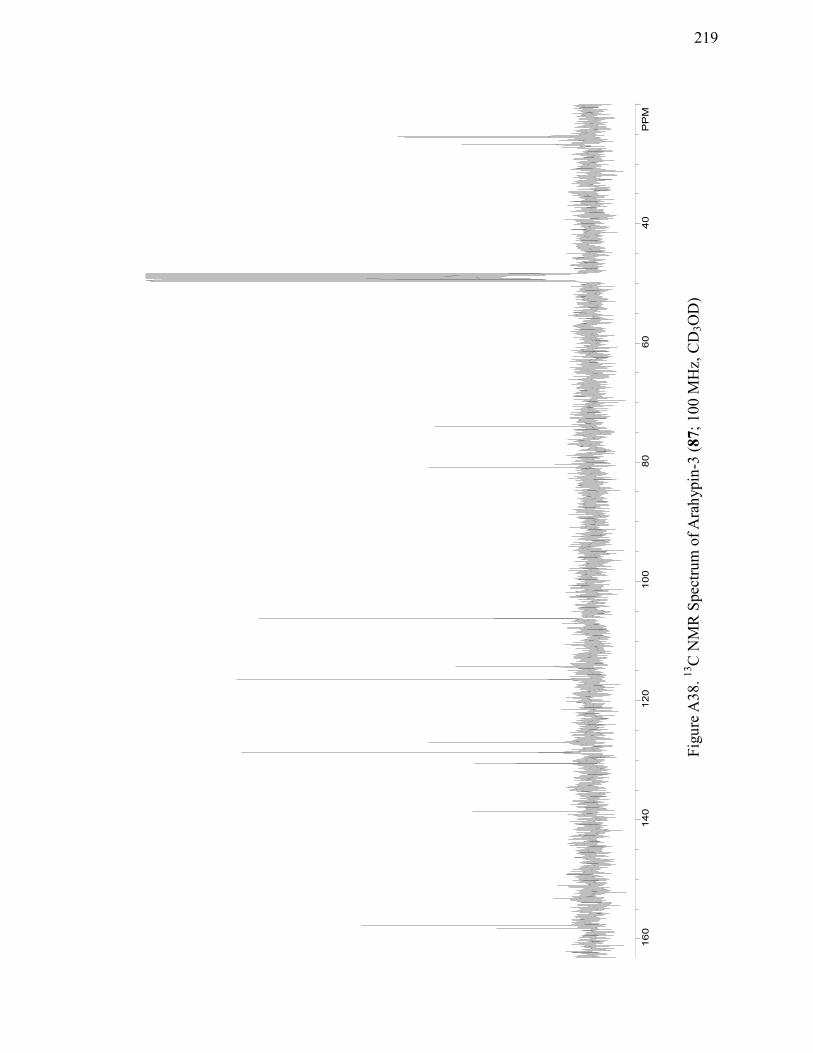
219
1
60
140
120
100
80
60
40
PP
M
Figu
re A
38. 13
C N
MR
Spe
ctru
m o
f Ara
hypi
n-3
(87;
100
MH
z, C
D3O
D)
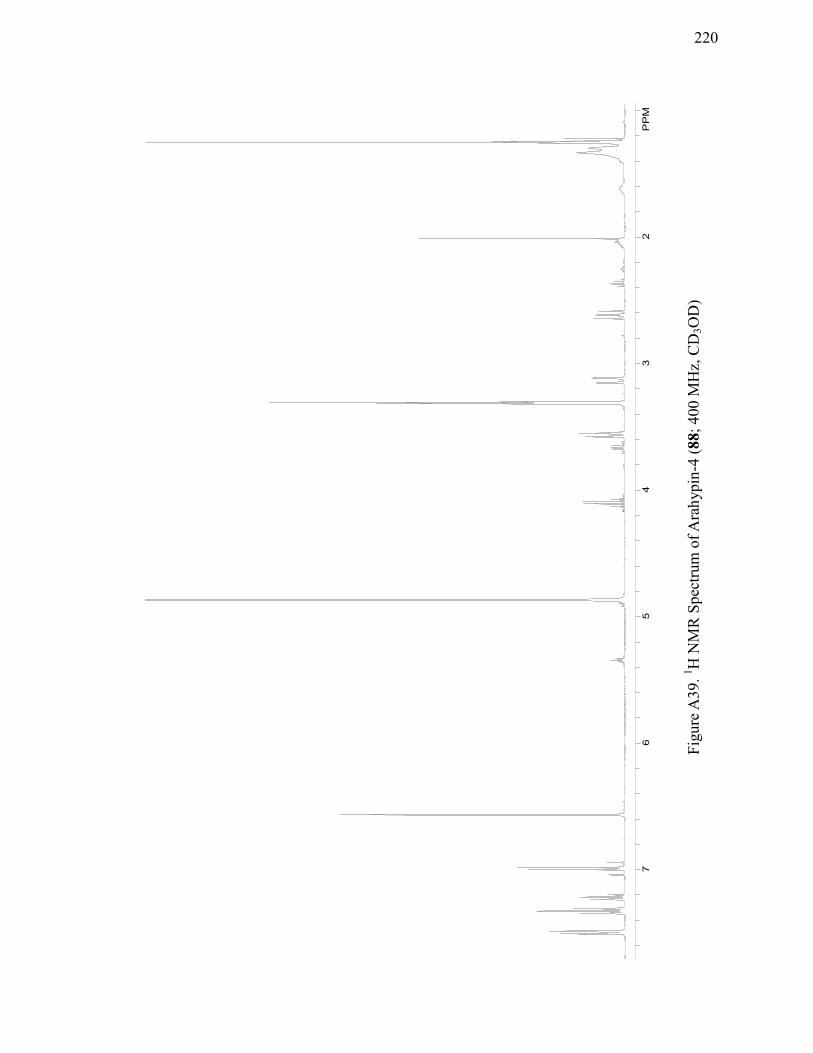
220
76
54
32
PP
M
Figu
re A
39. 1 H
NM
R S
pect
rum
of A
rahy
pin-
4 (8
8; 4
00 M
Hz,
CD
3OD
)

221
1
60
140
120
100
80
60
40
PP
M
Figu
re A
40. 13
C N
MR
Spe
ctru
m o
f Ara
hypi
n-4
(88;
100
MH
z, C
D3O
D)
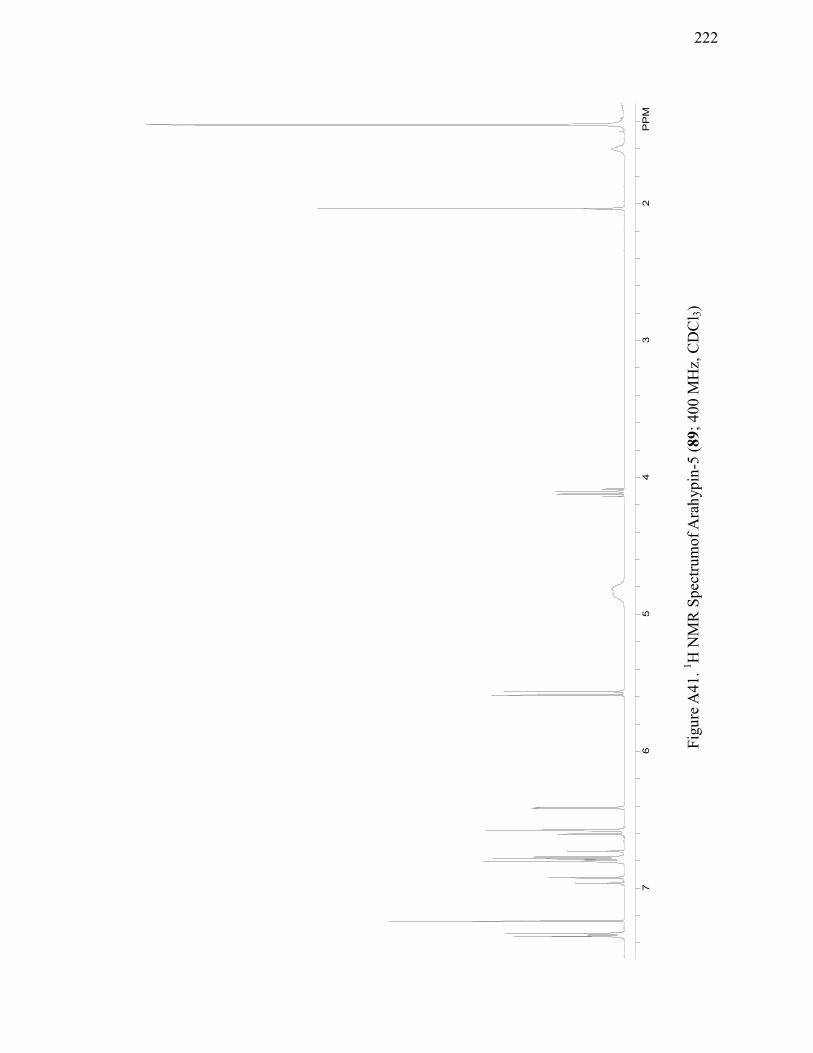
222
76
54
32
PP
M
Figu
re A
41. 1 H
NM
R S
pect
rum
of A
rahy
pin-
5 (8
9; 4
00 M
Hz,
CD
Cl 3)

223
140
120
100
80
60
40
PP
M
Figu
re A
42. 13
C N
MR
Spe
ctru
m o
f Ara
hypi
n-5
(89;
100
MH
z, C
DC
l 3)

224
76
54
32
1P
PM
Figu
re A
43. 1 H
NM
R S
pect
rum
of A
rahy
pin-
6 (9
0; 4
00 M
Hz,
CD
Cl 3)

225
Figu
re A
44. H
MB
C S
pect
rum
of A
rahy
pin-
6 (9
0; 6
00 M
Hz,
CD
Cl 3)

226
7
65
43
2P
PM
Figu
re A
45. 1 H
NM
R S
pect
rum
of A
rahy
pin-
7 (9
1; 4
00 M
Hz,
Ace
tone
-d6)
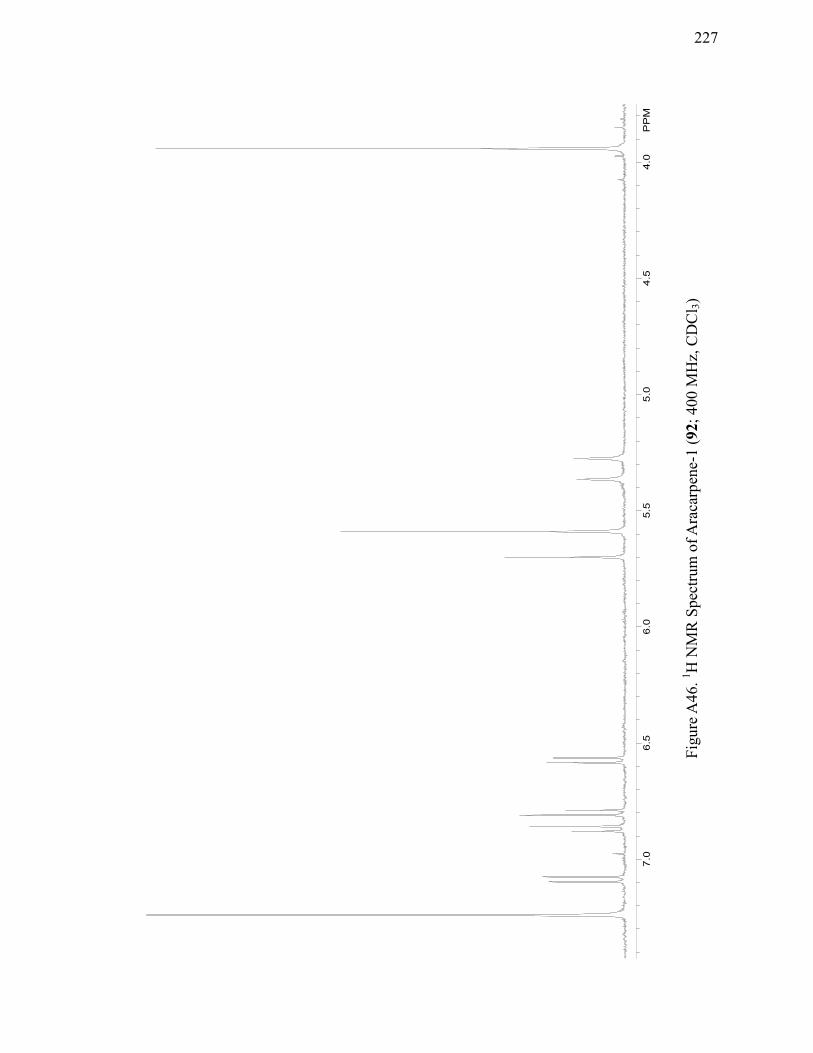
227
7.0
6.5
6.0
5.5
5.0
4.5
4.0
PP
M
Figu
re A
46. 1 H
NM
R S
pect
rum
of A
raca
rpen
e-1
(92;
400
MH
z, C
DC
l 3)
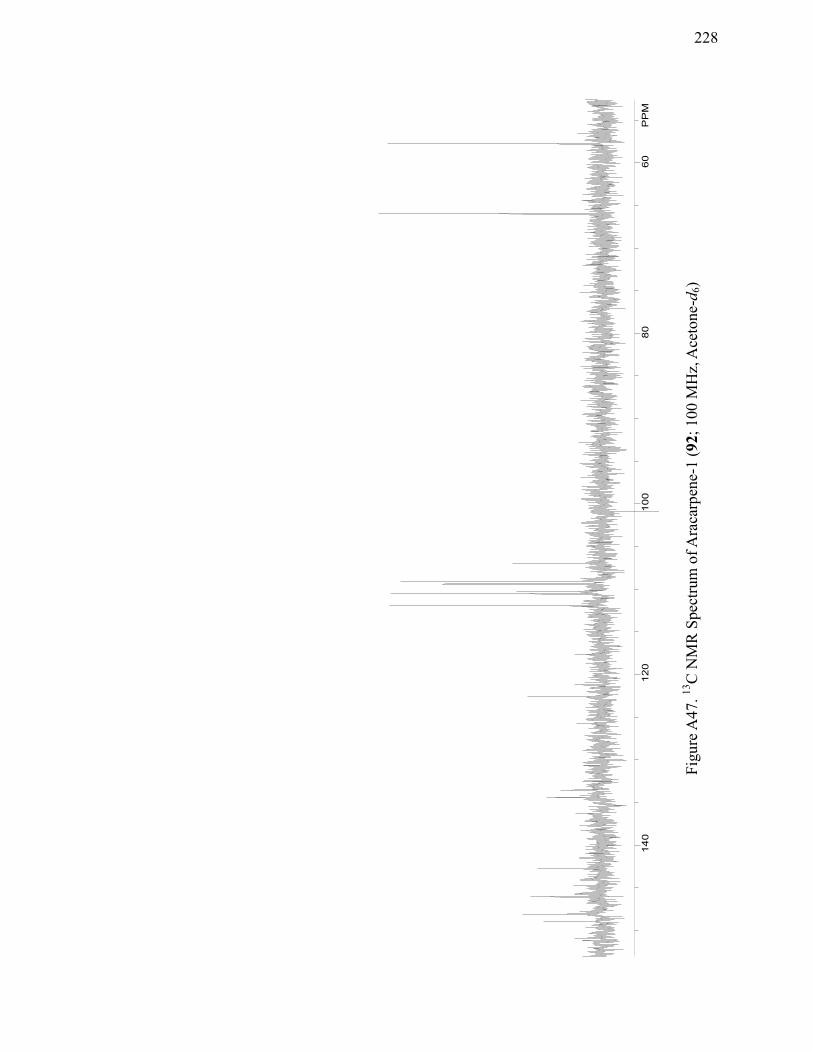
228
Figu
re A
47. 13
C N
MR
Spe
ctru
m o
f Ara
carp
ene-
1 (9
2; 1
00 M
Hz,
Ace
tone
-d6)
140
120
100
80
60
PP
M

229
9
87
65
4P
PM
Figu
re A
48. 1 H
NM
R S
pect
rum
of A
raca
rpen
e-2
(93;
400
MH
z, A
ceto
ne-d
6)
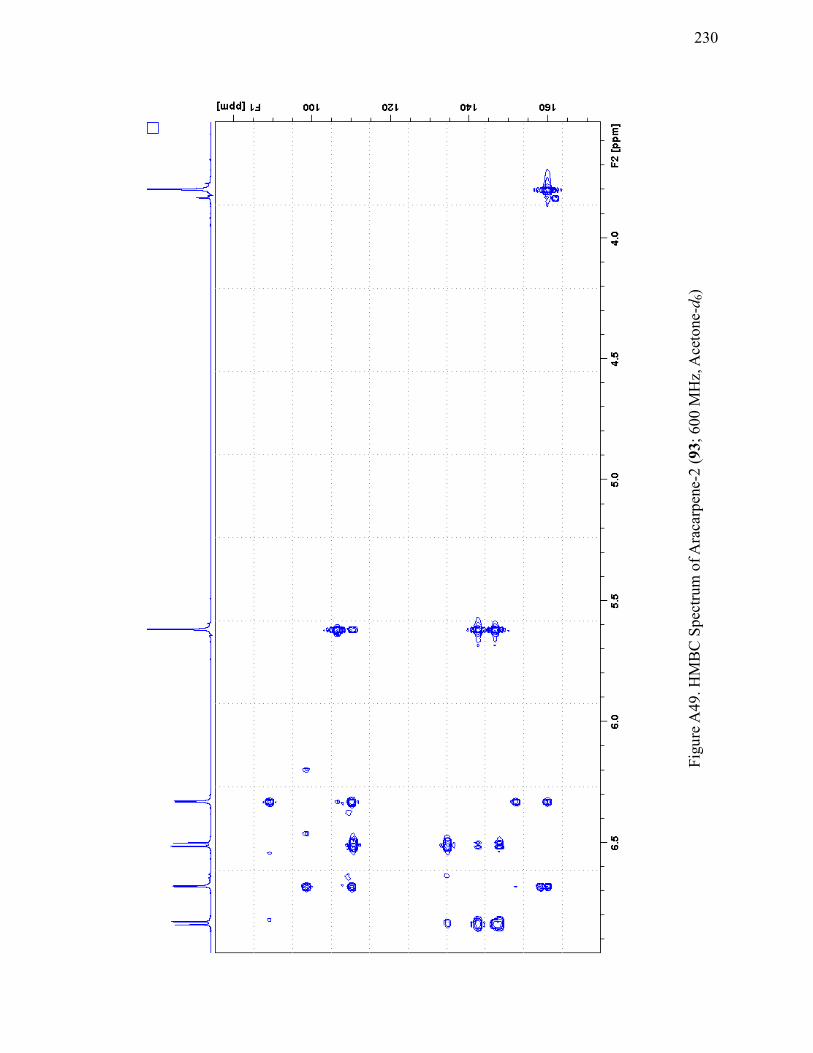
230
Figu
re A
49. H
MB
C S
pect
rum
of A
raca
rpen
e-2
(93;
600
MH
z, A
ceto
ne-d
6)

231
REFERENCES
1. Hawksworth, D. L. Mycol. Res. 1991, 95, 641-655.
2. Hawksworth, D. L. Mycol. Res. 2001, 105, 1422-1432.
3. Trappe, J. M.; Luoma, D. L. In The Fungal Community: Its Organization and Role in the Ecosystem; 2nd ed.; Carroll, G. C.; Wicklow, D. T., Eds.; Marcel Dekker, Inc.: New York, 1992; Vol. 9, pp 17-27.
4. Dalldorf, D. Fungi and Fungal Diseases, Charles C. Thomas Publishers, Springfield, Illinois, 1962, pp 1-34.
5. The Fungi III: The Fungal Population, Ainsworth, G. C.; Sussman, A. S., Eds.; Academic Press: New York & London, 1968.
6. Gloer, J. B. In The Mycota IV: Environmental and Microbial Relationships IV; 2nd ed.; Kubicek, C. P.; Druzhinia, I. S. Eds.; Springer-Verlag: Berlin, 2007; Vol. IV, pp 257-283.
7. Daemmrigh, A.; Bowden, M. E. Chem. Eng. News 2005, 83, 3.
8. Orru, B.; Riva, A.; Fruciano, E. Giuseppe Brotzu and the Discovery of Cephalosporins veprints.unica.it/148/1/orru-poster.pdf (Accessed August 2011)
9. Itokazu, G. Cephalosporins www.uic.edu/pharmacy/courses/pmpr342/itokazu/cephalosporins (Accessed August 2011).
10. Chin, Y. W.; Balunas, M. J.; Chai, H. B.; Kinghorn, A. D. The AAPS Journal 2006, 8, E239-E253.
11. Newman, D. J.; Cragg, G. M. J. Nat. Prod. 2007, 70, 461-477.
12. Siddiqui, I. N.; Zahoor, A.; Hussain, H.; Ahmed, I.; Ahmad, V. U.; Padula, D.; Draeger, S.; Schulz, B.; Meier, K.; Steinert, M.; Kurtan, T.; Florke, U.; Pescitelli, G.; Krohn, K. J. Nat. Prod. 2011, 74, 365-373.
13. Parish, C. A.; Smith, S. K.; Calati, K.; Zink, D.; Wilson, K.; Roemer, T.; Jiang, B.; Xu, D.; Bills, G.; Platas, G.; Pelaes, F.; Diez, M. T.; Tsou, N.; McKeown, A. E.; Ball, R. G.; Powles, M. A.; Yeung, L.; Liberator, P.; Harris, G. J. Am. Chem. Soc. 2008, 130, 7060-7066.
14. Corrado, M.; Rodrigues, K. F. J. Basic Microbiol. 2004, 44, 157-160.
15. Pesctielli, G.; Kurtan, T.; Florke, U.; Krohn, K. Chirality 2009, 21, E181-E201.
16. Chen, C. S.; Shieh, W. R.; Lu, P. H.; Harriman, S.; Chen, C. Y. Biochim Biophysi Acta 1991, 1078, 411-417.
232
17. Odds, F. C. Mycologist 2003, 17, 51-55.
18. MacMillan, J. J. Chem. Soc. 1959, 1823.
19. Brown, W. A. C.; Sim, G. A. J. Chem. Soc. 1963, 1050.
20. Eichelbaum, M. Stereochemical Aspects of Drug Action and Disposition; Testa, B., Somogyi, A., Eds.; Springer: Berlin, 2003.
21. EMEA. Investigation of Chiral Active Substances Report 3CC29a, EMEA; London, 1993, pp 381-391.
22. Sahajwalla, C. Regulatory Considerations in Drug Development of Stereoisomers, In Chirality in Drug Design and Development; Reddy, K.; Mehvar, R., Eds.; Marcel Dekker: New York, 2004, pp 419-432.
23. Miller, C. P.; Ulrich, J. W. Chirality 2008, 20, 762-770.
24. Contreras, R. H.; Peralta, J. E. Prog. Nucl. Magn. Reson. Spectrosc. 2000, 37, 321-425.
25. Hoye, T. R.; Jeffery, C. S.; Shao, F. Nat. Protocols 2007, 2, 2451-2457.
26. Autschbach, J. Chirality 2009, 21, E116-E152.
27. Barron, L. D.; Molecular Light Scattering and Optical Activity, 2nd Ed.; Cambridge University Press: Cambridge, UK., 2004.
28. Paly, G.; Zucchi, C.; Caglioti, L., Eds.; Progress in Biological Chirality Elsevier Science: Oxford, UK., 2004.
29. Buckingham, A. D.; Stiles, P. J. Acc. Chem. Res. 1974, 7, 258.
30. Schellman, J. A. Chem. Rev. 1975, 75, 323.
31. Wagniere, G. J. Am. Chem. Soc. 1966, 88, 3937.
32. Greenfield, N. J. Analysis of Circular Dichroism Data, In Methods in Enzymology, Vol. 383; Elsevier, 2004, pp 282-317.
33. Nave, C. R. Classification of Polarization, In HyperPhysics; Georgia State University, 2011 hyperphysics.phy-astr.gsu.edu/hbase/phyopt/polclas.html#c3 (Accessed August 2011).
34. Woody, R. W. Theory of Circular Dichroism of Proteins, In Circular Dichroism and the Conformational Analysis of Biomolecules; Fasman, G. D., Editor; Plenum Press: New York, 1996, pp 25-67, (and references therein).
35. Prelog, V.; Helmchen, G. Helv. Chim. Acta 1972, 55, 2581-2598.
36. Djerassi, C. Optical Rotatory Dispersion McGraw-Hill Book Co. Inc.: New York, 1960.
233
37. Gillard, R. D. Analyst 1963, 88, 825-828.
38. Snatzke, G. Pure & Appl. Chem. 1979, 51, 769-785.
39. Eliel, E. L.; Wilen, S. H. Stereochemistry of Organic Compounds, Wiley-VCH: New York, 1994.
40. Snatzke, G. Angew. Chem., Int. Ed. Engl. 1979, 18, 363-377.
41. Ciardelli, F.; Slavadori, P. Fundamental Aspects and Recent Developments in Optical Rotatory Dispersion and Circular Dichroism; Heyden: London, 1973.
42. Lightner, D. A. The Octant Rule, In Circular Dichroism: Principles and Applications, 2nd ed.; Berova, B.; Nakanishi, K.; Woody, R. W., Eds.; Wiley-VCH: New York, 2000, pp 261-303.
43. Berova, N.; Nakanishi, K. Exciton Chirality Method: Principles and Applications, In Circular Dichroism: Principles and Applications, 2nd ed.; Berova, B.; Nakanishi, K.; Woody, R. W., Eds.; Wiley-VCH: New York, 2000, pp 337-395.
44. Berova, N.; Di Bari, L.; Pescitelli, G. Chem. Soc. Rev. 2007, 36, 914-931.
45. Harada, N.; Nakanishi, K. Circular Dichroic Spectroscopy – Exciton Coupling in Organic Stereochemistry; University Science Books: Mill Valey, California, 1983.
46. Crawford, T. D. Theor. Chem. Acc. 2006, 115, 227-245.
47. Pecul, M.; Ruud, K. Adv. Quantum Chem. 2005, 50, 185-212.
48. Gross, E. K. U.; Burke, K. Basics in Time-Dependent Density Functional Theory; Springer: Berlin, 2006, pp 1-13.
49. Rappoport, D.; Furche, F. Excited States and Photochemistry; Springer: Berlin, 2006, pp 337-354.
50. Crawford, T. D.; Tam, M. C.; Abrams, M. L. J. Phys. Chem. A 2007, 111, 12057-12068, (and references therein).
51. Furche, F.; Ahirich, R.; Wachmann, C.; Weber, E.; Sobanski, A.; Vogtle, F.; Grimme, S. J. Am. Chem. Soc. 2000, 122, 1717-1724.
52. Autschbach, J.; Ziegler, T. J. Chem. Phys. 2002, 116, 891-896.
53. Ruud, K.; Helgaker, T. Chem. Phys. Lett. 2002, 352, 533-539.
54. Mazzini, F.; Pescitelli, G.; di Bari, L.; Netscher, T.; Salvadori, P. Chirality 2009, 21, 35-43.

234
55. Stephens, P. J.; McCann, D. M.; Cheeseman, J. R.; Frisch, M. J. Chirality 2005, 17, S52-S64.
56. Adano, C.; Barone, V. J. Chem. Phys. 1999, 110, 6158-6170.
57. Becke, A. D. J. Chem. Phys. 1993, 98, 1372-1377.
58. Becke, A. D. Phys. Rev. A 1988, 3098-3100.
59. Perdew, J. P. Phys. Rev. B 1986, 33, 8822-8824.
60. Schafer, A.; Huber, C.; Ahirichs, R. J. Chem. Phys. 1994, 100, 5829-5835.
61. Kurtan, T.; Pescitelli, G.; Salvadori, P.; Kenez, A.; Antus, S.; Szilagyi, L.; Illyes, T. Z.; Szabo, I. Chirality 2008, 379-385.
62. Canal-Neto, A.; Jorge, F. E. Chirality 2007, 19, 67-73.
63. Kendall, R. A.; Dunning, T. H.; Harrison, R. J. J. Chem. Phys. 1992, 96, 6796-6806.
64. Continuum Solvation Models in Chemical Physics: From Theory to Applications; Tomasi, J.; Mennucci, B.; Cammi, R., Eds.; Wiley: Chichester, 2007.
65. Diedrich, C.; Gimme, S. J. Phys. Chem. A 2003, 107, 2524-2539.
66. Cachet, N.; Genta-Jouve, G.; Regalado, E. L.; Mokrini, R.; Amade, P.; Culioli, G.; Thomas, O. P. J. Nat. Prod. 2009, 72, 1612-1615.
67. Ding, Y.; Li, X. C.; Ferreira, D. J. Nat. Prod. 2009, 72, 327-335.
68. Pescitelli, G.; Di Bari, L.; Caporusso, A. M.; Salvadori, P. Chirality 2008, 20, 393-399.
69. Bringmann, G.; Bruhn, T.; Maksimenka, K.; Hemberger, Y. Eur. J. Org. Chem. 2009, 20, 664-672.
70. Bringmann, G.; Gulder, T. A. M.; Reichert, M.; Gulder, T. Chirality 2008, 20, 628-642.
71. Krohn, K.; Farooq, U.; Florke, U.; Schulz, B.; Draeger, S.; Pescitelli, G.; Salvadori, P.; Antus, S.; Kurtan, T. Eur. J. Org. Chem. 2007, 3206-3211.
72. Jones, P. G. Acta. Crystallogr. 1984, 40, 663-668.
73. Jones, P. G. Absolute Structure and How Not to Determine It, In Crystallographic Computing 3: Data Collection, Structure Determination, Proteins, and Databases; Sheldrick G. M.; Kruger, C.; Goddard, D., Eds.; Oxford University Press: New York, 1985, pp 260-273.
235
74. Kuroda, R. Solid-state CD: Application to Inorganic and Organic Chemistry, In Circular Dichroism: Principles and Applications, 2nd ed.; Berova, N.; Nakanishi, K.; Wood, R. W., Eds.; Wiley-VCH: New York, 2000, pp 159-184.
75. Kuroda, R.; Honma, T. Chirality 2000, 12, 269-277.
76. Polavarapu, P. L. Mol. Phys. 1997, 91, 551-554.
77. Polavarapu, P. L. Chakraborty, D. K. Chem. Phys. 1999, 240, 1-8.
78. Polavarapu, P. L. Angew. Chem., Int. Ed. 2002, 41, 4544-4546.
79. Polavarapu, P. L. J. Phys. Chem. A 2005, 109, 7013-7023.
80. Cheeseman, J. R.; Frisch, M. J.; Devlin, F. J.; Stephens, P. J. J. Phys. Chem. A 2000, 104, 1039-1046.
81. Vereshchangia, A. A.; Sapteeva, T. I.; Slivkin, L. G.; Garmashov, V. I.; Rudakov, G. A. J. Appl. Chem USSR 1982, 55, 409.
82. Anderson, N. H.; Falcone, M. S.; Chemistry and Industry 1971, 62-63.
83. Kondru, R. K.; Wipf, P.; Beratan, D. N. J. Am. Chem. Soc. 1998, 120, 2204-2205.
84. Kondru, R. K.; Wipf, P.; Beratan, D. N. Science 1998, 282, 2247-2250.
85. Perry, T. L.; Dickerson, A.; Kahn, A. A.; Kondru, R. K.; Beratan, D. N.; Wipf, P.; Kelly, M.; Hamann, M. T. Tetrahedron 2001, 57, 1483-1487.
86. Ribe, S.; Kondru, R. K.; Beratan, D. N.; Wipf, P. J. Am. Chem. Soc. 2000, 122, 4608-4617.
87. Nagle, D. G.; Park, P. U.; Paul, V. J. Tetrahedron Lett. 1997, 38, 6969-6972.
88. Amos, R. D. Chem. Phys. Lett. 1982, 87, 23-26.
89. Rotzinger, F. P. J. Am. Chem. Soc. 1996, 118, 6760-6766.
90. Sobolev, V. S.; Neff, S. A.; Gloer, J. B. J. Agric. Food Chem. 2009, 57, 62-68.
91. Sobolev, V. S.; Neff, S. A.; Gloer, J. B. J. Agric. Food Chem. 2010, 58, 878-881.
92. Sobolev, V. S.; Neff, S. A.; Gloer, J. B.; Khan, S. I.; Tabanca, N.; De Lucca, A. J.; Wedge, D. E. Phytochemistry 2010, 71, 2099-2107.
93. Sobolev, V. S.; Khan, S. I.; Tabanca, N.; Wedge, D. E.; Manly, S. P.; Cutler, S. J.; Coy, M. R.; Becnel, J. J.; Neff, S. A.; Gloer, J. B. J. Agric. Food Chem. 2011, 59, 1673-1682.
236
94. quickstats.nass.usda.gov/data/printable/6E96A4FB-05C3-3E6E-8E10-68A29DA9B45A; United States Department of Agriculture, National Agricultural Statistics Service (Accessed September 2011).
95. Jaganath, I. B.; Crozier, A. Dietary Flavonoids and Phenolic Compounds. In Plant Phenolics and Human Health: Biochemistry, Nutrition, and Pharmacology; Fraga, C. G., Ed.; Wiley & Sons, Inc.: New York, 2010; pp 1-49.
96. Sobolev, V. R.; Sy, A. A.; Gloer, J. B. J. Agric. Food Chem. 2008, 56, 2960-2969.
97. Kim, J. S.; Lee, S. Y.; Park, S. U. Afr. J. Biotechnol. 2008, 7, 3788-3709.
98. Edwards, C.; Strange, R. N.; Cole, D. L. Plant Pathol. 1995, 44, 573-579.
99. Sobolev, V. R.; Horn, B. W.; Potter, T. L.; Deyrup, S. T.; Gloer, J. B. J. Agric. Food Chem. 2006, 54, 3505-3511.
100. Ingham, J. L. Phytochemistry 1976, 15, 1791-1793.
101. Cooksey, C. J.; Garratt, P. J.; Richards, S. E.; Strange, R. N. Phytochemistry 1988, 27, 115-116.
102. Wotton, H. R.; Strange, R. N. J. Gen. Microbiol. 1985, 131, 487-494.
103. Keen, N. T. Phytopathology 1975, 65, 91-92.
104. Jeandet, P.; Delaunois, B.; Conreux, A.; Donnez, D.; Nuzzo, V.; Cordelier, S.; Clement, C.; Courot, E. BioFactors 2010, 36, 331-334.
105. Ku, K. L.; Chang, P. S.; Cheng, Y. C.; Lien, C. Y. J. Agric. Food Chem. 2005, 53, 3877-3881.
106. Takaoka, M. Nippon Kagaku Kaishi 1939, 60, 1261-1264.
107. Sobolev, V. S. Beneficial Uses of Peanut By-products. www.ars.usda.gov/Research/docs.htm?docid=16814 (Accessed August 2011).
108. Gloer, J. B. Acc. Chem. Res. 1995, 28, 343-350, (and references therein).
109. Lumsden, R. D. The Fungal Community: Its Organization and Role in the Ecosystem; 2nd ed.; Carroll, G. C.; Wicklow, D. T., Eds.; Marcel Dekker, Inc.: New York, 1992; Vol. 9, pp 275-293.
110. Shim, S. H.; Baltrusaitis, J.; Gloer, J. B.; Wicklow, D. T. J. Nat. Prod. 2011, 74, 398-401.
111. Schmidt, L. E.; Deyrup, S. T.; Baltrusaitis, J.; Swenson, D. C.; Wicklow, D. T.; Gloer, J. B. J. Nat. Prod. 2010, 73, 404-408.
237
112. Sy, A. A.; Swenson, D. C.; Gloer, J. B.; Wicklow, D. T. J. Nat. Prod. 2008, 71, 415-419.
113. Deyrup, S. T.; Gloer, J. B.; O’Donnell, K.; Wicklow, D. T. J. Nat. Prod. 2007, 70, 378-382.
114. Jiao, P.; Mudur, S. V.; Gloer, J. B.; Wicklow, D. T. J. Nat. Prod. 2007, 70, 1308-1311.
115. Shim, S. H.; Swenson, D. C.; Gloer, J. B.; Dowd, P. F.; Wicklow, D. T. Org. Lett. 2006, 8, 1225-1228.
116. Bodey, G. P.; Vartivarian, S. Eur. J. Clin. Microbiol. 1994, 60, 847-852.
117. Smith, J. E.; Moss, M. O. Mycotoxins: Formation, Analysis, and Significance; Wiley: New York, 1985, pp1-148.
118. Chu, Y.; Gloer, J. B.; Koster, B.; Malloch, D. J. Nat. Prod. 2002, 65, 916-919.
119. Poling, S. M.; Wicklow, D. T.; Rogers, K. D.; Gloer, J. B. J. Agric. Food Chem. 2008, 56, 3006-3009.
120. Wicklow, D. T.; Jordan, A. M.; Gloer, J. B. Mycol. Res. 2009, 113, 1433-1442.
121. quickstats.nass.usda.gov/data/printable/7F05D28C-CB8C-3757-BD39-2F2DCAB12B6D; United States Department of Agriculture, National Agricultural Statistics Service (Accessed August 2011).
122. Dictionary of Natural Products, Web Edition, 20.1; Taylor & Francis Group/CRC Press, 2011.
123. SciFinder Scholar, Web Edition; American Chemical Society, 2011.
124. Che, Y. Chemical Investigations of Mycoparasitic and Coprophilous Fungi., Ph. D. Thesis, University of Iowa, Iowa City, IA, May 2000.
125. Kobayashi, R.; Samejima, S.; Nakajima, S.; Kawai, K.; Udagawa, S. Chem. Pharm. Bull. 1987, 35, 1347-1352.
126. Dalsgaard, P. W.; Larsen, T. O.; Christophersen, C. J. Antibiot. 2005, 58, 141-144.
127. Munro, H. D.; Musgrave, O. C.; Templeton, R. J. Chem. Soc. C 1967, 947-948.
128. Keller-Schierlein, W.; Kupfer, E. Helv. Chim. Acta. 1979, 21, 1501-1524.
129. Naruse, N.; Yamamoto, H.; Murata, S.; Swanda, Y.; Fukagawa, Y.; Oki, T. J. Antibiot. 1993, 46, 679-681.
130. Zhou, G. X.; Wijeratne, E. M. K.; Bigelow, D.; Pierson, L. S.; VanEtten, H. D.; Gunatilaka, A. A. L. J. Nat. Prod. 2004, 67, 328-332.
238
131. Kohno, J.; Nonaka, N.; Nishio, M.; Ohnuki, T.; Kawano, K.; Okuda, T.; Komatsubara, S. J. Antibiot. 1999, 52, 575-577.
132. Gutierrez, M.; Theoduloz, C.; Rodriguez, J.; Lolas, M.; Schmeda-Hirschmann, G. J. Agric. Food Chem. 2005, 53, 7701-7708.
133. Xie, L. W.; Ouyang, Y. G.; Zou, K.; Wang, G. H.; Chen, M. J.; Sun, H. M.; Dai, S.; Li. Appl. Biochem. Biotechnol. 2009, 159, 284-293.
134. Fang, F.; Ui, H.; Shiomi, K.; Masuma, R.; Yamaguchi, Y.; Zhang, C. G.; Zhang, X. W.; Tanaka, Y.; Omura, S. J. Antibiot. 1997, 50, 919-925.
135. Krough, P.; Hasselager, E.; Friis, P. Acta. Pathol. Microbiol. Scand., Sect. B: Microbiol. Immunol. 1970, 78, 401-413.
136. Barber, J.; Cornford, J. L.; Howard, T. D.; Sharpless, D. J. Chem. Soc., Perkin Trans. 1 1987, 2743-2744.
137. Macias, M.; Ulloa, M.; Gamboa, A.; Mata, R. J. Nat. Prod. 2000, 63, 757-761.
138. Schmidt, L. E. Chemical Investigations of Fungicolous/Mycoparasitic Fungi from Hawaii., Ph. D. Thesis, University of Iowa, Iowa City, IA, December 2007.
139. Ruegger, A.; Kuhn, M.; Lichti, H.; Loosli, H. R.; Huguenin, R.; Quiquerez, C.; von Wartburg, A. Helv. Chim. Acta. 1976, 59, 1075-1092
140. Traber, R.; Loosli, H.; Hofmann, H.; Kuhn, M.; Von Wartburg, A. Helv. Chim. Acta. 1982, 65, 1655-1677.
141. Turner, W. B.; Aldridge, D. C. Secondary Metabolites Derived from Amino-acids, In Fungal Metabolites II; Academic Press: London, 1983, p 433 (cyclsosporin A) and p 462 (chetoglobosins A & F), (and references therein).
142. Sawai, K.; Okuno, T.; Terada, Y.; Harada, Y.; Sawamura, K.; Sasaki, H.; Takao, S. Agric. Biol. Chem. 1981, 45, 1223-1228.
143. Cutler, H. G.; Springer, J. P.; Arrendale, R. F.; Arison, B. H.; Cole, P. D.; Roberts, R. G. Agric. Biol. Chem. 1988, 52, 1725-1733.
144. Cutler, H. G.; Crumley, F. G.; Springer, J. P.; Cox, R. H. J. Agric. Food Chem. 1981, 29, 981-983.
145. Cutler, H. G.; Ammermann, E.; Springer, J. P. ACS Symposium Series 1988, 380, 79-90.
146. Wicklow, D. T.; Rogers, K. D.; Dowd, P. F.; Gloer, J. B. Fungal Biology 2011, 115, 133-142.
147. Qin, J. C.; Zhang, Y. M.; Gao, J. M.; Bai, M. S.; Yang, S. X.; Laatsch, H.; Zhang, A. L. Bioorg. Med. Chem. Lett. 2009, 19, 1572-1574.
239
148. Momesso, L. S.; Kawano, C. Y.; Ribeiro, P. H.; Nomizo, A.; Goldman, G. H.; Pupo, M. T. Quim. Nova. 2008, 31, 1680-1685.
149. Oh, H. Chemical Investigations of Chaetomium sp. and Aquatic and Sclerotium-Producing Fungi, Ph. D. Thesis, University of Iowa, Iowa City, IA, May 1998.
150. Vesonder, R. F.; Tjarks, L. W.; Rohwedder, W. K.; Burmeister, H. R.; Laugal, J. A. J. Antibiot. 1979, 32, 759-761.
151. Singh, S. B.; Zink, D. L.; Goetz, M. A.; Dombrowski, A. W.; Polishook, J. D.; Hazuda, D. J. Tetrahedron Lett. 1998, 39, 2243-2246.
152. Kim, J. C.; Park, J. H.; Choi, G. J.; Kim, H. T.; Choi, Y. H.; Cho, K. Y. Han’guk Misaengmul-Saengmyongkong Hakhoechi 2002, 30, 339-345 (accessed through SciFinder September 2011).
153. Isaka, M.; Berkaew, P.; Intereya, K.; Komijit, S.; Sathitkunanon, T. Tetrahedron 2007, 63, 6855-6860.
154. Joshi, B. K.; Gloer, J. B.; Wicklow, D. T. J. Nat. Prod. 1999, 62, 730-733.
155. Matsumoto, M.; Minato, H.; Kondo, E.; Mitsugi, T.; Katagiri, K. J. Antibiot. 1975, 28, 602-604.
156. Polavarapu, P. L.; Jeirath, N.; Kurtan, T.; Pescitelli, G.; Krohn, K. Chirality 2009, 21, E202-E207.
157. Scherlach, K.; Hertweck, C. Org. Biomol. Chem. 2006, 4, 3517-3520.
158. Kimura, Y.; Kusano, M.; Koshino, H.; Uzawa, J.; Fujioka, S.; Tani, K. Tetrahedron Lett. 1996, 37, 4961-4964.
159. Kusano, M.; Koshino, H.; Uzawa, J.; Fujioka, S.; Kawano, T.; Kimura, Y. Biosci. Biotechnol. Biochem. 2000, 64, 2559-2568.
160. Larsen, T. O.; Frydenvang, K.; Frisvad, J. C.; Christophersen, C. J. Nat. Prod. 1998, 61, 1154-1157.
161. Arai, K.; Shimizu, S.; Yamamoto, Y. Chem. Pharm. Bull. 1981, 29, 1005-1012.
162. Lee, S. U.; Asami, Y.; Lee, D.; Jang, J.-H.; Ahn, J.-S.; Oh, H. J. Nat. Prod. 2011, 74, 1284-1287
163. He, J.; Lion, U.; Sattler, I.; Gollmick, F. A.; Grabley, S.; Cai, J.; Meiners, M.; Schünke, H.; Schamann, K.; Dechert, U.; Krohn, M. J. Nat. Prod. 2005, 68, 1397-1399.
164. Peterson, S. W. Mycologia 2008, 100, 205–226.
165. Li, K.; Horanyi, P. S.; Collins, R.; Phillips, R. S.; Eriksson, K. L. Enzyme Microb. Technol. 2001, 28, 301-307.
240
166. Nobiaki, K.; Tukashi, Y.; Naoko, M. Jpn. Kokai Tokkyo Koho 2003, JP 2003096080 (A).
167. Birch, A. J.; Musgrave, O. C.; Rickards, R. W.; Smith, H. J. Chem. Soc. 1959, 3146-3152.
168. Lai, S.; Shizuri, Y.; Yamamura, S.; Kawai, K.; Terada, Y.; Furukawa, H. Tetrahedron Lett. 1989, 30, 2241-2244.
169. Watanabe, T.; Arisawa, M.; Narusuye, K.; Alam, M. S.; Yamamoto, K.; Mitomi, M.; Ozoe, Y.; Nishida, A. Bioorg. Med. Chem. 2009, 17, 94-110.
170. quickstats.nass.usda.gov/data/printable/523AF159-E34C-3DFB-84A1-1CD8A3EC3151; United States Department of Agriculture, National Agricultural Statistics Service (Accessed September 2011).
171. Kralj, A.; Kehraus, S.; Krick, A.; Eguereva, E.; Kelter, G.; Maurer, M.; Wortmann, Fiebig, H. H.; Konig, G. M. J. Nat. Prod. 2006, 69, 995-1000.
172. Fungal Metabolites II; Turner, W. B.; Aldridge, D. C. Eds.; Academic Press: London, 1983, pp. 182-192.
173. Nozawa, K.; Udagawa, S.; Nakajima, S.; Kawai, K. J. Chem. Soc., Chem. Commun. 1987, 1157-1159.
174. Seya, H.; Nozawa, K.; Nakajima, S.; Kawai, K.; Udagawa, S. J. Chem. Soc. Perkin Trans. 1 1986, 109-116.
175. Fujimoto, H.; Satoh, Y.; Yamaguchi, K.; Yamazaki, M. Chem. Pharm. Bull. 1998, 46, 1506-1510.
176. Hamasaki, T.; Nakajima, H; Yokota, T.; Kimura, Y. Agric. Biol. Chem. 1983, 47, 891-892.
177. Fujita, M.; Yamada, M.; Nakajima, S.; Kawai, K.; Nagai, M. Chem. Pharm. Bull. 1984, 32, 2622-2627.
178. Suemitsu, R.; Ohnishi, K.; Horiuchi, M.; Morikawa, Y.; Sakaki, Y.; Matsumoto, Y. Biosci. Biotech. Biochem. 1993, 57, 334-335.
179. Rank, C.; Nielsen, K. F.; Larsen, T. O.; Varga, J.; Samson, R. A.; Frisvad, J. C. Fungal Biology 2011, 115, 406-420.
180. Lee, Y. M,; Li, H.; Hong, J.; Cho, H. Y.; Bae, K. S.; Kim, M. A.; Kim, D.; Jung, J. H. Arch. Pharm. Res. 2010, 33, 231-235.
181. Jiao, P. Chemical Investigations of Freshwater and Fungicolous Fungi, Ph. D. Thesis, University of Iowa, Iowa City, IA, December 2006.
182. Terao, K.; Emiko, I.; Kawai, K.; Nozawa, K.; Udagawa, S. Mycopathologia 1990, 112, 71-79.
241
183. Ueno, Y.; Umemori, K.; Niimi, E.; Tanuma, S.; Nagata, S.; Sugamata, M.; Ihara, T.; Sekijima, M.; Kawai, K.; Ueno, I.; Tashiro, F. Natural Toxins 1995, 3, 129-137.
184. Herath, K. B.; Jayasuriya, H.; Ondeyka, J. G.; Polishook, J. D.; Bills, G. F.; Dombrowski, A. W.; Cabello, A.; Vicario, P. P.; Zweerink, H.; Guan, Z. Singh, S. B. J. Antibiot. 2005, 58, 686-694.
185. Seya, H.; Nozawa, K.; Udagawa, S.; Nakajima, S.; Kawai, K. Chem. Pharm. Bull. 1986, 34, 2411-2416.
186. Jayasuriya, H.; Guan, Z.; Dombrowski, A. W.; Bills, G. F.; Polishook J. D.; Jenkins, R. G.; Koch, L.; Crumley, T.; Tamas, T.; Dunois, M.; Misura, A.; Darkin-Rattray, S. J.; Gregory, L.; Singh, S. B. J. Nat. Prod. 2007, 70, 1364-1367.
187. Akashi, K.; Palermo, R. E. J. Org. Chem. 1978, 43, 2063-2066.
188. Sharpless, K. B.; Akashi, K. J. Am. Chem. Soc. 1976, 1986-1987.
189. Kokke, W. C. M. C.; Varkevisser, F. A. J. Org. Chem. 1974, 39, 1535-1539.
190. Bonini, C.; Chiummiento, L.; Funicello, M.; Lupattelli, P.; Pullez, M. Eur. J. Org. Chem. 2006, 80-83.
191. Shaabani, A.; Tavasoli-Rad, F.; Lee, D. G. Synthetic Communications 2005, 35, 571-580
192. Bailey, P. S. Ozonization in Organic Chemistry, Vol. 1, Academic Press, New York, 1978.
193. Rueppel, M. L.; Rapoport, H. J. Am. Chem. Soc. 1972, 94, 3877-3883
194. Paukstelis, J. V.; Macharia, B. W. J. Org. Chem. 1973, 38, 646-648
195. Amagata, T.; Usami, Y.; Minoura, K.; Ito, T.; Numata, A. J. Antibiot. 1998, 51, 33-40.
196. Abe, N.; Murata, T.; Hirota, A. Biosci. Biotechnol. Biochem. 1998, 62, 2120-2126.
197. Abe, N.; Sugimoto, O.; Tanji, K.; Hirota, A. J. Am. Chem. Soc. 2000, 122, 12606-12607.
198. Abe, N.; Yamamoto, K.; Hirota, A. Biosci. Biotechnol. Biochem. 2000, 64, 620-622.
199. Nozawa, Y.; Yamamoto, K.; Ito, M.; Sakai, N.; Mizoue, K.; Mizobe, F.; Hanada, K. J. Antibiot. 1997, 50, 635-640.

242
200. Gregory, L.; Pestka, J. J.; Dearborn, D. G.; Rand, T. G. Toxicol. Pathol. 2004, 32, 26-34.
201. Mudur, S. V. Bioactive Secondary Metabolites from Mycoparasitic, Fungicolous, and Freshwater Fungi, Ph. D. Thesis; University of Iowa, Iowa City, IA, December 2006.
202. Gohrt, A.; Grabley, S.; Thiericke, R.; Zeeck, A. Liebigs. Ann. 1996, 627-633.
203. Krohn, K.; Ludewig, K.; Aust, H.; Draeger, S.; Schulz, B. J. Antibiot. 1994, 47, 113-118.
204. Paxton, J. D. Biosynthesis and Accumulation of Legume Phytoalexins, In Mycotoxins and Phytoalexins; Sharma, R. P.; Salunkhe, D. K., Eds.; CRC Press: Boca Raton, FL, 1991; pp 485-499.
205. Subba Rao, P. V.; Strange, R. N. Chemistry, Biology, and Role of Groundnut Phytoalexins in Resistance to Fungal Attack, In Handbook of Phytoalexin Metabolism and Action; Daniel, M., Purkayastha, R. P., Eds.; Marcel Dekker, Inc.: New York, 1995; pp 199-227.
206. Cole, R. J.; Cox, R. H. Handbook of Toxic Fungal Metabolites; Academic Press: New York, 1981; pp 937.
207. Cole, R. J.; Dorner, J. W. Peanut Phytoalexins. In Mycotoxins and Phytoalexins; Sharma, R. P.; Salunkhe, D. K., Eds.; CRC Press: Boca Raton, FL, 1991; pp 501-509.
208. Dorner, J. W.; Cole, R. J.; Sanders, T. H.; Blankenship, P. D. Mycopathologia 1989, 105, 117-128.
209. Sobolev, V. S.; Guo, B. Z.; Holbrook, C. C.; Lynch, R. E. J. Agric. Food. Chem. 2007, 55, 2195-2200.
210. Keen, N. T.; Ingham, J. L. Phytochemistry 1976, 15, 1794-1795.
211. Aguamah, G. A.; Langcake, P.; Leworthy, D. P.; Page, J. A.; Pryce, R. J.; Strange, R. N. Phytochemistry 1981, 20, 1381-1383.
212. Cooksey, C. J.; Garratt, P. J.; Richards, S. E.; Strange, R. N. Phytochemistry 1988, 27, 1015-1016.
213. Sobolev, V. S.; Potter, T. L.; Horn, B. W. Phytochem. Anal. 2006, 17, 312-322.
214. Sobolev, V. S.; Deyrup, S. T.; Gloer, J. B. J. Agric. Food Chem. 2006, 54, 2111-2115.
215. Hahlbrook, K.; Scheel, D. Annu. Rev. Plant Physiol. Plant Mol. Biol. 1989, 40, 347-369.

243
216. Morita, H.; Noguchi, H.; Schroder, J.; Abe, I. Eur. J. Biochem. 2001, 268, 3759-3766.
217. Dixon, R. A.; Pavia, N. L. Plant Cell 1995, 7, 1085-1097.
218. Hart, J. H. Annu. Rev. Phytopathol. 1981, 19, 437-458.
219. Ioset, J. R.; Marston, A.; Gupta, M. P.; Hostettman, K. J. Nat. Prod. 2001, 64, 710-715.
220. Su, B. N.; Cuendet, M.; Hawthorne, M. E.; Kardano, L. B. S.; Riswan, S.; Fong, H. H. S.; Mehta, R. G.; Pezzuto, J. M.; Kinghorn, A. D. J. Nat. Prod. 2002, 65, 163-169.
221. Langcake, P.; Pryce, R. J. Experientia 1977, 33, 151-152.
222. Yoder, B. J.; Cao, S.; Norris, A.; Miller, J. S.; Ratovoson, F.; Razafitsalama, J.; Andriantsiferana, R.; Rasamison, V. E.; Kingston, D. G. I. J. Nat. Prod. 2007, 70, 342-346.
223. Huang, K. S.; Wang, Y. H.; Li, R. L.; Lin, M. Phytochemistry 2000, 54, 875-881.
224. Pezet, R.; Perret, C.; Jean-Denis, J. B.; Tabacchi, R.; Gindro, K.; Viret, O. J. Agric. Food Chem. 2003, 51, 5488-5492.
225. Syah, Y. M.; Achmad, S. A.; Ghisalberti, E. L.; Hakim, E. H.; Iman, M. Z. N.; Makmur, L.; Mujahiddin, D. Fitoterapia 2000, 71, 630-635.
226. Iliya, I.; Ali, Z.; Tanaka, T.; Iinuma, M.; Furasawa, M.; Nakaya, K.; Shirataki, Y.; Murata, J.; Darnaedi, D.; Matsuura, N.; Ubukata, M. Chem. Pharm. Bull. 2003, 51, 85-88.
227. Jeandet, P.; Douillet-Breuil, A. C.; Bessis, R.; Debord, S.; Sbaghi, M.; Adrian, M. J. Agric. Food Chem. 2002, 50, 2731-2741.
228. He, S.; Wu, B.; Pan, Y.; Jiang, L. J. Org. Chem. 2008, 73, 5233–5241.
229. Lam, S. H.; Chen, J. M.; Kang, C. J.; Chen, C. H.; Lee, S. S. Phytochemistry 2008, 69, 1173-1178.
230. Likhitwitayawuid, K.; Sritularak, B. J. Nat. Prod. 2001, 64, 1457-1459.
231. Ohyama, M.; Tanaka, T.; Ito, T; Iinuma, M.; Bastow, K. F.; Lee, K. H. Bioorg. Med.Chem. Lett. 1999, 9, 3057-3060.
232. Huang, K. S.; Lin, M.; Cheng, G. F. Phytochemistry 2001, 58, 357-362.
233. He, S.; Lu, Y.; Wu, B.; Pan, Y. J. Chromatogr. A 2007, 1151, 175–179.
234. Guo, X. Y.; Wang, J.; Wang, N. L.; Kitanaka, S.; Liu, H. W.; Yao, X. S. Chem. Pharm. Bull. 2006, 54, 21-25.
244
235. Marino, S. D.; Gala, F.; Borbone, N.; Zollo, F.; Vitalini, S.; Visioli, F.; Iorizzi, M. Phytochemistry 2007, 68, 1805-1812.
236. Fang, N.; Casida, J. E. J. Nat. Prod. 1999, 62, 205-210.
237. Minezawa, N.; Gordon, M. S. J. Phys. Chem. A 2011, 115, 7901-7911.
238. Kurihara, H.; Kawabata, J.; Ichikawa, S.; Mishima, M.; Mizutani, J. Phytochemistry 1991, 30, 649-653.
239. Kurihara, H.; Kawabata, J.; Ichikawa, S.; Mizutani, J. Agric. Biol. Chem. 1990, 54, 1097-1099.
240. Schultz, T. P.; Nicholas, D. D.; Fisher, T. H. Agric. Food Chem 1997, 1, 289-299.
241. Schultz, T. P.; Boldin, W. D.; Fisher, T. H.; Nicholas, D. D.; McMurtrey, K. D.; Pobanz, K. Phytochemistry 1992, 31, 3801-3806.
242. Bokel, M.; Diyasena, M. N. C.; Gunatilaka, A. A. L.; Kraus, W.; Sotheeswaran, S. Phytochemistry 1988, 27, 377-380.
243. Al-Hazimi, H. M. G.; Alkhathlan, H. Z.; Naturally Occurring Pterocarpanoids and Related Compounds. J. King Saud Univ., Riyadh 2000, 12, 93-122.
244. Jiménez-González, L.; Álvarez-Corral, M.; Muñoz-Dorado, M.; Rodríguez-García, I. Phytochem. Rev. 2008, 7, 125-154.
245. He, J.; Chen, L.; Heber, D.; Shi, W.; Lu, Q. Y. J. Nat. Prod. 2006, 69, 121-124.
246. Tanaka, H.; Hirata, M.; Etoh, H.; Watanabe, N.; Shimizu, H.; Ahmad, M.; Khan, Z.; Anwar, M. Heterocycles 2001, 55, 2341-2347.
247. Rukachaisirikul, T.; Innok, P.; Aroonrerk, N.; Boonamnuaylap, W.; Limrangsun, S.; Boonyon, C.; Woonjina, U.; Suksamrarn, A. J. Ethnopharmacol. 2007, 110, 171-175.
248. Mitscher, L. A.; Ward, J. A.; Drake, S.; Rao, G. S. Heterocycles 1984, 22, 1673-1675.
249. Njamen, D.; Talla, E.; Mbafor, J. T.; Fomum, Z. T.; Kamanyi, A.; Mbanya, J. C.; Cerda-Nicolas, M.; Giner, R. M.; Recio, M. C.; Rios, J. L. Eur. J. Pharmacol. 2003, 468, 67-74.
250. Selvam, C.; Jachak, S. M.; Oli, R. G.; Thilagavathi, R.; Chakraborti, A. K.; Bhutani, K. K. Tetrahedron Lett. 2004, 45, 4311-4314.
251. Chaudhuri, S. K.; Huang, L.; Fullas, F.; Brown, D. M.; Wani, M. C.; Wall, M. E.; Tucker, J. C.; Beecher, C. W. W.; Kinghorn, A. D. J. Nat. Prod. 1995, 58, 966-1969.

245
252. Maurich, T.; Lorio, M.; Chimenti, D.; Turchi, G. Chem. Biol. Interact. 2006, 159, 104-116.
253. Miyase, T.; Sano, M.; Nakai, H.; Muraoka, M.; Nakazawa, M.; Suzuki, M.; Yoshino, K.; Nishihara, Y.; Tanai, J. Phytochemistry 1999, 52, 303-310.
254. Chanphen, R.; Thebtaranonth, Y.; Wanauppathamkul, S.; Yuthavong, Y. J. Nat. Prod. 1998, 61, 1146-1147.
255. Salem, M. M.; Werbovetz, K. A. J. Nat. Prod. 2006, 69, 43-49.
256. Joseph, C. C.; Ndoile, M. M.; Malima, R. C.; Nkunya, M. H. H. Trans. R. Soc. Trop. Med. Hyg. 2004, 98, 451-455.
257. Morimoto, M.; Fukumto, H.; Hiratani, M.; Chavasiri, W.; Komai, K. Biosci. Biotech. 2006, 70, 1864-1868.
258. Boland, G. M.; Donnelly, D. M. X. Nat. Prod. Rep. 1998, 15, 241-260.
259. Chansakaow, S.; Ishikawa, T.; Sekine, K.; Okada, M.; Higuchi, Y.; Kudo, M.; Chaichantipyuth, C. Planta Med. 2000, 66, 572-575.
260. Ferreira, M. A.; Moir, M.; Thomson, R. H. J. C. S Perkin 1 1974, 2429-2435.
261. Ingham, J.; Dewick, P. M. Phytochemistry 1978, 17, 535-538.
262. De Lucca, A. J.; Bland, J. M.; Vigo, C. B.; Cushion, M.; Selitrennikoff, C. P.; Walsh, T. J. Med. Mycol. 2002, 40, 131-137.
263. O’Donnell, K. Sydowia 1996, 48, 57-70.
264. White, T. J.; Bruns, T.; Lee, S.; Taylor, J. W. In PCR Protocols: A Guide to Methods and Applications; Innis, M. A.; Gelfand, D. H.; Sninsky, J. J.; White, T. J., Eds.; Academic Press: New York, 1990; pp 315-322.
265. Schaefer, A.; Horn, H.; Ahlrichs, R. J. Chem. Phys. 1992, 97, 2571-2577.
266. Eichkorn, K.; Weigend, F.; Treutler, O.; Ahlrichs, R. Theoret. Chim. Acta 1997, 97, 119-124.
267. Eichkorn, K.; Treutler, O.; Öhm, H.; Häser, M.; Ahlrichs, R. Chem. Phys. Lett. 1995, 240, 283-289.
268. Becke, A. D. J. Chem. Phys. 1993, 98, 5648-5652.
269. Lee, C.; Yang, W.; Parr, R. G. Phys. Rev. B, 1988, 37, 785-789.
270. Neese, F.; Wennmohs, F.; Hansen, A.; Becker, U. Chem. Phys. 2009, 356, 98-109.
271. Sinnecker, S.; Rajendran, A.; Klamt, A.; Diedenhofen, M.; Neese, F. J. Phys. Chem. A 2006, 110, 2235-2245.
246
272. Neese, F. ORCA, Version 2.8, Universität Bonn, Bonn, Germany, 2010.
273. Bruhn, T.; Hemberger, Y.; Schaumlöffel, A.; Bringmann, G. SpecDis, Version 1.50, Universität Würzburg, Würzburg Germany, 2010.
274. Raper, K. B.; Fennell, D. I. The Genus Aspergillus, Williams & Wilkins: Baltimore, MD, 1965.
275. Samuels, G.J., Petrini, O., Kuhls, K., Lieckfeldt, E., and Kubicek, C.P. 1998. The Hypocrea schweinitzii complex and Trichoderma sect. Longibrachiatum. Studies in Mycology 41:1-54.
276. Ellis, M. B. Dematiaceous Hyphomycetes Commonwealth Mycological Institute, Kew, Surrey, England; 1971, p. 608.