chemical kinetics: the method of initial rateshomepage.smc.edu/gallogly_ethan/labs and...
TRANSCRIPT

Santa Monica College Chemistry 12
Chemical Kinetics: The Method of Initial Rates Page 1 of 15
Chemical Kinetics: The Method of Initial Rates Objectives: • To determine the rate law of a chemical reaction using the Method of Initial Rates. • To determine the activation energy of the reaction by finding the value of the rate
constant, k, at several temperatures. • To observe the effect of a catalyst on the reaction rate. Background: Part A: Finding the Rate Law Using the Method of Initial Rates
The rate law of a chemical reaction is a mathematical equation that describes how the reaction rate depends upon the concentration of each reactant. Two methods are commonly used in the experimental determination of the rate law: the method of initial rates and the graphical method. In this experiment, we shall use the method of initial rates to determine the rate law of a reaction. You should review the sections on determining rate laws via this method in the chapter on chemical kinetics in your textbook before proceeding with this experiment.
The reaction to be studied in this experiment is represented by the following
balanced chemical equation:
€
6 I−(aq) + BrO3−(aq) + 6 H+(aq)→3 I2(aq) + Br−(aq) + 3 H2O (l) (1)
This reaction proceeds relatively slowly. The rate law for this reaction is of the form:
€
Rate = k[I−]x[BrO3−]y[H+]z (2)
where the value of the rate constant, k, is dependent upon the temperature at which the reaction is run. The values of x, y, z and k must be found for this reaction in order to specify the rate law completely. The values of the reaction orders, x, y, and z, are usually, though not always, small integers.
The method of initial rates allows the values of these orders to be found by running the reaction multiple times under controlled conditions and measuring the rate of the reaction in each case. All variables are held constant from one run to the next, except for the concentration of one reactant. The order of that reactant concentration in the rate law can be determined by observing how the reaction rate varies as the concentration of that one reactant is varied. This method is repeated for each reactant until all the orders are determined. At that point, the rate law can be used to find the value of k for each trial. If the temperatures are the same for each trial, then the values of k should be the same too.

Santa Monica College Chemistry 12
Chemical Kinetics: The Method of Initial Rates Page 2 of 15
The method of initial rates relies upon the assumption that the concentration of each reactant and the temperature do not change significantly over the time interval that the reaction rate is being measured. This is accomplished by measuring the reaction rate over a time interval short enough that the concentrations of the reactants do not vary appreciably from their initial values. Because the reaction rate depends upon the reactant concentrations and the temperature, if these are essentially constant, then the rate of reaction will also be constant during this time interval. This allows us to measure the reaction rate by simply dividing the change in reactant concentration by the change in time for the period observed, thus for Equation (1) under initial-rate conditions
€
Rate of Reaction = −Δ[BrO3
−]Δt
(3)
To ensure that the reactant concentrations in the reaction we are observing do not
change appreciably over the time interval observed, we use what is known as a clock reaction. A clock reaction is relatively rapid chemical process whose completion depends upon the rate of the reaction we are observing. The time it takes for the clock reaction to reach completion is used to measure the rate of the reaction being studied over a short enough time interval as to maintain initial conditions in the reaction being studied. Clock reactions generally have an easily observable endpoint, such a color change, to help facilitate experimental measurements.
In this experiment we shall use the reaction described by the equation:
€
I2(aq) + 2 S2O32−(aq)→2 I−(aq) + S4O6
2−(aq) (4) as our clock reaction. The clock reaction described by Equation (4) will be run in our reaction flask along with the reaction described by Equation (1). This clock reaction is many times faster than that described by Equation (1). Looking at Equation (4), we see that all of the iodine, I2 (aq), produced by the reaction described by Equation (1) will be rapidly converted to iodide ions, I– (aq), by the clock reaction described by Equation (4). This will continue until the moment when all of the thiosulfate ions, S2O3
2– (aq), initially present in the reaction flask are consumed. At that point the clock reaction is complete and I2 (aq) will begin to accumulate in the solution. A starch indicator is also included in the reaction mixture. This indicator forms a deep blue complex in the presence of I2 (aq). All the other chemical species used in this experiment are colorless. Thus, a dramatic color change from colorless to blue will be observed the moment all the S2O3
2– (aq) has been consumed. This color change signals the completion of our clock reaction. We shall use the time that it takes for this blue color to appear to determine the initial rate of the reaction given by Equation (1). We use the same quantity of S2O3
2– (aq) in each trial to ensure that the time it takes for the clock reaction to finish depends only upon the rate at which I2 (aq) is produced by Equation (1) under the specific experimental conditions present for each trial. As a simple analogy of how the thiosulfate in our clock reaction works, consider a large leaky water tank for which you wish to measure the drip rate over a short period of time. One method would be to place a small bucket below the drip and measure the time that it takes to fill this bucket, stopping your clock when the bucket is full. The S2O3
2– (aq) in our clock reaction takes the part of the bucket. When the S2O3
2– (aq) is used up by the I2 (aq)

Santa Monica College Chemistry 12
Chemical Kinetics: The Method of Initial Rates Page 3 of 15
“dripping” into the clock reaction from the reaction given by Equation (1), the “bucket” is full and the clock stops.
Because the clock reaction occurs much faster than the reaction we are studying, and because we use only a small amount of S2O3
2– (aq) relative to the amounts of the reactants in Equation (1), we are able to observe the reaction given by Equation (1) under initial conditions. Thus, we are able to use the method of initial rates in our analysis of the reaction kinetics of Equation (1) based on the time it takes for our clock reaction to reach completion for each trial.
The rate of the reaction is defined by Equation (3) as the change in concentration of BrO3
– (aq) with time. However, as discussed above, in order to maintain initial conditions we will be measuring the time that it takes for a set quantity of S2O3
2– (aq) to be used up by the clock reaction. Therefore, we will need to use the stoichiometry of Equations (1) and (4) to relate the rate of change of the S2O3
2– (aq) concentration in the clock reaction to that of the BrO3
– (aq) concentration in Equation (1). Finally, using the measured rate for each trial, we can use the method of initial rates to determine the orders of the reaction in the reaction rate law given by Equation (2). Part B: Determination of the Activation Energy of the Reaction
The value of the rate constant, k, measured in Part A is dependent upon the temperature at which the reaction occurs according to the Arrhenius Equation:
€
k = Ae−Ea /RT (5) where A is the frequency factor and is related to the number of properly aligned collisions that occur per second between reactant molecules; Ea is the activation energy of the reaction and is the minimum energy that must be present in a collision for a reaction to occur; and R is the universal gas constant with a value of 8.3145x10⁻³ kJ·mol–1. Taking the natural logarithm of both sides of Equation (5) gives:
€
lnk = −Ea
R1T#
$ % &
' ( + lnA (6)
Note that this equation is that of a straight line of the form
€
y = mx + b where:
€
y = lnkx =1/Tm = −Ea /Rb = lnA
Thus, if the rate constant, k, is measured at several temperature and ln k is plotted as a function of 1/T, the slope of the resulting line will allow the value of Ea for the reaction to be determined.

Santa Monica College Chemistry 12
Chemical Kinetics: The Method of Initial Rates Page 4 of 15
Part C: The Effect of a Catalyst upon Reaction Rate
Catalysts increase the rate of a chemical reaction by providing a new pathway or mechanism through which a reaction proceeds that has a lower activation energy than that of the uncatalyzed reaction. Because this new pathway has a lower activation energy a greater number of the reactant molecule collisions result in the formation of products, thus increasing the reaction rate. To demonstrate the effect of a catalyst on the reaction rate you will repeat one of the trials from Part A in the presence of an ammonium molybdate, (NH4)2MoO4
(aq), catalyst to see how the time it takes for the color change to occur is altered. Procedure Materials and Equipment: You will need the following additional items for this experiment: stopwatch (or digital timer) hot-water baths set at different temperatures (available in lab room) ice-water bath (obtain a bucket of ice from the stockroom) four 10-mL graduated cylinders (these must be shared with other groups; the stockroom
does not have extra 10-mL cylinders to lend) two thermometers Safety: GENERAL SAFETY: Students must wear safety goggles at all times. The hot-water baths used in Part B of this experiment can become hot enough to burn your skin. Use caution when working with them.
CHEMICAL HANDLING: The ammonium molybdate catalyst used in Part C is known to be toxic and harmful to the environment. Potassium bromate, KBrO3, is a potential human carcinogen and should be handled with care. Gloves are required for this experiment. Care should be taken in handling these chemicals and proper disposal is required.
WASTE DISPOSAL: All chemicals used in this experiment must be disposed of in an appropriate chemical waste container.

Santa Monica College Chemistry 12
Chemical Kinetics: The Method of Initial Rates Page 5 of 15
Experimental Set-up and Procedure: Preparation of Glassware Because soap residue and other chemicals can interfere with the reaction we are observing it is critical that all glassware used in this experiment be rinsed several times using deionized water (and not soap!) prior to performing the experiment. Also, because the production of deionized water is very energy intensive glassware should be rinsed using a squirt bottle in order to minimize waste; never rinse glassware directly under the deionized water tap. In general there is no need to dry glassware after rinsing because most solutions that we use are aqueous.
Part A: Finding the Rate Law Using the Method of Initial Rates In this part of the experiment, you will perform four trials. In each trial you will vary the initial concentration of one reagent in the reaction mixture. Table 1 below summarizes the volume of each reagent that should be used in each reaction mixture. We see from Table 1 that two reaction flasks are used for each trial. This is because we shall measure the time that the clock reaction takes to turn blue from the moment we mix the contents of the two flasks. Observe that the total volume for each trial listed in Table 1 is the same. For example, 10.0 milliliters of water have been added to the mixture in Trial 1 so that its volume is the same as those for other trials. Also observe that the same quantity of sodium thiosulfate has been added to each reaction mixture. Why are these two conditions important? (There are two questions at the end of the experiment concerning this; you may wish to answer them now).
Table 1: Volumes of Reagents to be Used in the Reaction Mixtures (All volumes in milliliters unless otherwise specified). Reaction Mixture
Flask I (250 mL) Flask II (125 mL) 0.010 M KI 0.0010 M Na2S2O3 H2O 0.040 M KBrO3 0.10 M HCl Starch
1 10.0 10.0 10.0 10.0 10.0 3-4 drops 2 20.0 10.0 -- 10.0 10.0 3-4 drops 3 10.0 10.0 -- 20.0 10.0 3-4 drops 4 10.0 10.0 -- 10.0 20.0 3-4 drops
Rinse four 250-mL beakers, four 10-mL graduated cylinders (you will need to share two with another group), two thermometers, a 125-mL Erlenmeyer flask, and a 250-mL Erlenmeyer flask using deionized water as described in the preparation of glassware section above. There is no need to dry these after rinsing, but shake them gently several times to remove almost all the water. Using the four 250-mL beakers, you will collect about 100 mL of each of the four reagents needed to prepare the mixtures listed in Table 1. Rinse each beaker with about 5 mL of the particular reagent solution you will store in it first, pouring this rinse into the appropriate

Santa Monica College Chemistry 12
Chemical Kinetics: The Method of Initial Rates Page 6 of 15
chemical waste container, then fill the beaker with the 100 mL you will need. In this way the beakers do not need to be dried before use. Label each beaker appropriately. Using one of the clean rinsed 10-mL graduated cylinders, measure 10.0 mL of deionized water and transfer it into the clean 250-mL Erlynmeyer flask. Now place one of the four clean rinsed 10-mL graduated cylinders by each of the 250-mL beakers containing the reagents. Rinse each 10-mL graduated cylinder with about 2-3 mL of the reagent in the beaker next to it, pouring this rinse into the waste container. You should now use these cylinders for measuring only the reagent in the beaker they are paired with. Label each of these graduated cylinders appropriately. We have already begun to prepare the half of Reaction Mixture 1 listed in Table 1 for Flask I. Into the 250-mL Erlenmeyer flask containing the 10.0 mL of deionized water, add 10.0 mL of the 0.010 M KI reagent solution and 10.0 mL of the 0.0010 M Na2S2O3 reagent solution from your beakers using the appropriate 10-mL graduated cylinders. Now prepare the half of Reaction Mixture 1 listed in Table 1 for Flask II. Into a clean rinsed 125-mL Erlenmeyer flask combine 10.0 mL of the 0.040 M KBrO3 reagent solution, 10.0 mL of the 0.10 M HCl solution, and 3 to 4 drops of starch indicator. Put one of the two thermometers into each of the two flasks and, if necessary, use a hot or cold water bath to adjust the temperatures of the two flasks so that they are within 0.2°C of each other. Label the thermometers “Flask I” and “Flask II” so you don’t accidentally cross contaminate your flasks in future trials. The next step requires two experimenters: one to operate the stopwatch or timer and another to mix and swirl the contents of the two flasks. Be certain that the person using the stopwatch or timer knows how to operate it by testing it once or twice before proceeding. Pour the contents of Flask II into Flask I rapidly and then swirl the solution to mix thoroughly. Start the stopwatch or timer the moment the two solutions are combined. Set the flask containing the solution down on a sheet of white paper and watch carefully for the blue color of the starch-iodine complex to appear, swirl occasionally. It should take about one to three minutes. Stop the timer the instant that the blue color first appears. Record the elapsed time on your data sheet to as many significant figures as you think reasonable. Using the thermometer remaining in Flask I, measure the temperature of the reaction mixture immediately following the reaction to the nearest tenth of a degree and record the average of this value and your starting temperatures on your data sheet. Dispose of the contents of the flask in the appropriate chemical waste container. Rinse both Erlenmeyer flasks and your thermometers as described in the preparation of glassware section. Repeat this procedure once more, performing a second trial for Mixture 1. (Use the 10-mL graduated cylinder from the Na2S2O3 solution to measure the deionized water. Be sure to rinse this cylinder appropriately before using it again with the Na2S2O3 solution). If the time you measure for this second trial differs by more than ten percent from that of your first trial,

Santa Monica College Chemistry 12
Chemical Kinetics: The Method of Initial Rates Page 7 of 15
repeat the procedure again. If after three trials you still unable to obtain two trials with reaction times that differ by less than ten percent, see your instructor. Now repeat this procedure for the other three mixtures listed in Table 1, performing two trials for each of the mixtures. Repeat any trials where the reaction times for the same mixture differ by more than 10%. Record these data on your data sheet. Do not forget to measure the temperature before and after each trial. Part B: Determination of the Activation Energy of the Reaction You only need to perform one trial for each of trials in Part B. However, before leaving the lab room you should analyze your data and check that your plot is linear, repeating any trails that do not fall close to your best-fit line. Prepare Flasks I and II as in Part A using the quantities given for Mixture 1 in Table 1. Prepare an ice-water bath by mixing ice and enough water to fill the spaces between the pieces of ice in the small ice bucket obtained from the stockroom. Place both flasks carefully into the ice-water bath and wait for the temperature of the contents of each flask to reach about 3°C. Remove the flasks from the ice-water bath and pour the contents of Flask II into Flask I rapidly. Swirl the solution to mix thoroughly. Start your timer the moment you combine the two solutions. Return the flask containing the mixed solution in the ice bath and watch carefully for the blue color to appear. This should occur in about three to eight minutes. For the cold solution a faint blue color may appear initially and then grow darker. Stop the timer the instant that this faint blue color first appears. Record the elapsed time and the average temperature of this mixture on your data sheet. Try your best to keep the temperature constant throughout the reaction. Dispose of the contents of the flask in the chemical waste container. Rinse both Erlenmeyer flasks and your thermometers as described in the preparation of glassware section. Perform two more trials for Part B at elevated temperatures using the hot-water bath at the side of the laboratory room in place of the ice-water bath. Each trial should be performed using the quantities given for Mixture 1 in Table 1. Heat both flasks in the hot-water bath until the temperature in the flasks reaches approximately 30°C (±5°C) in the first elevated-temperature trial, and about 40°C (±5°C) in the second elevated-temperature trial. You may need to hold or clamp the flasks in place to keep their contents from spilling while they are heating in the hot-water bath. When the appropriate temperature has been reached, remove the flasks, mix the contents, and record the elapsed time for the blue color to appear. Record the average temperature of the reaction mixture as before. Dispose of the contents of the flasks in the appropriate chemical waste container. Rinse the flasks and thermometers as before.

Santa Monica College Chemistry 12
Chemical Kinetics: The Method of Initial Rates Page 8 of 15
Part C: The Effect of a Catalyst Upon Reaction Rate Prepare Flasks I and II as in Part A above using the quantities given for reaction Mixture 1 in Table 1, but this time in addition to the starch indicator add one drop of 0.5-M ammonium molybdate, (NH4)2MoO4, to the reagents in Flask II. Pour the contents of Flask II into Flask I rapidly and then swirl the solution to mix thoroughly. Start your timer the moment you combine the two solutions. Set the flask containing the solution down on a sheet of white paper and watch for the blue color of the starch-iodine complex to appear. This should occur very rapidly in this case. Record the elapsed time and average temperature of this mixture on your data sheet. Pour the contents of the flask into the appropriate chemical waste container. Rinse the flask you added the catalyst to well.
Santa Monica College Chemistry 12
Chemical Kinetics: The Method of Initial Rates Page 9 of 15
Name: ____________________________ Date: ________________________
Lab Partner: ________________________ Lab Section: __________________
Chemical Kinetics: The Method of Initial Rates
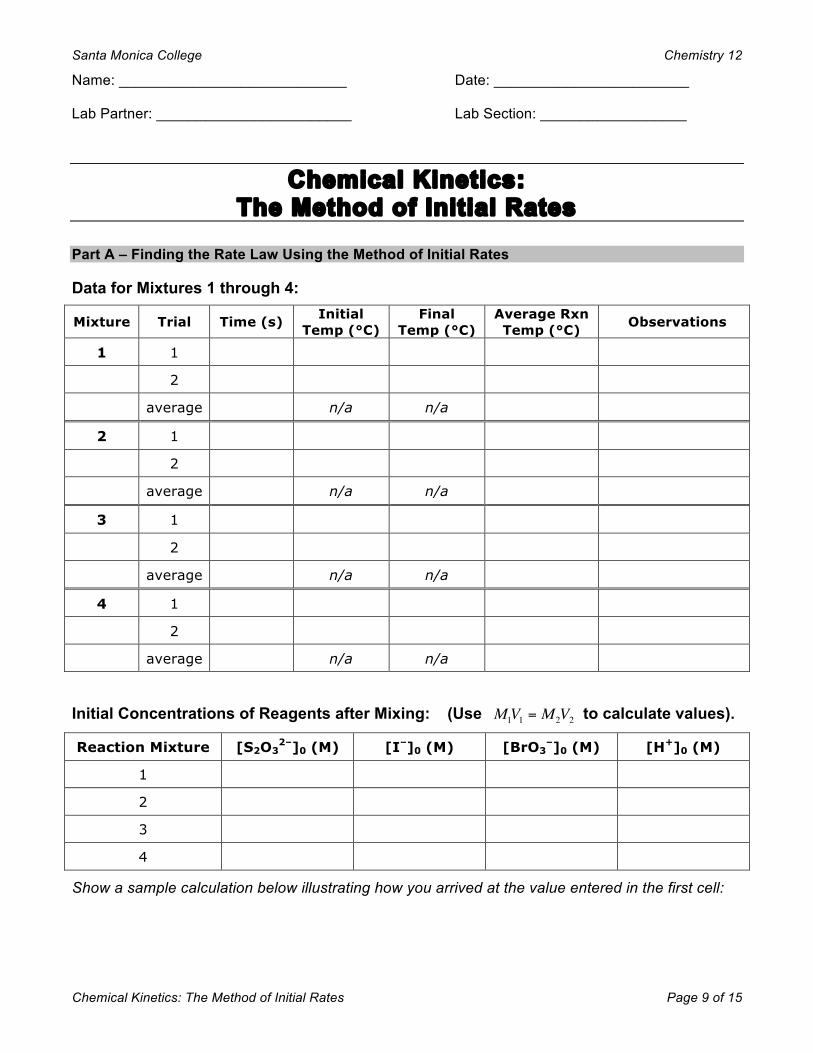
Part A – Finding the Rate Law Using the Method of Initial Rates Data for Mixtures 1 through 4:
Mixture Trial Time (s) Initial Temp (°C)
Final Temp (°C)
Average Rxn Temp (°C) Observations
1 1
2
average n/a n/a
2 1
2
average n/a n/a
3 1
2
average n/a n/a
4 1
2
average n/a n/a
Initial Concentrations of Reagents after Mixing: (Use
€
M1V1 = M2V2 to calculate values).
Reaction Mixture [S2O32–]0 (M) [I–]0 (M) [BrO3
–]0 (M) [H+]0 (M)
1
2
3
4
Show a sample calculation below illustrating how you arrived at the value entered in the first cell:

Santa Monica College Chemistry 12
Chemical Kinetics: The Method of Initial Rates Page 10 of 15
Based on the stoichiometry of Equations (1) and (4): _______ mole(s) of S2O3
2– are consumed for every _______ mole(s) of BrO3– that react.
Therefore, the values of a and b in the relative rate expression:
€
−1aΔ[BrO3
−]Δt
= −1bΔ[S2O3
2−]Δt
are a = ______ and b = ______
Use your concentration data and average times from the previous page to calculate the rate that S2O3
2– is consumed in each of your four mixtures. Then use the values of a and b in the relative rate expression above to determine the corresponding initial rate of reaction in terms of the change in concentration of BrO3
– reacted.
Relative Rates of Reaction:
Reaction Mixture
€
−Δ[S2O3
2−]Δt
(M⋅ s−1)
€
−Δ[BrO3
−]Δt
(M⋅ s−1)
1
2
3
4
Show sample calculations below illustrating how you arrived at the values for Reaction Mixture 1:

Santa Monica College Chemistry 12
Chemical Kinetics: The Method of Initial Rates Page 11 of 15
Summary of Results for Use in the Method of Initial Rates: (copy the appropriate values from the tables on the previous two pages)
Reaction Mixture [I–]0 (M) [BrO3–]0 (M) [H+]0 (M) Rate (M·s–1)
1
2
3
4 Use the method of initial rates and the relevant data in the table above to determine the order of each reactant as given by Equation (2) and state the experimentally determined rate law below. Clearly show all your calculations, including which mixtures the data you used came from.
The reaction order with respect to I– x =
The reaction order with respect to BrO3– y =
The reaction order with respect to H+ z =
The Rate Law:

Santa Monica College Chemistry 12
Chemical Kinetics: The Method of Initial Rates Page 12 of 15
Using your experimentally determined rate law from the previous page determine the value of the rate constant, k, for each of the four reaction mixtures and the average value of k. Value and Units of the Rate Constant, k :
Reaction Mixture 1 2 3 4
Value of k
Show sample calculations below illustrating how you determined the value of k for Mixture 1: Average value of k: Units of k: Part B – The Effect of Temperature on the Reaction Rate
In this part we will use the temperature data collected in Parts A and B for Mixture 1 to determine the value of the activation energy, Ea, for the reaction. Complete the following table using your experimental data and calculated values from Parts A and B of the experiment. Attach your additional calculations on separate sheets of paper to the back of your laboratory report. Be sure to determine the value of the rate constant, k, for each of the different temperatures below and give the appropriate units (the average value of k that you determined in Part A is valid only for the room temperature entry below). Summary of Results for Use in Determining the Activation Energy of the Reaction:
Ice Water Room Temp* About 30°C About 40°C
Temp of Mixture, T (°C)
Temp of Mixture, T (K)
Elapsed Time (s)
€
−Δ[S2O32−]/Δt (M⋅ s−1)
€
−Δ[BrO3−]/Δt (M⋅ s−1)
Rate Constant & Units, k
€
lnk (no units)
1/T (K–1) *For Room Temp use your average data for Mixture 1 from Part A.

Santa Monica College Chemistry 12
Chemical Kinetics: The Method of Initial Rates Page 13 of 15
Use Excel to create a graph of “ln k versus 1/T”. Your graph should have an appropriate title and labeled axes with an appropriate scale. Using the Excel trendline function, add a best-fit line to your plotted data and have Excel display the equation of this line and its R2 value on your graph. Submit this graph with your report. Use this graph to determine the value of the activation energy, Ea, and the frequency factor, A, for this reaction (be certain to include the proper units for each!). Show your calculations. Calculations: Value of Ea: Units of Ea: Value of A: Units of A: Part C – The Effect of a Catalyst Upon Reaction Rate Reaction Time of Normal and Catalyzed Reaction for Mixture 1:
Reaction Mixture 1 Elapsed Time (s) Temperature (°C) Notes / Observations
without catalyst*
with catalyst
*Use the data from Part A for Mixture 1.

Santa Monica College Chemistry 12
Chemical Kinetics: The Method of Initial Rates Page 14 of 15
Questions: 1. The volume of each the reagents listed in Table 1 are varied one at a time in turn except for the
volume of sodium thiosulfate, which is the same in each trial. Why do we keep the volume of sodium thiosulfate the same in each trial?
2. In Part A, even though the concentrations of the reactants are changed in each trial, the
experimentally determined values of the rate constant, k, for each trial should be fairly similar. Why is this?
3. How do your results from Part B also support your answer to the previous question? 4. What is the qualitative relationship between reaction rate and temperature obtained from your
results in Part B? Can you give a physical explanation to explain this? What is occurring on the molecular level?

Santa Monica College Chemistry 12
Chemical Kinetics: The Method of Initial Rates Page 15 of 15
5. Based on your results for Part C, how does the presence of the catalyst effect the value of the
activation energy of this reaction? 6. What additional experiment could you perform to determine the value of the activation energy
for the catalyzed reaction? 7. What is one difficulty would you might face in performing the experiment that you described in
your answer to the previous question? How might you attempt to overcome this difficulty?