chemical process alternatives for radioactive waste year 7 - yer - project 1... · chemical process...
TRANSCRIPT

YEAR END TECHNICAL REPORT August 29, 2016 to September 28, 2017
Chemical Process Alternatives for Radioactive Waste
Date submitted:
November 3, 2017
Principal Investigator:
Leonel E. Lagos, Ph.D., PMP®
Florida International University Collaborators:
Dwayne McDaniel, Ph.D., P.E. (Project Manager) Amer Awwad, M.S., P.E.
Anthony Abrahao, M.S. Ahmadreza Abbasi Baharanchi, Ph.D.
Aparna Aravelli, Ph.D. William Tan, Ph.D.
DOE Fellows
Prepared for:
U.S. Department of Energy Office of Environmental Management
Under Cooperative Agreement DE-EM00000598
This document represents one (1) of four (4) reports that comprise the Year End Reports for the
period of August 29, 2016 to September 28, 2017 prepared by the Applied Research Center at
Florida International University for the U.S. Department of Energy Office of Environmental
Management (DOE-EM) under Cooperative Agreement No. DE-EM0000598.
The complete set of FIU’s Year End Reports for this reporting period includes the following
documents:
Project 1: Chemical Process Alternatives for Radioactive Waste
Document number: FIU-ARC-2017-800006470-04b-255
Project 2: Environmental Remediation Science and Technology
Document number: FIU-ARC-2017-800006471-04b-254
Project 3: Waste and D&D Engineering and Technology Development
Document number: FIU-ARC-2017-800006472-04b-245
Project 4: DOE-FIU Science & Technology Workforce Development Initiative
Document number: FIU-ARC-2017-800006473-04b-253
Each document will be submitted to OSTI separately under the respective project title and
document number as shown above.

DISCLAIMER
This report was prepared as an account of work sponsored by an agency of the United States
government. Neither the United States government nor any agency thereof, nor any of their
employees, nor any of its contractors, subcontractors, nor their employees makes any warranty,
express or implied, or assumes any legal liability or responsibility for the accuracy, completeness,
or usefulness of any information, apparatus, product, or process disclosed, or represents that its
use would not infringe upon privately owned rights. Reference herein to any specific commercial
product, process, or service by trade name, trademark, manufacturer, or otherwise does not
necessarily constitute or imply its endorsement, recommendation, or favoring by the United States
government or any other agency thereof. The views and opinions of authors expressed herein do
not necessarily state or reflect those of the United States government or any agency thereof.

FIU-ARC-2017-800006470-04b-255 Chemical Process Alternatives for Radioactive Waste
ARC Year-End Technical Progress Report i
TABLE OF CONTENTS
TABLE OF CONTENTS ................................................................................................................. i
LIST OF FIGURES ....................................................................................................................... iii
LIST OF TABLES ....................................................................................................................... viii
PROJECT 1 OVERVIEW ...............................................................................................................1
TASK 17.1.1 CFD MODELING OF NON-NEWTONIAN FLUIDS (FIU YEAR
7) ..............................................................................................................................................3
EXECUTIVE SUMMARY ....................................................................................................3
NON-NEWTONIAN CFD MODELING ...............................................................................4
MODELING OF RETRIEVAL PROCESSES .....................................................................11
PIPELINE FLUSHING ........................................................................................................20
CONCLUSIONS...................................................................................................................28
TASK 17.1.2 CFD MODELING OF NON-NEWTONIAN FLUID
UNDERGOING SPARGING (FIU YEAR 7) ...............................................................................30
EXECUTIVE SUMMARY ..................................................................................................30
INTRODUCTION ................................................................................................................31
LITERATURE REVIEW .....................................................................................................32
NUMERICAL APPROACH ................................................................................................35
RESULTS & DISCUSSIONS ..............................................................................................38
CONCLUSIONS AND FUTURE WORK ...........................................................................47
TASK 18.2 DEVELOPMENT OF INSPECTION TOOLS FOR DST PRIMARY
TANKS (FIU YEAR 7) .................................................................................................................50
EXECUTIVE SUMMARY ..................................................................................................50
INTRODUCTION ................................................................................................................52
MAGNETIC MINIATURE ROVER ...................................................................................53
PNEUMATIC PIPE CRAWLER .........................................................................................70
DST FULL SCALE SECTIONAL MOCKUP .....................................................................75
CONCLUSIONS AND FUTURE WORK ...........................................................................82
TASK 18.3 INVESTIGATION USING AN INFRARED TEMPERATURE
SENSOR TO DETERMINE THE INSIDE WALL TEMPERATURE OF DSTS
(FIU YEAR 7)................................................................................................................................84
EXECUTIVE SUMMARY ..................................................................................................84
INTRODUCTION ................................................................................................................85
SENSOR VALIDATION TESTS.........................................................................................86
SENSOR INTEGRATION WITH INSPECTION TOOLS .................................................90
CONCLUSIONS AND FUTURE WORK ...........................................................................92
REFERENCES .....................................................................................................................93
TASK 19.1 PIPELINE CORROSION AND EROSION EVALUATION (FIU
YEAR 7) ........................................................................................................................................94

FIU-ARC-2017-800006470-04b-255 Chemical Process Alternatives for Radioactive Waste
ARC Year-End Technical Progress Report ii
EXECUTIVE SUMMARY ..................................................................................................94
INTRODUCTION ................................................................................................................95
CONCLUSIONS.................................................................................................................103
REFERENCES ...................................................................................................................104
TASK 19.2 EVALUATION OF NONMETALLIC COMPONENTS IN THE
WASTE TRANSFER SYSTEM (FIU YEAR 7).........................................................................105
EXECUTIVE SUMMARY ................................................................................................105
INTRODUCTION ..............................................................................................................106
EXPERIMENTAL TESTING ............................................................................................107
CONCLUSIONS AND FUTURE WORK .........................................................................115
REFERENCES ...................................................................................................................116

FIU-ARC-2017-800006470-04b-255 Chemical Process Alternatives for Radioactive Waste
ARC Year-End Technical Progress Report iii
LIST OF FIGURES
Figure 1. Turbulent velocity profile for the transitional case. ........................................................ 6
Figure 2. Turbulent velocity profile for the fully turbulent case. ................................................... 7
Figure 3. Variation of shear rate versus different ratios. ................................................................ 8
Figure 4. Contour and profile of mean and turbulent axial velocity profiles, Re = 25300. ............ 8
Figure 5. Shear dependency on urms/η and TDR/TKE, Re = 25300. .............................................. 9
Figure 6. Structures found in core flow which belong to top envelope in Figure 5(b). .................. 9
Figure 7. Axial velocity for modified RANS-HB and other RANS simulations. ........................ 10
Figure 8. Interactions of liquid, suspended solids and settled solid fields during tank mixing
operations, image and description from Rector et al., (2010). .............................................. 12
Figure 9. Mesh and initialization of a multiple region domain created in Star-CCM+. ............... 14
Figure 10. 2D computational domain created for the 1:21 scaled tank with 43” internal diameter.
............................................................................................................................................... 15
Figure 11. 3D computational domain created for the 1:21 scaled tank with 43” internal diameter.
............................................................................................................................................... 15
Figure 12. Multiphase simulation of jet flow in a multi-region domain. ...................................... 16
Figure 13. Initial conditions for simulation of jet flow in a multi-region domain. ....................... 16
Figure 14. Evolution of flow from 0 sec to 60 sec, contour of solid volume fraction. ................. 17
Figure 15. Velocity contour and vector filed in 2D simulation of 43” tank with MJP suction ports.
............................................................................................................................................... 18
Figure 16. Velocity contour and vector filed in 2D simulation of 43” tank without MJP suction
ports....................................................................................................................................... 18
Figure 17. Velocity profile at the location of MJP and TRN suction ports, MJP port on (left) and
off (right). .............................................................................................................................. 19
Figure 19. FIU’s proposed test loop. ............................................................................................ 26
Figure 20. FIU’s proposed variable-length loops (left) and an existing 270-ft pipeline at FIU
(right). ................................................................................................................................... 26
Figure 22. General flow structure in PJM vessel (left), radial wall jet depiction (Poreh et al. 1967)
(right). ................................................................................................................................... 31
Figure 23. Bubble column flow regime based on characteristic length and flow rate. ................. 32
Figure 24. Boundary Conditions, physical characteristic (left) and Initial conditions (right) of
Caixia Chen simulation. ........................................................................................................ 38
Figure 25. Replication of Xe's simulation results compared to chen's experimental data. ........... 39
Figure 26. Cross section view of mesh for parametric study. ....................................................... 39

FIU-ARC-2017-800006470-04b-255 Chemical Process Alternatives for Radioactive Waste
ARC Year-End Technical Progress Report iv
Figure 27. Circumferentially time averaged (a) air volume fraction and (b) air axial velocity profile
simulation results compared to Amin’s experimental data. .................................................. 40
Figure 28. Developed simulation grid refinement study of the time averaged (a) air volume fraction
(b) air axial velocity . ............................................................................................................ 41
Figure 29. Instantaneous velocity at the center of the bubble column at a height of (a) 40% of liquid
height and (b) 80% of liquid height. ..................................................................................... 42
Figure 30. H/D comparison ( 𝐻𝐷 = 5.2 − .34 ) of (a) air volume fraction and (b) air axial velocity
at 40% of the liquid height. ................................................................................................... 43
Figure 31. H/D comparison ( 𝐻𝐷 = 5.2 − .34) of (a) air volume fraction and (b) air axial velocity
at 80% of the liquid height. ................................................................................................... 44
Figure 32. Time averaged air volume fraction profile across a 2D plane for H/D= 5.8-.34 with a
clip to range of .5 (not to scale). ........................................................................................... 44
Figure 33. Time averaged air volume fraction on an axial section view for (a) 𝐻𝐷 = .34, (b) 𝐻𝐷=
3.8, (c) 𝐻𝐷 = 5.8 at (1) 40% and (2) 80% of the liquid height. ........................................... 46
Figure 34. Inspection entry points of the AY-102 double-shell tank. .......................................... 52
Figure 35. Side view of primary tank and refractory air slot. ....................................................... 53
Figure 36. Refractory air slot layout and description for AY-102. ............................................... 53
Figure 37. Refractory slot layout for Tank type AZ, SY, AW, AN and AP. ................................ 54
Figure 38. The redesigned inspection tool without the hood. Both the camera and the LED lights
are connected perpendicularly to the base-PCB. Three extra connector-pins (yellow) are
added on the base-PCB to provide connections to the sensors. ............................................ 54
Figure 39. Initial conceptual design with a temperature sensor attached (purple) to the top of the
inspection tool. The design also includes a patch-LED inserted on the front PCB, replacing
the bulb LED. ........................................................................................................................ 55
Figure 40. CAD drawing showing various PCBs for the electronic components. ....................... 56
Figure 41. Conceptual design of temperature sensor integration for measuring the ambient
temperature. .......................................................................................................................... 57
Figure 42. Conceptual design of iButton integration for measuring both the ambient temperature
and humidity. ........................................................................................................................ 57
Figure 43. Conceptual design of radiation sensor integration for measuring beta, gamma and x-
rays. ....................................................................................................................................... 57
Figure 44. Conceptual design of non-contact infrared temperature sensor for measuring the surface
temperature of the tank bottom. The circular cutout (on right) through the inspection tool’s
body allows the IR sensing element to be fitted to measure the surface temperature of the
tank. ....................................................................................................................................... 57
Figure 45. Base, Camera and Sensors PCB designs. .................................................................... 58
Figure 46. Old inspection tool with wire cluttering issue (top) and new inspection tool with custom-
made PCB (bottom). ............................................................................................................. 58
FIU-ARC-2017-800006470-04b-255 Chemical Process Alternatives for Radioactive Waste
ARC Year-End Technical Progress Report v
Figure 47. (left) Sensor hoops populated with both the temperature and iButton sensors (left) and
populated camera PCBs with both the patch and mixed LED lights for the lighting source of
the mini inspection tool (right). ............................................................................................ 59
Figure 48. Temperature sensor hood (left), inspection tool fitted with iButton humidity and
temperature sensor (middle), and inspection tool fitted with RD2014 radiation sensor (right).
The sensor hoods share common electrical and communication interfaces. ........................ 59
Figure 49. Waterproof controller box housing all the electronic components that interface with the
inspection tool and operator (left) and box diagram showing the layout of the controller box
(right). ................................................................................................................................... 60
Figure 50. Xbox controller attached to the controller box to provide the operator with the option
of controlling both the mini inspection tool and the cable management system manually. . 60
Figure 51. Ventilation channel proposed inspection. .................................................................... 61
Figure 52. FIU’s robotic platform. ................................................................................................ 61
Figure 53. Automated cable management systems. ...................................................................... 62
Figure 54. Automated cable management system dimensions. .................................................... 62
Figure 55. Original cable management (left) and redesign prototype with winder (right). .......... 63
Figure 56. Redesigned cable management system with an active cable releasing capability. ..... 63
Figure 57. Active cable feeding systems. ..................................................................................... 64
Figure 58. Prototype of the automated tether management system. ............................................. 65
Figure 59. Cable management system equipped with active cable release capability. ................. 65
Figure 60. Image stream obtained from the onboard camera during a test in the mock up channel.
Red lines show the wall boundaries while the dotted-green line is the estimated central line,
with respect to the wall boundaries. ...................................................................................... 66
Figure 61. Image processing pipeline for detecting the channel boundaries. ............................... 67
Figure 62. Raw image from the camera (left) and processed image with the detected channel
boundaries overlaid in green (right). ..................................................................................... 67
Figure 63. The control outputs of the PID controller.................................................................... 68
Figure 64. Full-scale sectional mock-up showing the starting and end point traversed by the mini
inspection tool (left) and the experiment setup with operator’s computer, control box and
cable management system (right). ........................................................................................ 69
Figure 65. Image capture of the inner concrete wall of the mock-up (left) and the mini inspection
tool reaching the end of the refractory slot (right). ............................................................... 69
Figure 66. AY-102 air supply lines............................................................................................... 70
Figure 67. FIU’s pneumatic pipe crawler. .................................................................................... 71
Figure 68. Pneumatic pipe crawler. .............................................................................................. 71
Figure 69. Current pneumatic pipe crawler prototype. ................................................................. 72

FIU-ARC-2017-800006470-04b-255 Chemical Process Alternatives for Radioactive Waste
ARC Year-End Technical Progress Report vi
Figure 70. Sensor integration. ....................................................................................................... 73
Figure 71. New instrumentation module. ..................................................................................... 74
Figure 72. Crawler current pneumatic actuator (left) and considered pancake cylinder (right). .. 74
Figure 73. Original mockup design. ............................................................................................. 75
Figure 74. Current mockup design................................................................................................ 75
Figure 75. Existing configuration of the DST’s leak detection system. ....................................... 76
Figure 76. Layout of the tank foundation drains (left) and cooling channels (right). ................... 77
Figure 77. Concrete foundation with drain slots. .......................................................................... 77
Figure 78. Refractory pad with cooling channels. ........................................................................ 78
Figure 79. Tank central plenum. ................................................................................................... 78
Figure 80. Mockup foundation and refractory pad concrete coating. ........................................... 79
Figure 81. Primary tank layout. .................................................................................................... 79
Figure 82. The full-scale HLW tank mockup. .............................................................................. 80
Figure 83. Design of the refractory pad structure with cooling channels. .................................... 81
Figure 84. Plywood boxes that form the refectory. ...................................................................... 81
Figure 85. a) Experimental set up b) tank covered with insulation........................................ 86
Figure 86. a) HSTs fixed under the plate b) DAQ system with thermocouples c) DAQ
dashboard. ............................................................................................................................. 87
Figure 87. Emissivity experiment with Raytek sensor a) carbon steel plate b) stainless steel tank
wall. ....................................................................................................................................... 88
Figure 88. IR sensor head on the rover: a) empty chassis b) actual rover in the tank channels c)
detailed view. ........................................................................................................................ 90
Figure 89. IR sensor head attached at: a) front b) top (angular) c) rear. ...................................... 90
Figure 90. a) IR sensor head on the pneumatic pipe crawler b) sensor head and crawler inside the
clear pipe. .............................................................................................................................. 91
Figure 91. (a) UT sensors, (b) Wireless network, and (c) Mounting system. ............................. 97
Figure 92. (a) Permasense corrosion monitoring system and (b) Permasense WT 210 series UT
sensor [4]. .............................................................................................................................. 97
Figure 93. Permasense sensor system a) on pipe section b) detailed view. ................................ 98
Figure 94. Sample thickness measurements for 2 in elbow section from Oct 2016 to Jan 2017. 99
Figure 95. Pipe loop design for aging. ........................................................................................ 100
Figure 96. Pump for sand water media [5]. ............................................................................... 101
Figure 97. a) Coupon, b) Coupon installed on an elbow. .......................................................... 101
Figure 98. In-service component aging loop. ............................................................................. 107

FIU-ARC-2017-800006470-04b-255 Chemical Process Alternatives for Radioactive Waste
ARC Year-End Technical Progress Report vii
Figure 99. HIHTL burst pressure profiles................................................................................... 108
Figure 100. Ruptured hose section.............................................................................................. 109
Figure 101. O-ring test apparatus................................................................................................ 110
Figure 102. Gasket test apparatus. .............................................................................................. 111
Figure 103. Tensile strength testing of EPDM and Garlock® coupons. .................................... 111
Figure 104. EPDM coupon tensile strength. ............................................................................... 111
Figure 105. Garlock® coupon tensile strength. .......................................................................... 112
Figure 106. Coupon tensile strength comparison to baseline data.............................................. 112
Figure 107. Hose sample coupons. ............................................................................................. 113
Figure 108. Aged (bottom) vs. un-aged (top) coupons. .............................................................. 113
Figure 109. Unaged (baseline) hose sample. .............................................................................. 114
Figure 110. 6-Month aged hose sample (79°C). ......................................................................... 114

FIU-ARC-2017-800006470-04b-255 Chemical Process Alternatives for Radioactive Waste
ARC Year-End Technical Progress Report viii
LIST OF TABLES
Table 1. Sources for Simulation Data, TANK AY-102, 1:8 & 1:21 Scaled Tanks ...................... 14
Table 2. Parameters Used in Creation of 2D and 3D Computational Domains ........................... 14
Table 3. Calculation of Suspension Velocity for Particles in a 3” pipe ........................................ 21
Table 4. Candidate Simulants for Use in Initial Phases of the Flushing Tests ............................. 23
Table 5. Matrix for Flushing Test using 165-ft Test Loop ........................................................... 24
Table 6. Information Required from Flushing Test ...................................................................... 27
Table 7. Amin's Non-Newontian Rheological Characteristics ..................................................... 40
Table 8. Potential Sensors for Integration ..................................................................................... 56
Table 9. Temperature (IR Sensor and HSTs) in ºF ....................................................................... 87
Table 10. Experimental Results with ½ in Carbon Steel Plate (Temperature Readings in ºF)..... 88
Table 11. Experimental Results on Stainless Steel Plate (Temperature Readings in ºF) ............. 88
Table 12. Sample UT Sensor Measurements for 3-in Straight Section ........................................ 99
Table 13. Sand and Water Testing .............................................................................................. 102
Table 14 . 6-month O-Ring Pressure Test Results ...................................................................... 109
Table 15. 6-Month Garlock® Gasket Testing Results ................................................................ 110
FIU-ARC-2017-800006470-04b-255 Chemical Process Alternatives for Radioactive Waste
ARC Year-End Technical Progress Report 1
PROJECT 1 OVERVIEW
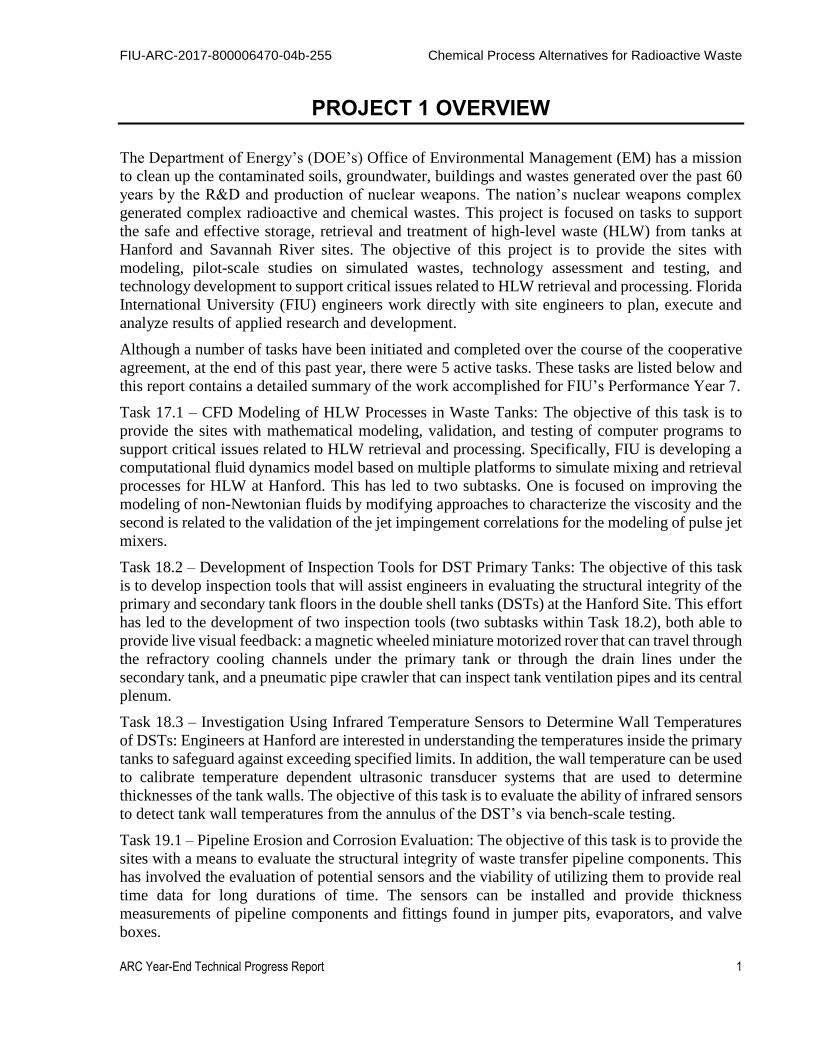
The Department of Energy’s (DOE’s) Office of Environmental Management (EM) has a mission
to clean up the contaminated soils, groundwater, buildings and wastes generated over the past 60
years by the R&D and production of nuclear weapons. The nation’s nuclear weapons complex
generated complex radioactive and chemical wastes. This project is focused on tasks to support
the safe and effective storage, retrieval and treatment of high-level waste (HLW) from tanks at
Hanford and Savannah River sites. The objective of this project is to provide the sites with
modeling, pilot-scale studies on simulated wastes, technology assessment and testing, and
technology development to support critical issues related to HLW retrieval and processing. Florida
International University (FIU) engineers work directly with site engineers to plan, execute and
analyze results of applied research and development.
Although a number of tasks have been initiated and completed over the course of the cooperative
agreement, at the end of this past year, there were 5 active tasks. These tasks are listed below and
this report contains a detailed summary of the work accomplished for FIU’s Performance Year 7.
Task 17.1 – CFD Modeling of HLW Processes in Waste Tanks: The objective of this task is to
provide the sites with mathematical modeling, validation, and testing of computer programs to
support critical issues related to HLW retrieval and processing. Specifically, FIU is developing a
computational fluid dynamics model based on multiple platforms to simulate mixing and retrieval
processes for HLW at Hanford. This has led to two subtasks. One is focused on improving the
modeling of non-Newtonian fluids by modifying approaches to characterize the viscosity and the
second is related to the validation of the jet impingement correlations for the modeling of pulse jet
mixers.
Task 18.2 – Development of Inspection Tools for DST Primary Tanks: The objective of this task
is to develop inspection tools that will assist engineers in evaluating the structural integrity of the
primary and secondary tank floors in the double shell tanks (DSTs) at the Hanford Site. This effort
has led to the development of two inspection tools (two subtasks within Task 18.2), both able to
provide live visual feedback: a magnetic wheeled miniature motorized rover that can travel through
the refractory cooling channels under the primary tank or through the drain lines under the
secondary tank, and a pneumatic pipe crawler that can inspect tank ventilation pipes and its central
plenum.
Task 18.3 – Investigation Using Infrared Temperature Sensors to Determine Wall Temperatures
of DSTs: Engineers at Hanford are interested in understanding the temperatures inside the primary
tanks to safeguard against exceeding specified limits. In addition, the wall temperature can be used
to calibrate temperature dependent ultrasonic transducer systems that are used to determine
thicknesses of the tank walls. The objective of this task is to evaluate the ability of infrared sensors
to detect tank wall temperatures from the annulus of the DST’s via bench-scale testing.
Task 19.1 – Pipeline Erosion and Corrosion Evaluation: The objective of this task is to provide the
sites with a means to evaluate the structural integrity of waste transfer pipeline components. This
has involved the evaluation of potential sensors and the viability of utilizing them to provide real
time data for long durations of time. The sensors can be installed and provide thickness
measurements of pipeline components and fittings found in jumper pits, evaporators, and valve
boxes.

FIU-ARC-2017-800006470-04b-255 Chemical Process Alternatives for Radioactive Waste
ARC Year-End Technical Progress Report 2
Task 19.2 – Evaluation of Non-metallic Components in the Waste Transfer System: The objective
of this task is to provide the Hanford Site with data obtained from experimental testing of the hose-
in-hose transfer lines, Teflon® gaskets, EPDM O-rings, and other nonmetallic components used
in their tank farm waste transfer system under simultaneous stressor exposures. The experiments
will be limited to various combinations of simultaneous stressor exposure to caustic solutions, high
temperatures and high pressure. Evaluation of baseline materials will be conducted for comparison
to materials that have been conditioned with the various simultaneous stressors.

FIU-ARC-2017-800006470-04b-255 Chemical Process Alternatives for Radioactive Waste
ARC Year-End Technical Progress Report 3
TASK 17.1.1 CFD MODELING OF NON-NEWTONIAN FLUIDS (FIU YEAR 7)
EXECUTIVE SUMMARY
Study of waste processes at Hanford and Savannah River Sites (SRS) require extensive
experimental and/or computational investigations with a number of complexities. Processes such
as in-tank mixing and retrieval, pipe transfer, and flushing operations deal with numerous
parameters that need to be included in tests or simulations. Efforts during this performance period
focused on implementation of shear dependency into RANS-HB, review and extension of mixing
and retrieval processes in simulation platforms, and review of flushing and critical velocity studies
using experimental approaches.
The high level waste (HLW) in Hanford tanks is typically non-Newtonian in nature. Rheology of
the waste can be represented by the Herschel-Buckley (HB) model of viscosity. The computational
modeling of these processes can combine the HB model with a Reynolds-averaged Navier-Stokes
(RANS) platform to create a RANS-HB simulation approach. RANS models, despite their
simplicity and cost effectiveness, employ scale averaging of flow features that require
improvements. This includes the shear rate for correctly capturing the viscosity variations in the
flow and the flow field variables such as velocity and pressure.
This computational fluid dynamics (CFD) effort focused primarily on the transfer of waste in
straight pipelines. The goal was to improve the predictions of RANS-HB flow simulation of a non-
Newtonian fluid in a straight pipe using a shear dependency modification correlation obtained
from a quasi-direct numerical simulation (Q-DNS) platform. Some peripheral work was also done
to further validate the last year’s RANS-alpha model, and compare the shear dependency between
RANS-alpha and Q-DNS-HB simulations.
Investigation of the mixing and retrieval processes required a comprehensive literature review of
the processes involved, working and limiting conditions, simulants, and related numerical work.
The goal was to simulate the in-tank processes using a simple modeling approach in Star-CCM+
or Comsol multiphysics platforms, which could yield easier-to-interpret data and results as
compared to existing work done on the Fluent platform. This investigation resulted in expansion
of the initial task discussed to multiphase flow simulations and preliminary results were obtained.
Lastly, efforts focused on development of a test loop that could bridge technical gaps associated
with waste transfer lines and flushing of systems at Hanford and Savannah River. The objective
was to investigate parameters that affect flushing and develop a test plan and an experimental setup
for optimizing flushing operations. A test plan is currently being developed and is under review.

FIU-ARC-2017-800006470-04b-255 Chemical Process Alternatives for Radioactive Waste
ARC Year-End Technical Progress Report 4
NON-NEWTONIAN CFD MODELING
Introduction
Accurate simulation of flow systems involving non-Newtonian fluids such as waste processing
systems in the US Department of Energy’s sites has attained a great deal of attention.
Computational fluid dynamics (CFD) can play a significant role in assisting engineers to safely
and optimally transfer the waste from single shell tanks to double shell tanks, according to Meyer
et al. (2005). CFD simulations can be validated by experiments and run with different types of
simulants that can be used for further predictions. A 1.5 wt% Laponite-water simulant was used in
experimental and simulation studies by Escudier et al. (1996 & 2005) and Peltier et al. (2015),
respectively. Variation of shear stress in this simulant can be modeled using HB rheological model
developed by Herschel and Bulkley (1926).
Previous efforts by this author, Baharanchi et al. (2016), created a method to obtain and utilize
alternative viscosity values during RANS simulations for pipe flow of 1.5 wt% Laponite-water
simulant. This method, known as the alpha-method, demonstrated successful improvement of the
velocity profiles for laminar, transitional, and turbulent regimes of flow. Results compared the
performance of different versions of the alpha viscosity model against those of the original HB
and shear rate correction of Gavrilov and Rudyak (2014) in regards to mean axial velocity profile
as well as viscosity profiles in limited cases.
In this research, simulation results from the RANS-alpha method were considered for study of
three primary goals: (1) validation of turbulence quantities obtained by RANS-alpha simulations,
(2) analysis of the shear dependency behavior, and (3) implementation of the shear dependencies
of Q-DNS-HB into RANS-HB. For the first goal, profile of normalized velocity (u+) versus non-
dimensional wall distance (y+) were created for the turbulent and transitional cases and compared
with the same quantities reported by Escudier et al. (1996). This work aims to evaluate the
validation of results when turbulent quantities were considered in addition to time and scale
averaged velocity profiles.
For the second goal, additional simulations using the RANS-alpha method were ran for Reynold
numbers of 10k, 15k, and 20k as an extension of FIU’s previous investigations, but with a shift in
focus towards shear dependency analysis using two criteria developed at FIU. The RANS
simulations were based on the k-ε turbulence model and a modified HB-based viscosity model
(alpha model). Later, shear dependency analysis of the most recent results obtained from a quasi-
direct numerical simulation (Q-DNS) was considered. Results of this analysis were used to obtain
relationships between the shear rate and turbulence variables in dissipative scales of turbulence
referred to as baseline shear dependency in this work.
For the third goal, the baseline shear dependency obtained from Q-DNS simulations were
incorporated into a RANS-HB simulation with the same Reynold number of 25.3K. This
incorporation was done according to an algorithm that was developed inside the Q-DNS
simulation. FIU compared shear rate variations between Q-DNS-HB and RANS-alpha simulations
to evaluate similarities. The results suggested a significant improvement of RANS H-B modeling
using the modified shear rate.

FIU-ARC-2017-800006470-04b-255 Chemical Process Alternatives for Radioactive Waste
ARC Year-End Technical Progress Report 5
NUMERICAL APPROACH
As noted previously, the RANS model used for this investigation is a k-ε turbulence model and
the viscosity was modeled using the alpha model which is a HB-based viscosity model. Different
versions of this model were used in the simulation of flow with different levels of mesh resolution
to ensure that the results guarantee grid independence. Details of the equations solved, viscosity
models, and turbulence modeling could be found in FIU’s year-end report for FY 2015 and
Baharanchi et al. (2016). Here, the parameters of the turbulence velocity profile are defined as u+
= u/u* and y+ = yu*D/µw, where u* is the friction velocity defined as u* = √τw/ρ, where τw is the
shear stress at the wall and ρ is the fluid density. Other variables, y, D, and µw are wall distance,
pipe diameter, and viscosity of the fluid at the wall.
Shear rate plays a critical role in simulation studies of non-Newtonian fluids. Analysis from
Gavrilov and Rudyak (2014) showed that there is a strong dependency between shear rate and
dissipation rate of turbulent kinetic energy. In this work, variation of the shear rate against a
quantity defined by Eq.(1) was obtained for dissipative scales.
urms
η =
√2K
3
υ3/4
ε1/4
(1)
urms and η represent velocity and length scale of turbulent structures. In this equation K, υ, and ε,
represent TKE, kinematic viscosity, and TDR, respectively. This quantity has the same units of
shear rate, sec-1, and is zero for non-dissipative scales. In the case where the average value of ε is
obtained from spatial analysis, η will then represent Kolmogorov length scale, which is the
smallest scale in turbulent flow. In RANS, K and ε are obtained from the solution to the closure
equations of TKE and TDR and are directly accessible from STAR-CCM+. In Q-DNS, TKE and
TDR must be obtained from fluctuations of velocity components. TKE is defined as
TKE = 0.5*(ux2+uy
2+uz
2), where prime denotes fluctuations and u is the axial velocity component.
Definition of urms and TDR are according to Eq.(2) and Eq.(4), respectively.
urms= √1
3(ux,rms
2+ uy,rms2+ uz,rms
2) (2)
ux,rms=√ux2 , uy,rms=√uy
2 , uz,rms=√uz
2 (3)
ε = μ (2δux
δx
2 +2
δuy
δy
2 +2
δuz
δk
2 + (
δux
δy+
δuy
δx)
2 + (
δux
δz+
δuz
δx)
2 + (
δuy
δz+
δuz
δy)
2 ) (4)
Another variable that was introduced for the study of shear dependency behavior was TDR/TKE.
This ratio has units of s-1 similar to the shear rate and was obtained from the equations described
above. Variation of this variable in the domain formed the second criterion for the shear
dependency study and was used in conjunction with the first criterion to complete the analysis.
For brevity, study parameters for RANS-alpha, RANS-HB, and QDNS-HB simulation are not
included in this report. They are available in FIU’s FY 2015 report.

FIU-ARC-2017-800006470-04b-255 Chemical Process Alternatives for Radioactive Waste
ARC Year-End Technical Progress Report 6
RESULTS & DISCUSSION
Results for the turbulence velocity profiles were obtained for all the models used in FY 2015.
Figure 1 and Figure 2 show the results for transitional, Re = 3400 and fully turbulent, Re = 25300,
respectively. These results indicated that best agreements between simulation results and
experimental data were obtained with the Inv._Local_alpha method and Inv.global_alpha model
versions for Re = 3400, and Re = 25300 cases, respectively.
Interestingly, Inv.global_alpha model was also rated the best model version for the fully turbulent
case (Re = 25300) in FY 2015 when FIU considered the mean velocity profile instead of the
turbulent velocity profile. Therefore, this model version could best represent both mean and
turbulent velocity profiles for the fully turbulent case.
In the case of transitional flow, ratings here were different from the ratings obtained in FY 2015.
Perhaps the alternation between laminar and turbulent regimes in a transitional flow posed a
challenge to a fully turbulent RANS model like the k-ε model that was used in this work. Therefore,
no consensus could be achieved regarding the alpha model for the transitional case.
Figure 1. Turbulent velocity profile for the transitional case.

FIU-ARC-2017-800006470-04b-255 Chemical Process Alternatives for Radioactive Waste
ARC Year-End Technical Progress Report 7
Figure 2. Turbulent velocity profile for the fully turbulent case.
FIU extended the same analysis of shear rate which was performed last year for both RANS-HB
and Q-DNS-HB results. In RANS-alpha simulations, various Reynolds numbers, Re = 10000,
15000, and 20000, were considered to observe similarities between profiles of shear dependencies.
In Q-DNS-HB simulations, it was shown that mean and turbulent profiles could be successfully
captured first.
Results as shown in Figure 3 demonstrated similar profiles that were non-linear and increase and
shift to the right with increasing Reynolds number. This is a result of higher shear and velocity
fluctuations in higher Reynolds numbers. Additional and similar analysis was performed using the
ratio of turbulent dissipations to turbulent kinetic energy, which has the same units as shear rate
(1/sec). For each Reynolds number shown in Figure 3, a profile with small slope is preceded with
a profile having a larger slope. The former is indicative of variations in the vicinity to solid

FIU-ARC-2017-800006470-04b-255 Chemical Process Alternatives for Radioactive Waste
ARC Year-End Technical Progress Report 8
boundaries and the slope of this profile grows with increasing Reynolds number. In contrast,
variations with almost equal slopes were observed at small values of TDR/TKE for different
Reynolds numbers. Similarity between these profiles suggest that a correlation can be obtained
and implemented into the RANS-HB modeling to directly modify the shear rate based on
TDR/TKE values.
Figure 3. Variation of shear rate versus different ratios.
Figure 4 shows profiles of mean and turbulent velocities for the axial velocity component obtained
from the Q-DNS. Experimental profiles of mean and turbulent velocity were obtained from
Escudier et al. (1996 & 2005) and Escudier and Presti (2003), respectively. As observed, good
agreement existed between the simulation and experimental results, which allowed further
investigation on shear rate dependency parameters.
Figure 4. Contour and profile of mean and turbulent axial velocity profiles, Re = 25300.
For study of shear dependency in the Q-DNS-HB modeling investigation, efforts focused on the
fully turbulent flow case. Variation of shear rate versus urms/η and TDR/TKE were obtained and
plotted for turbulent structures, as shown in Figure 5(a,b). Figure 5(a) shows that a qualitative
similarity existed between Q-DNS-HB and RANS-alpha simulations. In addition, a qualitative
similarity was found between the variation of shear rate in Figure 3 and the bottom envelope in
Figure 5 (b). However, the RANS-alpha method imposed a significant underestimation of shear
rate and urms/η.

FIU-ARC-2017-800006470-04b-255 Chemical Process Alternatives for Radioactive Waste
ARC Year-End Technical Progress Report 9
Figure 5. Shear dependency on urms/η and TDR/TKE, Re = 25300.
Variation of shear rate versus TDR/TKE, as shown in Figure 5 (b), revealed two envelopes which
were partly similar. The top envelope was found to contain computational cells on solid boundaries
and in structures that exist in the core flow, as shown in Lijia Xu et al. [24]. It was found that the
top envelope was related to regions of small urms/η which can be separated from the bottom
envelope by urms/η <400 s-1. Results of this structure separation in the flow field is shown in Lijia
Xu et al. [24]. This figure also shows a fine resolution display of these structures obtained through
adjusting the threshold of Q-criterion on the course resolution.
Another observation from Figure 5 (b) is that both top and bottom envelopes show reductions of
shear rate with an increase of TDR/TKE. Here, more attention is given to higher values of the
dissipation rate. A regression analysis was performed in Matlab, as shown in Figure 5(c-d), and
values of 1867(1/s) and 1782 (1/s), were obtained for the top and bottom envelopes, respectively.
Figure 6. Structures found in core flow which belong to the top envelope in Figure 5(b).
Top envelope
bottom
envelope
(c) (d)
(a) (b)
FIU-ARC-2017-800006470-04b-255 Chemical Process Alternatives for Radioactive Waste
ARC Year-End Technical Progress Report 10
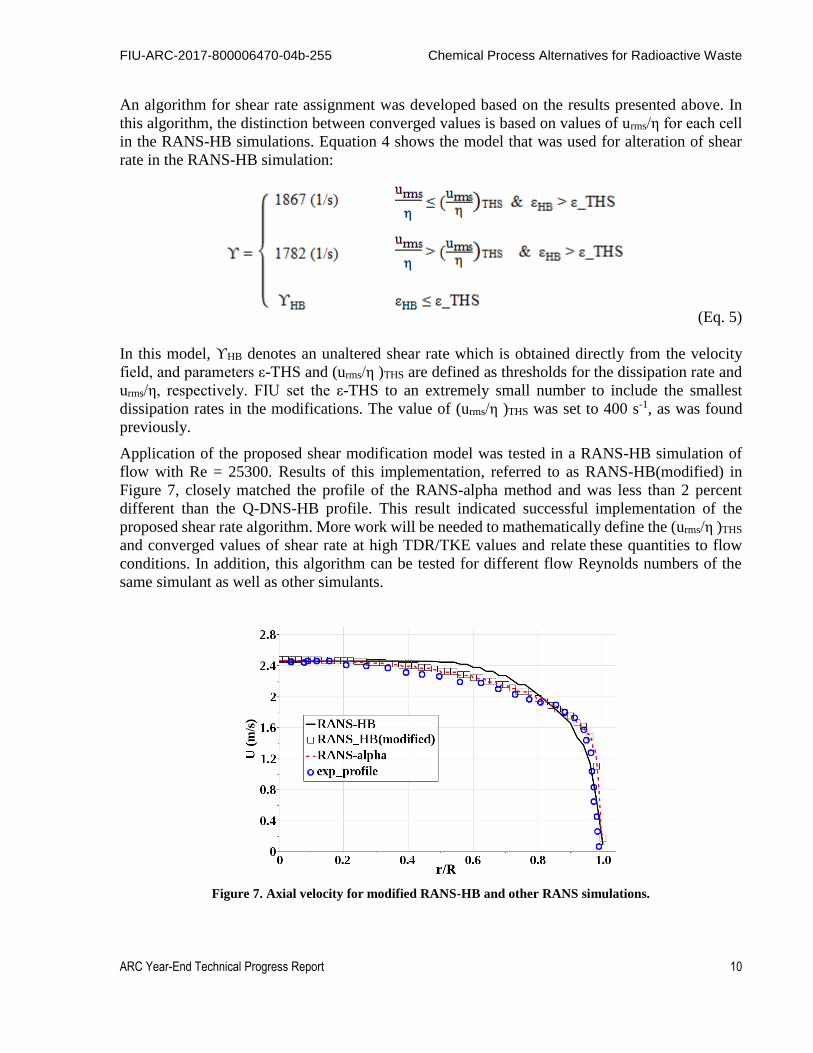
An algorithm for shear rate assignment was developed based on the results presented above. In
this algorithm, the distinction between converged values is based on values of urms/η for each cell
in the RANS-HB simulations. Equation 4 shows the model that was used for alteration of shear
rate in the RANS-HB simulation:
(Eq. 5)
In this model, ϒHB denotes an unaltered shear rate which is obtained directly from the velocity
field, and parameters ε-THS and (urms/η )THS are defined as thresholds for the dissipation rate and
urms/η, respectively. FIU set the ε-THS to an extremely small number to include the smallest
dissipation rates in the modifications. The value of (urms/η )THS was set to 400 s-1, as was found
previously.
Application of the proposed shear modification model was tested in a RANS-HB simulation of
flow with Re = 25300. Results of this implementation, referred to as RANS-HB(modified) in
Figure 7, closely matched the profile of the RANS-alpha method and was less than 2 percent
different than the Q-DNS-HB profile. This result indicated successful implementation of the
proposed shear rate algorithm. More work will be needed to mathematically define the (urms/η )THS
and converged values of shear rate at high TDR/TKE values and relate these quantities to flow
conditions. In addition, this algorithm can be tested for different flow Reynolds numbers of the
same simulant as well as other simulants.
Figure 7. Axial velocity for modified RANS-HB and other RANS simulations.

FIU-ARC-2017-800006470-04b-255 Chemical Process Alternatives for Radioactive Waste
ARC Year-End Technical Progress Report 11
MODELING OF RETRIEVAL PROCESSES
INTRODUCTION
Selection of baseline experimental and simulation data is a critical step in conducting numerical
simulations of waste mixing and transfer. An extensive literature review was conducted in order
to obtain the correct properties and dimensions that can be used in construction of the
computational domains, meshes, and simulations.
According to Rector et al. (2010), solids in the tanks at Hanford are generally composed of
submicron particles of Boehmite and Gibbsite. The presence of these components can introduce
particle gels with non-Newtonian behaviors; more specifically, a Bingham plastic type of fluid
may exist (Lee 2012). By referring to observations of Powell et al. (1995), Wells et al. (2013)
explains that slurry rheology may change from Newtonian to non-Newtonian and can cause a
significant reduction of mobilization of the clay layer. The effect can be a 40% increase of required
flow rate to achieve the same waste mobilization metric, as usually identified by the effective
cleaning radius (ECR). According to Adamson and Gauglitz (2011), suspending particles of a non-
Newtonian slurry with higher yield stress is more difficult, but once erosion happens, particles stay
suspended to a greater degree, as compared to situations with slurries with a lower yield stress.
The combined effect will be higher concentrations in the transfer lines.
It is critical to know how the yield stress varies with the concentration of solids in the slurry.
According to Lee (2012), a simulant composed of 22 wt% and 28 wt% Kaolin clay in water will
have a yield stress of 3 Pa and 10 Pa, respectively. These stress values are recommended by RPP-
PLAN-51625 for the simulant representing the slurry in Hanford tanks. In particular, this yield
stress of the sediment layer at the bottom of the tank may be significantly different from the liquid
above the solid sediment, the supernatant, which has suspended particles in it. This information is
critical for the simulation since, if the mixture multiphase model is used, then different rheograms
are needed for the solid layer and the supernatant. Therefore, a portion of the literature review was
dedicated to finding this variation.
In this research effort, attention was given to the properties of different simulants used in full-scale
or scaled experiments and simulations related to processes at or between Hanford tanks. Focus was
on reported data of tests conducted in 2011 and 2013, as well as related simulations. FIU reviewed
the procedure and results of some scaled tests conducted by Lee and Thien (2013) and Wells et al.
(2013) using a four-component simulant (gibbsite, sand, zirconium oxide, stainless steel, as well
as Wells et al. (2011) using a five-component simulant (gibbsite, silicon carbide, zirconium oxide,
stainless steel, bismuth oxide). Details and reports regarding simulant development and refinement
processes are provided by Wells et al. (2011) and Lee (2012a, 2012b).
For simulations in Star-CCM+, data and geometrical dimensions pertaining to the 2013 tests with
the four-component simulation were considered. Rationale for this selection is for simplicity and
the amount of accessible information.
According to Peurrung et al. (2013), the modeling and scaled testing of the waste handling
processes is a necessity since full-scale vessel testing may be too costly and time consuming. For
this reason, design and optimization of several processes in waste mixing and transport are based
on results from pilot-scale experiments, which are difficult to extrapolate to full-scale behavior,
according to Rector et al. (2010). Thus, both scaled and full-scale CFD simulations are needed.

FIU-ARC-2017-800006470-04b-255 Chemical Process Alternatives for Radioactive Waste
ARC Year-End Technical Progress Report 12
These researchers used high-performance multiphase flow simulations to resolve design,
operational safety, and optimization issues for high-level waste transport processes.
The current approach in simulating these systems is to use one of the commercial CFD programs
with a multi-fluid option to model the different phases. The primary drawback with this approach
is that some programs are limited in their parallel scaling. As an example, use of Fluent for design
verification was rejected due to substantial difficulty in result validation, according to Peurrung et
al. (2013). However, FIU’s review indicates that Star-CCM+ has appropriate parallel computing
performance and ease of implementation of user defined functions which suggests a level of
suitability for this CFD application.
Numerical simulation of mixing of solid-liquid slurries using high-speed fluid jets is a technical
challenge because of the large separation of spatial and time scales (Rector et al., 2010). Peak jet
velocity at the nozzle is on the order of 10 meters per second, which results in a Courant limit time
step on the order of thousandths of a second. Therefore, a complete cycle of rotation of the high-
speed jets in a tank takes approximately 1 minute and the simulation needs a large number of time
steps. For example, a typical pulse-jet simulation takes weeks or even months to complete on a
mid-size computer cluster for a single proposed operational configuration, according to Rector et
al. (2010). In addition, CFD simulation must consider the strong interactions between fluid flow,
solid transport, and erosion/suspension from/to the sediment layer, as shown in Figure 8. Peurrung
et al. (2013) concluded that jet mixing simulations of a scaled tank experiment can take only 5
hours using 5000 processor cores while it may take 336 hours (two weeks) if run on a cluster with
64 processor cores. Therefore, an essential step in conducting simulation of the mixing system is
obtaining an estimate of the minimum number of processors needed to simulate mixing and
transport processes as quickly and accurately as possible.
Figure 8. Interactions of liquid, suspended solids and settled solid fields during tank mixing operations, image
and description from Rector et al., (2010).
Literature Review
General approaches in the literature regarding the simulation of the mobilization of sediment first
requires the erosion of the sediment surface and then focuses on the suspension of the sediment.
Efforts were focused on literature and simulations for the initial erosion of the solid phase. These
simulations were conducted to better understand the fundamental problems and limitations that
exist with current simulation methods.

FIU-ARC-2017-800006470-04b-255 Chemical Process Alternatives for Radioactive Waste
ARC Year-End Technical Progress Report 13
The literature contains a number of numerical studies on sediment erosion using an Eulerian-
Eulerian approach, which is also referred to as the two-fluid model approach. In this approach,
both solid and fluid phases are treated as a continuum and equation sets are solved separately for
each individual phase that is present in the flow. Some of the research using this method has been
conducted by Parsi et al. (2015), Rector et al. (2010), He et al. (2009), and Gustavasson and
Almstedt (2000). An alternative approach is the Euler-Lagrange method where the solid is treated
as a discrete phase (particles) and has been used by Mercier et al. (2014) and Kim et al. (2015). In
this work, the first approach is considered and the following paragraphs explain the details of the
procedure.
Several process vessels will hold waste at various stages within the Hanford Waste Treatment and
Immobilization Plant (WTP). These vessels have mixing system requirements to limit hydrogen
gas accumulation and ensure that pump transfer and normal operations occur (Rector et al., 2012).
The WTP Pretreatment Facility requires a uniform feed from each waste tank that consistently
matches tank average concentrations during the extraction process. This acceptance criterion
requires an accurate method for determining the tank average concentration through a limited
number of samples during mixing. CFD modeling can be used to provide a meaningful prediction
of suspended solids behavior to guide both sampling (in terms of sampling location) and extraction
processes. For this application, a reliable CFD code with formal verification and validation is
needed (SRNL-PNNL, 2013).
In addition, another key uncertainty in the waste feed delivery system is a potential variation in
undissolved solids (UDS) transferred in individual batches in comparison to an initial sample used
for evaluating the acceptance criteria (Wells et al., 2011). Variation in UDS can lead to pipeline
plugging, which has been identified as a significant issue for the WTP, according to Rector et al.
(2009). This uncertainty is due to a challenging and perhaps one of the more limiting WTP waste
acceptance criteria parameters, which is the critical velocity of the slurry. Critical velocity is
defined as the velocity of the slurry above which particulates will remain mobilized in the carrier
solution and be transported down the pipe. Critical velocity is important for WTP receipt to ensure
that solids in HLW feed will remain suspended and not accumulate in plant piping. The CFD
modeling work of Rector et al. (2009) shows capabilities of obtaining detailed distributions for
settled and suspended solids.
Wells et al. (2011) introduced metrics for waste operations. Operations are particle settling,
mobilization, suspension, and pipeline transfer. The metrics include particle settling velocity (Ut),
critical shear stress for erosion of particles (τc), cloud height (Hc), effective cleaning radius (ECR),
and pipeline critical transport velocity (Uc). Among these, the transfer concentration is the primary
metric used for DST sampling and batch transfer performance, according to Lee (2012) and Wells
et al. (2013). Equations that describe models for each metric, including Archimedes number, jet-
suspended impeller speed, and jet velocity, that are needed to achieve a certain degree of solid
suspension for each metric, can be found in reports of Wells et al. (2011) and Rector et al. (2009).
NUMERICAL APPROACH
Representation of the sediment layer at the bottom of double-shell tanks at the start of simulation
(initial condition) required a known shape of the sediment layer. First, a very simple laminar flow
simulation was considered to quickly test the capability of Stat-CCM+ in capturing flow features
including the presence and mobilization of a simulant layer. An arbitrary region was created with
an initial solid volume fraction equal to the maximum packing ratio (ε_solid = max_packing ratio=

FIU-ARC-2017-800006470-04b-255 Chemical Process Alternatives for Radioactive Waste
ARC Year-End Technical Progress Report 14
0.624, for spherical particles) inside another larger arbitrary region, as shown in Figure 9. An
interface on each side of the smaller domain was created to ensure continuity between the domains.
Figure 9. Mesh and initialization of a multiple region domain created in Star-CCM+.
Later, 2D and 3D models of a 1:21 scaled tank (internal diameter of 43 inch) were created with
inclusion of all air lift circulators (ALCs), mixer jet pumps, a transfer line, and a sediment layer.
In creation of these domains (Figure 10 and Figure 11) information in Table 1 and Table 2 were
used.
Table 1. Sources for Simulation Data, TANK AY-102, 1:8 & 1:21 Scaled Tanks
Tank internal diameter Lee and Thien (2013), lee (2012) and Jensen et al. (2012)
Mixer jet pump Lee and Thien (2013), lee (2012) and Jensen et al. (2012)
Transfer pump suction line Lee and Thien (2013), lee (2012) and Jensen et al. (2012)
Air lift circulators (ALC),
numbers
Thien (2012), Lee (2012)
Transfer lines Lee and Thien (2013), Lee (2012)
Shape of the tank bottom Lee (2012).
Thickness of sediment layer Jensen et al. (2012), Thien et al. (2011) , Greer and Thien
(2012)
Thickness liquid layer Jensen et al. (2012), Greer and Thien (2012)
Solid concentration Lee and Thien (2013), Wells et al. (2013)
Data collection times Jenson et al. (2013), Well et al. (2013)
Flow rate data Wells et al. (2013)
Table 2. Parameters Used in Creation of 2D and 3D Computational Domains
Property 43” Tank
Tank internal diameter (m) 1.1
Mixer jet pump nozzle diameter (m) 0.0071
Mixer jet pump nozzle elevation (m) 0.0218
Mixer jet pump suction diameter (m) 0.0135
Mixer jet pump suction elevation (m) 0.0061
Mixer jet pump axial offset in 0° & 180°
angles(m) 0.3230
Transfer pump suction diameter (m) 0.28

FIU-ARC-2017-800006470-04b-255 Chemical Process Alternatives for Radioactive Waste
ARC Year-End Technical Progress Report 15
Transfer pump suction velocity (m/s) 1.16 – 3.44
Transfer pump suction elevation (m) 0.0071
Transfer pump axial offset in 90° angles (m) 0.0884
Transfer pump suction inlet diameter (m)
0.0064-
0.0122*
0.0071**
Transfer line diameter (m) 0.0095*
0.0079**
Air lift circulators (ALC), Count 22
Air lift circulators (ALC), Diameter (m) 0.036
Air lift circulators (ALC), Elevation (m) 0.035
Sediment layer thickness (m) 0.067
Liquid layer thickness (m) 0.43 * lee (2012) for SSMD of AY-102 tank.
** Jensen et al. (2012) for SSMD of AY-102 tank.
Figure 10. 2D computational domain created for the 1:21 scaled tank with 43” internal diameter.
Figure 11. 3D computational domain created for the 1:21 scaled tank with 43” internal diameter.
During this performance period, a limited number of 2D simulations were run for flow in the scaled
43-inch tank. The purpose of these simulations was to evaluate the correct setup of interface
between the sediment layer and the rest of the tank and evaluating the effect of suction and nozzle
ports. Simulation were run in steady and single-phase modes with fixed jets and standard k-ε
model. Nozzle and suction ports of the mixture jet pumps (MJP) were not connected using a field
function for mass flow rate. Instead, a constant value was assigned for the target mass flow rate

FIU-ARC-2017-800006470-04b-255 Chemical Process Alternatives for Radioactive Waste
ARC Year-End Technical Progress Report 16
that represents a steady situation for this step of the work. In reality, a slurry pump connects these
ports.
RESULTS & DISCUSSION
Results (Figure 12) of the simulation using an initial constant viscosity for the solid phase in
indicated diffusion of the solid which smeared the interface between solid and fluid. This result
did not show erosion and suspension of the solid which is directly associated with the viscosity
inside and on top of the sediment.
Figure 12. Multiphase simulation of jet flow in a multi-region domain.
According to Marcier et al. (2012-2014), Bonelli et al. (2012), and Rector et al. (2010), erosion
occurs if the shear stress on the sediment is greater than its yield stress. Initially, values of the
shear stress were obtained and it was observed that maximum shear stress was approximately 0.064
Pa in the areas close to the jet inlet and lower values were observed on the top of the sediment
layer. These shear stress values were lower than the yield stress values found in Bonelli et al.
(2006), Marcier et al. (2012-2014), and Bamberger et al. (2010). Therefore, implementation of the
erosion law was pointless, since no erosion would occur at this stress level. As an alternative, an
artificial viscosity was assigned to regions where the solid volume fraction was equal or larger
than 0.624. This artificial viscosity was set to a large value (ten times larger than the viscosity of
the liquid) to reflect higher resistance to flow inside the smaller domain. Initial conditions are
shown in Figure 13.
Figure 13. Initial conditions for simulation of jet flow in a multi-region domain.
Simulations with the above parameters were run and continued for 60 seconds. Results, as shown
in Figure 14, indicated deformation of the sediment layer and suspension of solids in the
supernatant. Results show that there was still residue left in the domain after 60 seconds, which
was an unrealistic situation caused by the artificial viscosity assigned to the solid region.
Continuity of flow across the interfaces and flow inside the smaller regions are shown after the
solid is pushed from the domain.
FIU-ARC-2017-800006470-04b-255 Chemical Process Alternatives for Radioactive Waste
ARC Year-End Technical Progress Report 17
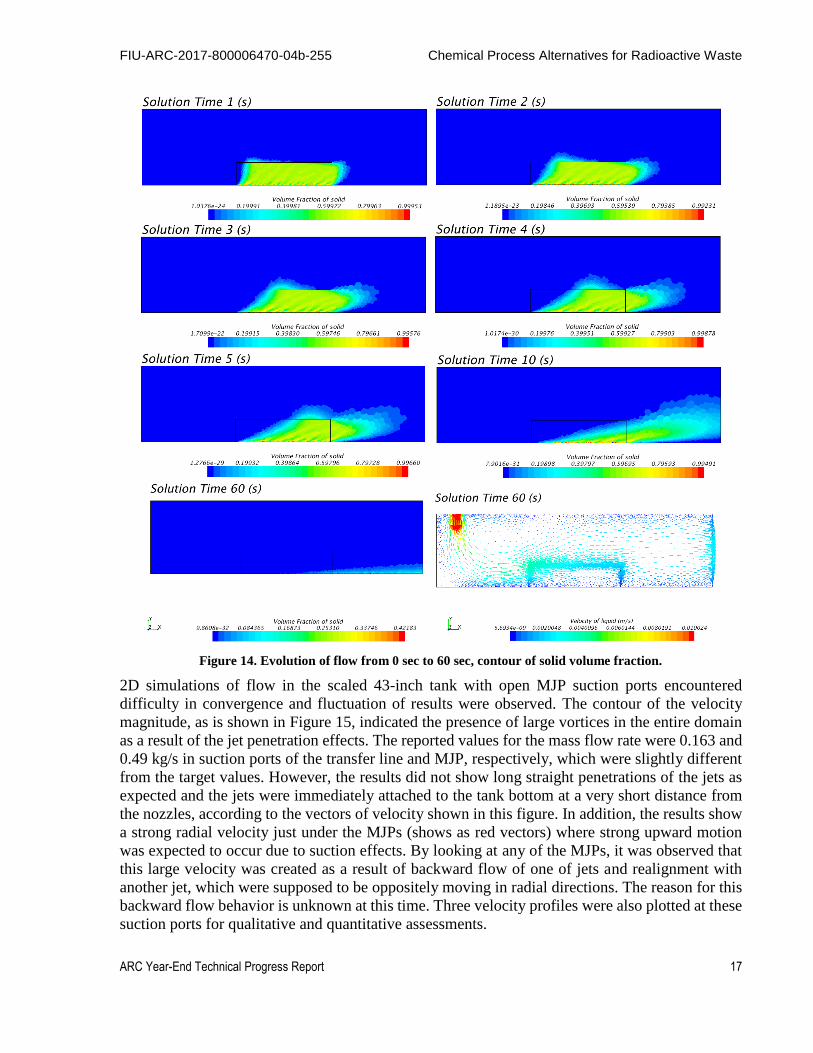
Figure 14. Evolution of flow from 0 sec to 60 sec, contour of solid volume fraction.
2D simulations of flow in the scaled 43-inch tank with open MJP suction ports encountered
difficulty in convergence and fluctuation of results were observed. The contour of the velocity
magnitude, as is shown in Figure 15, indicated the presence of large vortices in the entire domain
as a result of the jet penetration effects. The reported values for the mass flow rate were 0.163 and
0.49 kg/s in suction ports of the transfer line and MJP, respectively, which were slightly different
from the target values. However, the results did not show long straight penetrations of the jets as
expected and the jets were immediately attached to the tank bottom at a very short distance from
the nozzles, according to the vectors of velocity shown in this figure. In addition, the results show
a strong radial velocity just under the MJPs (shows as red vectors) where strong upward motion
was expected to occur due to suction effects. By looking at any of the MJPs, it was observed that
this large velocity was created as a result of backward flow of one of jets and realignment with
another jet, which were supposed to be oppositely moving in radial directions. The reason for this
backward flow behavior is unknown at this time. Three velocity profiles were also plotted at these
suction ports for qualitative and quantitative assessments.

FIU-ARC-2017-800006470-04b-255 Chemical Process Alternatives for Radioactive Waste
ARC Year-End Technical Progress Report 18
Figure 15. Velocity contour and vector filed in 2D simulation of 43” tank with MJP suction ports.
Later, the effect of treating the suction ports of MJPs as being closed (wall B.C.) was studied. The
purpose of this study was to see if strong asymmetry was caused by the presence of the MJP’s
suction ports. This simulation, with MJP suction ports set to the wall B.C., converged to results
that did not fluctuate. As shown in Figure 16, only a dominant large vortice existed in the domain
which was located between the left MJP and the central ALC. A display of velocity vectors in
Figure 16 showed penetration of two opposing jets in the domain; however, an immediate
backflow of one of the two jets was observed. This result indicated no high-velocity region under
the suction ports of MJPs and transfer lines.
Figure 16. Velocity contour and vector filed in 2D simulation of 43” tank without MJP suction ports.
Another observation was obtained by comparing the velocity profiles at the location of suction
ports between the two simulations explained above. The left diagram in Figure 17 does not show
a symmetrical profile at any of the ports in the first simulation. The calculated face-average
velocity value at the transfer line was 1.78 m/s, which was slightly different from the target value
of 2.2 m/s. This discrepancy could be caused by the rectangular configuration of the ports, pipes,
and the tanks two-dimensional domain as opposed to the actual circular configurations. The right
diagram in this figure indicated symmetrical velocity profiles at the suction port of the transfer
line.

FIU-ARC-2017-800006470-04b-255 Chemical Process Alternatives for Radioactive Waste
ARC Year-End Technical Progress Report 19
Figure 17. Velocity profile at the location of MJP and TRN suction ports, MJP port on (left) and off (right).
FIU-ARC-2017-800006470-04b-255 Chemical Process Alternatives for Radioactive Waste
ARC Year-End Technical Progress Report 20
PIPELINE FLUSHING
LITERATURE REIVEW
A review of the literature was conducted that focused primarily on reports generated from previous
flushing practices using (1) non-Newtonian HLW at Hanford and Savannah River sites, and (2)
HLW simulants at national laboratories. The goal was to recognize the existing technological gaps
and to develop test mythologies that could potentially bridge those gaps. This section explains the
theoretical analysis and mythologies that were considered for future testing.
Results reported for flushing tests of 15 simulants in the WTP-RPT-175 Rev. 0 document (Poloski
et al., 2009a) indicated that a minimum flush-to-line volume ratio of two would likely leave behind
only small traces of particles in the pipeline. Increasing this ratio to three was suggested without
guaranteeing that it would clean the pipeline completely. In addition, use of a system with
automatic valve control based on different feedbacks was strongly suggested. The reported results
for several tests indicated that velocity in the pipeline could reach values close to 20 ft/s before
and after a maximum point in density profile. This maximum indicated a maximum of solid
concentration in the pipe outlet. In several cases, high velocities were obtained even in steady
conditions (flat sections of the density and velocity profiles) where traces of particles were
probably flowing in the system. Flow of this solid-liquid mixture with these reported velocities
which were higher than the upper limit set by the design guide (24590-WTP-GPG-M-0058, Rev.
0, Hall, 2006) can cause some level of erosion in the pipeline. This excessive velocity could be
due to the nature of the system as the pneumatic system used for flushing provided flow rates on
the order of 500 gpm to 1000 gpm for a 100-gallon loop. Erosion levels can be magnified by
increased flush duration which could be the scenario in a cross-site pipeline at Hanford. To control
the flow rate while maintaining pressure, an electric pump or other method can replace the
pneumatic flush system.
Further, application of the suspension velocity correlation of Kale and Patwardhan (2005) and
Wells et al. (2011) was examined. This correlation was originally developed for pulse jet mixer
(PJM) applications and potential application of this correlation to pipeline flushing was
investigated. Erosion of a sediment bed sitting in a pipe invert with a bed height equal to the
fraction of pipe inside diameter was considered. It was assumed that a high-velocity flow entering
a partially plugged pipe acts like a jet which impacts on the surface of the sediments. Determining
the velocity of this jet, which is sufficient to erode this sediment layer with a length equal to
multiple pipe diameters, is desired. The nozzle diameter was assumed to be the hydraulic diameter
of the unplugged portion of the pipe’s cross-sectional area, defined as dj = 4* Aunplugged/ Punplugged).
Results of this preliminary application were compared to the critical velocity calculated from
correlation of Oroskar and Turian (1980). Since the suspension velocity is usually higher than the
critical velocity, this comparison could be used as a primitive check on the analysis. Table 3 shows
the results obtained for a solid loading of 20%, solid and liquid densities of 2500 and 999 kg/m3,
respectively, liquid viscosity of 1 cP, and length of the sediment layer of 1 meter or 13.2 times the
pipe diameter (pipe diameter was selected as 3 inches or 0.078 m).

FIU-ARC-2017-800006470-04b-255 Chemical Process Alternatives for Radioactive Waste
ARC Year-End Technical Progress Report 21
Table 3. Calculation of Suspension Velocity for Particles in a 3” pipe
D_pipe/z V_susp d_nozzle* (m)
2 10.43114 0.0046
3 7.780723 0.054
4 6.592275 0.059
5 5.954697 0.062
6 5.562316 0.064
7 5.297831 0.066
8 5.107917 0.067
This value is 0.04m in the analysis of Wells et al. (2011)
To address some of the technical gaps noted in the literature review, it was suggested that FIU’s
current pipeline unplugging system could be modified and used for flushing, re-suspension and
potentially critical velocity studies. The current loop is 270 ft in length but there is room for
expansion up to 2000 ft, if needed.
Experimental Approach for Flushing Study
To provide the necessary pressure head and flow rates in flushing tests, three systems were
considered: (1) use of an elevated water tank with a fixed water level, (2) use of a variable-speed
electric water pump, and (3) use of compressed air to pressurize water in a flush vessel. The third
configuration is meant to advance the flushing system that was used in previous testing (Poloski
et al., 2009a). The systems in the first and third configuration would be equipped with a motor-
operated valve for flow rate adjustment. Results in WTP-RPT-175 Rev. 0 showed that adequate
flushing was obtained with pressure reaching values of 80 to 100 psi during flushing of simulants.
To construct the second system, an electric water pump capable of delivering 100 gpm of water at
80 psi could be a candidate to avoid high velocities in the system. A review of existing
manufacturer products has indicated that a variable frequency drive may be needed to meet these
requirements.
FIU’s flushing test loop will have some differences from the existing loops used for the Hanford
waste testing. A controller module could be used to control the opening and closing of a motor-
operated valve in the first and third system configuration, or to ramp up/down and shut off the
electric pump in the second system configuration. All systems could be excited with a regulated
signal from a controller module to provide variable pressure in the pipeline if such a practice could
result in better flushing performance. This controller can analyze the signals received from a tank
level transmitter and two Coriolis meters placed upstream (right after the water pump, elevated
tank, or the flush vessel) and downstream (close to the capture tank) of the loop to correctly adjust
the flow rate and duration of the flush. Signals from the upstream and downstream meters will
indicate flow velocity and traces of particles (density), respectively. If density signals from the
upstream and downstream meters are very close, then almost pure water is being discharged to the
capture tank and the controller shuts off the water pump to end the flushing operation. As per FIU’s
communications with manufacturers, Micro-Motion F series-2700 and 5700 models provide 4 to

FIU-ARC-2017-800006470-04b-255 Chemical Process Alternatives for Radioactive Waste
ARC Year-End Technical Progress Report 22
20 mA signal outputs of mass and density that could be input into a LabView program for flow
rate and velocity calculations and further used by the controller module.
A slightly more complicated but more accurate system would incorporate a sampling port with a
valve just before the capture tank. Visual inspections or analysis through a particle size analyzer
can then help to qualitatively and quantitatively evaluate the flush performance. Complexity can
be increased by operating based on signals received from other instruments, such as a PulseEcho
sensor, a Lasentec sensor, or from an optical probe in a clear section of the system (Goosen et al.,
2011). The system could be designated empty if no results come from the PulseEcho and Lasentec
sensors. Use of PulseEcho and Lasentec sensors in the loop can be an extension of the sensor
utilization from particle velocity and size measurements in documents WTP-RPT-175 Rev. 0 0
(Poloski et al., 2009a) and WTP-RPT-189 Rev. 0 (Poloski et al., 2009b) to provide real-time
monitoring of the particle presence and concentration during flushing operations.
In this study, a stationary bed will be manually created in the system. The procedure will be based
on the sequential creation of sliding and stationary beds in the loop. FIU will initially run the
system without the flushing tank/pump components in order to fill the system. Then, by changing
valve configurations, the slurry will be circulated in the system without running through the mixing
tank. This step is necessary to keep the solid content constant in the loop. At this stage, the system
will function similar to the WRPS Waste Certification Loop. Then, the system will be run in steady
state mode and near the deposition velocities to obtain a sliding bed that will be moving in the
entire horizontal sections of the system. The effort will first focus on achieving a uniform bed in
the entire system. Later, different sediment shapes will be achieved by ramping the velocity in
different modes and rates.
FIU is currently investigating instrumentation that is capable of detecting particles in dilute
concentrations in high-velocity streams. This condition occurs close to the end of the flushing
operation. According to Denslow et al. (2011), PulseEcho cannot be used for this application
because of insufficient backscattered signals. This issue was not reported for the Lasentec sensor.
Results reported by Bontha et al. (2000) showed the capability of this sensor to detect particles in
the range of 0.8 to 1000 µm. Lasentec can produce particle size distributions and update this
information every two seconds (according to Poloski et al., 2009a) which is a relatively long time
for this application. FIU is currently interested in the possibility of obtaining data from Lasentec
in much shorter time intervals.
Initial phases of this study will involve simple simulants which can physically represent actual
waste in the WTP. Simple simulants that were used in PNNL’s M1 tests (Poloski 2009a, b and
Yokuda et al., 2009) will be considered. The goal will be to compare results obtained by FIU’s
loop with those obtained in M1 test results as a baseline test. Other important criteria in the
selection of simulants is the availability of flushing test results and the similarity of test loops to
FIU’s loop. For this reason, simulants used in the PNNL-17639, WTP-RPT-175 Rev. 0 report
(Poloski 2009a) were considered. Various simulants in the form of glass beads (two sizes, 10 µm
and 100 µm), 50 µm alumina, and 316 stainless steel (two sizes, 10 µm and 100 µm) in water-
kaolin suspension will be considered.
For the initial studies, FIU will choose one or two simulants from a matrix of 6 non-Newtonian
simulants based on ease of testing and availability of material. Instability issues associated with
simulants used in the PNNL-18316 WTP-RPT-189 Rev. 0 document (Poloski et al., 2009b) will
be considered. In preparation of the test matrix for simulant selection, size, density, yield stress,

FIU-ARC-2017-800006470-04b-255 Chemical Process Alternatives for Radioactive Waste
ARC Year-End Technical Progress Report 23
and viscosity will be considered. Water will be the primary component of the carrier fluid. Kaolin
clay and MgSO4 (in 10 ppm) will be used to adjust the shear viscosity and yield stress, respectively.
Kaolin clay with particle size of 1 µm and density of 2~3 g/cm3 will be considered. Medium- and
high- rheology simulants (τy =3 and 6 Pa) with small, medium, and high density, and medium and
large particle sizes will be considered in the initial test matrix. Table 4 shows the matrix for
simulant selection for the flushing tests.
Table 4. Candidate Simulants for Use in Initial Phases of the Flushing Tests
name Al2O3-MR GB-MR SS-MR Al2O3-HR GB-HR SS-HR
Volume fraction % (Mass fraction %)*
Coarse Particle
Kaolin Clay
Water
9.5(25.6)
8.9(16.0)
81.6(58.4)
8.4(16.9)
7.7(15.5)
83.9(67.6)
3.9(22.9)
6.5(11.8)
89.6(65.3)
9.7(25.7)
10.7(18.7)
79.6(55.6)
10.7(20.6)
9.6(18.4)
79.7(61.1)
4.8(26.5)
6.4(11.2)
88.8(62.2)
Al2O3: Aluminum Oxide, density: 4~6 g/cm3, particle size:50µm
G.B. : glass beads, density: 2~4 g/cm3, particle size: 100µm
SS: Stainless Steel, density:8~10 g/cm3, particle size: 100µm
MR and HR stand for medium rheology (τy = 3 Pa) and high rheology (τy = 6 Pa), respectively.
* Mass fraction will be varied in each round of tests. Values are available in Poloski et al. (2009a) and are the
baseline for future variations. Solid loading will be changed with ±5% and ± 10% increments.
Initial testing will start with a 165-foot loop which is similar to PNNL’s M1 test loop in length.
FIU will also focus on mid-density material such as aluminum oxide in both high and medium
rheologies. Studies will continue with high-density stainless steel in later phases in addition to the
full range of particle sizes and different test loops lengths.
Variables considered in the test matrix will include: simulant material (carrier material type,
particle type and concentration), operation of pump mode (fixed, ramped, pulsing), flush duration,
number of flushes (1, 2, and 3), bed formation (triangular, rectangular, and waveform) and loop
length (165, 330, 495, 660, and 825 ft).
In the initial phases of the flushing study, a fixed-volume test strategy will be used. A potential
test matrix is provide in Table 5, with a total of 24 tests for the initial phase of testing. This table
shows the test matrix using a simulant with 16% kaolin clay, 25.6% AL2O3 and 58.4% water for
the 165 foot test loop that creates a uniform sediment bed. Resultant flush duration and line to
volume ratio are also calculated and shown in the left two columns. The sediment shape will not
be the priority in the initial phases and uniform beds will initially be obtained in the system. Best
flush practices will be evaluated by starting the flushing with a resulting total flush-to-line volume
of 2. Low values were selected because testing results in WTP-RPT-175 Rev. 0 showed a sudden
drop of velocity after the velocity reached a maximum. The challenge will be to examine low
values by keeping the flow velocity constant during flushing. In this test phase, the tank level
indicator will be used for flush volume calculations. The indicator signal will also be used for
stopping the pump.
When signals received from the Lasentec indicate there are no particles detected, the pump will be
stopped. For performance evaluations, signals from a Coriolis meter will be considered as well.

FIU-ARC-2017-800006470-04b-255 Chemical Process Alternatives for Radioactive Waste
ARC Year-End Technical Progress Report 24
Therefore, columns related to total and per-flush line-to-volume ratio are tentative. This practice
will be similar to those reported in WTP-RPT-175 Rev. 0. In subsequent phases, FIU may consider
target flush volumes and stop the pump based on the signal received from the tank level indicator.
In addition, non-uniform sediment shapes, stainless steel beads and longer test loops may be
considered in a future test matrix.
Table 5. Matrix for Flushing Test using 165-ft Test Loop
Test
Number
Flush
Mode
Number of
flushes
Flush to line
volume ratio,
(per flush)
Resultant
Duration
Per flush
(sec)
Resultant
flush to line
volume ratio
1 Constant* 1 2 27.4 2
2 Ramped 1 2 27.4 2
3 Pulsed 1 2 27.4 2
4 Constant* 2 1 13.7 2
5 Ramped 2 1 13.7 2
6 Pulsed 2 1 13.7 2
7 Constant* 1 3 41 3
8 Ramped 1 3 41 3
9 Pulsed 1 3 41 3
10 Constant* 2 1.5 20.5 3
11 Ramped 2 1.5 20.5 3
12 Pulsed 2 1.5 20.5 3
13 Constant* 1 4 54.8 4
14 Ramped 1 4 54.8 4
15 Pulsed 1 4 54.8 4
16 Constant* 2 2 27.4 4
17 Ramped 2 2 27.4 4
18 Pulsed 2 2 27.4 4
19 Constant* 1 5 68.4 5
20 Ramped 1 5 68.4 5
21 Pulsed 1 5 68.4 5
22 Constant* 2 2.5 34.2 5
23 Ramped 2 2.5 34.2 5
24 Pulsed 2 2.5 34.2 5 * This value must be found experimentally. The default value is 12 ft/s if no plugging formation will be observed.
Ramping starts from a safe velocity (default 8 ft/s) that must also be found and the continues to 12 ft/s
Pulse will be between the safe velocity (default 8 ft/s) and the maximum velocity (12 ft/s)
Proposed test loop operations
Defining a correct test protocol consisting of sequential steps was an important step in developing
a suitable test plan. The proposed protocol includes the following general steps:
1. Create and mix the simulant in the mixing tank.
2. Run the slurry pump to fill the system.

FIU-ARC-2017-800006470-04b-255 Chemical Process Alternatives for Radioactive Waste
ARC Year-End Technical Progress Report 25
3. Circulate the slurry by bypassing the mixing tank and create a stationary bed after creating
a sliding bed and stopping it. At this stage, the system will function similarly to the WRPS
Waste Certification Loop (Bontha et al., 2010).
4. Control the solids loading by changing the concentrations in the slurry mixing tank and
bring the mixing tank back to the loop. Return to step 3.
5. Start the flushing test and stop after a certain time or after a certain flush volume.
6. Evaluate how much solid is left behind after step 5. One of the following will be used:
a. Capture the residual solids in a special filter bag inside the capture tank.
b. Circulate the residuals in a loop using the slurry pump and capture the residual
solids progressively in a special filter inside a water tank. This step requires
cleaning the slurry pump using water in a special cleaning line.
The proposed test loop will be an integrated test loop for flushing studies with the potential for
evaluating critical velocities. This loop, as shown in Figure 18 and Figure 19, was designed to have
the following features: (1) detection of the onset of particle deposition using the PulseEcho sensor,
(2) inline monitoring of particles in the flush stream, (3) post-flush evaluation of solid residuals,
(4) cleaning of slurry pump and its attached line, (5) modularity in length (165, 330, 495, 660, and
825 ft), (6) automatic control of valves and the flush pump, (7) automatic termination of flush
operation using signals from Lasentec and an in-tank level transmitter, and (8) several visualization
sections for easy visualization of the flow.
FIU is in the process of assessing the availability of equipment that is necessary for simulant
preparation as well as flow rate and pressure measurements. The current test loop at FIU is a
pipeline system, approximately 270 feet in length and consists of 3-inch-diameter carbon steel
schedule 40 pipes. The system is currently ready to be connected to tanks, pumps, and other
instrumentation to form a test loop. FIU has the capacity to make this pipeline shorter or longer
(up to 2000-ft) for down-scaling and up-scaling purposes. Figure 19 shows a schematic of a down-
scaled loop with 90, 180, and 270-feet lengths.
It is expected that the proposed system will allow for visibility of sediment bed or plug formation
and characterization of the system before and after flushing operations. A list of proposed
instrumentation is included in Table 6.
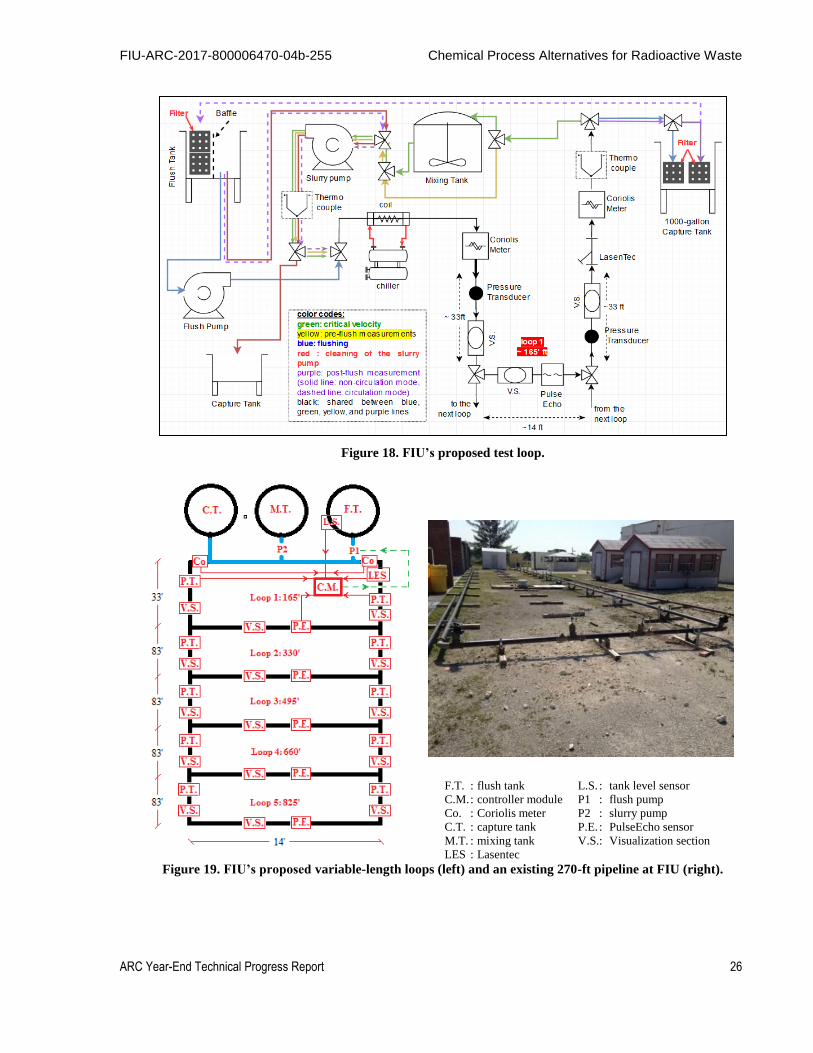
FIU-ARC-2017-800006470-04b-255 Chemical Process Alternatives for Radioactive Waste
ARC Year-End Technical Progress Report 26
Figure 18. FIU’s proposed test loop.
F.T. : flush tank L.S. : tank level sensor
C.M. : controller module P1 : flush pump
Co. : Coriolis meter P2 : slurry pump
C.T. : capture tank P.E. : PulseEcho sensor
M.T. : mixing tank V.S. : Visualization section
LES : Lasentec
Figure 19. FIU’s proposed variable-length loops (left) and an existing 270-ft pipeline at FIU (right).

FIU-ARC-2017-800006470-04b-255 Chemical Process Alternatives for Radioactive Waste
ARC Year-End Technical Progress Report 27
Table 6. Information Required from Flushing Test
Variable Instrument type #
Mass flow rate Coriolis meter Micro-Motion F
series model 2700 2
Density
Pressure differential pressure transducer 2,4,5,
6,8,10
Mixing tanks with agitator 400 Gallons 1
Water tank 1000 Gallons 1-2(a)
Capture tank 1000 Gallons 1-2
Electric water pump TBD (b) 1
Slurry velocity and stratification PulseEcho 2(c)
Sediment bed characterization PulseEcho 1
Particle trace measurement The Mettler Toledo Lasentec 1
Control module TBD 1
Motor-operated valves TBD 1
Tank level transmitter TBD 1
Rheometer TBD 1
Slurry pump TBD (15 HP for 165’ loop) 1
Particle size analyzer TBD 1
Data Acquisition (DAQ) TBD 1
Flow characterization/observation Visualization section 3,5(d)
Slurry temperature control Chiller 1
Slurry temperature Thermocouple 2

FIU-ARC-2017-800006470-04b-255 Chemical Process Alternatives for Radioactive Waste
ARC Year-End Technical Progress Report 28
CONCLUSIONS
A turbulent velocity profile obtained from a RANS simulation with the Inverse_Global_alpha
method closely matched the experimental profile at Re=25300. Considering the results obtained
in the previous year for the mean velocity, it is concluded that this version can reliably represent
fully turbulent flows. A conclusion could not be drawn for any versions of the alpha model for the
transitional flows when considering both the mean and turbulent velocity profiles together. Efforts
for validating turbulent quantities of a transitional flow using a fully turbulent model was not
conclusive.
Mean and turbulent velocity profiles were also obtained for the Q-DNS-HB simulation of the fully
turbulent flow and a close agreement with the experimental values were obtained. With that
verification, shear dependency analysis of the Q_DNS_HB simulation results indicated
convergence of shear rate to constant values in high ε/k values. Converged values were 1867 s-1
and 1782 s-1 for urms/η =[0 to 400 s-1] and urms/η > 400 s-1, respectively.
Furthermore, comparison between RANS-alpha and Q-DNS-HB simulations showed that
variations of shear rate versus urms/η were qualitatively similar. Similarity was observed for the
shear rate variations against TDR/TKE if only high values of urms/η (bottom envelope of ϒ versus
TDR/TKE) were considered. For this reason, only the Q-DNS-HB simulation results were
considered for generation of a shear rate modification algorithm.
Implementation of the Q-DNS-HB-based shear rate modification algorithm in the RANS-HB was
successfully demonstrated in Star-CCM+. Shear alterations resulted in remarkable improvement
of accuracy over most of the range of r/R and results converged to those of the RANS-alpha and
Q-DNS-HB methods with less than 2 percent deviation. Potential future work could focus on
extending the shear dependency analysis presented to different Reynolds numbers and for the same
or different simulant/s using Q-DNS-HB and RANS-HB approaches.
CFD simulations of the in-tank waste mobilization showed that simulating erosion without
changing the volume fraction directly in Star-CCM+ was possible. It was shown that without
solution of the granular temperature and pressure, a symmetric diffusion occurs to the solid layer,
which did not comply with asymmetric boundary conditions of the simulation. However, setting a
large value of viscosity in the solid layer resulted in deformation of the sediment layer and
diffusion of the solid in the liquid phase (suspension). This solid diffusion increased over time at
an extremely slow rate, which was related to the fact that the artificial viscosity was set to a
significantly large value. Potential future efforts could focus on the incorporation of the calculation
for solid pressure and granular temperature, which sets additional bounds to the solid volume
fraction.
Simulations in the 1:21 scaled tank showed a significant impact due to the presence of the MJP
suction port. This could be due to any inaccurate modeling parameters or potential numerical
limitations caused by the proximity of the suction ports to the tank bottom and MJP nozzles.
Potential future work could be to evaluate the effects of mesh size and solution schemes on the
numerical accuracy and performance. The aim would be to obtain converged solutions with the
presence of MJP suction ports that are connected to MJP nozzles via a field function for mass flow
rate. A rotating jet could be created via a sliding mesh in the model and similar investigations
could be performed.

FIU-ARC-2017-800006470-04b-255 Chemical Process Alternatives for Radioactive Waste
ARC Year-End Technical Progress Report 29
Finally, a test plan consisting of protocol, matrix, and experimental test loop was proposed to
evaluate technical gaps in current flushing operations. The test plan is currently being evaluated
by engineers from PNNL and SRNL. Their feedback regarding simulant composition, test matrix,
instrumentation, and test protocol will be incorporated into the test plan. Future work will include
finalizing the test plan and modification of the current test loop. Subsequent testing phases may
involve varying initial sediment configurations, simulant composition and pipeline length. The test
loop can also be modified to address other relevant waste transfer issues including critical velocity
and erosion and corrosion.

FIU-ARC-2017-800006470-04b-255 Chemical Process Alternatives for Radioactive Waste
ARC Year-End Technical Progress Report 30
TASK 17.1.2 CFD MODELING OF NON-NEWTONIAN FLUID UNDERGOING
SPARGING (FIU YEAR 7)
EXECUTIVE SUMMARY
The Waste Treatment and Immobilization Plant (WTP) will house pulsed jet mixers (PJMs) in
waste processing tanks that require improved computer models for the prediction of slurry mixing
behavior. The nature of the high level-waste (HLW) in these tanks can be represented using non-
Newtonian fluid viscosity modeling. In order to enhance and expedite this mixing process, the
implementation of sparging to the PJMs is being considered. Currently, the PJM process is
undergoing research and validation at NETL’s Morgantown site. At this site, an experiment
investigating the time for a tracer to become fully mixed in the non-Newtonian fluid while
undergoing sparging was conducted. This is due to a lack of knowledge on the effect of rheological
properties and sparging flow rates on the flow characteristics of the PJM vessels for improved
mixing.
A sparging application that has been researched prominently in the scientific community is that of
bubble columns. In the analytical assessment of flow characteristics in bubble columns, the radial
air volume fraction and axial velocity profiles are studied. Numerous studies, numerical and
experimental, have been conducted on bubble columns with Newtonian fluids. These studies have
investigated the effects of alterations on the rheological properties, sparging flow rates, and
characteristic ratio (𝐻
𝐷). A few experimental works on bubble columns which contain non-
Newtonian fluids have been conducted in the literature. These works have looked into the effect
of altering the rheological properties and sparging flow rates but not on the 𝐻
𝐷 ratio effects.
Specifically, there is no literature investigating flow characteristics in 𝐻
𝐷 ratios as low as those
observed in the PJM waste tanks. Furthermore, no literature on simulating sparged non-Newtonian
fluids has been identified. Thus, the purpose of this task is to use CFD in order to study the flow
characteristics under PJM characteristic ratio.
The current CFD study uses existing experimental work on non-Newtonian bubble columns to
develop and validate a CFD model. The model produced closely matched the experimental radial
air volume fraction profile and qualitatively matched the experimental radial air axial velocity
profile. This simulation then used the develop simulation to assess the flow characteristics at five
different characteristic ratios, namely 𝐻
𝐷= 5.2, 3.8, 2.4, 1.37, and .34, where the lowest
𝐻
𝐷 ratio
pertains to that of the PJM geometric condition. The results showed a trend of flattening radial air
volume fraction and radial air axial velocity profile with decreasing characteristic ratio. This was
attributed to the relative proximity of the sparging flow rate inlet location to the height of the
column, not giving enough time for fully developed flow. In addition, a slight increase in volume
fraction magnitude and a decrease in air velocity magnitude are observed with decreasing
characteristic ratio. A plug profile for both air axial velocity and air volume fraction is expected
for sparging under PJM geometric conditions.

FIU-ARC-2017-800006470-04b-255 Chemical Process Alternatives for Radioactive Waste
ARC Year-End Technical Progress Report 31
INTRODUCTION
Many engineering processes at various U.S. Department of Energy sites include the flow of nuclear
waste in a liquid form that is characterized as a non-Newtonian fluid. These operations require that
the waste be properly mixed. Pulse jet mixing (PJM), as shown on the left of Figure 20, is one of
the methods selected by the DOE to mix the HLW slurry prior to the vitrification process. This
method involves sucking a portion of the waste from the tank into a pressurized vessel and then
injecting it back into the tank in order to mix the waste using pressurized jets. This process is
repeated over a number of cycles until the desired level of homogeneity is achieved [1].
Figure 20. General flow structure in PJM vessel (left), radial wall jet depiction (Poreh et al. 1967) (right).
Currently, the PJM process as applied to the nuclear waste at Hanford is undergoing research and
validation. For example, the implementation of sparging during the PJM process is being
considered in order to expedite the mixing process. At NETL’s Morgantown site, testing of the
PJM process with non-Newtonian fluid is currently being directed. An experiment investigating
the time for a tracer to become fully mixed in the non-Newtonian fluid while undergoing sparging
was conducted. This is due to a lack of knowledge on the effect of rheological properties and
sparging flow rates on the flow characteristics of the PJM vessels for improved mixing.
The primary focus of this task is to conduct computational fluid dynamics (CFD) analysis to
develop a simulation that is capable of studying the effects that rheological properties,
characteristic dimensional properties, and sparging flow rates have on the sparging process. An
assessment of this aspect of the PJM process is critical to the successful design and implementation
of the PJMs which are used for treatment and storage of nuclear waste.

FIU-ARC-2017-800006470-04b-255 Chemical Process Alternatives for Radioactive Waste
ARC Year-End Technical Progress Report 32
LITERATURE REVIEW
Gas-sparged vessels have been used in process industries for a number of years. Bubble column is
a general term describing gas-sparged vessels. Bubble columns are widely used in the chemical
industry and in several applications within the nuclear energy industry [3]. Specific applications
of bubble columns are seen in the production of baker’s yeast, citric and amino acids, metals,
microbial fuel cells, and many more [4-8]. These kinds of systems are widely used because they
offer favorable mass transfer and mixing characteristics at a feasible cost due to their mechanical
simplicity [9].
The existing literature on bubble columns articulates the unsteady behavior flow in a bubble
column. This unsteady behavior is a significant factor in the mixing and transport progression in
bubble column flows and occurs at varying spatial and temporal scales [10]. These unsteady
features are undoubtedly affected by geometrical factors (e.g., liquid height, geometric
characteristics, and sparger flow rate). For this reason, experimental works on bubble columns are
identified by a liquid height, characteristic length, and a superficial gas velocity range (sparger
flow rate). One of the significant effects of the mentioned parameters is on the nature of the bubble
flow, as shown in Figure 21.
Figure 21. Bubble column flow regime based on characteristic length and flow rate.
From Figure 21, it can be seen that there are four different kinds of bubbly flow in a bubble column
as a function of the superficial gas velocity Ug and column diameter Dc. These are homogenous,
heterogeneous (Churn-turbulent), transitional, and slug bubbly flow regimes. Homogenous and
heterogeneous bubbly flows characterize the distribution of bubble diameters. Slug flows are
characterized by an agglomeration of bubbles which are observed to be passing large bubbles. The
context of this effort maintains its focus on homogeneous bubbly flow as that is the flow that is
proposed for the PJMs.
In the literature, most of the earlier experimental studies were conducted on rectangular bubble
columns and mainly focused on investigating time averaged behavior of a Newtonian fluid. For
example, Becker et al., Pfleger et al., Pan et al., and Buwa all studied rectangular bubble columns
[11-15]. According to Rampure et al., this was due to the fact that plume oscillations in this
geometry were already well established. It was also due to simpler geometry, which reduces

FIU-ARC-2017-800006470-04b-255 Chemical Process Alternatives for Radioactive Waste
ARC Year-End Technical Progress Report 33
computational requirements while still retaining key characteristics observed in cylindrical bubble
columns.
Experimental studies of cylindrical bubble columns, the shape of the waste tanks at Hanford, have
also been conducted for Newtonian fluids. For example, Chen et al. [16] studied the effect of
column size on heat transfer characteristics and volume fraction profile under 𝐻
𝐷≅ of 10, 5, & 2.5
and superficial gas velocities of .02-.09 𝑚
𝑠. Chen recorded that gas volume fraction profiles were
parabolic and symmetric in nature. He also noted that with increasing 𝐻
𝐷 there was a flattening of
the parabolic gas volume fraction profile. Rampure et al. [10] investigated the effects of H
D = 5 and
10 under superficial gas velocities of .01-.2 m
s on the dynamic and time averaged flow behavior of
cylindrical bubble columns. Rampure also noticed that oscillations of bubble swarms had varying
time scales, unlike that of rectangular bubble columns. In a later study, Rampure et al. [17] also
studied bubble columns at higher superficial gas velocities (up to .4 𝑚
𝑠) under a similar
characteristic ratio (𝐻
𝐷=5) by measuring local time-averaged gas holdup and velocity profiles.
Rampure also looked into mixing times, where the mixing times asymptotically approached a
minimum value as superficial gas velocities were increased. As a more recent example, McClure
et al. [18] investigated bubble size distribution (BSD) as a function of sparger design using 𝐻
𝐷=2.5
and superficial gas velocities of .01 to .11 𝑚
𝑠. McClure observed that BSD in water air systems
changed significantly with column height and insignificantly with increasing superficial velocities
at the range tested.
Experimental investigations of cylindrical bubble columns with non-Newtonian fluid are not as
plentiful in number as they are with Newtonian fluids. Amin E. et al. [19] showed radial
distribution of both upward gas velocity and volume fraction for an array of non-Newtonian fluids
in a bubble column with a 𝐻
𝐷=2.5 tested at superficial velocities between .04 and .2
𝑚
𝑠. Cécile et al.
[20] similarly studied mixing time in a bubble column using non-Newtonian power law fluids as
a function of superficial gas velocities. The experiment had an 𝐻
𝐷=1.75 and was tested at superficial
gas velocities of .001 - .008 𝑚
𝑠. Kawase et al. [21] conducted experiments on a bubble column with
fermentation broths having a yield stress behavior. In his work, he detailed total gas hold up as a
function of superficial velocity and axial velocity as a function of superficial velocity for a
superficial velocity range of .01 and .1 m
s. Although this fluid is the one of interest, no information
on radial distributions of these quantities is given which would better serve for proper validation.
Lastly, Junya Knitta et al. [22] investigated cylindrical bubble columns with fluids showing both
yield stress and power law behavior. Junya also recorded total gas hold up, but noticed that a
certain amount did not escape the bubble column due to the yield stress behavior. This experiment
was performed for 𝐻
𝐷=5, 10 under superficial gas velocities of .01 to .1
𝑚
𝑠.
In addition to the experimental work conducted on cylindrical bubble columns, CFD simulations
in this subject have also been conducted but are limited in number. McClure et al. [18, 23] have
conducted Euler-Euler transient simulations of Newtonian bubble columns, matching axial
velocity and volume gas fractions profiles radially at different heights. Mohan et al. [17] conducted
FIU-ARC-2017-800006470-04b-255 Chemical Process Alternatives for Radioactive Waste
ARC Year-End Technical Progress Report 34
similar simulations and was able to accurately capture data for a range of superficial gas velocities
(0-.4 𝑚
𝑠). Lijia Xu et al. [24] also used a Euler-Euler approach to investigate gas volume fraction
profiles of a slurry in a bubble column. The viscosity model used in this approach was the Thomas
semi-theoretical correlation, which does not take into account yield stress.
The CFD studies mentioned recognized the drag force, lift, particle induced turbulence, and virtual
mass force as relevant forces to be considered. Furthermore all three studies used RANS modeling,
neglected virtual mass force, and agreed that drag was the most dominant force largely contributing
to the dynamics of the problem. Worthy of note is that McClure et al. was the only study which
took turbulent dispersion into account while Lijia Xu et al. was the only study to incorporate the
lift force. All the mentioned CFD studies were conducted using different versions of the
commercial code Fluent. To the authors knowledge, there are no CFD simulation models of bubble
columns with power law or visco-plastic fluids.
Given the limited examinations conducted on sparged non-Newtonian fluids, it is not surprising
that none of the studies investigate the H
D ratio and shear thickening effect on non-Newtonian
bubble columns. This area of study is beneficial to the implementation of sparging as a second
means of mixing in the PJM process due to the fact that waste tanks are known to vary in size and
thus capacity. These parameters will be the focus of this work.
FIU-ARC-2017-800006470-04b-255 Chemical Process Alternatives for Radioactive Waste
ARC Year-End Technical Progress Report 35
NUMERICAL APPROACH
In order to investigate rheological and physical effects on a sparged non-Newtonian fluid, a finite
volume method was employed using the commercial code ANSYS Fluent v16. All of the theory
presented is obtained from the Ansys fluent theory manual [25] and includes the governing
equations, initial conditions, and boundary conditions.
Governing equations
The Eulerian-Eulerian multiphase flow model in ANSYS Fluent V14.5 was chosen to simulate all
of the bubble column simulations. An alternative to the Eulerian-Eulerian model for bubbly two-
phase flow is the Eulerian-Lagrangian model, where bubbles are individually tracked as a discrete
phase. The Eulerian-Lagrangian model for this reason becomes computationally intensive for large
quantities of discrete phases, leaving the Eulerian-Eulerian model the feasible alternative for this
work.
The main characteristic of the Eulerian-Eulerian model is that it mathematically represents each
phase as interpenetrating continua. In addition, the volume of a phase cannot be occupied by
another phase, introducing the concept of volume fraction. The sum of all volume fractions is equal
to one for all space and time. This is mathematically expressed in ANSYS Fluent V14.5 user’s
manual for each phase as:
∑ 𝛼𝑜 = 1𝑛𝑜=1 (1)
where α represents the volume fraction of phase o. In the bubble column under question, only two
phases exist, namely the non-Newtonian liquid and gas in the form of air. The liquid is referred to
as the primary phase and the gas is referred to as the secondary phase. The effective density of
each phase is calculated in the following manner:
𝜌�� = 𝛼𝑜𝜌𝑜 (2)
where ρ0 is the density of phase o. Furthermore, the conservation of mass and momentum laws
are fulfilled by each phase, meaning that a set of equations is solved per phase. The continuity
equation for phase o is:
𝑑
𝑑𝑡(𝛼𝑜𝜌𝑜) + 𝛻 ∙ (𝛼𝑜𝜌𝑜𝜈𝑜 ) = ∑ (𝑚𝑝𝑜
𝑛𝑝=1 − 𝑚𝑜𝑝) (3)
where 𝜈𝑜 is the velocity vector of phase o and p represents the second phase. In this study, no mass
transfer or reactions occur, equating the continuity equation to zero. The conservation of
momentum equation for each phase o is:
where 𝑃 is the pressure, 𝜏�� is the stress tensor, 𝑔 is gravity, 𝐾𝑝𝑜 represents the interphase
momentum exchange coefficient, 𝐹𝑜 is the body force, and 𝐹𝑣𝑚,𝑜 is the virtual mass force.
𝑑
𝑑𝑡(𝛼𝑜𝜌𝑜𝜈𝑜 ) + 𝛻 ∙ (𝛼𝑜𝜌𝑜𝜈𝑜 𝜈𝑜 ) = −𝛼𝑜𝛻𝑃 + 𝛻 ∙ 𝜏�� + 𝛼𝑜𝜌𝑜𝑔 + ∑ 𝐾𝑝𝑜(
𝑛𝑜=1 𝜈𝑝 − 𝜈𝑜 ) + (𝐹𝑜
+ 𝐹𝑣𝑚,𝑜 ) (4)
FIU-ARC-2017-800006470-04b-255 Chemical Process Alternatives for Radioactive Waste
ARC Year-End Technical Progress Report 36
The first term on the left hand side of Eq. (4) represents the transient changes in momentum and
the second term is the changes of the convection term. The first term on the right hand side takes
into account pressure changes. The second term on the right hand side represents the stress tensor
term, defined by:
𝜏�� = 𝛼𝑜𝜇𝑜 (𝛻𝜈𝑜 + (𝛻𝜈𝑜 𝑇)) + 𝛼𝑜(𝜆𝑜 −
2
3𝜇𝑜)𝛻 ∙ 𝜈𝑜 𝐼 (5)
where 𝜆𝑜and 𝜇𝑜 represent the bulk and shear viscosity of phase o, upper script T symbolizes the
transpose, and 𝐼 is the identity matrix. Furthermore, the third term takes into account acceleration
due to gravity. The fourth term includes the interaction forces between the two phases as well as
mass transfer between phases. The fifth and final term on the right hand side represents the body
force and the virtual mass forces.
In the context of this work, there is no mass transfer and the compressibility of phases will be
neglected, yielding the following conservation of mass equation:
𝑑
𝑑𝑡(𝛼𝑜𝜌𝑜) + 𝛻 ∙ (𝛼𝑜𝜌𝑜𝜈𝑜 ) = 0 (6)
and the following stress tensor:
𝜏�� = 𝛼𝑜𝜇𝑜 (𝛻𝜈𝑜 + (𝛻𝜈𝑜 𝑇)) (7)
The interphase exchange coefficient is a function of the drag. The Schiller-Naumann drag model
is used as it is well accepted in the area of bubbly multiphase flows ([3], [26]). The drag force
predicted by Schiller-Naumann model is described as follows:
𝑓 =𝑐𝐷𝑅𝑒
24 (8)
where 𝑐𝐷the coefficient of drag and 𝑅𝑒 is the Reynolds number. The coefficient of drag is
computed in the following manner:
𝑐𝐷 = {24(1+.15𝑅𝑒
.687)
𝑅𝑒 , 𝑅𝑒 ≤ 1000
. 44 , 𝑅𝑒 ≥ 1000 (9)
where
𝑅𝑒 =𝜌𝑜|𝜈𝑝 −𝜈𝑜 |𝑑𝑏
𝜇𝑜 (10)
Turbulence
The turbulence model chosen for this multiphase flow is the RANS 𝒌 − 𝜺 RNG model. It is
important to note that the standard 𝑘-𝜀 model was originally intended for single phase flow but
several studies such as the ones conducted by Dale McClure, Rampure et al., Sokolichin, and
Eigenberger [10, 18, 27] have shown that the standard 𝑘-𝜀 models give physically accurate results
for bubble columns. This fact supports the use of the k–ε RANS models in bubble column
simulations. Furthermore, Xe et al. [28] and Laborde-Boutet et al. [29] investigated the

FIU-ARC-2017-800006470-04b-255 Chemical Process Alternatives for Radioactive Waste
ARC Year-End Technical Progress Report 37
implementation of different k–ε models and compared simulation results with the experimental
data of Chen [30]. The results indicated that RNG k–ε model was best able to capture the flow
characteristics in bubble columns within the turbulent regime.
Rheological modeling
In Fluent, there are a number of ways to model non-Newtonian fluids. For the scope of this work,
the power law model in Fluent is discussed. The non-Newtonian viscosity for isothermal
conditions is given by:
𝜂 = 𝑘 ∗ ��𝑛−1 (11)
where k and n are the consistency index and power law index, respectively. The value of the power
law index determines what kind of fluid it is. If n is equal to one, then it is a Newtonian fluid. If n
is greater than one, it is referred to as a shear thickening fluid and, lastly, if n is less than one, the
fluid is shear thinning.
In order to obtain a reliable CFD model, a number of steps are taken to validate the final model
through which sparging of a non-Newtonian fluid may be investigated. This is achieved by first
validating a simulation of sparged Newtonian fluid with existing experimental data. Then a second
simulation will be conducted in which experimental data of power law fluids is matched. Once a
degree of accuracy is reached within the validation process, rheological and physical
characteristics of the simulation will be altered systematically and conclusions will be discerned.
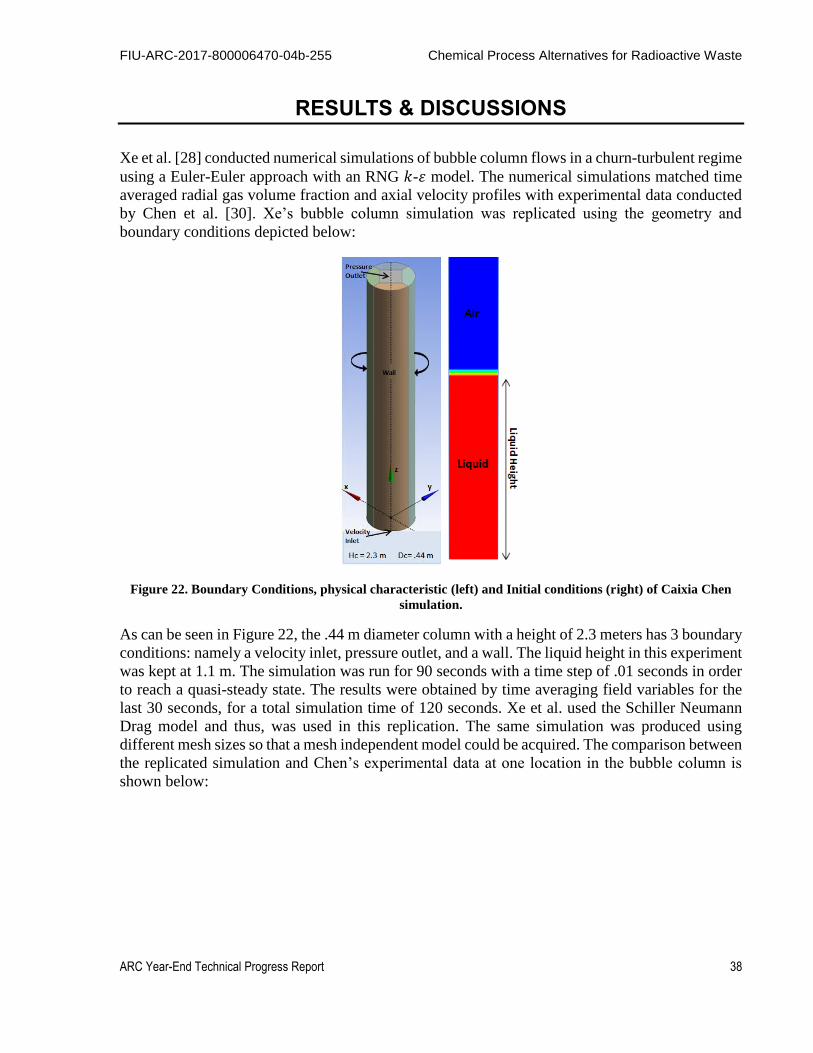
FIU-ARC-2017-800006470-04b-255 Chemical Process Alternatives for Radioactive Waste
ARC Year-End Technical Progress Report 38
RESULTS & DISCUSSIONS
Xe et al. [28] conducted numerical simulations of bubble column flows in a churn-turbulent regime
using a Euler-Euler approach with an RNG 𝑘-𝜀 model. The numerical simulations matched time
averaged radial gas volume fraction and axial velocity profiles with experimental data conducted
by Chen et al. [30]. Xe’s bubble column simulation was replicated using the geometry and
boundary conditions depicted below:
Figure 22. Boundary Conditions, physical characteristic (left) and Initial conditions (right) of Caixia Chen
simulation.
As can be seen in Figure 22, the .44 m diameter column with a height of 2.3 meters has 3 boundary
conditions: namely a velocity inlet, pressure outlet, and a wall. The liquid height in this experiment
was kept at 1.1 m. The simulation was run for 90 seconds with a time step of .01 seconds in order
to reach a quasi-steady state. The results were obtained by time averaging field variables for the
last 30 seconds, for a total simulation time of 120 seconds. Xe et al. used the Schiller Neumann
Drag model and thus, was used in this replication. The same simulation was produced using
different mesh sizes so that a mesh independent model could be acquired. The comparison between
the replicated simulation and Chen’s experimental data at one location in the bubble column is
shown below:
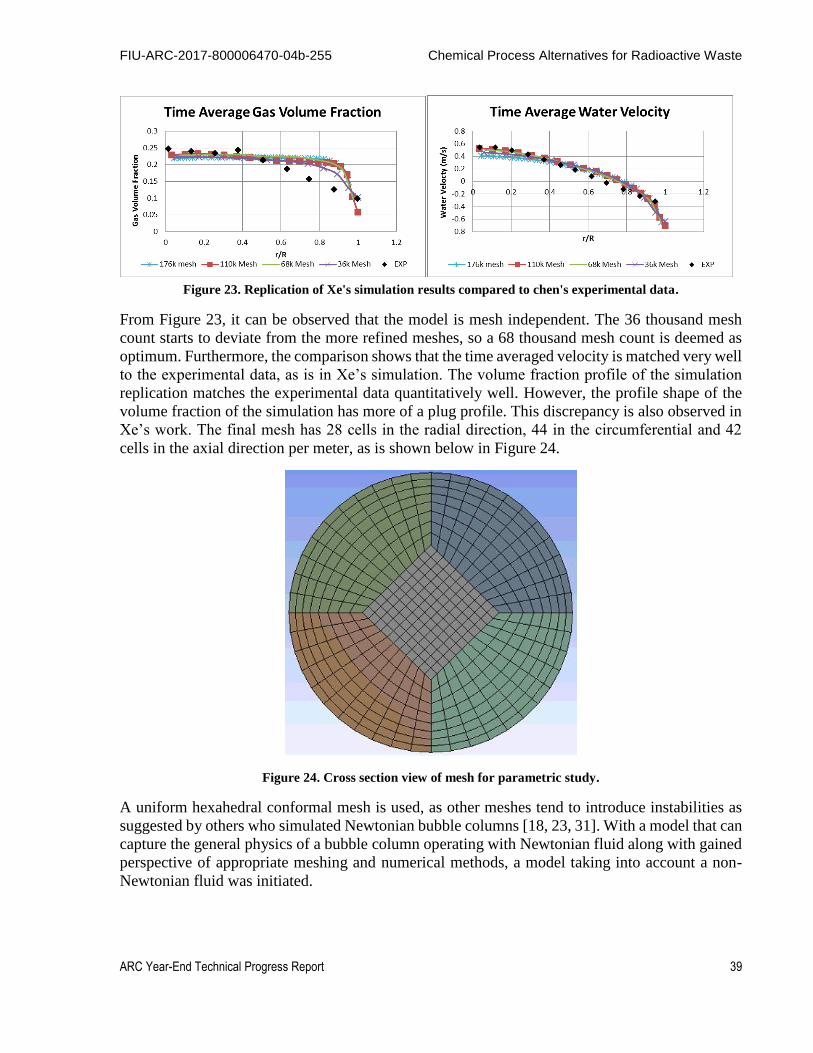
FIU-ARC-2017-800006470-04b-255 Chemical Process Alternatives for Radioactive Waste
ARC Year-End Technical Progress Report 39
Figure 23. Replication of Xe's simulation results compared to chen's experimental data.
From Figure 23, it can be observed that the model is mesh independent. The 36 thousand mesh
count starts to deviate from the more refined meshes, so a 68 thousand mesh count is deemed as
optimum. Furthermore, the comparison shows that the time averaged velocity is matched very well
to the experimental data, as is in Xe’s simulation. The volume fraction profile of the simulation
replication matches the experimental data quantitatively well. However, the profile shape of the
volume fraction of the simulation has more of a plug profile. This discrepancy is also observed in
Xe’s work. The final mesh has 28 cells in the radial direction, 44 in the circumferential and 42
cells in the axial direction per meter, as is shown below in Figure 24.
Figure 24. Cross section view of mesh for parametric study.
A uniform hexahedral conformal mesh is used, as other meshes tend to introduce instabilities as
suggested by others who simulated Newtonian bubble columns [18, 23, 31]. With a model that can
capture the general physics of a bubble column operating with Newtonian fluid along with gained
perspective of appropriate meshing and numerical methods, a model taking into account a non-
Newtonian fluid was initiated.
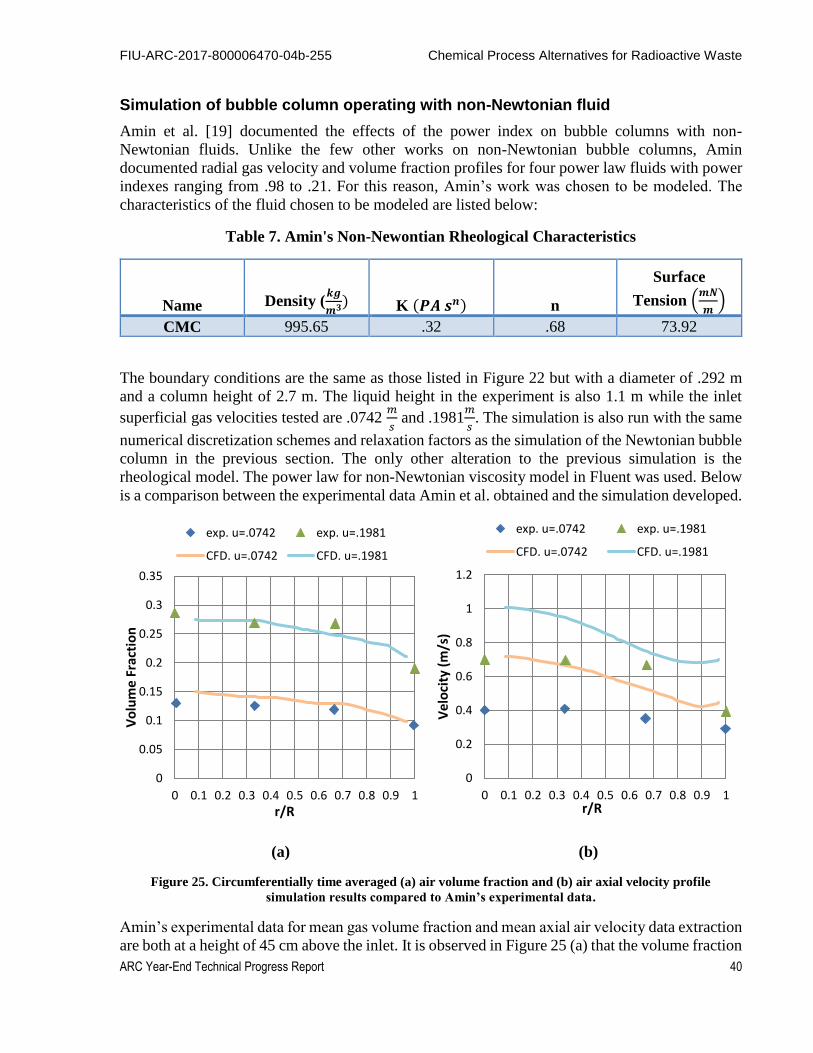
FIU-ARC-2017-800006470-04b-255 Chemical Process Alternatives for Radioactive Waste
ARC Year-End Technical Progress Report 40
Simulation of bubble column operating with non-Newtonian fluid
Amin et al. [19] documented the effects of the power index on bubble columns with non-
Newtonian fluids. Unlike the few other works on non-Newtonian bubble columns, Amin
documented radial gas velocity and volume fraction profiles for four power law fluids with power
indexes ranging from .98 to .21. For this reason, Amin’s work was chosen to be modeled. The
characteristics of the fluid chosen to be modeled are listed below:
Table 7. Amin's Non-Newontian Rheological Characteristics
Name
Density (𝒌𝒈
𝒎𝟑)
K (𝑷𝑨 𝒔𝒏)
n
Surface
Tension (𝒎𝑵
𝒎)
CMC 995.65 .32 .68 73.92
The boundary conditions are the same as those listed in Figure 22 but with a diameter of .292 m
and a column height of 2.7 m. The liquid height in the experiment is also 1.1 m while the inlet
superficial gas velocities tested are .0742 𝑚
𝑠 and .1981
𝑚
𝑠. The simulation is also run with the same
numerical discretization schemes and relaxation factors as the simulation of the Newtonian bubble
column in the previous section. The only other alteration to the previous simulation is the
rheological model. The power law for non-Newtonian viscosity model in Fluent was used. Below
is a comparison between the experimental data Amin et al. obtained and the simulation developed.
(a) (b)
Figure 25. Circumferentially time averaged (a) air volume fraction and (b) air axial velocity profile
simulation results compared to Amin’s experimental data.
Amin’s experimental data for mean gas volume fraction and mean axial air velocity data extraction
are both at a height of 45 cm above the inlet. It is observed in Figure 25 (a) that the volume fraction
0
0.05
0.1
0.15
0.2
0.25
0.3
0.35
0 0.1 0.2 0.3 0.4 0.5 0.6 0.7 0.8 0.9 1
Vo
lum
e F
ract
ion
r/R
exp. u=.0742 exp. u=.1981
CFD. u=.0742 CFD. u=.1981
0
0.2
0.4
0.6
0.8
1
1.2
0 0.1 0.2 0.3 0.4 0.5 0.6 0.7 0.8 0.9 1
Vel
oci
ty (
m/s
)
r/R
exp. u=.0742 exp. u=.1981
CFD. u=.0742 CFD. u=.1981
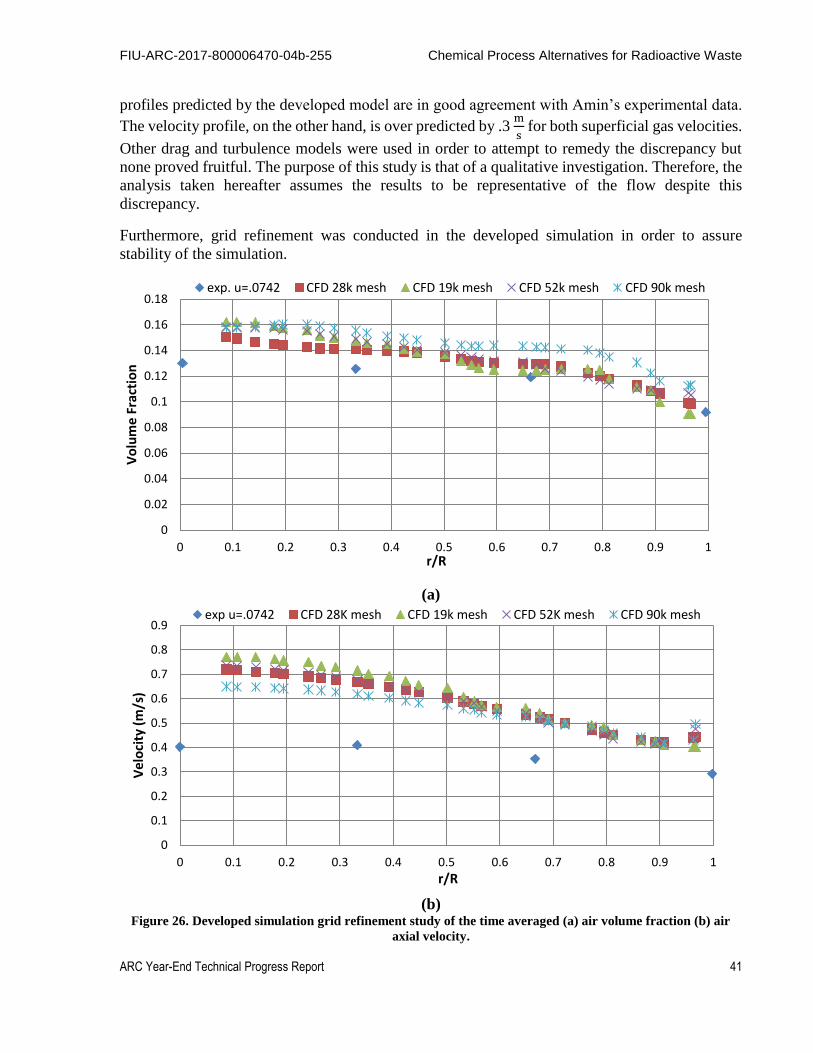
FIU-ARC-2017-800006470-04b-255 Chemical Process Alternatives for Radioactive Waste
ARC Year-End Technical Progress Report 41
profiles predicted by the developed model are in good agreement with Amin’s experimental data.
The velocity profile, on the other hand, is over predicted by .3 m
s for both superficial gas velocities.
Other drag and turbulence models were used in order to attempt to remedy the discrepancy but
none proved fruitful. The purpose of this study is that of a qualitative investigation. Therefore, the
analysis taken hereafter assumes the results to be representative of the flow despite this
discrepancy.
Furthermore, grid refinement was conducted in the developed simulation in order to assure
stability of the simulation.
(a)
(b) Figure 26. Developed simulation grid refinement study of the time averaged (a) air volume fraction (b) air
axial velocity.
0
0.02
0.04
0.06
0.08
0.1
0.12
0.14
0.16
0.18
0 0.1 0.2 0.3 0.4 0.5 0.6 0.7 0.8 0.9 1
Vo
lum
e F
ract
ion
r/R
exp. u=.0742 CFD 28k mesh CFD 19k mesh CFD 52k mesh CFD 90k mesh
0
0.1
0.2
0.3
0.4
0.5
0.6
0.7
0.8
0.9
0 0.1 0.2 0.3 0.4 0.5 0.6 0.7 0.8 0.9 1
Vel
oci
ty (
m/s
)
r/R
exp u=.0742 CFD 28K mesh CFD 19k mesh CFD 52K mesh CFD 90k mesh

FIU-ARC-2017-800006470-04b-255 Chemical Process Alternatives for Radioactive Waste
ARC Year-End Technical Progress Report 42
Figure 26 shows that the variability in the simulation results is small with refining mesh, showing
a degree of robustness in the simulation. The simulation was also tested for time averaged
convergence.
(a) (b)
Figure 27. Instantaneous velocity at the center of the bubble column at a height of (a) 40% of liquid height
and (b) 80% of liquid height.
In Figure 27, the water velocity at a point is observed to fluctuate at a height of (a) 40 % of the
liquid height and (b) 80% of the liquid height. The instantaneous water velocity is plotted from
120 seconds to 240 seconds. Although the instantaneous velocity changes with time, there is a
general trend of oscillation. The magnitude of oscillation also appears to be transient, but most of
the oscillations are near the .5 m/s and .4 m/s mark.
Given that the simulation results 1) qualitatively match Amin’s experimental data and are
quantitatively within reasonable error, 2) are fairly stable to grid refinements, and 3) are near a
quasi-steady state, it is concluded that the simulation can substantiate meaningful qualitative
results during a parametric study.
Parametric study simulation of bubble column operating with non-Newtonian fluid
As mentioned previously, there are no studies concerning the effects that 𝐻
𝐷 have on the volume
fraction and velocity profile of non-Newtonian sparged columns. Particularly, no information on 𝐻
𝐷 values as low as those observed in the waste tanks are studied. Thus, the validated simulation
will be ran with a varying characteristic ratio number (𝐻
𝐷= 5.2 - .34) and study the resulting effects.

FIU-ARC-2017-800006470-04b-255 Chemical Process Alternatives for Radioactive Waste
ARC Year-End Technical Progress Report 43
Non-Newtonian H
D Study
The simulation developed was run with an inlet air velocity of .1942 𝑚
𝑆 along with the same
diameter of Amin’s et al. experiment. In order to alter the 𝐻
𝐷 ratio, the height of the column was
changed while the diameter held constant. The distance between the height of the liquid and the
outlet pressure boundary condition was kept at a constant of 1.2 m. Like the previous simulations,
time averaging was conducted for 30 seconds after waiting 90 seconds for quasi-steady state to be
reached. The extraction of data was gathered at 40% and 80% of the liquid height, scaling with the
different 𝐻
𝐷 ratios. The following results were observed.
(a) (b)
Figure 28. H/D comparison ( 𝑯
𝑫= 𝟓. 𝟐−. 𝟑𝟒 ) of (a) air volume fraction and (b) air axial velocity at 40% of the
liquid height.
0
0.05
0.1
0.15
0.2
0.25
0.3
0.35
0.4
0 0.1 0.2 0.3 0.4 0.5 0.6 0.7 0.8 0.9 1
VF
r/R
H/D=5.2 H/D=3.8 H/D=2.4
H/D=1.37 H/D=.34
0
0.2
0.4
0.6
0.8
1
1.2
1.4
0 0.1 0.2 0.3 0.4 0.5 0.6 0.7 0.8 0.9 1
Ve
loci
ty (
m/s
)
r/R
H/D=5.2 H/D=3.8 H/D=2.4
H/D=1.37 H/D=.34
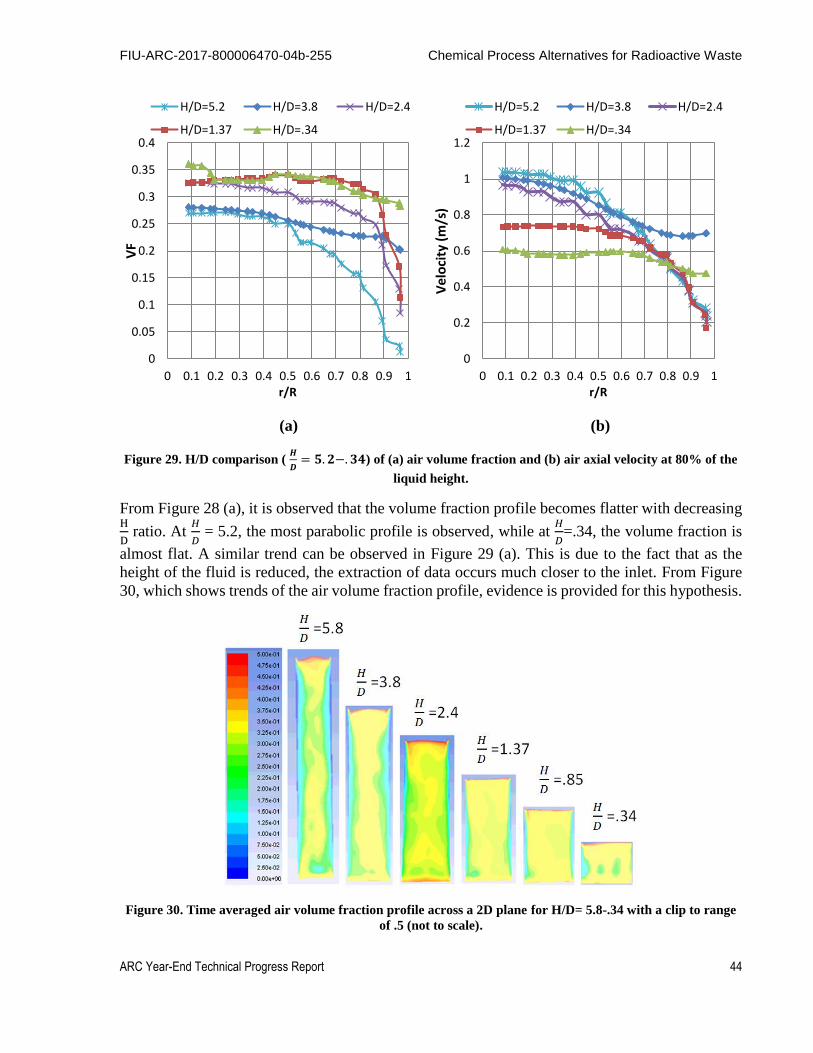
FIU-ARC-2017-800006470-04b-255 Chemical Process Alternatives for Radioactive Waste
ARC Year-End Technical Progress Report 44
(a) (b)
Figure 29. H/D comparison ( 𝑯
𝑫= 𝟓. 𝟐−. 𝟑𝟒) of (a) air volume fraction and (b) air axial velocity at 80% of the
liquid height.
From Figure 28 (a), it is observed that the volume fraction profile becomes flatter with decreasing H
D ratio. At
𝐻
𝐷 = 5.2, the most parabolic profile is observed, while at
𝐻
𝐷=.34, the volume fraction is
almost flat. A similar trend can be observed in Figure 29 (a). This is due to the fact that as the
height of the fluid is reduced, the extraction of data occurs much closer to the inlet. From Figure
30, which shows trends of the air volume fraction profile, evidence is provided for this hypothesis.
Figure 30. Time averaged air volume fraction profile across a 2D plane for H/D= 5.8-.34 with a clip to range
of .5 (not to scale).
0
0.05
0.1
0.15
0.2
0.25
0.3
0.35
0.4
0 0.1 0.2 0.3 0.4 0.5 0.6 0.7 0.8 0.9 1
VF
r/R
H/D=5.2 H/D=3.8 H/D=2.4
H/D=1.37 H/D=.34
0
0.2
0.4
0.6
0.8
1
1.2
0 0.1 0.2 0.3 0.4 0.5 0.6 0.7 0.8 0.9 1
Vel
oci
ty (
m/s
)
r/R
H/D=5.2 H/D=3.8 H/D=2.4
H/D=1.37 H/D=.34
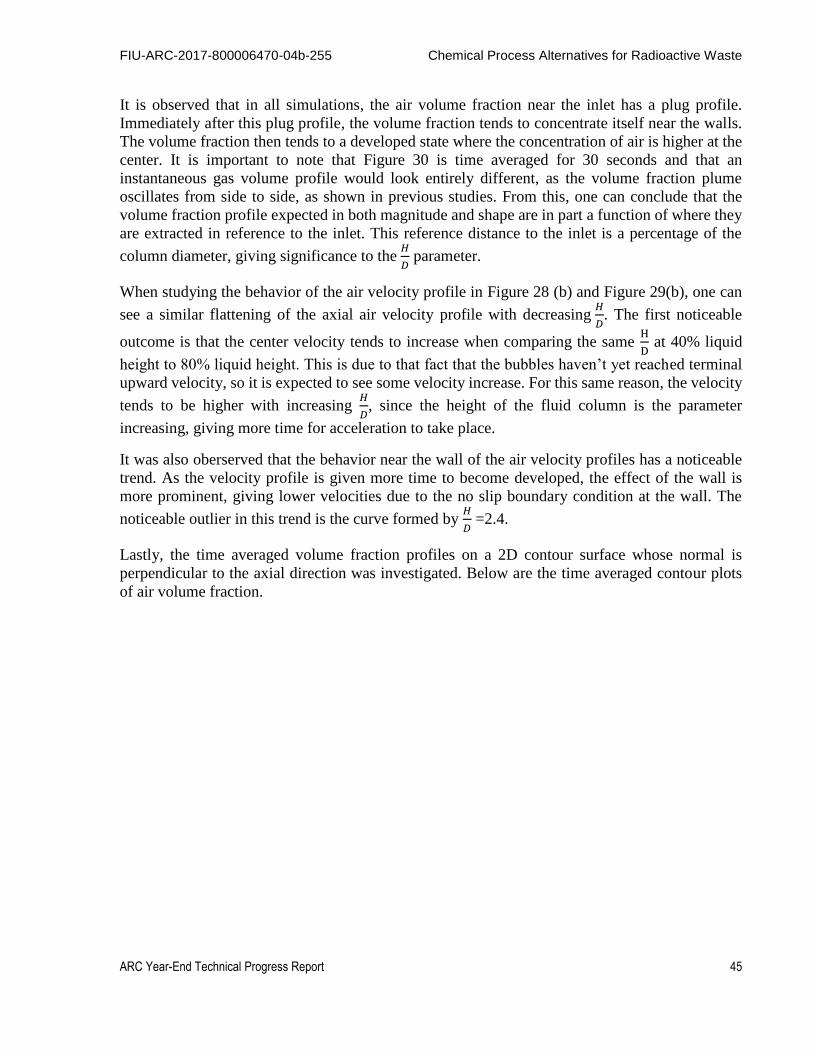
FIU-ARC-2017-800006470-04b-255 Chemical Process Alternatives for Radioactive Waste
ARC Year-End Technical Progress Report 45
It is observed that in all simulations, the air volume fraction near the inlet has a plug profile.
Immediately after this plug profile, the volume fraction tends to concentrate itself near the walls.
The volume fraction then tends to a developed state where the concentration of air is higher at the
center. It is important to note that Figure 30 is time averaged for 30 seconds and that an
instantaneous gas volume profile would look entirely different, as the volume fraction plume
oscillates from side to side, as shown in previous studies. From this, one can conclude that the
volume fraction profile expected in both magnitude and shape are in part a function of where they
are extracted in reference to the inlet. This reference distance to the inlet is a percentage of the
column diameter, giving significance to the 𝐻
𝐷 parameter.
When studying the behavior of the air velocity profile in Figure 28 (b) and Figure 29(b), one can
see a similar flattening of the axial air velocity profile with decreasing 𝐻
𝐷. The first noticeable
outcome is that the center velocity tends to increase when comparing the same H
D at 40% liquid
height to 80% liquid height. This is due to that fact that the bubbles haven’t yet reached terminal
upward velocity, so it is expected to see some velocity increase. For this same reason, the velocity
tends to be higher with increasing 𝐻
𝐷, since the height of the fluid column is the parameter
increasing, giving more time for acceleration to take place.
It was also oberserved that the behavior near the wall of the air velocity profiles has a noticeable
trend. As the velocity profile is given more time to become developed, the effect of the wall is
more prominent, giving lower velocities due to the no slip boundary condition at the wall. The
noticeable outlier in this trend is the curve formed by 𝐻
𝐷 =2.4.
Lastly, the time averaged volume fraction profiles on a 2D contour surface whose normal is
perpendicular to the axial direction was investigated. Below are the time averaged contour plots
of air volume fraction.

FIU-ARC-2017-800006470-04b-255 Chemical Process Alternatives for Radioactive Waste
ARC Year-End Technical Progress Report 46
(a1) (a2) (b1) (b2)
(c1) (c2)
Figure 31. Time averaged air volume fraction on an axial section view for (a) 𝑯
𝑫 = .34, (b)
𝑯
𝑫= 3.8, (c)
𝑯
𝑫 = 5.8
at (1) 40% and (2) 80% of the liquid height.
From the simulations, it is shown that there is little difference, from a qualitative point of view,
between the time averaged air volume fraction contour plots at 40% and 80% of liquid height.
There is a tendency for the volume fraction profile to concentrate near the center and lessen in
concentration radially outward until the column wall boundary condition is reached. This behavior
is observed in experimental data. In both Figure 31 (a1) and (a2), this tendency is not observed.
This could be due to the fact that at a 𝐻
𝐷 ratio of .35, the data is extracted too close to the inlet
velocity, not giving enough time for wall effects take precedence.

FIU-ARC-2017-800006470-04b-255 Chemical Process Alternatives for Radioactive Waste
ARC Year-End Technical Progress Report 47
CONCLUSIONS AND FUTURE WORK
The pulse jet mixing process is a vital part of the nuclear waste deactivation and decommissioning
mission at the Hanford Site. However, there are a number of areas of uncertainty within the PJM
process. This task investigates aspects of the hydrodynamics involved with implementing sparging
within the waste tanks.
The effect of the characteristic ratio, H
D, and power law index on bubble columns with non-
Newtonian fluids was investigated. It was observed that a flattening of the profile occurs with
decreasing H
D ratio for both air volume fraction and air axial velocity. This is predicted to be a result
of how close the outlet is to the inlet. The wider the diameter of the column through which sparging
occurs, the longer vertical distance required for the flow to become fully developed. It is, therefore,
expected that if the PJMs were sparged, they would experience a plug air volume fraction and axial
velocity profile.
Sparging in the area of non-Newtonian fluids has not been thoroughly investigated. Future work
in this area that would be beneficial to the design and development of the PJM process to
investigate the effects that altering rheological and physical characteristics of the flow would have
on the mixing state of the column. This would directly address the ultimate intent of the PJM
process. Furthermore, the synergistic effects on mixing that both sparging and jet impingement
has on mixing would be of significant interest.

FIU-ARC-2017-800006470-04b-255 Chemical Process Alternatives for Radioactive Waste
ARC Year-End Technical Progress Report 48
REFERENCES
1. Chris Guenther , M.S., William Rogers , Sofiane Benyahia , Rahul Garg , Tingwen Li,
TECHNICAL REPORT ON NETL’s NON‐NEWTONIAN MULTIPHASE SLURRY
WORKSHOP 2013, NETL: Morgan Town, WV. p. 1-65.
2. Poreh, M., Y.G. Tsuei, and J.E. Cermak, Investigation of a Turbulent Radial Wall Jet.
Journal of Applied Mechanics, 1967. 34(2): p. 457-463.
3. Picardi, R.N., Numerical Analysis of Multiphase Flow in Bubble Columns and
Applications for Microbial Fuel Cells, in Mechanical Engineering. 2015, Virginia
Tech: 2015-04-15.
4. Attfield, P.V., Stress tolerance: the key to effective strains of industrial baker's yeast.
Nature biotechnology, 1997. 15(13): p. 1351-1357.
5. Berovic, M. and M. Legisa, Citric acid production. Biotechnology Annual Review, 2007.
13: p. 303-343.
6. Hermann, T., Industrial production of amino acids by coryneform bacteria. Journal of
biotechnology, 2003. 104(1): p. 155-172.
7. Strik, D.P., et al., Renewable sustainable biocatalyzed electricity production in a
photosynthetic algal microbial fuel cell (PAMFC). Applied microbiology and
biotechnology, 2008. 81(4): p. 659-668.
8. Kantarci, N., F. Borak, and K.O. Ulgen, Bubble column reactors. Process Biochemistry,
2005. 40(7): p. 2263-2283.
9. Hekmat, A., A.E. Amooghin, and M.K. Moraveji, CFD simulation of gas–liquid flow
behaviour in an air-lift reactor: determination of the optimum distance of the draft tube.
Simulation Modelling Practice and Theory, 2010. 18(7): p. 927-945.
10. Rampure, M.R., V.V. Buwa, and V.V. Ranade, Modelling of Gas‐Liquid/Gas‐Liquid‐Solid Flows in Bubble Columns: Experiments and CFD Simulations. The Canadian
Journal of Chemical Engineering, 2003. 81(3‐4): p. 692-706.
11. Becker, S., A. Sokolichin, and G. Eigenberger, Gas—liquid flow in bubble columns and
loop reactors: Part II. Comparison of detailed experiments and flow simulations.
Chemical Engineering Science, 1994. 49(24): p. 5747-5762.
12. Pfleger, D., et al., Hydrodynamic simulations of laboratory scale bubble columns
fundamental studies of the Eulerian–Eulerian modelling approach. Chemical
Engineering Science, 1999. 54(21): p. 5091-5099.
13. Pan, Y., M.P. Dudukovic, and M. Chang, Numerical investigation of gas-driven flow in
2-D bubble columns. AIChE Journal, 2000. 46(3): p. 434-449.
14. Yakhot, V., et al., Development of turbulence models for shear flows by a double
expansion technique. Physics of Fluids A: Fluid Dynamics, 1992. 4(7): p. 1510-1520.
15. Buwa, V.V. and V.V. Ranade, Dynamics of gas–liquid flow in a rectangular bubble
column: experiments and single/multi-group CFD simulations. Chemical Engineering
Science, 2002. 57(22): p. 4715-4736.
16. Chen, W., et al., Scale-up effects on the time-averaged and dynamic behavior in bubble
column reactors. Chemical engineering science, 2001. 56(21): p. 6149-6155.
17. Rampure, M.R., A.A. Kulkarni, and V.V. Ranade, Hydrodynamics of Bubble Column
Reactors at High Gas Velocity: Experiments and Computational Fluid Dynamics (CFD)
Simulations. Industrial & Engineering Chemistry Research, 2007. 46(25): p. 8431-8447.

FIU-ARC-2017-800006470-04b-255 Chemical Process Alternatives for Radioactive Waste
ARC Year-End Technical Progress Report 49
18. McClure, D.D., et al., Development of a CFD model of bubble column bioreactors: part
one–a detailed experimental study. Chemical Engineering & Technology, 2013. 36(12):
p. 2065-2070.
19. Esmaeili, A., C. Guy, and J. Chaouki, The effects of liquid phase rheology on the
hydrodynamics of a gas–liquid bubble column reactor. Chemical Engineering Science,
2015. 129: p. 193-207.
20. Plais, C. and F. Augier, Effect of liquid viscosity on mixing times in bubble columns.
Theoretical Foundations of Chemical Engineering, 2016. 50(6): p. 969-974.
21. Kawase, Y. and M. Moo-Young, Hydrodynamics in bubble column bioreactors with
fermentation broths having a yield stress. Applied Microbiology and Biotechnology,
1989. 30(6): p. 596-603.
22. Terasaka, K., et al., Oxygen transfer into xanthan solutions in partitioned bubble
columns. Journal of chemical engineering of Japan, 2013. 46(1): p. 33-39.
23. McClure, D.D., et al., Development of a CFD model of bubble column bioreactors: part
two–comparison of experimental data and CFD predictions. Chemical Engineering &
Technology, 2014. 37(1): p. 131-140.
24. Xu, L., et al., Application of population balance model in the simulation of slurry bubble
column. Industrial & Engineering Chemistry Research, 2014. 53(12): p. 4922-4930.
25. Fluent, Theory Guide, in Multiphase Flow.
26. Fluent, Users Manual, in Multiphase Flow.
27. Sokolichin, A. and G. Eigenberger, Applicability of the standard k–ε turbulence model to
the dynamic simulation of bubble columns: Part I. Detailed numerical simulations.
Chemical Engineering Science, 1999. 54(13-14): p. 2273-2284.
28. Xu, L., et al., Numerical simulation of bubble column flows in churn-turbulent regime:
comparison of bubble size models. Industrial & Engineering Chemistry Research, 2013.
52(20): p. 6794-6802.
29. Laborde-Boutet, C., et al., CFD simulation of bubble column flows: Investigations on
turbulence models in RANS approach. Chemical Engineering Science, 2009. 64(21): p.
4399-4413.
30. Chen, J., et al., Fluid dynamic parameters in bubble columns with internals. Chemical
Engineering Science, 1999. 54(13): p. 2187-2197.
31. McClure, D.D., et al., Mixing in bubble column reactors: experimental study and CFD
modeling. Chemical Engineering Journal, 2015. 264: p. 291-301.

FIU-ARC-2017-800006470-04b-255 Chemical Process Alternatives for Radioactive Waste
ARC Year-End Technical Progress Report 50
TASK 18.2 DEVELOPMENT OF INSPECTION TOOLS FOR DST PRIMARY
TANKS (FIU YEAR 7)
EXECUTIVE SUMMARY
In August of 2012, traces of waste were found in the annulus of the AY-102 double-shell tank
(DST) storing radioactive waste at the Hanford Site, prompting the need for developing inspection
tools that can identify the cause and location of the leak. To help in this effort, FIU is investigating
the development of inspection tools able to access the tank’s secondary containment, while
providing live visual feedback. This effort has led to the development of two inspection tools: a
magnetic wheeled miniature motorized rover that will travel through the refractory cooling
channels under the primary tank, and a pneumatic pipe crawler that will inspect the tank ventilation
header piping. Both inspection routes lead to the central plenum under the primary tank.
The magnetic wheeled miniature tool is a remote controlled rover with four wheels directly driven
by independent micro DC motors. It is equipped with a camera to provide live visual feedback of
the inspection tasks. To avoid debris, the device will travel upside down magnetically attached to
the bottom of the primary tank. A generic sensor hood is designed to allow different sensors to be
integrated via a common hardward interface. The miniature tool is tethered to provide both the
power and communication links to and from the operator, and its operation is automated depending
on the tether tension. To reduce operational fatigue, a semi-autonomous control is incorporated to
assist the operator in steering the miniature tool during inspection.
Preliminary system testing for the inspection tool has been carried out at the full-scale sectional
mock-up facility built in-house. This included assessing the camera's visual feedback, the
inspection tool’s pull-force, data collected via the integrated sensors, and tether management
during operation. Further design modifications and performance enchancement efforts are
currently underway, and FIU has received significant feedback from WRPS engineers on the
necessary modifications.
FIU has also continued to test and improve the pneumatic pipe crawler developed for inspection
of 3- and 4-inch pipelines. The pneumatic pipe crawler is a worm type robot with a modular design,
composed of interchangeable cylindrical modules connected with flexible links. The primary
improvement includes the integration of sensors, with the objective of enhancing the inspection
tool capabilities, robustness and operational feedback. The integration of the following sensors are
being considered: (a) a thermal infrared camera to provide thermal image mapping, hot spot
detection and temperature gradient analysis; (b) ambient temperature, pressure and humidity
sensors to provide environmental conditions; (c) a wall scanner module to provide radiation,
ultrasound, and visual surface mapping; (d) a load cell to provide tether drag estimation; (e) contact
pressure sensors to provide grip conditions; and (f) inclinometers to provide slope and orientation
of each module of the crawler.
A full scale sectional mockup of the DST floor has been designed and is being manufactured at
FIU. The mockup is an 8 ft swath, approximately 40 ft in length that includes the two liners, the
annulus, the drain slots and refractory channels. The mockup will be used to demonstrate FIU’s

FIU-ARC-2017-800006470-04b-255 Chemical Process Alternatives for Radioactive Waste
ARC Year-End Technical Progress Report 51
systems and can also be used to evaluate future inspection technologies, sensors and robotic
devices in operational conditions equivalent to those at Hanford.

FIU-ARC-2017-800006470-04b-255 Chemical Process Alternatives for Radioactive Waste
ARC Year-End Technical Progress Report 52
INTRODUCTION
In August of 2012, traces of waste were found in the annulus of the AY-102 double-shell tank
storing radioactive waste at the Hanford Site, prompting the need for developing inspection tools
that can identify the cause and location of the leak.
Figure 32 shows three possible entry points for inspection in the AY-102 double-shell tank:
1. the refractory air slots through the annulus,
2. the leak detection piping, and
3. the ventilation header piping.
Figure 32. Inspection entry points of the AY-102 double-shell tank.
To assist in this effort, FIU is investigating the development of inspection tools able to access the
tank secondary containment, while providing live visual feedback. The effort led to the
development of two inspection tools:
a magnetic miniature rover that will travel through the refractory air slots, and
a pneumatic pipe crawler that will inspect the ventilation header piping.
The objective of this task is to develop inspection tools that will assist site engineers at Hanford in
understanding the health of the DSTs, including the primary and secondary liners.
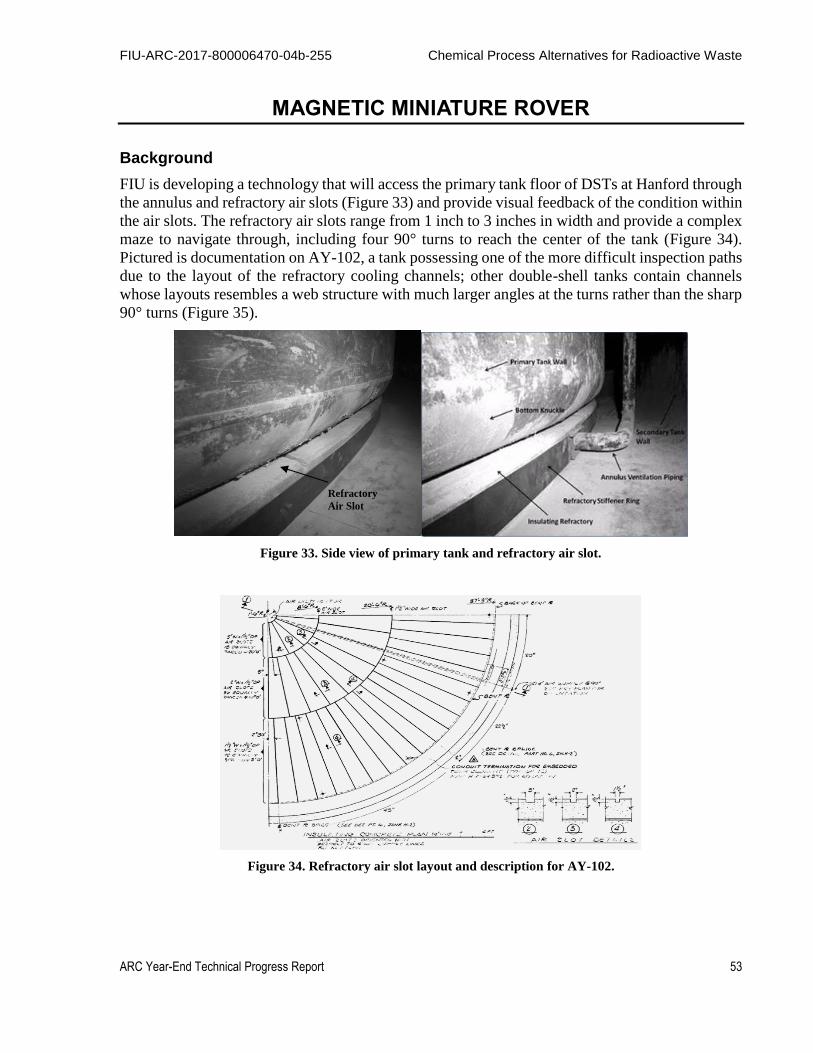
FIU-ARC-2017-800006470-04b-255 Chemical Process Alternatives for Radioactive Waste
ARC Year-End Technical Progress Report 53
MAGNETIC MINIATURE ROVER
Background
FIU is developing a technology that will access the primary tank floor of DSTs at Hanford through
the annulus and refractory air slots (Figure 33) and provide visual feedback of the condition within
the air slots. The refractory air slots range from 1 inch to 3 inches in width and provide a complex
maze to navigate through, including four 90° turns to reach the center of the tank (Figure 34).
Pictured is documentation on AY-102, a tank possessing one of the more difficult inspection paths
due to the layout of the refractory cooling channels; other double-shell tanks contain channels
whose layouts resembles a web structure with much larger angles at the turns rather than the sharp
90° turns (Figure 35).
Figure 33. Side view of primary tank and refractory air slot.
Figure 34. Refractory air slot layout and description for AY-102.
Refractory
Air Slot
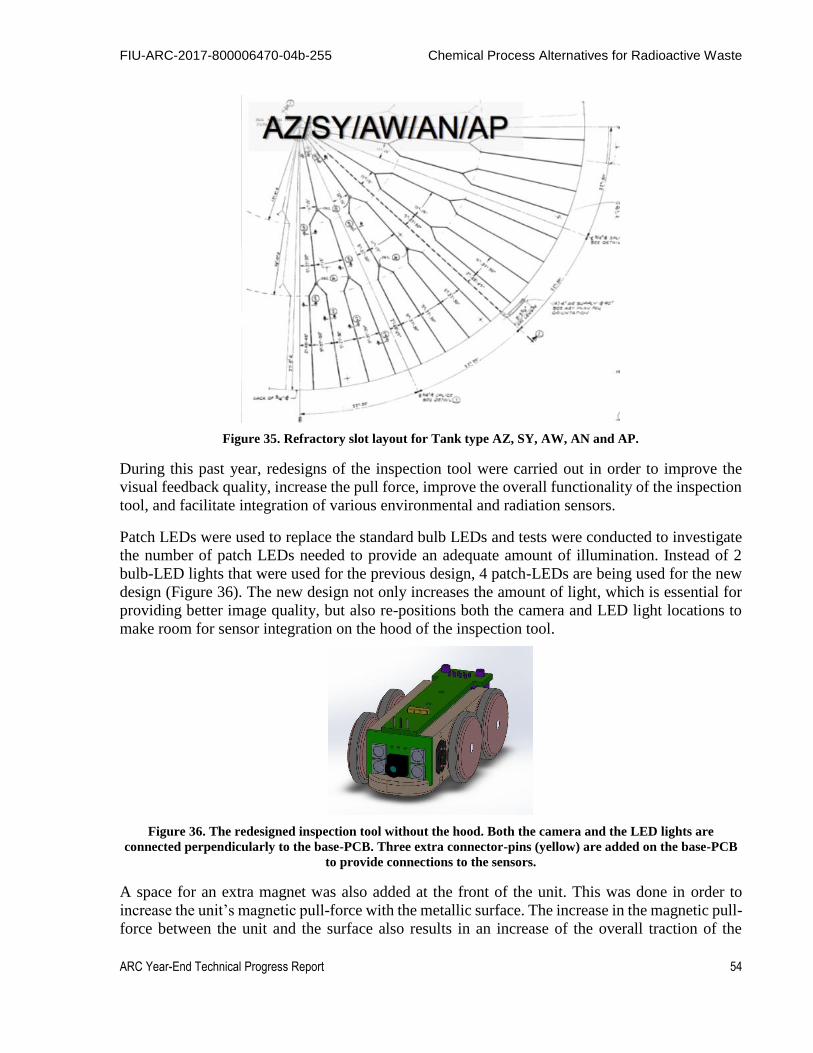
FIU-ARC-2017-800006470-04b-255 Chemical Process Alternatives for Radioactive Waste
ARC Year-End Technical Progress Report 54
Figure 35. Refractory slot layout for Tank type AZ, SY, AW, AN and AP.
During this past year, redesigns of the inspection tool were carried out in order to improve the
visual feedback quality, increase the pull force, improve the overall functionality of the inspection
tool, and facilitate integration of various environmental and radiation sensors.
Patch LEDs were used to replace the standard bulb LEDs and tests were conducted to investigate
the number of patch LEDs needed to provide an adequate amount of illumination. Instead of 2
bulb-LED lights that were used for the previous design, 4 patch-LEDs are being used for the new
design (Figure 36). The new design not only increases the amount of light, which is essential for
providing better image quality, but also re-positions both the camera and LED light locations to
make room for sensor integration on the hood of the inspection tool.
Figure 36. The redesigned inspection tool without the hood. Both the camera and the LED lights are
connected perpendicularly to the base-PCB. Three extra connector-pins (yellow) are added on the base-PCB
to provide connections to the sensors.
A space for an extra magnet was also added at the front of the unit. This was done in order to
increase the unit’s magnetic pull-force with the metallic surface. The increase in the magnetic pull-
force between the unit and the surface also results in an increase of the overall traction of the
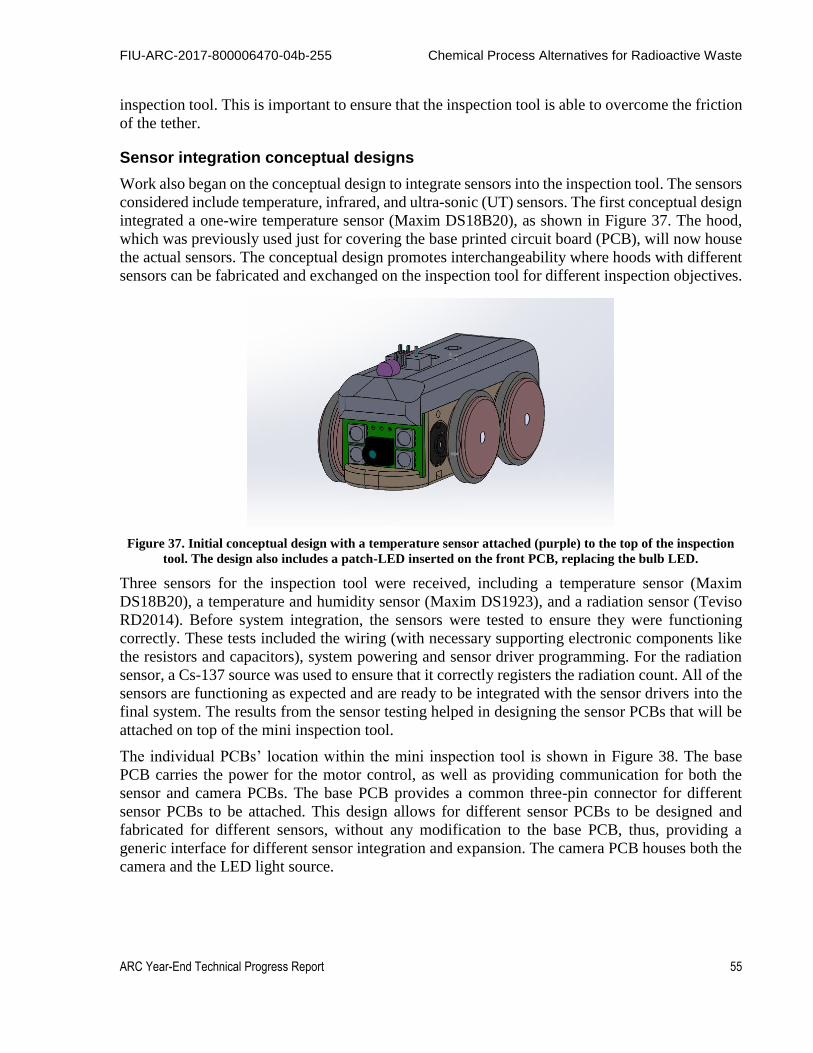
FIU-ARC-2017-800006470-04b-255 Chemical Process Alternatives for Radioactive Waste
ARC Year-End Technical Progress Report 55
inspection tool. This is important to ensure that the inspection tool is able to overcome the friction
of the tether.
Sensor integration conceptual designs
Work also began on the conceptual design to integrate sensors into the inspection tool. The sensors
considered include temperature, infrared, and ultra-sonic (UT) sensors. The first conceptual design
integrated a one-wire temperature sensor (Maxim DS18B20), as shown in Figure 37. The hood,
which was previously used just for covering the base printed circuit board (PCB), will now house
the actual sensors. The conceptual design promotes interchangeability where hoods with different
sensors can be fabricated and exchanged on the inspection tool for different inspection objectives.
Figure 37. Initial conceptual design with a temperature sensor attached (purple) to the top of the inspection
tool. The design also includes a patch-LED inserted on the front PCB, replacing the bulb LED.
Three sensors for the inspection tool were received, including a temperature sensor (Maxim
DS18B20), a temperature and humidity sensor (Maxim DS1923), and a radiation sensor (Teviso
RD2014). Before system integration, the sensors were tested to ensure they were functioning
correctly. These tests included the wiring (with necessary supporting electronic components like
the resistors and capacitors), system powering and sensor driver programming. For the radiation
sensor, a Cs-137 source was used to ensure that it correctly registers the radiation count. All of the
sensors are functioning as expected and are ready to be integrated with the sensor drivers into the
final system. The results from the sensor testing helped in designing the sensor PCBs that will be
attached on top of the mini inspection tool.
The individual PCBs’ location within the mini inspection tool is shown in Figure 38. The base
PCB carries the power for the motor control, as well as providing communication for both the
sensor and camera PCBs. The base PCB provides a common three-pin connector for different
sensor PCBs to be attached. This design allows for different sensor PCBs to be designed and
fabricated for different sensors, without any modification to the base PCB, thus, providing a
generic interface for different sensor integration and expansion. The camera PCB houses both the
camera and the LED light source.

FIU-ARC-2017-800006470-04b-255 Chemical Process Alternatives for Radioactive Waste
ARC Year-End Technical Progress Report 56
Figure 38. CAD drawing showing various PCBs for the electronic components.
Details of the sensors that are currently being considered are shown in the table below.
Table 8. Potential Sensors for Integration
Sensors Types Sensors Communication Descriptions
Temperature (Maxim
DS18B20)
One-Wire Ambient temperature
sensor
Temperature and
humidity (Maxim
DS1923)
One-Wire Ambient temperature and
humidity sensor
Radiation (Teviso
RD2014)
TTL Beta, gamma, x-rays
sensor
Infra-red non-contact
temperature sensor
(CMCIEL mTS017)
One-Wire Non-contact Infra-red
temperature sensor
The finalized conceptual designs for the integration of sensors described in the previous table are
shown below.

FIU-ARC-2017-800006470-04b-255 Chemical Process Alternatives for Radioactive Waste
ARC Year-End Technical Progress Report 57
Figure 39. Conceptual design of temperature sensor integration for measuring the ambient temperature.
Figure 40. Conceptual design of iButton integration for measuring both the ambient temperature and
humidity.
Figure 41. Conceptual design of radiation sensor integration for measuring beta, gamma and x-rays.
Figure 42. Conceptual design of non-contact infrared temperature sensor for measuring the surface
temperature of the tank bottom. The circular cutout (on right) through the inspection tool’s body allows the
IR sensing element to be fitted to measure the surface temperature of the tank.

FIU-ARC-2017-800006470-04b-255 Chemical Process Alternatives for Radioactive Waste
ARC Year-End Technical Progress Report 58
Printed Circuit Board (PCB) designs
The PCBs for the base, camera and sensors were designed to accommodate the respective
electronic components and provide the power and communication links to the mini inspection tool,
as shown in Figure 43. The addition of the PCB will reduce wire clutter and therefore help to
reduce the noise experienced by the camera. This redesign also removes tension from the wires
while the inspection tool is in operation. Instead, the tension is directed to the PCB, which will be
fastened to the body of the inspection tool. The differences between the old and the new design
with the PCB are illustrated in Figure 44.
Figure 43. Base, Camera and Sensors PCB designs.
Figure 44. Old inspection tool with wire cluttering issue (top) and new inspection tool with custom-made PCB
(bottom).
Fabrication and system integration
The CAD drawings and the PCBs of the conceptual designs were sent for fabrication. System
integration efforts were carried out after they were received. These included population of the
electronic components on the PCBs and overall functionality testing of the populated PCBs. Figure
45-left shows the two sensor hoops that are populated with both the temperature and iButton
(temperature and humidity) sensors. The sensor hoop has a generic hardware interface with the
base-PCB, such that different sensor hoods can be interchanged when needed. Figure 45-right

FIU-ARC-2017-800006470-04b-255 Chemical Process Alternatives for Radioactive Waste
ARC Year-End Technical Progress Report 59
shows the populated camera PCBs. Two designs with different LED light configurations are
currently being tested to determine the optimum lighting required for the camera in the refractory
slots. The first design uses all patch LEDs, which provide good localized lighting, while the second
design mixes both the patch and bulb LED lights, with the hope of providing both localized and
distance lighting.
Figure 45. (left) Sensor hoops populated with both the temperature and iButton sensors (left) and populated
camera PCBs with both the patch and mixed LED lights for the lighting source of the mini inspection tool
(right).
Two fully integrated mini-inspection tools fitted with radiation, temperature and humidity sensor
hoods are shown in Figure 46. Unfortunately, due to the lack of availability of the IR non-contact
temperature sensor, the conceptual design with the IR sensor shown in Figure 42 was not
fabricated.
Figure 46. Temperature sensor hood (left), inspection tool fitted with iButton humidity and temperature
sensor (middle), and inspection tool fitted with RD2014 radiation sensor (right). The sensor hoods share
common electrical and communication interfaces.
Controller and controller box
A waterproof controller box was designed and fabricated to house all of the electronic components
that interface with the inspection tool and the operator. The components include a single board
computer (SBC), an analog video capture card, a voltage converter and a motor controller. With
all of the components packed in a single enclosure, it would allow plug-and-go capability so that
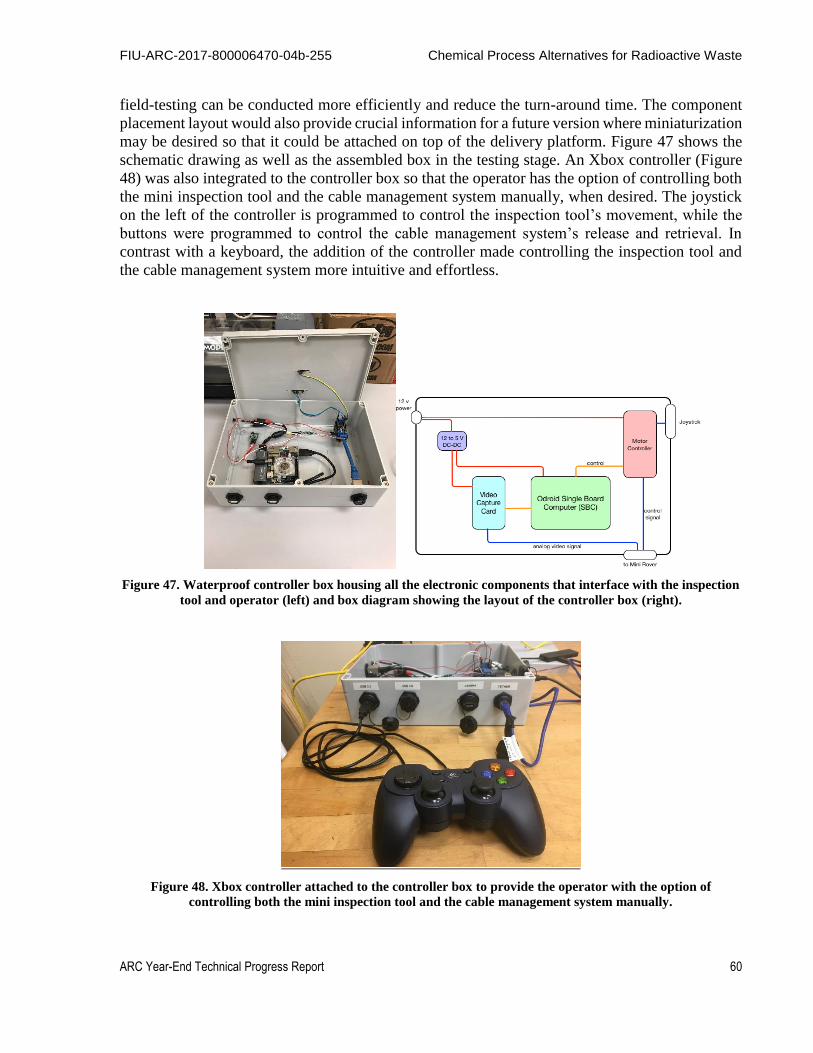
FIU-ARC-2017-800006470-04b-255 Chemical Process Alternatives for Radioactive Waste
ARC Year-End Technical Progress Report 60
field-testing can be conducted more efficiently and reduce the turn-around time. The component
placement layout would also provide crucial information for a future version where miniaturization
may be desired so that it could be attached on top of the delivery platform. Figure 47 shows the
schematic drawing as well as the assembled box in the testing stage. An Xbox controller (Figure
48) was also integrated to the controller box so that the operator has the option of controlling both
the mini inspection tool and the cable management system manually, when desired. The joystick
on the left of the controller is programmed to control the inspection tool’s movement, while the
buttons were programmed to control the cable management system’s release and retrieval. In
contrast with a keyboard, the addition of the controller made controlling the inspection tool and
the cable management system more intuitive and effortless.
Figure 47. Waterproof controller box housing all the electronic components that interface with the inspection
tool and operator (left) and box diagram showing the layout of the controller box (right).
Figure 48. Xbox controller attached to the controller box to provide the operator with the option of
controlling both the mini inspection tool and the cable management system manually.
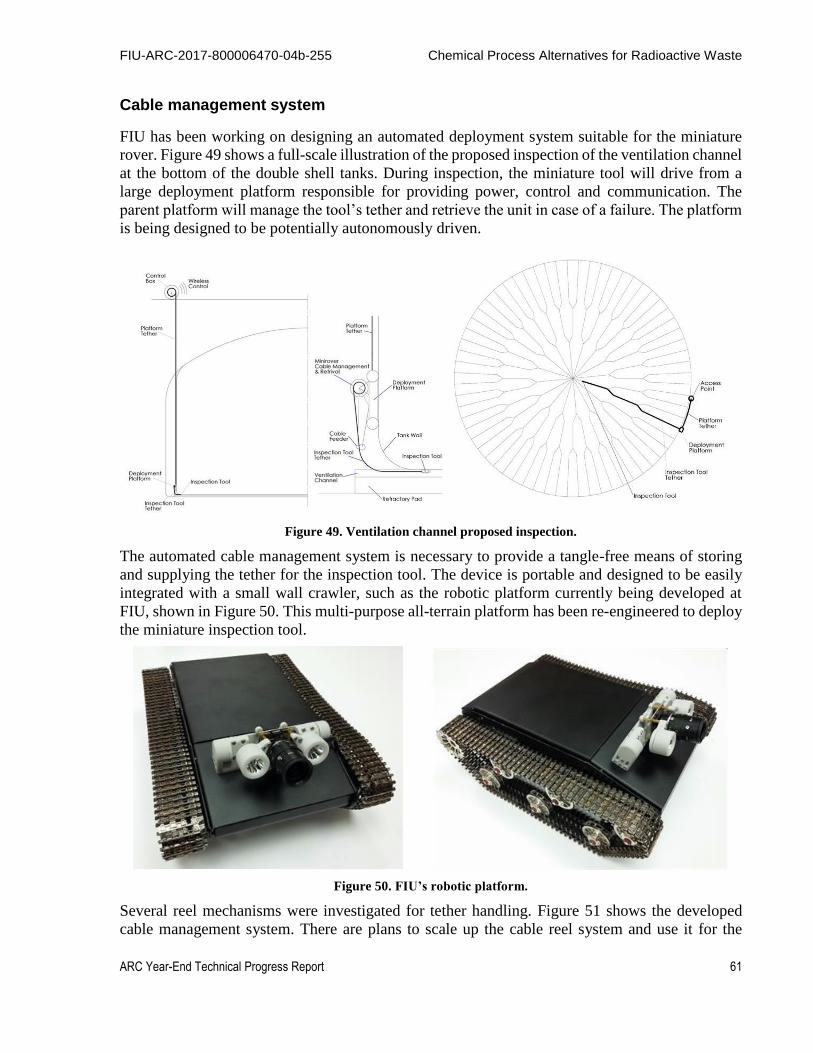
FIU-ARC-2017-800006470-04b-255 Chemical Process Alternatives for Radioactive Waste
ARC Year-End Technical Progress Report 61
Cable management system
FIU has been working on designing an automated deployment system suitable for the miniature
rover. Figure 49 shows a full-scale illustration of the proposed inspection of the ventilation channel
at the bottom of the double shell tanks. During inspection, the miniature tool will drive from a
large deployment platform responsible for providing power, control and communication. The
parent platform will manage the tool’s tether and retrieve the unit in case of a failure. The platform
is being designed to be potentially autonomously driven.
Figure 49. Ventilation channel proposed inspection.
The automated cable management system is necessary to provide a tangle-free means of storing
and supplying the tether for the inspection tool. The device is portable and designed to be easily
integrated with a small wall crawler, such as the robotic platform currently being developed at
FIU, shown in Figure 50. This multi-purpose all-terrain platform has been re-engineered to deploy
the miniature inspection tool.
Figure 50. FIU’s robotic platform.
Several reel mechanisms were investigated for tether handling. Figure 51 shows the developed
cable management system. There are plans to scale up the cable reel system and use it for the

FIU-ARC-2017-800006470-04b-255 Chemical Process Alternatives for Radioactive Waste
ARC Year-End Technical Progress Report 62
pneumatic pipe crawler, as well as for the deployment of other inspections tools currently being
developed at FIU.
Figure 51. Automated cable management systems.
The cable management system consists of a self-layering spool guide to keep the cable reel neat,
tidy, and protected from damage. A load cell senses the movement of the inspection tool and a
mechanism slides back and forth in sync with the spool wind so that the reel is always properly
wound. The system is completely automated and designed to retrieve the tool in case of failure.
An automated cable management system is important to contain eventual contamination and
prevent radiation spread. Figure 52 shows the overall dimensions of the device.
Figure 52. Automated cable management system dimensions.

FIU-ARC-2017-800006470-04b-255 Chemical Process Alternatives for Radioactive Waste
ARC Year-End Technical Progress Report 63
Figure 53 shows the two original prototypes successfully tested at FIU. The design has been in
continuous improvement and new features have been incorporated as needed in response to the
tests.
Figure 53. Original cable management (left) and redesign prototype with winder (right).
The most recently incorporated improvement was the addition of an active cable feeding
capability on the system. Since the mini-inspection tool has limited pull force when navigating in
the air refractory, this capability makes use of a strain gauge to sense the tension on the cable
and actively releases the cable as needed to minimize the cable tension. Figure 54 shows the
cable management system equipped with the active cable feeding capability.
Figure 54. Redesigned cable management system with an active cable releasing capability.

FIU-ARC-2017-800006470-04b-255 Chemical Process Alternatives for Radioactive Waste
ARC Year-End Technical Progress Report 64
The incorporated active cable feeding system, shown in Figure 55, uses a motor to automatically
feed the cable to the inspection tool and a tachometer that measures the feeding speed. FIU is also
planning to use the load cell embedded in the system mechanism to sense when the cable is in
tension, releasing and collecting the tether accordingly, freeing the device from excessive cable
dragging and pulling during inspections.
Figure 55. Active cable feeding systems.
Figure 56 shows the active cable feeding prototype successfully tested at FIU.

FIU-ARC-2017-800006470-04b-255 Chemical Process Alternatives for Radioactive Waste
ARC Year-End Technical Progress Report 65
Figure 56. Prototype of the automated tether management system.
Finally, Figure 57 shows the most recent prototype currently being tested at FIU.
Figure 57. Cable management system equipped with active cable release capability.
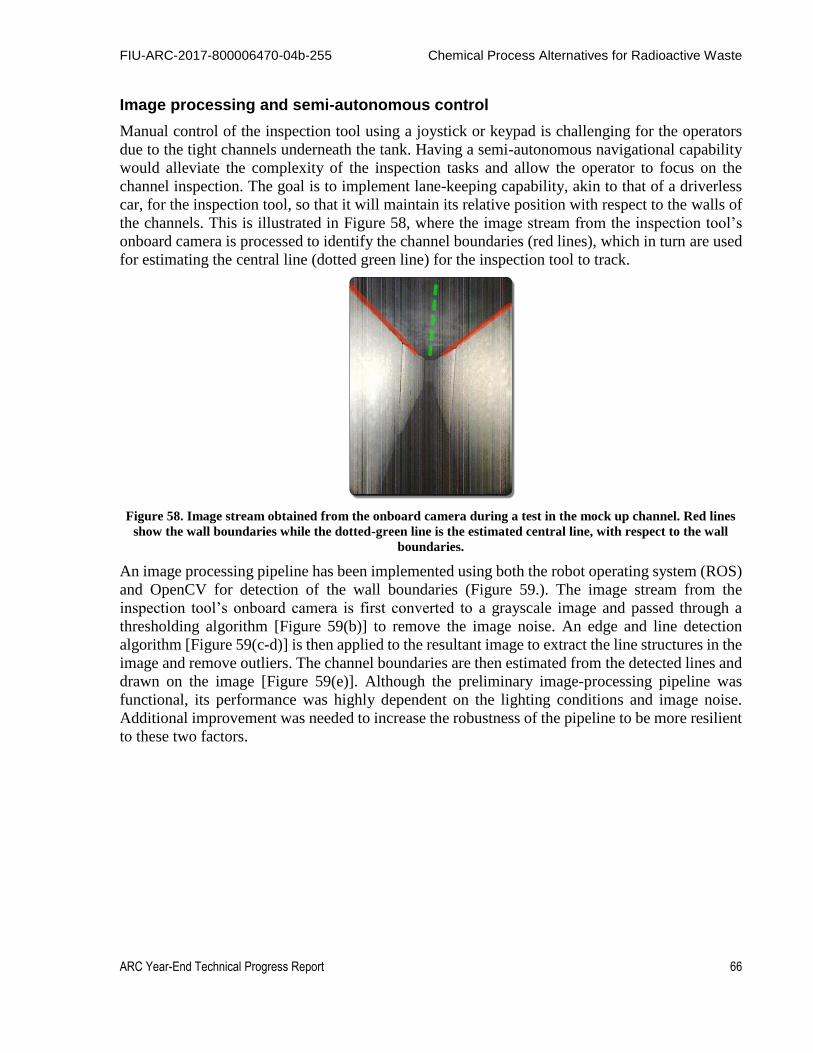
FIU-ARC-2017-800006470-04b-255 Chemical Process Alternatives for Radioactive Waste
ARC Year-End Technical Progress Report 66
Image processing and semi-autonomous control
Manual control of the inspection tool using a joystick or keypad is challenging for the operators
due to the tight channels underneath the tank. Having a semi-autonomous navigational capability
would alleviate the complexity of the inspection tasks and allow the operator to focus on the
channel inspection. The goal is to implement lane-keeping capability, akin to that of a driverless
car, for the inspection tool, so that it will maintain its relative position with respect to the walls of
the channels. This is illustrated in Figure 58, where the image stream from the inspection tool’s
onboard camera is processed to identify the channel boundaries (red lines), which in turn are used
for estimating the central line (dotted green line) for the inspection tool to track.
Figure 58. Image stream obtained from the onboard camera during a test in the mock up channel. Red lines
show the wall boundaries while the dotted-green line is the estimated central line, with respect to the wall
boundaries.
An image processing pipeline has been implemented using both the robot operating system (ROS)
and OpenCV for detection of the wall boundaries (Figure 59.). The image stream from the
inspection tool’s onboard camera is first converted to a grayscale image and passed through a
thresholding algorithm [Figure 59(b)] to remove the image noise. An edge and line detection
algorithm [Figure 59(c-d)] is then applied to the resultant image to extract the line structures in the
image and remove outliers. The channel boundaries are then estimated from the detected lines and
drawn on the image [Figure 59(e)]. Although the preliminary image-processing pipeline was
functional, its performance was highly dependent on the lighting conditions and image noise.
Additional improvement was needed to increase the robustness of the pipeline to be more resilient
to these two factors.

FIU-ARC-2017-800006470-04b-255 Chemical Process Alternatives for Radioactive Waste
ARC Year-End Technical Progress Report 67
Figure 59. Image processing pipeline for detecting the channel boundaries.
Figure 60. Raw image from the camera (left) and processed image with the detected channel boundaries
overlaid in green (right).
Additional efforts then concentrated on fine-tuning the camera image processing and proportional-
integral-derivative (PID) control of the semi-autonomous control for the mini inspection tool.
Some of the parameters for edge and line detection, as well as color segmentation, were fine-tuned.
This resulted in a clearer and more stable detection of the lane (Figure 60) for the semi-autonomous
control of the inspection tool. A preliminary PID control has been designed and implemented to
navigate the mini inspection tool along the central location of the detected lane, while the operator
controls the tool’s forward and backward motion. The semi-autonomous operation frees the
operator from having to keep the inspection tool away from the narrow refractory wall. Figure 61
shows the PID’s performance in controlling the inspection tool along the reference (Ref) signal.
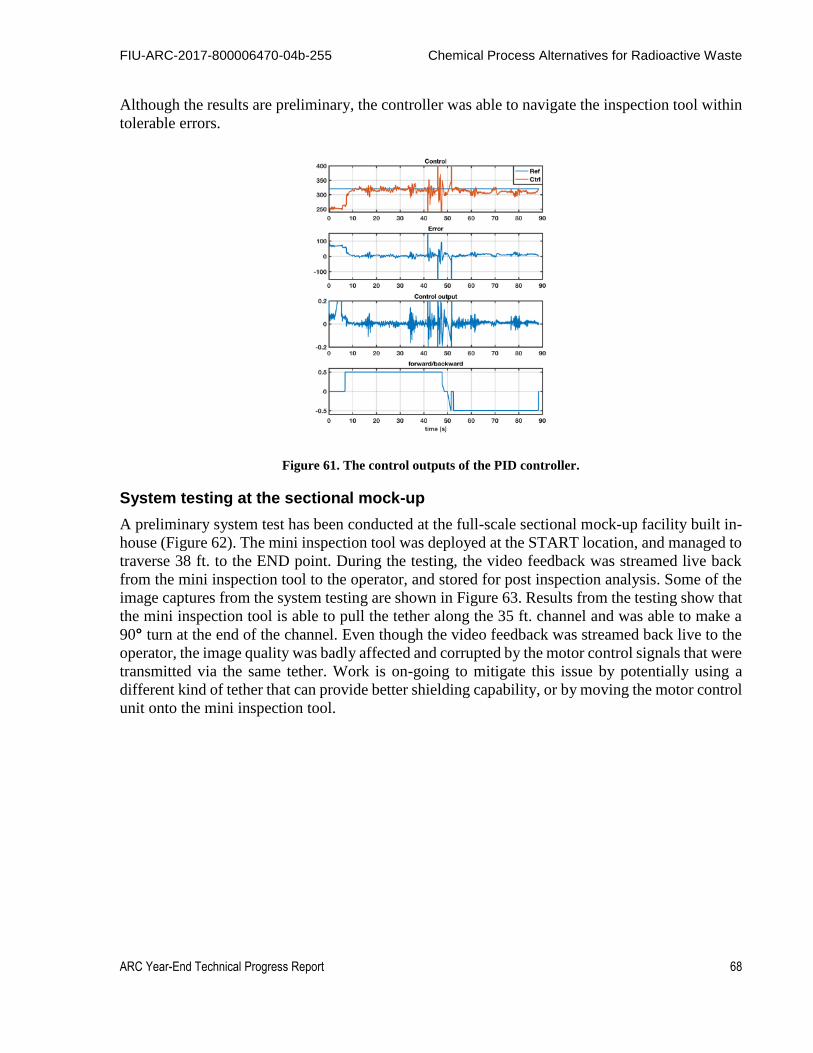
FIU-ARC-2017-800006470-04b-255 Chemical Process Alternatives for Radioactive Waste
ARC Year-End Technical Progress Report 68
Although the results are preliminary, the controller was able to navigate the inspection tool within
tolerable errors.
Figure 61. The control outputs of the PID controller.
System testing at the sectional mock-up
A preliminary system test has been conducted at the full-scale sectional mock-up facility built in-
house (Figure 62). The mini inspection tool was deployed at the START location, and managed to
traverse 38 ft. to the END point. During the testing, the video feedback was streamed live back
from the mini inspection tool to the operator, and stored for post inspection analysis. Some of the
image captures from the system testing are shown in Figure 63. Results from the testing show that
the mini inspection tool is able to pull the tether along the 35 ft. channel and was able to make a
90° turn at the end of the channel. Even though the video feedback was streamed back live to the
operator, the image quality was badly affected and corrupted by the motor control signals that were
transmitted via the same tether. Work is on-going to mitigate this issue by potentially using a
different kind of tether that can provide better shielding capability, or by moving the motor control
unit onto the mini inspection tool.
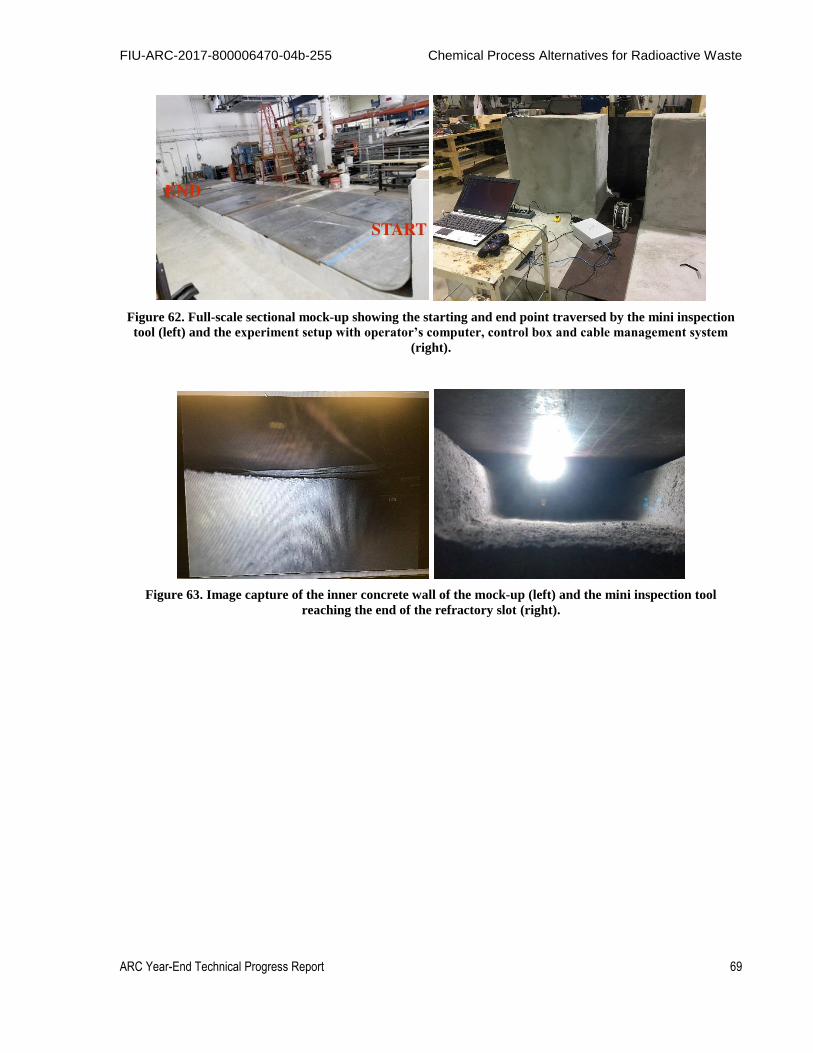
FIU-ARC-2017-800006470-04b-255 Chemical Process Alternatives for Radioactive Waste
ARC Year-End Technical Progress Report 69
Figure 62. Full-scale sectional mock-up showing the starting and end point traversed by the mini inspection
tool (left) and the experiment setup with operator’s computer, control box and cable management system
(right).
Figure 63. Image capture of the inner concrete wall of the mock-up (left) and the mini inspection tool
reaching the end of the refractory slot (right).
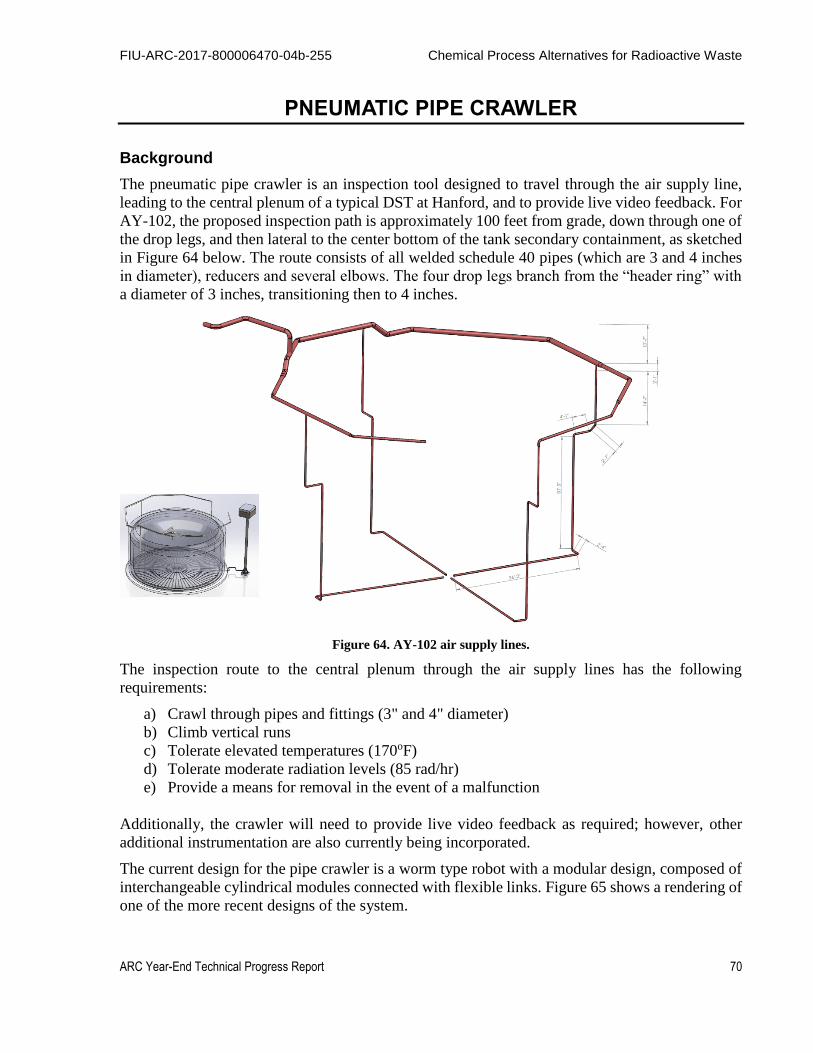
FIU-ARC-2017-800006470-04b-255 Chemical Process Alternatives for Radioactive Waste
ARC Year-End Technical Progress Report 70
PNEUMATIC PIPE CRAWLER
Background
The pneumatic pipe crawler is an inspection tool designed to travel through the air supply line,
leading to the central plenum of a typical DST at Hanford, and to provide live video feedback. For
AY-102, the proposed inspection path is approximately 100 feet from grade, down through one of
the drop legs, and then lateral to the center bottom of the tank secondary containment, as sketched
in Figure 64 below. The route consists of all welded schedule 40 pipes (which are 3 and 4 inches
in diameter), reducers and several elbows. The four drop legs branch from the “header ring” with
a diameter of 3 inches, transitioning then to 4 inches.
Figure 64. AY-102 air supply lines.
The inspection route to the central plenum through the air supply lines has the following
requirements:
a) Crawl through pipes and fittings (3" and 4" diameter)
b) Climb vertical runs
c) Tolerate elevated temperatures (170oF)
d) Tolerate moderate radiation levels (85 rad/hr)
e) Provide a means for removal in the event of a malfunction
Additionally, the crawler will need to provide live video feedback as required; however, other
additional instrumentation are also currently being incorporated.
The current design for the pipe crawler is a worm type robot with a modular design, composed of
interchangeable cylindrical modules connected with flexible links. Figure 65 shows a rendering of
one of the more recent designs of the system.

FIU-ARC-2017-800006470-04b-255 Chemical Process Alternatives for Radioactive Waste
ARC Year-End Technical Progress Report 71
Figure 65. FIU’s pneumatic pipe crawler.
Design concept
The design is an evolution of previous pipe crawlers developed at FIU (Pribanic, 2013). The tool
inherits the idea of using peristaltic propulsion, powered by pneumatics, and includes an innovative
design with a modular approach that utilizes off-the-shelf pneumatic actuators to produce the
contractions of the peristaltic motion.
A pneumatic powered crawler is suitable for highly radioactive environments with potential
exposure to flammable gases. The locomotion system does not require embedded radiation
hardened electronics and electric actuators. The design is also inherently ignition proof, since
pneumatic actuators are not likely to produce electric sparks common in some electric motors and
actuators.
In addition, the peristaltic propelled crawler offers an appropriate design for the radioactive
environment. The device can navigate inside a pipeline without using any external moving parts,
such as wheels and continuous tracks, and could be designed to be fully encapsulated in a
disposable elastic skin. In extreme cases, the crawler itself can be considered disposable, due to its
affordable design.
Another advantage is associated with its modular design, which has the potential to be
customizable. Other specific tasks could be accomplished with the addition of extra modules, such
as instrumentation, material sampling, and pipe repair.
As shown in Figure 66, the crawler’s basic design is composed of five modules linked by flexible
connections:
a) the front camera,
b) the front and back grippers, and
c) the two middle expansion modules.
Figure 66. Pneumatic pipe crawler.
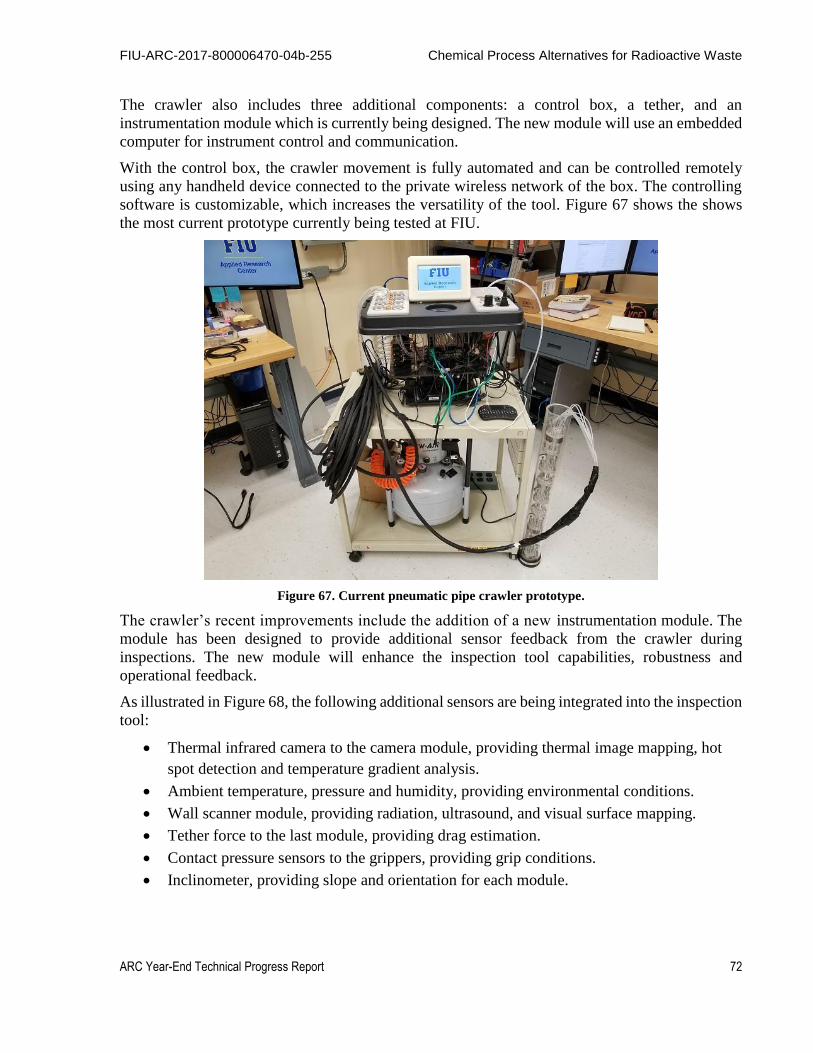
FIU-ARC-2017-800006470-04b-255 Chemical Process Alternatives for Radioactive Waste
ARC Year-End Technical Progress Report 72
The crawler also includes three additional components: a control box, a tether, and an
instrumentation module which is currently being designed. The new module will use an embedded
computer for instrument control and communication.
With the control box, the crawler movement is fully automated and can be controlled remotely
using any handheld device connected to the private wireless network of the box. The controlling
software is customizable, which increases the versatility of the tool. Figure 67 shows the shows
the most current prototype currently being tested at FIU.
Figure 67. Current pneumatic pipe crawler prototype.
The crawler’s recent improvements include the addition of a new instrumentation module. The
module has been designed to provide additional sensor feedback from the crawler during
inspections. The new module will enhance the inspection tool capabilities, robustness and
operational feedback.
As illustrated in Figure 68, the following additional sensors are being integrated into the inspection
tool:
Thermal infrared camera to the camera module, providing thermal image mapping, hot
spot detection and temperature gradient analysis.
Ambient temperature, pressure and humidity, providing environmental conditions.
Wall scanner module, providing radiation, ultrasound, and visual surface mapping.
Tether force to the last module, providing drag estimation.
Contact pressure sensors to the grippers, providing grip conditions.
Inclinometer, providing slope and orientation for each module.

FIU-ARC-2017-800006470-04b-255 Chemical Process Alternatives for Radioactive Waste
ARC Year-End Technical Progress Report 73
Figure 68. Sensor integration.
In addition, an embedded computer integrated with the module will control, manage and
communicate with the sensors in the device. A controller area network (CAN bus) protocol will
be used to communicate from the on-board computer to the portable control box thru the tether.
The sensors currently being considered for prototyping are listed below. The currently selected
sensors are affordable while high precision versions may be considered for site deployment.
Description Sensor
Thermal infrared camera FLIR LEPTON® Long Wave Infrared (LWIR)
Ambient temperature,
pressure and humidity
Adafruit BMP280 I2C or SPI Barometric Pressure & Altitude
Sensor
Radion Teviso RD2014
Ultrasound Ultran Group WD25-2
Visual surface mapping PTC06 Serial Camera Specification
Tether force Phidgets Micro Load Cell CZL635 (0-20kg)
SparkFun Load Cell Amplifier - HX71
Pressure sensors Sparkfun Force Sensitive Resistor 0.5"
Inclinometer AltIMU-10 Gyro, Accelerometer, Compass, and Altimeter
The new additional instrumentation module will be a carrousel type scanner that rotates and maps
the surface along the pipe inspection. As illustrated in Figure 69, the module uses 6 modular panels
that can be customized for different sensors.
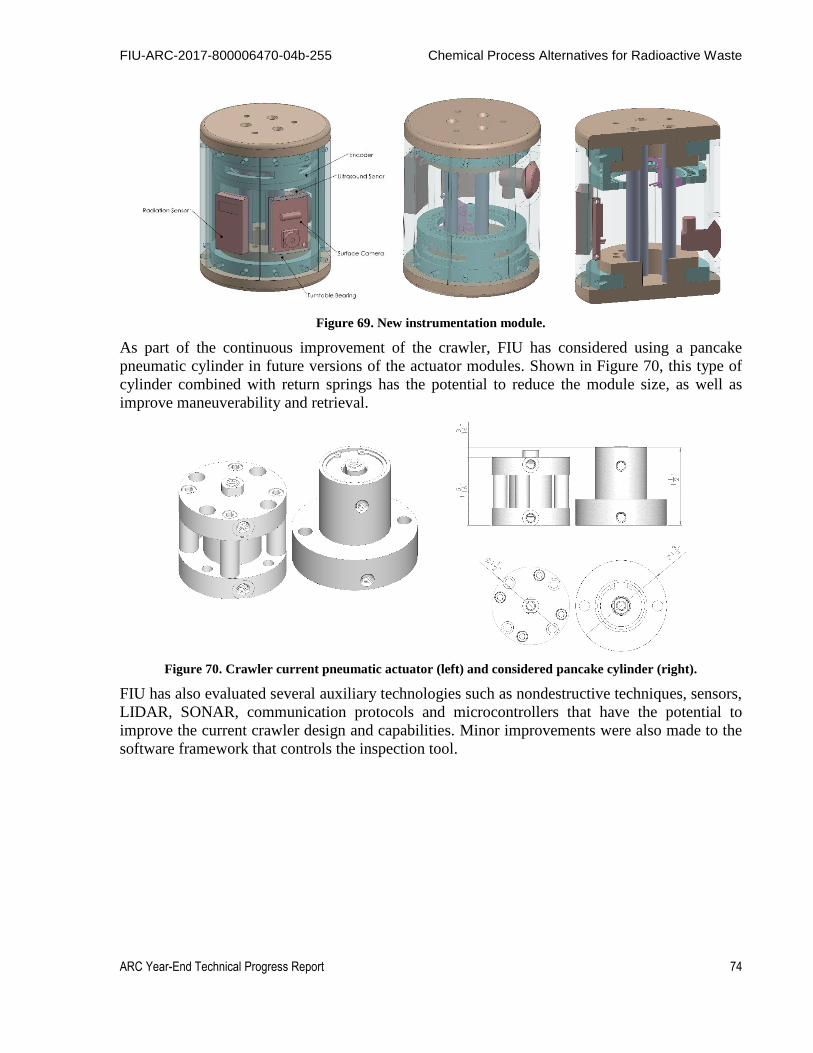
FIU-ARC-2017-800006470-04b-255 Chemical Process Alternatives for Radioactive Waste
ARC Year-End Technical Progress Report 74
Figure 69. New instrumentation module.
As part of the continuous improvement of the crawler, FIU has considered using a pancake
pneumatic cylinder in future versions of the actuator modules. Shown in Figure 70, this type of
cylinder combined with return springs has the potential to reduce the module size, as well as
improve maneuverability and retrieval.
Figure 70. Crawler current pneumatic actuator (left) and considered pancake cylinder (right).
FIU has also evaluated several auxiliary technologies such as nondestructive techniques, sensors,
LIDAR, SONAR, communication protocols and microcontrollers that have the potential to
improve the current crawler design and capabilities. Minor improvements were also made to the
software framework that controls the inspection tool.

FIU-ARC-2017-800006470-04b-255 Chemical Process Alternatives for Radioactive Waste
ARC Year-End Technical Progress Report 75
DST FULL SCALE SECTIONAL MOCKUP
FIU has been developing a full scale sectional mockup of the bottom section of a double shell tank.
The testbed has being designed to be customizable with a modular design that can reproduce
inspection conditions in Hanford tanks. This includes various configurations of the refractory pad,
cooling channels, supply airlines and plate thicknesses. Defects such as damaged welds, and in
situ bottom cracks can also be simulated. The mockup will also be capable of evaluating future
inspection technologies, delivery systems and robotic devices. The mockup design has been
extensively coordinated with the site engineers at WRPS, and extra care will be taken to assure a
high correlation between the mockup and the in-field conditions. Figure 71 illustrates an early
version of the mockup design, which was redesigned to be more versatile and cost effective.
Figure 71. Original mockup design.
As seen in Figure 72, the metal structure was removed in a redesign and the sectional mockup was
enhanced to address corrosion problems in the secondary liner of the DSTs.
Figure 72. Current mockup design.
The redesigned mockup not only includes the ventilation channels in the refractory pad of the
primary tank, but it also includes the leak detection system in the foundation slab of the secondary
tank liner. The full structure is 8 ft wide and 37.5 ft long and emulates the following elements of
the tank:
concrete foundation with draw slots,
6” drain line,
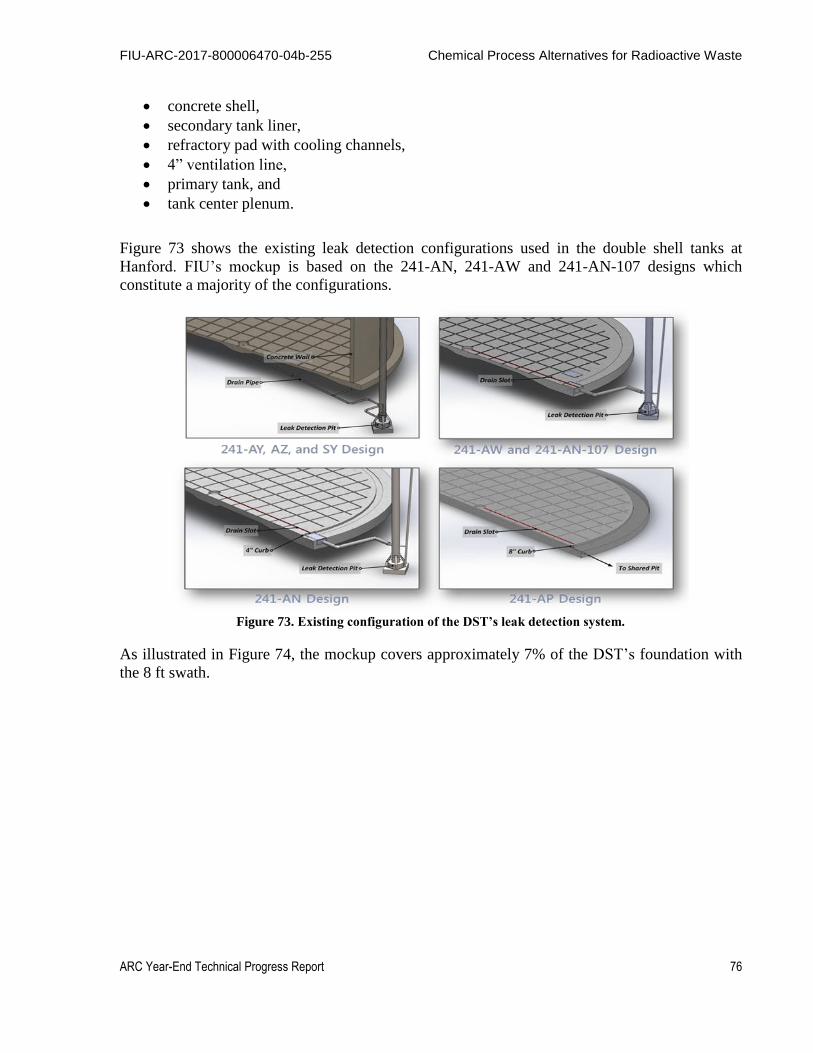
FIU-ARC-2017-800006470-04b-255 Chemical Process Alternatives for Radioactive Waste
ARC Year-End Technical Progress Report 76
concrete shell,
secondary tank liner,
refractory pad with cooling channels,
4” ventilation line,
primary tank, and
tank center plenum.
Figure 73 shows the existing leak detection configurations used in the double shell tanks at
Hanford. FIU’s mockup is based on the 241-AN, 241-AW and 241-AN-107 designs which
constitute a majority of the configurations.
Figure 73. Existing configuration of the DST’s leak detection system.
As illustrated in Figure 74, the mockup covers approximately 7% of the DST’s foundation with
the 8 ft swath.
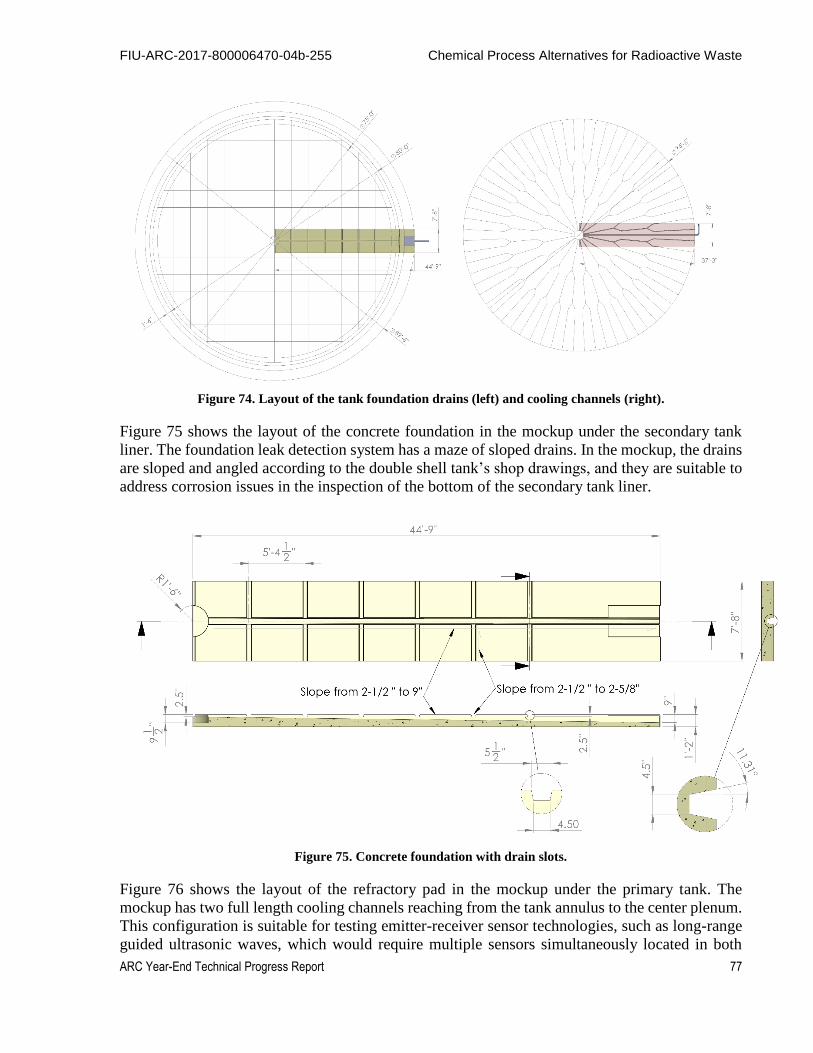
FIU-ARC-2017-800006470-04b-255 Chemical Process Alternatives for Radioactive Waste
ARC Year-End Technical Progress Report 77
Figure 74. Layout of the tank foundation drains (left) and cooling channels (right).
Figure 75 shows the layout of the concrete foundation in the mockup under the secondary tank
liner. The foundation leak detection system has a maze of sloped drains. In the mockup, the drains
are sloped and angled according to the double shell tank’s shop drawings, and they are suitable to
address corrosion issues in the inspection of the bottom of the secondary tank liner.
Figure 75. Concrete foundation with drain slots.
Figure 76 shows the layout of the refractory pad in the mockup under the primary tank. The
mockup has two full length cooling channels reaching from the tank annulus to the center plenum.
This configuration is suitable for testing emitter-receiver sensor technologies, such as long-range
guided ultrasonic waves, which would require multiple sensors simultaneously located in both

FIU-ARC-2017-800006470-04b-255 Chemical Process Alternatives for Radioactive Waste
ARC Year-End Technical Progress Report 78
channels. The refractory mockup also includes one of the carbon steel 4” ventilation pipe lines,
the only feasible way to provide access to the tank central plenum.
Figure 76. Refractory pad with cooling channels.
Figure 77 shows the mockup of the central plenum, which is also constructed in accordance with
the DST drawing provided by WRPS.
Figure 77. Tank central plenum.
The mockup foundation and refractory pad are made of a wood frame coated with concrete. The
concrete coating is approximately 1/2" thick in the foundation and in the refractory. The concrete
is held by a metal mesh attached to the wood frame. Shown in Figure 78, this combination provides
a lighter structure combined with surface properties similar the the refractory in the Hanford tanks.
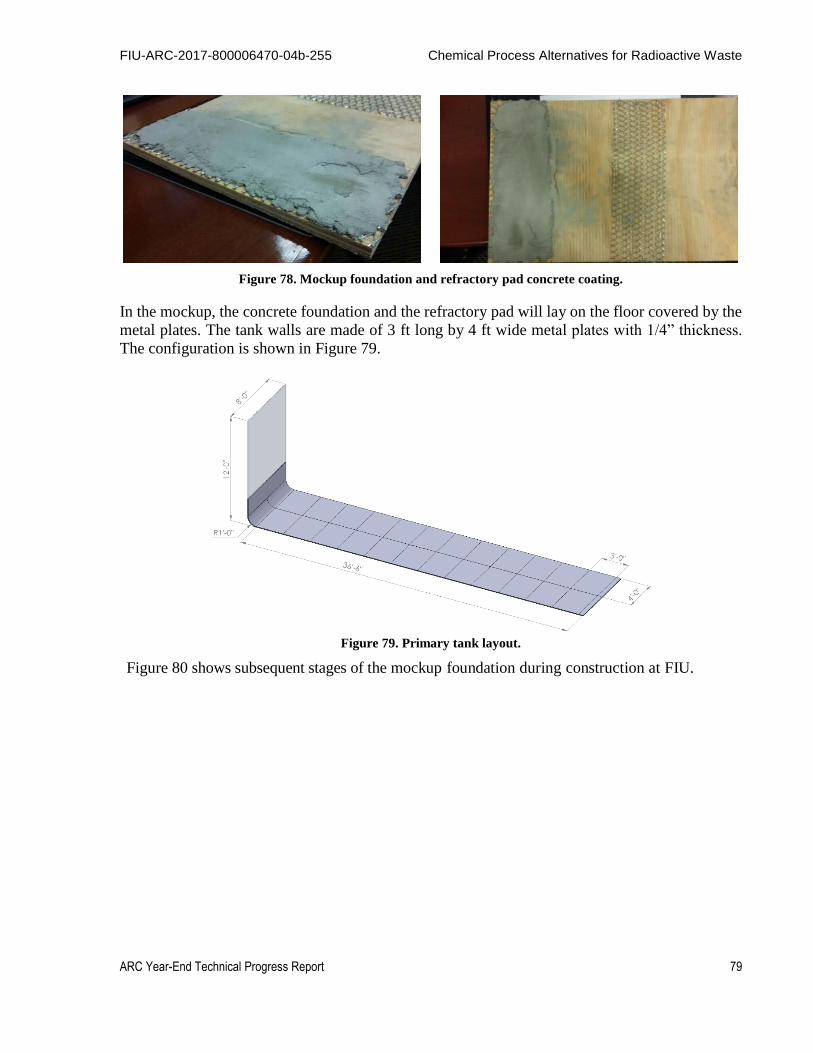
FIU-ARC-2017-800006470-04b-255 Chemical Process Alternatives for Radioactive Waste
ARC Year-End Technical Progress Report 79
Figure 78. Mockup foundation and refractory pad concrete coating.
In the mockup, the concrete foundation and the refractory pad will lay on the floor covered by the
metal plates. The tank walls are made of 3 ft long by 4 ft wide metal plates with 1/4” thickness.
The configuration is shown in Figure 79.
Figure 79. Primary tank layout.
Figure 80 shows subsequent stages of the mockup foundation during construction at FIU.
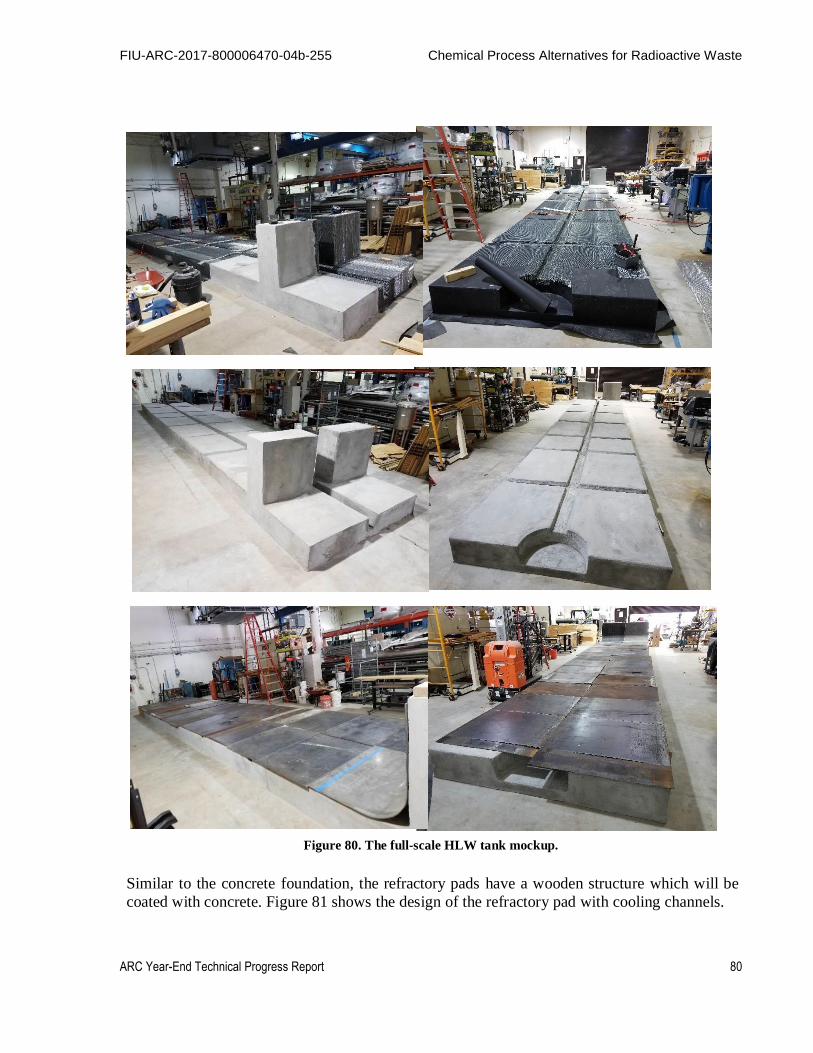
FIU-ARC-2017-800006470-04b-255 Chemical Process Alternatives for Radioactive Waste
ARC Year-End Technical Progress Report 80
Figure 80. The full-scale HLW tank mockup.
Similar to the concrete foundation, the refractory pads have a wooden structure which will be
coated with concrete. Figure 81 shows the design of the refractory pad with cooling channels.

FIU-ARC-2017-800006470-04b-255 Chemical Process Alternatives for Radioactive Waste
ARC Year-End Technical Progress Report 81
Figure 81. Design of the refractory pad structure with cooling channels.
The refractory pad are being constructed from sectional boxes made of plywood, as shown in
Figure 82. The boxes will have slots cut to form the network of refractory channels. After the
slots are created, the wood boxes will be covered in an asphalt felt and a metal lath will be
placed on top. A thin layer of concrete (around 1/2") will then be added onto the lath and the
secondary liner will be installed. This will complete the initial construction of the test bed.
Figure 82. Plywood boxes that form the refectory.
FIU-ARC-2017-800006470-04b-255 Chemical Process Alternatives for Radioactive Waste
ARC Year-End Technical Progress Report 82
CONCLUSIONS AND FUTURE WORK
The miniature rover inspection tool has been redesigned to improve its overall functionality. PCBs
were designed and fabricated for the base, camera and sensors to reduce wire clutter in the
inspection tool. It also removed tension from the wires while the inspection tool is in operation.
The use of PCBs also allowed patch LEDs to be used as the lighting source, thus increasing the
amount of light and improving the image quality of the camera feed.
Sensor integration for the inspection tool was carried out as part of the performance year efforts.
Among the sensors considered were temperature, humidity and radiation sensors. The sensors were
fitted onto their respective sensor hoods that provide a common power and communication
interface with the base unit. This allows the sensor hood to be interchangeable for different
inspection tasks.
An active cable management system that automatically releases and reels in cable has been
designed to aid the limited pull-force that the inspection tool can generate. In addition, a controller
box to house all of the necessary electronic components required to operate the inspection tool and
the cable management system has been constructed. Furthermore, an Xbox controller can be
attached to the controller box for manual operation of both the inspection tool and the cable
management system, when needed.
To ease the inspection operation within the narrow refractory channels, semi-autonomous control
of the inspection tool has been designed and is being fine-tuned. Images from the inspection tool’s
camera were processed to implement lane-keeping capability. This freed the operator from having
to keep the inspection tool in the center of the channels, allowing them to focus their attention on
the inspection tasks at hand.
Preliminary testing has been conducted at the full-scale sectional mock-up facility built in-house.
Test results showed that the mini inspection tool was able to overcome the friction generated by
the tether and managed to traverse the full length of the refractory channel. Work is ongoing to
correct the signal corruption issues and improve the quality of the images streamed back from the
mini inspection tool camera. Future work includes testing the mini inspection tool with the
integrated sensors and validating the results in the mock-up facility.
FIU has also continued to test and improve the pneumatic pipe crawler developed for inspection
of 3- and 4-inch pipelines. The primary improvement includes the integration of sensors, with the
objective of enhancing the inspection tool capabilities, robustness and operational feedback. The
integration of the following sensors are being considered: (a) a thermal infrared camera to provide
thermal image mapping, hot spot detection and temperature gradient analysis; (b) ambient
temperature, pressure and humidity sensors to provide environmental conditions; (c) a wall scanner
module to provide radiation, ultrasound, and visual surface mapping; (d) a load cell to provide
tether drag estimation; (e) contact pressure sensors to provide grip conditions; and (f) inclinometers
to provide slope and orientation of each module of the crawler. The addition of an automated cable
management systems will be considered as well. In the next period of performance, the design of
a larger scale crawler that can navigate through the 6-inch drain pit pipeline will be developed
using the lessons learned from the initial system. FIU will also investigate the development of a
conceptual design for a 2-inch version of the pipe crawler.

FIU-ARC-2017-800006470-04b-255 Chemical Process Alternatives for Radioactive Waste
ARC Year-End Technical Progress Report 83
Lastly, a full scale sectional mockup of the DST floor was designed and its construction is almost
completed. FIU will continue to make improvement of the testbed based on guidance from WRPS
to assure a high correlation between the mockup and the Hanford tanks. The mockup can also be
used to evaluate future inspection technologies, sensors and robotic devices in operational
conditions equivalent to those at Hanford.

FIU-ARC-2017-800006470-04b-255 Chemical Process Alternatives for Radioactive Waste
ARC Year-End Technical Progress Report 84
TASK 18.3 INVESTIGATION USING AN INFRARED TEMPERATURE
SENSOR TO DETERMINE THE INSIDE WALL TEMPERATURE OF DSTS (FIU YEAR 7)
EXECUTIVE SUMMARY
Corrosion in DSTs is one of the primary concerns at Hanford and other sites. It is managed by
stringent operating specifications as given in OSD-T-151-00007 “Operating Specifications for the
Double-Shell Storage Tanks” (OSD) [1]. One of the important parameters specified by OSD is the
temperature which plays an important role in corrosion. In general, the tank temperatures are
determined by various processes and most of these methods are approximations of the actual
temperatures at various locations inside the DST’s. Hence, there is an immense need for accurate
measurements and calculations of actual temperatures inside the tanks. Of particular interest is at
the interface of the tank waste and the inner walls since it accounts for the region highly prone to
corrosion.
The present task investigates in the use of an infrared (IR) sensor to measure the outer wall
temperatures of the primary shell in the DST. This process is practical since the sensor is expected
to “piggy back” on the scheduled inspection tools passing through the annulus of the DSTs. The
method checks whether the temperatures are within limits and may aid in obtaining accurate data
for input to thermal models and, in some cases, validate the models. During the previous year,
bench-scale testing has been initiated to validate the feasibility and use of the IR sensor for DST
measurements. The DSTs were represented using rectangular tanks. The IR sensor, as
recommended by the WRPS site engineers (Raytek MI3 [4] sensor), was procured, calibrated and
preliminary tests were conducted. The sensor results were compared to those obtained from
manual measurements using thermocouples. In addition, heat transfer based models were
generated and solved using commercially available software (Solidworks 2013) to study the
temperature profiles in the primary tank walls.
The bench-scale testing has been successfully completed with enhancements to the previous year’s
efforts. This included the automation of the data acquisition system for real-time measurements
during the tests and the use of testing temperature conditions that replicate actual DST
temperatures. In addition, emissivity calibration tests were conducted to validate the IR sensor for
use with other materials such as stainless steel along with carbon steel. Further, the Raytek IR
sensor was investigated for integration into two robotic inspection devices: the mini-rover and the
pipe crawler. The sensor can be used in conjunction with temperature dependent UT sensors for
calibration.
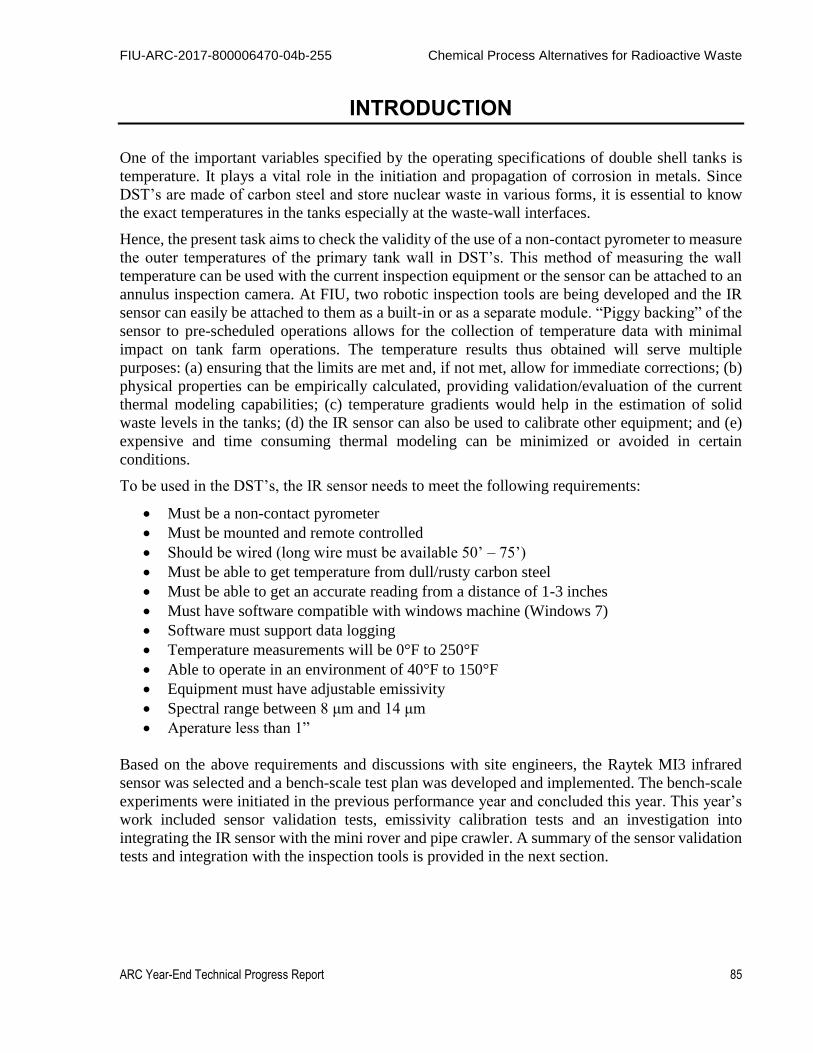
FIU-ARC-2017-800006470-04b-255 Chemical Process Alternatives for Radioactive Waste
ARC Year-End Technical Progress Report 85
INTRODUCTION
One of the important variables specified by the operating specifications of double shell tanks is
temperature. It plays a vital role in the initiation and propagation of corrosion in metals. Since
DST’s are made of carbon steel and store nuclear waste in various forms, it is essential to know
the exact temperatures in the tanks especially at the waste-wall interfaces.
Hence, the present task aims to check the validity of the use of a non-contact pyrometer to measure
the outer temperatures of the primary tank wall in DST’s. This method of measuring the wall
temperature can be used with the current inspection equipment or the sensor can be attached to an
annulus inspection camera. At FIU, two robotic inspection tools are being developed and the IR
sensor can easily be attached to them as a built-in or as a separate module. “Piggy backing” of the
sensor to pre-scheduled operations allows for the collection of temperature data with minimal
impact on tank farm operations. The temperature results thus obtained will serve multiple
purposes: (a) ensuring that the limits are met and, if not met, allow for immediate corrections; (b)
physical properties can be empirically calculated, providing validation/evaluation of the current
thermal modeling capabilities; (c) temperature gradients would help in the estimation of solid
waste levels in the tanks; (d) the IR sensor can also be used to calibrate other equipment; and (e)
expensive and time consuming thermal modeling can be minimized or avoided in certain
conditions.
To be used in the DST’s, the IR sensor needs to meet the following requirements:
Must be a non-contact pyrometer
Must be mounted and remote controlled
Should be wired (long wire must be available 50’ – 75’)
Must be able to get temperature from dull/rusty carbon steel
Must be able to get an accurate reading from a distance of 1-3 inches
Must have software compatible with windows machine (Windows 7)
Software must support data logging
Temperature measurements will be 0°F to 250°F
Able to operate in an environment of 40°F to 150°F
Equipment must have adjustable emissivity
Spectral range between 8 μm and 14 μm
Aperature less than 1”
Based on the above requirements and discussions with site engineers, the Raytek MI3 infrared
sensor was selected and a bench-scale test plan was developed and implemented. The bench-scale
experiments were initiated in the previous performance year and concluded this year. This year’s
work included sensor validation tests, emissivity calibration tests and an investigation into
integrating the IR sensor with the mini rover and pipe crawler. A summary of the sensor validation
tests and integration with the inspection tools is provided in the next section.
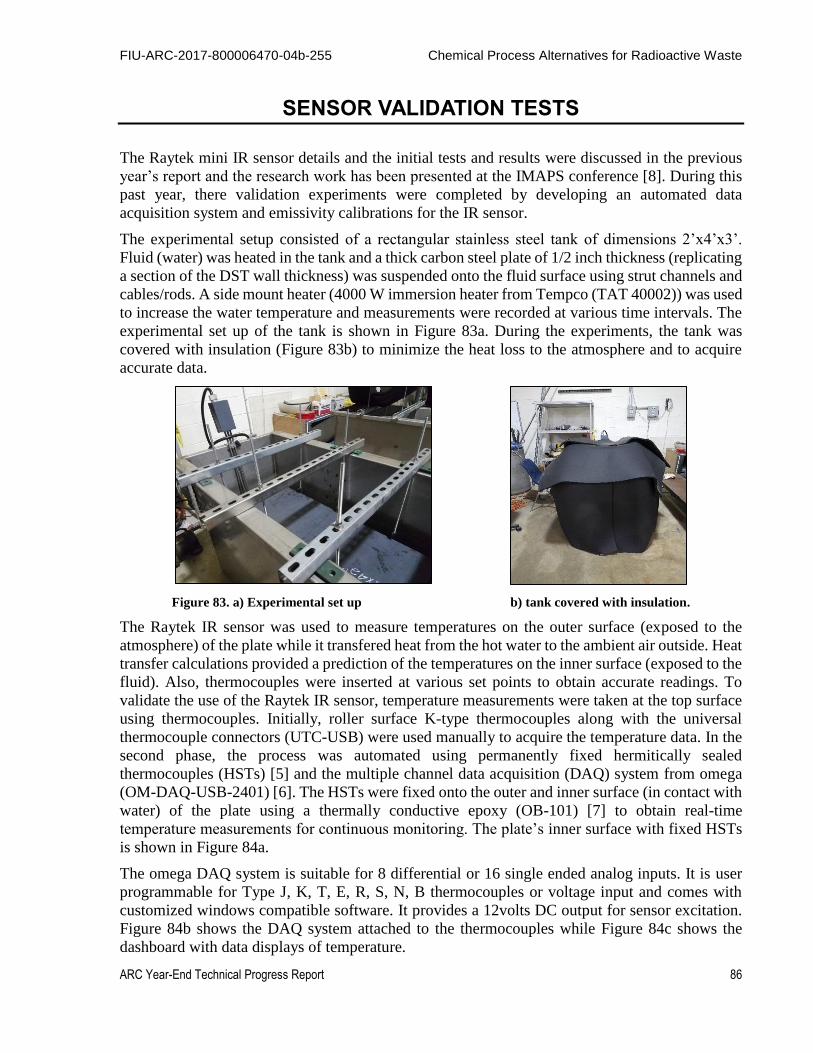
FIU-ARC-2017-800006470-04b-255 Chemical Process Alternatives for Radioactive Waste
ARC Year-End Technical Progress Report 86
SENSOR VALIDATION TESTS
The Raytek mini IR sensor details and the initial tests and results were discussed in the previous
year’s report and the research work has been presented at the IMAPS conference [8]. During this
past year, there validation experiments were completed by developing an automated data
acquisition system and emissivity calibrations for the IR sensor.
The experimental setup consisted of a rectangular stainless steel tank of dimensions 2’x4’x3’.
Fluid (water) was heated in the tank and a thick carbon steel plate of 1/2 inch thickness (replicating
a section of the DST wall thickness) was suspended onto the fluid surface using strut channels and
cables/rods. A side mount heater (4000 W immersion heater from Tempco (TAT 40002)) was used
to increase the water temperature and measurements were recorded at various time intervals. The
experimental set up of the tank is shown in Figure 83a. During the experiments, the tank was
covered with insulation (Figure 83b) to minimize the heat loss to the atmosphere and to acquire
accurate data.
Figure 83. a) Experimental set up b) tank covered with insulation.
The Raytek IR sensor was used to measure temperatures on the outer surface (exposed to the
atmosphere) of the plate while it transfered heat from the hot water to the ambient air outside. Heat
transfer calculations provided a prediction of the temperatures on the inner surface (exposed to the
fluid). Also, thermocouples were inserted at various set points to obtain accurate readings. To
validate the use of the Raytek IR sensor, temperature measurements were taken at the top surface
using thermocouples. Initially, roller surface K-type thermocouples along with the universal
thermocouple connectors (UTC-USB) were used manually to acquire the temperature data. In the
second phase, the process was automated using permanently fixed hermitically sealed
thermocouples (HSTs) [5] and the multiple channel data acquisition (DAQ) system from omega
(OM-DAQ-USB-2401) [6]. The HSTs were fixed onto the outer and inner surface (in contact with
water) of the plate using a thermally conductive epoxy (OB-101) [7] to obtain real-time
temperature measurements for continuous monitoring. The plate’s inner surface with fixed HSTs
is shown in Figure 84a.
The omega DAQ system is suitable for 8 differential or 16 single ended analog inputs. It is user
programmable for Type J, K, T, E, R, S, N, B thermocouples or voltage input and comes with
customized windows compatible software. It provides a 12volts DC output for sensor excitation.
Figure 84b shows the DAQ system attached to the thermocouples while Figure 84c shows the
dashboard with data displays of temperature.

FIU-ARC-2017-800006470-04b-255 Chemical Process Alternatives for Radioactive Waste
ARC Year-End Technical Progress Report 87
Figure 84. a) HSTs fixed under the plate b) DAQ system with thermocouples c) DAQ dashboard.
The temperatures were measured at 6 points on the plate using HST’s and at 3 top surface points
using the Raytek sensor. The results obtained are tabulated in Table 9.
Table 9. Temperature (IR Sensor and HSTs) in ºF
Data
point
T1 T2 T3 B1 B2 B3 R1 R2 R3
1 111.14 104.23 106.07 114.67 109.28 108.78 109.2 106.4 104.7
2 115.35 111.12 111.19 120.1 115.34 115.12 116.7 112.7 109.9
3 123.27 111.83 117.29 130.2 126.05 125.4 132.9 128.9 124.6
4 132.12 116.57 125.98 140.32 135.96 135.27 143.9 141.7 133
5 142.09 132.99 137.44 150.06 145.25 144.53 152 145.7 141.7
6 152.91 142.71 138.7 160.17 154.42 153.67 157 155 153.1
7 162.73 151.41 148.01 170.05 164.45 163.6 165.2 167.2 166.2
@T – Top surface, B – Bottom surface, R – Raytek
In Table 9, the columns T1, T2 and T3 represent the thermocouple readings while R1, R2 and R3
represent the Raytek sensor readings at the same locations. Thus, these values are compared. It
was determined that the average difference between the corresponding readings for location 1 was
5.3ºF, while for location 2 and location 3 was 12.3ºF and 6.9ºF, respectively. It was observed that
the temperature difference increased with an increase in temperature. In most cases, the Raytek
sensor showed a higher value. In addition, the temperatures at the top 3 locations, T1, T2 and T3
were compared to the bottom 3 locations, B1, B2 and B3 to investigate the heat transfer effects.
From the results, it is inferred that the average temperature difference was 6.5ºF, 11.4ºF, and 8.8ºF,
respectively, for the three locations. According to theoretical calculations, the average readings
can approximate 4-5ºF taking into account the temperature gradients with location and time.
In addition, the emissivity experiments were also conducted to check the sensor’s validity for
carbon steel and stainless steel materials. The first experiment conducted utilized the carbon steel
plate. Since the emissivity value of carbon steel was not precisely available in literature, an initial
estimate of 0.75 was chosen and a range of values above and below the initial estimate was
recorded. The experiment consisted of the ambient temperature measurement on a carbon steel
plate (1/2 inch thick) using both a Raytek and a hermitically sealed thermocouple. The second
experiment was conducted on the tank wall which consisted of stainless steel. Emissivity values
were changed from 0.3 to 0.6. The experimental set up for emissivity tests and the IR sensor are
shown in Figure 85.

FIU-ARC-2017-800006470-04b-255 Chemical Process Alternatives for Radioactive Waste
ARC Year-End Technical Progress Report 88
Figure 85. Emissivity experiment with Raytek sensor a) carbon steel plate b) stainless steel tank wall.
Results obtained from both experiments are given in Table 10 and Table 11. In Table 10, the
temperature was recorded at three different points using both sensors. It is evident from the table
that the temperature readings were close when the emissivity value ranged from 0.76 to 0.79 and
precise at 0.78. Also, it should be noted that for the emissivity change from 0.7 to 0.8, the
temperature values were precise within a maximum of 2-3ºF. Hence, the emissivity of carbon steel
can be taken as 0.78.
Table 10. Experimental Results with ½ in Carbon Steel Plate (Temperature Readings in ºF)
Emissivity
(Raytek)
Raytek
(point 1)
Raytek
(point 2)
Raytek
(point 3)
TC
(point 1)
TC
(point 2)
TC
(point 3)
0.7 69.5 68.5 68.7 72.88 73.25 71.66
0.71 65.9 64.4 66.8 73.43 71.13 75.78
0.72 68.2 70.2 70.2 73.05 71.33 71.07
0.73 68.9 67.4 67.8 73.13 70.77 73.97
0.74 66.4 67.6 66.8 72.92 71.37 72.42
0.75 68.4 68.6 68.1 62.98 66.08 66.49
0.76 66.8 68.7 68.3 68.69 69.97 68.22
0.77 70.6 67.5 66.9 69.65 68.08 70.03
0.78 70.9 69.7 68.9 70.49 70.15 70.58
0.79 70.9 69.8 68.5 71.24 70.14 72.28
0.8 70.6 71.4 70.2 72.19 73.2 72.54
Table 11. Experimental Results on Stainless Steel Plate (Temperature Readings in ºF)
Emissivity (Raytek) Raytek TC
0.3 40.4 73.42
0.4 52.8 73.54
0.5 61.4 73.23
0.6 73.7 74.34

FIU-ARC-2017-800006470-04b-255 Chemical Process Alternatives for Radioactive Waste
ARC Year-End Technical Progress Report 89
In the case of stainless steel, it was observed (Table 11) that the emissivity value of 0.4 to 0.5
provided an inaccurate temperature reading but at an emissivity of 0.6, both Raytek and
thermocouple readings were close with less than a 1ºF temperature difference. So, the emissivity
of stainless steel can be taken as 0.6. With these results, a method has been established to accurately
calibrate the sensor for different material types and emissivity values.

FIU-ARC-2017-800006470-04b-255 Chemical Process Alternatives for Radioactive Waste
ARC Year-End Technical Progress Report 90
SENSOR INTEGRATION WITH INSPECTION TOOLS
Integration of the IR sensor with the inspection devices developed in task 18.2 was also
investigated. The miniature magnetic rover developed for carbon steel pipe inspections was chosen
as a base model to integrate the mini IR sensor.
The IR sensor head was initially placed on an empty chassis of the mini rover to estimate the size
and appearance of the unified system, shown in Figure 86a. The sensor head was placed along the
length of the rover and the cable can be directly attached to the tether of the mini rover.
The sensor head was then temporarily mounted to the actual mini rover and basic temperature
readings were obtained. The sensor head attached to the mini rover inside the scaled DST mock-
up channels is shown in Figure 86b and c.
Figure 86. IR sensor head on the rover: a) empty chassis b) actual rover in the tank channels c) detailed view.
Alternative sensor locations, as shown in Figure 87, were considered, since frontal, rear and
angular measurements are often needed inside the pipe.
Figure 87. IR sensor head attached at: a) front b) top (angular) c) rear.
Various mounting techniques such as clip-on-and-clip-off versus glue or adhesive bonding versus
screws, etc. are currently being considered for semi-permanent mounting of the sensor head to the
mini rover and similar pipe inspection tools to investigate the feasibility of its use in pipes and
tanks.
The integration of the IR sensor with the pneumatic pipe crawler inspection device developed for
tank inspections was also evaluated. The pneumatic crawler is modular and the sections connecting
the modules provide a decent base for IR sensor incorporation. The IR sensor was fixed
temporarily on the pneumatic pipe crawler as shown in Figure 88a. This area is untouched by the
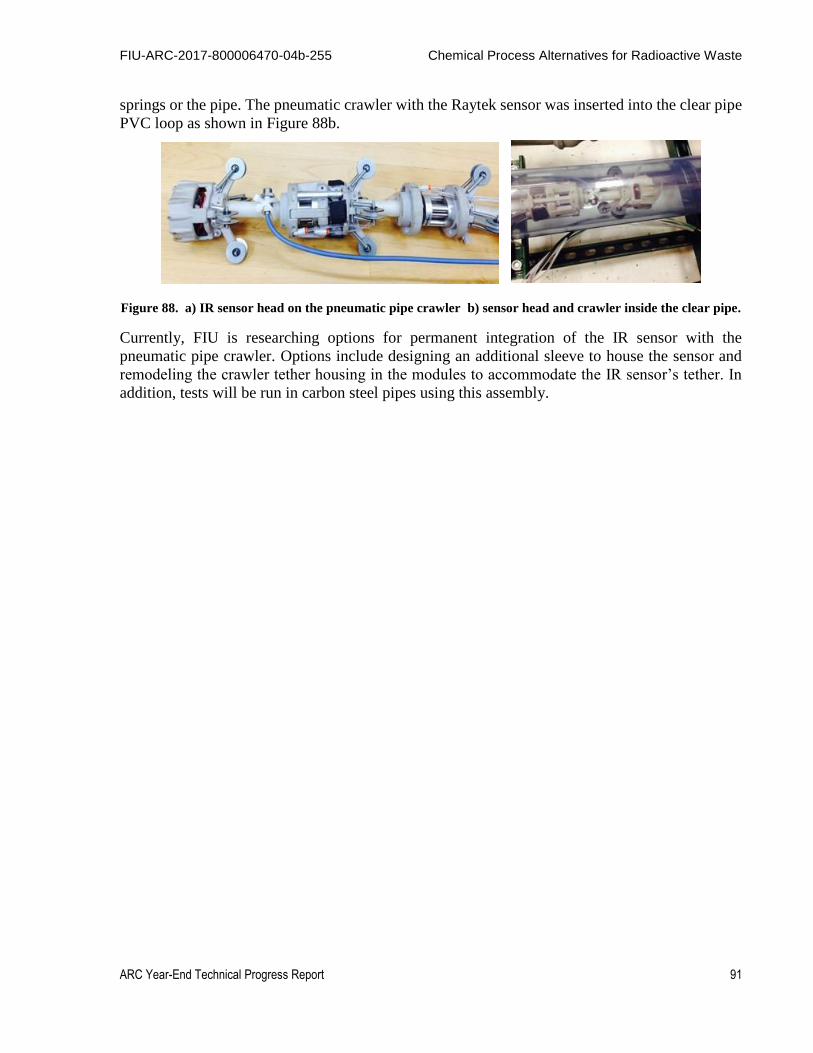
FIU-ARC-2017-800006470-04b-255 Chemical Process Alternatives for Radioactive Waste
ARC Year-End Technical Progress Report 91
springs or the pipe. The pneumatic crawler with the Raytek sensor was inserted into the clear pipe
PVC loop as shown in Figure 88b.
Figure 88. a) IR sensor head on the pneumatic pipe crawler b) sensor head and crawler inside the clear pipe.
Currently, FIU is researching options for permanent integration of the IR sensor with the
pneumatic pipe crawler. Options include designing an additional sleeve to house the sensor and
remodeling the crawler tether housing in the modules to accommodate the IR sensor’s tether. In
addition, tests will be run in carbon steel pipes using this assembly.

FIU-ARC-2017-800006470-04b-255 Chemical Process Alternatives for Radioactive Waste
ARC Year-End Technical Progress Report 92
CONCLUSIONS AND FUTURE WORK
Bench scale experiments were conducted to validate the use of the Raytek mini IR sensor for use
with the inspection devices to be deployed to actual sites. Automated data acquisition systems
were used along with the HSTs permanently fixed to the inner and outer surface of the test piece
for accurate thermal measurement and validation. Also, a temperature range as specified for the
DST’s (120-170ºF) was used. The experiments were conducted to investigate the sensitivity of the
Raytek IR sensor to different emissivity values and materials. A method has been established to
accurately calibrate and test the Raytek mini IR sensor. The tests were conducted with hot water
(liquid medium).
In addition, the option of potential integration of the IR sensor with inspection devices for
deployment into the tanks was investigated. This task will be merged with the mini-rover and
crawler tasks in the next performance year to make design modifications for integration.

FIU-ARC-2017-800006470-04b-255 Chemical Process Alternatives for Radioactive Waste
ARC Year-End Technical Progress Report 93
REFERENCES
1. OSD-T-151-00007, Operating specifications for the Double-Shell Storage Tanks, Rev 1,
Washington River Protection Solutions, Richland, WA.
2. Holsmith, B. (2015). Double Shell Tank Primary Wall Temperature Measurements: Suggested
New Technology White Paper, Washington River Protection Solutions, Richland, WA.
3. The Principles of Noncontact Temperature Measurement, produced by Raytek® available
online at http://support.fluke.com/raytek-sales/Download/Asset/9250315_ENG_D_W.PDF
4. www.raytek.com
5. http://www.omega.com/pptst/HSTC.html
6. http://www.omega.com/search/esearch.asp?start=0&perPage=10&summary=yes&sort=rank&search=
OM-DAQ-USB-2401&submit=Search&ori=OM-DAQ-USB-2401
7. http://www.omega.com/pptst/OB-100_OB-200_OT-200.html
8. Aravelli, D. McDaniel, A. Abrahao, A. Awwad, C. Davila, “Thermal Measurement and
Modeling of Nuclear Waste in the Double Shell Tanks at Hanford Nuclear Waste Site Using
Miniature Sensors,” International Microelectronics Assembly and Packaging Society
(IMAPS) 2016, Pasadena, CA, October 11-13, 2016.
FIU-ARC-2017-800006470-04b-255 Chemical Process Alternatives for Radioactive Waste
ARC Year-End Technical Progress Report 94
TASK 19.1 PIPELINE CORROSION AND EROSION EVALUATION
(FIU YEAR 7)
EXECUTIVE SUMMARY
A fitness-for-service (FFS) program has been implemented by Washington River Protection
Solutions (WRPS) to assess the structural integrity of pipelines, tanks and tank farm waste transfer
system. The purpose of the program was to inspect primary piping, encasements, and jumpers for
corrosion/erosion which has been accomplished in the previous years. As recommended, at least
5% of the buried carbon steel DSTs waste transfer line encasements were inspected. Data has been
collected for a number of these system components and analyzed.
Previous efforts from FIU included the evaluation of ultrasonic transducers that can provide real-
time thickness measurements for transfer system components. Initially, a market study was
conducted on various commercially available ultrasonic transducer systems according to the
requirements listed by the WRPS/DOE personnel. Out of the many options, some of the sensors
were procured and tested. Since the data acquisition systems were expensive; two of the viable
options were down selected.
During this past year, one of the down selected UT sensor systems, from the manufacturer
Permasense, was acquired and initial bench-scale validation tests have been successfully
conducted. The bench-scale test loop consisted of 2- and 3-inch diameter pipe sections with elbows
and straight sections and four Permasense guided wave sensors attached to it. Thickness
measurements were obtained over a period of 4 months and consistent results were acquired using
the wireless guided wave sensors. To assess the real-time thinning of the carbon steel pipe sections,
an engineering scale test loop was designed and a potential simulant (sand water slurry) has been
proposed. A test plan was developed to vary the volumetric concentration of the simulant being
circulated though the test loop for a period of about 7 months while using the Permasense sensors
for detection and measurement of potential erosion/corrosion in the pipe sections.

FIU-ARC-2017-800006470-04b-255 Chemical Process Alternatives for Radioactive Waste
ARC Year-End Technical Progress Report 95
INTRODUCTION
The Hanford Site Tank Farm has implemented a Fitness-for-Service (FFS) program for the Waste
Transfer System. The FFS program, based on API-579-1/ASME FFS-1, examines structural
parameters of the waste transfer systems in order to develop erosion/corrosion rates for relevant
system components. The FFS information is acquired from opportunistic evaluations of pipelines
that have been removed from service. FIU-ARC engineers work closely with key Hanford high
level waste (HLW) personnel and the contractor, Washington River Protection Solutions, LLC
(WRPS), to support the FFS program, deliver solutions for sensor evaluations, conduct bench-
scale testing followed by data acquisition and analysis for corrosion and erosion assessment.
The objective is to assist DOE and WRPS in providing realistic estimates of the remaining useful
life of the components and to incorporate those estimates into future design plans. Previous efforts
at Hanford included the installation of sensors on a number of the POR 104 components, to provide
real time pipe wall thickness measurements. Due to various limitations, alternative approaches for
remote permanently mounted pipe wall ultrasonic thickness measurement systems are being
investigated.
FIU efforts to support this scope have included investigating key options available in the market
for remote permanently-mounted ultrasonic transducer (UT) systems for HLW pipe wall thickness
measurements. Specific applications include straight sections, elbows and other fittings used in
jumper pits, evaporators, and valve boxes. FIU assessed the use of various ultrasonic systems that
are either commercially available or used previously at Hanford and selected the most promising
systems for further evaluation. One of the two down selected systems (Permasense UT sensor
system) was acquired and initial bench-scale validation testing was conducted.
Currently, FIU is in the process of implementing the real-time thickness measurement in an
engineering scale test set-up. A design loop has been established using 2- and 3-inch diameter
straight and bend pipe sections to mount the sensors. The loop will be eroded using a sand-water
slurry and the Permasense sensors will be used for thickness measurements.
The proposed research will provide information that will assist engineers with understanding the
failure potential of HLW transfer components due to corrosion and erosion. This information can
assist in determining if and when lines need to be removed, saving time and resources on unneeded
excavation of transfer lines. This information can also assist engineers with designing new transfer
systems by establishing more detailed/accurate guidelines governing the life expectancy of the
transfer system and its components.
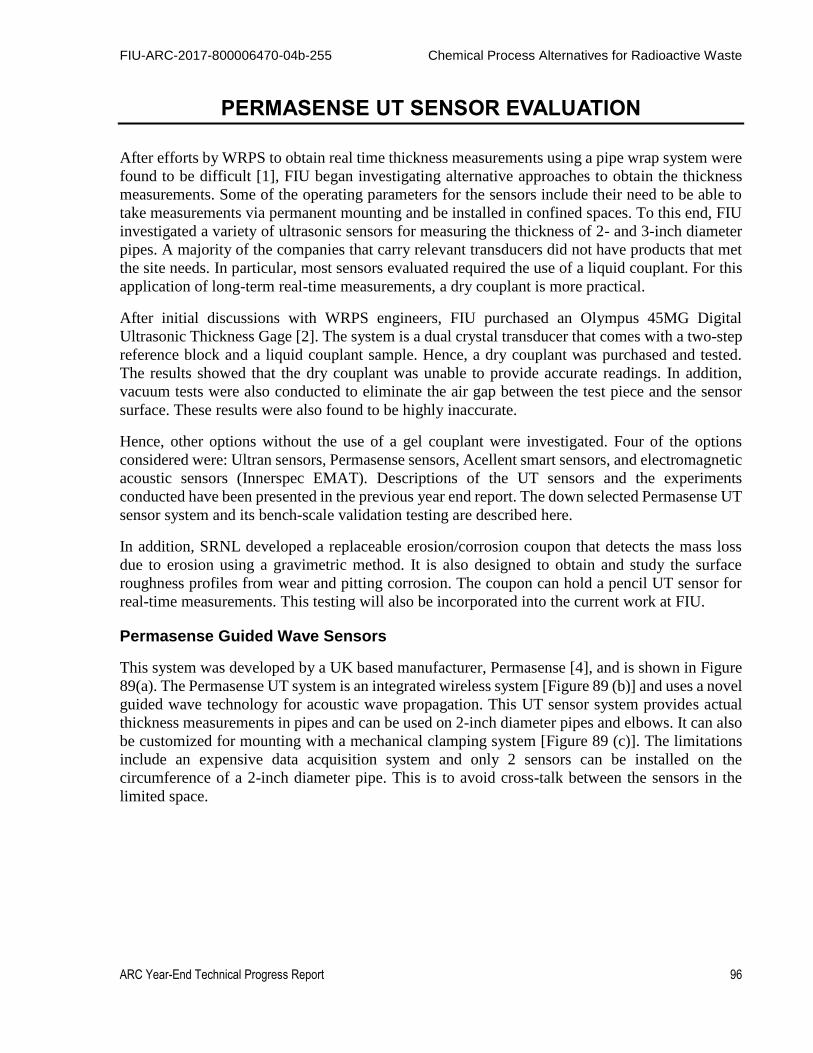
FIU-ARC-2017-800006470-04b-255 Chemical Process Alternatives for Radioactive Waste
ARC Year-End Technical Progress Report 96
PERMASENSE UT SENSOR EVALUATION
After efforts by WRPS to obtain real time thickness measurements using a pipe wrap system were
found to be difficult [1], FIU began investigating alternative approaches to obtain the thickness
measurements. Some of the operating parameters for the sensors include their need to be able to
take measurements via permanent mounting and be installed in confined spaces. To this end, FIU
investigated a variety of ultrasonic sensors for measuring the thickness of 2- and 3-inch diameter
pipes. A majority of the companies that carry relevant transducers did not have products that met
the site needs. In particular, most sensors evaluated required the use of a liquid couplant. For this
application of long-term real-time measurements, a dry couplant is more practical.
After initial discussions with WRPS engineers, FIU purchased an Olympus 45MG Digital
Ultrasonic Thickness Gage [2]. The system is a dual crystal transducer that comes with a two-step
reference block and a liquid couplant sample. Hence, a dry couplant was purchased and tested.
The results showed that the dry couplant was unable to provide accurate readings. In addition,
vacuum tests were also conducted to eliminate the air gap between the test piece and the sensor
surface. These results were also found to be highly inaccurate.
Hence, other options without the use of a gel couplant were investigated. Four of the options
considered were: Ultran sensors, Permasense sensors, Acellent smart sensors, and electromagnetic
acoustic sensors (Innerspec EMAT). Descriptions of the UT sensors and the experiments
conducted have been presented in the previous year end report. The down selected Permasense UT
sensor system and its bench-scale validation testing are described here.
In addition, SRNL developed a replaceable erosion/corrosion coupon that detects the mass loss
due to erosion using a gravimetric method. It is also designed to obtain and study the surface
roughness profiles from wear and pitting corrosion. The coupon can hold a pencil UT sensor for
real-time measurements. This testing will also be incorporated into the current work at FIU.
Permasense Guided Wave Sensors
This system was developed by a UK based manufacturer, Permasense [4], and is shown in Figure
89(a). The Permasense UT system is an integrated wireless system [Figure 89 (b)] and uses a novel
guided wave technology for acoustic wave propagation. This UT sensor system provides actual
thickness measurements in pipes and can be used on 2-inch diameter pipes and elbows. It can also
be customized for mounting with a mechanical clamping system [Figure 89 (c)]. The limitations
include an expensive data acquisition system and only 2 sensors can be installed on the
circumference of a 2-inch diameter pipe. This is to avoid cross-talk between the sensors in the
limited space.
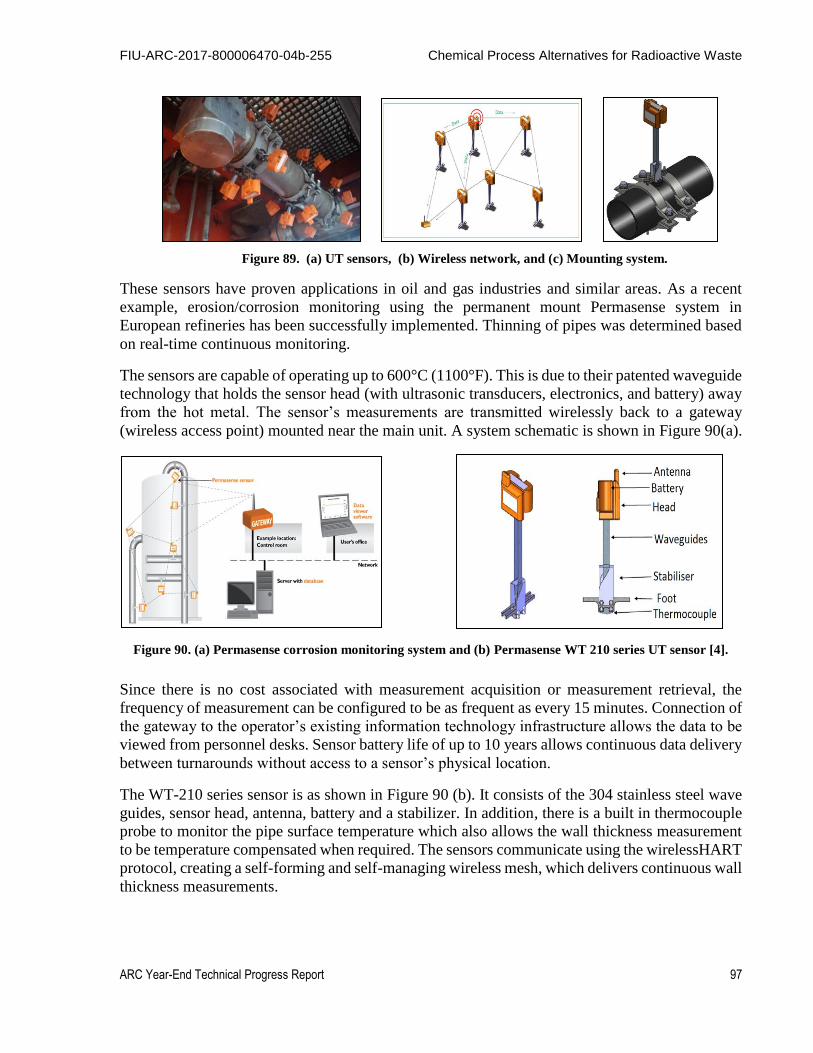
FIU-ARC-2017-800006470-04b-255 Chemical Process Alternatives for Radioactive Waste
ARC Year-End Technical Progress Report 97
Figure 89. (a) UT sensors, (b) Wireless network, and (c) Mounting system.
These sensors have proven applications in oil and gas industries and similar areas. As a recent
example, erosion/corrosion monitoring using the permanent mount Permasense system in
European refineries has been successfully implemented. Thinning of pipes was determined based
on real-time continuous monitoring.
The sensors are capable of operating up to 600°C (1100°F). This is due to their patented waveguide
technology that holds the sensor head (with ultrasonic transducers, electronics, and battery) away
from the hot metal. The sensor’s measurements are transmitted wirelessly back to a gateway
(wireless access point) mounted near the main unit. A system schematic is shown in Figure 90(a).
Figure 90. (a) Permasense corrosion monitoring system and (b) Permasense WT 210 series UT sensor [4].
Since there is no cost associated with measurement acquisition or measurement retrieval, the
frequency of measurement can be configured to be as frequent as every 15 minutes. Connection of
the gateway to the operator’s existing information technology infrastructure allows the data to be
viewed from personnel desks. Sensor battery life of up to 10 years allows continuous data delivery
between turnarounds without access to a sensor’s physical location.
The WT-210 series sensor is as shown in Figure 90 (b). It consists of the 304 stainless steel wave
guides, sensor head, antenna, battery and a stabilizer. In addition, there is a built in thermocouple
probe to monitor the pipe surface temperature which also allows the wall thickness measurement
to be temperature compensated when required. The sensors communicate using the wirelessHART
protocol, creating a self-forming and self-managing wireless mesh, which delivers continuous wall
thickness measurements.
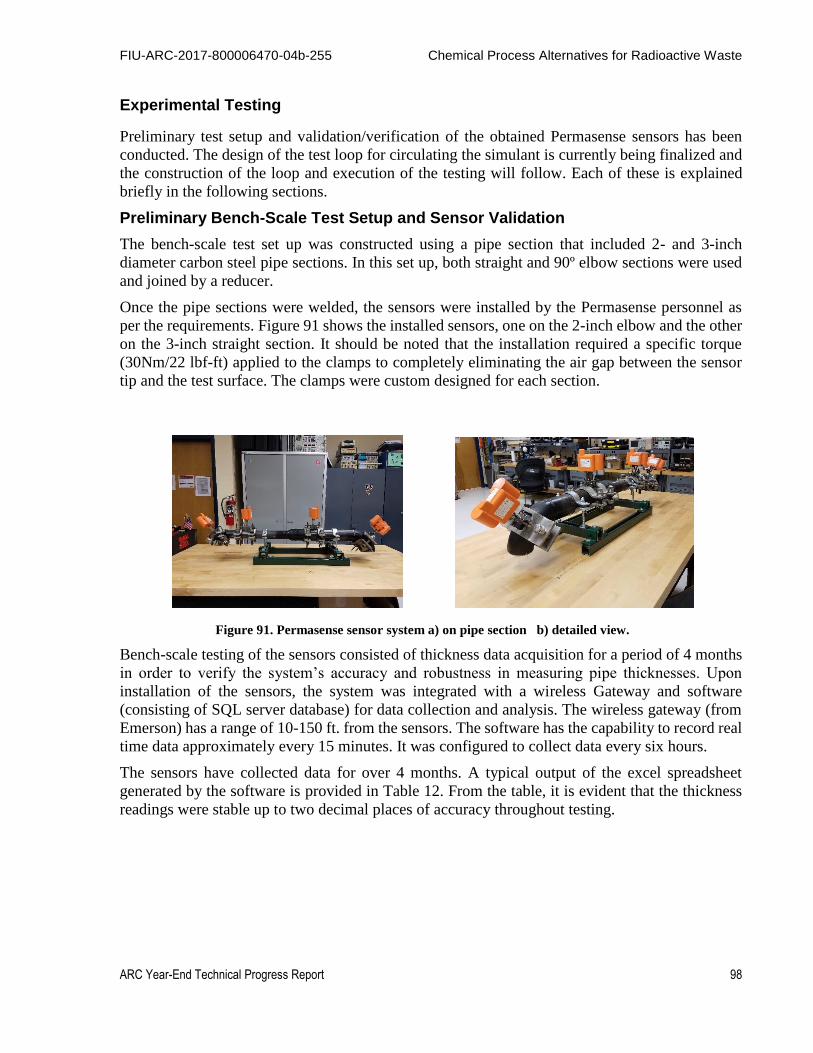
FIU-ARC-2017-800006470-04b-255 Chemical Process Alternatives for Radioactive Waste
ARC Year-End Technical Progress Report 98
Experimental Testing
Preliminary test setup and validation/verification of the obtained Permasense sensors has been
conducted. The design of the test loop for circulating the simulant is currently being finalized and
the construction of the loop and execution of the testing will follow. Each of these is explained
briefly in the following sections.
Preliminary Bench-Scale Test Setup and Sensor Validation
The bench-scale test set up was constructed using a pipe section that included 2- and 3-inch
diameter carbon steel pipe sections. In this set up, both straight and 90º elbow sections were used
and joined by a reducer.
Once the pipe sections were welded, the sensors were installed by the Permasense personnel as
per the requirements. Figure 91 shows the installed sensors, one on the 2-inch elbow and the other
on the 3-inch straight section. It should be noted that the installation required a specific torque
(30Nm/22 lbf-ft) applied to the clamps to completely eliminating the air gap between the sensor
tip and the test surface. The clamps were custom designed for each section.
Figure 91. Permasense sensor system a) on pipe section b) detailed view.
Bench-scale testing of the sensors consisted of thickness data acquisition for a period of 4 months
in order to verify the system’s accuracy and robustness in measuring pipe thicknesses. Upon
installation of the sensors, the system was integrated with a wireless Gateway and software
(consisting of SQL server database) for data collection and analysis. The wireless gateway (from
Emerson) has a range of 10-150 ft. from the sensors. The software has the capability to record real
time data approximately every 15 minutes. It was configured to collect data every six hours.
The sensors have collected data for over 4 months. A typical output of the excel spreadsheet
generated by the software is provided in Table 12. From the table, it is evident that the thickness
readings were stable up to two decimal places of accuracy throughout testing.

FIU-ARC-2017-800006470-04b-255 Chemical Process Alternatives for Radioactive Waste
ARC Year-End Technical Progress Report 99
Table 12. Sample UT Sensor Measurements for 3-in Straight Section
In addition, sample 2-inch elbow measurements from October 2016 to January 2017 are provided
in the plot shown in Figure 92. The maximum thickness was measured to be 4.346 mm and the
minimum value was 4.336 mm. The average for the sample data was 4.340 mm and the standard
deviation of the data was 0.0015.
Figure 92. Sample thickness measurements for 2 in elbow section from Oct 2016 to Jan 2017.
Results during the testing period showed that there was no significant change in the average
readings, demonstrating the stability of the system. In addition, the thickness readings matched the
manufacturer’s specified thickness.
Experimental Test Loop
For the next phase of this effort, measurements of wear rates on the pipes will be obtained in real
time. One of the methods for obtaining the data is to circulate a caustic/abrasive fluid such as NaCl,
ID Name Sent Time UT measurement (mm) Temperature (°C) Temp. compensation Flag
#00001 3 inch straight 10/25/2016 18:09 5.487 19.93 1
#00001 3 inch straight 10/25/2016 18:13 5.483 19.87 1
#00001 3 inch straight 10/26/2016 9:54 5.489 18.9 1
#00001 3 inch straight 10/26/2016 9:57 5.483 19.49 1
#00001 3 inch straight 10/26/2016 11:04 5.484 19.84 1
#00001 3 inch straight 10/26/2016 11:17 5.483 19.93 1
#00001 3 inch straight 10/26/2016 17:20 5.487 19.55 1
#00001 3 inch straight 10/26/2016 23:24 5.488 19.22 1
#00001 3 inch straight 10/27/2016 5:27 5.49 19.61 1
#00001 3 inch straight 10/27/2016 11:31 5.489 19.17 1
#00001 3 inch straight 10/27/2016 17:34 5.489 19.61 1
#00001 3 inch straight 10/27/2016 23:37 5.488 19.25 1
#00001 3 inch straight 10/28/2016 5:41 5.488 18.87 1
#00001 3 inch straight 10/28/2016 11:44 5.489 18.9 1
#00001 3 inch straight 10/28/2016 17:47 5.488 19.61 1
#00001 3 inch straight 10/28/2016 23:50 5.489 19.55 1
#00001 3 inch straight 10/29/2016 5:54 5.489 19.93 1
#00001 3 inch straight 10/29/2016 11:58 5.485 19.93 1
#00001 3 inch straight 10/29/2016 18:00 5.487 19.55 1
#00001 3 inch straight 10/30/2016 0:03 5.488 19.61 1
#00001 3 inch straight 10/30/2016 6:06 5.488 18.63 1
#00001 3 inch straight 10/30/2016 12:09 5.489 19.61 1
4.334
4.336
4.338
4.34
4.342
4.344
4.346
4.348
10/17/2016 11/6/2016 11/26/2016 12/16/2016 1/5/2017 1/25/2017
2 in
elb
ow
th
ickn
ess
(m
m)
Date

FIU-ARC-2017-800006470-04b-255 Chemical Process Alternatives for Radioactive Waste
ARC Year-End Technical Progress Report 100
Na2SO4, NaOH, HCl or a sand/water solution through a closed loop pipe section to record the
thinning of the pipe using the UT sensors. Of the solutions considered, the sand/water solution was
selected since it is environmentally friendly and significant erosion can be obtained in a relatively
short period of time. Caustic solutions generate fumes at high temperatures and require rigorous
safety handling and disposal procedures. An initial design of the test loop is shown in Figure 93.
This design incorporates 2- and 3-inch diameter schedule 40 carbon steel straight pipe sections
along with long radius elbows and a reducer. The loop is approximately 6 ½ ft x 7 ft in dimension
and will consist of a pump and a reservoir to circulate the simulant. The reservoir will be a 70
gallon vertical polyethylene tank with a stirrer/mixer. The design includes a bypass with steel ball
valves to control the flow of the simulant as the pump does not have a variable frequency drive
(VFD). The loop will consist of several sections attached with flanges and connectors for ease of
installation and removal/replacement, as needed. In addition, instrumentation such as flow meters
and temperature sensors will be installed in the test loop. The flow meters will act as flow
measuring stations to record the flow that will be varied as per the test matrix to simulate various
flow conditions. Temperature sensors may also be needed when the simulant temperatures are
varied.
Figure 93. Pipe loop design for aging.
A total of four Permasense sensors will be placed on the 2- and 3-inch diameter straight and bend
pipe sections (elbows) of the loop as shown in the figure. For the initial testing, as described in the
previous section, the sensors were installed by the manufacturer. Currently, FIU is looking into
procedures of removing and replacing the sensors on the new simulant loop design with the
assistance of the Permasense manufacturer.
An important feature in the test loop will be a slurry pump that can handle abrasive simulants and
generate flow velocities up to 2.5 m/s and flow rates up to 110 gpm. The maximum values are
based on typical flow requirements needed for erosion found in the literature [8]. A number of
pumps were evaluated for this purpose and the candidate selected is a 3 HP self-priming centrifugal
pump with 230 V, 12.5 amps, 1 phase, 2-inch inlet/outlet and a maximum head of 60 ft (Figure
94). The slurry pump, manufactured/distributed by Dayton [7], includes a stainless steel impeller

FIU-ARC-2017-800006470-04b-255 Chemical Process Alternatives for Radioactive Waste
ARC Year-End Technical Progress Report 101
which makes it suitable for corrosive media. It can also handle solids up to 1 inch in diameter and
can pump liquids with temperatures up to 160°F.
Figure 94. Pump for sand water media [5].
SRNL Coupon Testing
With support from SRNL, FIU testing will also include their coupon system developed for erosion
corrosion. The fabricated erosion coupon is made of stainless steel and is designed in a way such
that it can: (a) be used in a weight loss method, (b) house a pencil UT sensor, and c) be removed
and tested for surface roughness. The installation of the coupon and a UT sensor probe on an elbow
is shown in Figure 95.
Figure 95. a) Coupon, b) Coupon installed on an elbow.
The erosion/corrosion coupon developed by SRNL has significant beneficial features. It provides
the ability to measure extremely low values of mass loss (~0.00001 g), thickness changes (0.0001
inch) and surface roughness profiles, while minimizing the disruption of the flow field in the
process system.
The replaceable coupon is designed to minimize scratching or other deleterious effects that may
occur during installation and removal. An index mark is provided so it can be reinserted, if desired,
in the same orientation. The coupon holder is designed with a polymeric sleeve to isolate the
coupon from vibration, which could cause material loss by fretting. In addition, the holder provides
electrical isolation from the piping system, thereby eliminating galvanic effects between the pipe
and the coupon. The coupon is designed to optimize accurate placement (location and angle) of
the high resolution UT system, eliminating human error and thus providing repeatable, precise

FIU-ARC-2017-800006470-04b-255 Chemical Process Alternatives for Radioactive Waste
ARC Year-End Technical Progress Report 102
real-time (in situ) thickness measurements. The coupon and holder can be scaled to fit multiple
pipe sizes or installed in other system configurations (e.g., vessels or under nozzles) and is
designed to meet ASME pressure vessel requirements.
Testing
As discussed previously, there are several simulant options for circulation in the test loop to
determine real-time wear rate. Out of the options, the first stage of testing will use a sand and water
solution due to its ease of procurement, testing and disposal. Based on the results obtained during
the first phase of testing, other options (chemicals such as NaOH) might be considered in future
tests. The schedule for sand-water testing is given in Table 13. The sand media used will be up to
10% of solids by volume and the size of the sand particles will be typically 200, 600 and 900
microns. The volume concentration and size of the particles for testing have been selected based
on similar literature values [8, 9].
Table 13. Sand and Water Testing
Simulant Circulation Period
(estimated)
Water (loop validation) 1 week
Sand and water slurry (5%) 3 months
Sand and water slurry (8%) 2 months
Sand and water slurry (10%) 2 months
The test loop will be constructed as indicated in the design (Figure 93) and the testing will be
conducted based on the schedule above to measure real-time thinning of the carbon steel pipe
sections. The measurements will be obtained every 6 hrs. and the data will be analyzed to
determine if modifications to the system need to be made.
With support from SRNL, the FIU testing phase will also include their coupon system as described
in the previous section. The use of the replaceable erosion coupon could facilitate shorter duration
wear tests. Depending on the active degradation mechanism, the replaceable coupon may provide
validation of thickness change by using three independent measurement techniques: high
resolution UT, conventional micrometer and weight loss.

FIU-ARC-2017-800006470-04b-255 Chemical Process Alternatives for Radioactive Waste
ARC Year-End Technical Progress Report 103
CONCLUSIONS
Each of the UT sensor systems mentioned in the previous section have certain advantages and
limitations. Based on discussions with the site engineers, two of the options have been down
selected for further investigation. These include the Permasense guided wave technology and the
Ultran couplant free sensors. Selections were based on applicability to various pipe sizes, ability
to determine thicknesses accurately, and cost. One of the major challenges associated with a
custom built remote permanently mounted UT system for pipe wall thickness measurements is the
pricing of the systems.
FIU has acquired the Permasense sensors and validated the sensors for accurate static
measurements of the 2- and 3-inch diameter pipe sections. This has been accomplished by the
installation of the Permasense sensors on a custom built pipe layout to replicate typical waste
transfer system pipe fittings. Initial bench-scale validation results have led to the next stage in
engineering scale testing of the sensors under real-time thinning using a sand-water slurry.
Currently, FIU is designing a full-scale test set up to monitor and measure the erosion-corrosion
in pipe sections using the Permasense guided wave sensors. The UT sensors and their wall loss
measurement ability will be tested and validated under various environmental conditions such as
humidity and temperature. For practical implementation, an environmental chamber will be built
enclosing a section of the test loop.
In addition, FIU will also be incorporating a novel application developed by SRNL for corrosion
detection. SRNL developed a replaceable erosion/corrosion coupon to measure the mass change
(loss or gain) and to obtain and study the surface roughness profiles obtained from wear and pitting
corrosion while conducting real-time UT sensor measurements.

FIU-ARC-2017-800006470-04b-255 Chemical Process Alternatives for Radioactive Waste
ARC Year-End Technical Progress Report 104
REFERENCES
1. B. J. Vasquez, RPP – RPT – 55812, Engineering Evaluation of Remote Permanently
Mounted Pipe Wall Ultrasonic Thickness Measurement Devices, Rev 0, Washington River
Protection Solutions, Richland, WA.
2. www.olympus-ims.com
3. Aravelli, A., McDaniel, D. and Davila C., “Assessment of Guided Wave Ultrasonic
Transducer Systems for Wall Thickness Measurements”, Summary Document submitted to
DOE –EM under Cooperative Agreement # DE-EM0000598 (FIU-ARC-2016-800006470-
04c-242).
4. www.permasense.com
5. Philip T. and Jake D., “Monitoring and simulation resolves overhead corrosion – online
corrosion monitoring in tandem with simulation modelling identified the root cause of
corrosion in a crude unit overhead”, www.eptq.com – PTQ Q1 2016.
6. https://www.grainger.com/product/LITTLE-GIANT-1-8-HP-PPS-115-230V-Magnetic-
2P043.
7. https://www.grainger.com/ec/pdf/4YU37_1.pdf.
8. Wood R. J. K and Jones T. F., “Investigations of sand–water induced erosive wear of AISI
304 stainless steel pipes by pilot-scale and laboratory-scale testing”, Wear, Vol. 255, Issue
1-6, Aug-Sep 2003, Pg. 206-218,
http://www.sciencedirect.com/science/article/pii/S0043164803000954.
9. Naz., M. Y., Ismail, N. I., Sulaiman, S. A., Shukrullah, S., “Characterization of erosion of
gas pipelines by dry sand”, Instrumentation Science and Technology, 2017, VOL. 45, NO.
1, 62–72. http://dx.doi.org/10.1080/10739149.2016.1194295
10. Morris, K., “Investigation of Various Water Sources on the Corrosion of Carbon Steel
andAluminum”, 2017, Honors Research Project, Dept. of Chemical Engineering,
University of Akron, OH, USA.
11. http://hghouston.com/resources/technical-newsletters/corrosion-in-caustic-solutions
12. Lu, B., “ Erosion-Corrosion in Oil and Gas Production”, Research and Reviews in
Materials Science and Chemistry, Vol. 2, Issue 1, 2013, Pages 19-60, ISSN 2319-6920.
FIU-ARC-2017-800006470-04b-255 Chemical Process Alternatives for Radioactive Waste
ARC Year-End Technical Progress Report 105
TASK 19.2 EVALUATION OF NONMETALLIC COMPONENTS IN THE
WASTE TRANSFER SYSTEM (FIU YEAR 7)
EXECUTIVE SUMMARY
Nonmetallic materials are used in the United States Department of Energy’s Hanford Site Tank
Farm waste transfer system. These materials include the inner primary hoses in the hose-in-hose
transfer lines (HIHTLs), Garlock® gaskets, ethylene propylene diene monomer (EPDM) O-rings,
and other nonmetallic materials. These nonmetallic materials are exposed to β and γ irradiation,
caustic solutions as well as high temperatures and pressure stressors. How the nonmetallic
components react to each of these stressors individually has been well established. However,
simultaneous exposure of these stressors has not been evaluated and is of great concern to Hanford
Site engineers.
FIU engineers worked closely with key Hanford HLW personnel to develop an experimental test
plan to determine how these nonmetallic components react to various simultaneous stressor
exposures. The materials selected for testing included of EPDM and Garlock® coupons, EPDM
HIHTL inner hoses and EPDM O-rings as well as Garlock® gaskets. An experimental test loop
was constructed and the components were aged for durations of 180 and 365 days. The system can
accommodate eighteen component assemblies. Each assembly consisted of one EPDM HIHTL,
one EPDM O-ring and one Garlock® gasket. There were three assembly aging sets, one for each
temperature. Each set has six assemblies in it; three for each of the two time periods.
Prior to aging of the components, a sample set was mechanical tested to obtain various baseline
properties as per ASTM standards. The aging of the materials involved exposing each sample to a
25% NaOH solution at ambient (38oC), operating (54oC) and design temperatures (79oC) for
durations of 180 and 365 days. After aging/conditioning, the mechanical and material properties
of the aged samples were measured and compared with the baseline results to obtain an
understanding of degradation caused by the stressors. This report provides results from mechanical
property testing of EPDM and Garlock® material coupons as well as the blowout/leak testing for
HIHTL, EPDM O-rings and Garlock® gaskets after a 180-day aging period only since the material
testing for the 365-day aged samples had not been conducted at the time of reporting. Results
showed the difference in the HIHTL blowout pressures to be within the error margins while a more
significant difference was observed with the material tensile testing. An 88% and 57% reduction
in the average tensile strength was observed with the Garlock® and the EPDM materials,
respectively, when compared to their baseline tensile strength. In addition, analysis using a
scanning electron microscope with energy dispersive X-ray spectroscopy (SEM-EDS) was
conducted on the EPDM inner hose samples to determine how far the NaOH penetrated into the
ethylene propylene diene monomer (EPDM). Preliminary results show that the sodium hydroxide
is penetrating into the inner hose at the higher temperatures.

FIU-ARC-2017-800006470-04b-255 Chemical Process Alternatives for Radioactive Waste
ARC Year-End Technical Progress Report 106
INTRODUCTION
Nonmetallic materials are utilized in the waste transfer system at the Hanford tank farms; these
include the inner hose of the hose-in-hose transfer lines (HIHTLs), Garlock® gaskets and ethylene
propylene diene monomer (EPDM) O-rings. These materials are exposed to simultaneous stressors
including β and γ radiation, elevated temperatures, caustic supernatant as well as high pressures
during normal use. In 2011, the Defense Nuclear Facilities Safety Board recommended to the U.S.
Department of Energy (DOE) to conduct post service examination of HIHTLs and Teflon gaskets
to improve the existing technical basis for component service life. Suppliers of the nonmetallic
components often provide information regarding the effects of some of the stressors, but
information is not provided for simultaneous exposure. An extensive test plan was developed by
Sandia National Laboratories to understand the simultaneous effects of the aforementioned
stressors [1]; however, this test plan was never executed. Additional studies conducted by
Lieberman provides information on HIHTLs at elevated temperature and pressure but little
information is gained regarding the synergistic effects with the caustic supernatant [2]. FIU has
been tasked with supporting this effort by conducting multi stressor testing on typical nonmetallic
materials used at the Hanford tank farms.
This report provides the mechanical property testing of EPDM and Garlock® material coupons as
well as the blowout/leak test results for HIHTL, EPDM O-rings and Garlock® gaskets after a 6-
month aging period. In addition, the experimental test loop used to age the test specimens is
described.
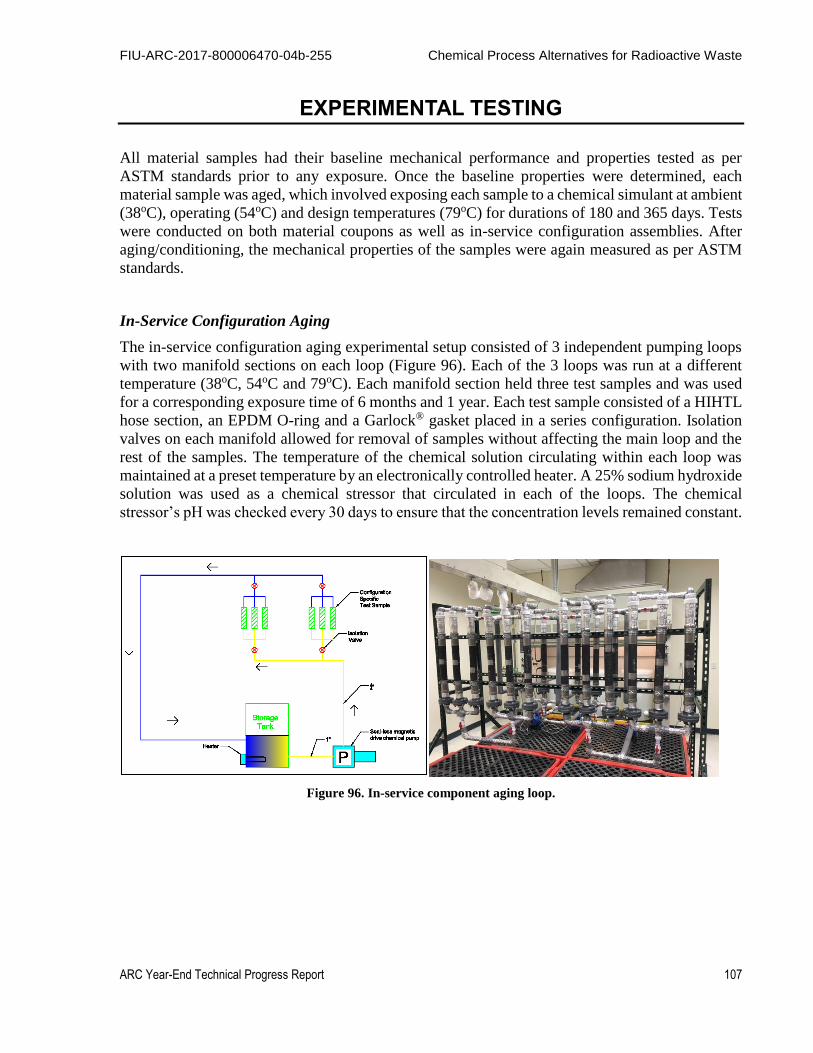
FIU-ARC-2017-800006470-04b-255 Chemical Process Alternatives for Radioactive Waste
ARC Year-End Technical Progress Report 107
EXPERIMENTAL TESTING
All material samples had their baseline mechanical performance and properties tested as per
ASTM standards prior to any exposure. Once the baseline properties were determined, each
material sample was aged, which involved exposing each sample to a chemical simulant at ambient
(38oC), operating (54oC) and design temperatures (79oC) for durations of 180 and 365 days. Tests
were conducted on both material coupons as well as in-service configuration assemblies. After
aging/conditioning, the mechanical properties of the samples were again measured as per ASTM
standards.
In-Service Configuration Aging
The in-service configuration aging experimental setup consisted of 3 independent pumping loops
with two manifold sections on each loop (Figure 96). Each of the 3 loops was run at a different
temperature (38oC, 54oC and 79oC). Each manifold section held three test samples and was used
for a corresponding exposure time of 6 months and 1 year. Each test sample consisted of a HIHTL
hose section, an EPDM O-ring and a Garlock® gasket placed in a series configuration. Isolation
valves on each manifold allowed for removal of samples without affecting the main loop and the
rest of the samples. The temperature of the chemical solution circulating within each loop was
maintained at a preset temperature by an electronically controlled heater. A 25% sodium hydroxide
solution was used as a chemical stressor that circulated in each of the loops. The chemical
stressor’s pH was checked every 30 days to ensure that the concentration levels remained constant.
Figure 96. In-service component aging loop.
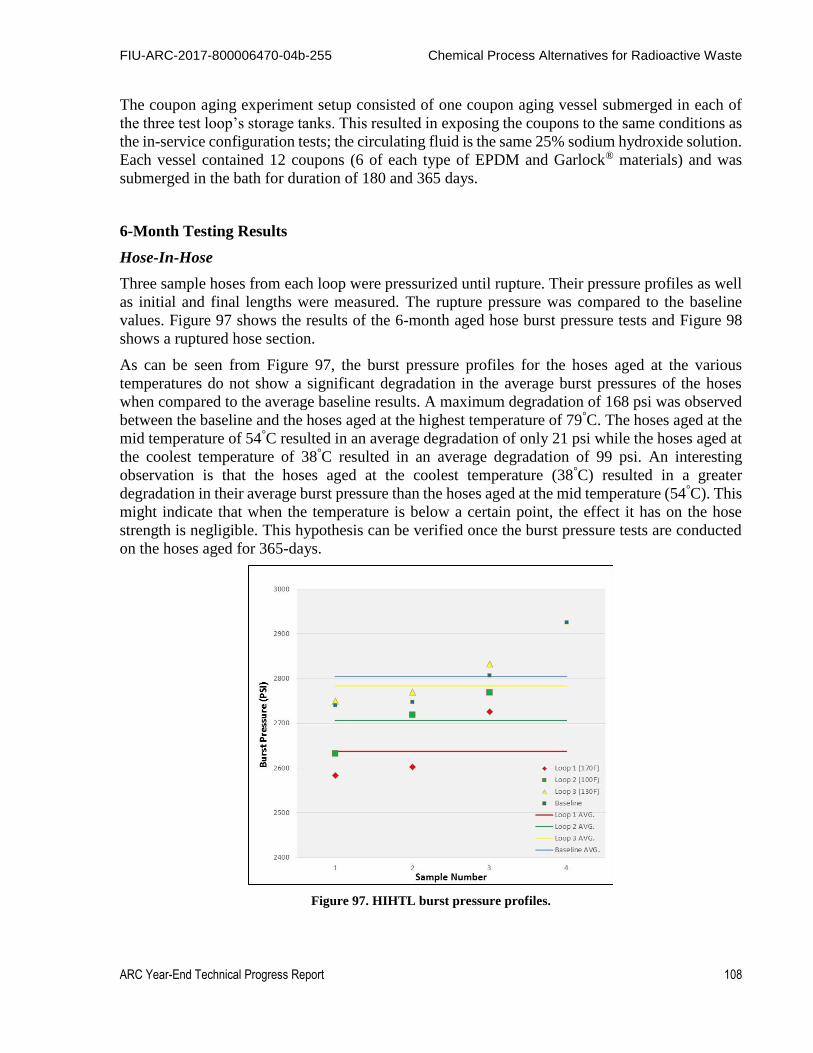
FIU-ARC-2017-800006470-04b-255 Chemical Process Alternatives for Radioactive Waste
ARC Year-End Technical Progress Report 108
The coupon aging experiment setup consisted of one coupon aging vessel submerged in each of
the three test loop’s storage tanks. This resulted in exposing the coupons to the same conditions as
the in-service configuration tests; the circulating fluid is the same 25% sodium hydroxide solution.
Each vessel contained 12 coupons (6 of each type of EPDM and Garlock® materials) and was
submerged in the bath for duration of 180 and 365 days.
6-Month Testing Results
Hose-In-Hose
Three sample hoses from each loop were pressurized until rupture. Their pressure profiles as well
as initial and final lengths were measured. The rupture pressure was compared to the baseline
values. Figure 97 shows the results of the 6-month aged hose burst pressure tests and Figure 98
shows a ruptured hose section.
As can be seen from Figure 97, the burst pressure profiles for the hoses aged at the various
temperatures do not show a significant degradation in the average burst pressures of the hoses
when compared to the average baseline results. A maximum degradation of 168 psi was observed
between the baseline and the hoses aged at the highest temperature of 79°C. The hoses aged at the
mid temperature of 54°C resulted in an average degradation of only 21 psi while the hoses aged at
the coolest temperature of 38°C resulted in an average degradation of 99 psi. An interesting
observation is that the hoses aged at the coolest temperature (38°C) resulted in a greater
degradation in their average burst pressure than the hoses aged at the mid temperature (54°C). This
might indicate that when the temperature is below a certain point, the effect it has on the hose
strength is negligible. This hypothesis can be verified once the burst pressure tests are conducted
on the hoses aged for 365-days.
Figure 97. HIHTL burst pressure profiles.

FIU-ARC-2017-800006470-04b-255 Chemical Process Alternatives for Radioactive Waste
ARC Year-End Technical Progress Report 109
Figure 98. Ruptured hose section.
EPDM O-Ring Testing
The aged O-ring pressure testing was conducted for nine EPDM O-ring specimens (three from
each loop). Table 14 shows the results of the testing and Figure 99 shows the O-ring test apparatus.
An average pressure of 1650 KPa was maintained for five minutes without any leaks.
Table 14 . 6-month O-Ring Pressure Test Results
Sample
Number O-01-4 O-01-5 O-01-6 O-02-4 O-02-5 O-02-6 O-03-1 O-03-2 O-03-3 Average
Water
Temperature
(°C) 23.00 23.00 22.00 22.00 22.00 22.00 22.00 22.00 22.00 22.22
Ambient
Temperature
(°C) 26.00 26.00 24.00 24.00 24.00 24.00 26.00 26.00 26.00 25.11
Humidity (%) 65.00 66.00 85.00 85.00 85.00 85.00 76.00 76.00 76.00 77.67
Holding
Pressure (Pa)
1.63E+
06
1.61E+0
6
1.61E+0
6
1.65E+0
6
1.61E+0
6
1.63E+0
6
1.68E+0
6
1.72E+0
6
1.75E+0
6
1.65E+0
6
Pressure
Maintained? Yes Yes Yes Yes Yes Yes Yes Yes Yes N/A
Time Until
Failure (s) N/A N/A N/A N/A N/A N/A N/A N/A N/A N/A

FIU-ARC-2017-800006470-04b-255 Chemical Process Alternatives for Radioactive Waste
ARC Year-End Technical Progress Report 110
Figure 99. O-ring test apparatus.
6-Month Garlock® Gasket Testing
The aged Garlock® gaskets pressure testing was conducted for nine Garlock® gasket specimens
(three from each loop). Table 15 shows the results of the testing and Figure 100 shows the test
apparatus. Of the nine specimens, only four gaskets were able to maintain pressure. Of the four
that maintained pressure, an average pressure of 487 KPa was maintained for five minutes without
any leaks. The leaks are believed to be due to the gaskets being compressed when they were
installed in the aging loop. Since the Garlock® material maintains a memory after it has been
compressed, when it is reinstalled into the pressure test rig, it does not always create a good seal.
Table 15. 6-Month Garlock® Gasket Testing Results
Sample
Number G-01-4 G-01-5 G-01-6 G-02-4 G-02-5 G-02-6 G-03-1 G-03-2 G-03-3 Average
Water
Temperature
(°C) 22.44 22.44 22.44 22.44 22.44 22.44 22.44 22.44 22.44 22.44
Ambient
Temperature
(°C) 26.67 26.67 26.11 26.11 26.11 26.11 26.11 26.11 26.11 26.23
Humidity (%) 50.00 50.00 54.00 54.00 54.00 54.00 54.00 48.00 53.00 52.33
Holding
Pressure (Pa)
1.09E+
06
1.12E+0
6
1.12E+0
6
0.00E+0
0
1.05E+0
6
0.00E+0
0
0.00E+0
0
0.00E+0
0
0.00E+0
0
4.87E+0
5
Pressure
Maintained? Yes Yes Yes No Yes No No No No N/A
Time Until
Failure (s) N/A N/A N/A 0.00 N/A 0.00 0.00 0.00 0.00 N/A

FIU-ARC-2017-800006470-04b-255 Chemical Process Alternatives for Radioactive Waste
ARC Year-End Technical Progress Report 111
Figure 100. Gasket test apparatus.
6-Month Coupon Testing
Three of the EPDM and Garlock® samples were aged in each of the three loop tanks maintained at
38°C, 54°C and 79°C, respectively. All procedures used for testing were derived from the ASTM
D412-16 standard [3]. Figure 102 and Figure 103 show results from the tensile strength tests for
the EPDM and Garlock® coupons, respectively, while Figure 104 shows a comparison of the
results to the baseline data.
Figure 101. Tensile strength testing of EPDM and Garlock® coupons.
Figure 102. EPDM coupon tensile strength.
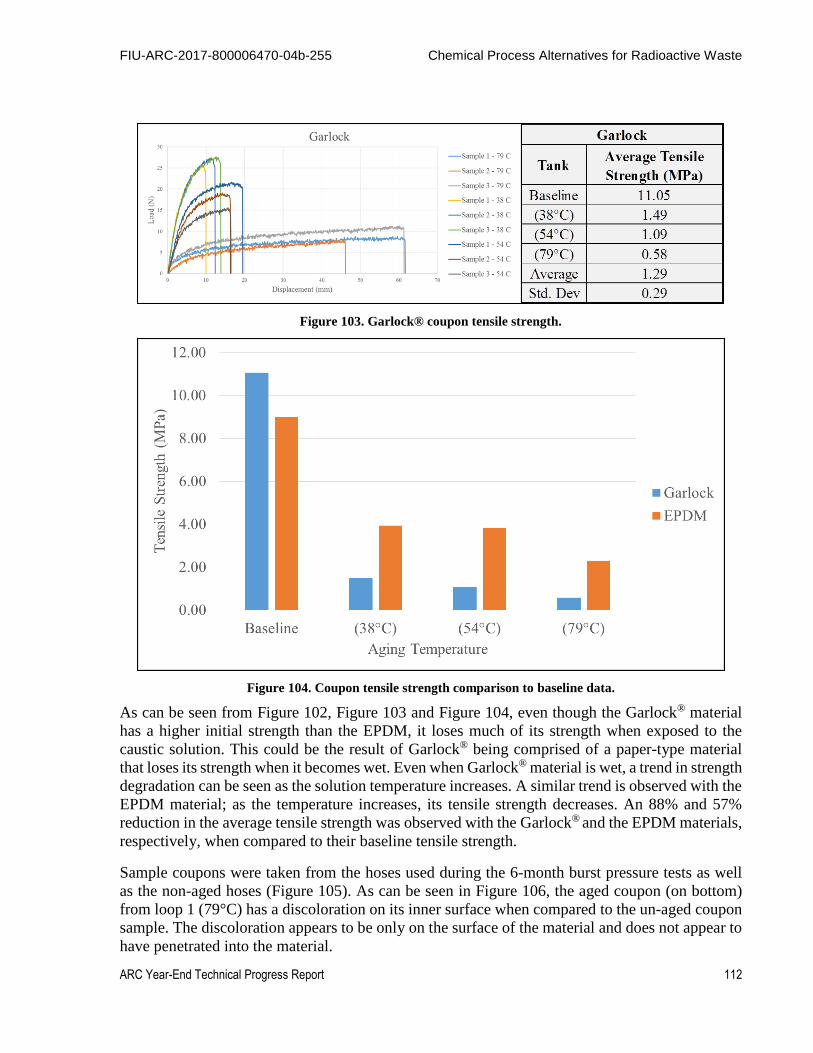
FIU-ARC-2017-800006470-04b-255 Chemical Process Alternatives for Radioactive Waste
ARC Year-End Technical Progress Report 112
Figure 103. Garlock® coupon tensile strength.
Figure 104. Coupon tensile strength comparison to baseline data.
As can be seen from Figure 102, Figure 103 and Figure 104, even though the Garlock® material
has a higher initial strength than the EPDM, it loses much of its strength when exposed to the
caustic solution. This could be the result of Garlock® being comprised of a paper-type material
that loses its strength when it becomes wet. Even when Garlock® material is wet, a trend in strength
degradation can be seen as the solution temperature increases. A similar trend is observed with the
EPDM material; as the temperature increases, its tensile strength decreases. An 88% and 57%
reduction in the average tensile strength was observed with the Garlock® and the EPDM materials,
respectively, when compared to their baseline tensile strength.
Sample coupons were taken from the hoses used during the 6-month burst pressure tests as well
as the non-aged hoses (Figure 105). As can be seen in Figure 106, the aged coupon (on bottom)
from loop 1 (79°C) has a discoloration on its inner surface when compared to the un-aged coupon
sample. The discoloration appears to be only on the surface of the material and does not appear to
have penetrated into the material.

FIU-ARC-2017-800006470-04b-255 Chemical Process Alternatives for Radioactive Waste
ARC Year-End Technical Progress Report 113
Figure 105. Hose sample coupons.
Figure 106. Aged (bottom) vs. un-aged (top) coupons.
Analysis using a scanning electron microscope with energy dispersive X-ray spectroscopy (SEM-
EDS) was conducted on the EPDM inner hose samples. The intention was to determine how far
the NaOH penetrated into the ethylene propylene diene monomer (EPDM). Figure 107 shows the
results from the unaged (baseline) sample. As expected, there is no NaOH found within the EPDM.
Figure 108 shows the results of the hose sample aged for 6-months at 79°C. As can be seen in the
figure, there are signs of both sodium and calcium present within the sample. From these
preliminary results, it appears that the sodium hydroxide is penetrating into the inner hose at the
higher temperatures. Once the results from the lower temperature samples are obtained, FIU can
correlate how the temperature effects the penetration of the NaOH into the EPDM hoses. In
addition, the samples will be analyzed in order to determine the source of the calcium inside the
samples.

FIU-ARC-2017-800006470-04b-255 Chemical Process Alternatives for Radioactive Waste
ARC Year-End Technical Progress Report 114
Figure 107. Unaged (baseline) hose sample.
Figure 108. 6-Month aged hose sample (79°C).

FIU-ARC-2017-800006470-04b-255 Chemical Process Alternatives for Radioactive Waste
ARC Year-End Technical Progress Report 115
CONCLUSIONS AND FUTURE WORK
After analyzing the experimental data from the six-month aged samples, minimal degradation was
observed in the bursting pressure of the hoses aged at the different temperatures. When compared
to the baseline results, a maximum degradation of around 1100 Kpa was observed. However, when
the tensile strength of the material coupons were analyzed, a much greater degradation was
observed. When the average tensile strength of the EPDM and the Garlock® coupons aged at 79°C
were compared to the baseline samples, a degradation of 75% and 95% in the tensile strength was
observed for the EPDM and the Garlock® samples, respectively. When analysis using a scanning
electron microscope with energy dispersive X-ray spectroscopy (SEM-EDS) was conducted on the
EPDM inner hose samples, the sodium hydroxide was observed to have penetrated into the
material at the 79°C temperature. The SEM-EDS analysis of all the hose samples is ongoing.
Therefore, a complete comparison cannot be done at this time. Also, even though the one-year
coupon aging has been completed, the material analysis has not yet begun. The next phase of
testing will include conducting burst pressure tests on the one-year aged hose specimens as well
as the tensile tests on the EPDM and the Garlock® material coupons samples. In addition, the SEM-
EDS analysis of the six-month as well as the one-year hose specimens will be completed. After all
the tests have been conducted and the data analyzed, additional testing phases may be considered.
This may include the effects of elevated pressure in addition to elevated temperature and exposure
to caustic solutions. Additional materials may also be evaluated, including the use Teflon and
Tefzel.

FIU-ARC-2017-800006470-04b-255 Chemical Process Alternatives for Radioactive Waste
ARC Year-End Technical Progress Report 116
REFERENCES
1. H Brush, C. O. (2013). Test Plan for the Irradiation of Nonmetallic Materials. Albuquerque,
New Mexico: Sandia National Laboratories.
2. Lieberman, P. (2004). Banded (Band-It) and Swaged Hose-In-Hose (HIHTL) Assembly
Service Life Verification Program. Santa Clarita, California: National Technical Systems.
3. ASTM D412-16 Standard Test Methods for Vulcanized Rubber and Thermoplastic
Elastomers—Tension, ASTM International, West Conshohocken, PA, 2016,
https://doi.org/10.1520/D0412-16