chemical stabilization of 1t phase transition metal
TRANSCRIPT
Chemical Stabilization of 1T′ Phase Transition Metal Dichalcogenideswith Giant Optical Kerr NonlinearitySherman J. R. Tan,†,‡,∇ Ibrahim Abdelwahab,†,‡,∇ Zijing Ding,§,⊥ Xiaoxu Zhao,†,‡ Tieshan Yang,∥
Gabriel Z. J. Loke,⊥ Han Lin,∥ Ivan Verzhbitskiy,⊥,⊗ Sock Mui Poh,†,‡ Hai Xu,† Chang Tai Nai,†
Wu Zhou,# Goki Eda,†,⊥,⊗ Baohua Jia,∥ and Kian Ping Loh*,†,⊗
†Department of Chemistry, National University of Singapore, Singapore 117543, Singapore‡NUS Graduate School for Integrative Sciences and Engineering, Centre for Life Sciences, National University of Singapore, #05-01,28 Medical Drive, Singapore 117456, Singapore§SZU-NUS Collaborative Innovation Center for Optoelectronic Science & Technology, Key Laboratory of Optoelectronic Devicesand Systems of Ministry of Education and Guangdong Province, College of Optoelectronic Engineering, Shenzhen University,Shenzhen 518060, China∥Centre for Micro-Photonics, Faculty of Science Engineering and Technology, Swinburne University of Technology, Hawthorn,Victoria 3122, Australia⊥Department of Physics, National University of Singapore, Singapore 117551, Singapore#Materials Science & Technology Division, Oak Ridge National Laboratory, Oak Ridge, Tennessee 37831, United States⊗Centre for Advanced 2D Materials and Graphene Research Centre, National University of Singapore, Singapore 117546, Singapore
*S Supporting Information
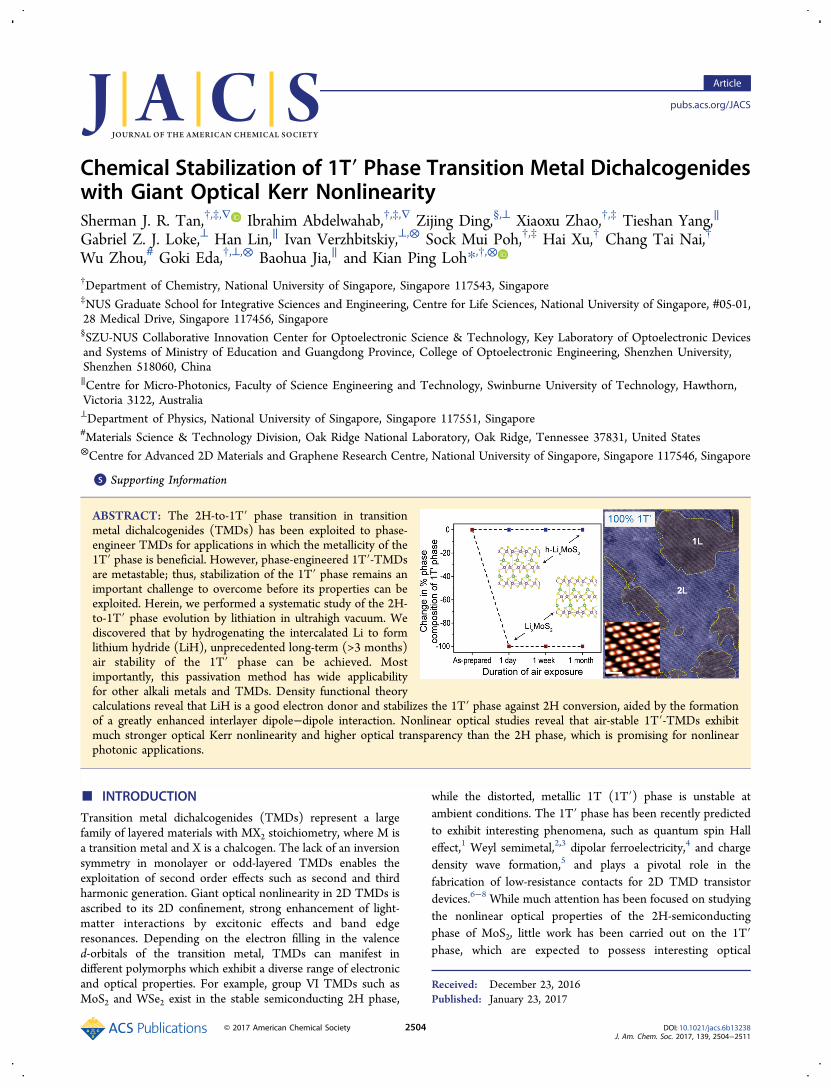
ABSTRACT: The 2H-to-1T′ phase transition in transitionmetal dichalcogenides (TMDs) has been exploited to phase-engineer TMDs for applications in which the metallicity of the1T′ phase is beneficial. However, phase-engineered 1T′-TMDsare metastable; thus, stabilization of the 1T′ phase remains animportant challenge to overcome before its properties can beexploited. Herein, we performed a systematic study of the 2H-to-1T′ phase evolution by lithiation in ultrahigh vacuum. Wediscovered that by hydrogenating the intercalated Li to formlithium hydride (LiH), unprecedented long-term (>3 months)air stability of the 1T′ phase can be achieved. Mostimportantly, this passivation method has wide applicabilityfor other alkali metals and TMDs. Density functional theorycalculations reveal that LiH is a good electron donor and stabilizes the 1T′ phase against 2H conversion, aided by the formationof a greatly enhanced interlayer dipole−dipole interaction. Nonlinear optical studies reveal that air-stable 1T′-TMDs exhibitmuch stronger optical Kerr nonlinearity and higher optical transparency than the 2H phase, which is promising for nonlinearphotonic applications.
■ INTRODUCTION
Transition metal dichalcogenides (TMDs) represent a largefamily of layered materials with MX2 stoichiometry, where M isa transition metal and X is a chalcogen. The lack of an inversionsymmetry in monolayer or odd-layered TMDs enables theexploitation of second order effects such as second and thirdharmonic generation. Giant optical nonlinearity in 2D TMDs isascribed to its 2D confinement, strong enhancement of light-matter interactions by excitonic effects and band edgeresonances. Depending on the electron filling in the valenced-orbitals of the transition metal, TMDs can manifest indifferent polymorphs which exhibit a diverse range of electronicand optical properties. For example, group VI TMDs such asMoS2 and WSe2 exist in the stable semiconducting 2H phase,
while the distorted, metallic 1T (1T′) phase is unstable atambient conditions. The 1T′ phase has been recently predictedto exhibit interesting phenomena, such as quantum spin Halleffect,1 Weyl semimetal,2,3 dipolar ferroelectricity,4 and chargedensity wave formation,5 and plays a pivotal role in thefabrication of low-resistance contacts for 2D TMD transistordevices.6−8 While much attention has been focused on studyingthe nonlinear optical properties of the 2H-semiconductingphase of MoS2, little work has been carried out on the 1T′phase, which are expected to possess interesting optical
Received: December 23, 2016Published: January 23, 2017
Article
pubs.acs.org/JACS
© 2017 American Chemical Society 2504 DOI: 10.1021/jacs.6b13238J. Am. Chem. Soc. 2017, 139, 2504−2511
properties due to the low symmetry of the distorted phase andits anisotropic optical properties.Several methods have been employed to induce 2H-to-1T′
phase transition in TMDs, including intercalation with alkalimetals,9−11 electron beam irradiation,12,13 mechanical strain,14
and plasmonic excitation.15 The weak van der Waals bondingbetween the TMD layers allows alkali metal ions to intercalate,forming ternary compounds which are highly anisotropic andpossessing pseudo two-dimensional properties.16,17 The 1T′domains are usually found in low concentrations with respect tothe 2H phase, especially after air-exposure,18 mild annealing, oraging.19,20 Lacking a method to stabilize the 1T′ phases against2H conversion means that many 1T′-associated properties areshort-lived in air, which prevents detailed investigation into theintriguing properties of this phase. It is therefore essential todevelop a phase engineering strategy which not only achievescomplete phase conversion, but also stabilizes the 1T′ phaseagainst degradation in air.Herein, we report an effective phase engineering method
which can achieve complete 2H-to-1T′ phase conversion inTMDs. Most importantly, the 1T′ phase can be stabilizedagainst conversion to the 2H phase for extended periods oftime in air. Our method involves intercalating MoS2, aprototypical TMD, by lithium atoms generated from a standardgetter source, followed by thermally activated hydrogenation ofthe intercalated Li to form LiH. The ability to achieve stableand homogeneous 1T′ phase in TMDs allows us to study itsnonlinear optical properties as a function of laser power in air,where giant optical Kerr nonlinearities in 1T′-MoS2 and 1T′-WS2 are discovered.
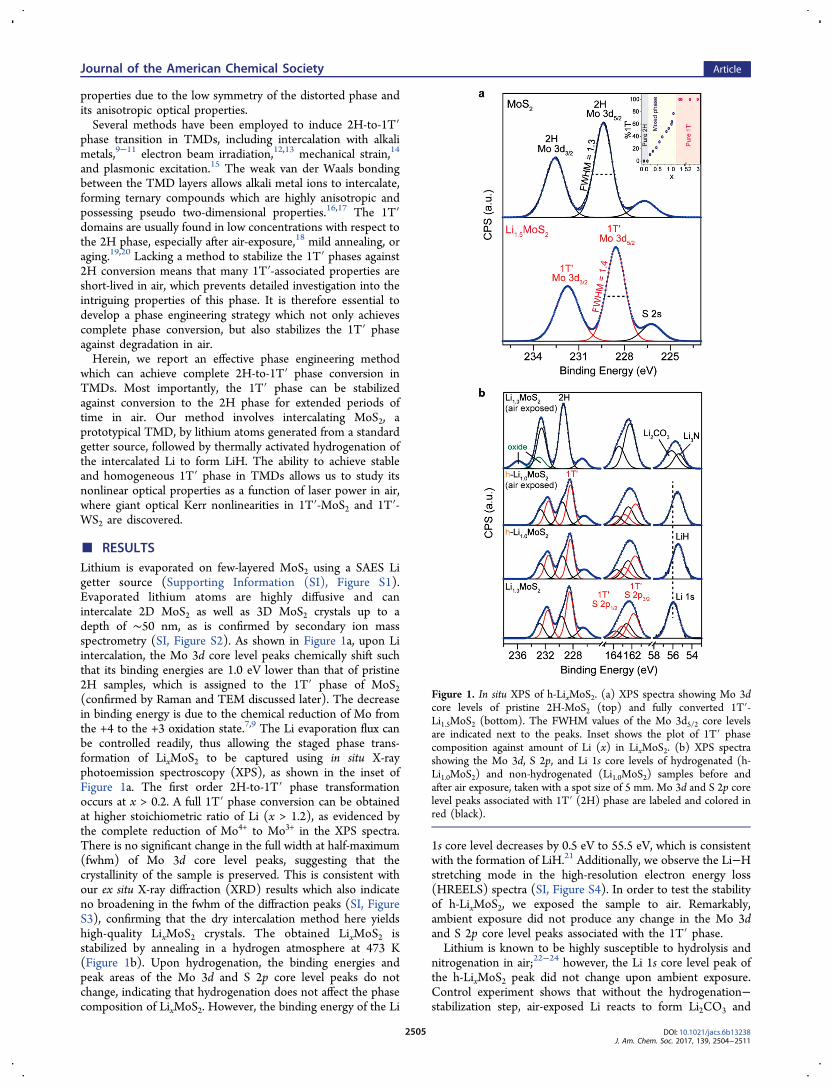
■ RESULTSLithium is evaporated on few-layered MoS2 using a SAES Ligetter source (Supporting Information (SI), Figure S1).Evaporated lithium atoms are highly diffusive and canintercalate 2D MoS2 as well as 3D MoS2 crystals up to adepth of ∼50 nm, as is confirmed by secondary ion massspectrometry (SI, Figure S2). As shown in Figure 1a, upon Liintercalation, the Mo 3d core level peaks chemically shift suchthat its binding energies are 1.0 eV lower than that of pristine2H samples, which is assigned to the 1T′ phase of MoS2(confirmed by Raman and TEM discussed later). The decreasein binding energy is due to the chemical reduction of Mo fromthe +4 to the +3 oxidation state.7,9 The Li evaporation flux canbe controlled readily, thus allowing the staged phase trans-formation of LixMoS2 to be captured using in situ X-rayphotoemission spectroscopy (XPS), as shown in the inset ofFigure 1a. The first order 2H-to-1T′ phase transformationoccurs at x > 0.2. A full 1T′ phase conversion can be obtainedat higher stoichiometric ratio of Li (x > 1.2), as evidenced bythe complete reduction of Mo4+ to Mo3+ in the XPS spectra.There is no significant change in the full width at half-maximum(fwhm) of Mo 3d core level peaks, suggesting that thecrystallinity of the sample is preserved. This is consistent withour ex situ X-ray diffraction (XRD) results which also indicateno broadening in the fwhm of the diffraction peaks (SI, FigureS3), confirming that the dry intercalation method here yieldshigh-quality LixMoS2 crystals. The obtained LixMoS2 isstabilized by annealing in a hydrogen atmosphere at 473 K(Figure 1b). Upon hydrogenation, the binding energies andpeak areas of the Mo 3d and S 2p core level peaks do notchange, indicating that hydrogenation does not affect the phasecomposition of LixMoS2. However, the binding energy of the Li
1s core level decreases by 0.5 eV to 55.5 eV, which is consistentwith the formation of LiH.21 Additionally, we observe the Li−Hstretching mode in the high-resolution electron energy loss(HREELS) spectra (SI, Figure S4). In order to test the stabilityof h-LixMoS2, we exposed the sample to air. Remarkably,ambient exposure did not produce any change in the Mo 3dand S 2p core level peaks associated with the 1T′ phase.Lithium is known to be highly susceptible to hydrolysis and
nitrogenation in air;22−24 however, the Li 1s core level peak ofthe h-LixMoS2 peak did not change upon ambient exposure.Control experiment shows that without the hydrogenation−stabilization step, air-exposed Li reacts to form Li2CO3 and
Figure 1. In situ XPS of h-LixMoS2. (a) XPS spectra showing Mo 3dcore levels of pristine 2H-MoS2 (top) and fully converted 1T′-Li1.5MoS2 (bottom). The FWHM values of the Mo 3d5/2 core levelsare indicated next to the peaks. Inset shows the plot of 1T′ phasecomposition against amount of Li (x) in LixMoS2. (b) XPS spectrashowing the Mo 3d, S 2p, and Li 1s core levels of hydrogenated (h-Li1.0MoS2) and non-hydrogenated (Li1.0MoS2) samples before andafter air exposure, taken with a spot size of 5 mm. Mo 3d and S 2p corelevel peaks associated with 1T′ (2H) phase are labeled and colored inred (black).
Journal of the American Chemical Society Article
DOI: 10.1021/jacs.6b13238J. Am. Chem. Soc. 2017, 139, 2504−2511
2505

Li3N25 immediately, and LixMoS2 reverts to the 2H phase
(Figure 1b). Consistent with our XPS results, ex situ Ramanspectroscopy confirms a full 2H-to-1T′ phase conversion athigher stoichiometric ratios of Li. 2H-MoS2 can beunambiguously identified by the zone-center Raman modes at383 cm−1 (E2g
1 mode) and 409 cm−1 (A1g mode).26,27 Inparticular, the E2g
1 mode is unique to the 2H phase and absentin the 1T′-MoS2; the absence of the E2g
1 mode is observed inthe h-Li1.50MoS2 sample, indicating a full 2H-to-1T′ phaseconversion (Figure 2a). In addition to the signature Ramanpeaks of 1T′-MoS2 at 158, 218, 301, and 334 cm−1, whichcorrespond to the J1, J2, Ag, and J3 peaks, respectively,
28 a peaklabeled “c”, corresponding to the out-of-plane Li−S Ramanmode of Li-intercalated MoS2,
29 is also observed. Interestingly,the intensity of the J2 peak is very weak in the mixed phasesample (h-Li1.0MoS2) and disappears in the pure h-Li1.5MoS2. J2is assigned to the longitudinal acoustic mode at the M-pointand is only allowed by disorder; thus, it was previouslyobserved in solution-phase chemical exfoliated samples andMoS2 nanoparticles with fullerene-like geometry.26,30 At theintermediate stage before full 1T′ coverage is attained(Li0.2<x<1.2MoS2), a mixture of 2H and 1T′ polytypes, joinedby disordered grain boundaries, coexists in the MoS2 film. Thedefect-related J2 peak may emanate from the grain boundaryregions, since this peak vanishes when a full 1T′ phase isdeveloped at full lithiation (x ≈ 1.2).Scanning transmission electron microscopy (STEM) images
of the h-LixMoS2 sample reveal the presence of alternating one-dimensional zigzag stripes on the basal plane, with measuredMo−Mo distances of 0.37 and 0.28 nm, corresponding to the1T′ phase unit cells with 2 × 1 superstructure31 (Figure 2b),which is confirmed also by the presence of the half-ordersuperstructure spots in the FFT diffraction image shown in
Figure 2c (0.17 Å−1 d-spacing, highlighted as yellow circles).The increased stability of our h-LixMoS2 (1T′) sample is alsoreflected in the much higher 1T′-to-2H phase conversiontemperature, determined using in situ XPS. It was observed thatthe 1T′-to-2H phase transition proceeds only above 673 K,which is markedly increased compared to 1T′-MoS2 samples(373 K) prepared by solution-phase method.9 The increasedthermal stability of our h-LixMoS2 samples is useful because itwill facilitate the subsequent device fabrication process, whichoften requires post-annealing treatment.Despite subjecting the h-LixMoS2 samples to multiple
characterizations over an extended period in air, we find thatthe 1T′ phase remains relatively stable, as judged by its steadyspectroscopic signatures in Raman, XRD, and XPS whensampled periodically over time (Figure 3a). Raman spectra of h-LixMoS2 aged for three months in air show no discernibledegradation of the 1T′-related peaks (Figure 3b). This is instark contrast to the samples which are not hydrogenated, forwhich the signal decays rapidly within a day. One possiblereason is the rapid oxidation and nitrogenation of lithium inair22 (Figure 1b), which reduced its electron donating ability.The 2H-to-1T′ phase change has an electronic origin. Theformation of the d3 configuration after electron transfer to theMo 4d orbitals destabilizes the trigonal prismatic structure inthe 2H phase in favor of the octahedral structure adopted bythe 1T′ phase.32 Intercalated Li atoms act as electron donors,therefore, the reduction in their electron donating ability afterexposure to air will destabilize the 1T′ phase against the 2Hphase.One question is whether the stabilization achieved by the
formation of alkali metal hydride is generic for othercombinations of layered 2D materials and alkali metalintercalants. As a further proof of principle, we demonstrate
Figure 2. Ex situ characterizations of h-LixMoS2. (a) Raman spectra of pristine 2H-MoS2, mixed 2H/1T′ phase h-Li1.0MoS2, and pure 1T′ phase h-Li1.5MoS2 taken with 532 nm laser. Raman modes unique to the 1T′ phase are labeled in red. (b) Annular dark-field scanning transmission electronmicroscopy image of monolayer and bilayer h-LixMoS2 regions with false color to differentiate the different layers. Inset shows the magnified filteredimage of 1T′ phase region indicated by the dotted orange box. Scale bars for image and inset are 2.5 and 0.5 nm, respectively. (c) Fast Fouriertransform pattern of (b) (left panel) and intensity profiles (middle and right panels) of blue and red lines indicated by inset of (b) showingalternating atomic spacing along one direction with spacing corresponding to zigzag Mo chains from 1T′-MoS2.
Journal of the American Chemical Society Article
DOI: 10.1021/jacs.6b13238J. Am. Chem. Soc. 2017, 139, 2504−2511
2506
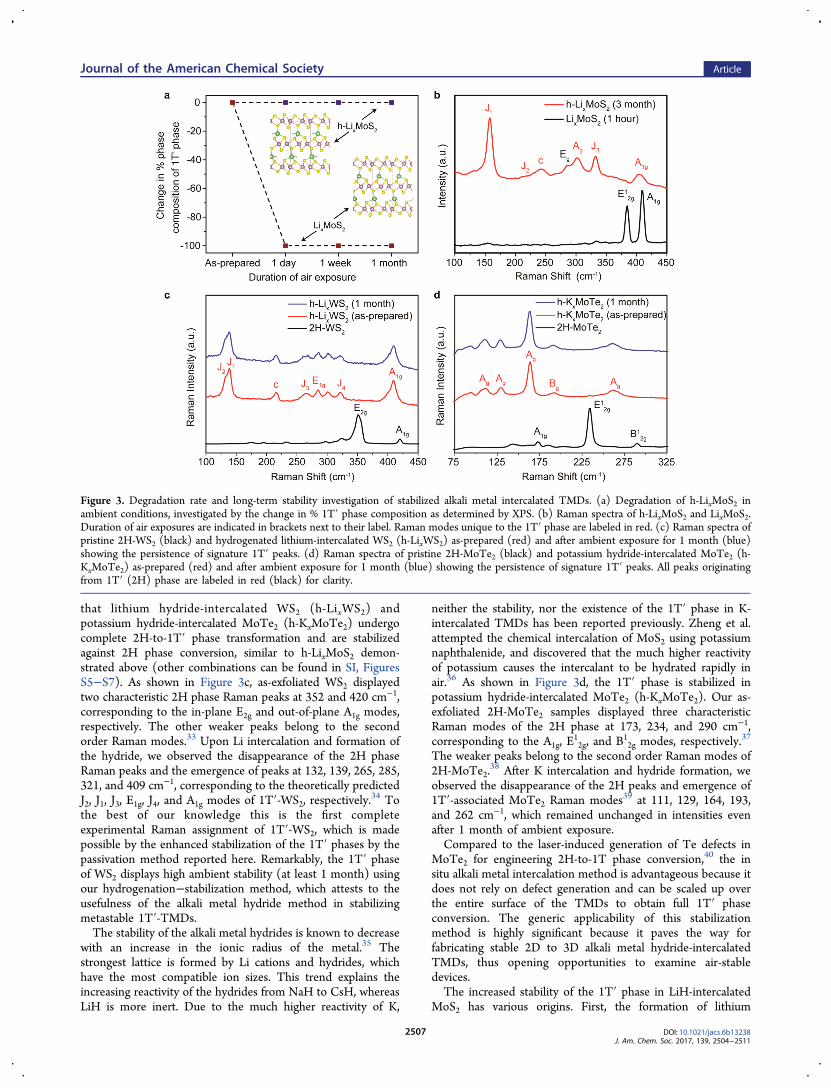
that lithium hydride-intercalated WS2 (h-LixWS2) andpotassium hydride-intercalated MoTe2 (h-KxMoTe2) undergocomplete 2H-to-1T′ phase transformation and are stabilizedagainst 2H phase conversion, similar to h-LixMoS2 demon-strated above (other combinations can be found in SI, FiguresS5−S7). As shown in Figure 3c, as-exfoliated WS2 displayedtwo characteristic 2H phase Raman peaks at 352 and 420 cm−1,corresponding to the in-plane E2g and out-of-plane A1g modes,respectively. The other weaker peaks belong to the secondorder Raman modes.33 Upon Li intercalation and formation ofthe hydride, we observed the disappearance of the 2H phaseRaman peaks and the emergence of peaks at 132, 139, 265, 285,321, and 409 cm−1, corresponding to the theoretically predictedJ2, J1, J3, E1g, J4, and A1g modes of 1T′-WS2, respectively.
34 Tothe best of our knowledge this is the first completeexperimental Raman assignment of 1T′-WS2, which is madepossible by the enhanced stabilization of the 1T′ phases by thepassivation method reported here. Remarkably, the 1T′ phaseof WS2 displays high ambient stability (at least 1 month) usingour hydrogenation−stabilization method, which attests to theusefulness of the alkali metal hydride method in stabilizingmetastable 1T′-TMDs.The stability of the alkali metal hydrides is known to decrease
with an increase in the ionic radius of the metal.35 Thestrongest lattice is formed by Li cations and hydrides, whichhave the most compatible ion sizes. This trend explains theincreasing reactivity of the hydrides from NaH to CsH, whereasLiH is more inert. Due to the much higher reactivity of K,
neither the stability, nor the existence of the 1T′ phase in K-intercalated TMDs has been reported previously. Zheng et al.attempted the chemical intercalation of MoS2 using potassiumnaphthalenide, and discovered that the much higher reactivityof potassium causes the intercalant to be hydrated rapidly inair.36 As shown in Figure 3d, the 1T′ phase is stabilized inpotassium hydride-intercalated MoTe2 (h-KxMoTe2). Our as-exfoliated 2H-MoTe2 samples displayed three characteristicRaman modes of the 2H phase at 173, 234, and 290 cm−1,corresponding to the A1g, E
12g, and B1
2g modes, respectively.37
The weaker peaks belong to the second order Raman modes of2H-MoTe2.
38 After K intercalation and hydride formation, weobserved the disappearance of the 2H peaks and emergence of1T′-associated MoTe2 Raman modes39 at 111, 129, 164, 193,and 262 cm−1, which remained unchanged in intensities evenafter 1 month of ambient exposure.Compared to the laser-induced generation of Te defects in
MoTe2 for engineering 2H-to-1T phase conversion,40 the insitu alkali metal intercalation method is advantageous because itdoes not rely on defect generation and can be scaled up overthe entire surface of the TMDs to obtain full 1T′ phaseconversion. The generic applicability of this stabilizationmethod is highly significant because it paves the way forfabricating stable 2D to 3D alkali metal hydride-intercalatedTMDs, thus opening opportunities to examine air-stabledevices.The increased stability of the 1T′ phase in LiH-intercalated
MoS2 has various origins. First, the formation of lithium
Figure 3. Degradation rate and long-term stability investigation of stabilized alkali metal intercalated TMDs. (a) Degradation of h-LixMoS2 inambient conditions, investigated by the change in % 1T′ phase composition as determined by XPS. (b) Raman spectra of h-LixMoS2 and LixMoS2.Duration of air exposures are indicated in brackets next to their label. Raman modes unique to the 1T′ phase are labeled in red. (c) Raman spectra ofpristine 2H-WS2 (black) and hydrogenated lithium-intercalated WS2 (h-LixWS2) as-prepared (red) and after ambient exposure for 1 month (blue)showing the persistence of signature 1T′ peaks. (d) Raman spectra of pristine 2H-MoTe2 (black) and potassium hydride-intercalated MoTe2 (h-KxMoTe2) as-prepared (red) and after ambient exposure for 1 month (blue) showing the persistence of signature 1T′ peaks. All peaks originatingfrom 1T′ (2H) phase are labeled in red (black) for clarity.
Journal of the American Chemical Society Article
DOI: 10.1021/jacs.6b13238J. Am. Chem. Soc. 2017, 139, 2504−2511
2507

hydride passivates the Li from reacting with air (78% nitrogen)to form Li3N. The heat of reaction for LiH(s) and N2(g) toform Li3N is endothermic (+41 kJ/mol), whereas that of Li(s)and N2(g) to give the same is exothermic (−55 kJ/mol); LiHalso is less reactive with water compared to Li (see reactionenthalpies in SI, Table S1). Second, LiH can act as a goodLewis base. To understand the role of the LiH intercalant instabilizing the 1T′-MoS2, we calculate the differential chargedensity (DCD), Δρ(r), of LixMoS2 and h-LixMoS2 (Figure4a,b). The model is based on a 1 × 2 × 2 supercell of Li0.5MoS2constrained by AB-stacked 2H-MoS2 with the lattice parame-ters a = 3.18 Å and c = 6.24 Å, as determined fromexperimental XRD and STEM data of our samples. Theenergetically optimized configuration of intercalated LiH(structure can be found in the insets of Figure 3a) has abinding energy of 0.24 eV on the MoS2 layers. The magnitudeof this binding energy is similar to a hydrogen bond, implyingfacile intercalation and de-intercalation. To quantify theamount of charge transfer from LiH to MoS2, we calculatethe plane-averaged DCD along the direction normal to thesurface by integrating Δρ(r) within the x−y plane. The excesselectrons transferred from lithium atoms to MoS2 is about0.818e per lithium atom (0.41e per MoS2 unit cell); however, itincreases to 0.879e per lithium hydride molecule upon theformation of LiH (0.44e per MoS2 unit cell). These resultsimply that LiH can act as an effective electron donor, and iscapable of inducing 2H-to-1T′ phase transition in MoS2. TheDFT calculations also reveal a significant charge redistributioninduced by the relatively large dipole moment of LiH, especiallyin between the MoS2 layers, as shown by the isosurface plots.The bond angle of Li−H−Li is about 83°, and the dipole istilted with respect to the MoS2 plane. Due to the large
polarized electron cloud of LiH, the charge transfer to the topand bottom MoS2 layers is nonequivalent, leading to chargepolarization between the top and bottom MoS2 plane (Figure4a,b). The increased free carrier density in MoS2 layers uponcharge transfer allows creation of image dipoles for screeningthe huge dipole of LiH. Consequently, the perpendicular dipolemoment generated is 0.123 D per unit cell for h-LixMoS2,which is of 2 orders of magnitude larger than that of LixMoS2(0.00616 D per unit cell). The giant increase in dipole−dipoleinteractions creates a strong intermolecular force whichdecreases the chemical energy of the system. The enhancedinterlayer coupling in h-LixMoS2 resulting from the increaseddipole−dipole interactions contracts the interlayer distance.This is consistent with XRD results, where we observe only a0.14 Å increase in the c-spacing of h-LixMoS2 compared to 2H-MoS2, following intercalation by LiH, as evidenced by the shiftof the (002) peak of 2H-MoS2 from 14.4° to 14.2° (Figure 4c).In order to verify whether the sandwich layered structure of
MoS2 layers protects the LiH intercalant from reacting with theambient environment, we exfoliated the top layers of h-LixMoS2flakes to expose the inner surface. AFM images of the air-exposed surface showed a reticular network of nanoparticlesand liquid films (Figure 4d). In the absence of a protectingMoS2 layer, the intercalated LiH undergoes rapid oxidation andhydration (SI, Figure S8). With the encapsulation of the alkalimetal hydrides by MoS2 layers, LiH intercalated-MoS2 is highlyrobust, as judged from the stable 1T′ signature in Raman evenafter 1 day of immersion in water (SI, Figure S9).In order to investigate the optical properties of h-LixMoS2,
we performed spectral measurements using dual microscope setup where the sample was illuminated by a broadband beam viaan inverted microscope to characterize the optical transmission
Figure 4. Electronic and steric stabilization of h-LixMoS2. (a,b) DFT-calculated differential charge density after intercalation of Li (a) and LiH (b)into bilayer 1T′-MoS2. Plane-averaged differential charge density (Δρ(z)) plots are shown in the left panels of the region marked by a black box ofthe isosurface side-view profile at 0.02 Å−3 in the right panels. The black dashed lines refer to an interface with vacuum. The red (blue) color of theisosurface plots denotes loss (accumulation) of electrons in the system. (c) Powder XRD spectra of pristine 2H-MoS2 (black) and h-LixMoS2 (red)of the (002) plane region. (d,e) NC-AFM images of surface exfoliated h-LixMoS2. Large-scale topography image is shown in (d), and the zoomed-inregion marked by the orange box is shown in (e), together with the height profile of water (1 monolayer) and aggregated Li clusters along the whitedotted line. Scale bars for the images are 1.9 μm and 400 nm, respectively.
Journal of the American Chemical Society Article
DOI: 10.1021/jacs.6b13238J. Am. Chem. Soc. 2017, 139, 2504−2511
2508
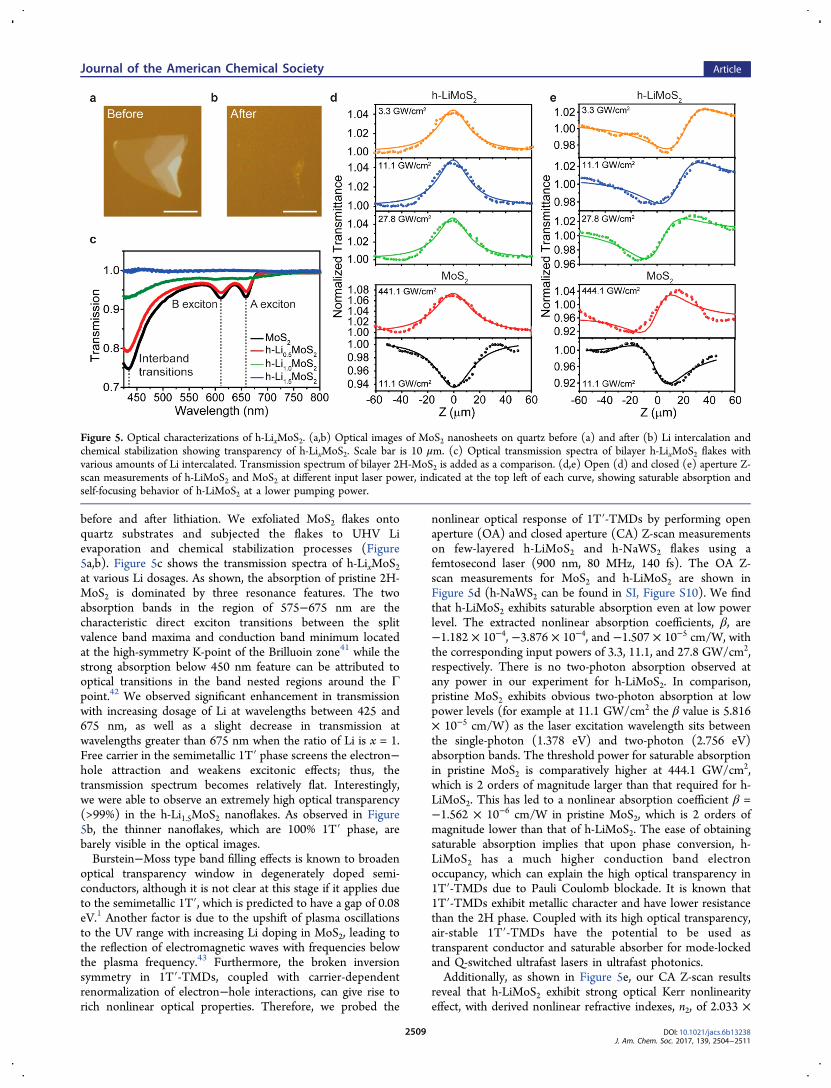
before and after lithiation. We exfoliated MoS2 flakes ontoquartz substrates and subjected the flakes to UHV Lievaporation and chemical stabilization processes (Figure5a,b). Figure 5c shows the transmission spectra of h-LixMoS2at various Li dosages. As shown, the absorption of pristine 2H-MoS2 is dominated by three resonance features. The twoabsorption bands in the region of 575−675 nm are thecharacteristic direct exciton transitions between the splitvalence band maxima and conduction band minimum locatedat the high-symmetry K-point of the Brilluoin zone41 while thestrong absorption below 450 nm feature can be attributed tooptical transitions in the band nested regions around the Γpoint.42 We observed significant enhancement in transmissionwith increasing dosage of Li at wavelengths between 425 and675 nm, as well as a slight decrease in transmission atwavelengths greater than 675 nm when the ratio of Li is x = 1.Free carrier in the semimetallic 1T′ phase screens the electron−hole attraction and weakens excitonic effects; thus, thetransmission spectrum becomes relatively flat. Interestingly,we were able to observe an extremely high optical transparency(>99%) in the h-Li1.5MoS2 nanoflakes. As observed in Figure5b, the thinner nanoflakes, which are 100% 1T′ phase, arebarely visible in the optical images.Burstein−Moss type band filling effects is known to broaden
optical transparency window in degenerately doped semi-conductors, although it is not clear at this stage if it applies dueto the semimetallic 1T′, which is predicted to have a gap of 0.08eV.1 Another factor is due to the upshift of plasma oscillationsto the UV range with increasing Li doping in MoS2, leading tothe reflection of electromagnetic waves with frequencies belowthe plasma frequency.43 Furthermore, the broken inversionsymmetry in 1T′-TMDs, coupled with carrier-dependentrenormalization of electron−hole interactions, can give rise torich nonlinear optical properties. Therefore, we probed the
nonlinear optical response of 1T′-TMDs by performing openaperture (OA) and closed aperture (CA) Z-scan measurementson few-layered h-LiMoS2 and h-NaWS2 flakes using afemtosecond laser (900 nm, 80 MHz, 140 fs). The OA Z-scan measurements for MoS2 and h-LiMoS2 are shown inFigure 5d (h-NaWS2 can be found in SI, Figure S10). We findthat h-LiMoS2 exhibits saturable absorption even at low powerlevel. The extracted nonlinear absorption coefficients, β, are−1.182 × 10⁻⁴, −3.876 × 10⁻⁴, and −1.507 × 10⁻⁵ cm/W, withthe corresponding input powers of 3.3, 11.1, and 27.8 GW/cm2,respectively. There is no two-photon absorption observed atany power in our experiment for h-LiMoS2. In comparison,pristine MoS2 exhibits obvious two-photon absorption at lowpower levels (for example at 11.1 GW/cm2 the β value is 5.816× 10⁻⁵ cm/W) as the laser excitation wavelength sits betweenthe single-photon (1.378 eV) and two-photon (2.756 eV)absorption bands. The threshold power for saturable absorptionin pristine MoS2 is comparatively higher at 444.1 GW/cm2,which is 2 orders of magnitude larger than that required for h-LiMoS2. This has led to a nonlinear absorption coefficient β =−1.562 × 10⁻⁶ cm/W in pristine MoS2, which is 2 orders ofmagnitude lower than that of h-LiMoS2. The ease of obtainingsaturable absorption implies that upon phase conversion, h-LiMoS2 has a much higher conduction band electronoccupancy, which can explain the high optical transparency in1T′-TMDs due to Pauli Coulomb blockade. It is known that1T′-TMDs exhibit metallic character and have lower resistancethan the 2H phase. Coupled with its high optical transparency,air-stable 1T′-TMDs have the potential to be used astransparent conductor and saturable absorber for mode-lockedand Q-switched ultrafast lasers in ultrafast photonics.Additionally, as shown in Figure 5e, our CA Z-scan results
reveal that h-LiMoS2 exhibit strong optical Kerr nonlinearityeffect, with derived nonlinear refractive indexes, n2, of 2.033 ×
Figure 5. Optical characterizations of h-LixMoS2. (a,b) Optical images of MoS2 nanosheets on quartz before (a) and after (b) Li intercalation andchemical stabilization showing transparency of h-LixMoS2. Scale bar is 10 μm. (c) Optical transmission spectra of bilayer h-LixMoS2 flakes withvarious amounts of Li intercalated. Transmission spectrum of bilayer 2H-MoS2 is added as a comparison. (d,e) Open (d) and closed (e) aperture Z-scan measurements of h-LiMoS2 and MoS2 at different input laser power, indicated at the top left of each curve, showing saturable absorption andself-focusing behavior of h-LiMoS2 at a lower pumping power.
Journal of the American Chemical Society Article
DOI: 10.1021/jacs.6b13238J. Am. Chem. Soc. 2017, 139, 2504−2511
2509
10−9, 5.51 × 10⁻¹⁰, and 2.897 × 10⁻¹⁰ cm2/W, with thecorresponding input powers of 3.3, 11.1, and 27.8 GW/cm2,respectively. Typical semiconductor materials such as Si (n2 =0.5 × 10⁻¹³ cm2/W) and GaAs (n2 = 1.5 × 10⁻¹³ cm2/W) usedin current electronic devices fall short of the required nonlinearrefractive index (>10−10 cm2/W) to produce attractive indexchange for optical devices.44 The strong optical Kerr non-linearity discovered in h-LiMoS2 and h-NaWS2, which outper-forms most of the other two-dimensional materials, suggeststhat air-stable 1T′-TMDs can be potentially used for opticalsignal modulation in optoelectronic platforms. Furthermore, weobserve a valley−peak type curve for h-LiMoS2 at any inputpower, while pristine MoS2 exhibit a peak−valley type curve formost of the power levels (for example at 11.1 GW/cm2),indicating self-focusing and self-defocusing behaviors, respec-tively. Only at high input powers (with a threshold at 444.1GW/cm2), MoS2 exhibit peak−valley shapes with a derivedthreshold nonlinear refractive index, n2, of 3.69 × 10⁻¹¹ cm2/W,which is 2 orders of magnitude lower than that of h-LiMoS2.The strong nonlinear optical susceptibilities and switchable self-focusing behavior of air-stable phase-engineered TMDs,together with its low linear absorption loss and nonlineartwo-photon absorption loss, open up tremendous possibilitiesfor applications as waveguides and ultrafast switches inintegrated photonic circuits.
■ CONCLUSIONIn summary, we have shown that full 1T′ phase can beengendered in MoS2 by the controlled evaporation of Li invacuum to produce LixMoS2 (x > 1.2). By exploiting theinterlayer diffusivity of hydrogen, the reactivity of intercalatedalkali metals in TMDs is reduced by the formation of alkalimetal hydride. A synergistic interaction is observed between thehost and intercalant: intercalated alkali metal hydrides are goodelectron donors and stabilize the 1T′ phase in air, while theTMDs layers sandwich and protect the alkali metal hydridesfrom reactive species in the ambient environment. The genericapplicability of this method has been verified in other kinds ofTMDs (e.g., WS2 and MoTe2) and also with different alkalimetal hydrides (e.g., LiH and KH). Giant optical Kerrnonlinearity and higher optical transparency has been observedin 1T′-MoS2, where its chemical stability permits high-powerlaser irradiation. The ability to prepare air-stable, large area,homogeneous 1T′ phase of MoS2 allows the material to beexploited as a nonlinear optical material which can be used assaturable absorber or optical limiters. Finally, the ability togenerate in TMD material two phases (e.g., 2H and 1T′) withmarkedly different nonlinear refractive index and extinctioncoefficient suggests the potential for phase and amplitudemodulations, enabling applications in flat lenses.
■ ASSOCIATED CONTENT*S Supporting InformationThe Supporting Information is available free of charge on theACS Publications website at DOI: 10.1021/jacs.6b13238.
Experimental details and supporting figures (PDF)
■ AUTHOR INFORMATIONCorresponding Author*[email protected] J. R. Tan: 0000-0003-1591-3497
Kian Ping Loh: 0000-0002-1491-743XAuthor Contributions∇S.J.R.T. and I.A. contributed equally.
NotesThe authors declare no competing financial interest.
■ ACKNOWLEDGMENTSK.P.L. is grateful for funding from the National ResearchFoundation, Prime Minister’s Office, Midsized Research Centre(CA2DM). This research was also supported in part by the U.S.Department of Energy (DOE), Office of Science, Basic EnergyScience, Materials Sciences and Engineering Division (W.Z.),and through a user project at ORNL’s Center for NanophaseMaterials Sciences (CNMS), which is a DOE Office of ScienceUser Facility. The authors are grateful to Sarkar Soumya (NGS,NUS) for contributing CVD sample for XPS measurementsand to Dr. Li Lin Jun (NUS) for discussions. I.A. acknowledgesthe NUS-Imperial Joint Ph.D. program.
■ REFERENCES(1) Qian, X.; Liu, J.; Fu, L.; Li, J. Science 2014, 346 (6215), 1344−1347.(2) Sun, Y.; Wu, S.-C.; Ali, M. N.; Felser, C.; Yan, B. Phys. Rev. B:Condens. Matter Mater. Phys. 2015, 92 (16), 161107.(3) Qi, Y.; Naumov, P. G.; Ali, M. N.; Rajamathi, C. R.; Schnelle, W.;Barkalov, O.; Hanfland, M.; Wu, S. C.; Shekhar, C.; Sun, Y.; Suss, V.;Schmidt, M.; Schwarz, U.; Pippel, E.; Werner, P.; Hillebrand, R.;Forster, T.; Kampert, E.; Parkin, S.; Cava, R. J.; Felser, C.; Yan, B.;Medvedev, S. A. Nat. Commun. 2016, 7, 11038.(4) Shirodkar, S. N.; Waghmare, U. V. Phys. Rev. Lett. 2014, 112 (15),157601.(5) Chen, X.; Chen, Z.; Li, J. Chin. Sci. Bull. 2013, 58 (14), 1632−1641.(6) Franklin, A. D. Science 2015, 349 (6249), aab2750.(7) Kappera, R.; Voiry, D.; Yalcin, S. E.; Branch, B.; Gupta, G.;Mohite, A. D.; Chhowalla, M. Nat. Mater. 2014, 13 (12), 1128−34.(8) Allain, A.; Kang, J.; Banerjee, K.; Kis, A. Nat. Mater. 2015, 14(12), 1195−205.(9) Eda, G.; Yamaguchi, H.; Voiry, D.; Fujita, T.; Chen, M.;Chhowalla, M. Nano Lett. 2011, 11 (12), 5111−6.(10) Wang, L.; Xu, Z.; Wang, W.; Bai, X. J. Am. Chem. Soc. 2014, 136(18), 6693−7.(11) Eda, G.; Fujita, T.; Yamaguchi, H.; Voiry, D.; Chen, M.;Chhowalla, M. ACS Nano 2012, 6 (8), 7311−7317.(12) Lin, Y. C.; Dumcenco, D. O.; Huang, Y. S.; Suenaga, K. Nat.Nanotechnol. 2014, 9 (5), 391−6.(13) Amara, K. K.; Chen, Y.; Lin, Y.-C.; Kumar, R.; Okunishi, E.;Suenaga, K.; Quek, S. Y.; Eda, G. Chem. Mater. 2016, 28 (7), 2308−2314.(14) Song, S.; Keum, D. H.; Cho, S.; Perello, D.; Kim, Y.; Lee, Y. H.Nano Lett. 2016, 16 (1), 188−193.(15) Kang, Y.; Najmaei, S.; Liu, Z.; Bao, Y.; Wang, Y.; Zhu, X.; Halas,N. J.; Nordlander, P.; Ajayan, P. M.; Lou, J.; Fang, Z. Adv. Mater. 2014,26 (37), 6467−6471.(16) Lerf, A. Dalton Trans 2014, 43 (27), 10276−91.(17) Eknapakul, T.; King, P. D.; Asakawa, M.; Buaphet, P.; He, R. H.;Mo, S. K.; Takagi, H.; Shen, K. M.; Baumberger, F.; Sasagawa, T.;Jungthawan, S.; Meevasana, W. Nano Lett. 2014, 14 (3), 1312−6.(18) Janish, M. T.; Carter, C. B. Scr. Mater. 2015, 107, 22−25.(19) Dungey, K. E.; Curtis, M. D.; Penner-Hahn, J. E. Chem. Mater.1998, 10 (8), 2152−2161.(20) Benavente, E.; Santa Ana, M. A.; Mendizabal, F.; Gonzalez, G.Coord. Chem. Rev. 2002, 224 (1−2), 87−109.(21) Charton, S.; Delaunay, F.; Saviot, L.; Bernard, F.; Maupoix, C.Experimental investigation on lithium hydride hydrolysis; Presented at16th World Hydrogen Energy Conference, France, 2006.
Journal of the American Chemical Society Article
DOI: 10.1021/jacs.6b13238J. Am. Chem. Soc. 2017, 139, 2504−2511
2510
(22) Aurbach, D.; Zinigrad, E.; Cohen, Y.; Teller, H. Solid State Ionics2002, 148 (3−4), 405−416.(23) Jeppson, D. W.; Ballif, J. L.; Yuan, W. W.; Chou, B. E. Lithiumliterature review: lithium’s properties and interactions; U.S. Departmentof Energy: Richland, WA, 1978.(24) Rhein, R. A. Lithium Combustion: A Review; Naval WeaponsCenter: China Lake, CA, 1990.(25) Ishiyama, S.; Baba, Y.; Fujii, R.; Nakamura, M.; Imahori, Y. Nucl.Instrum. Methods Phys. Res., Sect. B 2012, 293, 42−47.(26) Guo, Y.; Sun, D.; Ouyang, B.; Raja, A.; Song, J.; Heinz, T. F.;Brus, L. E. Nano Lett. 2015, 15 (8), 5081−8.(27) Lee, C.; Yan, H.; Brus, L. E.; Heinz, T. F.; Hone, J.; Ryu, S. ACSNano 2010, 4 (5), 2695−2700.(28) Hu, T.; Li, R.; Dong, J. J. Chem. Phys. 2013, 139 (17), 174702.(29) Julien, C.; Sekine, T.; Balkanski, M. Solid State Ionics 1991, 48(3−4), 225−229.(30) Frey, G. L.; Tenne, R.; Matthews, M. J.; Dresselhaus, M. S.;Dresselhaus, G. Phys. Rev. B: Condens. Matter Mater. Phys. 1999, 60(4), 2883−2892.(31) Chou, S. S.; Sai, N.; Lu, P.; Coker, E. N.; Liu, S.; Artyushkova,K.; Luk, T. S.; Kaehr, B.; Brinker, C. J. Nat. Commun. 2015, 6, 8311.(32) Cheng, Y.; Nie, A.; Zhang, Q.; Gan, L.-Y.; Shahbazian-Yassar, R.;Schwingenschlogl, U. ACS Nano 2014, 8 (11), 11447−11453.(33) Zhao, W.; Ghorannevis, Z.; Amara, K. K.; Pang, J. R.; Toh, M.;Zhang, X.; Kloc, C.; Tan, P. H.; Eda, G. Nanoscale 2013, 5 (20),9677−9683.(34) Singh, A.; Shirodkar, S. N.; Waghmare, U. V. 2D Mater. 2015, 2(3), 035013.(35) Fohlmeister, L.; Stasch, A. Aust. J. Chem. 2015, 68 (8), 1190−1201.(36) Zheng, J.; Zhang, H.; Dong, S.; Liu, Y.; Nai, C. T.; Shin, H. S.;Jeong, H. Y.; Liu, B.; Loh, K. P. Nat. Commun. 2014, 5, 2995.(37) Keum, D. H.; Cho, S.; Kim, J. H.; Choe, D.-H.; Sung, H.-J.; Kan,M.; Kang, H.; Hwang, J.-Y.; Kim, S. W.; Yang, H.; Chang, K. J.; Lee, Y.H. Nat. Phys. 2015, 11 (6), 482−486.(38) Guo, H.; Yang, T.; Yamamoto, M.; Zhou, L.; Ishikawa, R.;Ueno, K.; Tsukagoshi, K.; Zhang, Z.; Dresselhaus, M. S.; Saito, R. Phys.Rev. B: Condens. Matter Mater. Phys. 2015, 91 (20), 205415.(39) Sun, Y.; Wang, Y.; Sun, D.; Carvalho, B. R.; Read, C. G.; Lee, C.H.; Lin, Z.; Fujisawa, K.; Robinson, J. A.; Crespi, V. H.; Terrones, M.;Schaak, R. E. Angew. Chem., Int. Ed. 2016, 55 (8), 2830−4.(40) Cho, S.; Kim, S.; Kim, J. H.; Zhao, J.; Seok, J.; Keum, D. H.;Baik, J.; Choe, D.-H.; Chang, K. J.; Suenaga, K.; Kim, S. W.; Lee, Y. H.;Yang, H. Science 2015, 349 (6248), 625−628.(41) Mak, K. F.; Lee, C.; Hone, J.; Shan, J.; Heinz, T. F. Phys. Rev.Lett. 2010, 105 (13), 136805.(42) Carvalho, A.; Ribeiro, R. M.; Castro Neto, A. H. Phys. Rev. B:Condens. Matter Mater. Phys. 2013, 88 (11), 115205.(43) Wang, Y.; Ou, J. Z.; Chrimes, A. F.; Carey, B. J.; Daeneke, T.;Alsaif, M. M.; Mortazavi, M.; Zhuiykov, S.; Medhekar, N.; Bhaskaran,M.; Friend, J. R.; Strano, M. S.; Kalantar-Zadeh, K. Nano Lett. 2015, 15(2), 883−90.(44) Christodoulides, D. N.; Khoo, I. C.; Salamo, G. J.; Stegeman, G.I.; Van Stryland, E. W. Adv. Opt. Photonics 2010, 2 (1), 60.
Journal of the American Chemical Society Article
DOI: 10.1021/jacs.6b13238J. Am. Chem. Soc. 2017, 139, 2504−2511
2511