chemistry f336
TRANSCRIPT

1 | P a g e
Individual Investigation
Report (F336)
Kinetics of the Reaction between bromate (V) Bromide and Hydrogen ions
By Charles Ross
Kinetics of the reaction between Bromate (V), Bromide and Hydrogen ions,By Charles Ross

2 | P a g e
AimThe Aim of my investigation is to measure how the concentration of Potassium Bromide affects the rate of reaction when added to a solution of sulphuric acid, Potassium Bromate (V) and Phenol.The equation that represents the concentration of the solution affected by Potassium Bromide is:
BrO3- (aq) + 5Br- (aq) + 6H+ (aq) 3Br2 (aq) + 3H20 (l)
I am going to alter the concentrations of the Potassium Bromide, Potassium Bromate and the sulphuric acid so that I am able to find the rate of reaction with respect to each individual reactant. From this I can derive the rate equation,
Rate = K [Br-] [BrO3-] [H+]2
I am also going to investigate the effect that temperature has on the rate of reaction as well as the rate constant and use the Arrhenius equation to work out the activation enthalpy of this reaction.
Background information
The rate of a reaction is the speed at which the reactants react together to produce the product or products of that reaction. To measure the rate of reaction several different types of measurements have to be measured as the rate of reaction cannot be directly measured.To measure the rate of reaction, there are four factors that are of concern to me that affect the rate of reaction, these are:
Temperature Concentration Presence of a catalyst Pressure (gases)
To fully understand what happens when changing a concentration of a reactant, the collision theory must be referred to. The collision theory states that when suitable particles of the reactant hit with each other, only a certain percentage of the collisions cause any noticeable or significant chemical change; these successful changes are called successful collisions. The successful collisions have enough energy, also known as activation energy. This results in the products of the reaction. Increasing the concentration of the reactant particles will bring about more collisions and therefore many more successful collisions, increases the rate of reaction. My diagrams below will demonstrate this effect.
Kinetics of the reaction between Bromate (V), Bromide and Hydrogen ions,By Charles Ross

3 | P a g e
Increasing the temperature will increase the velocity of the particles meaning that they will have more energy. This increase of energy means that they will collide more often and as a result of this, more successful collisions will take place. Temperature has a large influence on the rate of reaction. Strictly speaking a 10oc rise in temperature will result in the rate being doubled. Increasing the temperature will significantly reduce the activation energy needed for the reaction to proceed. Increasing the temperature means that the amount of molecules colliding with this amount of energy will increase significantly increasing the rate of reaction. The distribution of the different kinetic energies can be represented on a diagram known as the Maxwell-Boltzmann distribution. (Graph 1)
My graph shows how the Maxwell-Boltzmann Distribution is affected by temperature. At lower temperatures, the molecules have less energy. Therefore, the speeds of the molecules are lower and the distribution has a smaller range. As the temperature of the molecules increases, the distribution flattens out. Because the molecules have greater energy at higher temperature, the molecules are moving faster.
The presence of a catalyst A catalyst is a substance which speeds up a reaction by providing an alternative route of reaction but is chemically unchanged at the end of the reaction. When the reaction has finished, you would have exactly the same mass of catalyst as you had at the beginning of the reaction. To increase the rate of a reaction, you would need to increase the amount of successful collisions within the reaction by providing an alternative route for the reaction to occur.
The concentration of Potassium Bromide solution will be varied first. I will then have a table of results with concentration and time. I need to calculate reaction rate but I cannot measure the amount of products produced directly. To get around this problem methyl orange has been added to the mixture. The reaction will therefore be studied as a clock reaction. The first bromine formed will be destroyed by reaction with Phenol, which is also deliberately added to the mixture to allow us to study the reaction.
Kinetics of the reaction between Bromate (V), Bromide and Hydrogen ions,By Charles Ross
(Reference 6)

4 | P a g e
Calculating the rate of reaction is going to be difficult because I cannot directly measure the amount of bromine produced from the reaction in a certain time. To overcome this problem I will be studying the reaction as a clock reaction. This reaction can be represented as,
During the reaction, the Phenol is used up which means that the remaining bromide can then react to turn the indicator colourless. Due to the Phenol being used up, I will use the same amount of Phenol in each reaction to keep the experiment fair otherwise the taken for the indicator to turn colourless would be altered accordingly. The amount of bromine needed to decolourise the methyl orange is the same in each reaction, so that the rate of reaction is proportional to the reciprocal of the reaction time. (Graph 2)
A zero order graph would show a straight line across from the y axis running parallel with the x axis as shown in graph 2. A first order graph is a straight line where the rate of reaction is directly proportional to the concentration of the reactants. This is shown by a straight line with a constant gradient which passes through the origin. Finally a second order graph is a line that passes through the origin but is a curve which gets dramatically steeper as the concentrations increase. From this graph I can determine the rate equation for my reaction with respect to each reactant. If my graph shows a zero order graph, rate = K[X] 0. This means that the rate of reaction = K. this means that the concentration in the reaction with have no effect on the rate and therefore has no overall effect on the rate equation.If my graph showed a first order reaction, the rate equation for that particular chemical would be, rate=K [A]x where x would be 1 and A the concentration of the reactant. If my graph showed a second order reaction, the rate equation for that substance would be, rate = K [B]y where y would act as a power of 2 and B the concentration of that reactant. To work out the overall order of reaction you would combine X+Y together. Over the course of my project I intend to prove that the rate equation is:
Rate = K [Br-] [BrO3-] [H+] 2
For me to be able to prove this rate equation, I will have to conduct a series of experiments and alter the concentration of the different reactants one by one in different experiments. K is the rate constant of the reaction. This constant cannot be changed by changing concentrations but can be altered by different temperatures. Maxwell and Boltzmann came up with a theory for the distribution of kinetic energies using the probability theory and the kinetic theory of gases. They calculated the fraction of molecules with energy greater than the activation energy, Ea.
Kinetics of the reaction between Bromate (V), Bromide and Hydrogen ions,By Charles Ross

5 | P a g e
Determination of the activation energy for the reaction between bromide, bromate (V) and hydrogen ions
During a reaction, bonds are first broken, and others are then formed. Particles will not react if they do not possess a certain amount of energy for the appropriate bonds to break. This certain amount of energy is called activation energy. Using the Arrhenius equation I can work out my activation energy of my experiment once I have found my rate constant.k = A e-Ea/RT
Where, R is the gas constant (8.314462175 J K-1 mol-1) and T is the absolute temperature. At a given temperature rate of reaction is proportional to e-Ea/RT since the rate constant k is a measure of reaction rate we can write k is proportional too e-Ea/RT OR k = A e-Ea/RT
K= Rate constantT= Absolute temperature (K)A= Pre-exponential factorEa= Activation energyR= universal gas constantTaking the log form of the equation, ln k = ln A – Ea/RT and then Rearranging in the form y = mx + cln k = -Ea/R x 1/T + ln AA value for rate can now be substituted for ln k. So a graph of ln k against 1/T should be a Straight line with gradient -Ea/R. From this gradient activation energy can be calculated.
Apparatus and Making required solutions for experimentsFor these experiments I will need:
Four burettes Five 250ml beakers five beakers 250ml White tiles Magnetic stirrer and stirring rod. Eighteen Volumetric flask 250ml Stopwatch Water baths one large beaker 500ml ten boiling tubes Ice cubes Two thermometers Rubber gloves/chemical resistant gloves Lab coat Water bath Clamp stand Burette clamp Funnel Eighteen storage bottles
Kinetics of the reaction between Bromate (V), Bromide and Hydrogen ions,By Charles Ross
(Reference 7)
(Reference 8)
6 | P a g e
Two one litre volumetric flasks Weighing boat Three 50ml flasks
Making required solutions.The equation I will be using to work out the mass of solid to add to make desired concentrations is;Mass of solid (g) = Chemical RFM x desired volume x desired concentrationMass of solid (g) =chemical RFM x 250x10-3 x Desired concentration Potassium Bromate (V) RFM= 167 0.01 Mol-1 dm3 Potassium Bromate (V) solution167 x 250x10-3 x 0.01 = 0.4175g0.009 mol-1 dm3 Potassium Bromate (V) solution167 x 250x10-3 x 0.009 = 0.37575g0.008 mol-1 dm3 Potassium Bromate (V) solution167 x 250x10-3 x 0.008 = 0.334g0.007 mol-1 dm3 Potassium Bromate (V) solution167 x 250x10-3 x 0.007 = 0.29225g0.006 mol-1 dm3 Potassium Bromate (V) solution167 x 250x10-3 x 0.006 = 0.2505g0.005 mol-1 dm3 Potassium Bromate (V) solution167 x 250x10-3 x 0.005 = 0.20875g
Potassium Bromide RFM = 119
0.01mol-1dm3 Potassium Bromide solution119 x 250x10-3 x 0.01 = 0.2975g0.009 mol-1dm3 Potassium Bromide solution119 x 250x10-3 x 0.009 = 0.26775g0.008mol-1dm3 Potassium Bromide solution119 x 250x10-3 x 0.008 = 0.238g0.007mol-1dm3 Potassium Bromide solution119 x 250x10-3 x 0.007 = 0.20825g0.006 mol-1dm3 Potassium Bromide solution119 x 250x10-3 x 0.006 = 0.1785g0.005 mol-1dm3 Potassium Bromide solution119 x 250x10-3 x 0.005 = 0.14875g
Making up concentrations of sulphuric acidSulphuric acid doesn’t come as a solid so a different equation had to be used.I didn’t use an equation; I worked out the volumes of water and sulphuric acid by using ratios.1.0mol-1dm3 = 250cm3 sulphuric acid0.9mol-1dm3 = 225cm3 sulphuric acid and 25cm3 deionised water0.8mol-1dm3 = 200cm3 sulphuric acid and 50cm3 deionised water
Kinetics of the reaction between Bromate (V), Bromide and Hydrogen ions,By Charles Ross

7 | P a g e
0.7mol-1dm3 = 175cm3 sulphuric acid and 75cm3 deionised water0.6 mol-1dm3 = 150cm3 sulphuric acid and 100cm3 deionised water0.5mol-1dm3 = 125cm3 sulphuric acid and 125cm3 deionised water
Making up 0.0001mol-1dm3 Phenol solutions was more difficult to make up because the amount of solid needed for this extremely low concentration couldn’t be measured on our scales at school. Mass of solid (g) =chemical RFM x desired volume of solution x Desired concentration of solutionPhenol RFM = 9494 x 1 x 0.0001 = 0.094gAfter working out the mass for a 0.001moldm3 solution, I took 100cm3 of the 0.001moldm3 solution and added 900cm3 of deionised water to lower the concentration to 0.0001moldm3
Kinetics of the reaction between Bromate (V), Bromide and Hydrogen ions,By Charles Ross

8 | P a g e
Method for investigating the effect of changing concentration1.Take 4 burettes and wash them out with water and then wash them through with the solutions. Label each burette with Potassium Bromate (V) solution, Sulphuric acid, Potassium Bromide and Phenol and fill the corresponding burette.2. Add 50cm3 of Potassium Bromate (V) solution, 50cm3 Potassium Bromide solution, 50cm3 of sulphuric acid solution and 50cm3 of Phenol solutions added to the burettes. Run out 10cm3 of both Potassium Bromate (V) and Phenol solution. Add 15cm3 of sulphuric acid to the beaker. Add 5 drops of methyl orange indicator to the beaker and stir to make sure the methyl orange is spread out within the mixture and that the reactants have mixed and aren’t concentrated in certain areas.3. 10cm3 of Potassium Bromide solution of the required concentration is added to another beaker. This is because the reaction would immediately start if added to the other reactants. The Potassium Bromide solution is poured into the first beaker and the stopwatch is started. The complete mixture is stirred using a magnetic stirrer set at a speed of 5. This is kept constant as if made faster or slower would change the rate of the reaction. Measure the time taken for the mixture to turn completely colourless from pink. Place a white tile behind the reaction beaker so you can clearly see when the reaction has turned colourless.
4.The beakers are then washed out and dried and the experiment is repeated with varying concentrations of Potassium Bromide. After the different Potassium Bromide concentrations are complete, keep the bromide concentration constant at 0.01mol-1 dm3 and vary the concentrations of bromate (V) solution always adding the same volume of each reactant. After bromate (V) ions are complete, keep them at a constant concentration of 0.01mol-1 dm3 and then vary the concentrations of sulphuric acid. The Phenol solution always remains at a constant 0.0001 mol-1 dm3 and 10cm3 is used.
Kinetics of the reaction between Bromate (V), Bromide and Hydrogen ions,By Charles Ross

9 | P a g e
Method for investigating the effect of temperaturePreheat a water bath just above the temperature of the desired temperature for doing the reaction. This will help heat up the reactants in the conical flask.2.Set up the apparatus as you would if you were investigating the change in concentration. Set up four burettes filled with the individual reactants in each. Before doing so, remember to wash out the burettes with deionised water and then with the substance going to be placed in that burette. This washes out any impurities and then water so the reactant isn’t contaminated.3.Run out the desired amounts of reactants into a conical flask making sure that the Bromide is run into a separate container. Add five drops of methyl orange indicator into the conical flask with the Potassium Bromate (V), sulphuric acid and Phenol in and stir to make sure it is evenly distributed around the flask.4.Place the reactants into the water bath making sure they are anchored down by a clamp in the water to prevent them from floating and place a thermometer in each flask as well as the water.5.Wait until the reactants are at the desired temperature for your reaction to take place and then add the Potassium Bromide solution to the other solution but do not stir the solutions. This will change results dramatically.6.Time how long it takes for the methyl orange indicator to turn form pink to colourless. To make the most accurate judgement, place a white tile behind the reaction vessel.7.Repeat this process until 2 or more results are concordant with each other.Do not alter the concentrations for a different experiment, only alter the temperature. Do six different temperatures which are very different from each other to get a good variety of result8.For the lower temperature reactions, follow the same procedure but place reaction vessel in an ice bath to lower the temperature until the correct reaction temperature is reached and then proceed as normal.
Kinetics of the reaction between Bromate (V), Bromide and Hydrogen ions,By Charles Ross

10 | P a g e
Risk Assessment
Risk assessment for Potassium Bromate (V) for a concentration of 0.1moldm-3
Type of Hazard Acute Hazards/symptoms
Prevention of hazard Solving hazard
Fire Not combustible but increases the combustion of other materials. Give off toxic gas in a fire.
Avoid contact with flames. Should be kept sealed when not in use.
Large quantities of water.
Inhalation Coughing, tight chest and sore throat.
Keep face covered and use necessary apparatus such as fume cupboard or breathing apparatus.
Seek immediate medical attention. Fresh air in large quantities.
Contact with skin Can cause itching and redness. In large quantities and skin exposed for a long time period, blisters/burns could form. Long term, could cause cancers. Category 2 carcinogen.
Wear protective clothing and gloves to prevent coming into contact with skin.
Rinse with plenty of water. Remove contaminated clothing and rinse again. Seek medical attention.
Contact with eyes Extreme itching, redness and slight loss of vision
Suitable eye protection should be worn
Rinse with water for several minutes with cold water and then seek medical advice immediately.
Ingestion Stomach cramps, vomiting, dizziness and diarrhoea.
Don’t drink or eat in the lab and thoroughly wash hands before eating.
Wash out mouth thoroughly. Drink a mixture of water and activated charcoal. Refer to medical attention.
Spillage n/a n/a Don’t wipe with a combustible material. Sweep into a container ready for disposal.
Storage n/a Should be kept in a chemical container.
n/a
Kinetics of the reaction between Bromate (V), Bromide and Hydrogen ions,By Charles Ross
(Reference 4)

11 | P a g e
Risk assessment for Phenol at a concentration of 0.0001moldm-3
Type of Hazard Acute hazard/symptoms
Prevention of hazard Solving hazard
Fire Combustible. Keep away from flames and from strong oxidants.
Carbon dioxide and or water spray.
inhalation Shortness of breath, burning sensation, headache nausea and vomiting, dizziness and possibility of unconsciousness.
Good ventilation and breathing equipment if required for strong concentrations.
Fresh air and seek immediate medical attention.
Contact with skin Redness, extreme burning sensation if exposed for a prolonged period of time and numbness.
Wear protective clothing including chemical or latex gloves to avoid contact with skin.
Poor glycerol onto the area of skin and leave for 30 seconds. Remove contaminated clothing and shower thoroughly. seek medical advice
Contact with eyes Burning sensation, redness, partial loss of vision or permanent loss of vision if exposed for a long period of time.
Wear eye protection and if strong concentrations, work in fume cupboard to prevent vapour entering eyes.
Rinse with plenty of warm water and then seek medical advice.
ingestion Corrosive may cause abdominal pain and cramps. May cause shock and produce dark green urine.
Don’t drink or eat in the lab and thoroughly wash hands before eating.
Wash hands well before eating. Drink lots of water and seek medical advice.
spillages n/a n/a pour glycerol onto the area contaminated to absorb remaining Phenol then wipe down thoroughly with cloth and dispose accordingly.
Storage n/a Keep in chemical resistant container in glass bottle. Keep away from water supply and in a well-ventilated area.
n/a
Kinetics of the reaction between Bromate (V), Bromide and Hydrogen ions,By Charles Ross
(Reference 1)

12 | P a g e
Risk assessment for sulphuric acid at a concentration of 1moldm-3
Type of hazard Acute hazards /symptoms
Prevention of hazard Solving hazard
Fire Not combustible. In a fire produces toxic gases and many reactions could lead to fire or even explosions.
No contact with combustible materials.
No water, use carbon dioxide to extinguish a fire.
inhalation Corrosive and irritant, burning sensation and shortness of breath.
Well ventilated room and a big work area so concentrations can dissipate throughout.
Fresh air for a long period of time. Seek medical advice.
Contact with skin Corrosive and irritant. Causes severe skin burns if in contact for a long period of time. Blisters and redness.
Protective clothing and chemical resistant gloves if making from a high concentration. Latex gloves.
Remove contaminated clothing and shower. Seek medical advice.
Contact with eyes Corrosive and irritant. Cause severe redness and burning sensation. Partial loss of vision.
Wear eye protection at all times and if high concentrations used, fume cupboard of breathing equipment should be used.
Rinse with plenty of water then go to a doctor or hospital if needed.
ingestion Corrosive and irritant, causes burning sensation and may lead to shock.
Don’t drink or eat in the lab and thoroughly wash hands before eating.
Rinse mouth with water several times and seek medical advice.
spillages Corrosive, burn through materials over time
n/a Sweep into a container and dispose of substance in a safe manor.
Storage n/a Store in a chemical resistant container in a glass bottle. Alternatively stored in a stainless steel container. Keep away from all combustible materials, bases, feedstuffs and water supply.
n/a
Kinetics of the reaction between Bromate (V), Bromide and Hydrogen ions,By Charles Ross
(Reference 2)

13 | P a g e
Risk assessment for Potassium Bromide
The risks for Potassium Bromide are pretty much negligible because I will be using it in very low concentrations. However safety precautions still have to be taken. Eye protection should be worn at all times when handling the substance and latex gloves should be warn as a safety provision. Potassium Bromide can cause some issues if ingested so be sure to wash hands before eating and also reframe from eating or drinking in the lab.
Risk assessment for Methyl orange indicator
Harmless substance but if swallowed can become harmful to the body so again reframe from eating or drinking in the lab and wash hand thoroughly before meals. Make sure eye protection is used before handling substance. Wash eyes thoroughly if it comes in contact and seek medical advice.
Working out the rate of the different concentrations of Potassium Bromide solutionKinetics of the reaction between Bromate (V), Bromide and Hydrogen ions,By Charles Ross
(Reference 3)

14 | P a g e
Bromide is always in excess so will not become the limiting factor in rate. To calculate the total amount of Br2 that can be produced by each mixture (moles) I need to know how much Bromate (V) is present in each reaction (Br-) is in excess.
0.01 Bromate (V) used:
0.01 moldm-3 stock conc.
10cm3 used.
Moles = 0.01/1000 x 10 = 1x10⁻⁴ BrO3- moles.
5Br- + BrO3- + 6H+ 3Br2 + 3H20
Maximum amount of Br2 possible to make = 3x10⁻⁴
Moles of Phenol added:
Stock = 0.0001 moldm-3
10cm3 added
Moles = 0.0001 / 1000 x 10 = 1x10⁻⁶ moles of Phenol
Amount of Br2 used by Phenol during reaction
C6H5OH + 3Br2 C6H2Br3OH + 3HBr
Every time I did the reaction I used 3x10⁻⁶ moles Br2 before it changed colour. Percentage of reaction investigated,
Percentage = 3x10⁻⁶ / 3x10-4 x 100 = 1 % very small
Initial rate of reaction = 3x10⁻⁶/time (s) to turn colourless = mol/s
From this equation above I can work out the rate of reaction for all my different concentrations of Potassium Bromide solution.
Kinetics of the reaction between Bromate (V), Bromide and Hydrogen ions,By Charles Ross
3x10⁻⁴ moles of Br21x10-4 moles Excess
3x10⁻⁶ moles of Br21x10-6 moles

15 | P a g e
seconds (S)concentration(mol dm-3) 1 2 3 4 average0.01 7.12 7.16 7.32 7.200.009 7.51 7.38 8.03 7.640.008 9.73 9.05 9.15 9.310.007 10.41 10.61 10.70 10.570.006 30.83 20.63 20.54 20.37 20.510.005 93.80 46.18 93.84 93.43 93.69
(Table 1) (Graph 3)
From Table 1 above, I have decided not to include the final value of rate as I believe it to be anomalous and down to some sort of error during the experiment.
As the same concentrations and volumes of Potassium Bromate (v) solution were used as Potassium Bromide, the same equation can be used to work out the rate of reaction for the solution.
seconds (S)
concentration 1 2 3 4 averag
Kinetics of the reaction between Bromate (V), Bromide and Hydrogen ions,By Charles Ross
Concentration of Potassium Bromide (Moldm-3)
Rate of Reaction (mol dm-3s-1)
0.01 4.17x10⁻⁷
0.009 3.93 x10⁻⁷
0.008 3.22 x10⁻⁷
0.007 2.84 x10⁻⁷
0.006 1.46 x10⁻⁷
0.005 3.20 x10⁻⁸

16 | P a g e
(moldm-3) e0.01 8.03 7.80 7.94 7.92
0.009 8.78 8.58 8.48 8.61
0.008 8.74 8.59 9.41 8.91
0.007 11.57 11.07 11.47
11.37
0.006 13.71 13.99 14.13
13.94
0.005 19.40 18.93 19.33
19.22
(Table 2) (Graph 4)
Concentration of Potassium Bromate (V) (Mol dm-3)
Rate of Reaction (Mol dm-3S-1)
0.01 3.79x10⁻⁷
0.009 3.48 x10⁻⁷
0.008 3.37 x10⁻⁷
0.007 2.64 x10⁻⁷
0.006 2.15 x10⁻⁷
0.005 1.56 x10⁻⁷
However for the different concentrations of Potassium Bromate (V) a different percentage of the reaction was investigated due to the different ratios in balancing the equation. A ratio of 5:3 meant that a maximum of 6x10⁻⁵ Br2 moles were made. Therefore the percentage of reaction investigated was % = 3x10⁻⁶/6x10-5 x 100 = 5% for changing the concentration of the sulphuric acid I used the same method to work out the rate.
(Table 3)(Graph 5)
Kinetics of the reaction between Bromate (V), Bromide and Hydrogen ions,By Charles Ross

17 | P a g e
Due to successfully working out the rate of the different concentrations I can plot three graphs of concentration on the X axis and rate on the Y axis. From this I will be able to determine the order of the reaction with respect to each reactant due to the shapes of the individual graphs.
From the three graphs previously, you can clearly see that they show distinct lines of which the Potassium Bromide and Potassium Bromate (v) are straight lines and the graph representing the data from sulphuric acid is an increasing curve. These graphs represent two first order reactions and one second order reaction. From this I am able to derive a rate equation and try and prove the rate equation I researched at the beginning.
Concentration (mol dm-3) Seconds (S)1 2 3 4 average
1.00 7.50 7.62 7.07 7.400.90 11.03 11.52 11.65 11.400.80 16.89 15.31 16.27 16.160.70 16.59 15.44 16.66 16.230.60 24.09 23.89 23.84 23.940.50 25.33 24.97 25.07 25.12
concentration (mol dm-3) Rate of reaction (moldm-3S-1)
1.00 4.08x10⁻⁷
0.90 2.65x10⁻⁷
0.80 1.87x10⁻⁷
0.70 1.86x10⁻⁷
0.60 1.26x10⁻⁷
0.50 1.20x10⁻⁷
Kinetics of the reaction between Bromate (V), Bromide and Hydrogen ions,By Charles Ross
(Reference 10)

18 | P a g e
Graph one which represents the rate concentration data for Potassium Bromide displays a line which has a constant gradient and passes through the origin. This means that during the reaction, this reactant reacts as a first order reactant. This there for means that in the rate equation it would be represented as follows;
R = K [Br]
In this graph I however had two results which didn’t fit any pattern of order reaction graphs and therefore I could count them as anomalous results and ignore them from my line of best fit. I believe that these stray results may have been caused due to multiple experimental errors of which I cannot pin point to be the exact cause.
Graph two displays the data for the rate concentration data for Potassium Bromate (v) solution. On the graph the line of best fit clearly displays a constant gradient which starts at the origin. This indicates that the reaction was a first order reaction with respect to the Potassium Bromate (V) solution. This then can be placed in the rate equation in the same form the Potassium Bromide was.
R = K [Br-] [BrO3-]
Graph three displays the results for the rate concentration data for the sulphuric acid. On the graph, the line of best fit is displayed as a increasing gradient curve. This means that the reaction order with respect to the sulphuric acid is a second order reaction when the concentration was changed. From this line, we can place the hydrogen ions into the rate equation.
R = K [Br-] [BrO3-] [H+] 2
From this rate equation I know that my results were correct because this was the rate equation which I was investigating and trying to prove from the beginning. My graphs clearly indicate the correct order of reaction with respect to the individual reactants in the investigation.
As I have now successfully proved my rate equation I have to determine the rate constant for the rate equation. The rate constant is a constant for a given reaction at a particular temperature. Using my concentrations of the reactants at a certain temperature, I should be able to calculate the rate constant.
[Br-] = 0.01moldm-3
[BrO3-] = 0.01moldm-3
[H+]2 = 12 = 1moldm-3
From my temperature results displayed in results table 4 I was able to work out the rate by dividing 1 by the average time for the solution to turn colourless. This is how I was able to work out my rate at room temperature assuming room temperature was roughly 200C.
Kinetics of the reaction between Bromate (V), Bromide and Hydrogen ions,By Charles Ross

19 | P a g e
Rate = 1/T
= 1/10.51 = 0.095s-1
Rate = k [Br-] [BrO3-] [H+] 2
To work out the rate constant for the rate equation above you need to rearrange the equation to show;
Reaction rate[Br-][BrO3-][H+] 2 = K
Lower concentrations were used in the temperature reaction because from my research if the concentrations were at a max, the higher temperature reactions would have been difficult to time accurately due to the speed of the reaction.From this equation, you put the rate of reaction on the top and the concentrations used underneath remembering to square the concentration of the sulphuric acid because of its second order nature.
0.0950.008 x 0.008 x 1.02 = K
K= 1484.375
The units of K vary for every reaction depending on how many concentrations are used and also the temperature at which the reaction takes place. In this instance the units of K can be derived from the original equation.
(Moldm-3) Seconds-1
(Mol dm-3) (Mol dm-3) (Mol dm-3)2 = units of K
K = 1484.375 S-1 Mol-3 dm9
Calculating activation enthalpy using the Arrhenius equation
With my set of results that I recorded when changing the temperature, I can use the Arrhenius equation to determine the activation enthalpy for the reaction.
At a given temperature the rate of reaction is proportional to e-Ea/RT
Where, Ea is the activation enthalpy of the reaction; R is the universal gas constant of 8.314462175JK-1Mol-1
T is the absolute temperature in kelvin and e is a known constant of 2.718281828 Kinetics of the reaction between Bromate (V), Bromide and Hydrogen ions,By Charles Ross

20 | P a g e
In the equation K can represent the rate of reaction.
Therefore K = A e-Ea/RT
This equation is known as the Arrhenius equation where A is the Arrhenius constant. The Arrhenius constant can be considered as a collision frequency and orientation factor in the rate of reaction. To begin to solve the equation, you have to take natural logs of the equation.
This forms the equation, ln K = ln A – Ea/RT
To make the equation more simple to work with, rearrange the equation into the form Y = MX+C.
Therefore, ln K = -Ea/R x 1/T + ln A
As I’ve put the equation in the form of Y = MX+C I can now plot a graph of ln K against 1/T and the gradient is constant and equals –Ea/R
Seconds (S)
Temperature (0C)
1 2 3 4 average time to go colourless (s)
rate = 1/T (seconds-1)
30 3.93 3.94 3.60 3.82 0.26
25 8.91 8.68 7.86 8.48 0.12
20 10.56 10.11 10.87 10.51 0.095
15 13.13 13.23 13.93 13.43 0.074
10 16.78 17.84 17.34 17.32 0.058
5 29.16 27.93 29.98 29.32 29.49 0.034
Kinetics of the reaction between Bromate (V), Bromide and Hydrogen ions,By Charles Ross
(Reference 5)

21 | P a g e
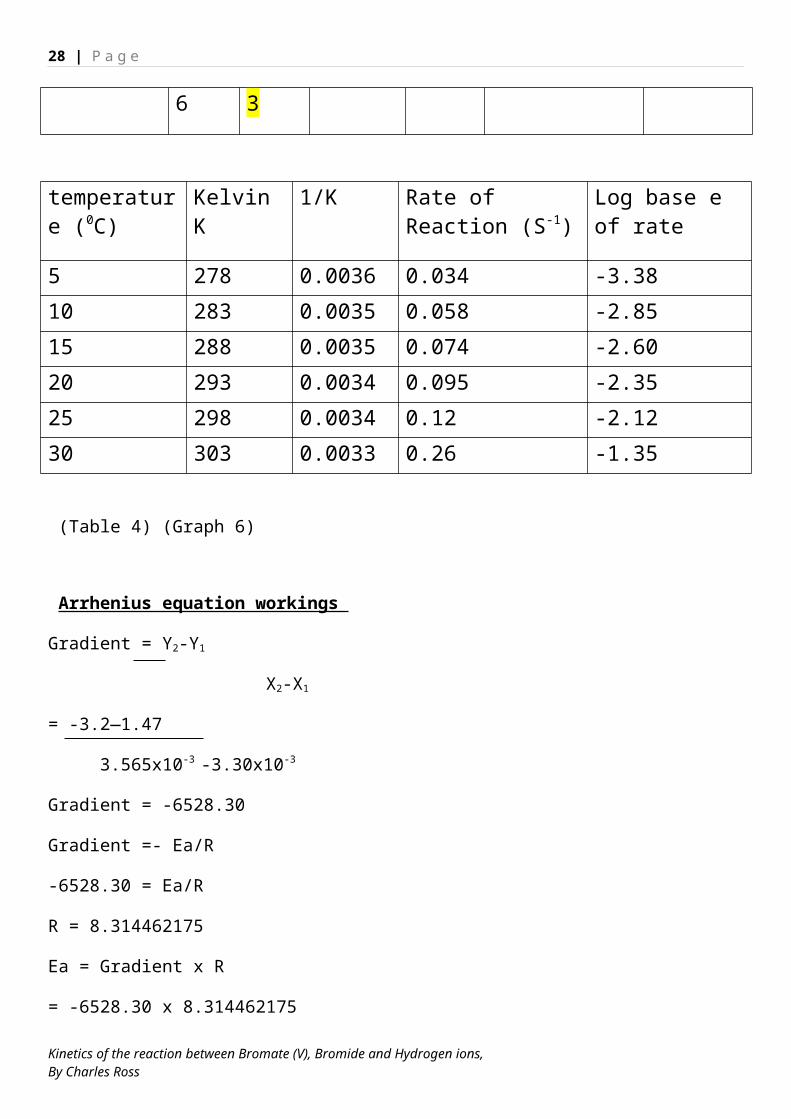
(Table 4) (Graph 6)
Arrhenius equation workings
Gradient = Y2-Y1
X2-X1
= -3.2—1.47
3.565x10⁻³ -3.30x10⁻³
Gradient = -6528.30
Gradient =- Ea/R
-6528.30 = Ea/R
R = 8.314462175
Ea = Gradient x R
= -6528.30 x 8.314462175
= -54279.3191
= 54279.3191 J Convert to KJ moles-1 = 54.2793191 KJ moles-1 = 54.3 KJ mol-1
Kinetics of the reaction between Bromate (V), Bromide and Hydrogen ions,By Charles Ross
temperature (0C)
Kelvin K 1/K Rate of Reaction (S-
1)Log base e of rate
5 278 0.0036 0.034 -3.38
10 283 0.0035 0.058 -2.85
15 288 0.0035 0.074 -2.60
20 293 0.0034 0.095 -2.35
25 298 0.0034 0.12 -2.12
30 303 0.0033 0.26 -1.35

22 | P a g e
Evaluation
Overall my experiments in investigating the change in temperature and the change in concentration were reliable and produced accurate results. My graphs however do display some anomalous results and in my evaluation I will try and identify the errors which caused these results and suggest the reasons for these.
My Method was recorded in the planning stage of my section. This method was used in my actual experiment but some alterations were made to make the experiment more reliable and accurate. A factor in my experiment which was hard to determine was the end point of the reaction when the solution turned colourless. To make it easier to judge, a white tile was placed behind the reaction vessel to make it easier to identify. The method for changing the concentrations was always the same and making up the different concentrations was constant apart from the Phenol solution.
Precision, reliability and percentage error
During the experiment reliability and precision had to be accounted for all the time during the experiment. All equipment used in my experiment had stated errors provided on the glassware.
Burette error ±0.1cm3
25cm3 pipette ±0.06cm3
250cm3 volumetric flask ±0.15cm3
Scales ± 0.005g 1000cm3 volumetric flask ±1.00cm3
Thermometer ±0.5oC
This is the equations used to work out the percentage error on measurements.
Percentage error = error of equipment
Measurement
During my experiment making up different amounts of solutions is where the largest error would have come into my investigation; however the error wouldn’t have been large enough to have considerable effects on the results. Using the equation above, I can calculate the errors in making up a solution.
Kinetics of the reaction between Bromate (V), Bromide and Hydrogen ions,By Charles Ross
X100

23 | P a g e
Percentage error calculation for making up a 250cm3 solution of 0.01 mol dm-3 potassium bromide solution:
0.005g / 0.2975g = 0.0168
0.0168 x 100 = 1.68%
That error calculation is for the error on measuring out the solid using the scales.
0.15 / 250 = 0.0006
0.0006 x 100 = 0.06 %
That is the error in the measurement of filling up a 250ml volumetric flask with distilled water. So overall the total error on making a solution of 0.01 mol dm-3 potassium bromide solution is,
1.68% + 0.06% = 1.74%
The next stage is measuring out a certain volume of solution. Here is where errors such as transfer error and parallax error play a part. The error on a 50cm3 burette is ± 0.1 cm3. So when I measured 10cm3 of potassium bromide solution out the error is;
0.1 / 10 = 0.010.01 x 100 = 1%
So overall the percentage error for making and measuring out required volumes of solution comes to and error of 2.74 % which is very small and can be ignored in all the results as it will have no considerable effect. This is the method you’d use to calculate the percentage error for all the production of solutions and measuring out desired volumes.
Error table for creating desired solutions and measuring out desired volume of solution for Potassium Bromide solution
Concentration (mol dm-3)
Mass of solid (g)
Volume of reactant measured using burette (cm3)
Error on weighing and dissolving solid in 250cm3 volumetric (%)
Error on measuring out desired volume using a burette (%)
Total Error (%) (column 4 and 5 added together)
0.01 0.29750 10 1.74 1 2.740.009 0.26775 10 1.93 1 2.930.008 0.23800 10 2.16 1 3.160.007 0.20825 10 2.46 1 3.460.006 0.17850 10 2.86 1 3.860.005 0.14875 10 3.42 1 4.42
Kinetics of the reaction between Bromate (V), Bromide and Hydrogen ions,By Charles Ross

24 | P a g e
Error table for creating desired solutions and measuring out desired volume of solution for Potassium Bromate (V) solution
Concentration (mol dm-3)
Mass of solid (g)
Volume of reactant measured using burette (cm3)
Error on weighing and dissolving solid in 250cm3 volumetric (%)
Error on measuring out desired volume using a burette (%)
Total Error (%) (column 4 and 5 added together)
0.01 0.41750 10 1.20 1 2.200.009 0.37575 10 1.33 1 2.330.008 0.33400 10 1.50 1 2.500.007 0.29225 10 1.71 1 2.710.006 0.25050 10 2.00 1 3.000.005 0.20875 10 2.40 1 3.40
The sulphuric acid percentage error was worked out differently because the sulphuric acid came as a liquid instead of a solid so scales weren’t needed. Instead, using a burette with an error of ±0.1cm3 I measured out the volumes of sulphuric acid into a volumetric flask with the same error as before. The calculations are as follows;
0.1 / 50 = 0.002
0.002 x 100 = 0.2%
Then you would multiply this number buy how many burettes were required to make up the desired volume in the volumetric flask. In this case, the whole volumetric was of 1 mol dm-3 sulphuric acid solution so the error of the volumetric flask doesn’t need to be accounted for.
0.2 x 5 = 1% error
When transferring from burette to reaction vessel, another percentage error is calculated which is constant throughout as the volume doesn’t change using the error of the burette over volume measured;
0.1 / 15 = 0.0066
0.0066 x 100 = 0.66%
Kinetics of the reaction between Bromate (V), Bromide and Hydrogen ions,By Charles Ross

25 | P a g e
However when you are making solutions of sulphuric acid of different concentrations, water is added to dilute it down but is measured using a burette. This means that for the creation of all the different concentrations of solutions, the error will be exactly the same as the total volume will always be 250cm3 and the error on the volumetric flask can be ignored as it just acts as storage and mixing device. Overall the total error for all the sulphuric acid solutions is constant at 1.66% due to the exact same way of production and equipment use.
Making the solutions is where the largest error occurred. The error of the scales and the error on the equipment used had to be taken into account. Roughly all the errors in making the solutions are around 3% ±1.5% if you take into account the scales and the error on measuring out the volumes of liquid. This percentage error is reasonably small and so won’t have significant effect on the results to cause the anomalous results circled on the graphs. Also you would have loss of substance due to transfer error, from weighing boats etc. but this wouldn’t have a significant influence on the results as it would be in tiny quantities.
To measure out my reactants, I have been using burettes over any other piece of experimental equipment. This is because a burette has the smallest percentage error and therefore is the most accurate when it comes to measuring reactants or solutions. The percentage uncertainty associated with a 50cm3 burette is ± 0.1cm3. When using a burette to measure out a volume of reactant or solution, I made sure that I read the measurement from the bottom of the meniscus. Also when reading the volume on a burette, I placed the clamp stand with my burette attached on a lab stool and sat on another to make sure that I was at eye level with the meniscus. This would then considerably reduce parallax error from my experiment.
When it came to making up different solutions of Potassium Bromate (V), Potassium Bromide and sulphuric acid, 250cm3 volumetric flasks were used which had an error of ±0.15cm3. Volumetric flasks were used instead of beakers because the error on a beaker is extremely high in comparison proving less accurate than a volumetric flask.
The scales which I used to measure out my solid had a very small error of ±0.005g which meant when weighing my solid out, it was extremely accurate. However when it came to measuring out the solid to make up the Phenol, the scales didn’t read down to a small enough number. This meant I had to place four times the amount of solid in a litre volumetric flask which had an error of ±1cm3. After mixing well, I poured 2x50cm3 into a burette and ran through into another 1 litre volumetric flask. The burette had an error of ±0.1cm3. I then added 900cm3 of deionised water to the solution to make up 0.0001Mol-1 dm3 solution of Phenol.
When making up all my solutions only a small amount of the reactants were taken from each volumetric flask. This meant that the concentration changed but each concentration was changed by an equal proportion so this would not have affected the shape of my graphs only the value of the points and the scales on both axis. Therefore I had to calculate the ‘actual concentration’ of the reactants. The method to find the actual concentration is reasonably straight forward.Kinetics of the reaction between Bromate (V), Bromide and Hydrogen ions,By Charles Ross

26 | P a g e
Example of calculation for Bromide concentrations:
1) Stock solution = 0.01mol dm-3
2) 1000cm3 = 0.01 moles of bromide ions
3) 1cm3 = 0.01/1000 = 1x10⁻⁵ mol dm-3
4) 10cm3 = 1x10-5 x 10 = 1x10⁻⁴ mol dm-3
5) Total volume of reaction vessel is 45cm3
6) 1000/45 = 22.2227) Actual concentration = 1x10-4 x 22.2228) = 2.2x10⁻³ mol dm-3 of bromide ions
Step 1 is the original solution you make up to use in your investigation in your volumetric flask. Step 2 is how you find the number of moles in 1000cm3 of solution. Step 3 is the calculation to find the concentration of solution for 1cm3 of the solution. Step 4 is finding the concentration for the volume of reactants you used in your reaction. For this stage, to find it for the sulphuric acid you would replace the 10cm3 with 15cm3 and times the moles by 15 instead of 10 to find the concentration. Step 5 is calculating the total volume of all reactants in your reaction vessel. Step 6 is finding a constant for this which is worked out as shown in the equation above. This is used as a constant to find the concentration of the volume of reactants used. For the concentrations of all the reactants, this will be the same because the volume added of all reactants is the same so the total volume of reactants will not change. This means that both Bromate and Bromide will have exactly the same stock and actual concentrations. Step 7 is multiplying the concentration of the volume of one reactant used by the constant number to find the actual concentration.
Table of Stock concentration and actual concentration for Bromide Ions
Stock Concentration Mol dm-3 Actual concentration Mol dm-3
0.01 2.20x10⁻³
0.009 1.99 x10⁻³
0.008 1.77 x10⁻³
0.007 1.55 x10⁻³
0.006 1.33 x10⁻³
0.005 1.00 x10⁻³
Table of stock concentration and actual concentration for Bromate (V) ions
Stock Concentration Mol dm-3 Actual concentration Mol dm-3
0.010 2.20x10⁻³
0.0090 1.99 x10⁻³
0.0080 1.77 x10⁻³
0.0070 1.55 x10⁻³
Kinetics of the reaction between Bromate (V), Bromide and Hydrogen ions,By Charles Ross

27 | P a g e
0.0060 1.33 x10⁻³
0.0050 1.00 x10⁻³
Table of stock concentration and actual concentration for Hydrogen Ions
Stock Concentration Mol dm-3 Actual concentration Mol dm-3
1.00 0.330.90 0.300.80 0.270.70 0.230.60 0.200.50 0.16
Each experiment I carried out was carried out 3 times or more, if the first two results were concordant then there was no need to do a third. Repeating my experiments increased the reliability of my results by showing me that within experimental error I was able to get almost the same result more than once. Averages can be taken from the number of trials of the experiment to produce a more reliable overall result. This average is then used in the calculation to work out the rate for that certain reaction.
This is still a small error which should not be a problem in the experiment. The errors associated with apparatus are often very small compared with those associated with procedures. It is difficult to find a value for errors included through procedures but the relative importance of them can be discussed.
Initial trials and investigations
The kinetics of the reaction between Potassium Bromate (V), Potassium Bromide and Sulphuric acid is a long time consuming reaction as it has to be studied as a clock reaction. For this reason I didn’t have time to do preliminary experiments to deduce possible errors from my experiment which might occur in my proper results. However I researched online how time consuming the reaction was and I planned my time wisely so that I didn’t have to cut out any reactions or repeats of reactions.
If time was on my side, I would have done several preliminary experiments to see which concentrations and temperatures where appropriate to investigate over the course of the project.
Kinetics of the reaction between Bromate (V), Bromide and Hydrogen ions,By Charles Ross
28 | P a g e
However as time was not of the essence, I read up about the best ways of going about stirring the reaction vessel. People have said that a magnetic stirrer was the most reliable method of mixing the solutions together as it gave an even speed of mixing the compound all around the reaction vessel.
To assure the temperature of the reactants was at the right temperature while investigating the temperature, a thermometer had to be placed in the water bath as well as the test tube to accurately measure the temperature of the reactants. When the reactants reached the required reaction temperature, I removed the thermometers and added the Potassium Bromide solution and started the clock. At the higher temperatures, I found that the reaction time went very fast and I was going to lower the concentrations down to slow the rate of reaction. However I didn’t choose to do this because at the lower temperatures of the reaction, the reaction took a considerable amount of time for the solution to go colourless and would have taken far too long to decolourise if the concentrations were lowered. Therefore I decided to use the following temperatures in my investigation:
50C 100C 150C 200C 250C 300C
I would have proceeded to do more temperature results to get a more accurate graph at the end of all the experiments but I was pushed for time so I chose the most appropriate temperatures which would give me a good idea of what the graph should look like.
In the reaction I was investigating, rate was an area I was studying and due to measuring the time taken for the mixture to turn colourless we had to study the reaction as a clock reaction because I couldn’t directly measure the amount of bromine produce in the reaction. Therefore the quicker the production of bromine in the reaction the greater the rate of reaction as rate = 1/reaction time. This method is the only method that properly works because the first bromine produced is used up in the reaction with the Phenol. After all the Phenol is used up, the bromine which is produced then decolourises the methyl orange indicator which triggers the clock reaction. Doing the experiment in this manner has its advantages because the amount of Phenol added is always constant and therefore the clock reaction is always a fair experiment. This method of reaction gives me more accurate and precise results than other methods such as the progress curve method which means that you don’t have to repeat your experiments causing unreliable results to occur. Also the graph produced is a lot harder to work with because additional measurements have to be made such as gradient lines drawn to find the rate of reaction. My rate concentration graphs instantly indicate an order of reaction and therefore allow me to work out a more accurate way of working out the rate constant for a reaction. When I was altering the temperature of the reaction vessels, I had to make sure that not only the water bath was up to a certain temperature but so were the reactants. To do this I had to add another thermometer to the reactants in the test tube. In my reaction, I only heated the test tube Kinetics of the reaction between Bromate (V), Bromide and Hydrogen ions,By Charles Ross

29 | P a g e
of Potassium Bromate (V), Phenol solution and the sulphuric acid. However, I should have heated that and the Potassium Bromide solution to because when I added the one test tube to the other, the reactants in the other tube would have been hotter than the other therefore cooling down the total reaction. This meant that the temperatures I recorded may not have been completely correct causing unreliable results when calculating the activation enthalpy. Also during the temperature reaction, as I didn’t need hot temperatures, I didn’t use a Bunsen burner but for the hotter temperatures of the tests, the water bath took too long to warm the reactants to the required temperature. Therefore I placed the reaction vessels on the radiator to warm up as they did so about three times faster. I wouldn’t have done this if I had lots of time but as time was slightly against me, I resorted to the quickest method.During my During my experiment, while varying the concentration, I had a few anomalous results while varying the concentration of the Potassium Bromide solution. Both of the anomalous results were from the two lower concentrations. To identify the problem that caused these two results, I decided to make up the two different concentrations again and retest them leaving the anomalous results in. After testing the newly made concentrations, it was clearly an issue with making up the solutions because my new results seemed to fit on the line perfectly well confirming the order of reaction. Not all the points in any graph properly sat on a line of best fit because the experiments were done at different times of the day and even different days. This means that the lab may have fluctuated in temperature causing rate to increase or decrease depending on which one. There is little I could do to stop this type of systematic error because I did not have the time to do all the experiments during a single day. To eradicate this type of error, I could have warmed the solutions to a certain temperature as close to normal room temperature (200C) and then carried out the reactions which would make it more of a fair test. My results however are reliable overall because the majority of them sit on a line of best fit which indicates that the slight change in temperatures on different days didn’t have a considerable effect to every result. Also during the temperature change reaction I had an anomalous result at the reaction held at 50C. This anomalous result could have been due to many factors such as equipment error, random error systematic errors and parallax error on reading the burette and or thermometer. However when I carried out this reaction, I had to do one result and come back at a different time to finish the other two repeats. When I did the second test I noticed a crack in the test tube after doing the experiment. This meant that water would have got into the solution and diluted it causing the reaction to occur a lot slower due to fewer successful collisions over a time period between the reacting particles. I repeated this anomalous result in a test tube that wasn’t broken and got a result which was concordant with the other two excluding the anomalous result. Finally at school, all our equipment is grade B equipment which is the less expensive equipment but due to a result of this has a higher error attached with it. If I could repeat my experiment I would do everything with grade A equipment due to the lower errors. Also this would reduce the percentage errors of my measurements therefore making the results more reliable and more accurate. Also I would have someone helping me do my experiment which would further reduce the error and increase the reliability and accuracy of my total experiment.
Kinetics of the reaction between Bromate (V), Bromide and Hydrogen ions,By Charles Ross

30 | P a g e
Conclusion
All my results have been recorded in appropriate tables and for my results fitting graphs have been plotted. These graphs have proved useful in that from them I have been able to derive rate equations from which a rate constant has been found and also activation enthalpy from my temperature variation results and graph.Overall, three different sets measurements have been recorded throughout my experiment. These being, the time taken for the change in colour for the variation in concentration of Potassium Bromide, Potassium Bromate (V), Sulphuric Acid solution (or concentration of H+ ions), the temperature and the rate. From my results from varying the concentration, I found that the lower concentrations of reactants took a lot longer to decolourise in the solution, this can be related to the collision theory which I talked about there is a smaller chance of reactants colliding successfully to reaction with the required activation energy (Graph 1). Therefore less molecules means that the solution will take a lot longer to decolourise which was proved in my results. From my rate concentration graphs I was able to determine rate of reaction by looking at the shape of the line of best fit. However this heavily relied on the graphs being plotted right and the scales being correct. From my background information I know that the graphs representing the order of reaction for the Potassium Bromate (V) and Potassium Bromide are first order graphs and my graphs displayed this by the constant gradient lines which passed through the origin. The order of reaction with respect to the sulphuric acid (H+ ions) is a second order reaction and this was displayed by curve which had an increasing gradient which passes through the origin. Overall the total order of the reaction was 4th order. This can be found by adding up the total powers in the rate equation with respect to each of the reactants.From my rate equation it is possible to work out the rate determining step of the overall reaction. This can be done by looking at the powers next to the ions in the rate equation. My rate equation shows me that in the rate determining step I have two H+ ions, one bromate (V) ion and one bromide ion. In a reaction the rate determining step is the slowest step in a rate mechanism. In chemical reactions, the reaction is believed to take place in a number of steps with a slow step being represented as the rate determining step of a reaction. The series of stages of the reaction must satisfy the stoichiometric equation as well as the rate equation
Rate determining step for the reaction
HBr + HBrO3 HBrO + HBrO2
The reaction mechanism cannot be proven; it is just suggested based on the understanding of chemistry and is simply an idea as to what may happen in this reaction.
In my experiment I also varied the temperature of my reaction while keeping the concentrations constant. The increase in temperature causes the rate of reaction to change which means that the rate constant must be affected too. Increasing the temperature means that more particles collide successfully more frequently because they have sufficient energy to do so. This may also be Kinetics of the reaction between Bromate (V), Bromide and Hydrogen ions,By Charles Ross

31 | P a g e
referred to as more molecules having the activation energy to react successfully. Therefore an increase in temperature means the reaction will happen faster. This was proved in my results by increasing the temperature form ten to twenty degrees, the reaction took was 6.79 seconds less. By plotting the reciprocal of the absolute temperature against log to the base e of reaction rate, I have obtained a graph with the gradient - Ea/R. from this I could simply rearrange to find the activation energy of the reaction (Ea). From my research I expected my activation energy to be between 40 and 70kjmol-1 and it turned out to be 54.3 KJ mol-1 which was what was roughly expected.During my temperature reactions I couldn’t do any reactions above 30 degrees because the rate was too quick to accurately measure on a stop watch and determine when the end point was. This is why I had to do more lower temperature results to give a getter graph to work out the activation enthalpy. From this I can conclude that my temperature reaction was reasonably accurate for the conditions and the apparatus I used. Also from my concentration reactions I had two main anomalous results which were clearly indicated on the graphs and were ignored in the average times and in the calculation for working out rate of reaction. Apart from this I have concluded that my concentration reactions were reliable and accurate as possible with the conditions I had to work with and the equipment. In general I think that my investigation went well. I succeeded in achieving all of my aims at the beginning of the experiment and from which I produced generally reliable results which fitted the pattern of other research which I conducted throughout my experiment.
Kinetics of the reaction between Bromate (V), Bromide and Hydrogen ions,By Charles Ross

32 | P a g e
References
http://www.cdc.gov/niosh/ipcsneng/neng0070.html Phenol (1)
http://www.cdc.gov/niosh/ipcsneng/neng0362.html H2SO4 (2)
http://www.sciencelab.com/msds.php?msdsId=9927361 methyl orange (3)
http://toxnet.nlm.nih.gov/cgi-bin/sis/search/a?dbs+hsdb:@term+@DOCNO+1253 Potassium Bromate (4)
Page 58, practical 19, chemistry in context laboratory manual and study guide, second edition written by Graham Hill and John Holman (5)
http://www.chemguide.co.uk/physical/basicrates/catalyst.html (6)
http://en.wikipedia.org/wiki/Arrhenius_equation (7)
http://www.chemguide.co.uk/physical/basicrates/arrhenius.html (8)
A-Level study guide for AS & A2 in one book, Revision Express, Pearson Education page 46 & 47 (9)
Salters Advanced Chemistry Chemical Ideas OCR GCE pages 220-223 rate equations and order of reactions (10)
Kinetics of the reaction between Bromate (V), Bromide and Hydrogen ions,By Charles Ross