chemistry research journal, 2017, 2(5):242-256 -...
TRANSCRIPT

Chemistry Research Journal, 2017, 2(5):242-256
Chemistry Research Journal
242
Available online www.chemrj.org
Research Article
ISSN: 2455-8990
CODEN(USA): CRJHA5
Concentrations of Physicochemical Properties and Polycyclic aromatic hydrocarbons in
Soil at Akala-olu Ahoada West Rivers State Nigeria
Ideriah T.J.K.1, Cookey G.A.
2, Isong U.A.
2
1Institute of Pollution Studies, Rivers State University Port Harcourt, Nigeria
2Department of Chemistry, Rivers State University Port Harcourt, Nigeria
Abstract The levels of Polycyclic Aromatic Hydrocarbons, Physicochemical Properties and Heavy Metals in Akala-
Olu, a crude oil producing community in Rivers State were assessed using standard methods recommended by
APHA, Loganathan and EGASPIN for physiochemical parameters, Chromatograph (HP5890 Series II) for PAHs
and Atomic Absorption Spectrophotometer for heavy metals. The results showed ranges of pH 6.20 - 6.78, total
organic carbon 0.633% - 1.05% organic matter varied 2.14% - 2.88%, Electrical conductivity 274µS/cm - 463
µS/cm, total Nitrogen 0.053% at - 0.977%, Available phosphorus 0.15mg/kg - 0.465mg/kg, Ca 199.67mg/kg -
245.08mg/kg, Mg 51.53mg/kg - 75.53mg/kg, Na 44.09mg/kg - 74.70mg/kg, K 41.11mg/kg - 69.83mg/kg, Cd
0.055mg/kg - 0.105mg/kg, Pb 4.065mg/kg - 5.850mg/kg, Al 0.999mg/kg - 2.085mg/kg, Cr 1.978mg/kg -
3.367mg/kg, Zn, 42.065mg/kg - 50.731mg/kg, Cu 1.474mg/kg - 2.663mg/kg, Fe 4484mg/kg - 6502.50mg/kg, Mn
29.876mg/kg - 33.995mg/kg, Co, 0.001mg/kg did not show any variation in the area. The concentrations of toxic
and carcinogenic PAHs ranged from 4.39x10⁻³
- 5.03x10⁻²
ppm Benzo(a)anthracene, 2.37x10⁻³
-3.68x10⁻²
ppm
Indeno(1,2,3-c,d)pyrene, 3.84x 10⁻³
– 7.08x10⁻²
ppm Dibenz(a,h)anthracene and 1.40x10⁻⁴
- 7.38x10⁻³
ppm Chrysene.
The levels of pH measured indicate that the soils are moderately acidic. The concentrations of most toxic and
carcinogenic PAHs such as Benzo(a)anthracene, Indeno(1,2,3-c,d)pyrene, Dibenz(a,h)anthracene and Chrysene
exceeded their permissible limits and therefore pose grave environmental and health concerns in the area. There
should be awareness campaign and the water in the area should be monitored regularly.
Keywords Top soil, carcinogenic PAHs, Physicochemical parameters, Akala-Olu
Introduction
Soil is a vital part of the Earth. It serves as a natural medium for plants growth [1]. Plants as an integral part of the
ecosystem when grown on polluted soil contaminates fruits, food crops due to the accumulation of toxic metals and
has become an inevitable problem because the entry of these heavy metals such lead, chromium, cadmium, zinc,
arsenic and hydrocarbons into the food chain may lead to increased vulnerability and exposure of the populace to
metal poisoning.
Heavy metals are natural components of the Earth‟s crust. They are not biodegradable or perishable. Heavy metals,
such Cu, Co, Fe, Zn and Mo are important to plants and animals, including humans at low concentrations for
enzyme activities. If these metals are removed from our nutrition, we are expected to be in the grip of a disease.
They are like vitamins and if we are deficient in even one of them, we are likely to suffer from one of them, we are

Ideriah TJK et al Chemistry Research Journal, 2017, 2(5):242-256
Chemistry Research Journal
243
likely to suffer from one or more health challenges [2], and meanwhile, high level exposure of heavy metals can
cause different health problems. Ingestion is one of the major routes of intake of heavy metals into the human body.
The study by Ideriah et al., [3] on “Heavy metal contamination of soils around municipal solid waste dump in Port
Harcourt” showed that levels of heavy metals in the soil around waste dump are influenced by the composition and
topography of the dumpsite, run-off and levels of scavenging.
Crude oil products are made up of hydrocarbons consisting of short and long-chain aliphatic and aromatic
hydrocarbons. Constituents of petroleum are namely volatile organic compounds (VOCs), such as toluene, xylene
and benzene and the polycyclic aromatic hydrocarbons (PAHs), have a variety of harmful effect on humans [4].
Polycyclic aromatic hydrocarbons (PAHs) are powerful environmental pollutants which are composed of fused
aromatic rings. They are almost everywhere in the environment and are usually formed during incomplete
combustion of organic materials such as coal, oil, wood, gasoline e.t.c. PAHs are present in asphalt, crude oil and
coal tar [5]. As a result of human activities PAHs are found in environment. High levels of PAHs are present in
cities and in places where bush burning, petroleum activities are persistently practiced [5]. PAHs have been seen as
a potent environmental pollutants by the United Nations Environmental programme [6], and the U.S Environment
protection Agency [7]. Health effects of PAHs have been intensively studied, probably because of their carcinogenic
nature. The health effects of PAHs exposure depends on some factors such as; duration of exposure, dose taken and
the individual characteristics which include nutritional status, age, life style [8]. Generally, the carcinogenic
properties of PAHs increase progressively with the number of aromatic rings [9]. Several toxicological studies in
animals (World Health Organization – International programme on chemical safety) [10] and occupational studies in
humans [11] demonstrate a high risk of lung cancer related to PAHs inhalation. According to the World Health
Organization [12] and Dionex [13] PAHs are classified as carcinogenic as well as mutagenic to higher animals.
The study is aimed to evaluate the impact of oil exploitation activities on the quality of soil in Akala-olu community
in Ahoada West Local Government Area of Rivers State in other to create awareness among the inhabitants.
Materials and Methods
Study Area
Akala-Olu community in Ahoada West local Government Area of Rivers state. It lies within latitudes 5˚ 5′ 0″ N and
longitude 6˚ 39′ 0″ E, with a total land area of 493km2, altitude of 71, elevation of approximately 12m and a
population of about 249,232 [14]. It is bounded by Ogba/ Egbema/Ndoni local government area, Abua/ Odua local
government local area, Ahoada East local government area on the east and Biseni and Yenagoa both of Bayelsa state
on the north and west respectively (Fig 1). Its vegetation is mainly a high dense rain forest. Thus, the occupations of
the people are mainly farming, fishing and hunting. The stations and their geographical positions are shown in Table
2.
Table 1: Geographical Location of soil Sampling Stations
Station Geographical Location
EAST (Longitude) NORTH (Latitude)
1 006˚ 30′ 18.9″ 05˚ 06′ 12.6″
2 006˚ 30′ 15.4″ 05˚ 06′ 24.8″
3 006˚ 30′ 13.5″ 05˚ 06′ 26.9″
4 006˚ 30′ 16.7″ 05˚ 06′ 22.3″
5 006˚ 30′ 17.2″ 05˚ 06′ 15.4″
Sample Collection and Preparation
Soil samples were collected with an auger. Soil samples from five (5) sampling points within the impacted area. A
total of thirty samples comprising fifteen 0-15cm depth and fifteen 15-30cm depth were collected into polythene
bags using hand auger. Ten (10) composite samples comprising of five 0-15cm and five 15-30cm were taken to the
laboratory for preparation and analyses. The composite samples were air-dried, ground to pass through a 2mm mesh
and stored at room temperature in well labeled polythene bags.
Ideriah TJK et al Chemistry Research Journal, 2017, 2(5):242-256
Chemistry Research Journal
244
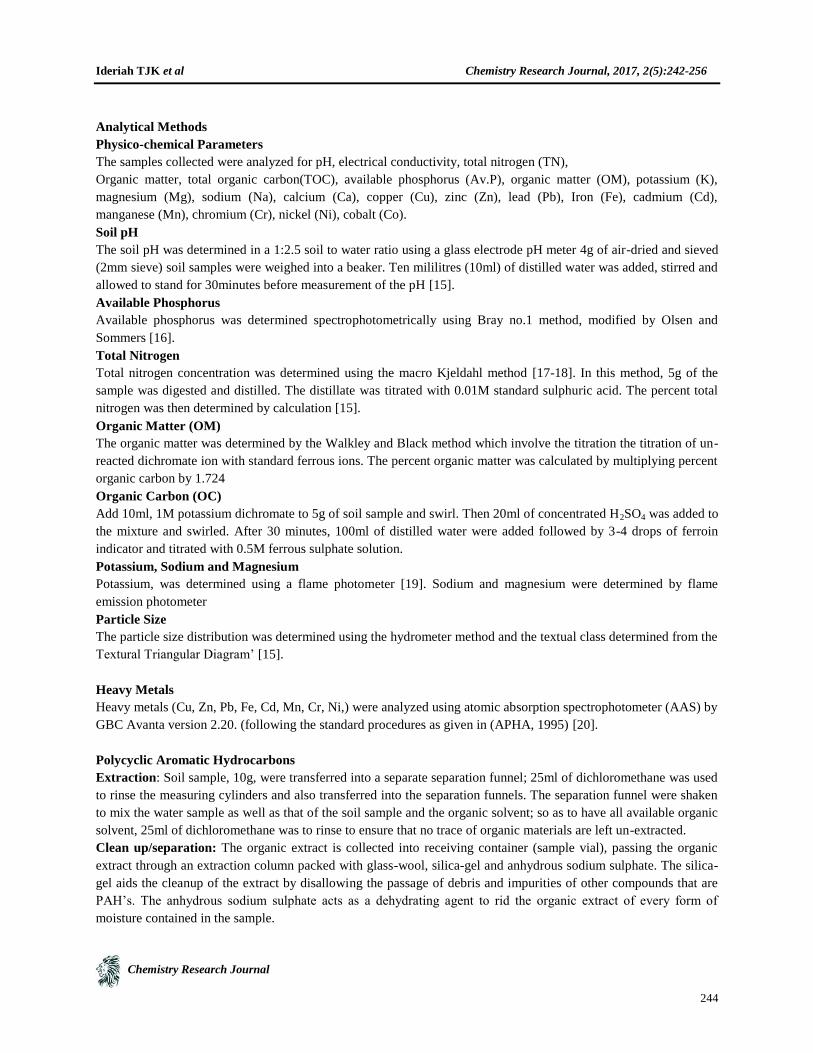
Analytical Methods
Physico-chemical Parameters
The samples collected were analyzed for pH, electrical conductivity, total nitrogen (TN),
Organic matter, total organic carbon(TOC), available phosphorus (Av.P), organic matter (OM), potassium (K),
magnesium (Mg), sodium (Na), calcium (Ca), copper (Cu), zinc (Zn), lead (Pb), Iron (Fe), cadmium (Cd),
manganese (Mn), chromium (Cr), nickel (Ni), cobalt (Co).
Soil pH
The soil pH was determined in a 1:2.5 soil to water ratio using a glass electrode pH meter 4g of air-dried and sieved
(2mm sieve) soil samples were weighed into a beaker. Ten mililitres (10ml) of distilled water was added, stirred and
allowed to stand for 30minutes before measurement of the pH [15].
Available Phosphorus
Available phosphorus was determined spectrophotometrically using Bray no.1 method, modified by Olsen and
Sommers [16].
Total Nitrogen
Total nitrogen concentration was determined using the macro Kjeldahl method [17-18]. In this method, 5g of the
sample was digested and distilled. The distillate was titrated with 0.01M standard sulphuric acid. The percent total
nitrogen was then determined by calculation [15].
Organic Matter (OM)
The organic matter was determined by the Walkley and Black method which involve the titration the titration of un-
reacted dichromate ion with standard ferrous ions. The percent organic matter was calculated by multiplying percent
organic carbon by 1.724
Organic Carbon (OC)
Add 10ml, 1M potassium dichromate to 5g of soil sample and swirl. Then 20ml of concentrated H2SO4 was added to
the mixture and swirled. After 30 minutes, 100ml of distilled water were added followed by 3-4 drops of ferroin
indicator and titrated with 0.5M ferrous sulphate solution.
Potassium, Sodium and Magnesium
Potassium, was determined using a flame photometer [19]. Sodium and magnesium were determined by flame
emission photometer
Particle Size
The particle size distribution was determined using the hydrometer method and the textual class determined from the
Textural Triangular Diagram‟ [15].
Heavy Metals
Heavy metals (Cu, Zn, Pb, Fe, Cd, Mn, Cr, Ni,) were analyzed using atomic absorption spectrophotometer (AAS) by
GBC Avanta version 2.20. (following the standard procedures as given in (APHA, 1995) [20].
Polycyclic Aromatic Hydrocarbons
Extraction: Soil sample, 10g, were transferred into a separate separation funnel; 25ml of dichloromethane was used
to rinse the measuring cylinders and also transferred into the separation funnels. The separation funnel were shaken
to mix the water sample as well as that of the soil sample and the organic solvent; so as to have all available organic
solvent, 25ml of dichloromethane was to rinse to ensure that no trace of organic materials are left un-extracted.
Clean up/separation: The organic extract is collected into receiving container (sample vial), passing the organic
extract through an extraction column packed with glass-wool, silica-gel and anhydrous sodium sulphate. The silica-
gel aids the cleanup of the extract by disallowing the passage of debris and impurities of other compounds that are
PAH‟s. The anhydrous sodium sulphate acts as a dehydrating agent to rid the organic extract of every form of
moisture contained in the sample.
Ideriah TJK et al Chemistry Research Journal, 2017, 2(5):242-256
Chemistry Research Journal
245
ANALYSIS: The concentrated aromatic extracts were transferred into labeled glass vials with Teflon for gas
chromatographic analysis. Polycyclic aromatic hydrocarbons were determined using gas chromatographic analysis
(HP 5890 series II)
Results and Discussion
Results
The results of levels of physicochemical properties and Polycyclic Aromatic Hydrocarbons in the top soil at the
study area are presented in Tables 1 and 2 respectively and Figs. 1 - 13. Correlation matrices of the parameters are in
Tables 3 and 4 respectively. The levels of pH varied between 6.20 at station 2 and 6.78 at station 5. The
concentrations of total organic carbon ranged from 0.633% at station 2 to 1.05% at station 3. The concentrations of
organic matter varied from 2.14% at station 2 to 2.88% at station 5. The concentrations of Electrical conductivity
ranged from 274µS/cm at station 4 to 463 µS/cm at station 5. The concentrations of total Nitrogen varied between
0.053% at station 2 to 0.977% at station 4. The concentrations of Available phosphorus varied from 0.15mg/kg at
station 2 to 0.465mg/kg at station 5. The concentrations of Ca varied between 199.67mg/kg at station 2 to
245.08mg/kg at station 3. The concentrations of Mg varied from 51.53mg/kg at station 5 to 75.53mg/kg at station 3.
The concentrations of Na ranged from 44.09mg/kg at station 2 to 74.70mg/kg at station 3. The concentrations of K
varied from 41.11mg/kg at station 2 to 69.83mg/kg at station 4. The concentrations of Cd varied from 0.055mg/kg at
station 2 to 0.105mg/kg at station 5. The concentrations of Pb varied from 4.065mg/kg at station 2 to 5.850mg/kg at
station 3. The concentrations of Al varied from 0.999mg/kg at station 3 to 2.085mg/kg at station 4. The
concentrations of Cr varied from 1.978mg/kg at station 2 to 3.367mg/kg at station 3. The concentrations of Zn
varied from 42.065mg/kg at station 5 to 50.731mg/kg at station 3. The concentrations of Cu varied from 1.474mg/kg
at station 2 to 2.663mg/kg at station 3. The concentrations of Fe varied from 4484mg/kg at station 5 to
6502.50mg/kg at station 3. The concentrations of Mn varied from 29.876mg/kg at station 2 to 33.995mg/kg at
station 4. The concentrations of Co, 0.001mg/kg did not show any variation in the area.
Discussion
Soil pH
The pH of the soils in the area, 6.20 – 6.78 is moderately acidic. This range is typical of Niger Delta soils [21-22].
The soils were slightly acidic based on pH ratings by Brady and Weil [23]. Low pH implies increased solubility and
availability of toxic metals (Fe, Al, Mn) and this could lead to reduced vegetation growth, reduced population of N-
fixing bacteria and allows for leaching of essential nutrients.
Itanna [24] reported that the availability of heavy metals increases with decreasing pH. The pH values obtained in
this study imply high tendency of heavy metal availability. The observed soil pH can influence nutrient absorption
and plant growth through its influence on nutrient availability and the presence of toxic ions. For instance, as pH
increase from 5.0 to 8.0, iron, manganese, zinc and copper become less available while phosphorus is readily
available at pH 6.5 [25].
Organic Matter
Organic carbon levels below 2% are taken to be very low for tropical soils [26-27]. Based on this rating, all the soil
samples analyzed are moderately high in organic matter. The values of organic matter in this study are below the
permissible limit, 3-5% recommended for 0-15cm depth by Brady [25]. The organic matter content of soil depends
on the rate of production and decay of wastes and is a function of temperature, rainfall and nutrient status [28]. The
level of biochemical activity influenced the variations in organic matter content. Increased biochemical activity
depends on the level of organic matter as it is the main source of energy for microorganisms.
According to Stocking [29], when soil organic carbon declines, plant nutrients such as nitrogen and phosphorus are
mostly at risk.
Total Organic Carbon

Ideriah TJK et al Chemistry Research Journal, 2017, 2(5):242-256
Chemistry Research Journal
246
The levels of total organic carbon in the area are low. Stegman and Heevenklage [30] reported that reduction of
organic carbon in soil is as a result of the ability of microorganisms to degrade organic carbon.
Total Nitrogen
Landon [26] rated soils with total Nitrogen levels from 0.1 – 0.2% as low and <0.1% as very low for tropical soils.
The soils of the area are very low in their total nitrogen content except station 4 which is low. Nitrogen is deficient
in soils from the area and this can limit vegetation growth and sustained productivity.
The low levels of total N in the area except station 4 suggest low mineralization of soil organic nitrogen. This does
not agree with the report by Baker and Herson [31] who observed that high levels of total nitrogen suggest active
mineralization of organic nitrogen in soil. The variations observed in the levels of total N suggest that they depend
on the type of plants grown in the area. The levels of nitrogen can be classified as low, medium or high depending
on the organic matter content, total nitrogen and nitrate nitrogen level of the soil. They showed that when organic
matter is 0 – 1.5% and total nitrogen is 0.1%; the availability of nitrogen is regarded as low. It is medium when
organic matter and total nitrogen are 1.5 – 2.5% and 0.1-0.2%, respectively and high when the soil has more than
0.2% total nitrogen. Enwezor et al. [32] further classified total nitrogen in soils as < 8µg/g (low), 8 - 20µg/g
(moderate) and > 20 µg/g (High).
Available Phosphorus
According to Ilaco [33] and Landon [26], available phosphorus value below 15mg/kg is regarded as low for tropical
soils. The results of this study show that the surface soils had available phosphorus values that are below the critical
limit. Low phosphorus levels could hinder nitrogen accumulation since symbiotic N-fixing bacteria have a high
phosphorus demand.
Exchangeable Ca
Ilaco [33] and Landon [26] rated soils with < 2.0meq/100g as very low in calcium, 2-5meq/100g as low and 5-10
meq/100g as medium. The levels of exchangeable calcium show that the soils of the study area are very low to
medium in exchangeable calcium.
Exchangeable Mg
The soils were found to range from low to medium in exchangeable magnesium based on the ratings by Ilaco [33]
and Landon [26]. According to these authors, exchangeable magnesium values from 1.5 – 3.0 meq/100g is medium,
0.5-1.5meq/100g low and <0.5 meq/100g very low.
Exchangeable K
According to Ilaco [33], levels of exchangeable potassium between 0.1 – 0.3 meq/100g soil are regarded as low for
tropical and sub-tropical soils and below 0.1 meq/100g soil very low. Based on this rating, the soils analyzed in this
study ranged between low to moderate in their exchangeable potassium content with most of the samples falling
within the „low‟ and „very low‟ ranges. According to Jones and Wild [34], amounts of exchangeable potassium in
the tropical savannah is low. The surface horizons of the cultivated spoils have the highest mean exchangeable
potassium value. This could be attributed to cultivation and enrichment of the soils with fertilizers. Udechukwu [35]
reported that the soils of the humid southern zone of Nigeria were deficient in potassium as a result of high leaching
intensity.
Exchangeable Na
Also, Ilaco [33] and Landon [26] rated exchangeable sodium levels below 0.1 meq/100g as very low and 0.1 – 0.3
meq/100g of soil as low. Based on this, all the soils studied are low in exchangeable sodium. Landon [26] observed
that although sodium could serve as a substitute for potassium, it is not an essential plant nutrient. For this reason, he
added that its absence or presence in only small quantities is not usually detrimental to plant nutrition. He observed
that when sodium is present in soil in significant quantities, particularly in proportion to other cations present, it can
have an adverse effect, not only on many crops, but also on physical conditions of the soil.
The generally low content of exchangeable bases in the spoil soils of the study area could be attributed to the parent
material that underlies the area as well as leaching of essential plant nutrients. Increasing the pH and organic matter
levels will make exchangeable bases more available in the soils.
Ideriah TJK et al Chemistry Research Journal, 2017, 2(5):242-256
Chemistry Research Journal
247
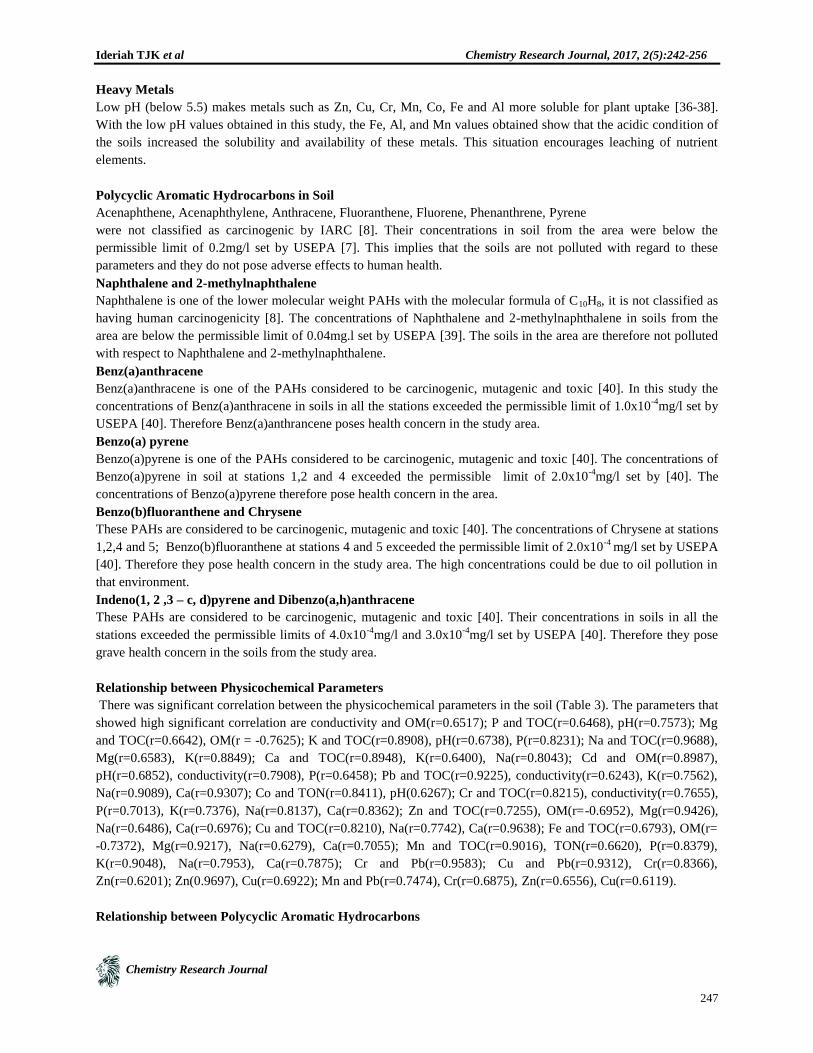
Heavy Metals
Low pH (below 5.5) makes metals such as Zn, Cu, Cr, Mn, Co, Fe and Al more soluble for plant uptake [36-38].
With the low pH values obtained in this study, the Fe, Al, and Mn values obtained show that the acidic condition of
the soils increased the solubility and availability of these metals. This situation encourages leaching of nutrient
elements.
Polycyclic Aromatic Hydrocarbons in Soil
Acenaphthene, Acenaphthylene, Anthracene, Fluoranthene, Fluorene, Phenanthrene, Pyrene
were not classified as carcinogenic by IARC [8]. Their concentrations in soil from the area were below the
permissible limit of 0.2mg/l set by USEPA [7]. This implies that the soils are not polluted with regard to these
parameters and they do not pose adverse effects to human health.
Naphthalene and 2-methylnaphthalene
Naphthalene is one of the lower molecular weight PAHs with the molecular formula of C10H8, it is not classified as
having human carcinogenicity [8]. The concentrations of Naphthalene and 2-methylnaphthalene in soils from the
area are below the permissible limit of 0.04mg.l set by USEPA [39]. The soils in the area are therefore not polluted
with respect to Naphthalene and 2-methylnaphthalene.
Benz(a)anthracene
Benz(a)anthracene is one of the PAHs considered to be carcinogenic, mutagenic and toxic [40]. In this study the
concentrations of Benz(a)anthracene in soils in all the stations exceeded the permissible limit of 1.0x10⁻⁴
mg/l set by
USEPA [40]. Therefore Benz(a)anthrancene poses health concern in the study area.
Benzo(a) pyrene
Benzo(a)pyrene is one of the PAHs considered to be carcinogenic, mutagenic and toxic [40]. The concentrations of
Benzo(a)pyrene in soil at stations 1,2 and 4 exceeded the permissible limit of 2.0x10⁻⁴
mg/l set by [40]. The
concentrations of Benzo(a)pyrene therefore pose health concern in the area.
Benzo(b)fluoranthene and Chrysene
These PAHs are considered to be carcinogenic, mutagenic and toxic [40]. The concentrations of Chrysene at stations
1,2,4 and 5; Benzo(b)fluoranthene at stations 4 and 5 exceeded the permissible limit of 2.0x10⁻⁴
mg/l set by USEPA
[40]. Therefore they pose health concern in the study area. The high concentrations could be due to oil pollution in
that environment.
Indeno(1, 2 ,3 – c, d)pyrene and Dibenzo(a,h)anthracene
These PAHs are considered to be carcinogenic, mutagenic and toxic [40]. Their concentrations in soils in all the
stations exceeded the permissible limits of 4.0x10⁻⁴
mg/l and 3.0x10⁻⁴
mg/l set by USEPA [40]. Therefore they pose
grave health concern in the soils from the study area.
Relationship between Physicochemical Parameters
There was significant correlation between the physicochemical parameters in the soil (Table 3). The parameters that
showed high significant correlation are conductivity and OM(r=0.6517); P and TOC(r=0.6468), pH(r=0.7573); Mg
and TOC(r=0.6642), OM(r = -0.7625); K and TOC(r=0.8908), pH(r=0.6738), P(r=0.8231); Na and TOC(r=0.9688),
Mg(r=0.6583), K(r=0.8849); Ca and TOC(r=0.8948), K(r=0.6400), Na(r=0.8043); Cd and OM(r=0.8987),
pH(r=0.6852), conductivity(r=0.7908), P(r=0.6458); Pb and TOC(r=0.9225), conductivity(r=0.6243), K(r=0.7562),
Na(r=0.9089), Ca(r=0.9307); Co and TON(r=0.8411), pH(0.6267); Cr and TOC(r=0.8215), conductivity(r=0.7655),
P(r=0.7013), K(r=0.7376), Na(r=0.8137), Ca(r=0.8362); Zn and TOC(r=0.7255), OM(r=-0.6952), Mg(r=0.9426),
Na(r=0.6486), Ca(r=0.6976); Cu and TOC(r=0.8210), Na(r=0.7742), Ca(r=0.9638); Fe and TOC(r=0.6793), OM(r=
-0.7372), Mg(r=0.9217), Na(r=0.6279), Ca(r=0.7055); Mn and TOC(r=0.9016), TON(r=0.6620), P(r=0.8379),
K(r=0.9048), Na(r=0.7953), Ca(r=0.7875); Cr and Pb(r=0.9583); Cu and Pb(r=0.9312), Cr(r=0.8366),
Zn(r=0.6201); Zn(0.9697), Cu(r=0.6922); Mn and Pb(r=0.7474), Cr(r=0.6875), Zn(r=0.6556), Cu(r=0.6119).
Relationship between Polycyclic Aromatic Hydrocarbons

Ideriah TJK et al Chemistry Research Journal, 2017, 2(5):242-256
Chemistry Research Journal
248
There was significant correlation between the Polycyclic Aromatic Hydrocarbons in the soil (Table 4). The
parameters that showed high significant correlation are between acenaphthylene and 2-methyl naphthalene
(r=0.9998); acenapthene and naphthalene (0.6837); phenanthrene and acenapthene(r=0.7669); fuoranthrene and
Fluorene (r=0.7774); pyrene and Fluorene (r=0.6628), anthracene (r=0.8706); Benz(a)anthracene and anthracene
(r=0.9873); chrysene and Fluorene (r=0.8565), anthracene (r=0.7581), fluoranthrene (r=0.8431); Benzo(b)
fluoranthrene and acenapthalene (r=0.9981), phenanthrene (r=0.9936), fluoranthrene (r=0.9993);
Benzo(a)fluoranthrene and naphthalene (r=0.8421), 2-methyl naphthalene(r=0.5195), acenahpthylene (r= -0.8031),
fluorene(r= -0.6746); benzo(k)fluoranthrene and fluorene(r=0.9895), fluoranthrene(r=0.8373); benzo(a)pyrene and
napthalene(r=0.7105), acenahpthylene(r=0.6625), phenanthrene(r=0.6887); indeno(1,2,3-cd)pyrene and
acenahpthene(r=0.7316); dibenz(a,h)anthracene and naphthalene(r= -0.7661), 2-metyl naphthalene (r= -0.7087),
acenapthylene(r= -0.7571); benz(a)anthracene and pyrene(r=0.9097); chrysene and pyrene (r=0.8332),
benz(a)anthracene(r= 0.8496); benzo(b)fluoranthrene and pyrene(r= -0.8796), benz(a)anthracene(r=-0.6397),
chrysene(r= -0.6322); benzo(k)fluoranthrene and chrysene(r=0.8368); dibenz(a,h)anthracene and
benzo(b)fluoranthrene(r= -0.8214).
Figure 1: Map of Rivers State showing the Study Area
Table 2: Levels of Physicochemical Parameters and Heavy Metals in Top Soil at the Study Area
Parameters Depth (cm) Station 1 Station 2 Station 3 Station 4 Station 5
TOC (%) 0-15cm 0.859 0.633 1.05 0.953 0.891
TON (%) 0-15cm 0.074 0.053 0.099 0.977 0.086
OM (%) 15-30cm 2.14 2.35 2.25 2.30 2.88
pH 0-15cm 6.53 6.20 6.23 6.72 6.78
ECond(µS/cm) 0-15cm 343 301.50 407.5 274 463
P (mg/kg) 0-15cm 0.210 0.15 0.325 0.450 0.465
Mg (mg/kg) 0-15cm 74.885 52.705 75.53 72.286 51.53
K (mg/kg) 0-15cm 62.896 41.11 66.71 69.83 69.150

Ideriah TJK et al Chemistry Research Journal, 2017, 2(5):242-256
Chemistry Research Journal
249
Na (mg/kg) 0-15cm 64.96 44.09 74.70 64.165 64.850
Ca (mg/kg) 0-15cm 205.253 199.67 245.03 225.285 216.885
Cd (mg/kg) 0-15cm 0.065 0.055 0.065 0.065 0.105
Pb (mg/kg) 0-15cm 4.626 4.065 5.850 4.920 5.200
Al (mg/kg) 0-15cm 1.21 1.460 0.999 2.085 1.540
Co (mg/kg) 0-15cm 0.001 0.001 0.001 0.001 0.001
Cr (mg/kg) 0-15cm 2.295 1.978 3.367 2.615 3.200
Zn (mg/kg) 0-15cm 47.400 42.984 50.731 49.820 42.065
Cu (mg/kg) 0-15cm 1.586 1.474 2.663 1.845 1.840
Fe (mg/kg) 0-15cm 5648.500 4861.000 6502.50 5811.650 4484.000
Mn (mg/kg) 0-15cm 31.55 29.876 33.150 33.995 32.482
Table 3: Mean levels (ppm) of Polycyclic Aromatic Hydrocarbons in Top Soil at the Study Area
PAH Depth
(cm)
Station 1 Station 2 Station 3 Station 4 Station 5 USEPA
Naphthalene 0-15cm 5.681×10⁻⁴
±4.950×10⁻⁷
4.798×10⁻⁴
±4.879×10⁻⁶
5.562×10⁻⁵
±1.626×10⁻⁶
6.227×10⁻³
±7.785×10⁻⁴
4.640×10⁻³
±1.591×10⁻⁴
4.0 ×10⁻² z
2-methyl Naphthalene 0-15cm 5.196×10⁻⁴
±1.068×10⁻⁵
4.942×10⁻⁵
±3.253×10⁻⁶
5.126×10⁻⁵
±7.071×10⁻⁸
6.194×10⁻⁴
±3.111×10⁻⁶
5.176×10⁻³
±7.778×10⁻⁵
4.0 ×10⁻² z
Acenaphthylene 0-15cm 3.752×10⁻⁴
±7.071×10⁻⁸
3.732×10⁻⁴
±7.566×10⁻⁶
3.672×10⁻⁵
±1.124×10⁻⁶
3.653×10⁻³
±2.418×10⁻⁴
3.633×10⁻³
±8.697×10⁻⁵
2.0 ×10⁻¹ y
Acenaphthene 0-15cm 4.509×10⁻³
±7.071×10⁻⁷
2.615×10⁻³
±1.499×10⁻⁴
4.489×10⁻⁴
±2.828×10⁻⁶
5.566×10⁻³
±2.100×10⁻⁴
3.616×10⁻³
±2.348×10⁻⁴
2.0 ×10⁻¹ y
Fluorene 0-15cm 1.349×10⁻²
±7.071×10⁻⁶
2.910×10⁻³
±5.374×10⁻⁵
1.316×10⁻³
±4.596×10⁻⁵
1.692×10⁻⁴
±2.864×10⁻⁵
1.452×10⁻⁴
±1909×10-6
2.0 ×10⁻¹ y
Phenanthrene 0-15cm 1.743×10⁻²
±7.071×10⁻⁴
1.630×10⁻³
±4.709×10⁻⁴
1.718×10⁻³
±1.061×10⁻⁴
1.916×10⁻²
±3.182×10⁻⁴
1.630×10⁻⁴
±1.435×10⁻⁵
2.0 ×10⁻¹y
Anthracene 0-15cm 3.016×10⁻²
±7.071×10⁻⁶
3.726×10⁻²
±1.485×10⁻³
3.089×10⁻³
±1.039×10⁻⁴
4.370×10⁻³
±2.991×10⁻⁴
3.320×10⁻²
±2.404×10⁻³
2.0 ×10⁻¹ y
Fluoranthene 0-15cm 3.651×10⁻²
±7.071×10⁻⁶
3.640×10⁻⁴
±2.065×10⁻⁵
3.710×10⁻³
±8.415×10⁻⁵
4.663×10⁻³
±3.818×10⁻⁴
2.024×10⁻²
±2.173×10⁻²
2.0 ×10⁻¹ y
Pyrene 0-15cm 1.611×10⁻²
±1.414×10⁻⁵
1.708×10⁻²
±6.223×10⁻³
1.565×10⁻³
±6.364×10⁻⁵
6.323×10⁻⁴
±2.128×10⁻⁵
7.232×10⁻³
±6.178×10⁻³
2.0 ×10⁻¹ y
Benz(a)anthracene 0-15cm 4.923×10⁻²
±7.071×10⁻⁶
5.025×10⁻²
±5.176
4.608×10⁻³
±4.448×10⁻⁴
4.394×10⁻³
±1.407×10⁻⁴
4.461×10⁻²
±3.281×10⁻³
1.0x10⁻⁴ x
Chrysene 0-15cm 7.380×10⁻³
±8.542×10⁻³
3.333×10⁻³
±2.558
1.403×10⁻⁴
±8.910×10⁻⁶
2.497×10⁻⁴
±8.542×10⁻⁵
3.494×10⁻³
±4.999×10⁻⁴
2.0x10⁻⁴ x
Benzo(b)fluoranthene 0-15cm 6.123×10⁻⁵
±2.121×10⁻⁸
4.004×10⁻⁵
±8.160×10⁻⁶
1.733×10⁻⁴
±2.015×10⁻⁵
2.765×10⁻⁴
±1.146×10⁻⁵
2.412×10⁻⁴
±6.210×10⁻⁵
2.0x10⁻⁴ x
Benzo(k)fluoranthene 0-15cm 1.592×10⁻⁴
±1.414×10⁻⁷
6.273×10⁻⁵
±8.697×10⁻⁷
6.310×10⁻⁵
±2.666×10⁻⁶
5.608×10⁻⁵
±1.916×10⁻⁶
5.669×10⁻⁵
±6.265×10⁻⁶
2.0x10⁻⁴ x
Benzo(a)pyrene 0-15cm 1.628×10⁻³
±7.071×10⁻⁷
2.434×10⁻³
±1.063×10⁻³
1.653×10⁻⁴
±3.536×10⁻⁶
1.853×10⁻²
±1.485×10⁻⁴
1.592×10⁻⁴
±4.320×10⁻⁵
2.0x10⁻⁴ x
Indeno(1,2,3-Cd)
pyrene
0-15cm 2.334×10⁻²
±7.071×10⁻⁶
3.677×10⁻²
±6.435×10⁻³
2.371×10⁻³
±8.485×10⁻⁵
3.665×10 -2
±1.471×10⁻³
2.324×10⁻²
±1.485×10⁻⁴
4.0x10⁻⁴ x
Dibenz(a,h)
anthracene
0-15cm 3.797×10⁻²
±1.414×10⁻⁵
7.083×10⁻²
±4.434×10⁻³
3.873×10⁻²
±3.677×10⁻⁴
2.420×10⁻²
±3.182×10⁻⁴
3.836×10⁻³
±1.966×10⁻⁴
3.0x10⁻⁴ x
x = 2013, y = 2014, z = 1996
Table 4: Correlation Matrix of Physicochemical Parameters and Heavy Metals in Soils
Parameters TOC TON OM pH Conductivity P Mg K Na Ca Cd
TOC 1
TON 0.313438 1

Ideriah TJK et al Chemistry Research Journal, 2017, 2(5):242-256
Chemistry Research Journal
250
OM -0.05574 -0.15649 1
pH 0.272802 0.479418 0.511612 1
Conductivity 0.369728 -0.57798 0.651678 0.164927 1
P 0.64675 0.543152 0.574364 0.757316 0.363538 1
Mg 0.664195 0.335831 -0.76253 -0.0786 -0.2543923 0.007118 1
K 0.890804 0.40346 0.199601 0.67379 0.4036346 0.823119 0.473953 1
Na 0.968843 0.120576 -0.04515 0.270134 0.4943651 0.552331 0.658338 0.884897 1
Ca 0.894752 0.251042 -0.05108 -0.05381 0.3313317 0.540501 0.517062 0.640034 0.804266 1
Cd 0.248162 -0.15374 0.898698 0.685175 0.7907702 0.684642 -0.45018 0.532831 0.316486 0.090217 1
Pb 0.922474 0.031238 0.150592 0.097799 0.6242703 0.598072 0.420699 0.756168 0.908985 0.930735 0.374769
Co -0.10498 0.841082 0.232878 0.626663 -0.4979448 0.512477 -0.19252 0.15635 -0.27279 -0.16376 0.101249
Cr 0.821512 -0.03233 0.426252 0.221209 0.765498 0.701312 0.158723 0.737584 0.813657 0.836203 0.598704
Zn 0.725535 0.479632 -0.69523 -0.13812 -0.2877854 0.139715 0.942627 0.471138 0.645598 0.697594 -0.47421
Cu 0.821024 -0.00728 -0.06765 -0.24178 0.4500012 0.362787 0.467546 0.50971 0.774205 0.963756 0.066436
Fe 0.679322 0.266556 -0.73716 -0.34276 -0.1996043 -0.02114 0.921711 0.34966 0.627993 0.705474 -0.53083
Mn 0.901592 0.662006 0.054507 0.518353 0.1365665 0.837968 0.536699 0.904817 0.795252 0.787498 0.277042
Pb Co Cr Zn Cu Fe Mn
Pb 1
Co -0.30596 1
Cr 0.958278 -0.22726 1
Zn 0.520866 -0.0706 0.270311 1
Cu 0.931236 -0.40939 0.836598 0.620069 1
Fe 0.543411 -0.29444 0.283354 0.969661 0.6921717 1
Mn 0.747442 0.334782 0.687459 0.655614 0.6118883 0.516568 1
Table 5: Correlation Matrix of PAHs in Soils at the Study Area
PAH Naphthalene 2-methyl
Naphthalene
Acenaphthylene Acenaphthene Fluorene Phenanthrene Anthracene Fluoranthene
Naphthalene 1
2-methyl
Naphthalene
0.53798951 1
Acenaphthylene 0.524147025 0.99981556 1
Acenaphthene 0.68366753 0.149398928 0.143695246 1
Fluorene -0.504753939 -0.389140312 -0.378087124 0.228488802 1
Phenanthrene 0.325877733 -0.401514915 -0.409078388 0.766935851 0.4743499 1
Anthracene -0.225559481 0.33427374 0.35016665 0.131696391 0.3625634 -0.298596192 1
Fluoranthene -0.073821283 0.234119663 0.242053452 0.395740375 0.7774165 0.368714202 0.401790095 1
Pyrene -0.532382502 -0.158964024 -0.141841348 0.07974273 0.6627506 -0.058535724 0.870632942 0.40440616
Benz(a)anthracene -0.293863171 0.264511678 0.281159582 0.150735639 0.5029434 -0.208963826 0.987335619 0.517080432
Chrysene -0.337777059 0.053725138 0.068399295 0.308722308 0.8564663 0.201965171 0.758065025 0.843127577
Benzo(b)fluoranthene 0.842093751 0.519498379 0.503133739 0.260648414 -0.6745939 0.103979188 -0.578896589 -0.2051103
Benzo(k)fluoranthene -0.426480706 -0.325864604 -0.316352084 0.270220851 0.989509 0.522476708 0.292132306 0.837285991
Benzo(a)pyrene 0.710522566 -0.209276165 -0.224959555 0.662540716 -0.2833282 0.688690524 -0.517466206 -0.313718903
Indeno(1,2,3-Cd)
pyrene
0.464456582 0.004513911 0.003361976 0.731606912 -0.0212076 0.368801686 0.395781143 -0.102132324
Dibenz(a,h)
anthracene
-0.708663813 -0.766093868 -0.757068997 -0.33338736 0.2854596 -0.090553383 0.220054674 -0.344467021
Pyrene Benz(a)
anthracene
Chrysene Benzo(b)
fluoranthene
Benzo(k)
fluoranthene
Benzo(a)
pyrene
Indeno(1,2,3-Cd)
pyrene
Dibenz(a,h)
anthracene
Pyrene 1
Benz(a)anthracene 0.90967767 1
Chrysene 0.832225659 0.849590071 1
Ideriah TJK et al Chemistry Research Journal, 2017, 2(5):242-256
Chemistry Research Journal
251
Benzo(b)fluoranthene -0.879608528 -0.639673841 -0.632150016 1
Benzo(k)fluoranthene 0.567151831 0.438854125 0.836816654 -0.566073108 1
Benzo(a)pyrene -0.466917058 -0.54488871 -0.445540079 0.530003066 -0.2514247 1
Indeno(1,2,3-Cd)
pyrene
0.35559552 0.340666124 0.169135639 -0.057108626 -0.0761185 0.565373859 1
Dibenz(a,h)
anthracene
0.577513804 0.230379709 0.12478446 -0.821389003 0.154389 -0.155827334 0.188285986 1
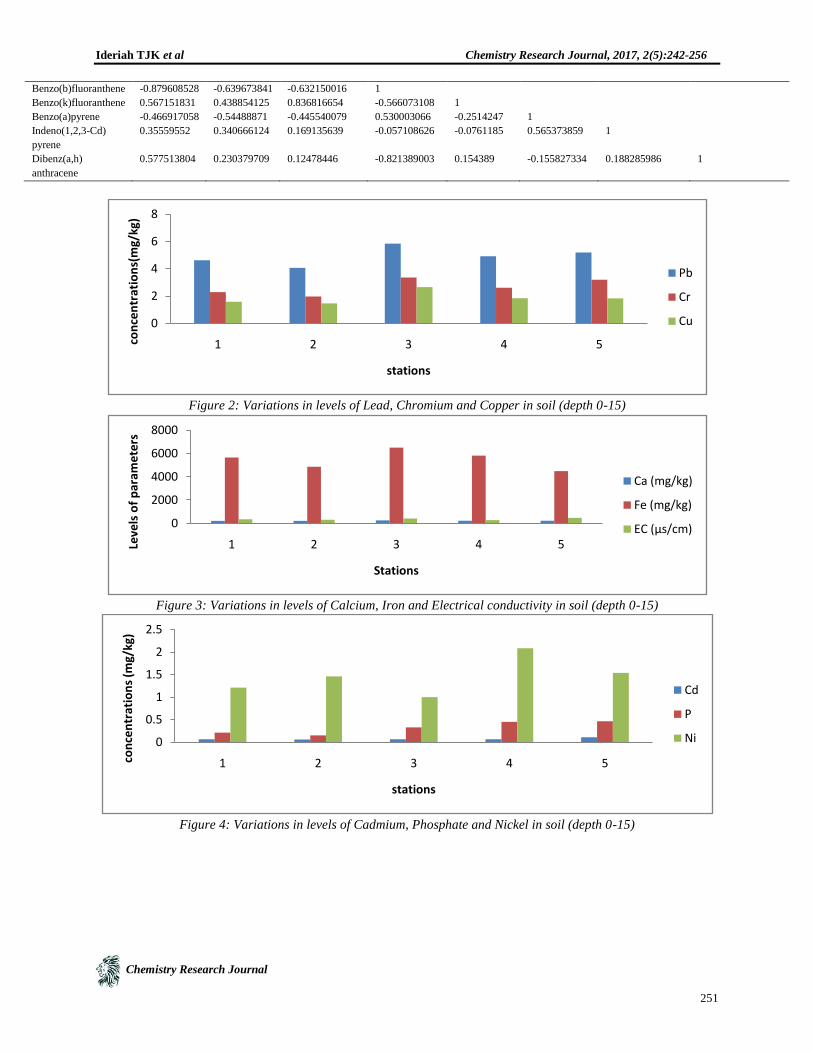
Figure 2: Variations in levels of Lead, Chromium and Copper in soil (depth 0-15)
Figure 3: Variations in levels of Calcium, Iron and Electrical conductivity in soil (depth 0-15)
Figure 4: Variations in levels of Cadmium, Phosphate and Nickel in soil (depth 0-15)
0
2
4
6
8
1 2 3 4 5con
cen
trat
ion
s(m
g/kg
)
stations
Pb
Cr
Cu
0
2000
4000
6000
8000
1 2 3 4 5Leve
ls o
f p
aram
ete
rs
Stations
Ca (mg/kg)
Fe (mg/kg)
EC (µs/cm)
0
0.5
1
1.5
2
2.5
1 2 3 4 5con
cen
trat
ion
s (m
g/kg
)
stations
Cd
P
Ni

Ideriah TJK et al Chemistry Research Journal, 2017, 2(5):242-256
Chemistry Research Journal
252
Figure 5: Variations in levels of Magnesium, Potassium, Sodium, Zinc and manganese in soil (depth 0-15)
Figure 6: Variations in levels of TOC and TON in soil (depth 0-15)
Figure 7: Variations in levels of polycyclic aromatic hydrocarbons in soil (depth 0-15)
0
20
40
60
80
1 2 3 4 5
con
cen
trat
ion
s (m
g/kg
)
Stations
Mg
K
Na
Zn
Mn
00.20.40.60.8
11.2
1 2 3 4 5
con
cen
trat
ion
s (%
)
Stations
TOC (%)
TON (%)
00.05
0.10.15
0.2
con
cen
trat
ion
s (p
pm
)
PAHs
STATION 5
STATION 4
STATION 3
STATION 2
STATION 1
0
10
20
30
40
1 2 3 4 5CO
NC
ENTR
ATI
ON
S (%
)
Stations
OM
TON

Ideriah TJK et al Chemistry Research Journal, 2017, 2(5):242-256
Chemistry Research Journal
253
Figure 8: Variations in levels of OM and TON in soil (depth 15-30)
Figure 9: Variations in levels of pH in soil (depth 15-30)
Figure 10: Variations in levels of Iron, Chromium, Manganese, Cadmium and Copper in soil (depth 15-30)
Figure 11: Variations in levels of Electrical conductivity, Lead and Zinc in soil (depth 15-30)
Figure 12: Variations in levels of Magnesium, Sodium, Calcium and potassium in soil (depth 15-30)
6
6.1
6.2
6.3
6.4
6.5
1 2 3 4 5
con
cen
trat
ion
s
Stations
pH
0
10
20
30
40
1 2 3 4 5
con
cen
trat
ion
s (m
g/kg
)
stations
Fe
Cr
Mn
Cd
Cu
0
50
100
150
200
250
1 2 3 4 5
leve
ls o
f p
aram
ete
rs
Stations
EC(µs/cm)
Pb (mg/kg)
Zn (mg/kg)
0
500
1000
1500
2000
1 2 3 4 5con
cen
trat
ion
s (m
g/kg
)
Stations
magnesium
sodium
calcium
potassium
Ideriah TJK et al Chemistry Research Journal, 2017, 2(5):242-256
Chemistry Research Journal
254
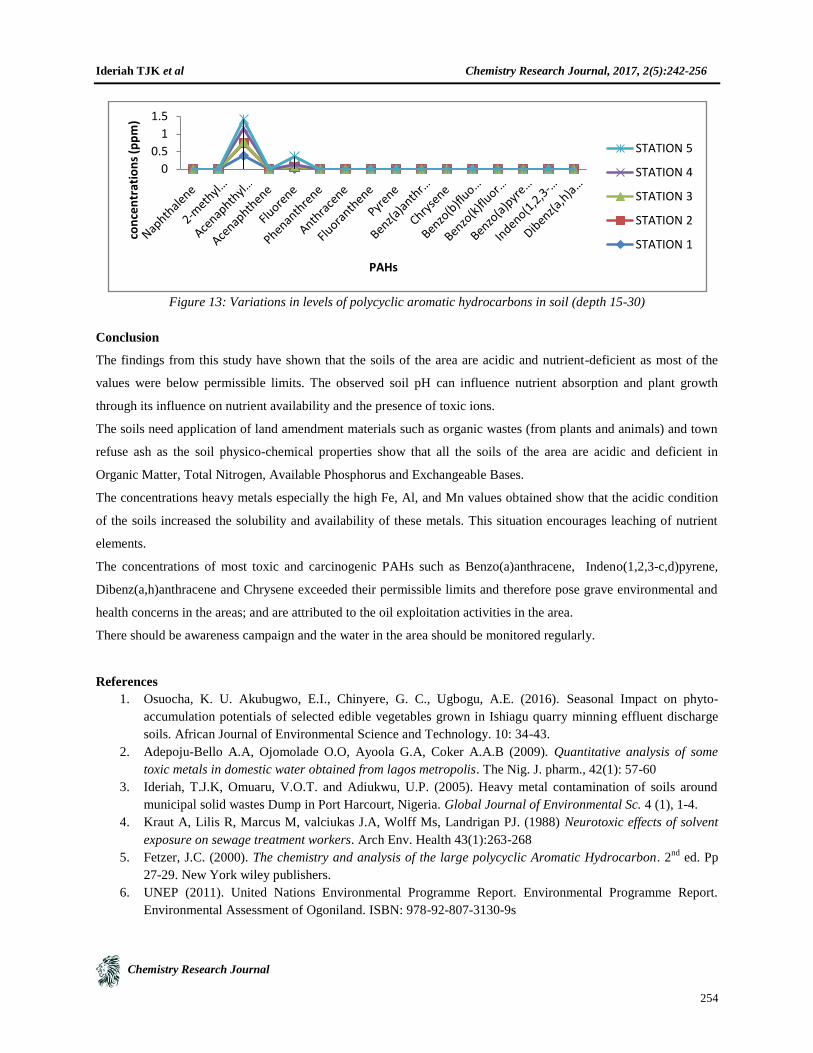
Figure 13: Variations in levels of polycyclic aromatic hydrocarbons in soil (depth 15-30)
Conclusion
The findings from this study have shown that the soils of the area are acidic and nutrient-deficient as most of the
values were below permissible limits. The observed soil pH can influence nutrient absorption and plant growth
through its influence on nutrient availability and the presence of toxic ions.
The soils need application of land amendment materials such as organic wastes (from plants and animals) and town
refuse ash as the soil physico-chemical properties show that all the soils of the area are acidic and deficient in
Organic Matter, Total Nitrogen, Available Phosphorus and Exchangeable Bases.
The concentrations heavy metals especially the high Fe, Al, and Mn values obtained show that the acidic condition
of the soils increased the solubility and availability of these metals. This situation encourages leaching of nutrient
elements.
The concentrations of most toxic and carcinogenic PAHs such as Benzo(a)anthracene, Indeno(1,2,3-c,d)pyrene,
Dibenz(a,h)anthracene and Chrysene exceeded their permissible limits and therefore pose grave environmental and
health concerns in the areas; and are attributed to the oil exploitation activities in the area.
There should be awareness campaign and the water in the area should be monitored regularly.
References
1. Osuocha, K. U. Akubugwo, E.I., Chinyere, G. C., Ugbogu, A.E. (2016). Seasonal Impact on phyto-
accumulation potentials of selected edible vegetables grown in Ishiagu quarry minning effluent discharge
soils. African Journal of Environmental Science and Technology. 10: 34-43.
2. Adepoju-Bello A.A, Ojomolade O.O, Ayoola G.A, Coker A.A.B (2009). Quantitative analysis of some
toxic metals in domestic water obtained from lagos metropolis. The Nig. J. pharm., 42(1): 57-60
3. Ideriah, T.J.K, Omuaru, V.O.T. and Adiukwu, U.P. (2005). Heavy metal contamination of soils around
municipal solid wastes Dump in Port Harcourt, Nigeria. Global Journal of Environmental Sc. 4 (1), 1-4.
4. Kraut A, Lilis R, Marcus M, valciukas J.A, Wolff Ms, Landrigan PJ. (1988) Neurotoxic effects of solvent
exposure on sewage treatment workers. Arch Env. Health 43(1):263-268
5. Fetzer, J.C. (2000). The chemistry and analysis of the large polycyclic Aromatic Hydrocarbon. 2nd
ed. Pp
27-29. New York wiley publishers.
6. UNEP (2011). United Nations Environmental Programme Report. Environmental Programme Report.
Environmental Assessment of Ogoniland. ISBN: 978-92-807-3130-9s
0
0.5
1
1.5
con
cen
trat
ion
s (p
pm
)
PAHs
STATION 5
STATION 4
STATION 3
STATION 2
STATION 1
Ideriah TJK et al Chemistry Research Journal, 2017, 2(5):242-256
Chemistry Research Journal
255
7. USEPA (U.S. Environmental Protection Agency) (2014). Drinking water regulations and health advisories.
Office of water, U.S Environmental Protection Agency (USEPA). Washington
8. ATSDR (Agency for Toxic substances and Disease Registry) (1995). Public Health statement for
polycyclic Aromatic Hydrocarbons (PAHs). ATSDR, Atlanta, GA: US Dept of Health and Human
Services, public Health services.
9. Ramirez, N., Cuadras, A., Rovira, E., Marce, R.M., Borrull, F., (2011). Risk Assessment related to
Atmospheric polycyclic aromatic hydrocarbons in Gas and particle phases near industrial sites.
Environmental Health perspectives volume 119, no8.
10. WHO – IPCS (World Health Organization- International Programme on chemical safety). (1998). Selected
Non-heterocyclic polycyclic Aromatic Hydrocarbons Environmental Health Criteria 202
11. Armstrong, B., Hutchison, E., Unwin J., Fletcher T, (2004). Lung cancer risk after exposure to polycyclic
Aromatic Hydrocarbons: a review and meta-analysis. Environ Health Perspect 112:970-978.
12. World Health Organization (WHO) (1997). Non-heterocyclic polycyclic aromatic hydrocarbons, Geneva:
World Health Organization, International programme on chemical safety, Environmental Health Criteria,
202.
13. Dionex corporation (2009) Determination of polycyclic aromatic hydrocarbons (PAHs) in tap water using
on-line solid-phase extraction followed by HPLC with UV and fluorescence detection. Application Note
213, LPN 2128, Sunnyvale, CA
14. Census (2006). National Population Commission Rivers State.
15. Loganathan, P. (1984). Laboratory manual of soil and plant analysis. University of science and
Technology, Port Harcourt, Nigeria. Pp:5-50.
16. Olsen, S.R. and Sommers, L.E (1982). Analysis of Soil Available Phosphorus. Method of Soil Analysis.
Part 2. Chemical and Microbiological Properties, 2nd
edn. Agron. Mongr. 9, ASA and SSSA, Madison, WI,
USA.
17. Bremner, J.M. (1996): Analysis of Total Nitrogen. Method of Soil Analysis Parts 3. Chemical Methods.
SSSA Book Series No. 5 SSSA and ASA, Madison, WI, U.S.A.
18. Mulvaney, R.L (1998). Mineral nitrogen determination. Method of Soil Analysis part 3. Chemical Methods.
SSSA Book Series No. 5 USA
19. Kundsen, N., Patterson, G.A and Pratt, P.F. (1982). Analysis of Na and K. Methods of Soil Analysis.
Chemical and Microbiological Properties. Sec. edn. Agron. Monogr. 9, ASA SSSA, Madison, WI, USA.
20. APHA (1995). Standard Methods for the Examination of water and waste water. 19th
edn. New York, USA
21. Isirimah, N. O., (1987). An Inventory of some chemical properties of selected surface soils of River state of
Nigeria: In proceeding of 15th
annual conference of Soil Science Association of Nigeria. Kaduna, 217-233.
22. Odu C.T.I., L., Nwoboshi, O.F. Esuruoso and O.J.A Ogunwale (1985). Industry operation Areas.
Proceeding of the international seminar on the Petroleum and the Nigerian Environment. Port Harcourt
117-123.
23. Brady, N.C, and Weil, R.R. (1994): The nature and properties of soils (Eleventh Edition). Prentice Hall
Inc., New Jersey, USA. 740pp.
24. Itanna, F., (1998). Comparative study on soil pollution with toxic substances on farmlands close to old and
New Industrial sites in Ethiopia. Bull. Chem. Soc. Ethiop., 12 (2), 105-112.
25. Brady, N.C. (1974): The nature and properties of soils. 8th
Edition. Macmillan Publishing CO., INC., New
York. USA.
26. Landon, J. R. (1991): Booker Tropical soil Manual. A Handbook for soil survey agricultural land evolution
in the tropics and sub-tropics. Longman Science and Technical. Pp. 474.
27. Metson, A.J. (1961): Methods of Soil Analysis for soil Survey Samples. New Zealand Department of Soil
and Industrial Research. Soil Bureau Bulletin 12, Government Printer, Wellington, New Zealand.
28. Smith, R. T. and Atkinson, K. (1975): Techniques in Pedology. A handbook for environmental and
resource studies. 1st edition, Elek Science, London.
Ideriah TJK et al Chemistry Research Journal, 2017, 2(5):242-256
Chemistry Research Journal
256
29. Stocking, M. (1997): Soil erosion and Land degradation. In: O „Riordan, T. (ed) Environmental Science for
environmental Management, Longman, England 224pp.
30. Stegman, R.S. and Heevenklage, J. (1991): Biological treatment of oil contaminated soils. In Bioreactor in
R.E Olfen Buttel (Eds), on site Bioremediation Process Xerenobiotic and Hydrocarbon Treatment. Pp 188-
199.
31. Baker K. H. and Herson, D.S. (1994): Bioremediation. McGraw – Hill Publishing Company, New York.
32. Enwezor, W. O. Udo, E.J; Usoroh, N.J; Ayotade, K. A., Adepetu J.A., Chude, V.O. and Udegbe, C.I.U,
(1988): Fertilizer use and management practices for crops in Nigeria.
33. Ilaco, B.V. (1985): Agricultural compendium for rural development in the tropics and sub-tropics. Elsevier
Amsterdam. Pp. 738.
34. Jones B., Turki, A., (1997): Distribution and speciation of heavy metals unsurficial sediments from Tees
Estuary, northeast England. Mar. Pollut. Buli 34, 768-779.
35. Udechukwu, A.R.H (1972): The potassium status of acid sands of eastern Nigeria. M. Phil. Thesis,
University of Nigeria, Nigeria, Nsukka.
36. Torbert, J.L., Tuladhar, A.R., Burger, J.A., and Bell, J.C. (1988): Minesoil property effects on the height of
ten-year-old white pine. Journal of Environmental Quality 17:189-191.
37. Donahue, R. L., Miller, R. W. and Shickluna, J. C. (1990): Soils. An introduction to soils and plant growth
(fifty Edition). New Delhi, Prentice-Hall of India, 667pp.
38. Reuter, R. (2001): Sewage sludge as an organic amendment for reclaiming surface mine wastes. Soil
Science Society of America Journal. 65:1736-1744.
39. U. S. Environmental Protection Agency (1996). Drinking water regulations and health advisories. Office of
water, U.S environmental protection Agency. Washington.
40. USEPA (2013) polycyclic aromatic hydrocarbons (PAHs) what are the standards and regulations for PAHs
exposures? United State Environmental Protection Agency (USEPA) 1-4