chemistry teachers final - royal society of chemistry · chemistry teacher supply, and the very...
TRANSCRIPT

i
CONTENTS
Executive Summary ii
1. Remit 1
2. Science Teacher Trends 2
3. Requirement for Science Teachers 7
4. Entering the Profession 9
5. Resignations and Retirements 15
6. Projecting Science Teacher Requirements 19
7. Conclusions and Recommendations 22
References 25

ii
EXECUTIVE SUMMARY
Purpose The Centre for Education and Employment Research at the University of Liverpool has been commissioned by the Royal Society of Chemistry to report on the current state of, and trends in, teacher supply in chemistry.
Teacher Numbers The best source of information is (or should be) a series of staffing surveys conducted by the Government every four years from 1984 to 1996, and again in 2002. In these surveys ‘chemistry teacher’ is defined in two ways: by subject taught and by qualification. On the basis of subject taught, the number of chemistry teachers appears to have more than halved since 1984. In terms of qualification, there was a drop of some 40 per cent from 1984 to 1996, with no figures released for 2002 since the response was so poor.
Requirement for Chemistry Teachers On the assumption that there should be a balance of expertise in science teaching at Key Stage 4, it was calculated that there was, in 2002, a requirement for some 8,350 chemistry teachers to cover KS4 and A-level. The 2002 Secondary Schools Curriculum and Staffing Survey found that there were in maintained schools 4,680 teachers with a degree, a BEd or a PGCE in chemistry. There was thus an estimated shortfall of 3,670 to be met by other teachers.
Recruitment to Teacher Training In the past two decades, targets for recruitment to science teacher training have only been met in the three years 1991-93 when the country was in deep economic recession. The allocation of science places is uneven with the majority going to biology and combined science (where the places are also mainly taken by biologists). The net effect is that, since 1984, the proportion of science teacher trainees in chemistry has declined from 30 per cent to 18 per cent. In physics, the drop has been from 30 per cent to 13 per cent. About two-thirds (64 per cent) of the training places in chemistry in 2003 were taken by chemistry graduates, the others being filled from a range of subjects from biochemistry to politics, English and theology. The pattern for physics was similar, but with nearly a quarter of places filled by engineering and technology graduates. However, 29 per cent of the physics graduates entering ITT had opted to train as mathematics teachers.
Resignations and Retirements Chemistry and physics teachers tend to be older, and biology teachers younger, than average. While the proportion of chemistry teachers under 30 has increased from its nadir in 1988, nevertheless insufficient recruits are coming in, and being retained, for chemistry to hold its own, let alone achieve a better balance with biology. Science teachers are not only more likely to be nearer retirement than other teachers, but they are also more often attracted away by independent schools and to government schemes, such as the KS3 science strategy. Resignations from chemistry posts, either to leave the profession or move to another school, were up by 137 per cent in the period 1994-2001.
iii
Projecting the Requirement for Chemistry Teachers Pupil numbers at KS3 are projected to fall from 2004, and at KS4 from 2007. This will reduce the requirement for science teachers by about 1,900 in the decade to 2013. However, chemistry’s ‘share’ would only be about 200 and, bearing in mind the existing deficit, the need will still be to increase recruitment.
Recommendations We make five main recommendations. They are made mainly in the light of the inadequate official data that were available to us in trying to establish the current state of chemistry teacher supply, and the very similar experience of the Smith Inquiry into Post 14 Mathematics Education.
• The Royal Society of Chemistry should undertake, possibly in collaboration with other science societies, a detailed study of the recruitment, deployment and retention of chemistry/science teachers. This could involve a survey to enable the overall situation to be described quantitatively, but there should also be in-depth studies in a sub-sample of schools – say 1 in 100, 32 schools, reflecting the national structure – to see how the various factors interact in particular situations.
• The RSC should associate itself with the recommendations of the Smith Inquiry for better data collection by the Government on the qualifications and deployment of teachers.
• The Society should monitor the Government’s response to the Smith Inquiry’s proposals for boosting recruitment to mathematics teaching and assess the likely impact on teacher supply in chemistry, particularly in view of the recruitment to mathematics teaching of science graduates, including those in chemistry.
• The RSC should press for an explanation of the apparent imbalance in allocations to chemistry, physics and biology PGCE courses, and campaign for more places to be made available to chemistry. It should also campaign for a better balance in recruitment to the combined/general science PGCE, including of more chemistry graduates.
• As part of the study which we have proposed, the Royal Society of Chemistry should pay particular attention to the age of the teachers and their retirement plans with a view to assessing, among other things, the likely impact of raising the retirement age of teachers to age 65.

1
1. REMIT
1.1 The Centre for Education and Employment Research at the University of Liverpool has been commissioned by the Royal Society of Chemistry to compile, and further analyse, the available of statistics relating to the provision of chemistry teachers in schools.
1.2 The brief specified the data the RSC would ideally like.
• Historical data on numbers of science teachers in post and the relationship to the number of secondary age pupils.
• Subject specialisms of the current science teaching force.
• Data on the numbers of science teachers entering and leaving the profession.
• Age profile of the science teaching force.
• Projections of the number of science teachers required to enter the profession each year over the next ten years.
• Projections of the number of subject specialists required each year to both maintain the current position and produce a balanced distribution.

2
2. SCIENCE TEACHER TRENDS
2.1 It is difficult to say with any certainty how many chemistry teachers there are or how the numbers have changed over the years. There is no unique qualification that defines the category. The best source of information is a series of staffing surveys conducted by the Department of Education (in its various guises) every four years from 1984 to 1996, and then again in 2002. In these surveys ‘chemistry teacher’ is operationalised in two ways: by subject taught and by subject of qualification. Charts 2.1 and 2.2 show the trends in chemistry teacher numbers on these two definitions in comparison with the other sciences.
Chart 2.1: Teachers1 by Subject Taught2
Year Chemistry Physics Biology Combined/ General3
Other
Science4
1984 11,800 12,600 14,300 28,400 7,500 1988 10,300 11,000 12,100 26,200 6,100 1992 5,800 6,000 6,500 28,500 3,200 1996 4,600 4,400 5,100 27,300 1,600 2002 5,200 4,700 5,600 28,300 1,600
1. Full-time teachers in maintained secondary schools in England (including middle deemed secondary). 2. Teachers are counted against each subject they are teaching. 3. Post National Curriculum includes integrated science, double award science and single award science. 4. Other science includes geology, environmental science, rural science, agricultural science and science in society. Source: Secondary School Staffing Surveys.
Chart 2.2: Teachers1 by Subject of Qualification2,3
Year4 Chemistry Physics Biology Combined/ General
Other
Science
1984 17,600 19,400 20,700 16,300 14,500 1988 16,600 17,600 18,800 13,700 12,300 1992 15,000 15,900 15,000 16,500 13,700 1996 10,700 10,400 11,300 15,500 6,200
1. Full-time teachers in maintained secondary schools in England (including middle deemed secondary). 2. Teachers are counted once against each subject in which they have a post A level qualification. 3. Teachers qualified in biology, chemistry or physics are treated as qualified to teach general science; teachers qualified to teach general science are treated as qualified to teach biology, chemistry and physics. 4. Response rate in 2002 survey not sufficiently high to compile distribution with any confidence. Source: Secondary School Staffing Surveys.
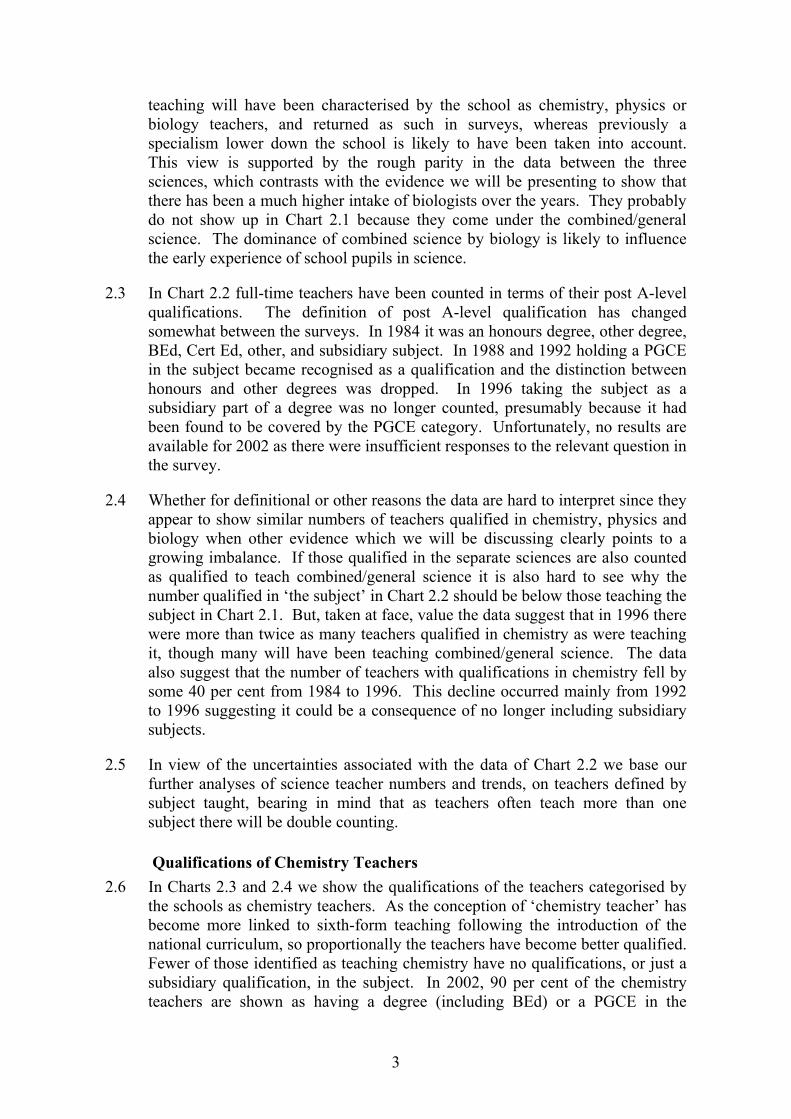
2.2 The two approaches yield very different results. Chart 2.1 shows the number of full-time teachers teaching a science or the sciences for part or whole of their time. They are counted once for each subject area they teach and so may appear several times in the table. On this basis, the number of chemistry teachers seems to have more than halved between 1984 and 2002. This is probably more a reflection of the structure of school science education than how many teachers were available to teach chemistry. With the introduction of the National Curriculum in 1988 the subject category up to the age of 16 in maintained schools became ‘science’, rather than the separate sciences. It is likely that from that date increasingly only teachers with some involvement in sixth-form
3
teaching will have been characterised by the school as chemistry, physics or biology teachers, and returned as such in surveys, whereas previously a specialism lower down the school is likely to have been taken into account. This view is supported by the rough parity in the data between the three sciences, which contrasts with the evidence we will be presenting to show that there has been a much higher intake of biologists over the years. They probably do not show up in Chart 2.1 because they come under the combined/general science. The dominance of combined science by biology is likely to influence the early experience of school pupils in science.
2.3 In Chart 2.2 full-time teachers have been counted in terms of their post A-level qualifications. The definition of post A-level qualification has changed somewhat between the surveys. In 1984 it was an honours degree, other degree, BEd, Cert Ed, other, and subsidiary subject. In 1988 and 1992 holding a PGCE in the subject became recognised as a qualification and the distinction between honours and other degrees was dropped. In 1996 taking the subject as a subsidiary part of a degree was no longer counted, presumably because it had been found to be covered by the PGCE category. Unfortunately, no results are available for 2002 as there were insufficient responses to the relevant question in the survey.
2.4 Whether for definitional or other reasons the data are hard to interpret since they appear to show similar numbers of teachers qualified in chemistry, physics and biology when other evidence which we will be discussing clearly points to a growing imbalance. If those qualified in the separate sciences are also counted as qualified to teach combined/general science it is also hard to see why the number qualified in ‘the subject’ in Chart 2.2 should be below those teaching the subject in Chart 2.1. But, taken at face, value the data suggest that in 1996 there were more than twice as many teachers qualified in chemistry as were teaching it, though many will have been teaching combined/general science. The data also suggest that the number of teachers with qualifications in chemistry fell by some 40 per cent from 1984 to 1996. This decline occurred mainly from 1992 to 1996 suggesting it could be a consequence of no longer including subsidiary subjects.
2.5 In view of the uncertainties associated with the data of Chart 2.2 we base our further analyses of science teacher numbers and trends, on teachers defined by subject taught, bearing in mind that as teachers often teach more than one subject there will be double counting.
Qualifications of Chemistry Teachers 2.6 In Charts 2.3 and 2.4 we show the qualifications of the teachers categorised by
the schools as chemistry teachers. As the conception of ‘chemistry teacher’ has become more linked to sixth-form teaching following the introduction of the national curriculum, so proportionally the teachers have become better qualified. Fewer of those identified as teaching chemistry have no qualifications, or just a subsidiary qualification, in the subject. In 2002, 90 per cent of the chemistry teachers are shown as having a degree (including BEd) or a PGCE in the

4
subject. Nevertheless, in terms of raw numbers there are apparently fewer with chemistry degrees in 2002 than 1984 – 3,744 against 6,490. This could be because some of those with chemistry degrees are now counted as science teachers.
Chart 2.3: Teachers Teaching Chemistry by Qualification1 Numbers Year Degree BEd PGCE2 Cert Ed Other3 None Total
1984 6,490 354 - 708 1,770 2,360 11,800 1988 5,459 412 1,030 515 1,751 1,133 10,300 1992 3,596 174 696 174 870 290 5,800 1996 3,450 230 690 92 - 138 4,600 2002 3,744 312 624 52 52 364 5,200
1. Highest level of qualification in subject taught reading from left to right. 2. Teachers holding PGCE but not degree in the subject; not distinguished as a category in 1984. 3. Main subject of other qualification, other related qualification or subsidiary subject in degree. Sources: Secondary School Staffing Surveys.
Chart 2.4: Per Cent Teachers Teaching Chemistry by Qualification1 Per Cent Year
Degree BEd PGCE2 Cert Ed Other3 None Total
1984 55 3 - 6 15 20 11,800 1988 53 4 10 5 17 11 10,300 1992 62 3 12 3 15 5 5,800 1996 75 5 15 2 - 3 4,600 2002 72 6 12 1 1 7 5,200
1. Highest level of qualification in subject taught reading from left to right. 2. Teachers holding PGCE but not degree in the subject; not distinguished as a category in 1984. 3. Main subject of other qualification, other related qualification or subsidiary subject in degree. Sources: Secondary School Staffing Surveys.
Comparisons with Other Sciences 2.7 The qualification pattern in chemistry is broadly in line with the other sciences.
Charts 2.5 and 2.6 show the numbers and percentages of science teachers holding a degree in the subject taught as revealed in the Secondary Staffing Surveys. In all the surveys those specialising in chemistry emerged as the most likely to hold a cognate degree. In 2002, for example, it was 72 per cent compared with 71 per cent in biology and 63 per cent in physics. In the combined/general category the numbers shown as having a degree leapt ten fold between 1992 and 1996 as a result of a definitional change in which those with chemistry, physics, biology and other science degrees were counted as having a degree in combined/general science. Even so, by 2002, apparently only 62 per cent of those teaching science held a science degree, leaving 10,000 without.

5
Chart 2.5: Teachers with Degree in Subject Taught
Year Chemistry Physics Biology Combined/ General
Other
Science
1984 6,490 4,914 6,435 852 975 1988 5,459 4,070 5,566 786 732 1992 3,596 3,060 2,145 1,425 768 1996 3,450 2,728 3,213 15,561 368 2002 3,744 2,961 3,976 17,546 160
Chart 2.6: Percentages of Teachers with Degree in Subject Taught
Year Chemistry Physics Biology Combined/ General
Other
Science
1984 55 39 54 3 13 1988 53 37 46 3 12 1992 62 51 33 5 24 1996 75 62 63 57 23 2002 72 63 71 62 10
2.8 When the definition of being qualified to teach the subject is broadened out to include holding any degree including a BEd and/or a PGCE in the subject, as in Charts 2.7 and 2.8, all the percentages increase but for the combined/general category it goes up markedly suggesting that not a few teachers becoming qualified through a PGCE in science are entering training on the basis of other degrees. We will explore this in more detail in Chapter 4.
Chart 2.7: Teachers with Degree or PGCE in Subject Taught
Year Chemistry Physics Biology Combined/ General
Other
Science
1984 6,884 5,292 7,722 852 1,125 1988 6,881 5,500 7,502 2,620 915 1992 4,466 4,080 4,095 6,270 834 1996 4,370 4,004 4,539 22,386 372 2002 4,680 4,183 4,984 23,772 304
Chart 2.8: Percentages of Teachers with Degree or PGCE in Subject Taught
Year Chemistry Physics Biology Combined/ General
Other
Science
1984 58 42 54 3 15 1988 67 50 62 10 15 1992 77 68 63 22 26 1996 95 91 89 82 23 2002 90 89 89 84 19
6
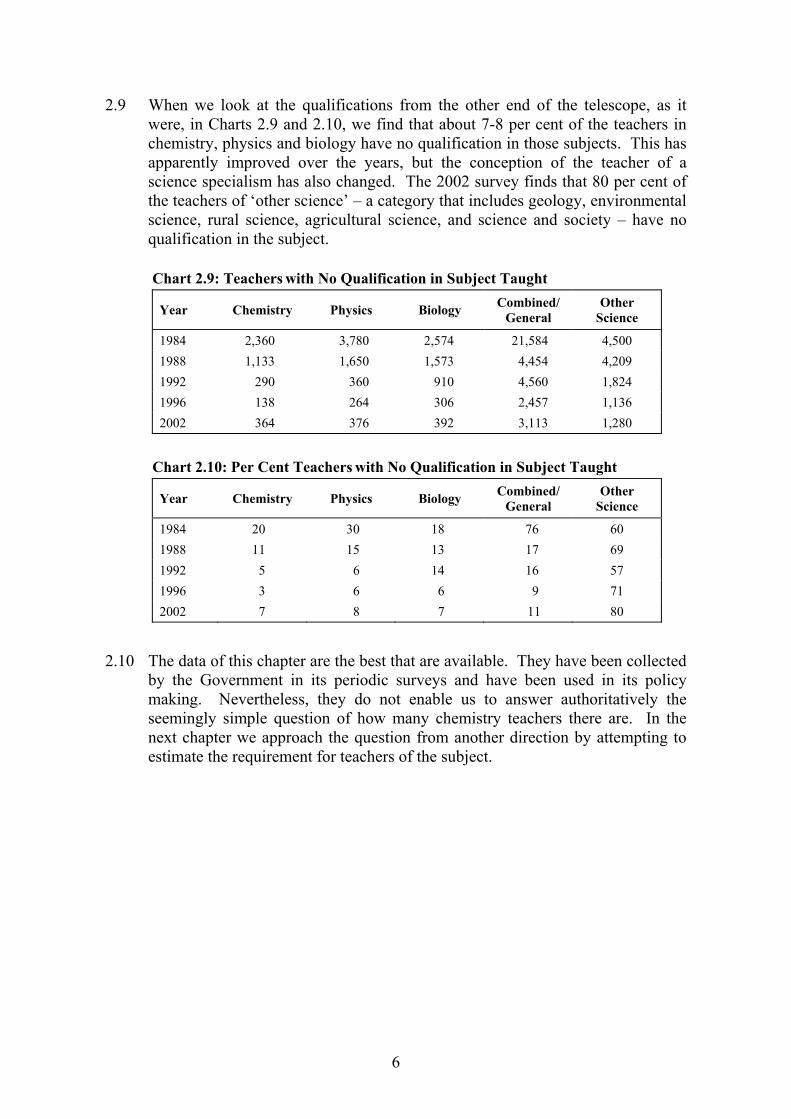
2.9 When we look at the qualifications from the other end of the telescope, as it were, in Charts 2.9 and 2.10, we find that about 7-8 per cent of the teachers in chemistry, physics and biology have no qualification in those subjects. This has apparently improved over the years, but the conception of the teacher of a science specialism has also changed. The 2002 survey finds that 80 per cent of the teachers of ‘other science’ – a category that includes geology, environmental science, rural science, agricultural science, and science and society – have no qualification in the subject.
Chart 2.9: Teachers with No Qualification in Subject Taught
Year Chemistry Physics Biology Combined/ General
Other
Science
1984 2,360 3,780 2,574 21,584 4,500 1988 1,133 1,650 1,573 4,454 4,209 1992 290 360 910 4,560 1,824 1996 138 264 306 2,457 1,136 2002 364 376 392 3,113 1,280
Chart 2.10: Per Cent Teachers with No Qualification in Subject Taught
Year Chemistry Physics Biology Combined/ General
Other
Science
1984 20 30 18 76 60 1988 11 15 13 17 69 1992 5 6 14 16 57 1996 3 6 6 9 71 2002 7 8 7 11 80
2.10 The data of this chapter are the best that are available. They have been collected by the Government in its periodic surveys and have been used in its policy making. Nevertheless, they do not enable us to answer authoritatively the seemingly simple question of how many chemistry teachers there are. In the next chapter we approach the question from another direction by attempting to estimate the requirement for teachers of the subject.
7
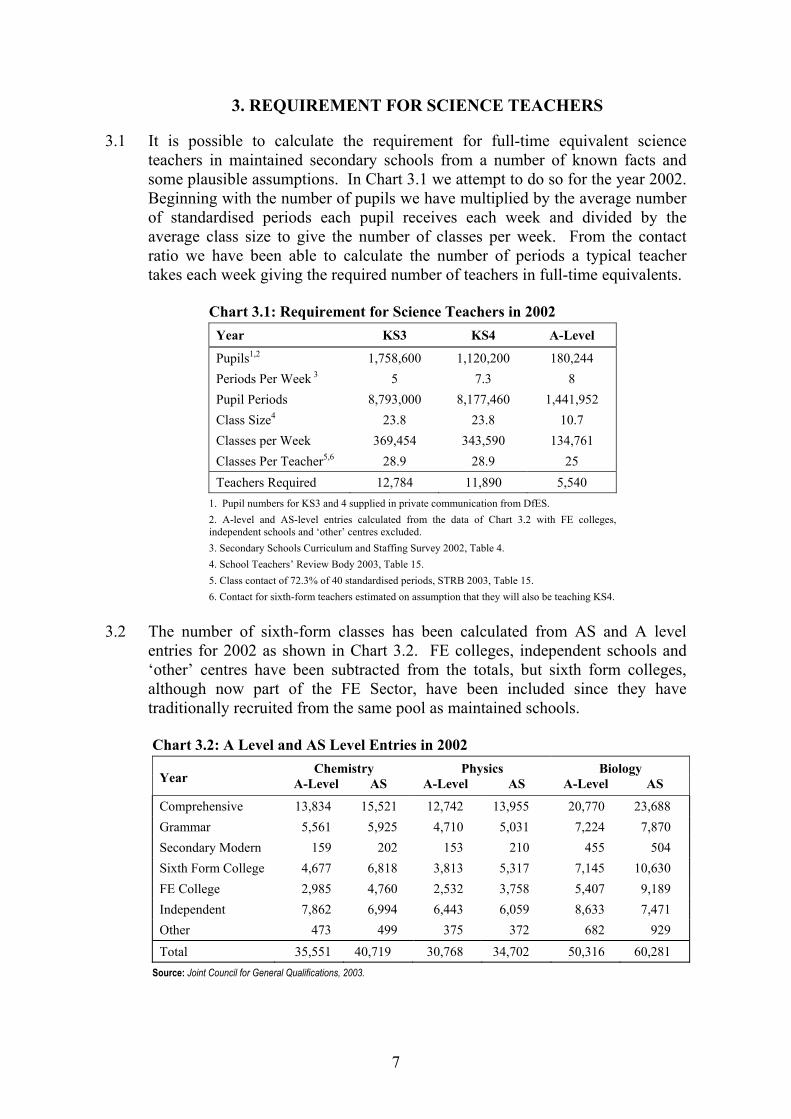
3. REQUIREMENT FOR SCIENCE TEACHERS
3.1 It is possible to calculate the requirement for full-time equivalent science teachers in maintained secondary schools from a number of known facts and some plausible assumptions. In Chart 3.1 we attempt to do so for the year 2002. Beginning with the number of pupils we have multiplied by the average number of standardised periods each pupil receives each week and divided by the average class size to give the number of classes per week. From the contact ratio we have been able to calculate the number of periods a typical teacher takes each week giving the required number of teachers in full-time equivalents.
Chart 3.1: Requirement for Science Teachers in 2002 Year KS3 KS4 A-Level
Pupils1,2 1,758,600 1,120,200 180,244 Periods Per Week 3 5 7.3 8 Pupil Periods 8,793,000 8,177,460 1,441,952 Class Size4 23.8 23.8 10.7 Classes per Week 369,454 343,590 134,761 Classes Per Teacher5,6 28.9 28.9 25 Teachers Required 12,784 11,890 5,540
1. Pupil numbers for KS3 and 4 supplied in private communication from DfES. 2. A-level and AS-level entries calculated from the data of Chart 3.2 with FE colleges, independent schools and ‘other’ centres excluded. 3. Secondary Schools Curriculum and Staffing Survey 2002, Table 4. 4. School Teachers’ Review Body 2003, Table 15. 5. Class contact of 72.3% of 40 standardised periods, STRB 2003, Table 15. 6. Contact for sixth-form teachers estimated on assumption that they will also be teaching KS4.
3.2 The number of sixth-form classes has been calculated from AS and A level entries for 2002 as shown in Chart 3.2. FE colleges, independent schools and ‘other’ centres have been subtracted from the totals, but sixth form colleges, although now part of the FE Sector, have been included since they have traditionally recruited from the same pool as maintained schools.
Chart 3.2: A Level and AS Level Entries in 2002 Chemistry Physics Biology
Year A-Level AS A-Level AS A-Level AS
Comprehensive 13,834 15,521 12,742 13,955 20,770 23,688 Grammar 5,561 5,925 4,710 5,031 7,224 7,870 Secondary Modern 159 202 153 210 455 504 Sixth Form College 4,677 6,818 3,813 5,317 7,145 10,630 FE College 2,985 4,760 2,532 3,758 5,407 9,189 Independent 7,862 6,994 6,443 6,059 8,633 7,471 Other 473 499 375 372 682 929 Total 35,551 40,719 30,768 34,702 50,316 60,281
Source: Joint Council for General Qualifications, 2003.

8
3.3 Overall, the requirement for science teachers in full-time equivalents comes out at about 30,100. The actual number of science teachers recorded in the Secondary Schools Curriculum and Staffing Survey for 2002 is 45,400 (see Chart 2.1). But any full-time teacher taking some science is included so there will be some double counting. On the assumption that, on average, full-time teachers spend two-thirds of their time teaching science, the 30,100 ftes become 45,150 full-time teachers which is of the same order as the teachers who are in post.
3.4 In order to derive an estimate of the number of chemistry specialists that are needed we take the view that KS3 can be regarded as general science, but that at KS4 there should be a balance in combined science between chemistry, physics and biology. On these assumptions, the requirement for 30,100fte science teachers can be thought to be distributed as shown in Chart 3.3.
Chart 3.3: Requirement for Science Teachers
3.5 For chemistry and physics, it appears that there are enough graduate teachers to cover the A-level teaching, but not for providing both A-level and KS4. In the case of chemistry, the requirement would be 5,570 ftes or 8,355 teachers, compared to the 3,744 graduates or 4,680 graduates and/or PGCEs actually found to be teaching the subject. Presumably the difference is met by the less well-qualified staff of Chart 2.3, plus some teaching from other scientists and from outside the subject.

9
4. ENTERING THE PROFESSION
4.1 The intimations of shortages in the recruitment of well-qualified science teachers of Chapter 3 are borne out by the trends in recruitment to science-teacher training. Chart 4.1 shows the targets (now called allocations) and intakes over the past twenty years. It is striking that, apart from the three years 1991-93, when the economy was in deep recession, the targets have not been met. Although the targets are said to have been derived from the Department’s model (DES, 1990; DfEE, 1998), the shape of the graph suggests that the availability of potential recruits may have had some part to play. Through to 1992 the targets seem to have been held down by the failure to meet them, but, having been exceeded handsomely in that year, they were then almost doubled over three years. Subsequently, they seem to have been brought down again by further shortfalls, but since 1999 they have been allowed to edge up in response to improving, but still insufficient, recruitment.
0
1
2
3
4
1983/84 1985 1987 1989 1991 1993 1995 1997 1999 2001 2003/04Academic Year
Thou
sand
s
Target
Intake
Science
1. England and Wales. Source: TTA (1996). A Strategic Plan for Teacher Supply and Recruitment. A Discussion Document. London: TTA; Annual Reports of the School Teachers’ Review Body; Written Evidence from the DfES to the STRB.
4.2 Science targets and intakes are aggregates of recruitment to the sciences and combined/general science. Chart 4.2 gives the applicants to the different areas of science for the last four years, and Chart 4.3, the actual acceptances as measure of intake. Chart 4.2 shows that the sciences have shared in the improvement to recruitment associated with the incentives intended to boost take-up of the shortage subjects, although not uniformly. While chemistry applicants are up on the year 2000, they are down on 2001 and 2002. Similarly biology; but physics has continued to show increases from a very low base.
4.3 Although applicant numbers have been moving upwards intake figures have been rising even faster. Intakes have gone up year by year in chemistry and biology in spite of some falling back in applications. Whereas applicants in physics are up by 49.0 per cent over the four years, acceptances have risen by
Chart 4.1: Targets (Allocations) and Intakes to Science ITT1

10
61.5 per cent, prompting questions about whether the same standards are being applied.
Chart 4.2: Applicants1 to PGCE Science Courses by Year
Science 2000 2001 2002 2003 % Change 2000-03
Chemistry 668 768 795 742 11.1 Physics 343 372 455 511 49.0 Biology 1,609 1,790 1,698 1,625 1.0 Combined/General 1,067 1,115 1,091 1,210 13.4 Other 41 48 40 40 -2.4
1. England and Wales. Source: GTTR Applicant Statistics posted on website at www.gttr.ac.uk.
Chart 4.3: Accepted Applicants1,2 to PGCE Science Courses by Year
Science 2000 2001 2002 2003 % Change 2000-03
Chemistry 403 443 481 494 22.6 Physics 218 226 278 352 61.5 Biology 903 919 965 986 9.2 Combined/General 696 689 716 848 21.8 Other 17 15 18 20 17.6
1. England and Wales. 2. Based on funded places and including deferred entry. Source: GTTR Applicant Statistics posted on website at www.gttr.ac.uk.
4.4 But what is also notable about the acceptances is the gulf between recruitment to chemistry and physics, on the one hand, and biology on the other. The difference seems to be built into the allocations. While it is true, as we have seen, that there are more AS and A-level biology students than in chemistry and physics, there are not twice as many. If we take into account the need for balance at KS4 the difference in requirement for biology teachers becomes only about 14 per cent compared with chemistry and 18 per cent compared with physics (see Chart 3.3). Again one has to wonder whether the targets are determined as much by the availability of applicants as need.
4.5 The changing patterns of recruitment to the different sciences are traced in Chart 4.4. While intakes to chemistry and physics are little different from what they were twenty years ago, that to biology has risen steadily to double. The impact of the 1991-93 economic recession can be seen in the applicant figures for all areas. The additional ‘bump’ in the physics applicant figures around 1987 is associated with the introduction of training bursaries in that subject in 1986 which were discontinued in the early nineties.

11
Chart 4.4: Recruitment to PGCE Courses
Chemistry Physics
0
2
4
6
8
10
12
14
16
18
83 85 87 89 91 93 95 97 99 1 3
Hund
reds
0
2
4
6
8
10
12
14
16
18
83 85 87 89 91 93 95 97 99 1 3
Hund
reds
Biology Combined Science
0
2
4
6
8
10
12
14
16
18
83 85 87 89 91 93 95 97 99 1 3
Hund
reds
0
2
4
6
8
10
12
14
16
18
83 85 87 89 91 93 95 97 99 1 3
Hund
reds
Intake Applications
Source: GTTR Annual Reports, except for 2003 which is taken from the website and includes deferred entries.
Chart 4.5: Subject Balance in Science PGCE Intakes1 Per Cent
Year2 N Chemistry Physics Biology Combined/General Other
1983 1,529 30.1 30.0 28.6 5.4 5.9 1986 1,377 25.1 33.8 32.1 4.4 4.6 1989 1,375 30.5 24.3 37.6 3.7 3.9 1992 1,972 25.6 27.3 34.4 7.7 5.0 1995 2,519 21.0 16.7 31.4 25.8 5.2 1998 2,028 18.2 9.9 40.2 30.1 1.5 2000 2,271 17.2 9.9 39.9 32.7 0.8 2001 2,360 19.3 10.3 38.2 31.5 0.7 2002 2,416 18.8 12.6 38.1 29.5 0.9 2003 2,700 18.3 13.0 36.5 31.4 0.7
1. England and Wales. 2. 1990-92 does not include articled teachers. Source: GTTR Annual Reports, except for 2003 which is taken from the website and includes deferred entries.
Year Year

12
4.6 The graphs in Chart 4.4 also bring out the great growth in combined/general science teacher training since ‘science’ was made the National Curriculum subject in 1988. There are thus two possible sources of imbalance in recruitment to science teaching: the different intakes to the separate sciences and the make-up of the combined/general science intake. We will explore this in detail latter.
4.7 The changing composition of the PGCE science intake is summarized in Chart 4.5. It shows that in, 1983, the science teacher trainees consisted of about 30 per cent from each of the sciences, plus ten per cent ‘other’ or ‘general’. But, by 2003, there were fewer than 20 per cent in chemistry and only 13 per cent in physics. Even these figures are an improvement on 2000. The other two-thirds of PGCE science trainees in 2003 were on biology or combined/general science courses.
4.8 The balance of science provision in the national curriculum will depend also on the subject qualifications of those recruited. Chart 4.6 shows the degree subjects of the PGCE trainees in 2001-02. Charts 4.7 and 4.8 present the same data expressed as percentages, first of the trainees by subject of training, then by subject of qualification.
Chart 4.6: Degree Subjects of PGCE Trainees, 2001-02 PGCE Course
Degree Subject Chem Physics Biology Comb/ General Maths
Total
Chemistry 177 1 14 128 9 329 Biochemistry/ Biophysics 38 - 37 92 3 170
Physics 2 80 3 55 47 187 Biological Sciences 9 2 314 396 9 730 Medical Sciences 9 2 64 89 4 168 Other Sciences 14 6 11 80 33 144 Combined Science 13 8 21 98 21 161 Mathematics 0 0 0 2 566 568 Engineering & Technology 10 31 13 44 187 285
Other Subjects 5 4 17 51 190 267 Total 2771 1342 4943 1,0354 1,0695 3,009
1. 31 no information, including 7 in SCITTs. 2. 14 no information, including 1 in SCITT. 3. 80 no information, including 14 in SCITTs. 4. 557 no information, including 426 in SCITTs. 5. 191 no information, including 47 in SCITTs. Source: Teacher Training Agency (personal communication).
4.9 Chart 4.7 brings out the domination of the combined/general intake by the biological sciences. Nearly half the intake (47 per cent) comes from the biological sciences per se or the medical sciences. The ‘other’ sciences which contribute another 8 per cent include environmental science and psychology. In contrast, only 12 per cent and 5 per cent have qualifications in chemistry and

13
physics respectively. Five per cent of the combined/general intake comes from a wide variety of ‘other’ subjects including economics, sociology, geography, English, media studies and much else besides.
Chart 4.7: Percentages of PGCE Trainees, 2001-02, by Subject of Training PGCE Course
Degree Subject Chemistry Physics Biology Combined/ General Maths
Chemistry 63.9 0.7 2.8 12.4 0.8 Biochemistry/ Biophysics 13.7 0.0 7.5 8.9 0.3
Physics 0.7 59.7 0.6 5.3 4.4 Biological Sciences 3.2 1.5 63.6 38.3 0.8 Medical Sciences 3.2 1.5 13.0 8.6 0.4 Other Sciences 5.1 4.5 2.2 7.7 3.1 Combined Science 4.7 6.0 4.3 9.8 2.0 Mathematics 0.0 0.0 0.0 0.2 52.9 Engineering & Technology 3.6 23.1 2.6 4.3 17.5
Other Subjects 1.8 3.0 3.4 4.9 17.8
Chart 4.8: Percentages of PGCE Trainees, 2001-02, by Qualification PGCE Course
Degree Subject Chemistry Physics Biology Combined/ General Maths
Chemistry 53.8 0.3 4.3 38.9 2.7 Biochemistry/ Biophysics 22.4 0.0 21.8 54.1 1.8
Physics 1.1 42.8 1.6 29.4 25.1 Biological Sciences 1.2 0.3 43.0 54.2 1.2 Medical Sciences 5.4 1.2 38.1 53.0 2.4 Other Sciences 9.7 4.2 7.6 55.6 22.9 Combined Science 8.1 5.0 13.0 60.9 13.0 Mathematics 0.0 0.0 0.0 0.4 99.6 Engineering & Technology 3.5 10.9 4.6 15.4 65.6
Other Subjects 2.6 2.1 8.9 26.8 71.2
4.10 Table 4.7 also shows that about two-thirds (64 per cent) of the PGCE chemistry intake has a degree in chemistry and another 14 per cent a degree in biochemistry/biophysics. In physics, about 60 per cent has a physics degree, and another 23 per cent a degree in engineering or technology. More than three quarters of the biology intake (77 per cent) holds a degree in the biological or medical sciences, with another 7.5 per cent graduating in biochemistry or biophysics.

14
4.11 Table 4.8 shows that a quarter of the trainees with physics degrees (47 out of 187) had chosen to train as mathematics teachers, possibly in some cases because less practical work would be involved. This trend is likely to be exacerbated if the proposal in the recent Smith (2004) report for extra incentives to recruit mathematics teachers is taken up. Chemistry could also be affected though in 2001-02 only 3 per cent of the recruits with degrees in chemistry were training to be mathematics teachers. Most were either training to teach chemistry itself (54 per cent) or combined science (39 per cent). The difficulties of recruiting to teacher training in mathematics are underlined by the wide variety of backgrounds from which the trainees are drawn.
4.12 The training targets for the different areas of science seem out of line with the requirements in the specialisms as calculated in Chapter 3, with fewer chemists and physicists, and more biologists, than would seem necessary to achieve balanced provision. The intake is skewed even further by combined science which recruits predominantly from biology. While there may be enough chemistry graduates in schools to cover A-level teaching, it seems likely that they are under-represented in the teaching of combined science. This will be masked by treating the subject as science and counting all science teachers as appropriately qualified to teach it. There is a case for a special survey to determine the extent to which chemistry teaching in Key Stage 4 is taken by those with an inadequate background in the subject.

15
5. RESIGNATIONS AND RETIREMENTS
5.1 We now turn to teachers leaving. Here it is important to draw a distinction between teachers leaving schools and leaving the profession. Teachers have to resign from one school to take a post in another. Counting resignations is, therefore, a measure of both turbulence in the system and wastage from it.
5.2 The Employers’ Organisation for Local Government has for a number of years conducted in January a survey of resignations from schools in the previous calendar year. These surveys cover both moves to other schools and leaving the profession. Chart 5.1 shows the data for full-time teachers on permanent contracts leaving maintained secondary schools in the eight years from 1994 to 2001. It is evident that over this period there has been a considerable increase in resignations from schools. Across all subjects it has more than doubled, and turnover among chemistry teachers was broadly in line with the overall picture. In physics it was somewhat below average, but in biology and particularly in the general science category it was considerably above.
Chart 5.1: Resignations by Subject1
Year Chemistry Physics Biology General Science
All Subjects
% Wastage
1994 366 377 377 521 11,078 63.9 1995 384 396 372 551 11,986 66.2 1996 422 398 410 578 12,049 65.3 1997 555 524 587 809 15,864 65.2 1999 587 587 621 906 16,784 56.4 2000 739 762 858 1,334 23,825 49.6 2001 866 688 1,004 1,589 25,473 45.5 %Change +136.6 +82.5 +166.3 +205.0 +129.9 -28.8
1. Full-time teachers in maintained secondary schools in England (including middle deemed secondary). Source: Employers’ Organisation, Annual Surveys of Teacher Resignations and Recruitment.
5.3 The Employers’ Organisation does not publish data on turnover and wastage for the individual subjects, but overall wastage is shown as having declined by nearly 20 percentage points (28.8 per cent change) in the eight-year period. This indicates that movements between schools have contributed more to the increase in resignations than has leaving teaching. Nevertheless, loss from the profession rose also. For all subjects together the increase was 62.6 per cent. Applying the overall wastage rate to the individual subjects we can estimate loss to teaching as shown in Chart 5.2. As with the turnover rates, loss from chemistry was in line with the average, with again physics somewhat below, and biology and general science above. Since wastage, to some extent, reflects the size of the pool from which the teachers are resigning, greater loss from biology and general science probably reflects higher recruitment to these areas (as we saw in Chapter 4).

16
Chart 5.2: Estimates of Teachers1 Leaving the Profession
Year Chemistry Physics Biology Other
Science
1994 234 241 241 333 1995 254 262 246 365 1996 276 260 268 377 1997 362 342 383 527 1999 331 331 350 511 2000 367 378 426 662 2001 394 313 457 718 %Change +68.4 +29.9 +89.6 +115.6
1. Full-time teachers in maintained secondary schools in England (including middle deemed secondary). Source: Employers’ Organisation, Annual Surveys of Teacher Resignations and Recruitment.
5.4 We are able to explore more fully where those resigning from schools in 2002 were going by drawing on the results of a national survey (ten per cent structured sample) we conducted for the DfES (Smithers and Robinson, 2003). Chart 5.3 list the destinations of the science teachers and the teachers of other subjects. The 261 science resignees included only 21 identified as chemistry teachers, 27 as physics teachers and 15 as biology teachers, so it seems likely that the headteachers who provided information were mainly thinking of them all as science teachers.
Chart 5.3: Destinations Science Other Subjects Total Destination N % N % N %
Full-Time Maintained Sch 120 46.0 762 48.8 882 48.4 Part-Time Maintained Sch 3 1.1 23 1.5 26 1.4 Supply Teaching 5 1.9 33 2.1 38 2.1 Independent School 13 5.0 57 3.6 70 3.8 Teaching Abroad 11 4.2 70 4.5 81 4.4 Lecturing FE/HE 1 0.4 13 0.8 14 0.8 Other Education 24 9.2 78 5.0 102 5.6 Other Employment 8 3.1 96 6.1 104 5.7 Maternity 6 2.3 45 2.9 51 2.8 Family Care 5 1.9 36 2.3 41 2.2 Travel 11 4.2 68 4.4 79 4.3 Normal-Age Retirement 16 6.1 72 4.6 88 4.8 Ill Health Retirement 10 3.8 38 2.4 48 2.6 Early Retirement 21 7.7 108 6.9 128 7.0 Other2 8 3.1 63 4.0 71 3.9 Total 261 100.0 1,562 100.0 1,823 100.0
1. Full-time permanent teachers only. 2. Includes redundancy and overseas returning home.

17
5.5 About half those resigning were going to teach, either full-time or part-time, in another maintained school, with the percentage of science teachers similar to that in other subjects in this respect. In so far as the science teachers were distinguishable as a group, they were more likely to be leaving to take an education post outside teaching, to move to an independent school, or to be retiring. The relatively high proportion taking education posts outside teaching, in part, reflects the active recruitment by the Government’s Key Stage 3 Science Strategy at this time. The greater proportion of moves to independent schools is consistent with that sector drawing in teachers from maintained schools, especially where good teachers are in short supply. Science teachers were also more likely to retire. Proportionally more were reaching the normal age for retirement, but they were also more likely to go prematurely or for reasons of ill health. Altogether 17.6 per cent of the science teachers were retiring compared with 13.9 per cent of those in other subjects. This leads us to look at the age of the teachers.
Chart 5.4: Age of Teachers by Subject Taught1 Per Cent Subject
Under 30 30-39 40-49 50 or Over N in
thousands
Chemistry 16 26 28 30 5.2 Physics 17 28 27 29 5.6 Biology 27 26 25 21 5.6 Combined/General Science 21 25 27 27 28.3
Other Sciences 23 16 31 30 1.6 All Subjects 22 25 28 25 388.4
1.Full-time teachers counted once against each subject they are teaching. Source: DfES (private communication).
Age 5.6 Chart 5.4 shows that chemistry and physics teachers tend to be older, and
biology teachers younger, than the average. This reflects the different rates of recruitment discussed in Chapter 4. It also indicates that science teaching is likely to move more in the direction of biology in coming years unless recruitment to the physical science is increased.
Chart 5.5: Trends in Age1 of Chemistry Teachers Per Cent Year
Under 30 30-39 40-49 50 or Over N in
thousands
1984 16 41 29 14 17.6 1988 9 27 48 17 16.6 1992 13 33 39 14 15.0 1996 14 20 42 23 10.7 2002 16 26 28 30 5.2
1. For years 1984-96 inclusive, full-time teachers with a post A-level qualification in chemistry; for 2002 by subject taught. Source: Secondary School Staffing Surveys and DfES (private communication).
18
5.7 The ageing of chemistry teachers is brought out clearly in Chart 5.5. Since 1984 the proportion over 50 has more than doubled as the wave recruited during the boom years of the 1970s has flowed through the system. Chart 5.5 also shows that the percentage of chemistry teachers under 30 has recovered somewhat from the nadir of 1988, but nevertheless the subject still does not appear to be recruiting sufficient teachers to renew itself, let alone arrive at a better balance with biology.
19
6. PROJECTING SCIENCE TEACHER REQUIREMENTS
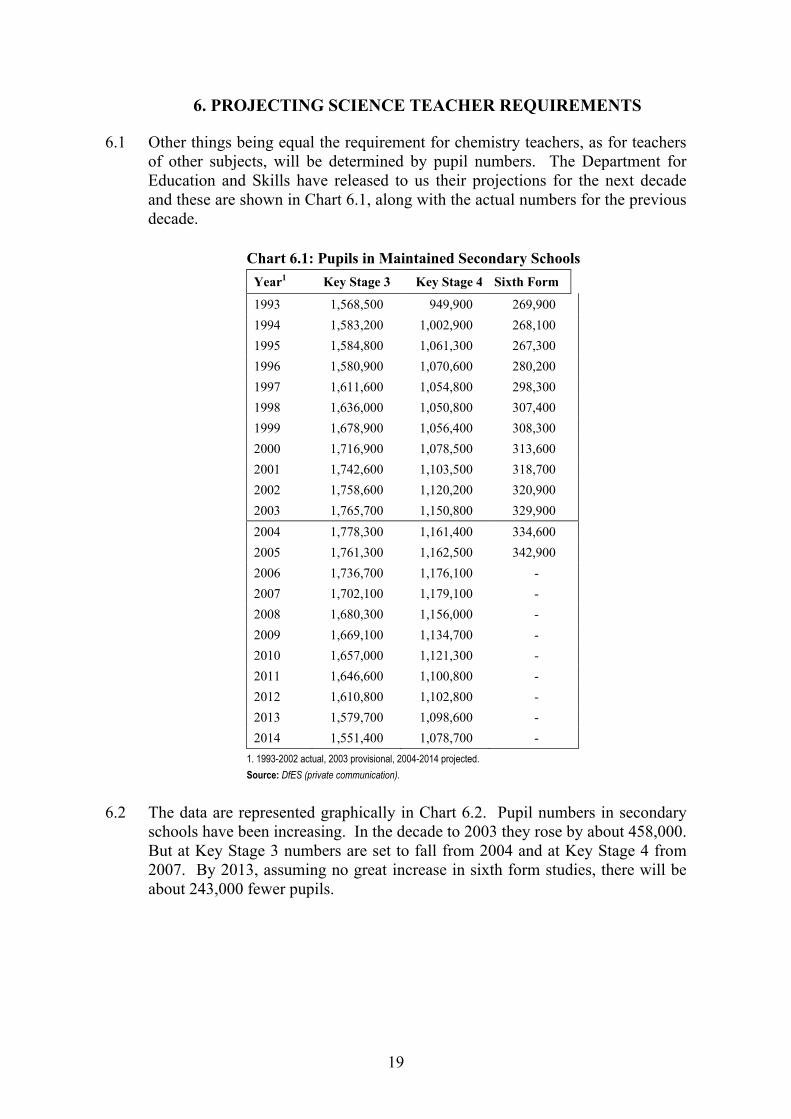
6.1 Other things being equal the requirement for chemistry teachers, as for teachers of other subjects, will be determined by pupil numbers. The Department for Education and Skills have released to us their projections for the next decade and these are shown in Chart 6.1, along with the actual numbers for the previous decade.
Chart 6.1: Pupils in Maintained Secondary Schools Year1 Key Stage 3 Key Stage 4 Sixth Form
1993 1,568,500 949,900 269,900 1994 1,583,200 1,002,900 268,100 1995 1,584,800 1,061,300 267,300 1996 1,580,900 1,070,600 280,200 1997 1,611,600 1,054,800 298,300 1998 1,636,000 1,050,800 307,400 1999 1,678,900 1,056,400 308,300 2000 1,716,900 1,078,500 313,600 2001 1,742,600 1,103,500 318,700 2002 1,758,600 1,120,200 320,900 2003 1,765,700 1,150,800 329,900 2004 1,778,300 1,161,400 334,600 2005 1,761,300 1,162,500 342,900 2006 1,736,700 1,176,100 - 2007 1,702,100 1,179,100 - 2008 1,680,300 1,156,000 - 2009 1,669,100 1,134,700 - 2010 1,657,000 1,121,300 - 2011 1,646,600 1,100,800 - 2012 1,610,800 1,102,800 - 2013 1,579,700 1,098,600 - 2014 1,551,400 1,078,700 -
1. 1993-2002 actual, 2003 provisional, 2004-2014 projected. Source: DfES (private communication).
6.2 The data are represented graphically in Chart 6.2. Pupil numbers in secondary schools have been increasing. In the decade to 2003 they rose by about 458,000. But at Key Stage 3 numbers are set to fall from 2004 and at Key Stage 4 from 2007. By 2013, assuming no great increase in sixth form studies, there will be about 243,000 fewer pupils.

20
0
0.5
1
1.5
2
1994 1996 1998 2000 2002 2004 2006 2008 2010 2012 2014Year
Mill
ions
Key Stage 3
Key Stage 4
Sixth Form
1. Pupil numbers in FTEs 1986-1999, and projections 2000-2010. Source: DfES (personal communication) plus our own projections for sixth-form numbers beyond 2005.
0
5
10
15
20
25
30
35
40
2002 2003 2004 2005 2006 2007 2008 2009 2010 2011 2012 2013 2014Year
Thou
sand
s
ScienceTeachers
Chemistry Teachers
1. Based on pupil number projections of Chart 6.1. .
6.3 The impact on the requirement for science and chemistry teachers is shown in Chart 6.3. This has been arrived at by carrying forward the calculations of Chart 3.1 to future years. All the variables except pupil numbers at Key Stages 3 and 4 have been held constant including, the number of A-level students. On these assumptions, there will a requirement for about 1,900 fewer science teachers by 2013, a reduction of 6.3 per cent on 2003. Chemistry’s ‘share’ of the decrease would be only 184 (or 3.2 per cent). Since there is a strong case for increasing
Chart 6.2: Secondary Pupil Numbers1 1994-2014
Chart 6.3: Projections of Teacher Numbers1

21
the number of chemistry teachers relative to biology teachers, and since better qualified teachers and structural changes could lead to greater take-up of A-level chemistry, it is fair to conclude that changing pupil numbers will have relatively little impact on the requirement for chemistry teachers in the next decade.
22
7. CONCLUSIONS AND RECOMMENDATIONS
7.1 It is difficult to report accurately on the current state of teacher supply in chemistry in England for at least three reasons.
• There is no unique qualification to be a chemistry teacher so there is no simple criterion on which they can be counted; teachers with chemistry degrees teach a variety of subjects, and holders of other degrees train to be chemistry teachers.
• Up to the age of 16 chemistry teaching in most maintained schools forms part of a combined course towards the single or double award GCSE in science. Although it is implicit that chemistry comprises about a third of the content, teachers to this level are increasingly being viewed as science teachers and it is being assumed – probably incorrectly - that any science teacher can teach any science.
• Recruitment to, and resignations from, chemistry teaching form only a very small part of a complex system and surveys of the totality are rarely based on samples large enough to enable meaningful conclusions to be drawn about chemistry alone.
We, therefore, recommend that the Royal Society of Chemistry, possibly in collaboration with other science societies, should undertake a detailed study of the recruitment, deployment and retention of chemistry/science teachers. This could involve a survey to enable the overall situation to be described quantitatively, but there should also be in-depth studies in a sub-sample of schools – say 1 in 100, 32 school, reflecting the national structure – to see how the various factors interact in particular situations.
7.2 Such a study is needed especially because of poor data collection on school staffing by the government. The difficulties we encountered in compiling an accurate picture for the Royal Society of Chemistry in this report were similarly experienced by Adrian Smith’s Inquiry into Post 14 Mathematics Education (Smith 2004). The Inquiry “found it very frustrating not to be able to arrive at a clear overall picture of current and future needs for mathematics teachers in schools and colleges due to irregular and radically incomplete official data collection.” It found itself unable to be sure of how many teachers of mathematics there are, or their age profile or qualifications. It regretted that the DfES could only provide percentage breakdown and not absolute numbers from the 2002 Secondary Schools Curriculum and Staffing Survey due to the poor response rate. In also noted with concern that the latest survey had come six years after the previous one so the only numbers available to it were very much out of date.
7.3 The Smith Inquiry recommended, “that the DfES and the LSC work together and with the TTA to review the frequency and scope of data collection relating to mathematics teacher and teacher trainer numbers and qualifications. They should seek to agree a data collection strategy that will provide the evidence base for a

23
coherent policy approach to the supply of appropriately qualified teachers for the teaching of mathematics across all secondary schools, sixth form and further education colleges, and of appropriately qualified ITT mathematics trainers.” The experience of other countries suggests that this is entirely feasible, in principle, not only for mathematics but for all subjects. The Scottish Executive (2004), for example, carries out an Annual Census in September each year of the pupils and teachers in its schools, and it can say with some confidence how many chemistry, physics, biology and mathematics teachers, among others, it has, how many vacancies there are, and from its projections how many will be needed in the future.
We recommend that the Royal Society of Chemistry should associate itself with the recommendations from the Smith Inquiry for better data collection by the Government on the qualifications and deployment of teachers.
7.4 The weaknesses in official data collection which the Smith inquiry has identified with respect to mathematics, and which we have also highlighted in this report for chemistry and the sciences, apply to all subjects. But it is particularly important that mathematics and sciences should be considered together, since in our analyses of the qualifications of those training to be teachers we found that about a quarter of those with physics degrees were, in fact, training to be mathematics teachers. Mathematics teacher training also draws in graduates from other sciences, including chemistry. Any moves to increase recruitment to mathematics teaching are likely, therefore, to impinge on entry to science teacher training..
We recommend that the Society monitor the Government’s response to the Smith Inquiry’s proposals for boosting recruitment to mathematics teaching and assess the likely impact on teacher supply in chemistry, particularly in view of the recruitment to mathematics teaching of science graduates including those in chemistry.
7.5 Reforms along the lines advocated by the Smith Inquiry make it more urgent for the Royal Society of Chemistry to carry out its own detailed study. There are, as we have seen, definitional problems in recording the numbers of chemistry and other specialist science teachers over and above those that would be met in mathematics. The danger is that without particular advice from the RSC, these will be lost sight of in the search for a general approach. There is also the need to ensure that the data collected are sufficiently robust and complete to enable proper consideration to be given to the factors affecting individual subjects. A detailed study such as we have proposed would help to delineate clearly the issues for the RSC and put it in a stronger position to represent the interests of the subject.
7.6 The clearest indication that chemistry is understaffed is in the training statistics. We saw in Chapter 4 that biology has about double the intake of chemistry. Moreover, three times as many biology graduates are recruited to the combined/general science PGCE courses as chemistry graduates, with there being

24
even fewer physics graduates. From about a third of the trainees in 1983, chemistry now comprises less than 20 per cent of the total science intake. Although there has been some improvement from the trough at the turn of the millennium, nevertheless, considerably fewer physical scientists are being recruited than biological scientists. This, in part, seems to be embedded in the training allocations.
The Royal Society of Chemistry should press for an explanation of the apparent imbalance in allocations to chemistry, physics and biology PGCE courses, and campaign for more places to be made available to chemistry. It should also campaign for a better balance in recruitment to the combined/general science PGCE, including of more chemistry graduates.
7.7 A consequence of the differential rates of recruitment to teacher training in the sciences which have emerged over the past twenty years is that chemistry teachers are older than biology teachers, or teachers generally. The same is true of physics teachers. Thirty per cent are due to retire in the next ten years and the rate may be even higher since few teachers currently stay to the retirement age of 60. Changes are in the pipeline to raise the retirement age to 65 for new entrants from 1 Sept 2006 and for existing staff with effect from 1 Sept 2013 (DfES, 2002). In the longer term, this could be expected to extend the typical length of service, but there may be a surge of departures in the next decade as teachers try to beat the new arrangements.
As part of the survey we have proposed, the Royal Society of Chemistry should pay particular attention to the age of the teachers and their retirement plans, with a view to assessing, among other things, the likely impact of raising the retirement age.
7.8 Calculations of the requirement for chemistry teachers on the assumption that they should comprise about a third of the science teachers at Key Stage 4, in addition to staffing A-level chemistry, suggests that there is already under-representation. Changes to the way education 14-19 is structured, and, in particular, the nature of GCSE science, could alter requirements in future years. But projections on the basis of pupil numbers suggest that the demand for chemistry teachers will be sustained. The imbalance in current science teacher training, and the older average age of chemistry teachers, suggests that there will need to be continued improvement in the recruitment of appropriately qualified teachers if chemistry is to secure its place in the school science curriculum.

25
REFERENCES (Where runs of publications have been used as with the GTTR, STRB, EO etc only the
latest edition has been referenced)
DES (1986). ‘The 1984 secondary school staffing survey: some data on teachers and their deployment’. Statistical Bulletin 8/86 May 1986.
DES (1989). ‘1988 secondary school staffing survey’. List of Tables, Letter from DES, October 1989.
DES (1990). Projecting the Supply and Demand of Teachers: A Technical Description. London: HMSO.
DES (1993). ‘1992 secondary school staffing survey’. List of Tables, Letter from DES, May 1993.
DfEE (1997). 1996/97 Secondary Schools Curriculum and Staffing Survey. Statistical Bulletin 11/97. London: The Stationery Office.
DfEE (1998a). Teacher Supply and Demand Modelling: A Technical Description. London: The Stationery Office.
DfES (2002). Simplicity, Security and Choice: Working and Saving for Retirement. Pensions Green Paper. London: The Stationery Office.
DfES (2003a). Statistics of Education. School Workforce in England. London: The Stationery Office.
DfES (2003b). Statistics of Education. Schools in England. London: The Stationery Office.
DfES (2003c). Summary of Written Evidence to the School Teachers’ Review Body. Statistical Tables as an Annex. London: DfES.
DfES (2003d). ‘Secondary schools curriculum and staffing survey: November 2002 (Provisional)’. DfES National Statistics First Release SFR 25/2003, 25 September.
Employers’ Organisation for Local Government (2002). Survey of Teacher Resignations and Recruitment 1885/6 –2001. London: Employers’ Organisation for Local Government.
Graduate Teacher Training Registry (2003). Annual Statistical Report 2002 Entry. Cheltenham: GTTR.
Graduate Teacher Training Registry (2003). Applicant and Accepted Applicants. Posted on the website at www.gttr.ac.uk.
Joint Council for General Qualifications (2003). Inter-Awarding Body Statistics Winter 2001/Summer 2002. CD-Rom. Guildford: JCGQ.
School Teachers’ Review Body (2003). Twelfth Report. Cmnd 5715. London: The Stationery Office.

26
Scottish Executive (2004). Results of Teacher Workforce Planning for 2004/05. Statistics Publication Notice. Education Series. Edinburgh: A Scottish Executive national Statistics Publication.
Smith. A. (2004). Making Mathematics Count. Report of Professor Adrian Smith’s Inquiry into Post-14 Mathematics Education. www.mathematicsinquiry.org.uk/report.
Smithers, A. and Robinson, P. (2003). Factors Affecting Teachers’ Decisions to Leave the Profession. Research Report 430. London: DfES.
Teacher Training Agency (1996). A Strategic Plan for Teacher Supply and Recruitment. A Discussion Document. London: TTA..
Teacher Training Agency (2004) Performance Profiles posted on the website at www.canteach.gov.uk.