chemostratigraphic characterization of siliciclastic rocks
TRANSCRIPT
Journal of Geography and Geology; Vol. 6, No. 4; 2014 ISSN 1916-9779 E-ISSN 1916-9787
Published by Canadian Center of Science and Education
88
Chemostratigraphic Characterization of Siliciclastic Rocks in Parts of the Eastern Dahomey Basin, Southwestern Nigeria
Ikhane P. R.1, Akintola A. I.1, Bankole S. I.2, Ajibade O. M.1 & Edward O. O.1
1 Department of Earth Sciences, Olabisi Onabanjo University, Nigeria 2 Department of Geosciences University of Lagos, Akoka Lagos, Nigeria
Correspondence: Akintola A. I., Department of Earth Sciences, Olabisi Onabanjo University, Nigeria. E-mail: [email protected]
Received: July 16, 2014 Accepted: July 29, 2014 Online Published: November 18, 2014
doi:10.5539/jgg.v6n4p88 URL: http://dx.doi.org/10.5539/jgg.v6n4p88
Abstract Chemostratigraphy, involving the application of inorganic geochemistry for the characterization of sedimentary sequences has been applied in the study of siliciclastic rocks in parts of the eastern Dahomey basin, Southwest Nigeria, with the aim of characterizing the rocks based on variations in inorganic geochemistry.
The present study is based on 15 surface samples carefully selected from exposed sedimentary sequence near Igbile and 5 subsurface samples retrieved from cores of a drilled hole in Ijagun and these were subjected to geochemical analyses using Inductively Coupled Plasma-Mass Spectrometry (ICP-MS) to determine the major and trace elements concentration.
Results of the geochemical analyses revealed eleven (11) Major elements of which SiO2 having a percentage (%) range value of 45.35%-96.98% and Al2O3 with a percentage (%) range value of 0.8%-37.49% being the highest major element concentrations. Twenty-four (24) Trace elements were represented with Zr ranging value of between 150.7 ppm-1651.6 ppm being the most significant trace element. Sixteen (16) Rare Earth elements of which Ce ranging in value between 10.8ppm-251.3ppm show the highest concentration. The high percentage concentration of Al2O3 is an indication of abundant clay minerals whereas the high concentration of Zr in parts per million suggests sedimentary reworking of the sediments. High Ce concentration is indicative of oxic conditions. Based on variations in elements and element ratios such as Th/U, Cr, Zr, P2O5, V and Mo, the rocks analyzed have been subdivided into two (2) geochemical packages and three (3) geochemical units. Ratios of SiO2 and Al2O3 indicate three (3) sedimentary facies namely sandstone, siltstone and claystone while the variation in the ratios of Ga/Rb and Al2O3/(Na2O+CaO+K2O+MgO) depicts fluctuating paleoclimate during the deposition of the sedimentary sequence. Sediment provenance became increasingly felsic from an initial mafic source as inferred from the variation in ratios of Cr/Al2O3, TiO2/Nb, Nb/Al2O3 as well as the discriminant function analysis.
Keywords: chemostratigraphy, eastern Dahomey basin, geochemical units, paleoclimate, sediment provenance
1. Introduction Sedimentary rocks are faithful records of the sensitive and subtle changes in provenance, environment of deposition and post-depositional changes. Such changes mean that apparently uniform successions may show primary differences in the chemistry of their constituent minerals, or in the proportions of accessory phases such as heavy minerals and clays, many of which have very distinctive trace-element contents. An ability to characterize these subtle geochemical heterogeneities enables apparently uniform thick successions to be subdivided and correlated even between wells.
A stratigraphic record is the outcome of an exogenic system (one derived externally) consisting of geologic setting, changes in sea level, changes in geochemical reactions between the sea water and rock, climate and processes of sediment formation (Srinivasan, 1989), the ensuing sedimentary record, therefore shows differences in bulk chemistry. As these changes produce different combinations of minerals, there are distinctive major and trace elemental compositions of the sediments as well which are observable and can be used for the correlation and characterization of these rocks; this in turn forms the basis of chemostratigraphic application in sub-dividing strata (Das, 1997). The concept of chemostratigraphy holds good, with an ability to judge these differences,
www.ccsenet.org/jgg Journal of Geography and Geology Vol. 6, No. 4; 2014
89
distinctness of chemical composition and its causative factor (local, regional or global) and this enables the recognition and correlation of chemozones at appropriate scale ( Ramkumar and Sathish, 2006).
Chemostratigraphy, therefore, is the study of inorganic geochemistry of sedimentary sequences employed for the study of variations in the geochemistry of sediments as a correlation tool. This is done by analyzing ditch cutting samples, conventional core samples, sidewall cores or outcrop samples which allows regional to reservoir-scale inter-well correlations to be made. It involves the application of major- and trace-element geochemistry for the characterization and subdivision of sedimentary sequences into geochemically distinct units, and correlation of strata in sedimentary basins. It is a powerful and robust technique that uses changes in major, trace and rare-earth element abundances to characterize and correlate sequences of sedimentary rocks. The stratigraphic technique of chemostratigraphy relies upon recognizing changes in element concentrations through time and using those to model changes with respect to geological events, such as paleoclimate (Pearce et al., 2005a, Ratcliffe et al., 2010) and provenance (Ratcliffe et al., 2007, Wright et al., 2010).
Chemostratigraphic correlation is particularly applicable to sequences that have very poor biostratigraphic control or too thick, rapidly deposited sequences that cannot be subdivided further by biostratigraphic data. Ambiguity and uncertainty often associated with more traditional methods of correlation such as lithostratigraphy, biostratigraphy and geophysical logging are resolved.
This technique is therefore applied in the study area to geochemically characterize the rocks, determine lateral continuity or otherwise of variations in inorganic geochemistry observed, correlate the lithostratigraphic units based on their inorganic geochemistry and model changes in sediment provenance chemically.
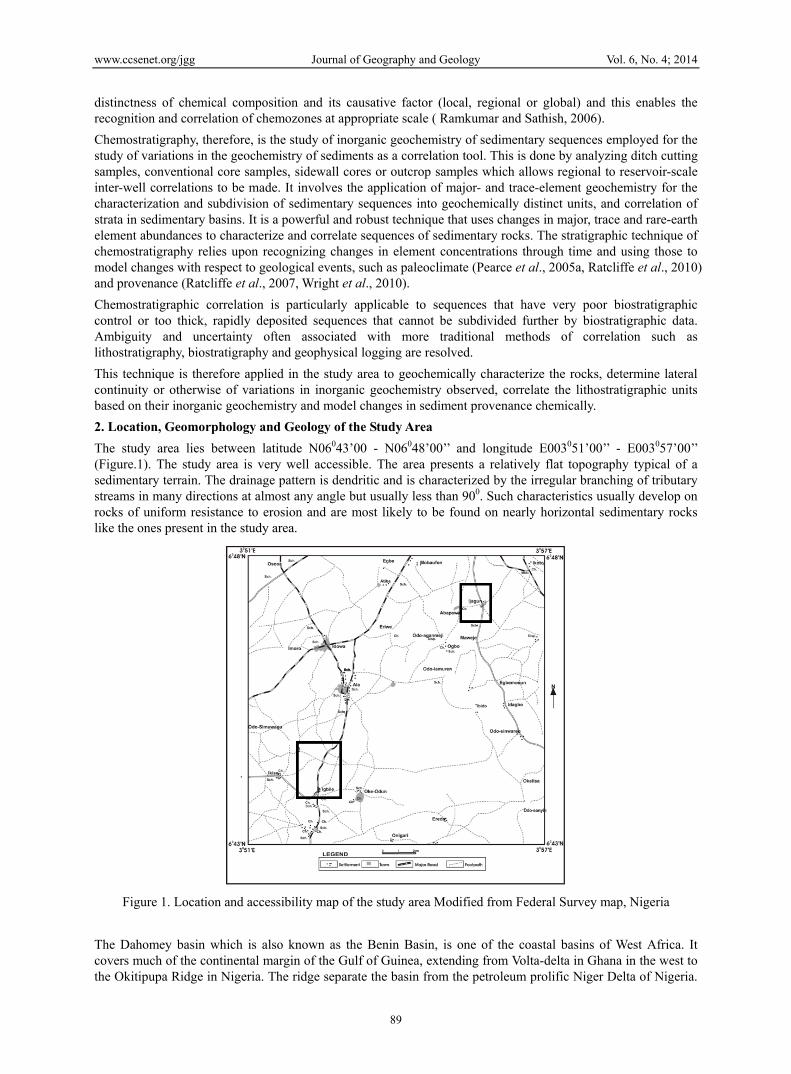
2. Location, Geomorphology and Geology of the Study Area The study area lies between latitude N06043’00 - N06048’00’’ and longitude E003051’00’’ - E003057’00’’ (Figure.1). The study area is very well accessible. The area presents a relatively flat topography typical of a sedimentary terrain. The drainage pattern is dendritic and is characterized by the irregular branching of tributary streams in many directions at almost any angle but usually less than 900. Such characteristics usually develop on rocks of uniform resistance to erosion and are most likely to be found on nearly horizontal sedimentary rocks like the ones present in the study area.
Figure 1. Location and accessibility map of the study area Modified from Federal Survey map, Nigeria
The Dahomey basin which is also known as the Benin Basin, is one of the coastal basins of West Africa. It covers much of the continental margin of the Gulf of Guinea, extending from Volta-delta in Ghana in the west to the Okitipupa Ridge in Nigeria. The ridge separate the basin from the petroleum prolific Niger Delta of Nigeria.
www.ccsenet.org/jgg Journal of Geography and Geology Vol. 6, No. 4; 2014
90
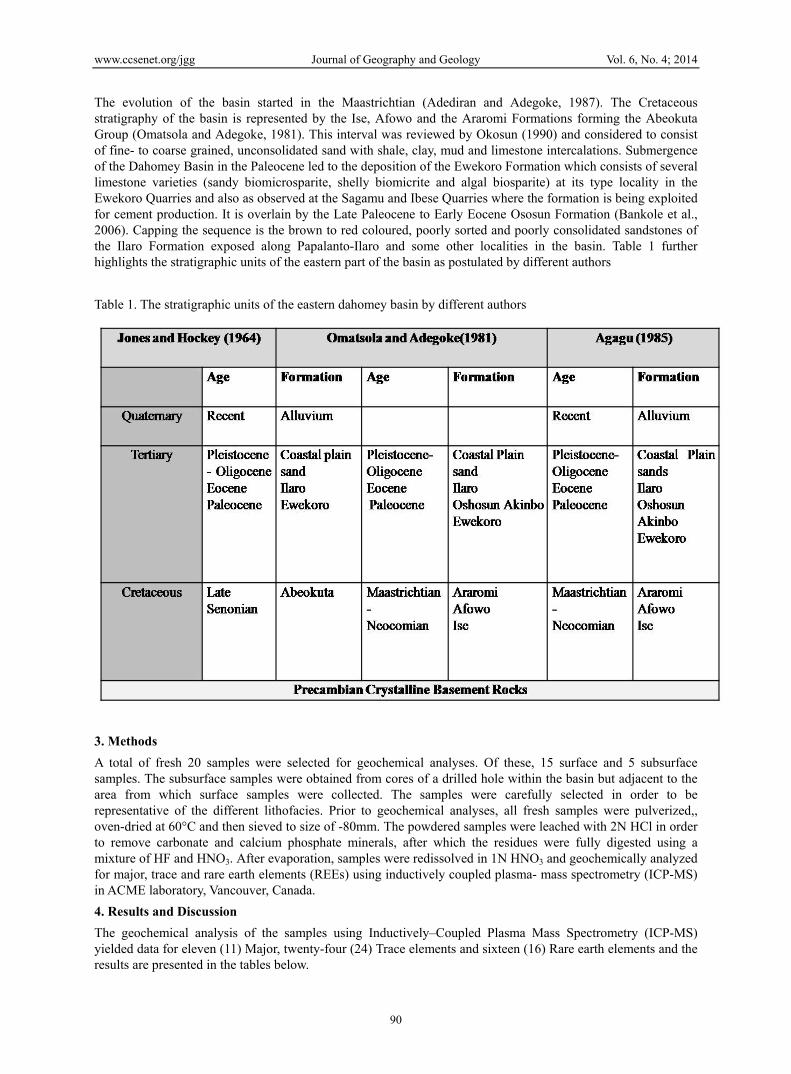
The evolution of the basin started in the Maastrichtian (Adediran and Adegoke, 1987). The Cretaceous stratigraphy of the basin is represented by the Ise, Afowo and the Araromi Formations forming the Abeokuta Group (Omatsola and Adegoke, 1981). This interval was reviewed by Okosun (1990) and considered to consist of fine- to coarse grained, unconsolidated sand with shale, clay, mud and limestone intercalations. Submergence of the Dahomey Basin in the Paleocene led to the deposition of the Ewekoro Formation which consists of several limestone varieties (sandy biomicrosparite, shelly biomicrite and algal biosparite) at its type locality in the Ewekoro Quarries and also as observed at the Sagamu and Ibese Quarries where the formation is being exploited for cement production. It is overlain by the Late Paleocene to Early Eocene Ososun Formation (Bankole et al., 2006). Capping the sequence is the brown to red coloured, poorly sorted and poorly consolidated sandstones of the Ilaro Formation exposed along Papalanto-Ilaro and some other localities in the basin. Table 1 further highlights the stratigraphic units of the eastern part of the basin as postulated by different authors
Table 1. The stratigraphic units of the eastern dahomey basin by different authors
3. Methods A total of fresh 20 samples were selected for geochemical analyses. Of these, 15 surface and 5 subsurface samples. The subsurface samples were obtained from cores of a drilled hole within the basin but adjacent to the area from which surface samples were collected. The samples were carefully selected in order to be representative of the different lithofacies. Prior to geochemical analyses, all fresh samples were pulverized,, oven-dried at 60°C and then sieved to size of -80mm. The powdered samples were leached with 2N HCl in order to remove carbonate and calcium phosphate minerals, after which the residues were fully digested using a mixture of HF and HNO3. After evaporation, samples were redissolved in 1N HNO3 and geochemically analyzed for major, trace and rare earth elements (REEs) using inductively coupled plasma- mass spectrometry (ICP-MS) in ACME laboratory, Vancouver, Canada.
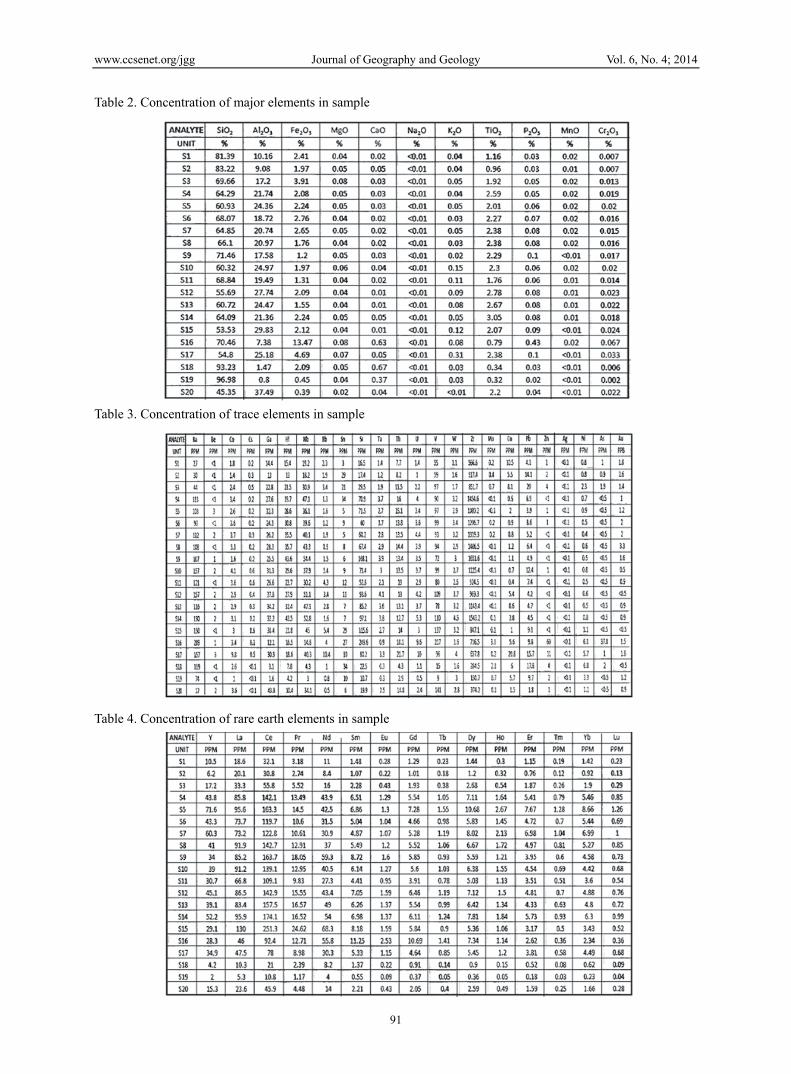
4. Results and Discussion The geochemical analysis of the samples using Inductively–Coupled Plasma Mass Spectrometry (ICP-MS) yielded data for eleven (11) Major, twenty-four (24) Trace elements and sixteen (16) Rare earth elements and the results are presented in the tables below.
www.ccsenet.org/jgg Journal of Geography and Geology Vol. 6, No. 4; 2014
91
Table 2. Concentration of major elements in sample
Table 3. Concentration of trace elements in sample
Table 4. Concentration of rare earth elements in sample
www.ccsenet.org/jgg Journal of Geography and Geology Vol. 6, No. 4; 2014
92
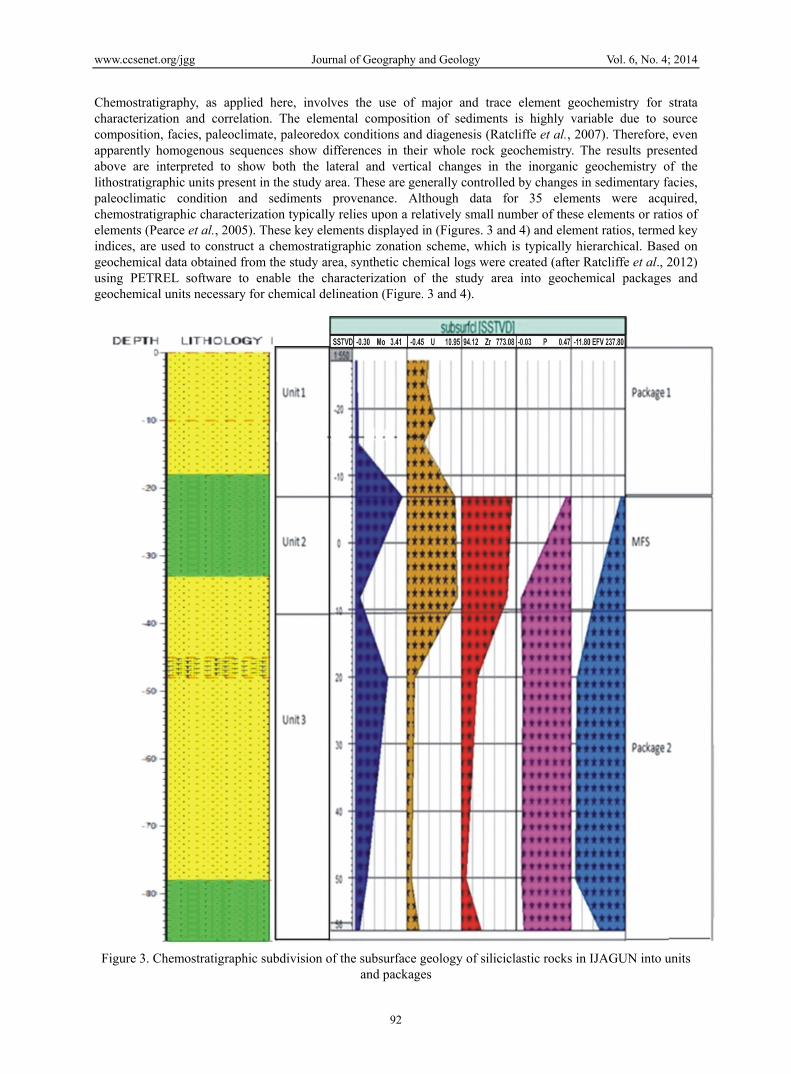
Chemostratigraphy, as applied here, involves the use of major and trace element geochemistry for strata characterization and correlation. The elemental composition of sediments is highly variable due to source composition, facies, paleoclimate, paleoredox conditions and diagenesis (Ratcliffe et al., 2007). Therefore, even apparently homogenous sequences show differences in their whole rock geochemistry. The results presented above are interpreted to show both the lateral and vertical changes in the inorganic geochemistry of the lithostratigraphic units present in the study area. These are generally controlled by changes in sedimentary facies, paleoclimatic condition and sediments provenance. Although data for 35 elements were acquired, chemostratigraphic characterization typically relies upon a relatively small number of these elements or ratios of elements (Pearce et al., 2005). These key elements displayed in (Figures. 3 and 4) and element ratios, termed key indices, are used to construct a chemostratigraphic zonation scheme, which is typically hierarchical. Based on geochemical data obtained from the study area, synthetic chemical logs were created (after Ratcliffe et al., 2012) using PETREL software to enable the characterization of the study area into geochemical packages and geochemical units necessary for chemical delineation (Figure. 3 and 4).
Figure 3. Chemostratigraphic subdivision of the subsurface geology of siliciclastic rocks in IJAGUN into units
and packages
www.ccsenet.org/jgg Journal of Geography and Geology Vol. 6, No. 4; 2014
93
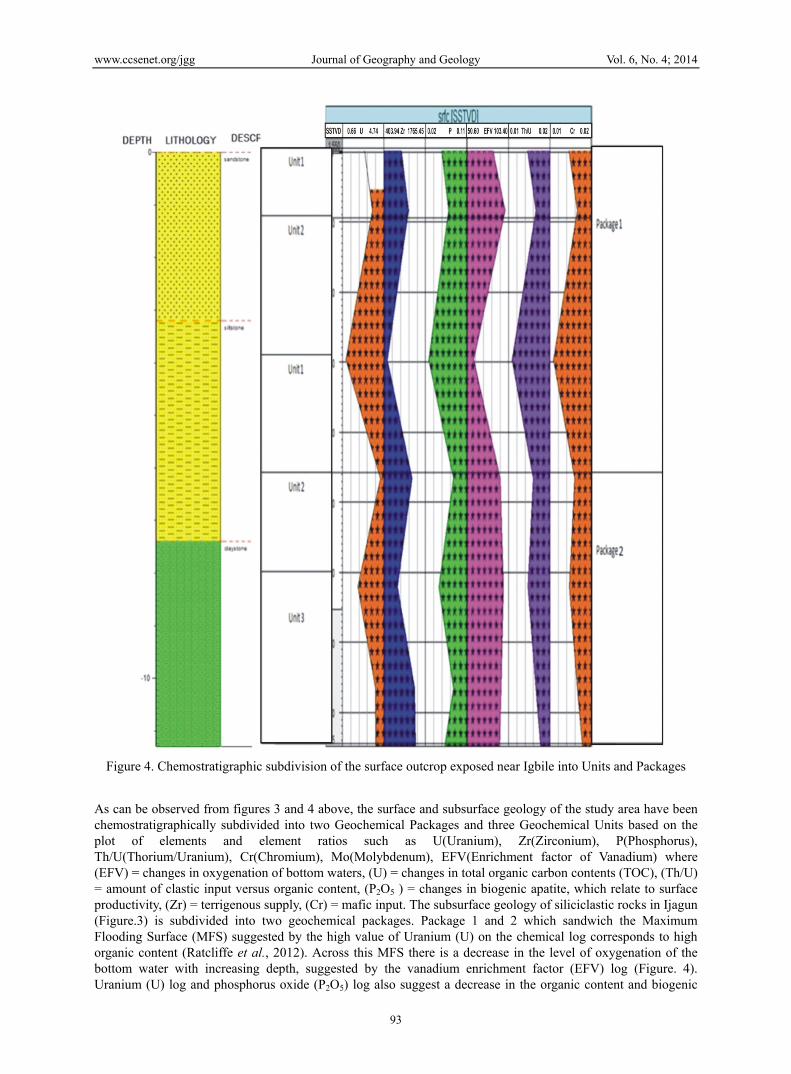
Figure 4. Chemostratigraphic subdivision of the surface outcrop exposed near Igbile into Units and Packages
As can be observed from figures 3 and 4 above, the surface and subsurface geology of the study area have been chemostratigraphically subdivided into two Geochemical Packages and three Geochemical Units based on the plot of elements and element ratios such as U(Uranium), Zr(Zirconium), P(Phosphorus), Th/U(Thorium/Uranium), Cr(Chromium), Mo(Molybdenum), EFV(Enrichment factor of Vanadium) where (EFV) = changes in oxygenation of bottom waters, (U) = changes in total organic carbon contents (TOC), (Th/U) = amount of clastic input versus organic content, (P2O5 ) = changes in biogenic apatite, which relate to surface productivity, (Zr) = terrigenous supply, (Cr) = mafic input. The subsurface geology of siliciclastic rocks in Ijagun (Figure.3) is subdivided into two geochemical packages. Package 1 and 2 which sandwich the Maximum Flooding Surface (MFS) suggested by the high value of Uranium (U) on the chemical log corresponds to high organic content (Ratcliffe et al., 2012). Across this MFS there is a decrease in the level of oxygenation of the bottom water with increasing depth, suggested by the vanadium enrichment factor (EFV) log (Figure. 4). Uranium (U) log and phosphorus oxide (P2O5) log also suggest a decrease in the organic content and biogenic

www.ccsenet.org/jgg Journal of Geography and Geology Vol. 6, No. 4; 2014
94
productivity down across the MFS. Package 1 suggests an interval of low or no significant influence from terrigenous supply and marine supply on the stratigraphy record of the subsurface formation as suggested by nil Zircon (Zr) log record, inconsistent Mo (Molybdenum) and U (Uranium) logs as well as P (phosphorus) log record (Figure.3). Package 2 represents an interval of constant biogenic apatite content with a significant reduction in total carbon content and decrease in oxygenation of bottom waters, implying increase in reducing conditions. This is followed by an increase in organic content in the rocks and increase in terrigenous input into the depositional basin as indicated by the Zircon log.
The geochemical packages are further subdivided into three units: (Unit 1) represents a record of low /no information which is probably a gap in sedimentation or unconformity as suggested by zero/nil Zircon (Zr) log kick (Ratcliffe et al., 2012). At this interval, there is no record of biogenic productivity (as indicated by the absence of P2O5 log Kick) and no record of terrigenous supply. (Unit 2) represents a period of high biogenic productivity (high P2O5 log), optimum level and change in the oxygenation of the bottom water of the formation. It also represents the interval with the highest record of fossils (as suggested by high kick of the U-log and Mo log, as well as high P2O5 (Figures.3 and 4). (Unit 3) represents an interval of decrease in oxygenation across the biogenic zone (low U-log), decrease in biogenic productivity (low P2O5-log kick) and terrigenous supply (low Zr kick).
The surface geology of siliciclastic rocks sampled from outcrop near Igbile (Figure.4) is chemostragraphically subdivided into two geochemical packages. Package 1 represents an interval of initial increase followed by subsequent decrease in total organic carbon content, terrigenous supply, biogenic apatite content, oxygenation of bottom waters, ratio of clastic input and organic content as well as mafic input into the basin. The general increase in these parameters is succeeded by a general decrease and then subsequent increase. Package 2 represents an interval of initial decrease and subsequent decrease in total organic content, terrigenous supply, biogenic apatite, oxygenation of bottom waters and mafic input. These packages are further divided into three (3) geochemical units. Unit (1) is characterized by significant increase in organic carbon content indicating increase in fossil content in the sediments (as suggested by the U-log), significant increase in terrigenous supply (as suggested by Zr-log). It also corresponds to an interval of increase in oxic conditions as indicated by V-log and significant increase in mafic input as suggested by Cr-log. Unit (2) represents an interval of significant decrease in organic carbon content in the sediments indicated by the U-log, reduction in terrigenous supply as suggested by Zr-log and an interval of reduction in oxygenation of bottom waters, indicated by EFV-log. Unit (3) represents an interval of constant oxic conditions during sediment deposition as indicated by EFV-log, slight increase in terrigenous supply indicated by Zr-log, slight decrease and then constant organic carbon content as shown by the U-log, slight increase and then decrease in biogenic apatite content indicated by the P2O5-log. Notwithstanding, there are limitations in the correlation of the surface and subsurface geology of the area probably due to the effects of erosion and weathering on the rock outcrops responsible for different chemical signatures.
5. Changes in Sedimentary Facies In any siliciclastic sequence, the primary differences in whole rock geochemistry occur between lithologies (Ratcliffe et al., 2008). A chemical classification of siliciclastic rocks can be achieved based on the ratios of some oxides (Sprague et al., 2009). These ratios are referred to as lithologic ratios and the oxides involved in this classification are Si02, Al2O3, MgO and Fe2O3. The following lithologic ratios are used in this classification:
Table 5a. Lithologic ratios used for siliciclastic rocks classification (after Sprague et al., 2009)
Silty claystone/claystone SiO2/Al2O3 < 4 Siltstones SiO2/ Al2O3 = 4-6 Argillaceous sandstone SiO2/Al2O3 = 6-10 Sandstones SiO2/ Al2O3 >10 Dolomitic sandstones > MgO 5% & SiO2/ Al2O3 >10Fe-rich lithologies > 10% Fe2O3 SiO2/ Al2O3 < 4 Fe-rich silty claystone SiO2/ Al2O3 = 4-6 Fe-rich siltstone SiO2/ Al2O3 =6-10 Fe-rich argillaceous Sandstone SiO2/ Al2O3 > 10 Fe-rich Sandstone
www.ccsenet.org/jgg Journal of Geography and Geology Vol. 6, No. 4; 2014
95
Based on the lithologic ratios in table 5a above, the SiO2/ Al2O3 ratio of the analyzed samples have been calculated and the results are presented below:
Table 5b. Sedimentary facies present in study area (after Sprague et al., 2009)
SAMPLES Si02/Al2O3 Fe2O3 (%) INTERPRETATION Sample 1 8.01 2.41 Argillaceous sandstone Sample 2 9.16 1.97 Argillaceous sandstone Sample 3 4.05 3.91 Siltstone Sample 4 2.95 2.08 Silty claystone/claystone Sample 5 2.50 2.24 Silty claystone/claystone Sample 6 3.63 2.76 Silty claystone/claystone Sample 7 3.12 2.65 Silty claystone/claystone Sample 8 3.15 1.76 Silty claystone/claystone Sample 9 4.06 1.2 Siltstone
Sample 10 2.41 1.97 Silty claystone/claystone Sample 11 3.53 1.31 Silty claystone/claystone Sample 12 2.00 2.09 Silty claystone/claystone Sample 13 2.48 1.55 Silty claystone/claystone Sample 14 3.00 2.24 Silty claystone/claystone Sample 15 1.79 2.12 Silty claystone/claystone Sample 16 9.54 13.47 Fe-rich argillaceous sandstone Sample 17 2.17 4.69 Silty claystone/claystone Sample 18 63.42 2.09 Sandstone Sample 19 121.2 0.45 Sandstone Sample 20 1.20 0.39 Silty claystone/claystone
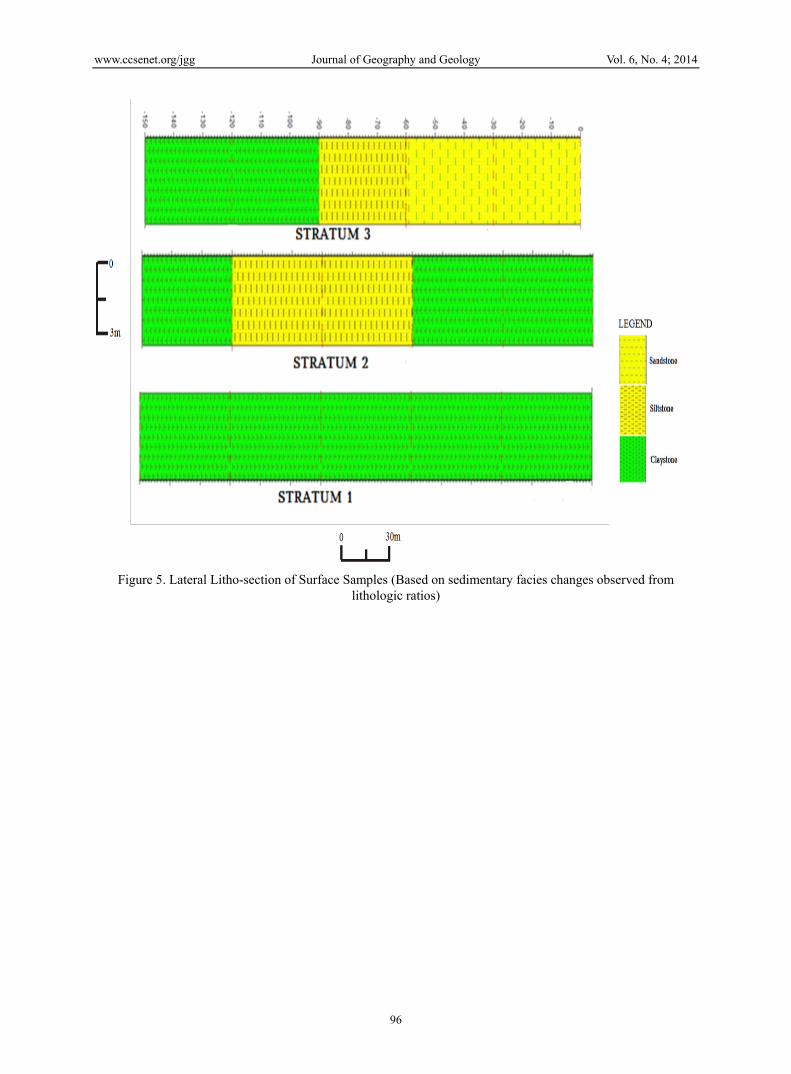
From the calculation of the SiO2/ Al2O3 ratio, it can be inferred that the rocks consist of three (3) sedimentary facies namely sandstone, siltstone and claystones. The sandstones and claystones are correlatable over a long distance as they are found in both Igbile and Ijagun while the siltstones are present only in Igbile. This gradation between sedimentary facies is observed both laterally and vertically, which is consistent with Walthers’ law of facies succession.
From this classification and the litho-section in Figures. 6 and 7, it can be inferred that the claystones were deposited first, followed by siltstones and then, the sandstones. The pattern of deposition of the different sedimentary facies and how they appear in cross- section are modeled in Figure.5 below.
www.ccsenet.org/jgg Journal of Geography and Geology Vol. 6, No. 4; 2014
96
Figure 5. Lateral Litho-section of Surface Samples (Based on sedimentary facies changes observed from
lithologic ratios)

www.ccsenet.org/jgg Journal of Geography and Geology Vol. 6, No. 4; 2014
97
Figure 6. Lithosection of surface samples
www.ccsenet.org/jgg Journal of Geography and Geology Vol. 6, No. 4; 2014
98
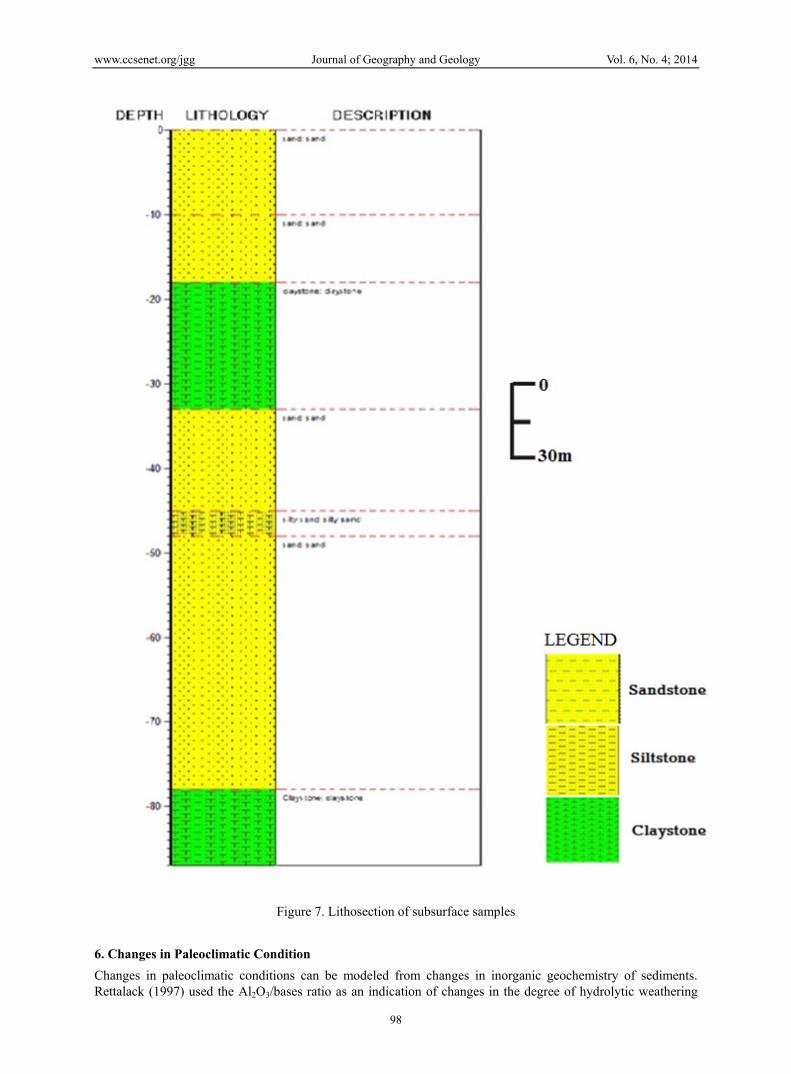
Figure 7. Lithosection of subsurface samples
6. Changes in Paleoclimatic Condition
Changes in paleoclimatic conditions can be modeled from changes in inorganic geochemistry of sediments. Rettalack (1997) used the Al2O3/bases ratio as an indication of changes in the degree of hydrolytic weathering

www.ccsenet.org/jgg Journal of Geography and Geology Vol. 6, No. 4; 2014
99
which in turn serves as an indicator of changes in paleoclimatic condition (Hildred et al., 2010). Bases, here refers to the sum of the concentration of CaO, MgO, Na2O and K2O in the samples. Also, changes in Al2O3/bases values tend to match changes in the (Gallium/Rubidium) Ga/Rb values in sediments. Ga is commonly enriched in kaolinite (Hieronymus et al., 2001) whereas Rb is more prevalent in Illite where it replaces K (Welby, 1958). Therefore, the Ga/Rb ratio reflects the kaolinite- illite ratio. In a situation where the Ga/Rb ratio increases upwards, with a linear relationship (increases contemporaneously) to Al2O3/bases, it implies that the degree of hydrolytic weathering increases and the sediments are becoming more kaolinitic and kaolinitic claystones are formed in hot humid climates while illite is more typical of drier cooler climates (Rat cliffe, 2010).
Figure 8. Binary plot of Ga/Rb and Al2O3/bases
Table 6. Variation in Ga/Rb and Al2O3/Bases Ratio in the study area
Ga/Rb AVERAGE Al2O3/BASE AVERAGE Sample 1 6.84 101.6 Sample 2 6.84 64.85 Sample 3 6.7 12.36 107.5 128.49 Sample 4 21.23 181.16 Sample 5 20.18 187.38 Sample 6 20.25 208 Sample 7 13.78 172.83 Sample 8 31.44 17.65 233 177.9 Sample 9 17 175.8 Sample 10 5.79 99.88 Sample 11 6.18 114.64 Sample 12 11.11 11.34 198.14 Sample 13 12.21 188.23 163.77 Sample 14 20.12 142.4 Sample 15 7.11 175.47 Sample 16 3.025 9.34 Sample 17 2.91 58.5 Sample 18 3.1 1.96 Sample 19 2 1.81 Sample 20 87.6 624.83
www.ccsenet.org/jgg Journal of Geography and Geology Vol. 6, No. 4; 2014
100
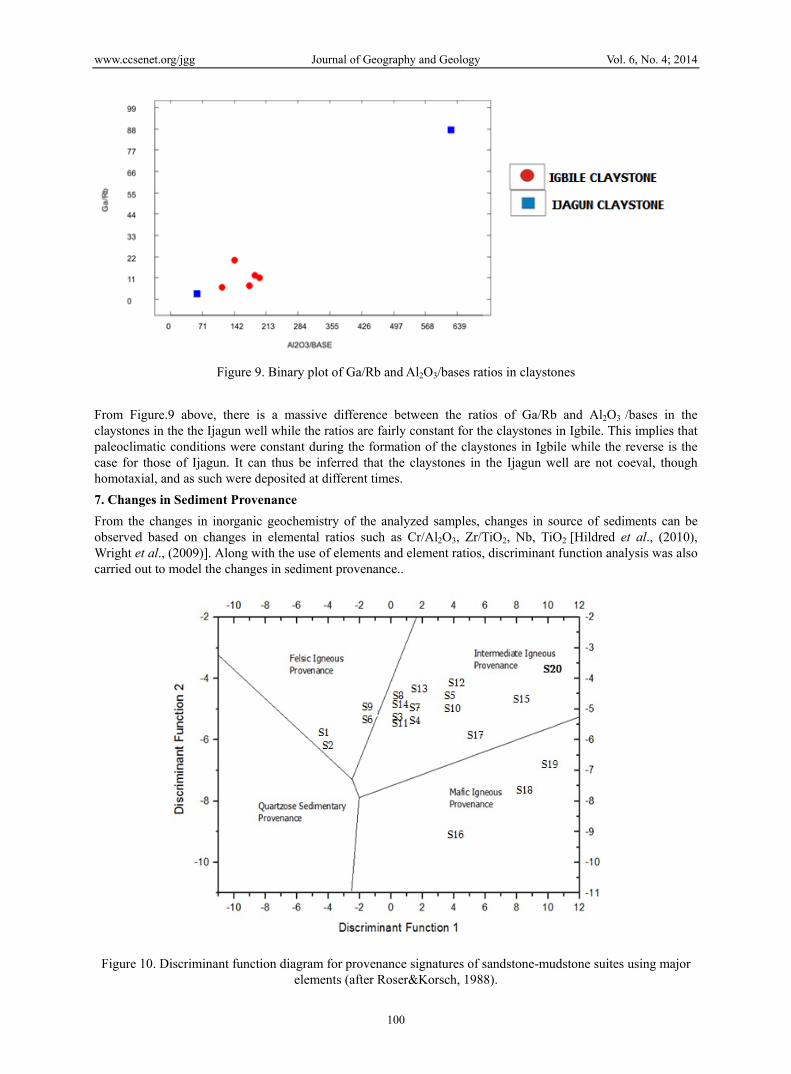
Figure 9. Binary plot of Ga/Rb and Al2O3/bases ratios in claystones
From Figure.9 above, there is a massive difference between the ratios of Ga/Rb and Al2O3 /bases in the claystones in the the Ijagun well while the ratios are fairly constant for the claystones in Igbile. This implies that paleoclimatic conditions were constant during the formation of the claystones in Igbile while the reverse is the case for those of Ijagun. It can thus be inferred that the claystones in the Ijagun well are not coeval, though homotaxial, and as such were deposited at different times. 7. Changes in Sediment Provenance From the changes in inorganic geochemistry of the analyzed samples, changes in source of sediments can be observed based on changes in elemental ratios such as Cr/Al2O3, Zr/TiO2, Nb, TiO2 [Hildred et al., (2010), Wright et al., (2009)]. Along with the use of elements and element ratios, discriminant function analysis was also carried out to model the changes in sediment provenance..
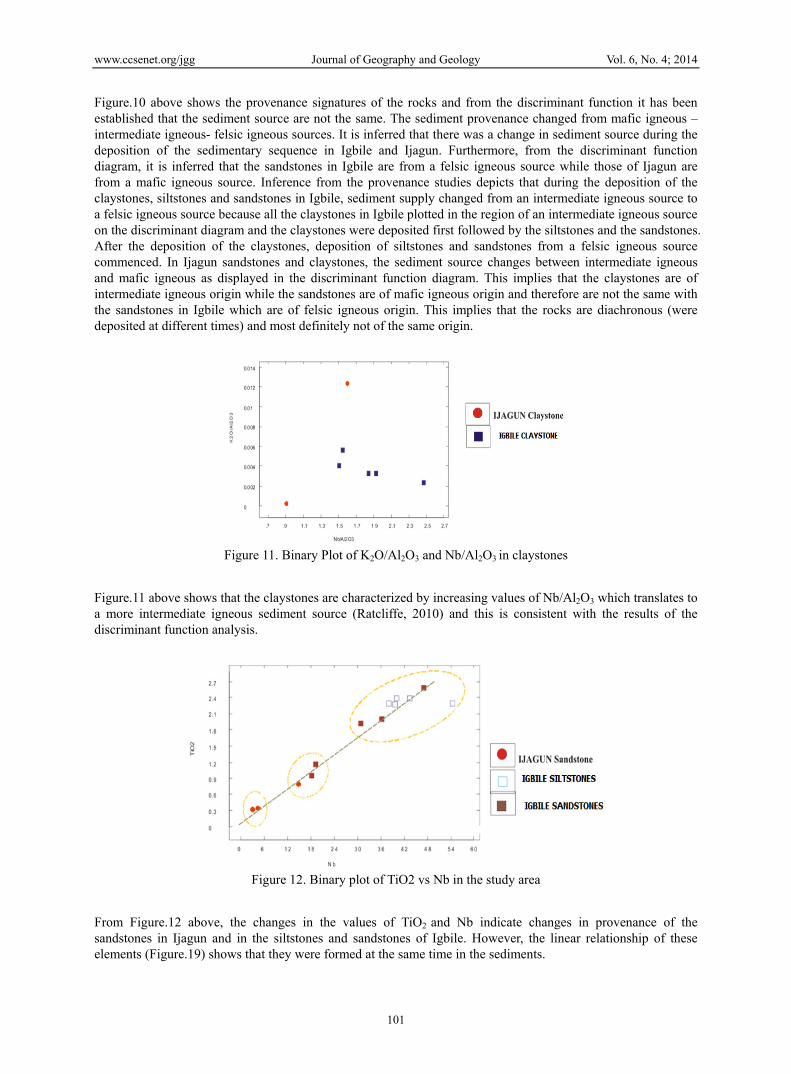
Figure 10. Discriminant function diagram for provenance signatures of sandstone-mudstone suites using major elements (after Roser&Korsch, 1988).
www.ccsenet.org/jgg Journal of Geography and Geology Vol. 6, No. 4; 2014
101
Figure.10 above shows the provenance signatures of the rocks and from the discriminant function it has been established that the sediment source are not the same. The sediment provenance changed from mafic igneous – intermediate igneous- felsic igneous sources. It is inferred that there was a change in sediment source during the deposition of the sedimentary sequence in Igbile and Ijagun. Furthermore, from the discriminant function diagram, it is inferred that the sandstones in Igbile are from a felsic igneous source while those of Ijagun are from a mafic igneous source. Inference from the provenance studies depicts that during the deposition of the claystones, siltstones and sandstones in Igbile, sediment supply changed from an intermediate igneous source to a felsic igneous source because all the claystones in Igbile plotted in the region of an intermediate igneous source on the discriminant diagram and the claystones were deposited first followed by the siltstones and the sandstones. After the deposition of the claystones, deposition of siltstones and sandstones from a felsic igneous source commenced. In Ijagun sandstones and claystones, the sediment source changes between intermediate igneous and mafic igneous as displayed in the discriminant function diagram. This implies that the claystones are of intermediate igneous origin while the sandstones are of mafic igneous origin and therefore are not the same with the sandstones in Igbile which are of felsic igneous origin. This implies that the rocks are diachronous (were deposited at different times) and most definitely not of the same origin.
Figure 11. Binary Plot of K2O/Al2O3 and Nb/Al2O3 in claystones
Figure.11 above shows that the claystones are characterized by increasing values of Nb/Al2O3 which translates to a more intermediate igneous sediment source (Ratcliffe, 2010) and this is consistent with the results of the discriminant function analysis.
Figure 12. Binary plot of TiO2 vs Nb in the study area
From Figure.12 above, the changes in the values of TiO2 and Nb indicate changes in provenance of the sandstones in Ijagun and in the siltstones and sandstones of Igbile. However, the linear relationship of these elements (Figure.19) shows that they were formed at the same time in the sediments.
www.ccsenet.org/jgg Journal of Geography and Geology Vol. 6, No. 4; 2014
102
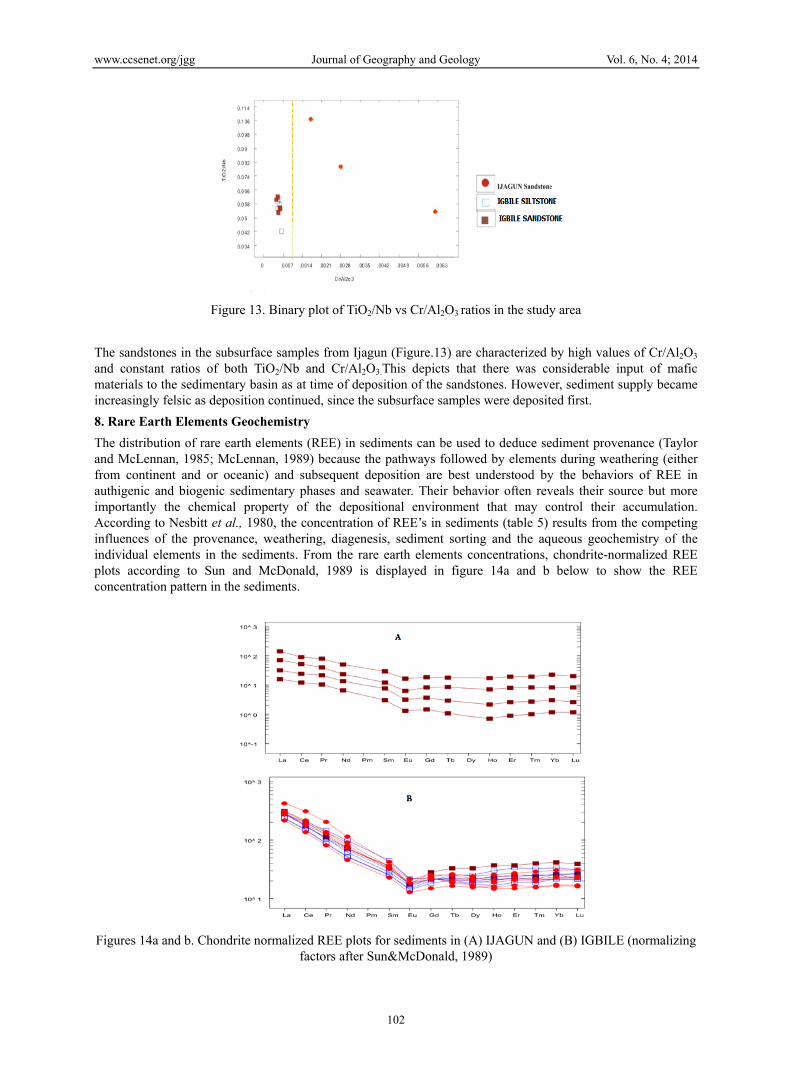
Figure 13. Binary plot of TiO2/Nb vs Cr/Al2O3 ratios in the study area
The sandstones in the subsurface samples from Ijagun (Figure.13) are characterized by high values of Cr/Al2O3 and constant ratios of both TiO2/Nb and Cr/Al2O3.This depicts that there was considerable input of mafic materials to the sedimentary basin as at time of deposition of the sandstones. However, sediment supply became increasingly felsic as deposition continued, since the subsurface samples were deposited first.
8. Rare Earth Elements Geochemistry The distribution of rare earth elements (REE) in sediments can be used to deduce sediment provenance (Taylor and McLennan, 1985; McLennan, 1989) because the pathways followed by elements during weathering (either from continent and or oceanic) and subsequent deposition are best understood by the behaviors of REE in authigenic and biogenic sedimentary phases and seawater. Their behavior often reveals their source but more importantly the chemical property of the depositional environment that may control their accumulation. According to Nesbitt et al., 1980, the concentration of REE’s in sediments (table 5) results from the competing influences of the provenance, weathering, diagenesis, sediment sorting and the aqueous geochemistry of the individual elements in the sediments. From the rare earth elements concentrations, chondrite-normalized REE plots according to Sun and McDonald, 1989 is displayed in figure 14a and b below to show the REE concentration pattern in the sediments.
Figures 14a and b. Chondrite normalized REE plots for sediments in (A) IJAGUN and (B) IGBILE (normalizing
factors after Sun&McDonald, 1989)
www.ccsenet.org/jgg Journal of Geography and Geology Vol. 6, No. 4; 2014
103
From the REE concentration plots above, a negative mean Eu anomaly is observed for sediments in Ijagun (Eu/Eu*= 0.76) and Igbile (Eu/Eu*= 0.64), where Eu/Eu*= √EuN / (SmNx GdN). A value greater than 1.0 indicates a positive anomaly while a value less than 1.0 is a negative anomaly (Taylor and McLennan 1985) and higher LREE/HREE ratios with negative Eu anomalies denotes felsic source rock (Wronkiewicz and Condie 1989, Taylor and McLennan 1985). There is a significant enrichment of Light Rare Earth Elements (LREE) over Heavy Rare Earth Elements (HREE) (Figure. 14b) in the sediments from Igbile. Coupled with the mean Eu/Eu * value of 0.64, it is inferred that the sediments are from a predominantly felsic igneous source. According to Cullers et al., (1988); Cullers (1994); Cullers and Podkovyrov (2000), sediments with Eu anomaly range of 0.40-0.94 are derived from felsic sources and the sediments in Igbile show a mean Eu anomaly of 0.64, inferring that they are from a felsic source.
However, the sediments from Ijagun show just a slight enrichment of light rare earth elements (LREE, La-Nd) over heavy rare earth elements (HREE, Er-Lu) (see Figure.14a) and a large spread of La/Sc ratios, which points to different source compositions for the sediments in Ijagun as the sediments comprise high La/Sc ratios with an average of 2.65 and this is higher than the value of 2.22 for upper continental crust (UCC) after McLennan et al., 2006. This can also be inferred from the discriminant function plot (Figure.10) where the sediments from Ijagun plot in both the mafic igneous and intermediate igneous provenance portions in the diagram. This suggests that the sediments in Ijagun are not dominated by one source area alone but a blend of various sources probably as a result of one or more sedimentary cycles or repetitive depositional cycles.
9. Geochemical Characterization of Lithostratigraphic Units In any siliciclastic sequence, the primary differences in whole rock geochemistry occur between lithologies (Ratcliffe et al., 2008). Sandstones, with their quartz-rich nature, have markedly different whole-rock geochemistry than clay-mineral bearing mudstones. Therefore, in order to recognize geochemical changes through time, within and between different lithofacies, mudstone and sandstone lithologies need to be considered separately. However, it is important to integrate interpretations from both lithologies to provide a holistic understanding of the chemostratigraphy. 10. Claystones The elements and element ratios used to differentiate the claystones in the study intervals here are Al2O3, K2O, K2O/ Al2O3, Nb/Al2O3, TiO2/Nb, and Zr/TiO2. All of these elements and element ratios have been used to characterize the claystones.
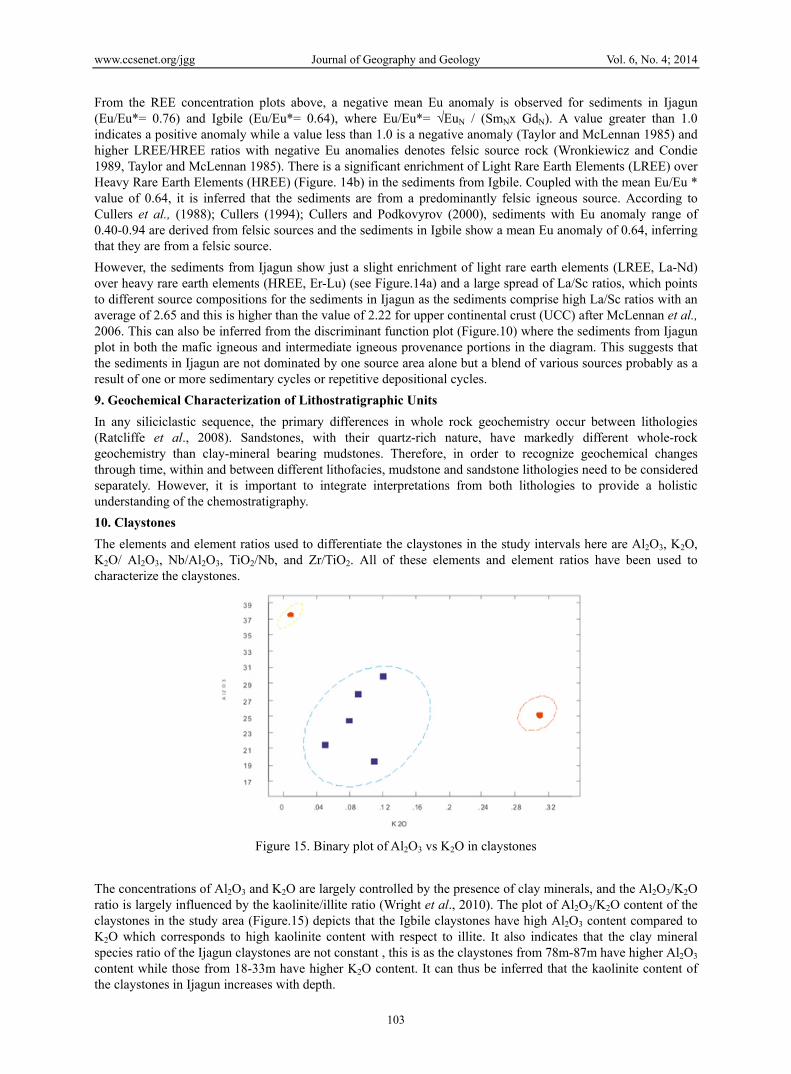
Figure 15. Binary plot of Al2O3 vs K2O in claystones
The concentrations of Al2O3 and K2O are largely controlled by the presence of clay minerals, and the Al2O3/K2O ratio is largely influenced by the kaolinite/illite ratio (Wright et al., 2010). The plot of Al2O3/K2O content of the claystones in the study area (Figure.15) depicts that the Igbile claystones have high Al2O3 content compared to K2O which corresponds to high kaolinite content with respect to illite. It also indicates that the clay mineral species ratio of the Ijagun claystones are not constant , this is as the claystones from 78m-87m have higher Al2O3 content while those from 18-33m have higher K2O content. It can thus be inferred that the kaolinite content of the claystones in Ijagun increases with depth.

www.ccsenet.org/jgg Journal of Geography and Geology Vol. 6, No. 4; 2014
104
Figure 16. Binary plot of K2O/Al2O3 vs Zr/TiO2 ratios of the claystones
Figure.16 reflect changes in Zr/TiO2 content of the claystones in Igbile and Ijagun. It is inferred from the plot that this ratio is higher in the Igbile claystones. Zr/TiO2 is related to ratio of heavy mineral suites present in sediments and as such, Zr and TiO2 are both related principally to silt-grade heavy mineral grains, Zr being associated with zircons and TiO2 with Ti-oxides such as Rutile and Anatase (Hildred et al., 2010). Therefore, Zr/TiO2 (Figure. 15) suggests the Zircon/ (Rutile + Anatase) ratio and an overall decrease in the ratio from the surface to subsurface are observed.
Figure 17. Binary plot of K2O/Al2O3 vs Nb/Al2O3 ratios in claystones
The plot (Figure.17) shows that the claystones are characterized by high values of Nb/Al2O3 which translates to a more intermediate sediment source (Ratcliffe, 2010). This is consistent with the results of the discriminant function analysis.
Figure 18. Binary plot of TiO2 vs Nb in the claystones
www.ccsenet.org/jgg Journal of Geography and Geology Vol. 6, No. 4; 2014
105
TiO2 and Nb are two elements that commonly occur together in a range of minerals such as Ti-oxide heavy minerals, clay minerals, and volcanogenic material (Deer et al., 1966). Commonly, they display a positive linear relationship in sediments, as demonstrated in Figure.18 above, this implies that detrital mineralogy is constant and as such the mudstones are of the same source.
11. Sandstones The elements and element ratios used to differentiate the sandstones in the study area are TiO2, Nb, TiO2/Nb, Cr/Al2O3. From the elements and element ratios, the changes in inorganic geochemistry within the sandstone lithologies have been observed.
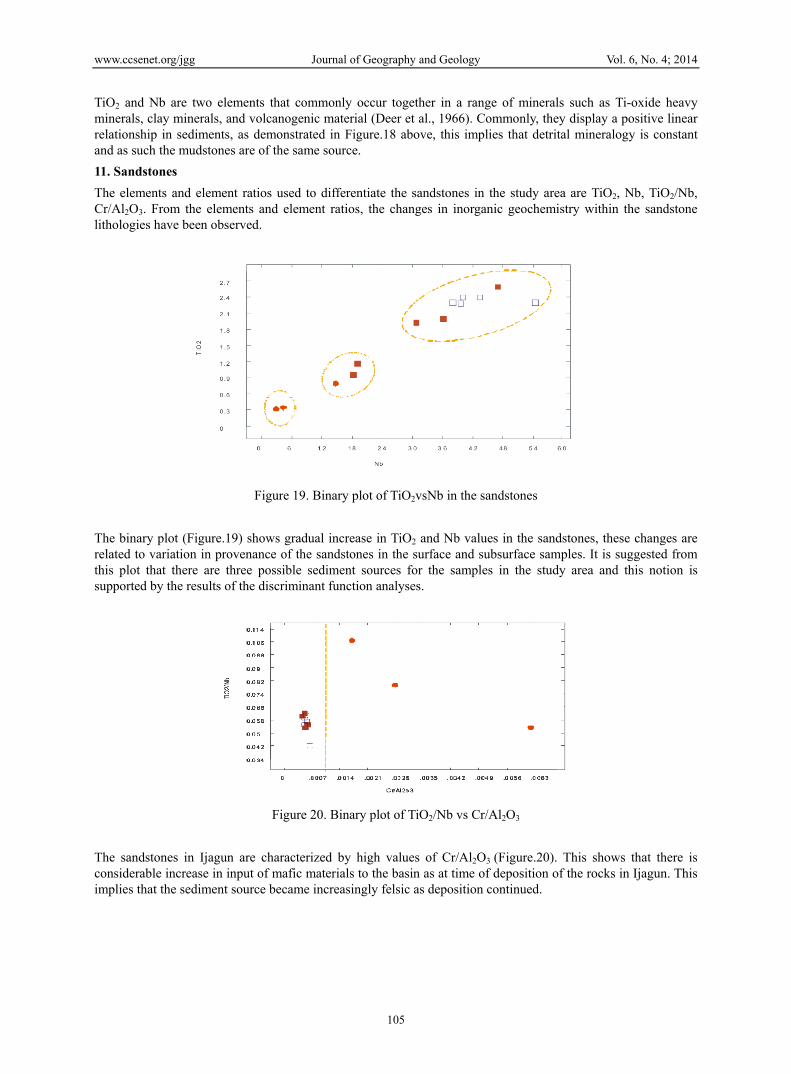
Figure 19. Binary plot of TiO2vsNb in the sandstones
The binary plot (Figure.19) shows gradual increase in TiO2 and Nb values in the sandstones, these changes are related to variation in provenance of the sandstones in the surface and subsurface samples. It is suggested from this plot that there are three possible sediment sources for the samples in the study area and this notion is supported by the results of the discriminant function analyses.
Figure 20. Binary plot of TiO2/Nb vs Cr/Al2O3
The sandstones in Ijagun are characterized by high values of Cr/Al2O3 (Figure.20). This shows that there is considerable increase in input of mafic materials to the basin as at time of deposition of the rocks in Ijagun. This implies that the sediment source became increasingly felsic as deposition continued.
www.ccsenet.org/jgg Journal of Geography and Geology Vol. 6, No. 4; 2014
106
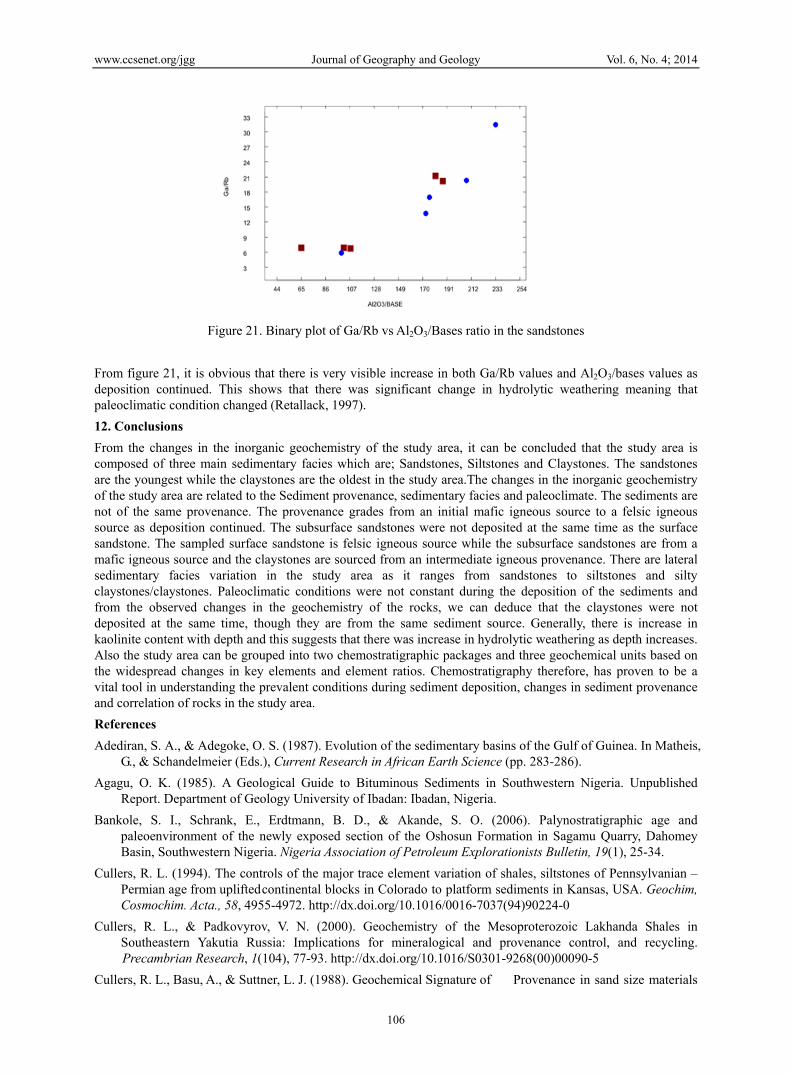
Figure 21. Binary plot of Ga/Rb vs Al2O3/Bases ratio in the sandstones
From figure 21, it is obvious that there is very visible increase in both Ga/Rb values and Al2O3/bases values as deposition continued. This shows that there was significant change in hydrolytic weathering meaning that paleoclimatic condition changed (Retallack, 1997). 12. Conclusions From the changes in the inorganic geochemistry of the study area, it can be concluded that the study area is composed of three main sedimentary facies which are; Sandstones, Siltstones and Claystones. The sandstones are the youngest while the claystones are the oldest in the study area.The changes in the inorganic geochemistry of the study area are related to the Sediment provenance, sedimentary facies and paleoclimate. The sediments are not of the same provenance. The provenance grades from an initial mafic igneous source to a felsic igneous source as deposition continued. The subsurface sandstones were not deposited at the same time as the surface sandstone. The sampled surface sandstone is felsic igneous source while the subsurface sandstones are from a mafic igneous source and the claystones are sourced from an intermediate igneous provenance. There are lateral sedimentary facies variation in the study area as it ranges from sandstones to siltstones and silty claystones/claystones. Paleoclimatic conditions were not constant during the deposition of the sediments and from the observed changes in the geochemistry of the rocks, we can deduce that the claystones were not deposited at the same time, though they are from the same sediment source. Generally, there is increase in kaolinite content with depth and this suggests that there was increase in hydrolytic weathering as depth increases. Also the study area can be grouped into two chemostratigraphic packages and three geochemical units based on the widespread changes in key elements and element ratios. Chemostratigraphy therefore, has proven to be a vital tool in understanding the prevalent conditions during sediment deposition, changes in sediment provenance and correlation of rocks in the study area.
References Adediran, S. A., & Adegoke, O. S. (1987). Evolution of the sedimentary basins of the Gulf of Guinea. In Matheis,
G., & Schandelmeier (Eds.), Current Research in African Earth Science (pp. 283-286).
Agagu, O. K. (1985). A Geological Guide to Bituminous Sediments in Southwestern Nigeria. Unpublished Report. Department of Geology University of Ibadan: Ibadan, Nigeria.
Bankole, S. I., Schrank, E., Erdtmann, B. D., & Akande, S. O. (2006). Palynostratigraphic age and paleoenvironment of the newly exposed section of the Oshosun Formation in Sagamu Quarry, Dahomey Basin, Southwestern Nigeria. Nigeria Association of Petroleum Explorationists Bulletin, 19(1), 25-34.
Cullers, R. L. (1994). The controls of the major trace element variation of shales, siltstones of Pennsylvanian – Permian age from uplifted continental blocks in Colorado to platform sediments in Kansas, USA. Geochim, Cosmochim. Acta., 58, 4955-4972. http://dx.doi.org/10.1016/0016-7037(94)90224-0
Cullers, R. L., & Padkovyrov, V. N. (2000). Geochemistry of the Mesoproterozoic Lakhanda Shales in Southeastern Yakutia Russia: Implications for mineralogical and provenance control, and recycling. Precambrian Research, 1(104), 77-93. http://dx.doi.org/10.1016/S0301-9268(00)00090-5
Cullers, R. L., Basu, A., & Suttner, L. J. (1988). Geochemical Signature of Provenance in sand size materials

www.ccsenet.org/jgg Journal of Geography and Geology Vol. 6, No. 4; 2014
107
in soils and streams sediments near the Tobacco Root batholiths, Montana, USA. Chem. Geol., 70, 335-348. http://dx.doi.org/10.1016/0009-2541(88)90123-4
Das, N. (1997). Chemostratigraphy of sedimentary sequences: A review of the state of the art. Journal of Geological Society of India, 49, 621–628.
Deer, W. A., Howie, R. A., & Zussman, J. (1966). An introduction to the rock forming minerals. New York (Longman).
Hieronymus, B., Kotschoubey, B., & Boulègue, J. (2001). Gallium behaviour in some contrasting lateritic profiles from Cameroon and Brazil. Journal of Geochemical Exploration, 72, 147–63. http://dx.doi.org/10.1016/S0375-6742(01)00160-1
Hildred, G. V., Ratcliffe, K. T., Wright, A. M., Zaitlin, B. A., & Wray, D. S. (2010). Chemostratigraphic applications to low-accommodation fluvial incised-valley settings; an example from the Lower Mannville Formation of Alberta, Canada. Journal of Sedimentary Research, 80(1), 1032-1045 http://dx.doi.org/10.2110/jsr.2010.089
Mclennan, S. M. (1989a). Rare earth elements in sedimentary rocks: Influence of provenance and sedimentary processes: Mineralogical Society of America Reviews in Mineralogy, 21, 169-200.
Okosun, E. A. (1990). Review of the Early Tertiary Stratigraphy of southwestern Nigeria. Journal of Mining and Geology, 34(1), 27-35.
Omatsola, M. A., & Adegoke, O. S. (1981). Tectonic Evolution and Cretaceous Stratigraphy of the Dahomey Basin. Journal of Mining Geology, 18(1), 130-137.
Pearce, T. J., Wray, D.S., Ratcliffe, K. T., Wright, D. K., & Moscarello, A. (2005a). Chemostratigraphy of the Upper Carboniferous Schooner Formation, southern North Sea. In: Carboniferous hydrocarbon geology: the southern North Sea and surrounding onshore areas. In Collinson, J. D., Evans, D. J., Holliday, D. W., & Jones N. S. (Eds.), Yorkshire Geological Society, Occasional Publications series (Vol. 7, pp. 147–64).
Pearce, T. J., Martin, J. H., Cooper, D., & Wray, D. S. (2010). Chemostratigraphy of upper carboniferous (pennsylvanian) sequences from the southern north sea (United Kingdom). Application of Modern Stratigraphic Techniques: Theory and Case Histories. SEPM Special Publication, 94, 109–127.
Ramkumar, M., & Sathish, G. (2006). Integrated sequence and chemostratigraphic modelling: A sure-fire technique for stratigraphic correlation, petroleum exploration and reservoir characterization. In Rajendran, S., Srinivasamoorty, K., & Aravindan, S. (Eds.), Mineral Exploration: Recent Strategies (pp. 21-40). New India Publishers.
Ratcliffe, K. T., Wright, A. M., & Schmidt, K. (2012). Application of inorganic whole-rock geochemistry to shale resource plays: an example from the Eagle Ford Shale Formation, Texas. In Ruarri, D. S., Janson, X., & Wright, W. (Eds.), The Sedimentary Record. Society for Sedimentary Geology publication, 10(2), 12.
Ratcliffe, K. T., Morton, A., Ritcey, D., & Evenchick, C. E. (2007). Whole rock geochemistry and heavy mineral analysis as exploration tools in the Bowser and Sustut Basins, British Colombia, Canada. Journal of Canadian Petroleum Geology, 55, 320–37. http://dx.doi.org/10.2113/gscpgbull.55.4.320
Ratcliffe, K. T., Wright, A. M., Montgomery, P. Palfrey, A. Vonk, A. Vermeulen, J., & Barrett, M. (2010). Application of chemostratigraphy to the Mungaroo Formation, the Gorgon Field, offshore Northwest Australia. APPEA Journal 2010 50th Anniversary Issue, 371 – 385.
Ratcliffe, K. T., Hughes, A. D., Lawton, D. E., Wray, D. S., Bessa, F., Pearce, T. J., & Martin, J. (2006). A regional chemostratigraphically-defined correlation framework for the late Triassic TAG-I in Blocks 402 and 405a, Algeria. Petroleum Geoscience, 12, 3–12. http://dx.doi.org/10.1144/1354-079305-669
Retallack, G. J. (1997). A Colour Guide to Palaeosols: Chichester, England, John Wiley & Sons Ltd., 120–127.
Roser, B. P., & Korsch, R. J. (1988). Provenance signature of sandstone-mudstone suites determined using discriminant function analysis of major element data. Chem. Geol., 67, 119-139. http://dx.doi.org/10.1016/0009-2541(88)90010-1
Sprague, R. A., Melvin, J. A., Conradi, F. G., Pearce, T. J., Dix, M. A., Hill, S. D., & Canham, H. (2009). Integration of Core-based Chemostratigraphy and Petrography of the Devonian Jauf Sandstones, Uthmaniya Area, Ghawar Field, Eastern Saudi Arabia. Search and Discovery Article, 20065, 34.
Srinivasan, M. S. (1989). Recent advances in Neogene planktonic foraminiferal biostratigraphy,
www.ccsenet.org/jgg Journal of Geography and Geology Vol. 6, No. 4; 2014
108
chemostratigraphy and paleoceanography, Northern Indian Ocean. Journal of Palaeontological Society of India, 34, 1–18.
Sun, S. S., & McDonough, W. F. (1989). Chemical and isotopic systematic of ocean basalts: Implication for mantle composition and processes. In: Saunders, A. D and Norry, M.J., (eds). Magmatism in the ocean Basins. Geological Society, London. Special publication, 42, 313-345. http://dx.doi.org/10.1144/GSL.SP.1989.042.01.19
Taylor, S. R., & Mclennan, S. M. (1985). The continental crust: Its composition and evolution. Blackwel Science Publisher, 312.
Welby, C. W. (1958). Occurrence of alkali metals in some Gulf of Mexico sediments. Journal of Sedimentary Petrology, 28, 431–52.
Wright, A. M., Ratcliffe, K., Bhattacharya, J., Zhu, Y., & Wray, D. S. (2010). The Application of Chemostratigraphy to Fluvial-Deltaic Sequences: Example from the Ferron Sandstone Member, South-Central Utah. Search and Discovery Article, 40498, 55-60.
Wronkiewicz, D. J., & Condie, K. C. (1989). Geochemistry and provenance of sediments from the Pongola Supergroup, SouthAfrica; Evidence for a 3.0 – Ga – Old continental craton. Geochim. Cosmochim. Acta, 53, 1537 – 1549. http://dx.doi.org/10.1016/0016-7037(89)90236-6
Copyrights Copyright for this article is retained by the author(s), with first publication rights granted to the journal.
This is an open-access article distributed under the terms and conditions of the Creative Commons Attribution license (http://creativecommons.org/licenses/by/3.0/).