chicago forward: multimodal transportation in...
TRANSCRIPT
Chicago Forward: Multimodal Transportation
in Action
Gabe Klein, Commissioner
Minnesota Urban Land Institute
1

Elevated Railway Station at Van Buren and State Street, c. 1905

State and Madison Streets, c. 1910

Chicago’s Transportation Network: The Envy of the Nation . . .
The freight rail hub of North America
Grid street network & hub of Interstate Highways
The nation’s only dual-hub airport
A well-established and well-used bicycle network
High performing, 24-hour transit services
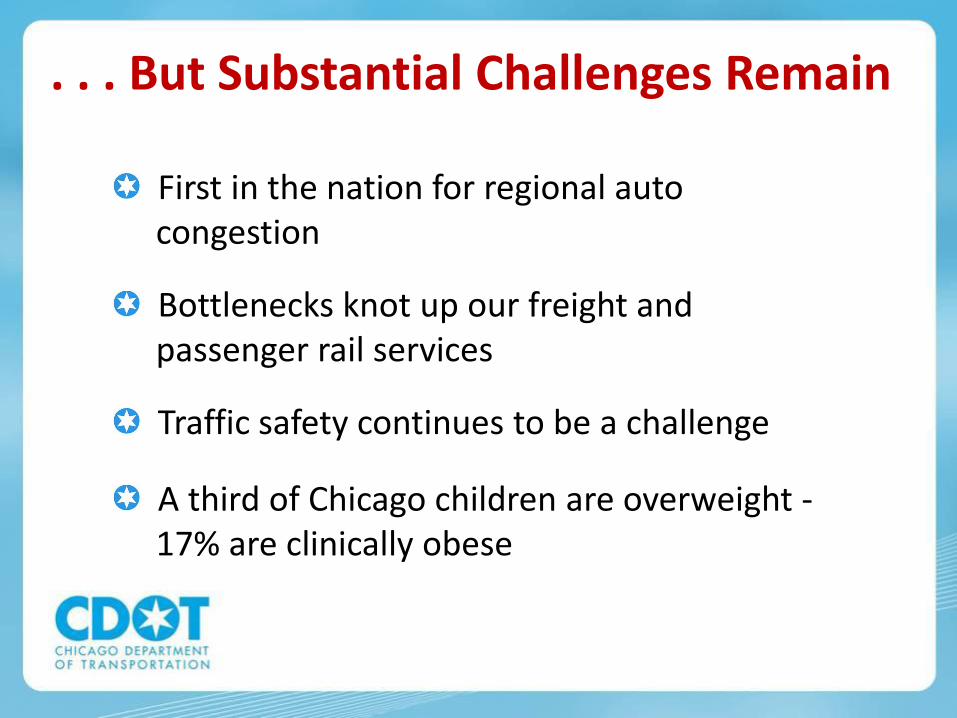
. . . But Substantial Challenges Remain
First in the nation for regional auto congestion
Bottlenecks knot up our freight and passenger rail services
Traffic safety continues to be a challenge
A third of Chicago children are overweight - 17% are clinically obese

CDOT by the Numbers
$600-800 Million Annual Budget More than half from state or federal grants
262 bridges and viaducts
4,091 miles of streets (excluding Expressways)
26,658 intersections (2,935 signalized)
10,646,110 feet of lane striping
12,145 bike racks
10,997 trees planted/year
59 stations and 50 miles of track owned by CDOT but operated by CTA

Pedestrians – Countdown Signals, Safety Improvements & Campaign
Cyclists – Bike Sharing, Innovative and New Bikeways, Expand Parking
Motorists – Use technology to improve Signal Timing and Traveler Info
Freight Rail – CREATE Program to improve efficiency
Transit – Rebuild systems, Improve Access, Implement Bus Rapid Transit
Improving Transportation in Chicago is Making the Most of Every Option


Six Principles
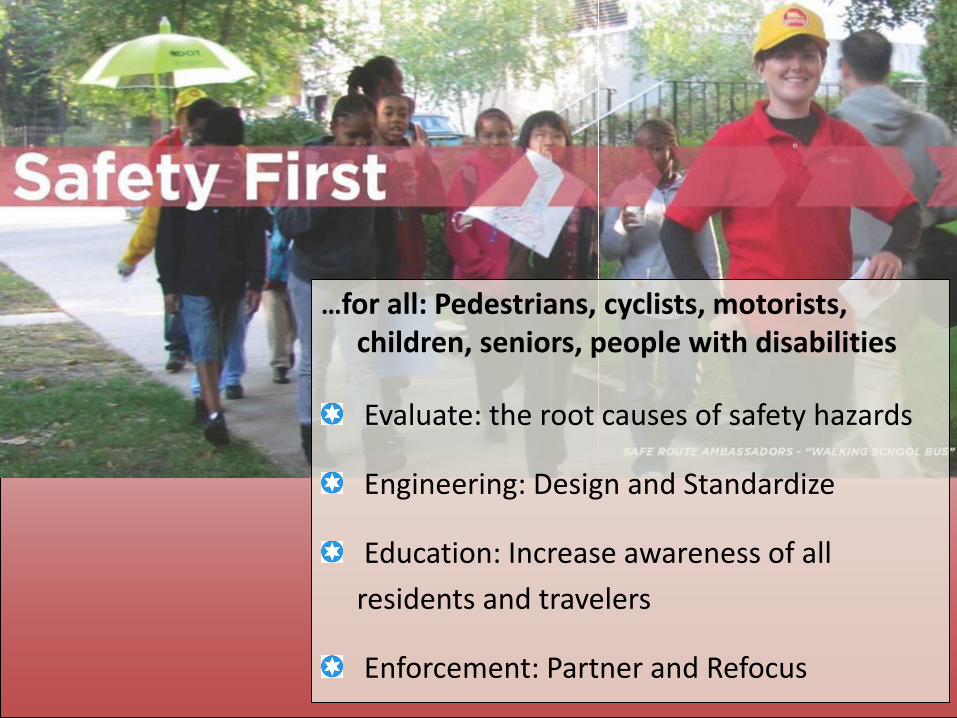
…for all: Pedestrians, cyclists, motorists, children, seniors, people with disabilities
Evaluate: the root causes of safety hazards
Engineering: Design and Standardize
Education: Increase awareness of all
residents and travelers
Enforcement: Partner and Refocus

Safety Issues
Over 130,000 crashes per year involving autos
More than 3,000 crashes involving pedestrians each year
40% of pedestrian fatalities are hit-and-run (vs. 20% national)
Speeding is rampant with limited enforcement
28% of crashes in CBD involve taxis
An unsafe city won’t attract
families, businesses
Speeding a factor in many crashes

Bicycle Crash Trends: 2005-2010
• 8,861 injury crashes and 32 fatal crashes during study period
• 28% decrease in fatal crashes
• 27% increase in injury crashes
• 45% increase in cycle commuters
• 25% of crashes were hit and runs
• 8% of crashes involved taxicabs

Speed Kills Safety Drives the Program.
Chance a pedestrian struck by a vehicle will survive drops dramatically as vehicle speed increases
Source: UK Department of Transport

Sample Treatments
Median Refuge Island Safety Zone Stencil Countdown Timers
Speed Feedback Sign Stop-for-Ped Sign High Visibility Crosswalk

First Round Safety Zones Schools:
Claremont Community Academy
Disney Magnet School
Hancock
Hanson Park/Prosser Vocational
Pickard
Morgan Park
Parks: Garfield
Humboldt
McKinley
Washington
Major Taylor Trail
Senn
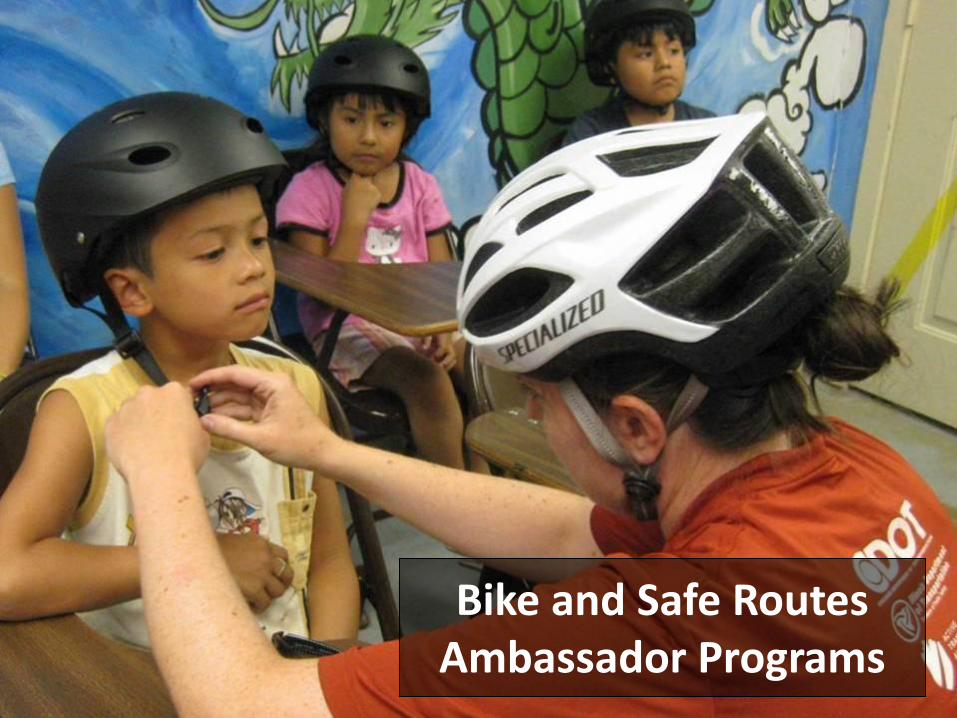
Bike and Safe Routes Ambassador Programs
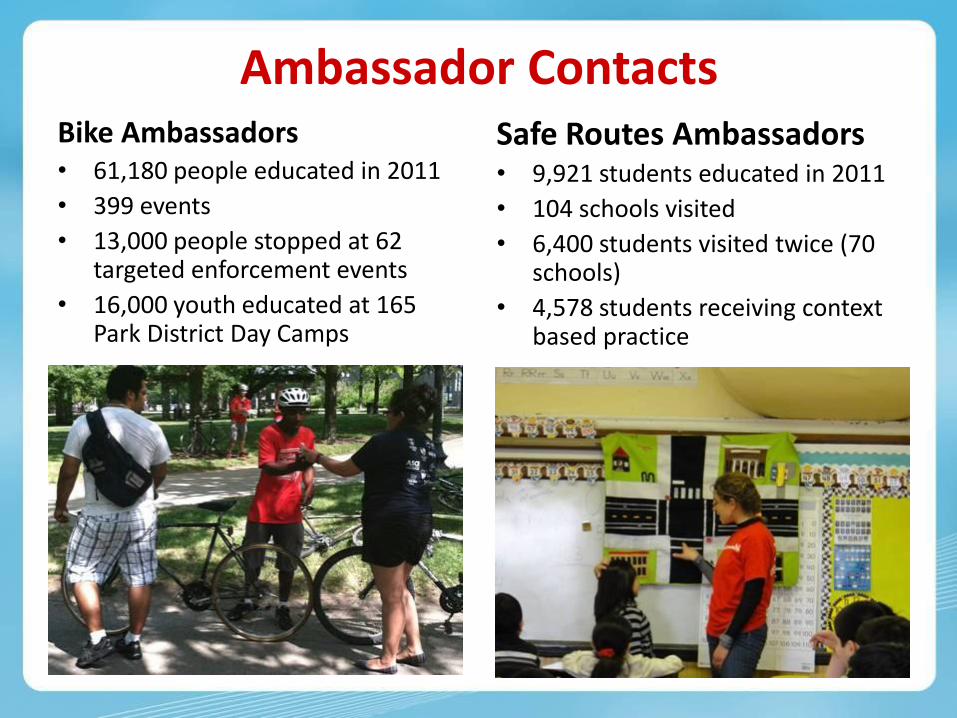
Ambassador Contacts Safe Routes Ambassadors • 9,921 students educated in 2011
• 104 schools visited
• 6,400 students visited twice (70 schools)
• 4,578 students receiving context based practice
Bike Ambassadors • 61,180 people educated in 2011
• 399 events
• 13,000 people stopped at 62 targeted enforcement events
• 16,000 youth educated at 165 Park District Day Camps
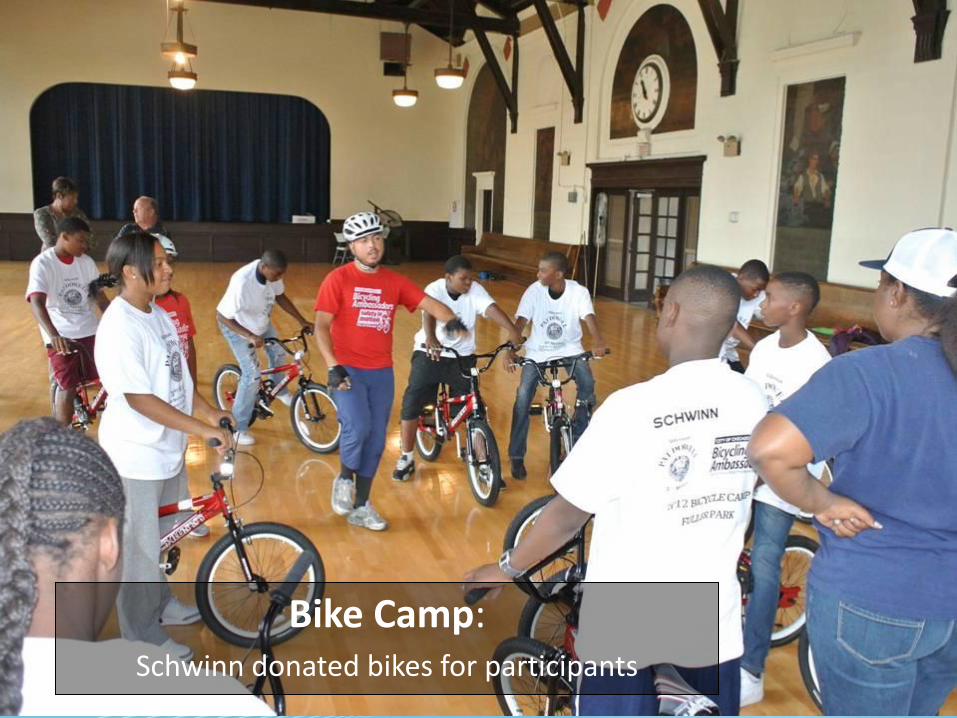
Bike Camp: Schwinn donated bikes for participants

Enforcement Actions
Continue red-light automated enforcement program (map at left)
Reduced angle (“T-Bone”) crashes by 29% in 2 years
Automated speed enforcement in Safety Zones around schools & parks.
Targeted crosswalk enforcement efforts (100/yr) across city with Police
Publicity magnifies impact

Pedestrian Enforcement Actions
Targeted enforcement efforts 100/yr across city with Police Department, Aldermen
Even occasional publicity magnifies impact
Help Police integrate pedestrian and bicycle protection enforcement into officers’ regular duties.
Encourage assignment of bicycle and pedestrian safety trainers in the Police Department.

Preserve our multi-billion dollar assets
On-time, scheduled maintenance
Fix it first, build it better
Inspect and Coordinate
Secure resources to keep up with needs

Wacker Drive Photo(s)
Rebuilding Wacker Drive

Grand/State Subway Reconstruction
New backlit signage wall
New expanded mezzanine Northbound platform
New entrance kiosk

Utility Responsibility: Updated Regulations for Openings, Construction, and Repair of the Public Way
New Regulations published July 16, 2012 apply to utilities and contractors
Pavement markings must be restored with the repair of any street opening
All pavement markings removed during construction must replaced
If any portion of the markings are disturbed at any quadrant at any intersection, restoration must be curb-to-curb, including crosswalks, stop bars, lane markings, center-line markings, and bike lane treatments and symbols
Temporary markings required if the restoration is lasting longer than 14 days

For physical and economic health, expand and improve all modes
Complete Streets
Make Chicago the best big city in the world for walking/cycling
Efficient, affordable, attractive transit
Improve inter-modal connections
Predictable, safe, reliable motor vehicle operations

Complete Streets Policy The safety and convenience of all users of the
transportation system, including pedestrians, bicyclists, transit users, freight, and motor vehicle drivers shall be accommodated and balanced in all types of transportation and development projects and through all phases of a project so that even the most vulnerable – children, elderly, and persons with disabilities – can travel safely within the public right of way.
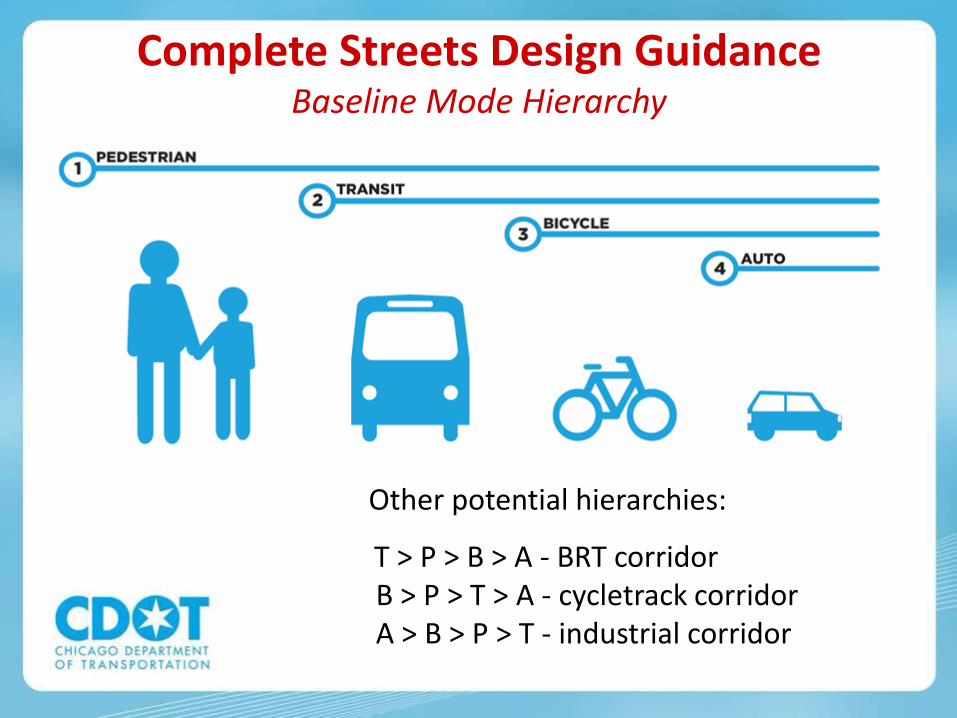
Complete Streets Design Guidance Baseline Mode Hierarchy
Other potential hierarchies:
T > P > B > A - BRT corridor B > P > T > A - cycletrack corridor A > B > P > T - industrial corridor

Landscaping Pedestrian Refuges
Bus-rapid Transit Cycle Tracks Turn Lanes
Complete Streets Design Guidance Cross Section Development
Stoop area/Yards Door Zone
Building Setbacks Walkways
Trees Sidewalk Furniture
Driveways
Curbs Bicycle Lanes Cycle Tracks Parking Turn Lanes
Sample: 100’ Transit Corridor/Major Road Sample: 66’ Neighborhood/Mixed Use/Main Street

16 Tools for improving pedestrian conditions
20 Safety recommendations
16 Connectivity recommendations
6 Livability recommendations
10 Health-oriented recommendations

Bicycle Commuting in Chicago
• 15,096 daily bicycle commuters
• 2.5 times as many as in 2000
• Over twice the national average
• More per capita than NYC or LA
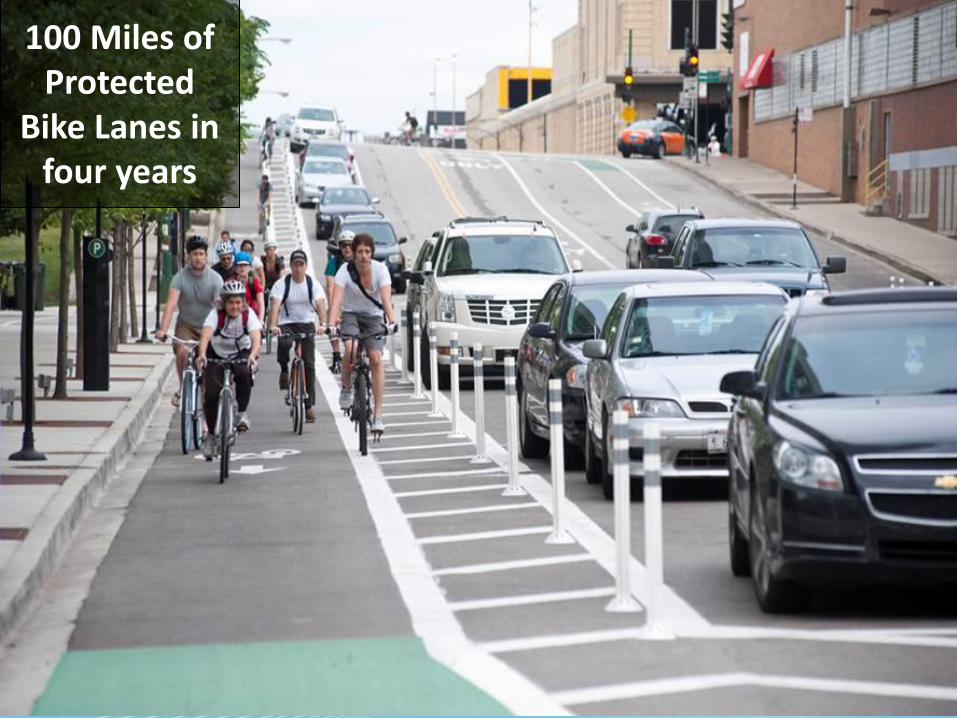
100 Miles of Protected
Bike Lanes in four years

Kinzie Street: Chicago’s First Protected Bike Lane
55% increase in bicyclists post-construction
Approximately 50% of a.m. eastbound traffic is bikes
Little to no increase in motor vehicle travel times

Chicago Bike Sharing 4,000 bikes, the largest in the United States
Launching Summer 2013, starting in greater central area
Designed for shorter, point-to-point trips
First half hour free for members Can drop off at any open station
Well-maintained, convenient, and adjustable, with bell and lights Provides transit/bike connectivity

Central Loop BRT
Conceptual design: details subject to change
• Improve on 3-5 mph bus speed • Rail-style amenities incl. level boarding • Adjacent/Parallel protected bike lanes • Transit Center at Union Station with
pedway to Amtrak/Metra concourse

36
Serves 6 routes that combine to offer rides every 2 minutes in the corridor Serves top commuter rail terminals, 7 rapid transit lines Serves routes to state’s top tourist attraction, Navy Pier and United Center (NBA/NHL stadium), shopping, offices, hospitals
Central Loop BRT
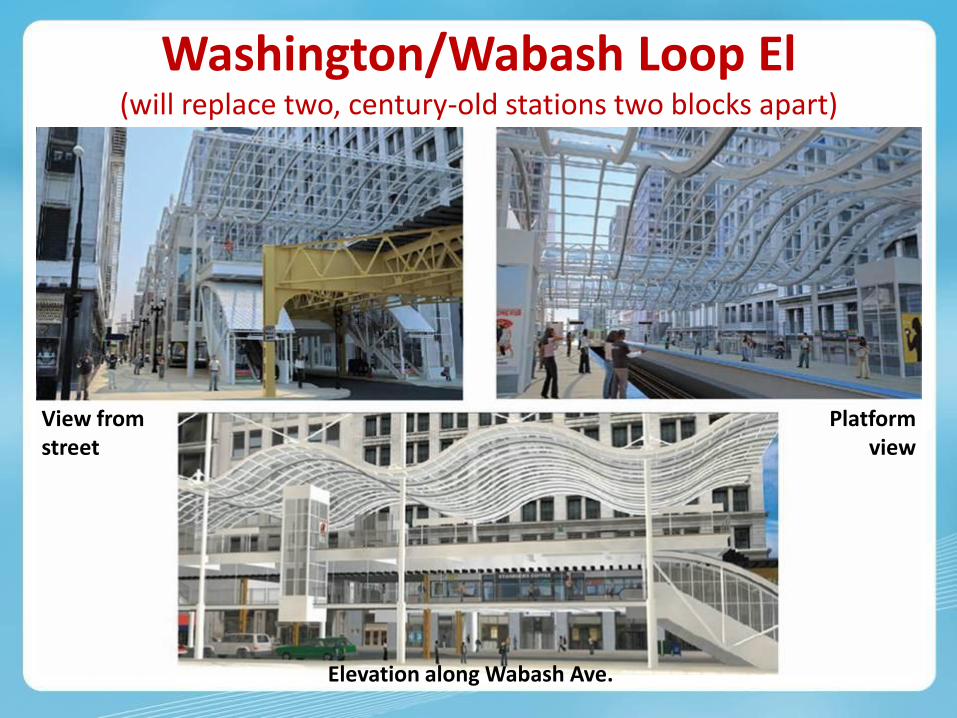
View from street
Platform view
Elevation along Wabash Ave.
Washington/Wabash Loop El (will replace two, century-old stations two blocks apart)
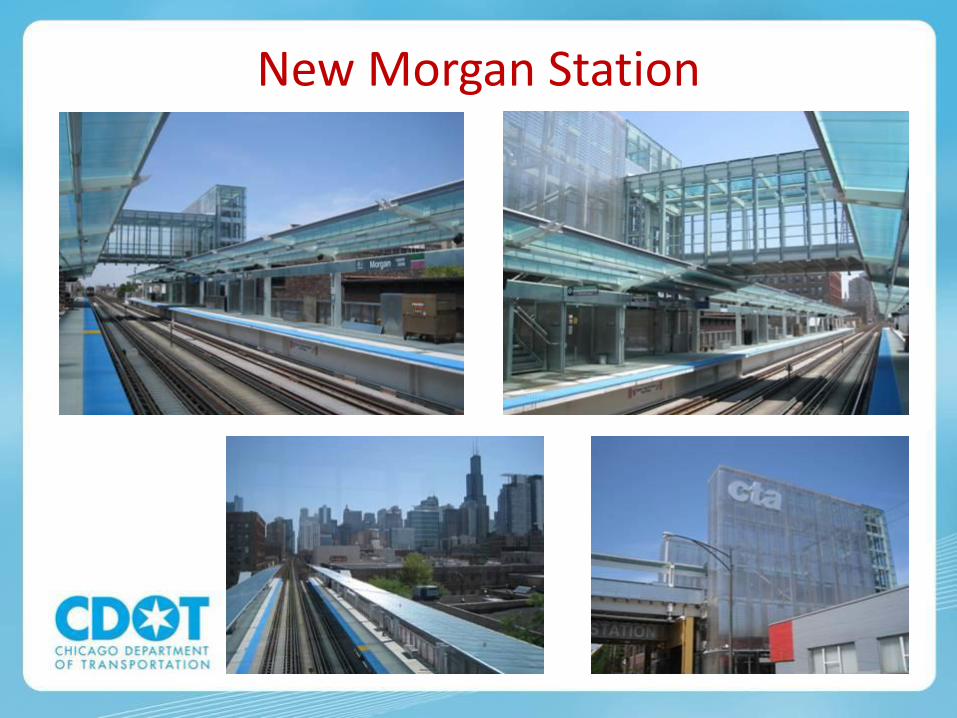
New Morgan Station
New backlit signage wall
New expanded mezzanine Northbound platform

Transform the agency to both serve and move people
Responsiveness
Transparency and Public Communications
Customer Information
Build agency and staff capacity and increase efficiencies

ChicagoTraffic Tracker.com Rush Hour Screen Grab to Come
Real Time Traffic Information

Engage the Public Through Social Media

Digital Public Way

Support the Chicago Climate Action Plan
Enhance Chicago Green Streets program
Reduce Stormwater Runoff
Promote energy conservation
Reduce waste; increase use of recycled materials

Plug-in Electric Vehicles & Infrastructure: Phase 1
Will create densest network of Quick Charge stations in the world
City and State partnership
$2M State/Federal leverages almost $7M in private investment
280 Charging Stations 73 Public DC Fast Chargers 146 Public Level 2 61 Level 2 stations for car-sharing
organizations

Green Alley Program
Six pilot locations, and over 175 locations citywide
Program includes use of permeable pavements, recycled materials, high-albedo pavements, and dark-sky lighting.
Improves stormwater management and energy use through infrastructure improvements

Green Alley
High Albedo Permeable Concrete Alley

Existing
Bloomingdale Trail
Conceptual Design

Support a $500+ Billion GDP regional economy
Make streets great for commerce
Improve Freight Operations
Improve Truck Mobility
Work with Regional Partners
Improve connections to the world (air/rail)
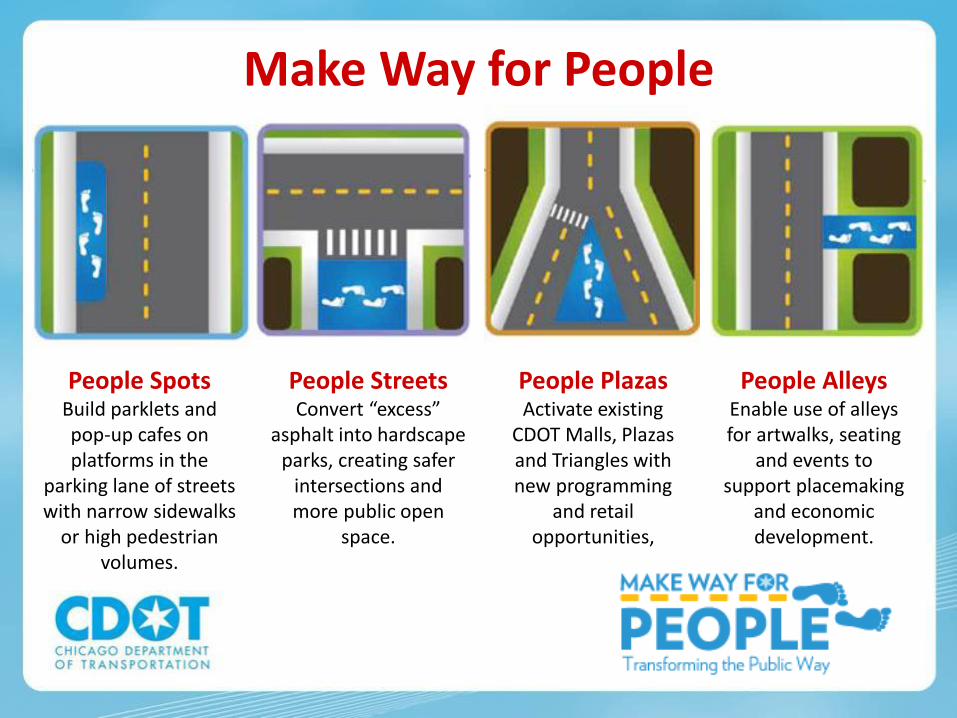
People Spots Build parklets and pop-up cafes on platforms in the
parking lane of streets with narrow sidewalks
or high pedestrian volumes.
People Streets Convert “excess”
asphalt into hardscape parks, creating safer
intersections and more public open
space.
People Plazas Activate existing
CDOT Malls, Plazas and Triangles with new programming
and retail opportunities,
Make Way for People
People Alleys Enable use of alleys for artwalks, seating
and events to support placemaking
and economic development.
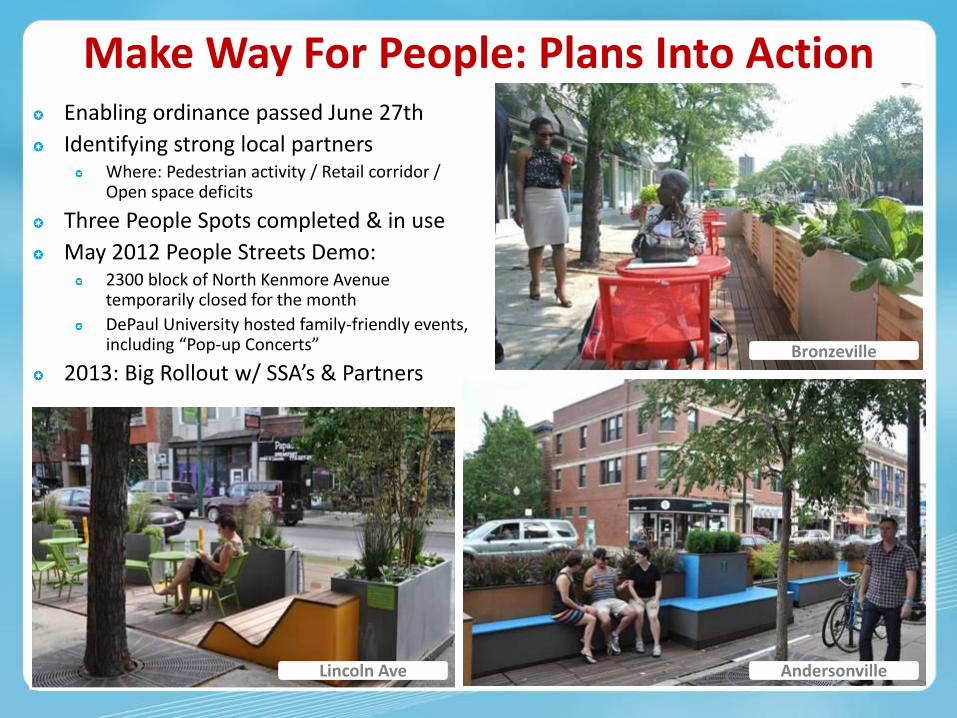
Make Way For People: Plans Into Action Enabling ordinance passed June 27th
Identifying strong local partners Where: Pedestrian activity / Retail corridor / Open space deficits
Three People Spots completed & in use
May 2012 People Streets Demo: 2300 block of North Kenmore Avenue temporarily closed for the month
DePaul University hosted family-friendly events, including “Pop-up Concerts”
2013: Big Rollout w/ SSA’s & Partners
Lincoln Ave Andersonville
Bronzeville

Corwith Intermodal
Yard


Stay In Touch!
Website www.chicagodot.org
@CDOTNews
Facebook facebook.com/CDOTNews
54