chicago mercantile exchange information sources · chicago mercantile exchange information sources...
TRANSCRIPT
Chicago Mercantile Exchange information sources
http://www.cmegroup.com/tools-information/index.html
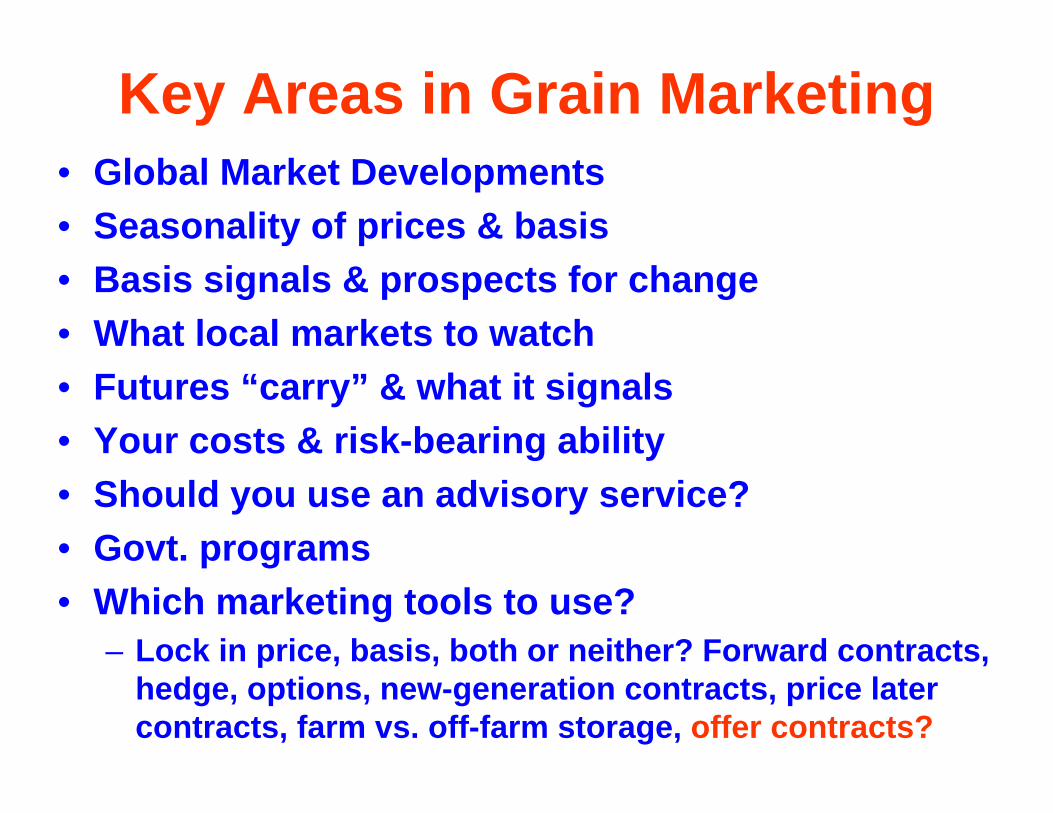
Key Areas in Grain Marketing• Global Market Developments• Seasonality of prices & basis• Basis signals & prospects for change• What local markets to watch• Futures “carry” & what it signals• Your costs & risk-bearing ability• Should you use an advisory service?• Govt. programs• Which marketing tools to use?
– Lock in price, basis, both or neither? Forward contracts, hedge, options, new-generation contracts, price later contracts, farm vs. off-farm storage, offer contracts?
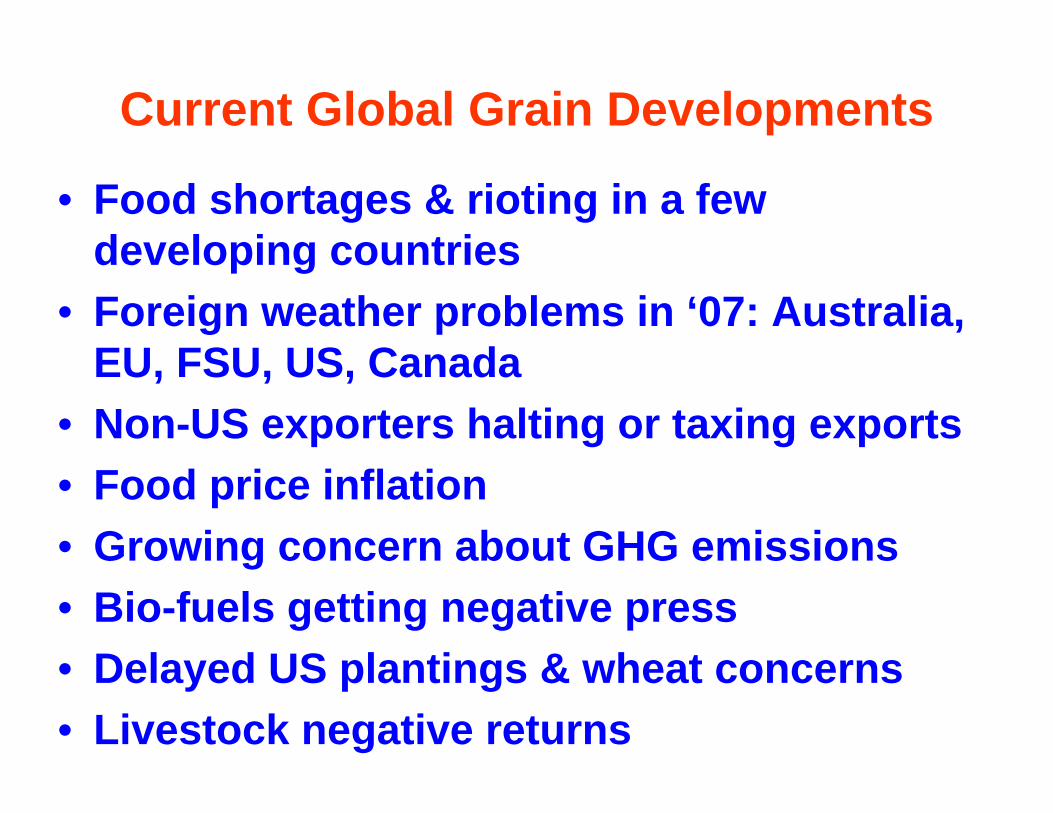
Current Global Grain Developments
• Food shortages & rioting in a few developing countries
• Foreign weather problems in ‘07: Australia, EU, FSU, US, Canada
• Non-US exporters halting or taxing exports • Food price inflation• Growing concern about GHG emissions • Bio-fuels getting negative press• Delayed US plantings & wheat concerns• Livestock negative returns
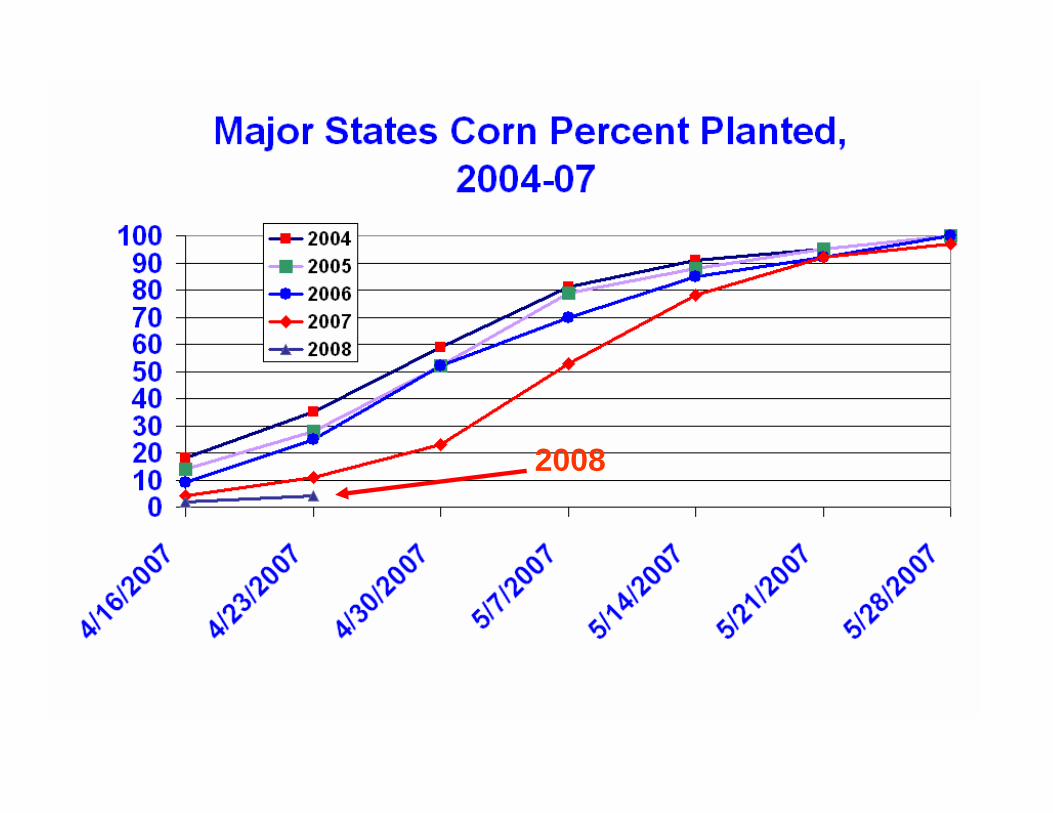
2008
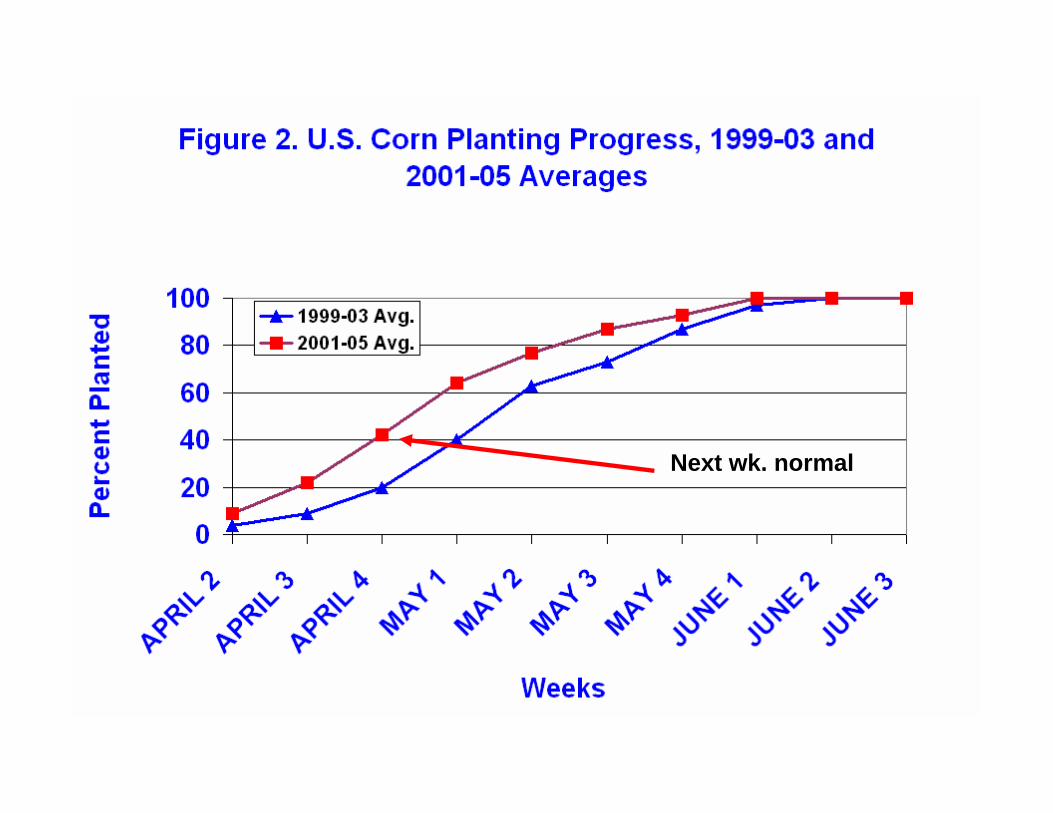
Next wk. normal
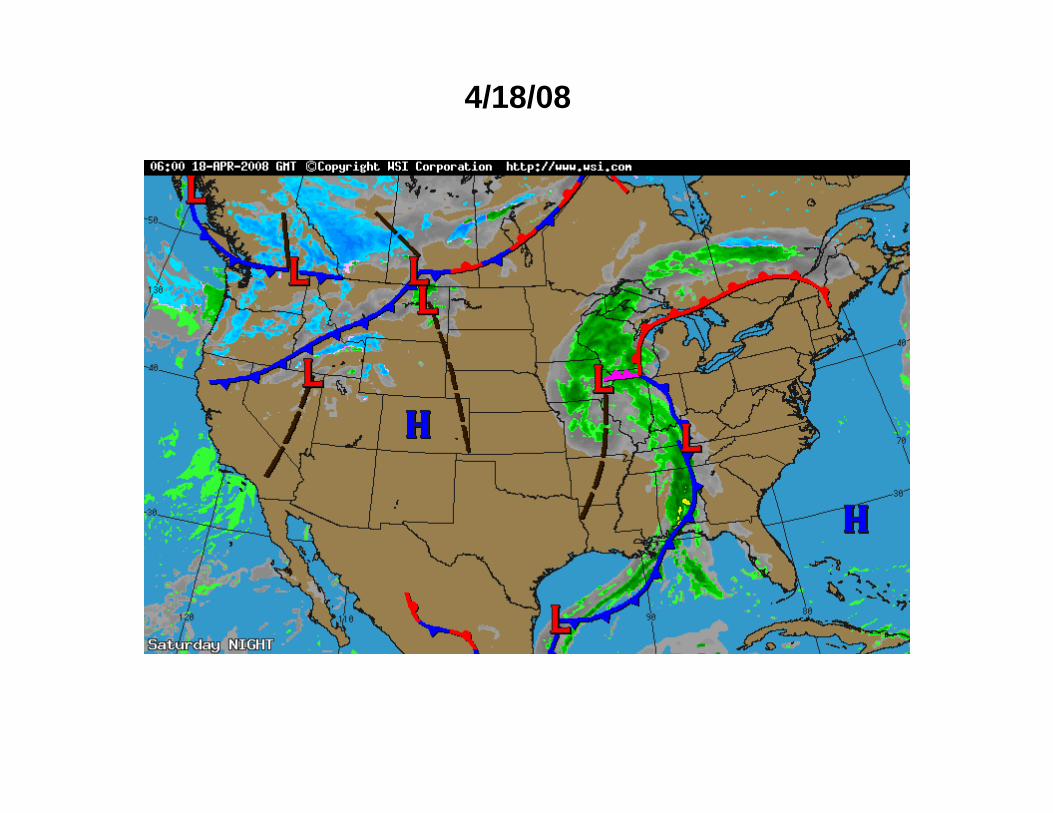
4/18/08

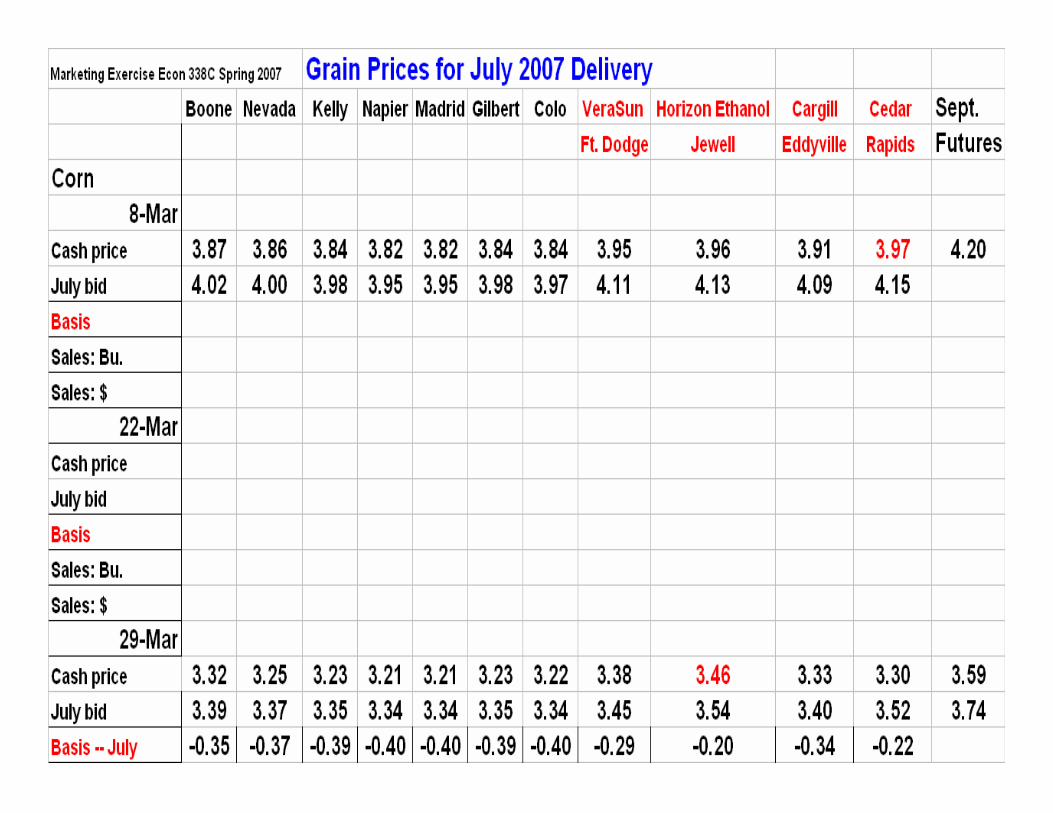
Prices when USDA planting intentions survey was taken

Price
as
of
04/18/08
11:15AM
C
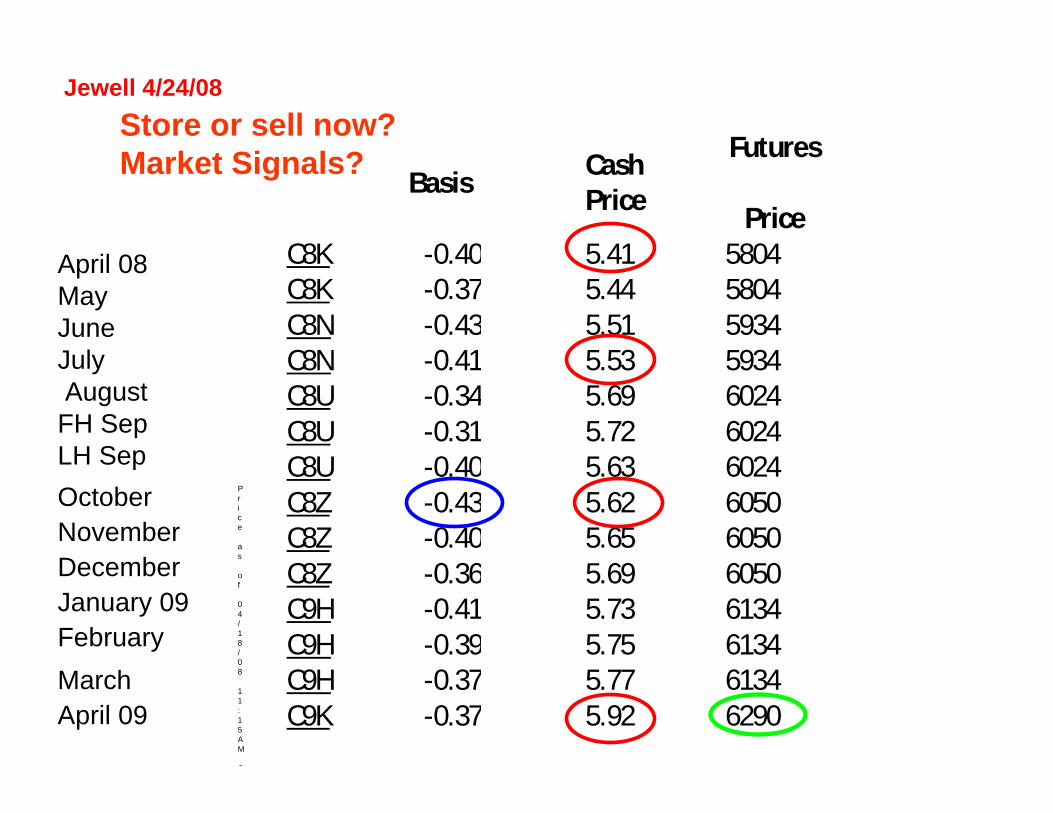
Jewell 4/24/08
Basis Cash Price
Futures
Price C8K -0.40 5.41 5804 C8K -0.37 5.44 5804 C8N -0.43 5.51 5934 C8N -0.41 5.53 5934 C8U -0.34 5.69 6024 C8U -0.31 5.72 6024 C8U -0.40 5.63 6024 C8Z -0.43 5.62 6050
8 C8Z -0.40 5.65 6050 C8Z -0.36 5.69 6050
C9H -0.41 5.73 6134 C9H -0.39 5.75 6134 C9H -0.37 5.77 6134 C9K -0.37 5.92 6290
April 08 MayJuneJuly August
FH Sep LH Sep October November December January 09 February MarchApril 09
Store or sell now?Market Signals?
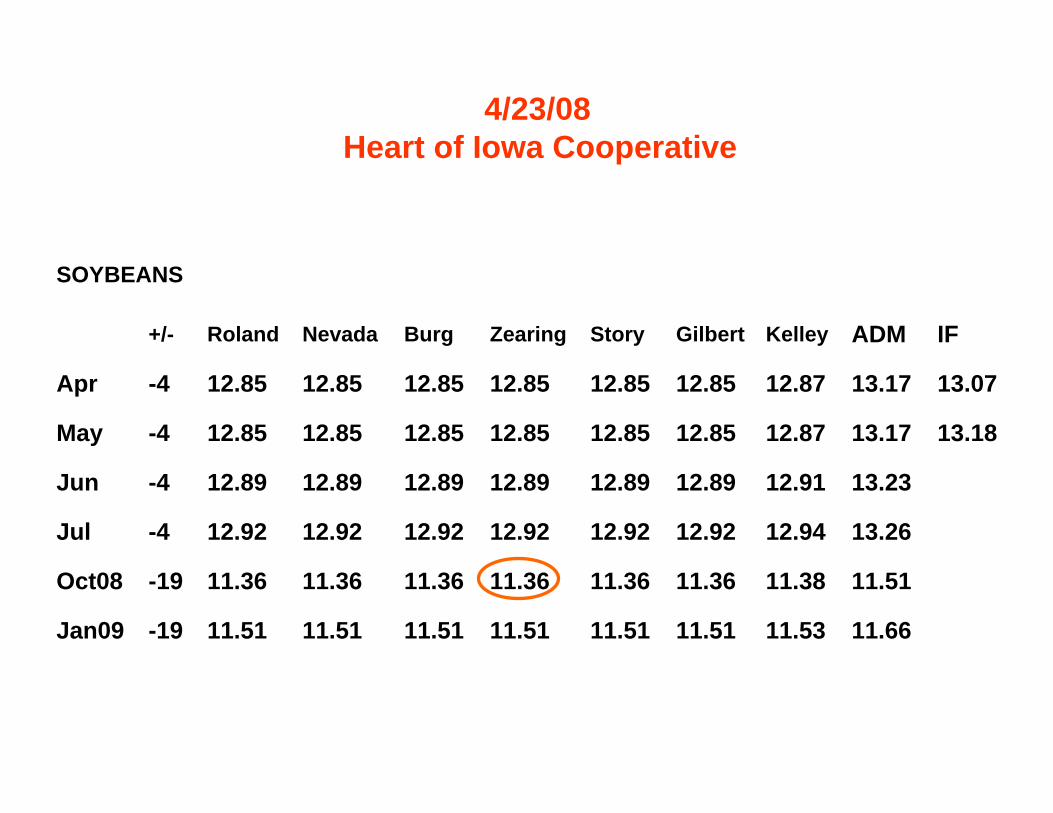
11.66 11.53 11.51 11.51 11.51 11.51 11.51 11.51 -19Jan09
11.51 11.38 11.36 11.36 11.36 11.36 11.36 11.36 -19Oct08
13.26 12.94 12.92 12.92 12.92 12.92 12.92 12.92 -4Jul
13.23 12.91 12.89 12.89 12.89 12.89 12.89 12.89 -4Jun
13.1813.17 12.87 12.85 12.85 12.85 12.85 12.85 12.85 -4May
13.0713.17 12.87 12.85 12.85 12.85 12.85 12.85 12.85 -4Apr
IFADMKelleyGilbertStoryZearingBurgNevadaRoland+/-
SOYBEANS
4/23/08Heart of Iowa Cooperative
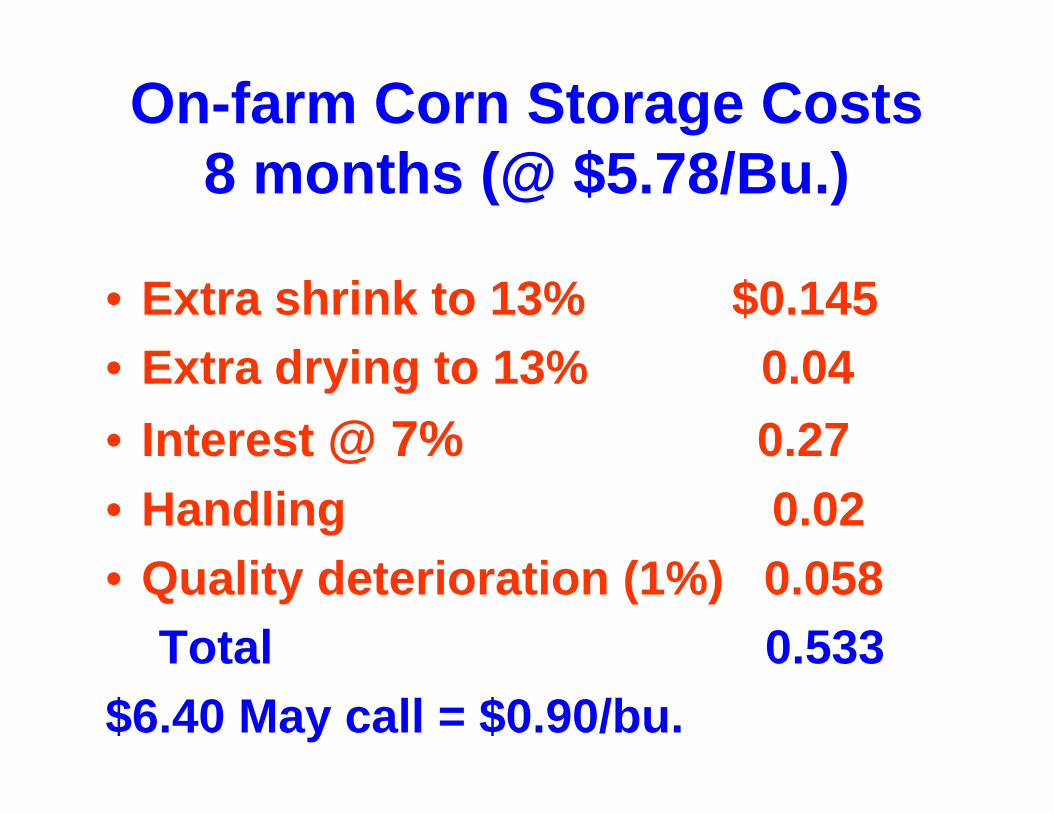
On-farm Corn Storage Costs8 months (@ $5.78/Bu.)
• Extra shrink to 13% $0.145• Extra drying to 13% 0.04 • Interest @ 7% 0.27• Handling 0.02• Quality deterioration (1%) 0.058
Total 0.533$6.40 May call = $0.90/bu.
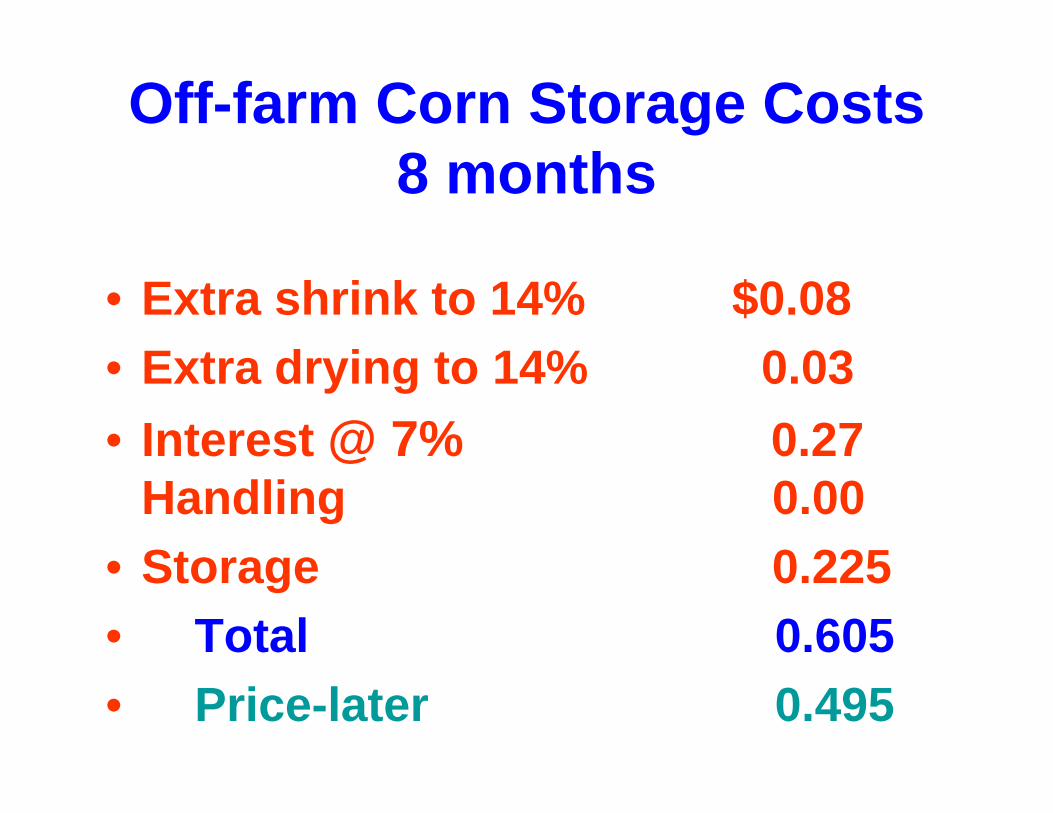
Off-farm Corn Storage Costs8 months
• Extra shrink to 14% $0.08• Extra drying to 14% 0.03 • Interest @ 7% 0.27
Handling 0.00• Storage 0.225• Total 0.605• Price-later 0.495
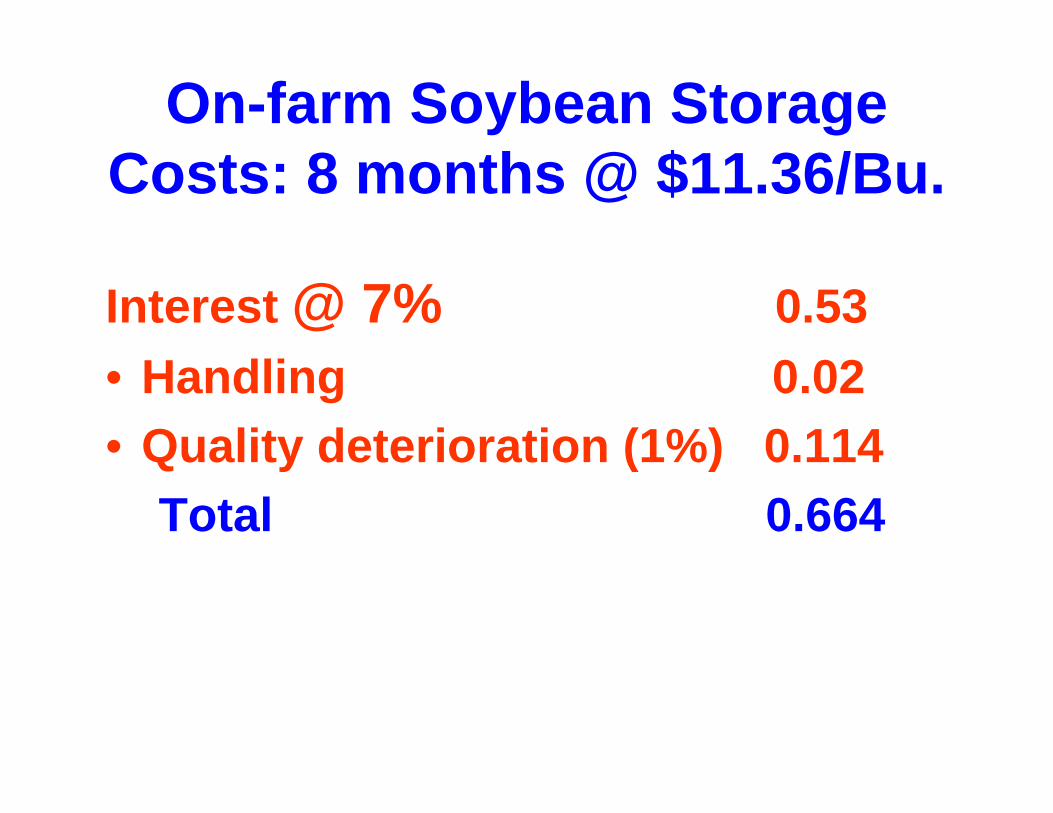
On-farm Soybean Storage Costs: 8 months @ $11.36/Bu.
Interest @ 7% 0.53• Handling 0.02• Quality deterioration (1%) 0.114
Total 0.664
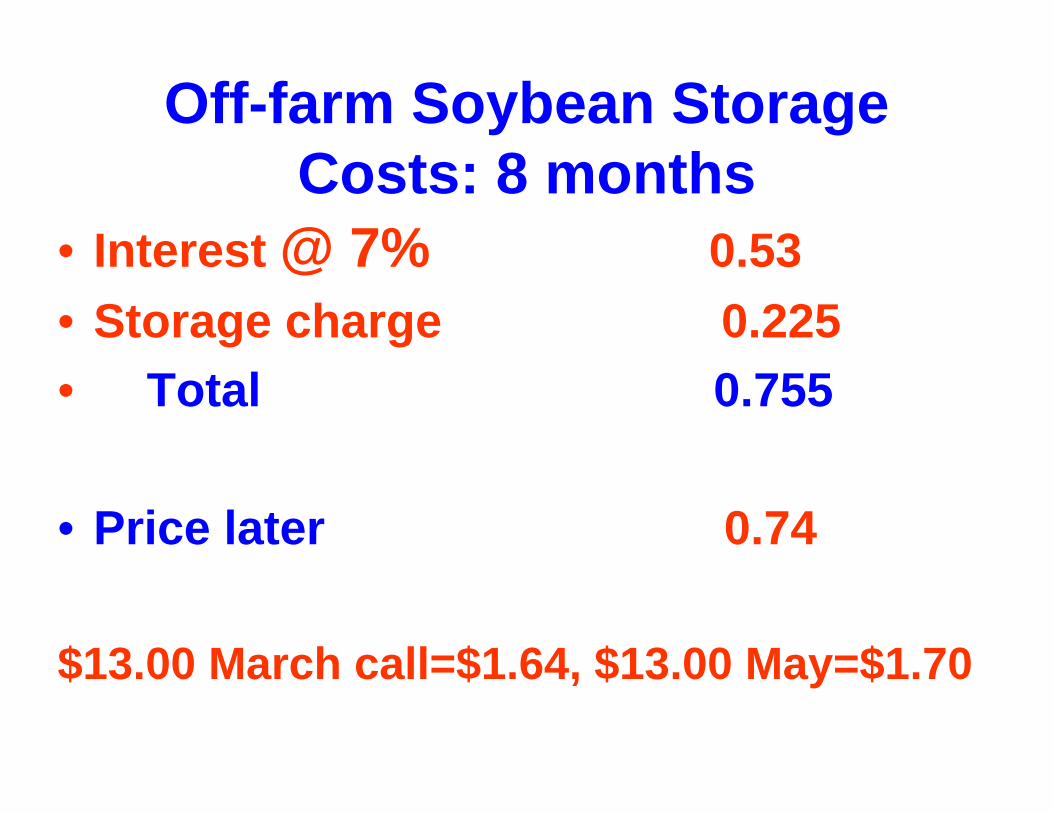
Off-farm Soybean Storage Costs: 8 months
• Interest @ 7% 0.53• Storage charge 0.225• Total 0.755
• Price later 0.74
$13.00 March call=$1.64, $13.00 May=$1.70
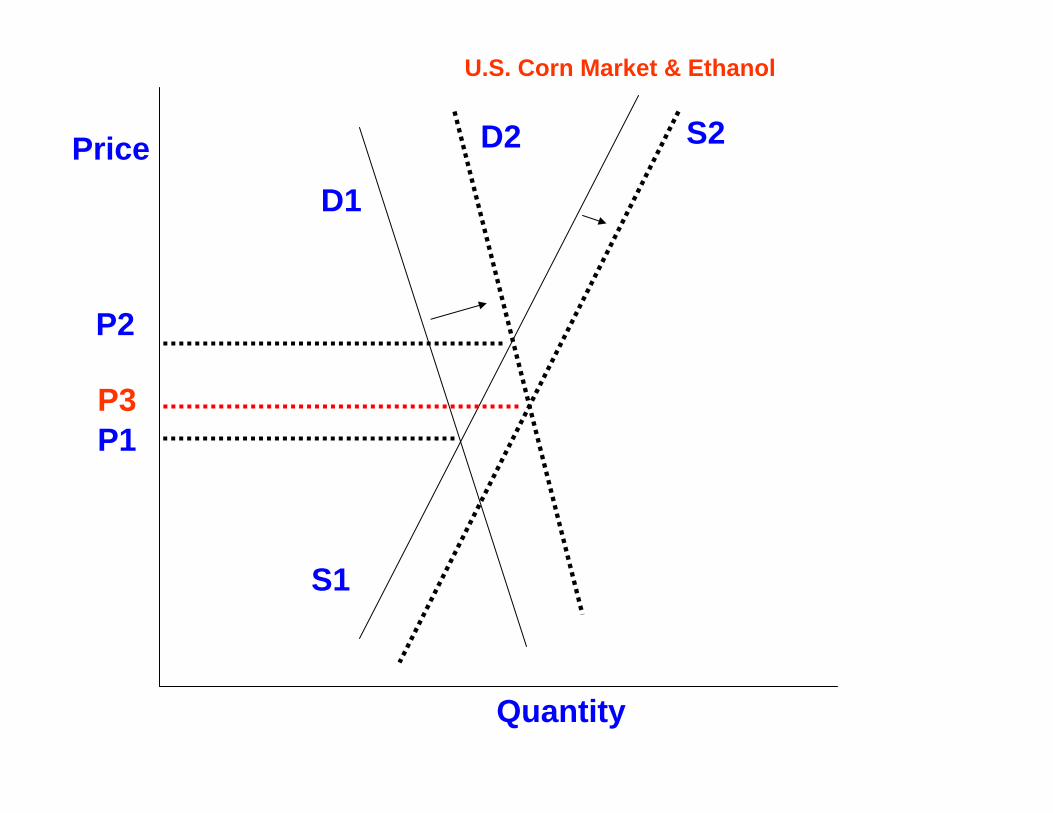
D1
D2 S2
S1
Price
Quantity
P1
P2
P3
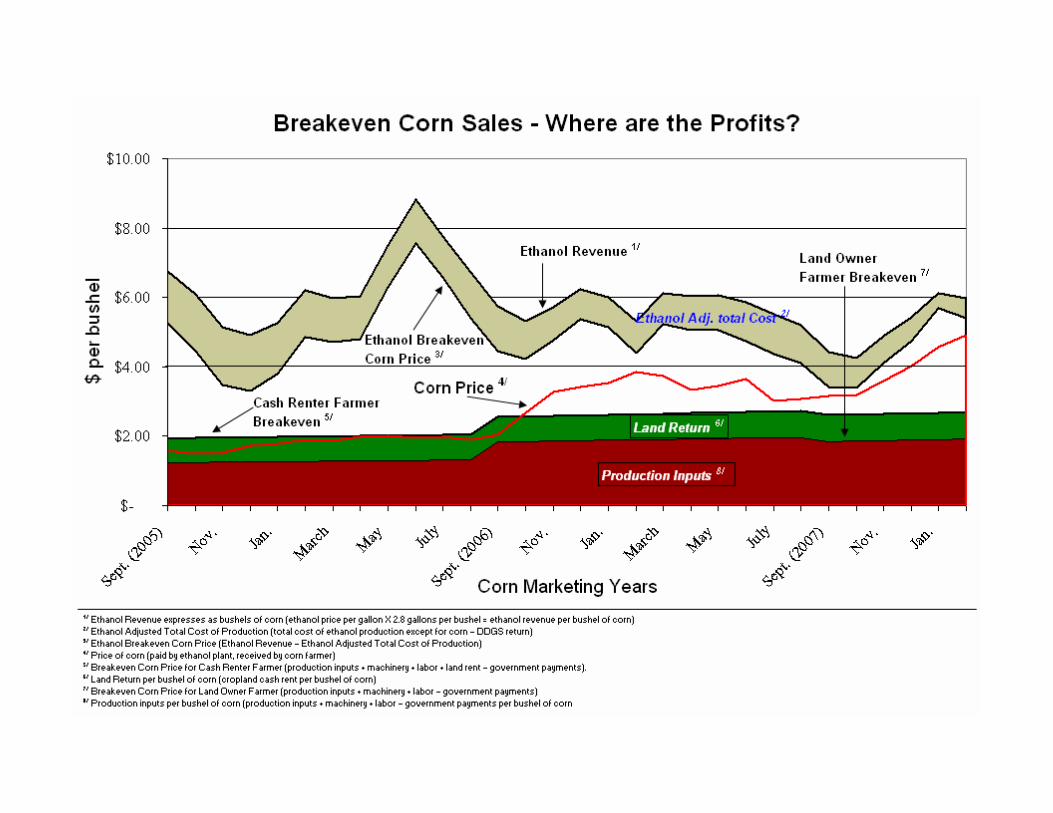
U.S. Corn Market & Ethanol
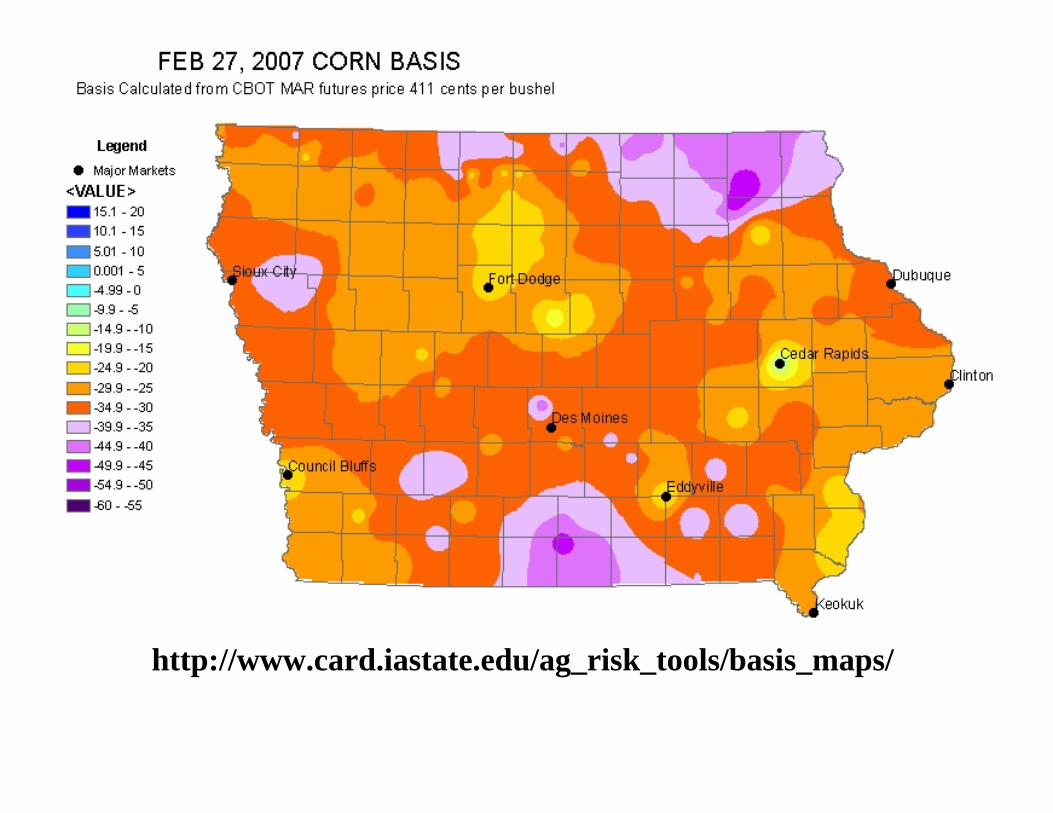
http://www.card.iastate.edu/ag_risk_tools/basis_maps/
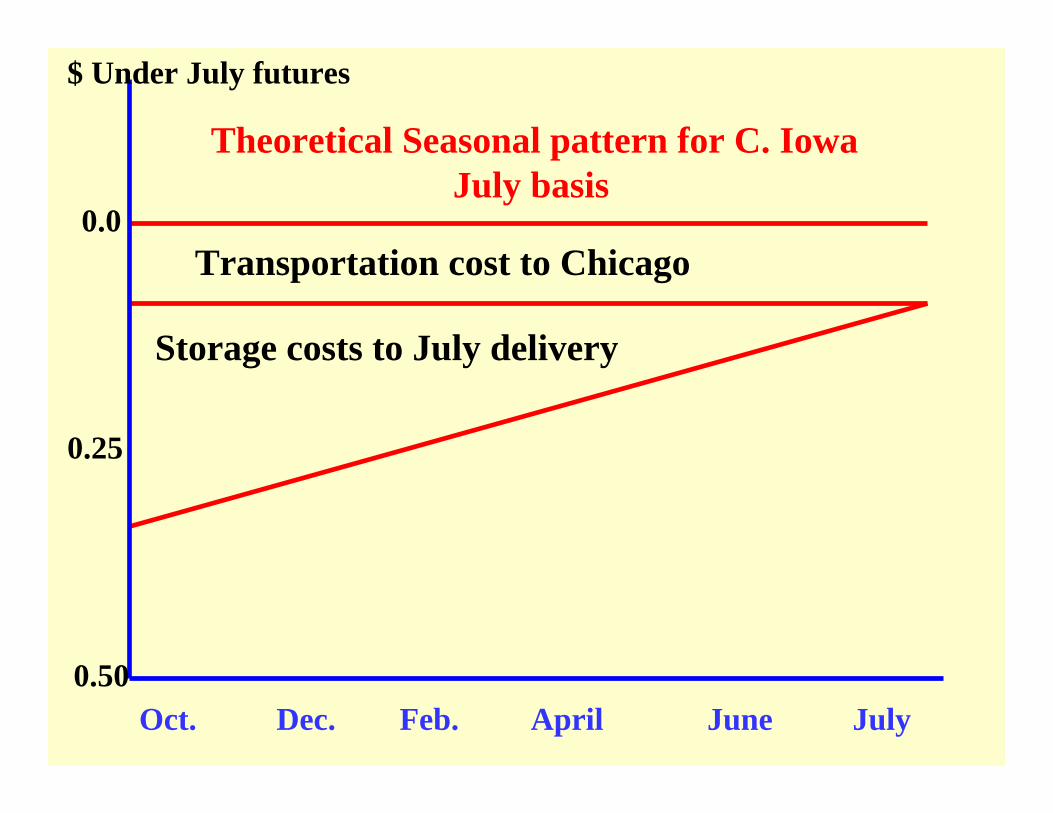
Theoretical Seasonal pattern for C. IowaJuly basis
Transportation cost to Chicago
Storage costs to July delivery
$ Under July futures
0.0
0.50
0.25
Oct. Dec. Feb. April June July
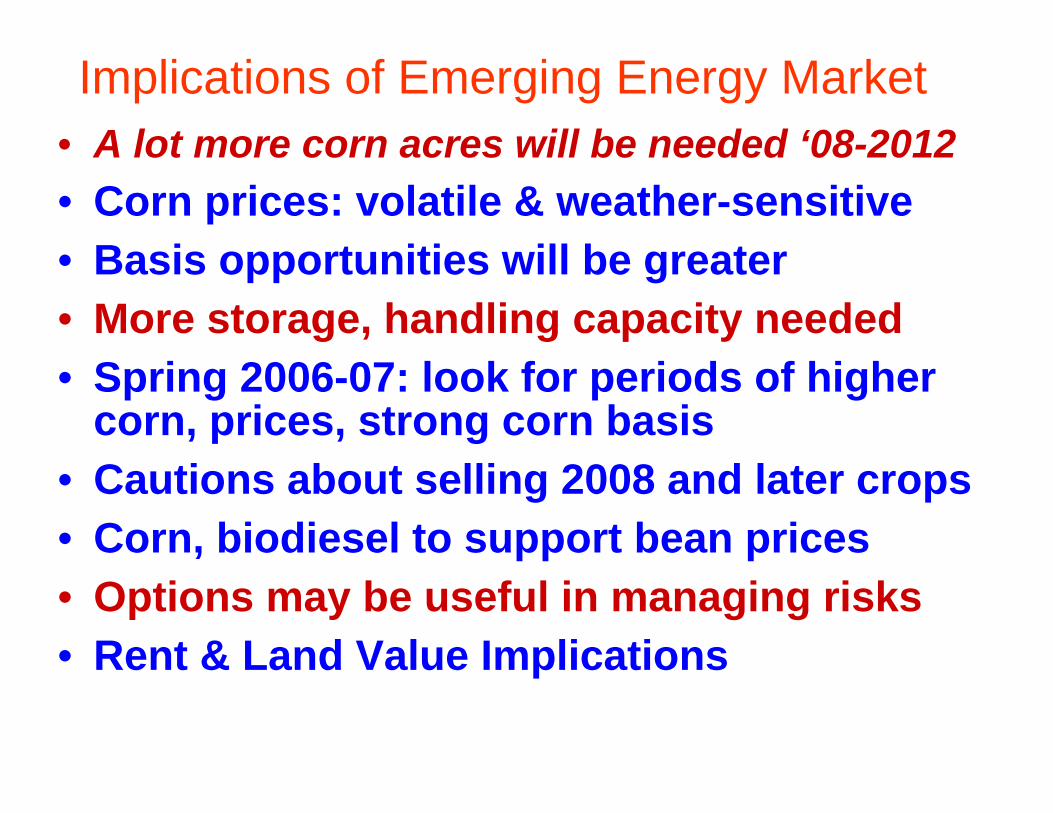
Implications of Emerging Energy Market• A lot more corn acres will be needed ‘08-2012• Corn prices: volatile & weather-sensitive• Basis opportunities will be greater• More storage, handling capacity needed• Spring 2006-07: look for periods of higher
corn, prices, strong corn basis• Cautions about selling 2008 and later crops• Corn, biodiesel to support bean prices• Options may be useful in managing risks• Rent & Land Value Implications
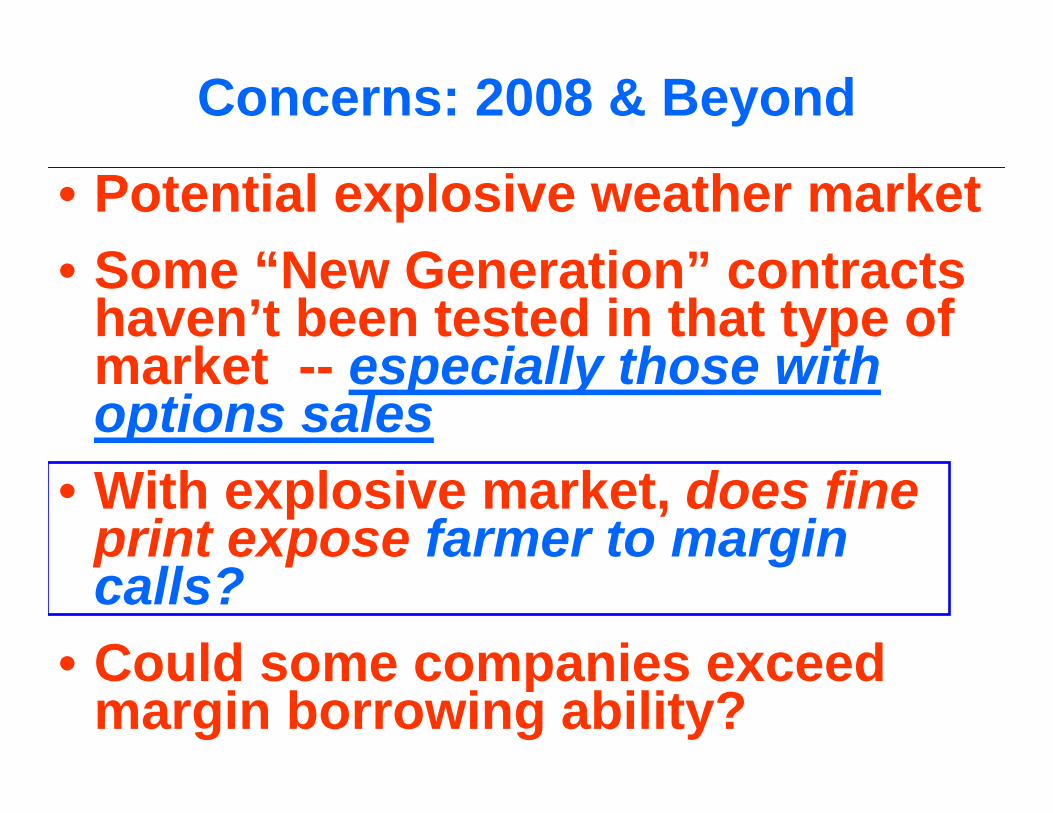
Concerns: 2008 & Beyond
• Potential explosive weather market• Some “New Generation” contracts
haven’t been tested in that type of market -- especially those with options sales
• With explosive market, does fine print expose farmer to margin calls?
• Could some companies exceed margin borrowing ability?
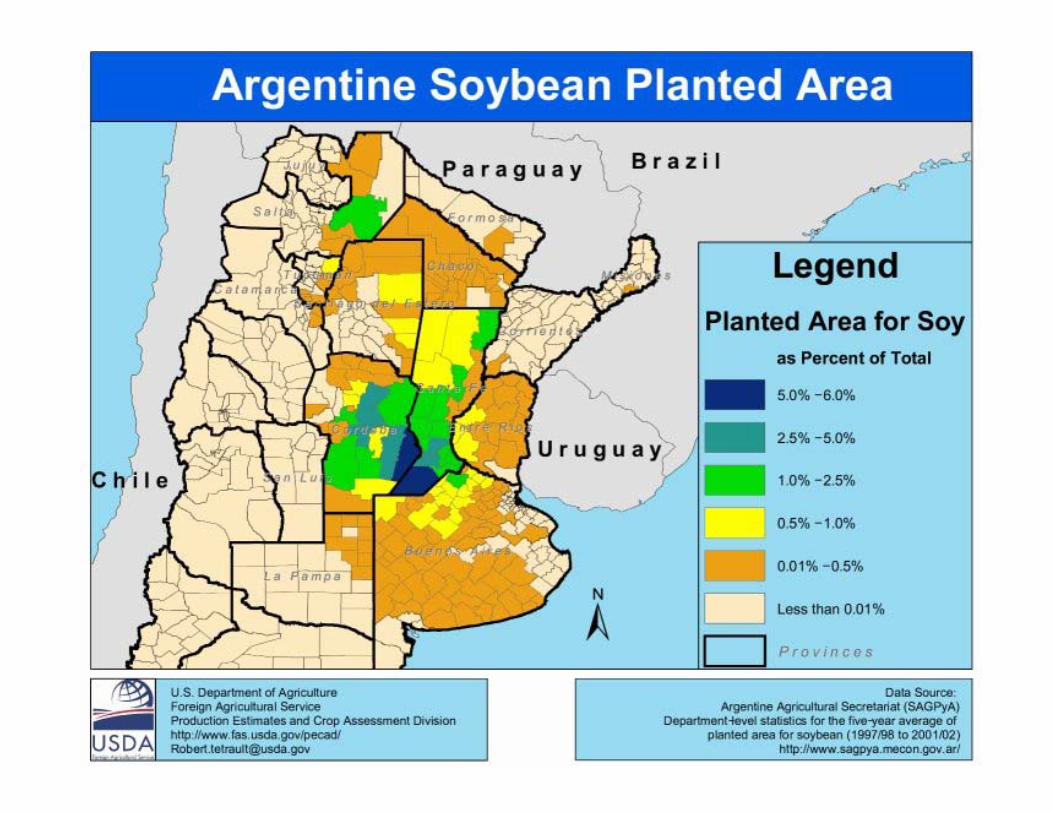
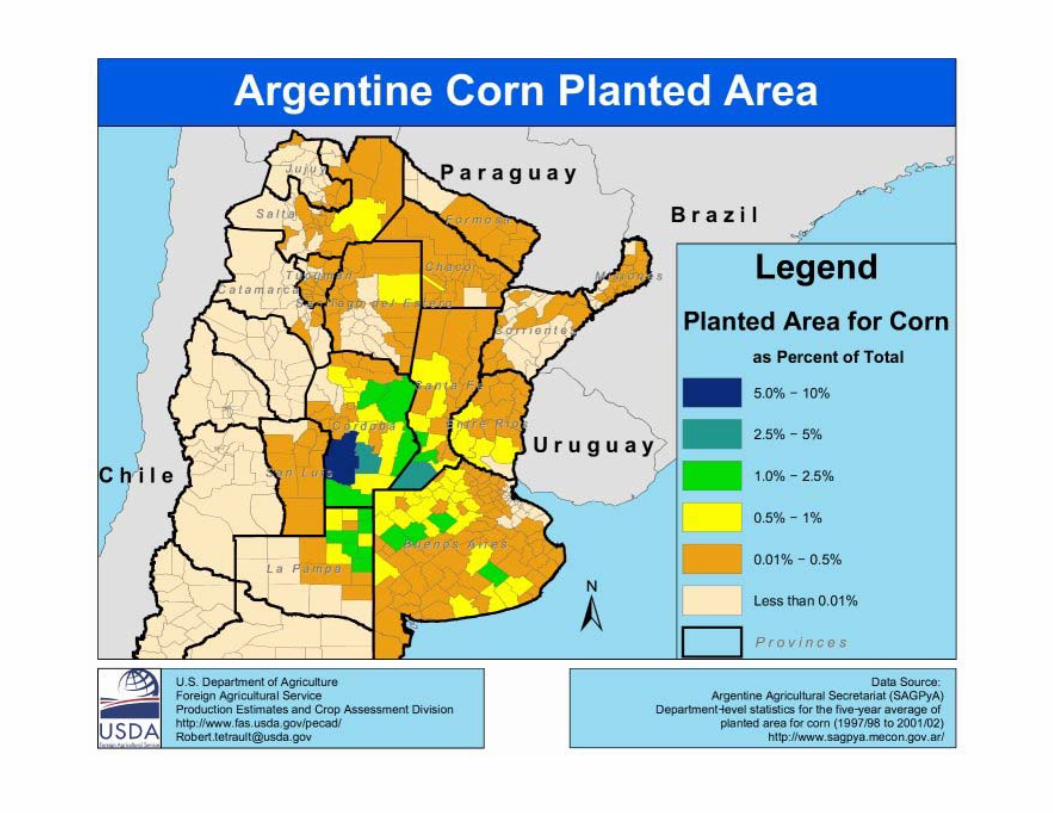
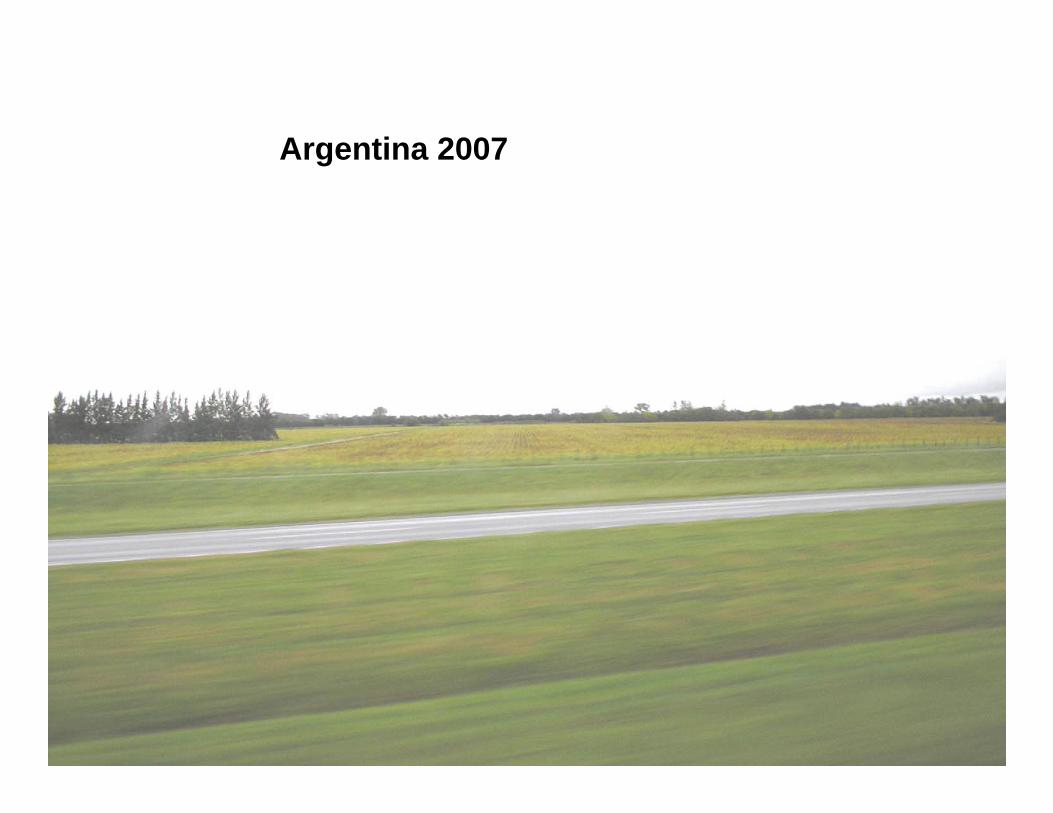
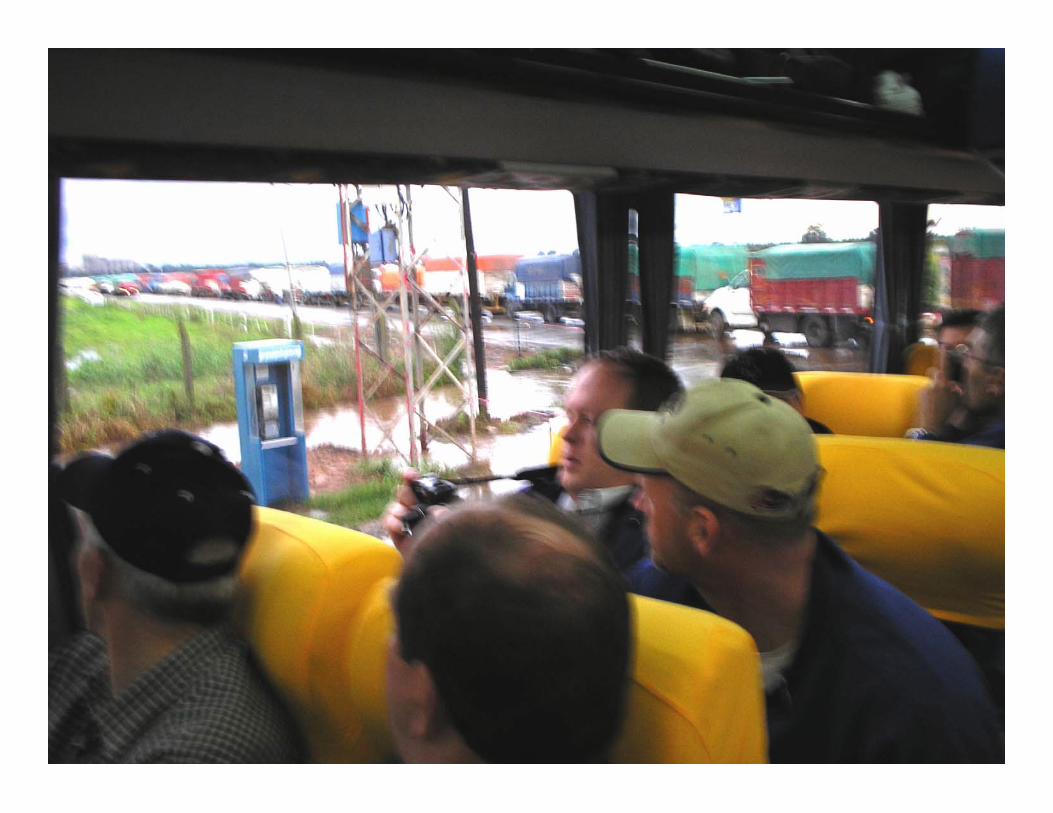
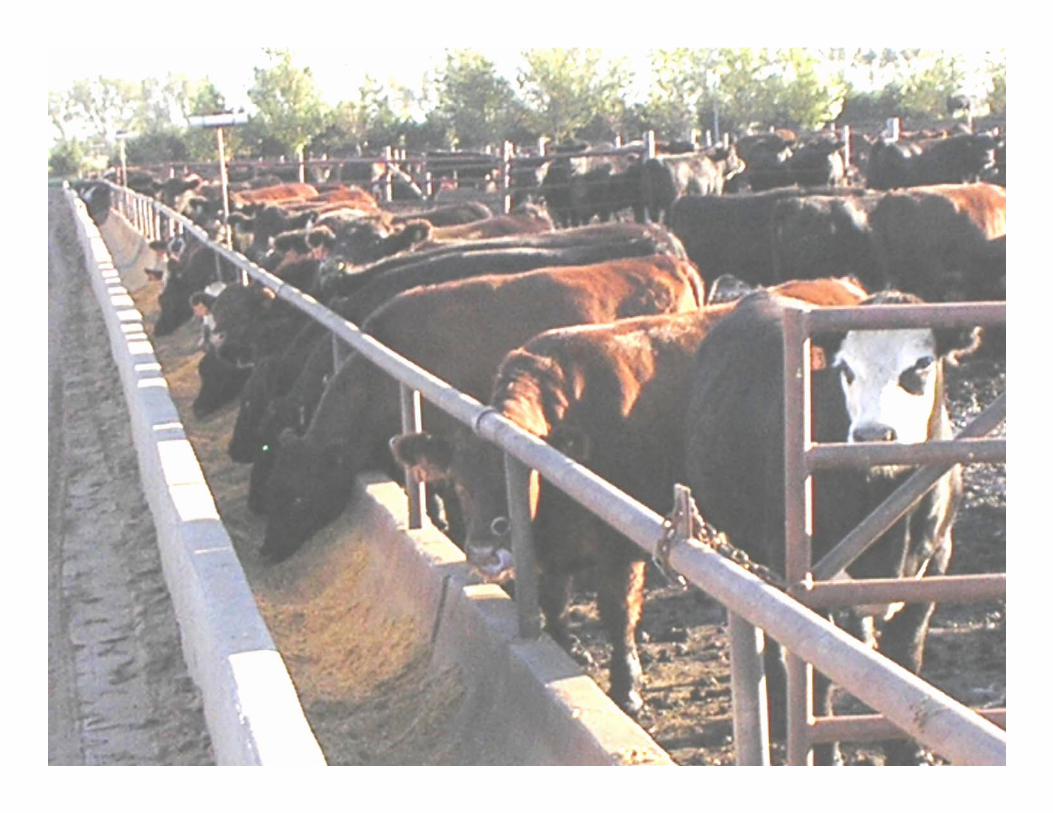
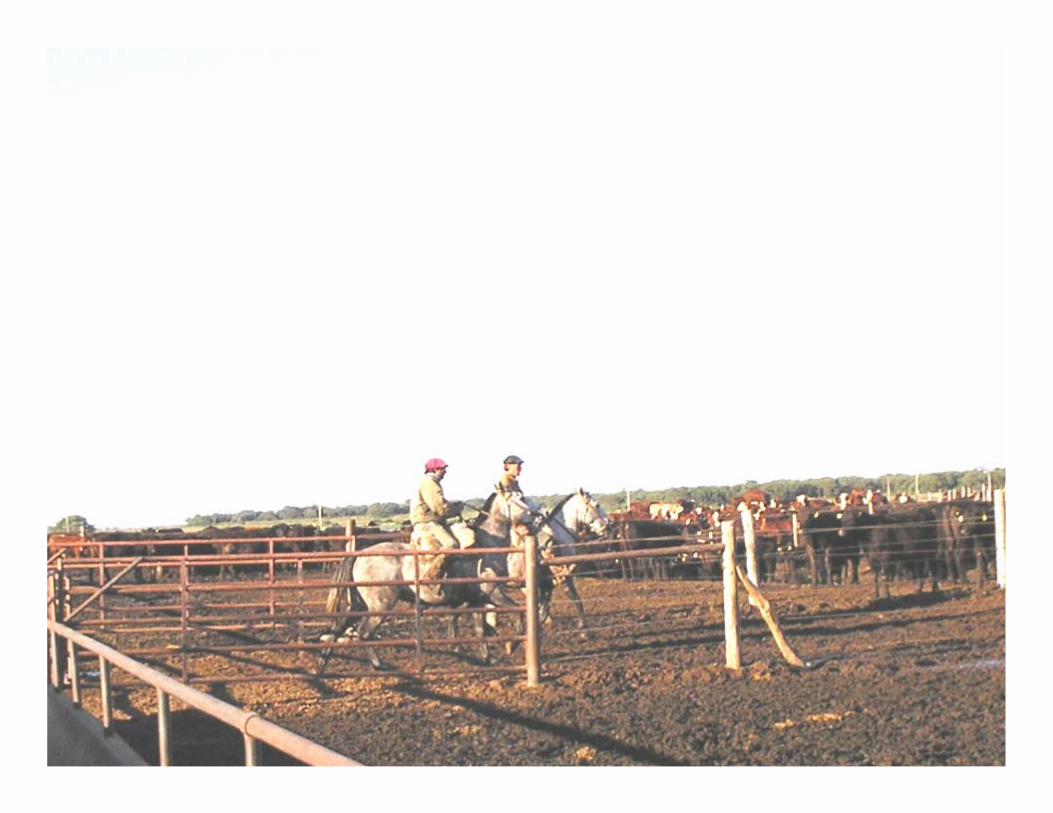
Argentina 2007
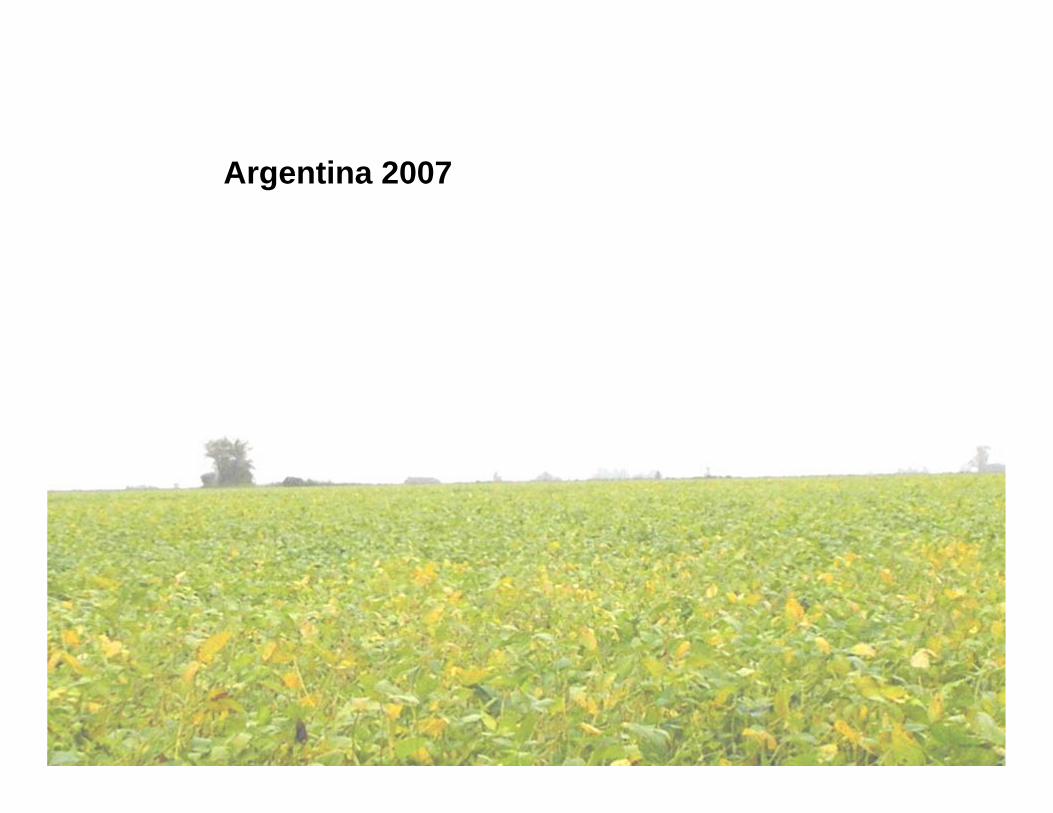
Argentina 2007
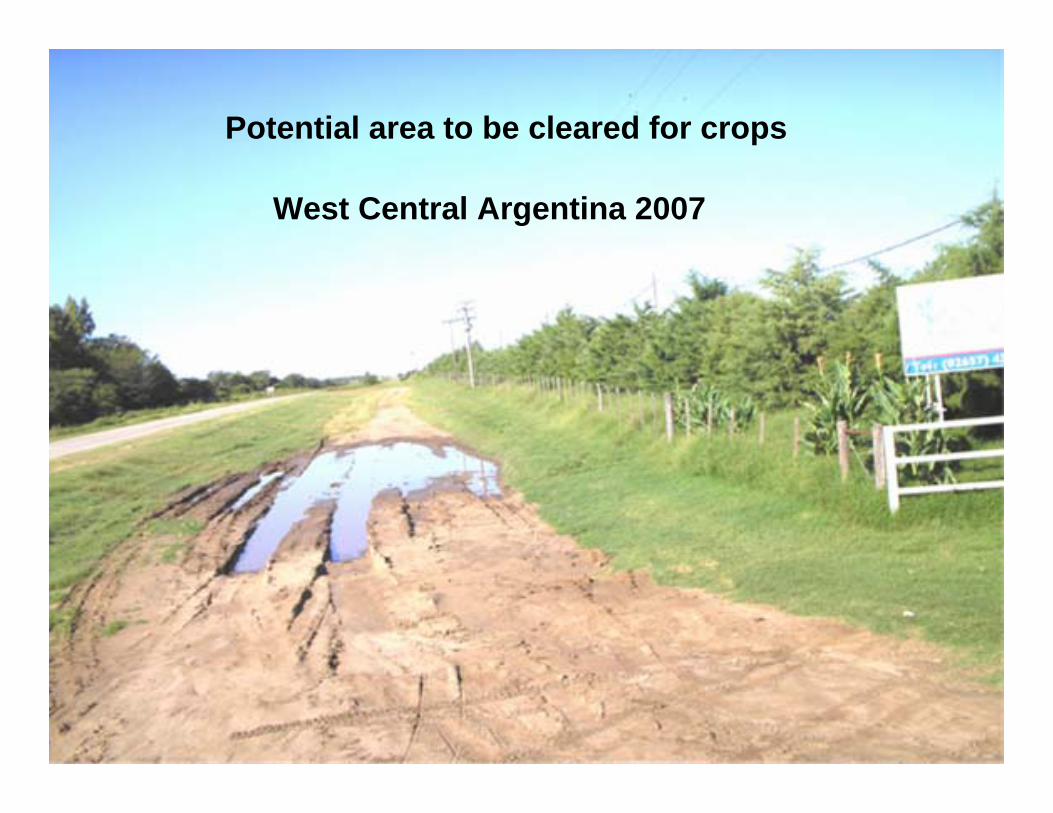
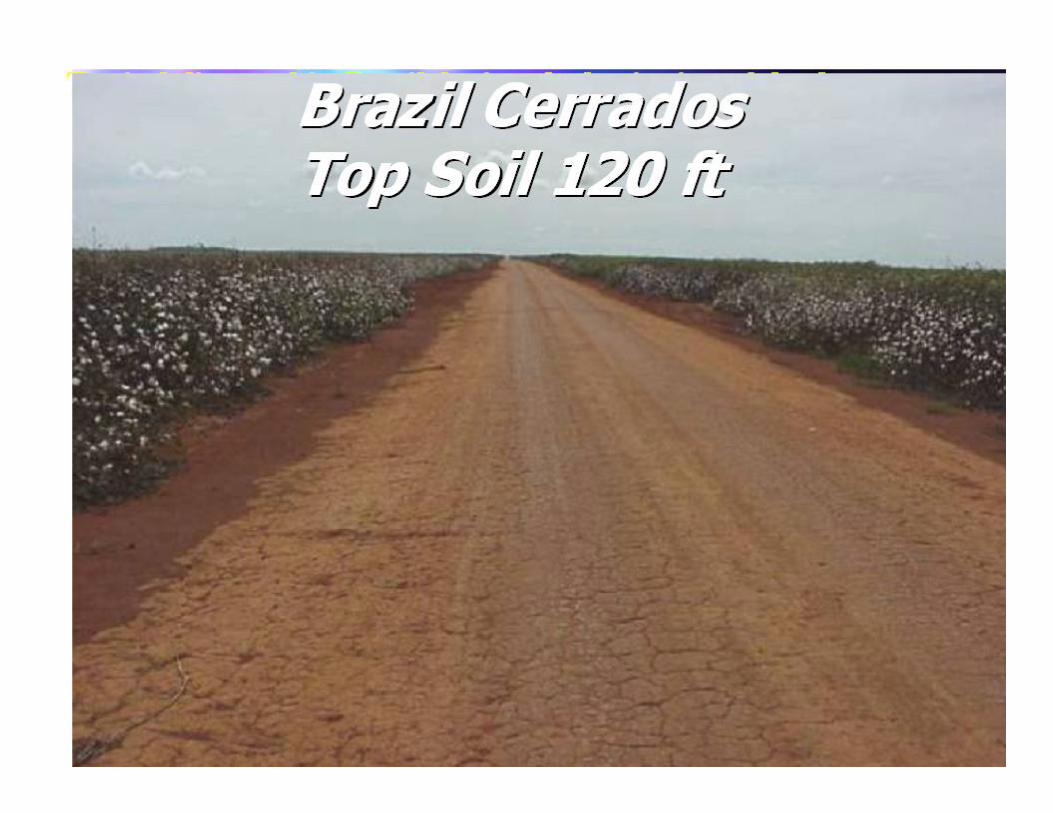
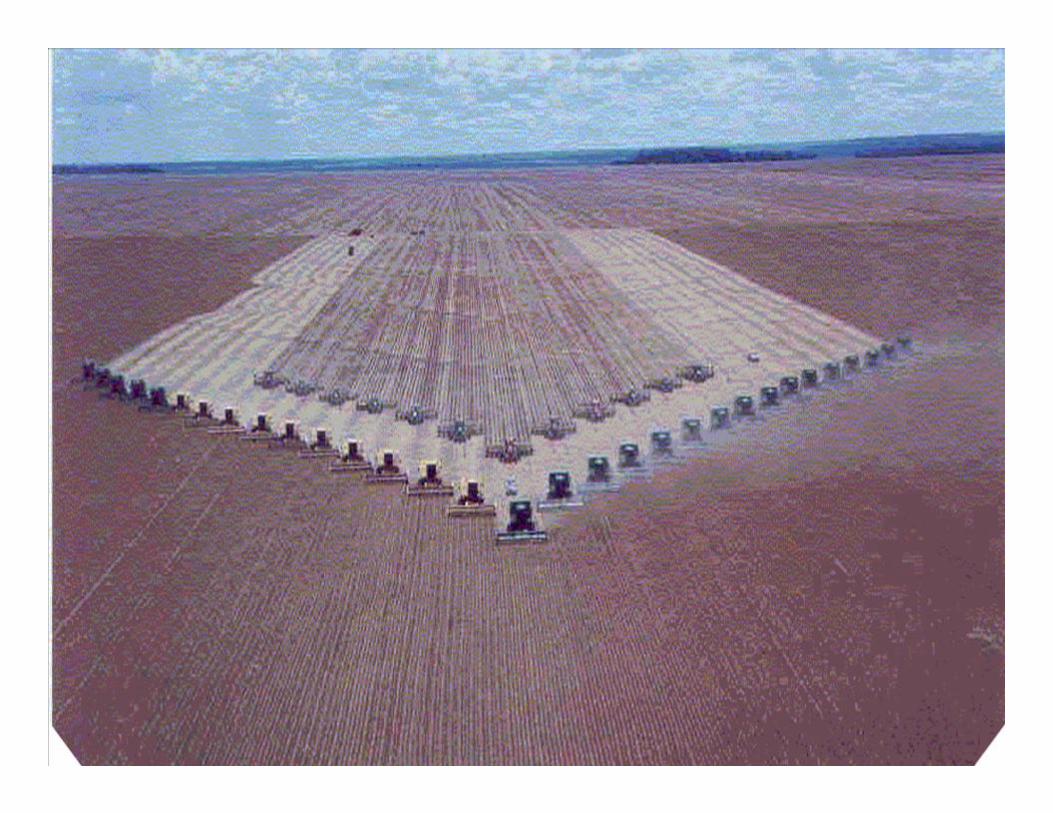
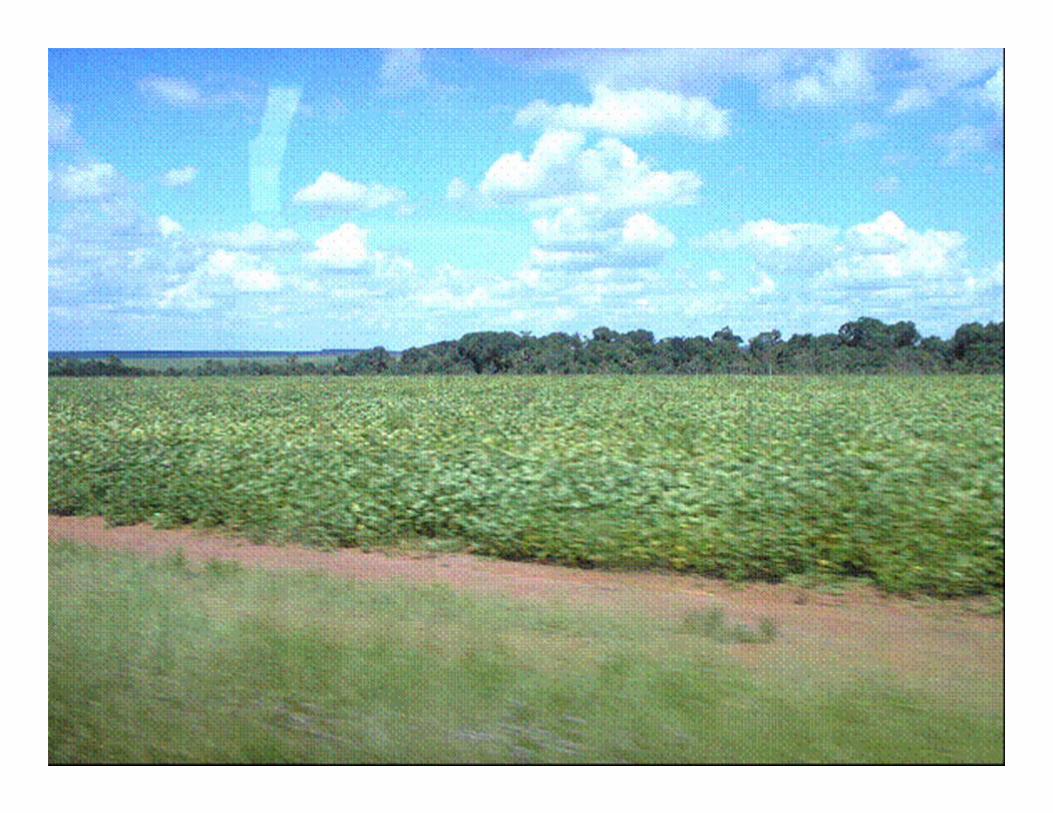
Potential area to be cleared for crops
West Central Argentina 2007
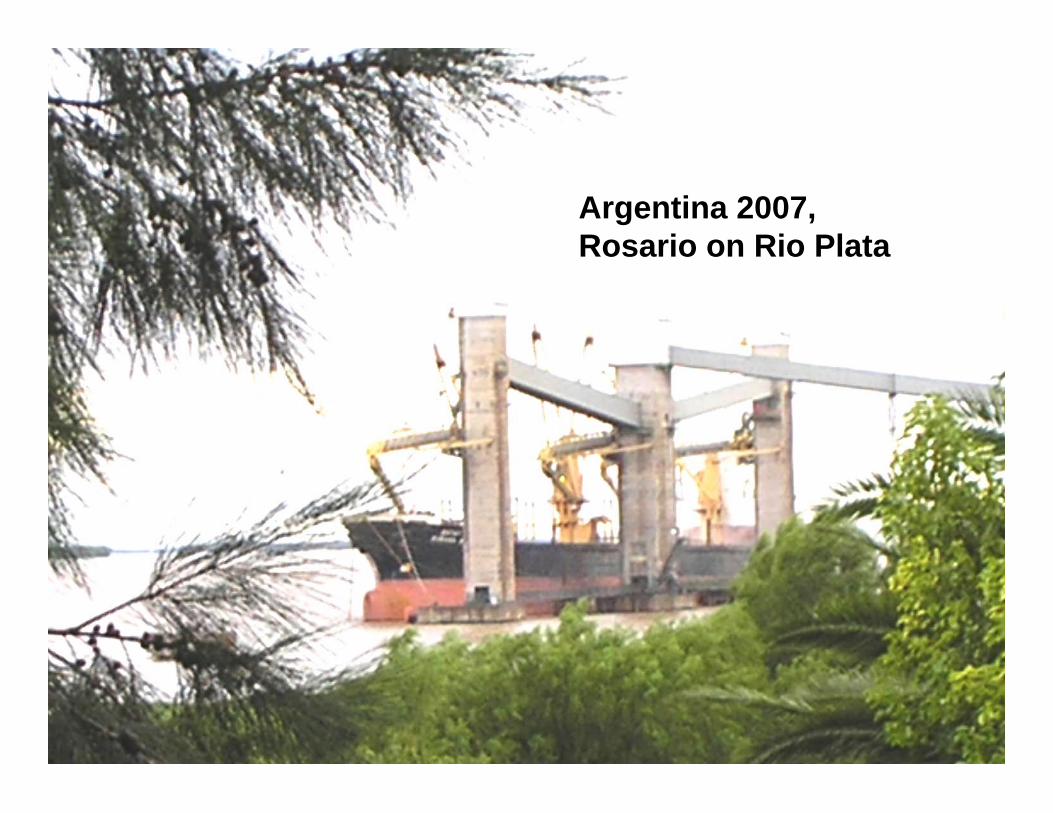
Argentina 2007, Rosario on Rio Plata
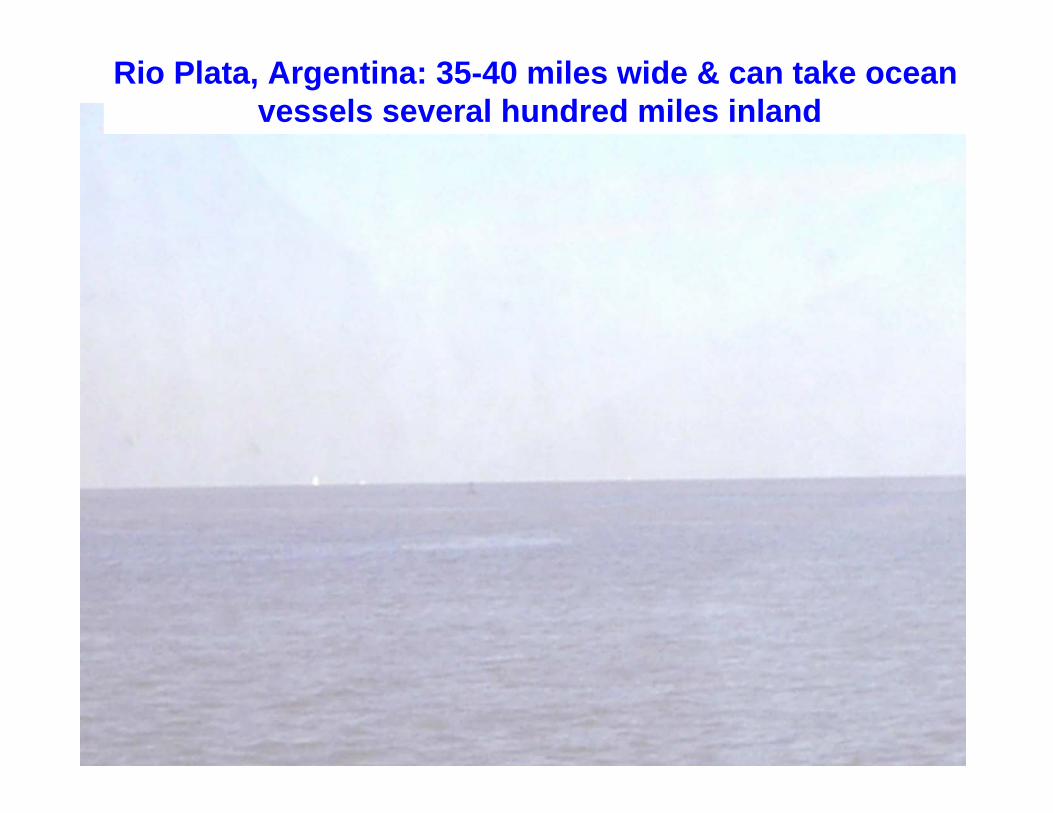
Rio Plata, Argentina: 35-40 miles wide & can take ocean vessels several hundred miles inland
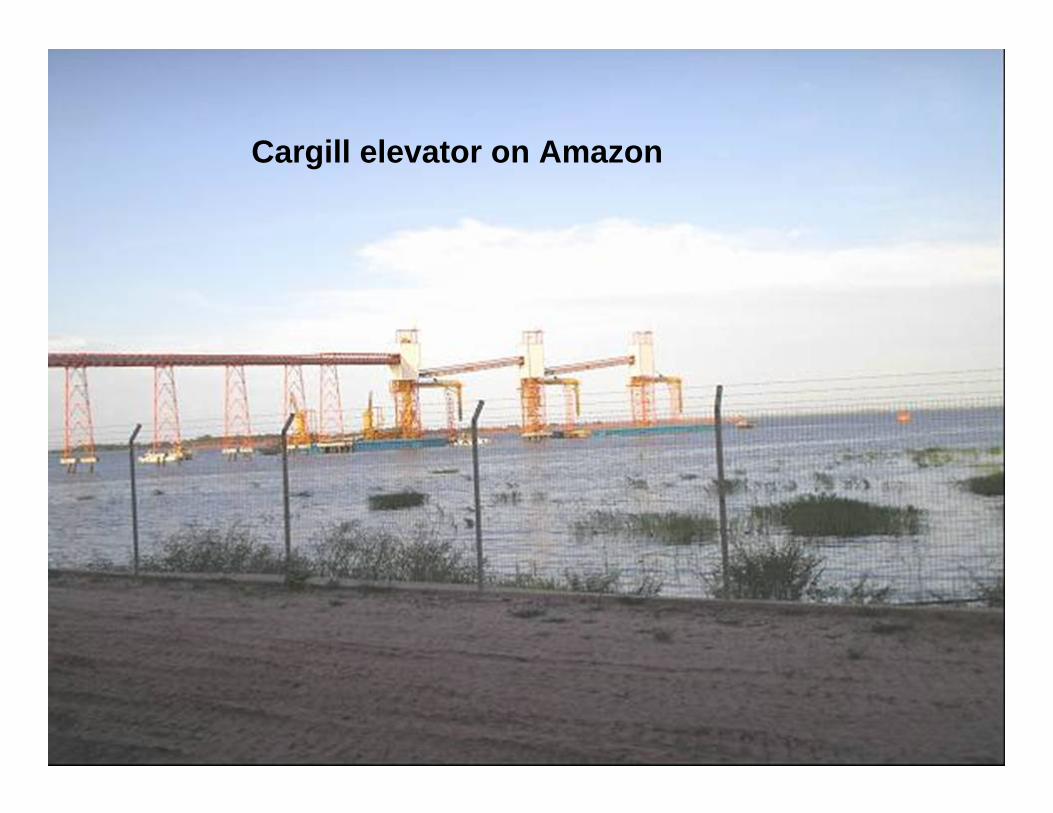
Cargill elevator on Amazon
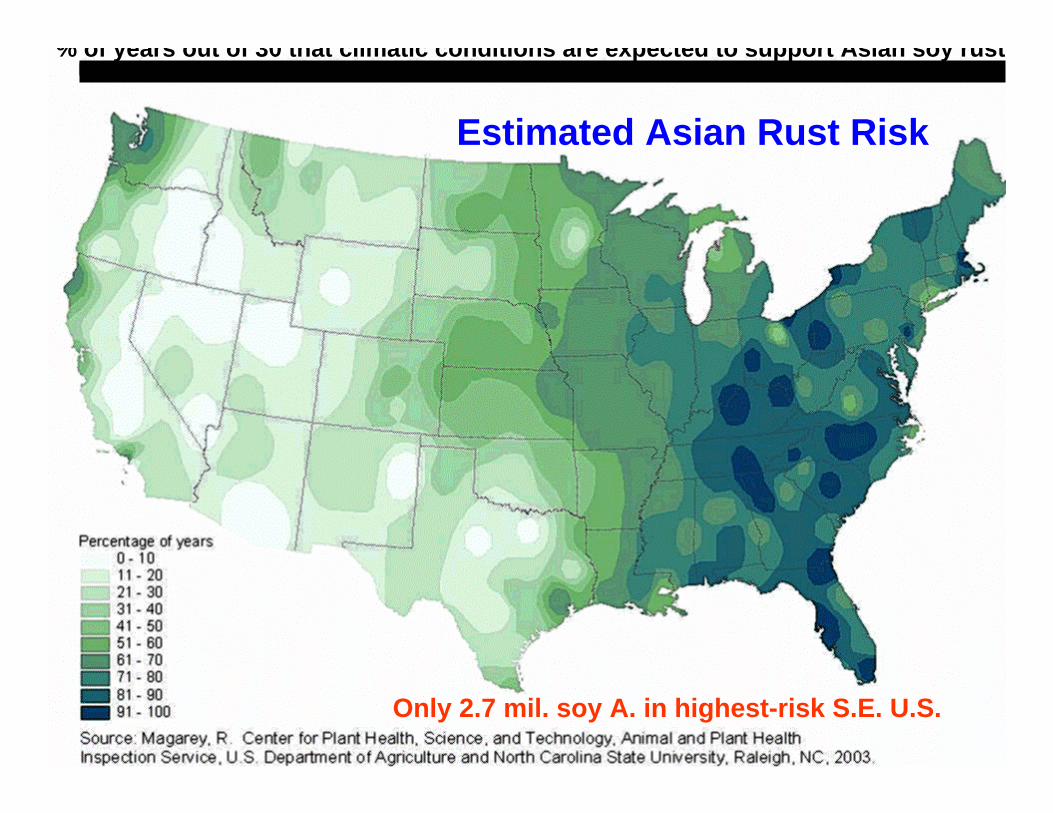
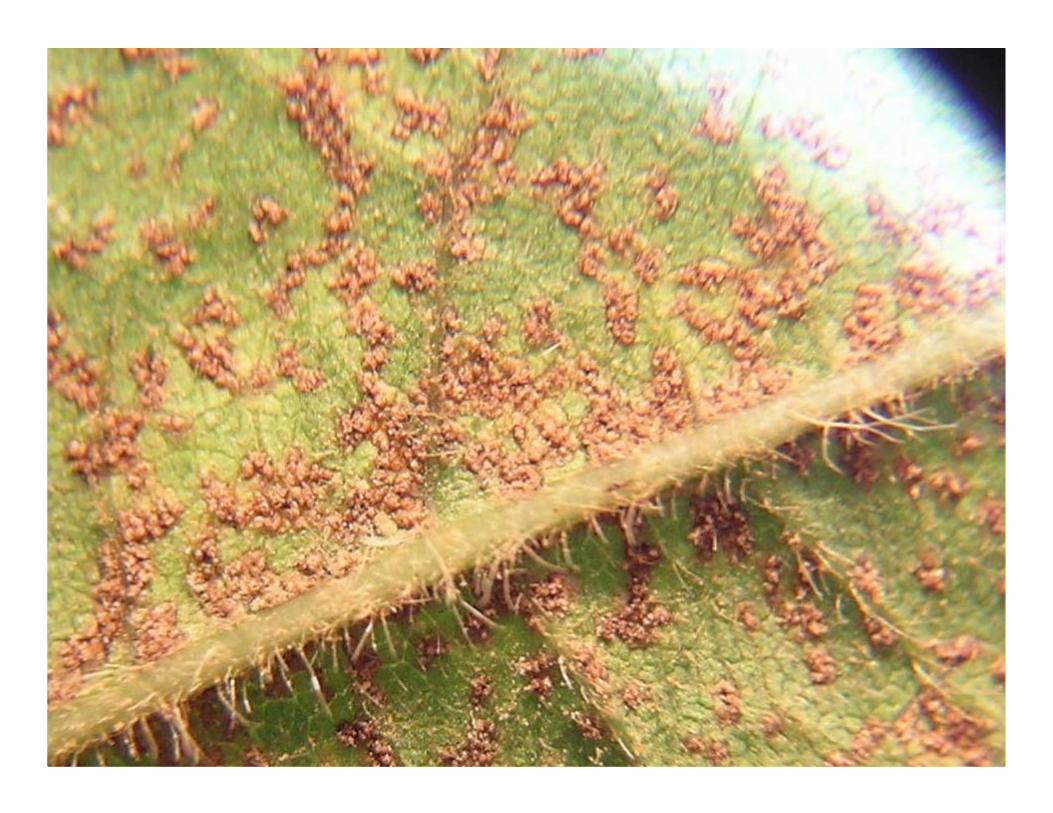
Only 2.7 mil. soy A. in highest-risk S.E. U.S.
Estimated Asian Rust Risk
% of years out of 30 that climatic conditions are expected to support Asian soy rust

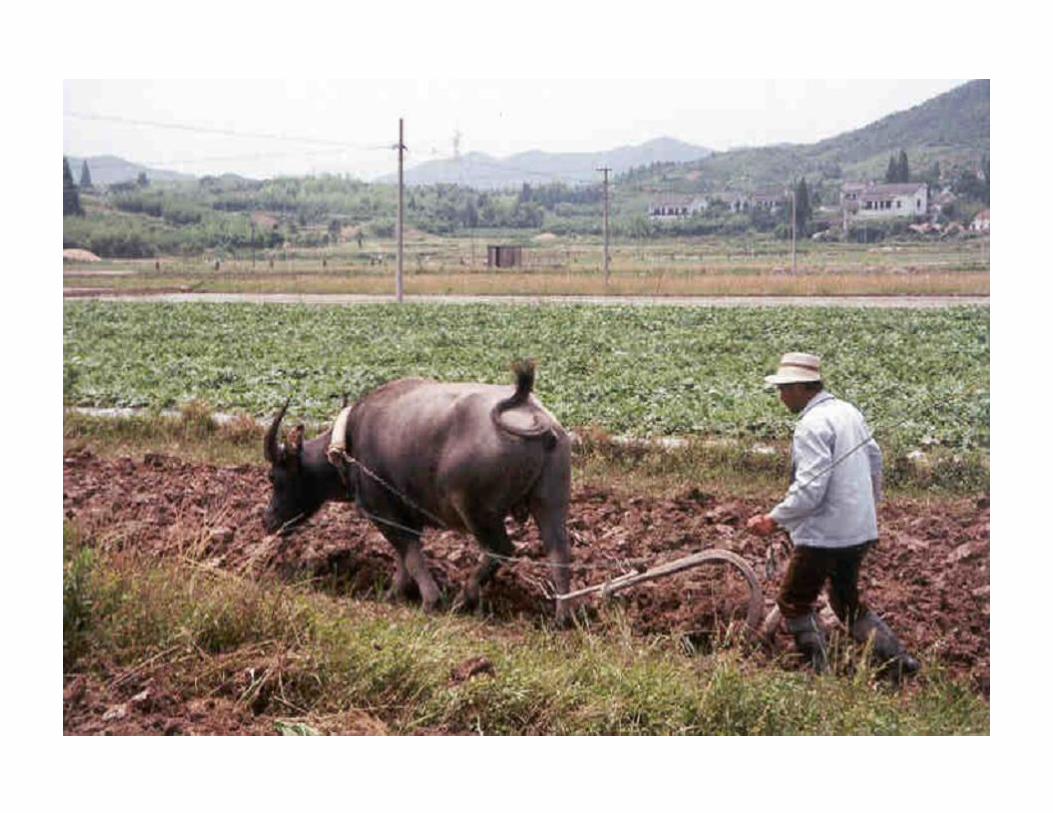
China: a wild card in the corn market

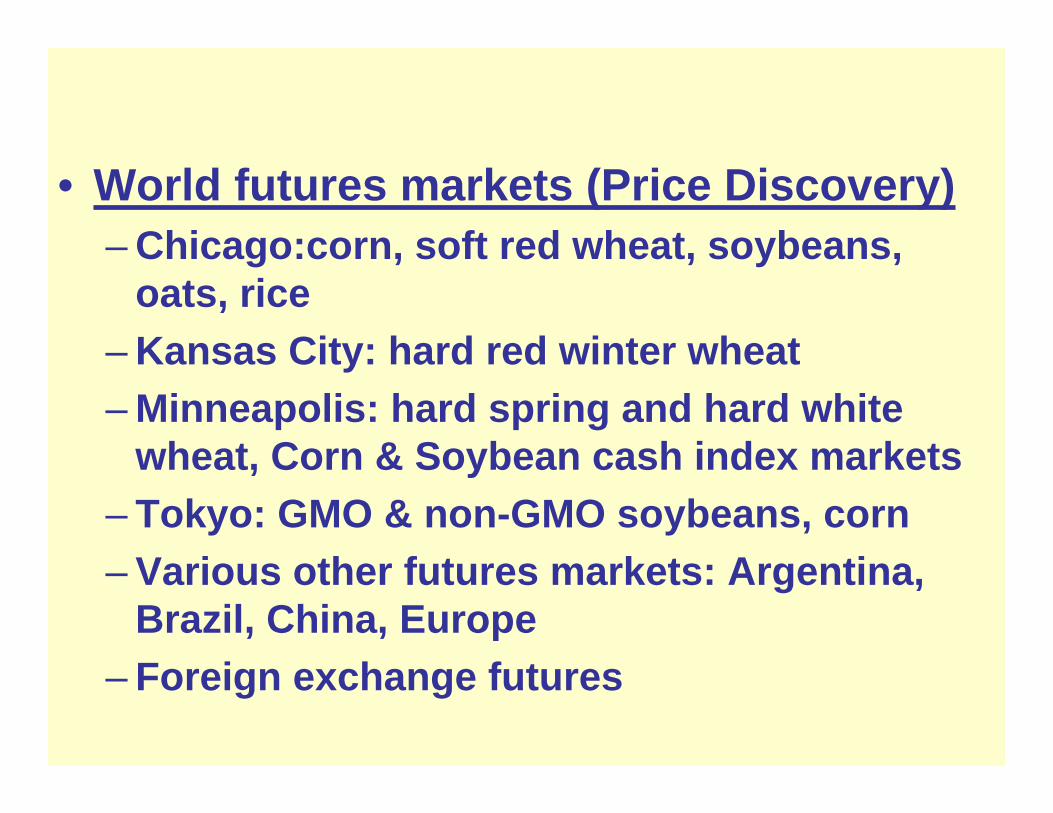
• World futures markets (Price Discovery)– Chicago:corn, soft red wheat, soybeans,
oats, rice– Kansas City: hard red winter wheat– Minneapolis: hard spring and hard white
wheat, Corn & Soybean cash index markets– Tokyo: GMO & non-GMO soybeans, corn– Various other futures markets: Argentina,
Brazil, China, Europe– Foreign exchange futures
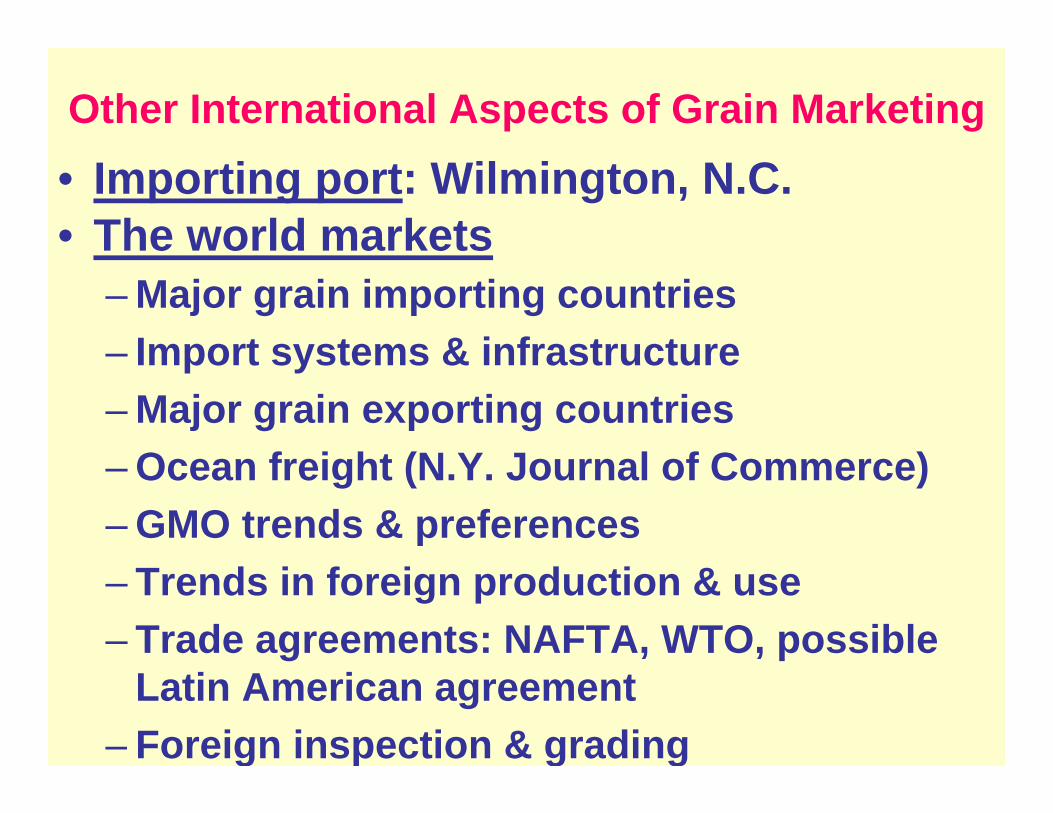
Other International Aspects of Grain Marketing• Importing port: Wilmington, N.C.• The world markets
– Major grain importing countries– Import systems & infrastructure– Major grain exporting countries– Ocean freight (N.Y. Journal of Commerce)– GMO trends & preferences– Trends in foreign production & use– Trade agreements: NAFTA, WTO, possible
Latin American agreement– Foreign inspection & grading
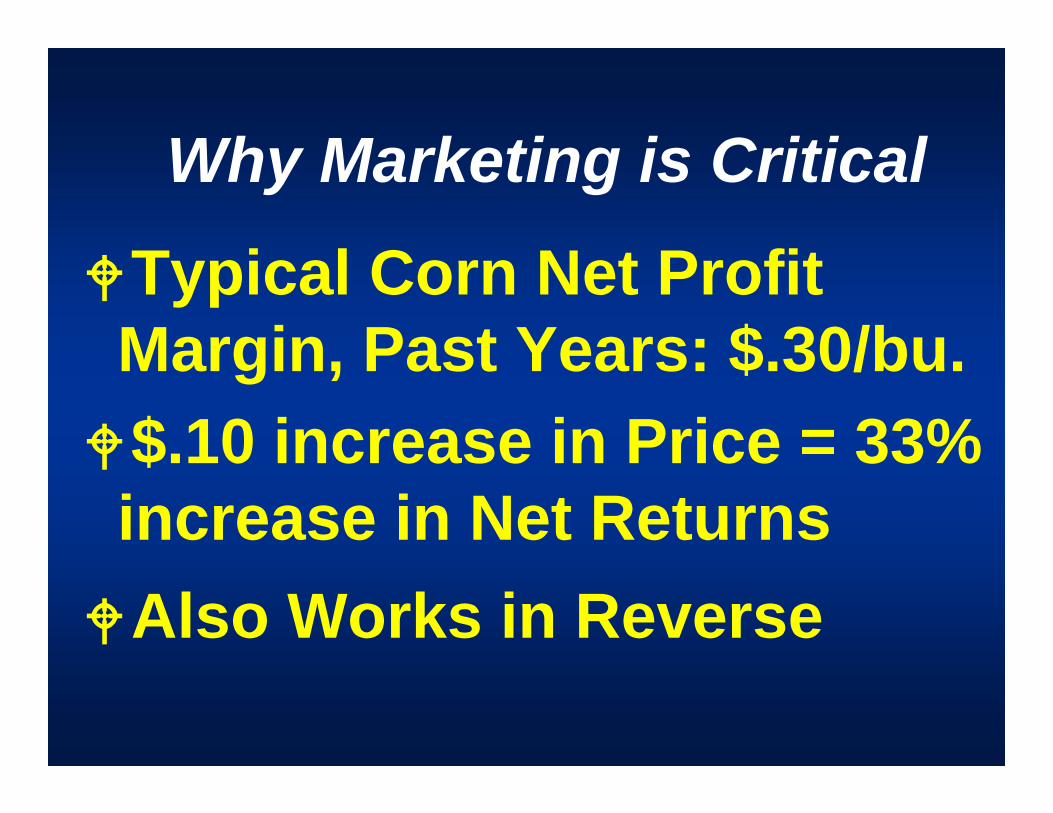
Why Marketing is Critical
Typical Corn Net ProfitMargin, Past Years: $.30/bu.$.10 increase in Price = 33%increase in Net ReturnsAlso Works in Reverse
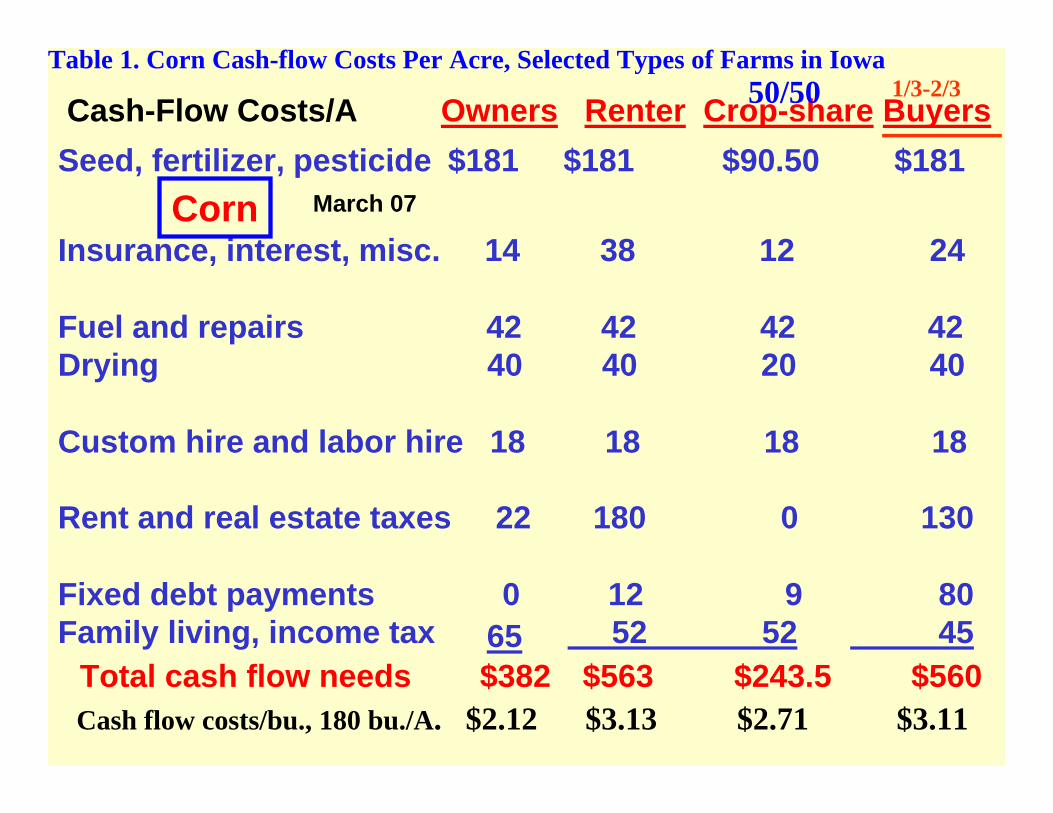
Cash-Flow Costs/A Owners Renter Crop-share BuyersSeed, fertilizer, pesticide. $181 $181 $90.50 $181
Insurance, interest, misc. 14 38 12 24
Fuel and repairs 42 42 42 42Drying 40 40 20 40
Custom hire and labor hire 18 18 18 18
Rent and real estate taxes 22 180 0 130
Fixed debt payments 0 12 9 80Family living, income tax 65 52 52 45
Cash flow costs/bu., 180 bu./A. $2.12 $3.13 $2.71 $3.11Total cash flow needs $382 $563 $243.5 $560
Table 1. Corn Cash-flow Costs Per Acre, Selected Types of Farms in Iowa1/3-2/350/50
Corn March 07
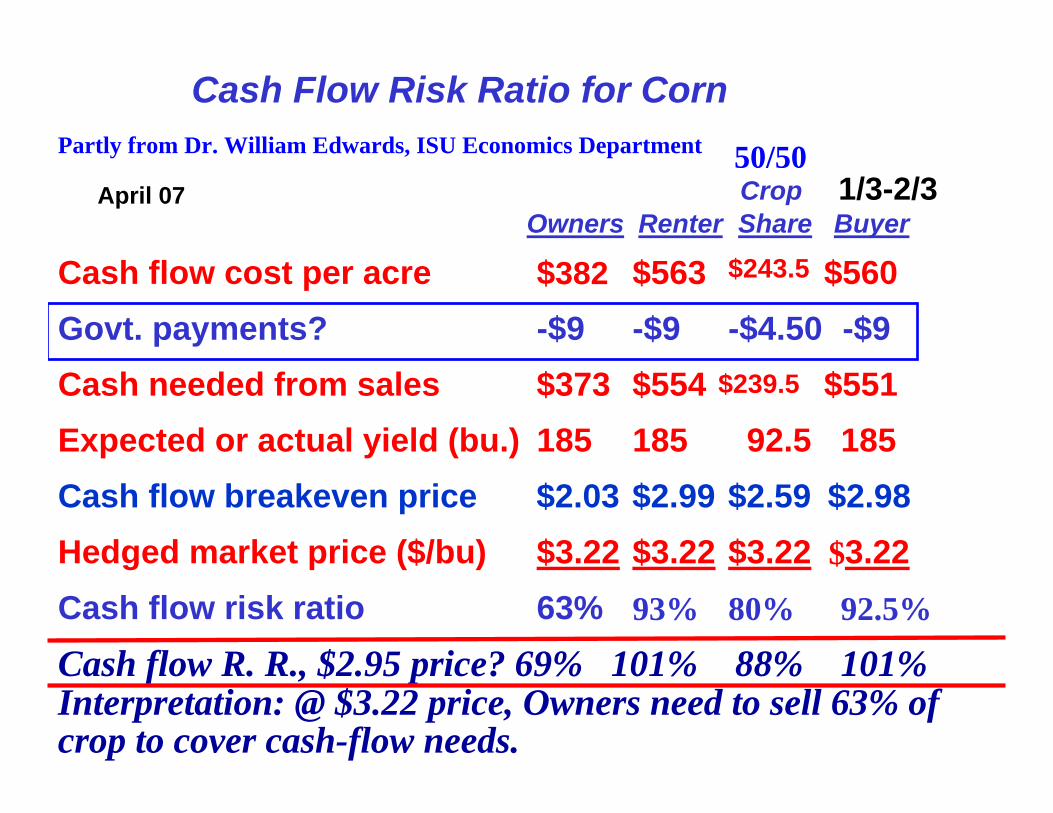
Cash Flow Risk Ratio for Corn
50/50Crop 1/3-2/3
Owners Renter Share Buyer
Cash flow cost per acre $382 $563 $243.5 $560Govt. payments? -$9 -$9 -$4.50 -$9Cash needed from sales $373 $554 $239.5 $551Expected or actual yield (bu.) 185 185 92.5 185Cash flow breakeven price $2.03 $2.99 $2.59 $2.98Hedged market price ($/bu) $3.22 $3.22 $3.22 $3.22Cash flow risk ratio 63% 93% 80% 92.5%
Cash flow R. R., $2.95 price? 69% 101% 88% 101%Interpretation: @ $3.22 price, Owners need to sell 63% ofcrop to cover cash-flow needs.
Partly from Dr. William Edwards, ISU Economics Department
April 07
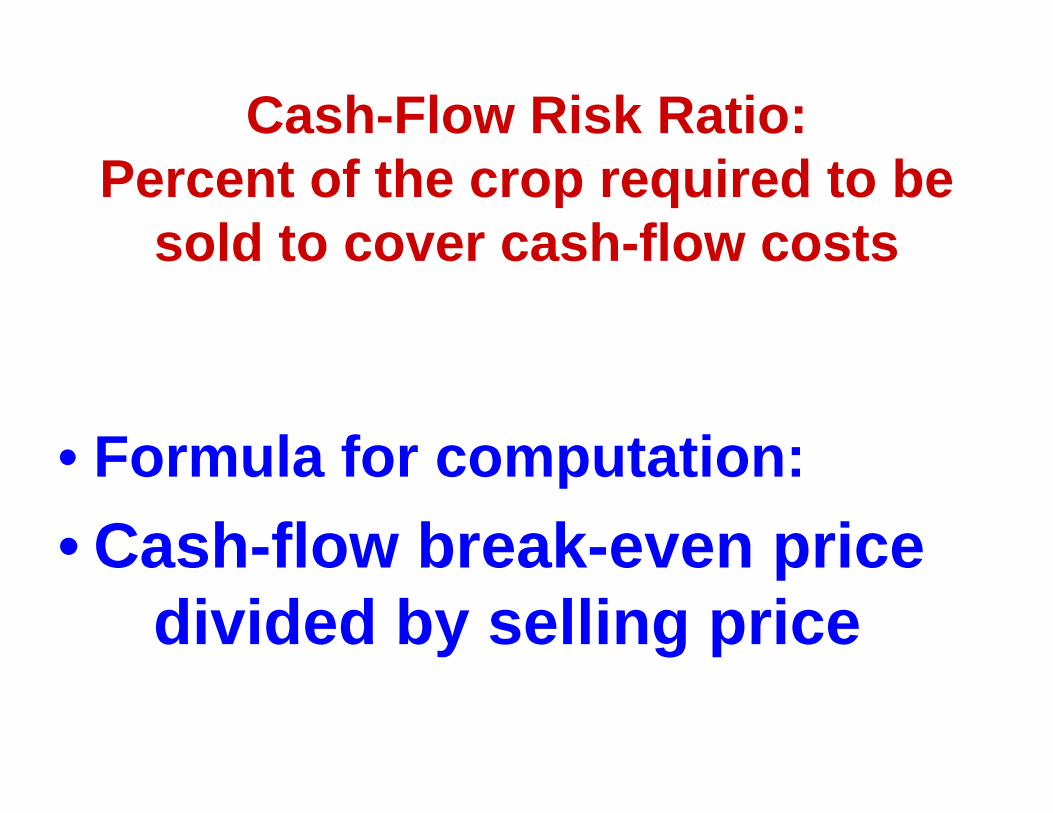
Cash-Flow Risk Ratio:Percent of the crop required to be
sold to cover cash-flow costs
• Formula for computation: • Cash-flow break-even price
divided by selling price
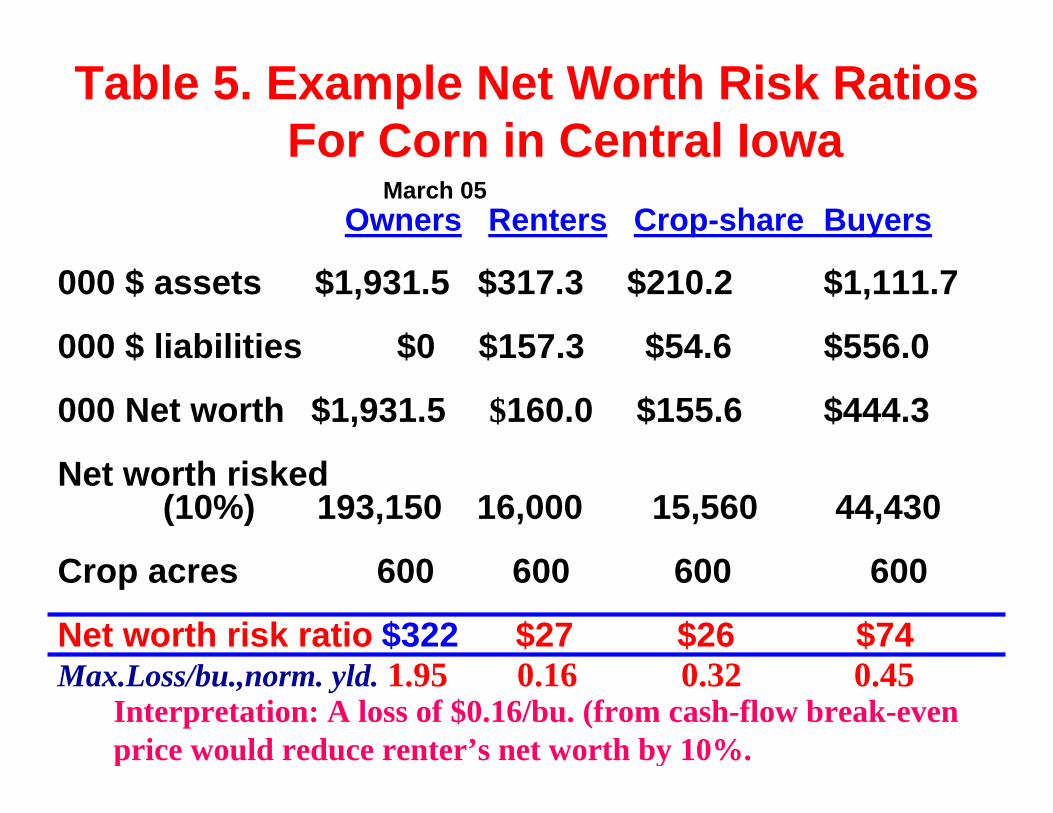
Table 5. Example Net Worth Risk Ratios For Corn in Central Iowa
March 05Owners Renters Crop-share Buyers
000 $ assets $1,931.5 $317.3 $210.2 $1,111.7
000 $ liabilities $0 $157.3 $54.6 $556.0
000 Net worth $1,931.5 $160.0 $155.6 $444.3
Net worth risked(10%) 193,150 16,000 15,560 44,430
Crop acres 600 600 600 600
Net worth risk ratio $322 $27 $26 $74Max.Loss/bu.,norm. yld. 1.95 0.16 0.32 0.45
Interpretation: A loss of $0.16/bu. (from cash-flow break-evenprice would reduce renter’s net worth by 10%.
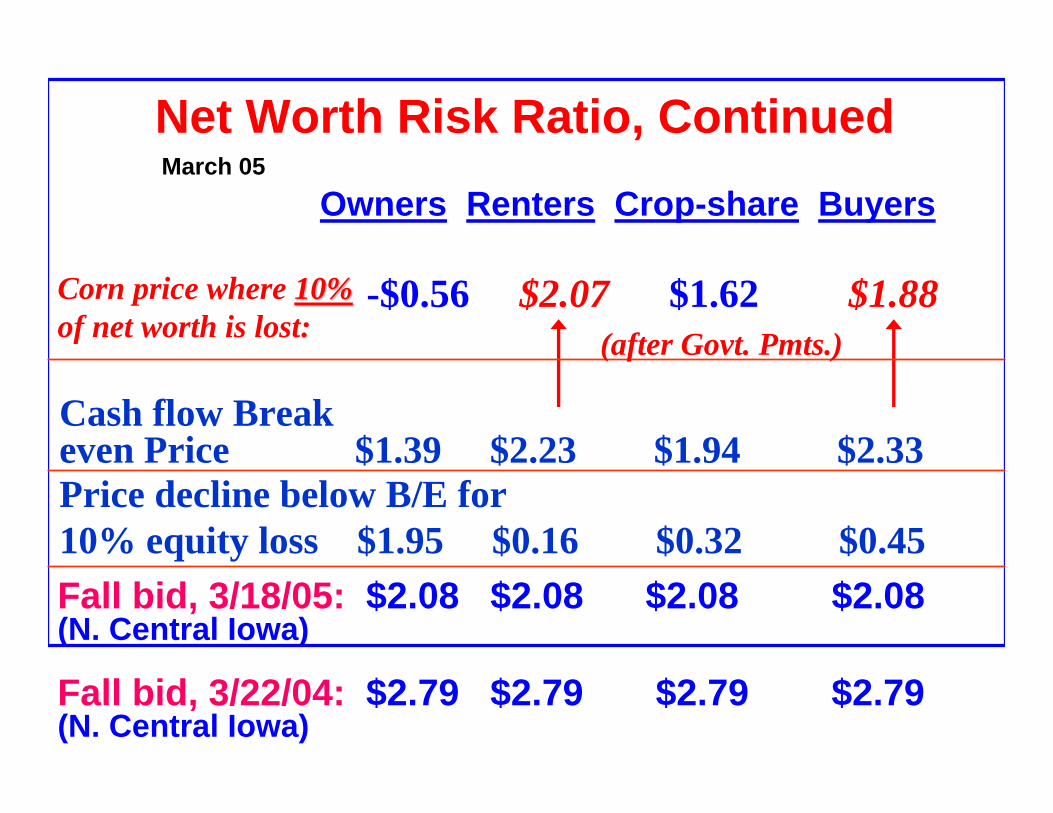
Net Worth Risk Ratio, ContinuedMarch 05
Owners Renters Crop-share Buyers
-$0.56 $2.07 $1.62 $1.88
Cash flow Breakeven Price $1.39 $2.23 $1.94 $2.33Price decline below B/E for10% equity loss $1.95 $0.16 $0.32 $0.45
Corn price where 10%10%of net worth is lost:
Fall bid, 3/18/05: $2.08 $2.08 $2.08 $2.08(N. Central Iowa)
Fall bid, 3/22/04: $2.79 $2.79 $2.79 $2.79(N. Central Iowa)
(after Govt. Pmts.)
Net-Worth Risk Ratio
• The maximum dollars per acre which can be lost in any one year before a predetermined percentage of the equity is lost.
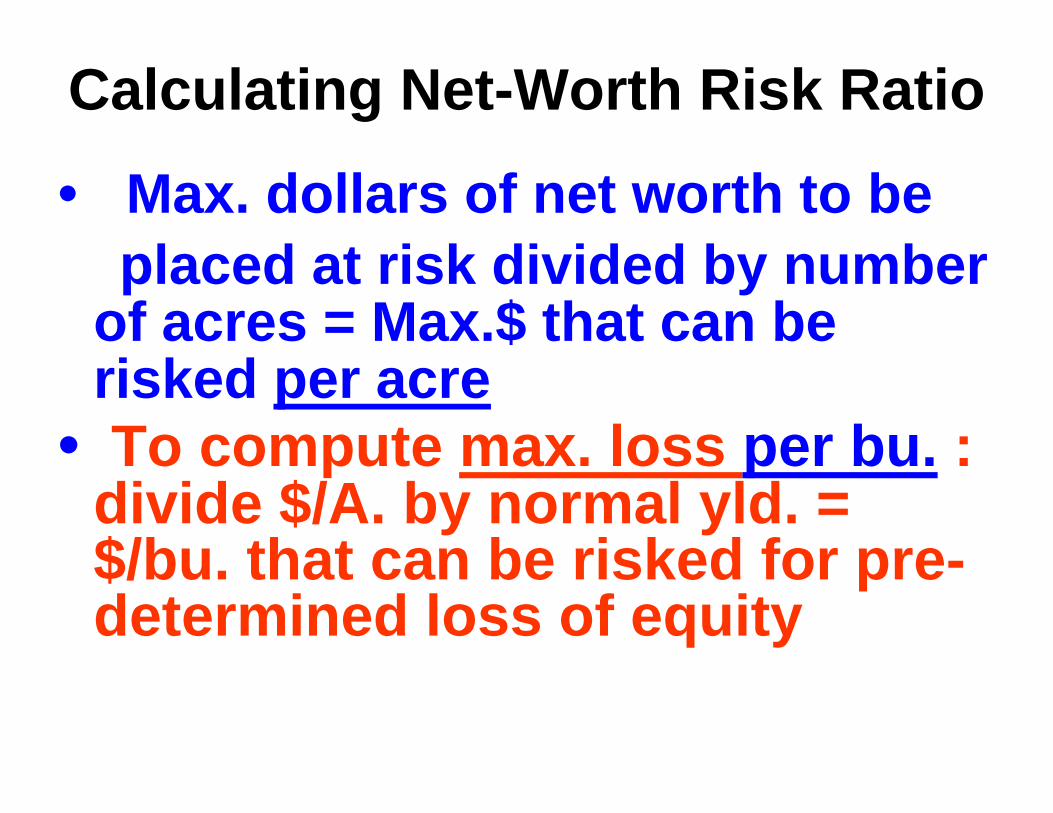
Calculating Net-Worth Risk Ratio
• Max. dollars of net worth to beplaced at risk divided by number
of acres = Max.$ that can be risked per acre
• To compute max. loss per bu. : divide $/A. by normal yld. = $/bu. that can be risked for pre-determined loss of equity
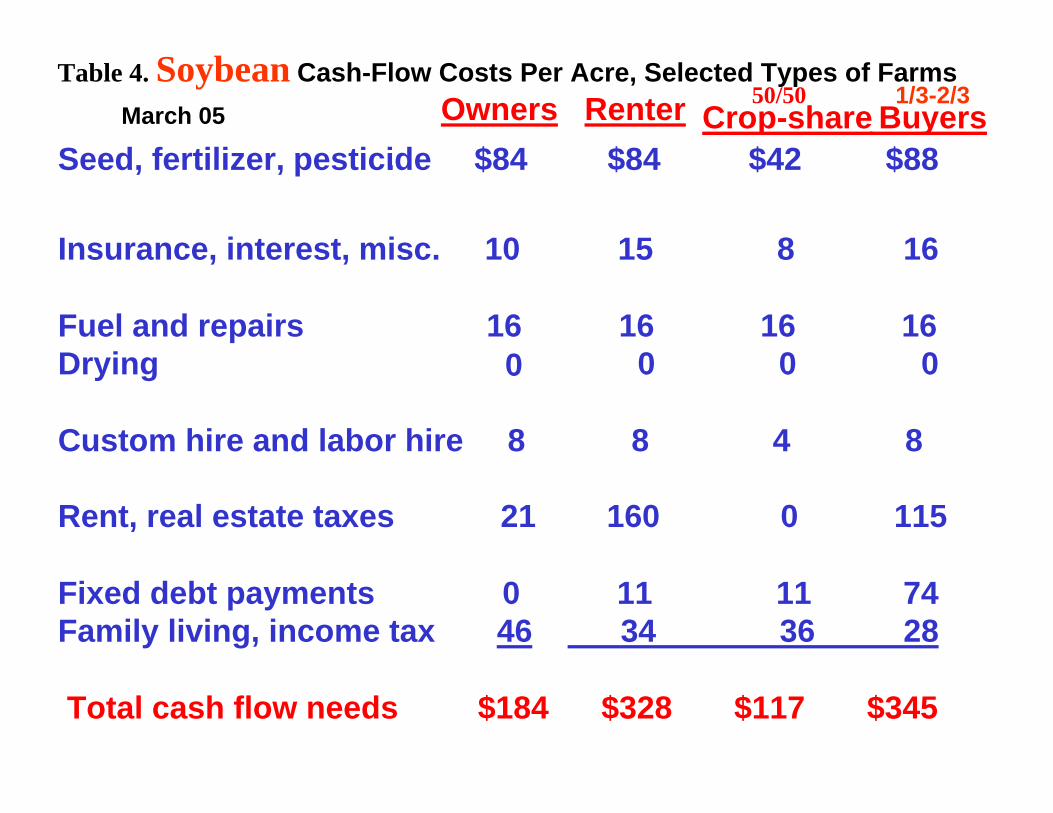
Owners Renter Crop-share BuyersSeed, fertilizer, pesticide. $84 $84 $42 $88
Insurance, interest, misc. 10 15 8 16
Fuel and repairs 16 16 16 16Drying 0 0 0 0
Custom hire and labor hire 8 8 4 8
Rent, real estate taxes 21 160 0 115
Fixed debt payments 0 11 11 74Family living, income tax 46 34 36 28
Total cash flow needs $184 $328 $117 $345
1/3-2/350/50Table 4. Soybean Cash-Flow Costs Per Acre, Selected Types of Farms
March 05
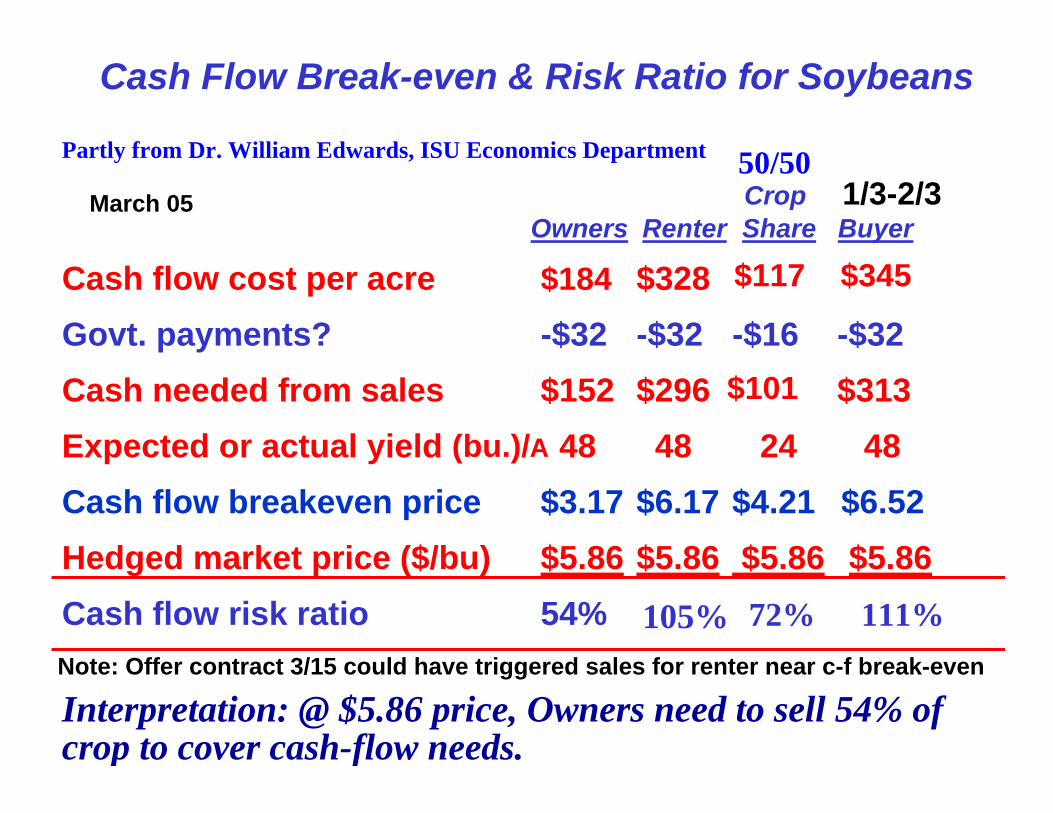
Cash Flow Break-even & Risk Ratio for Soybeans
50/50Crop 1/3-2/3
Owners Renter Share Buyer
Cash flow cost per acre $184 $328 $117 $345
Govt. payments? -$32 -$32 -$16 -$32Cash needed from sales $152 $296 $101 $313Expected or actual yield (bu.)/A 48 48 24 48Cash flow breakeven price $3.17 $6.17 $4.21 $6.52Hedged market price ($/bu) $5.86 $5.86 $5.86 $5.86Cash flow risk ratio 54% 105% 72% 111%
Interpretation: @ $5.86 price, Owners need to sell 54% ofcrop to cover cash-flow needs.
Partly from Dr. William Edwards, ISU Economics Department
March 05
Note: Offer contract 3/15 could have triggered sales for renter near c-f break-even

Mktg. Plan• Starting point in a mktg plan: financial
needs of the business• Know your break-even price• Know your risk-bearing ability• Plan marketing with a goal of at least
covering cash-flow needs• Look for mktg. & insurance tools to
minimize risk of losing the business•• Role of Offer ContractsRole of Offer Contracts•• TimingTiming
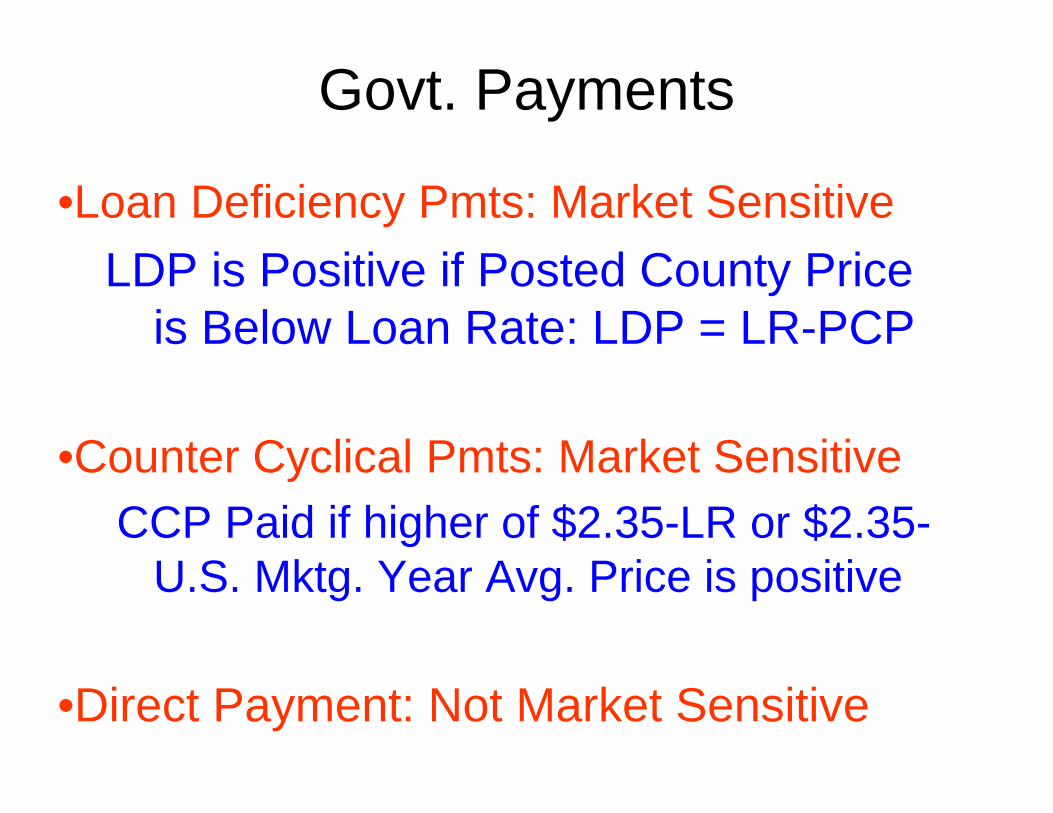
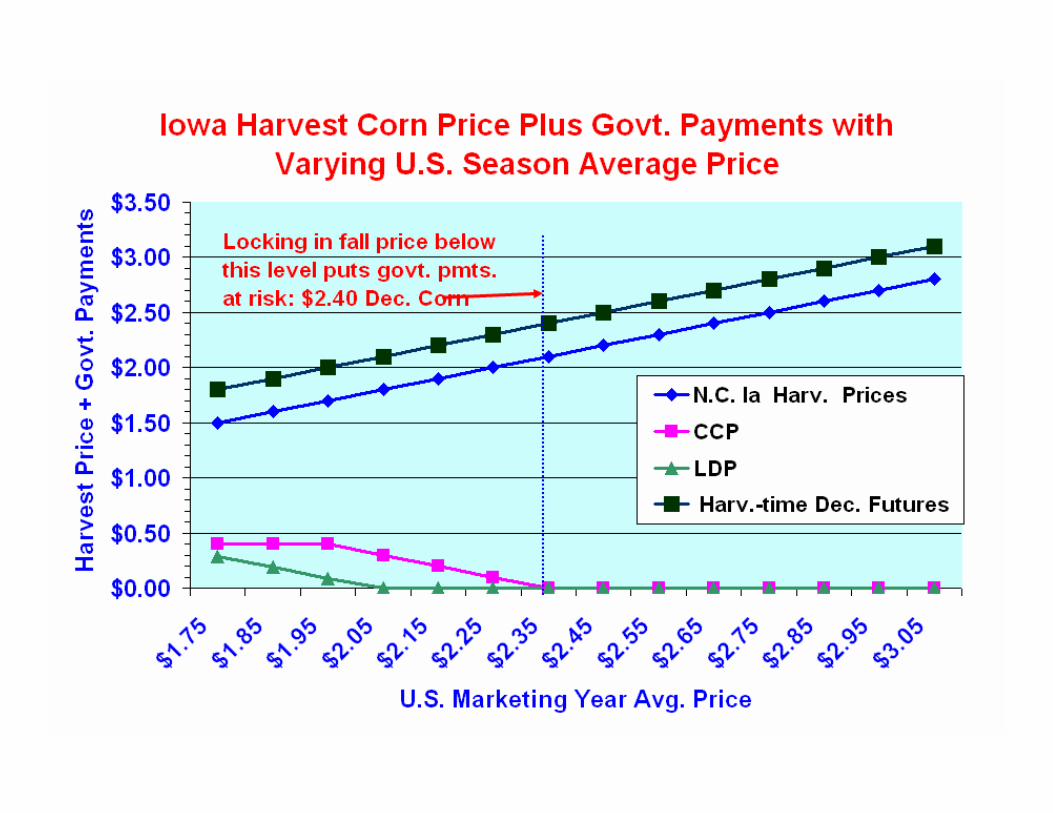
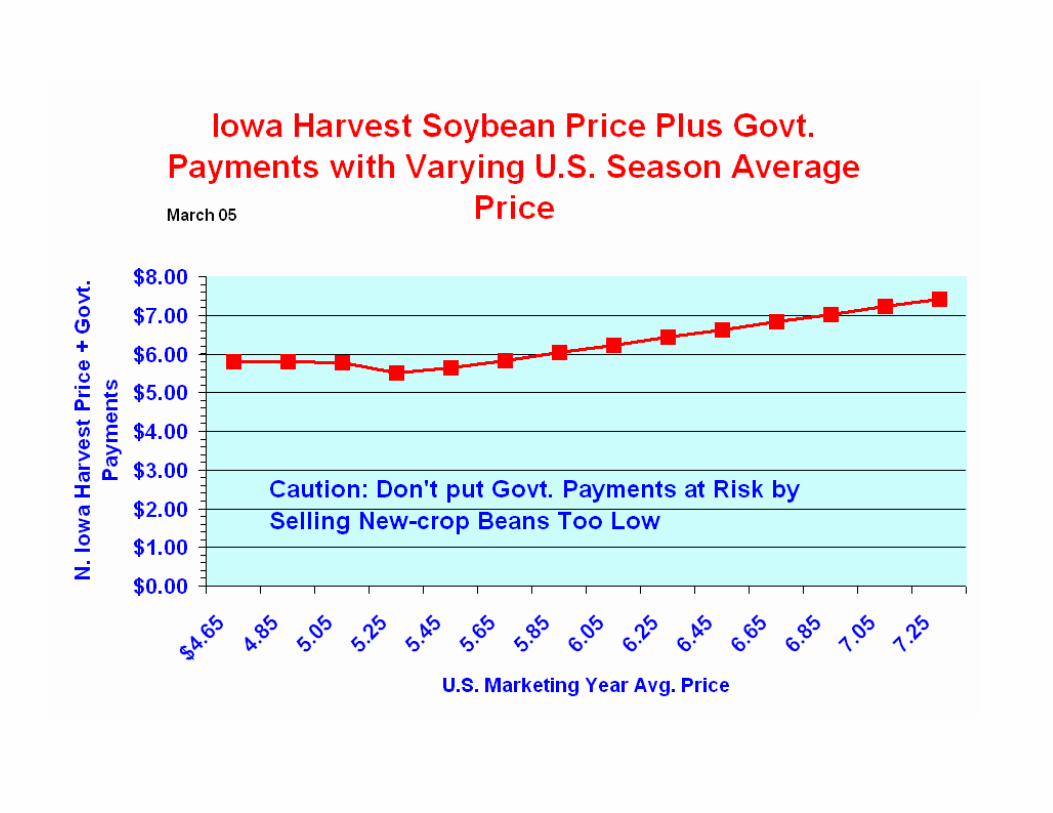
Govt. Payments
•Loan Deficiency Pmts: Market SensitiveLDP is Positive if Posted County Price
is Below Loan Rate: LDP = LR-PCP
•Counter Cyclical Pmts: Market SensitiveCCP Paid if higher of $2.35-LR or $2.35-
U.S. Mktg. Year Avg. Price is positive
•Direct Payment: Not Market Sensitive

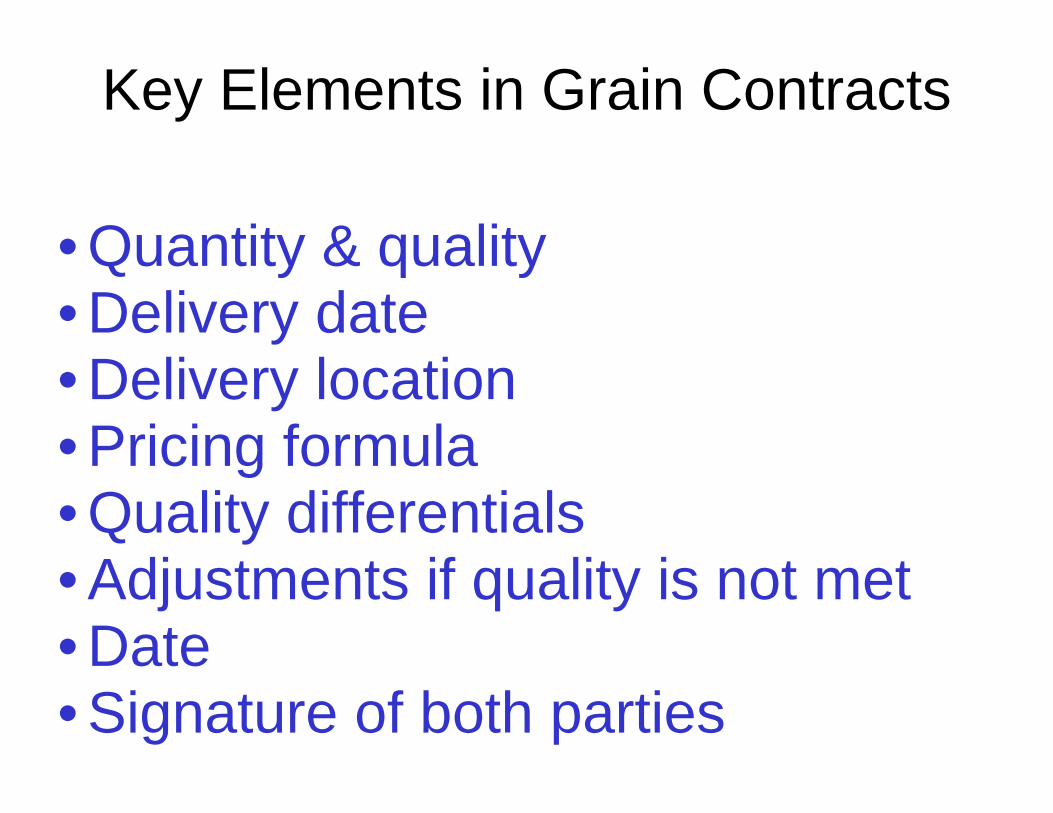
Key Elements in Grain Contracts
• Quantity & quality• Delivery date• Delivery location• Pricing formula• Quality differentials• Adjustments if quality is not met• Date • Signature of both parties
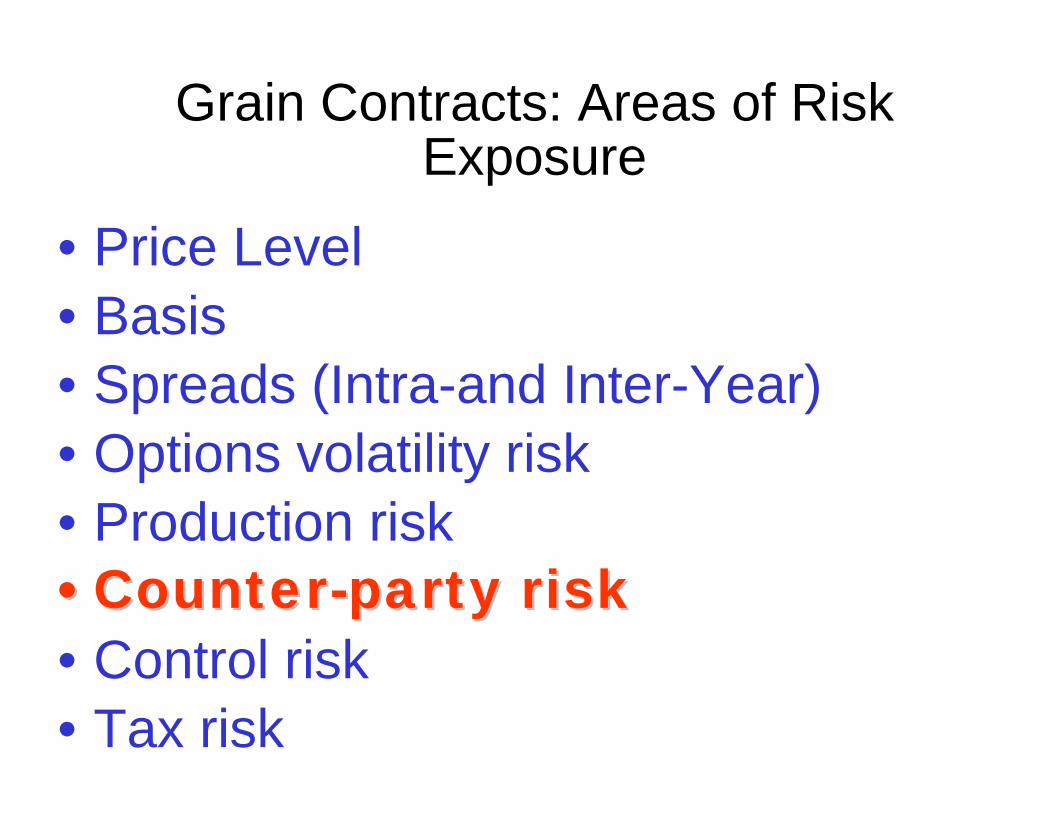
Grain Contracts: Areas of Risk Exposure
• Price Level• Basis• Spreads (Intra-and Inter-Year)• Options volatility risk• Production risk•• CounterCounter--party riskparty risk• Control risk• Tax risk
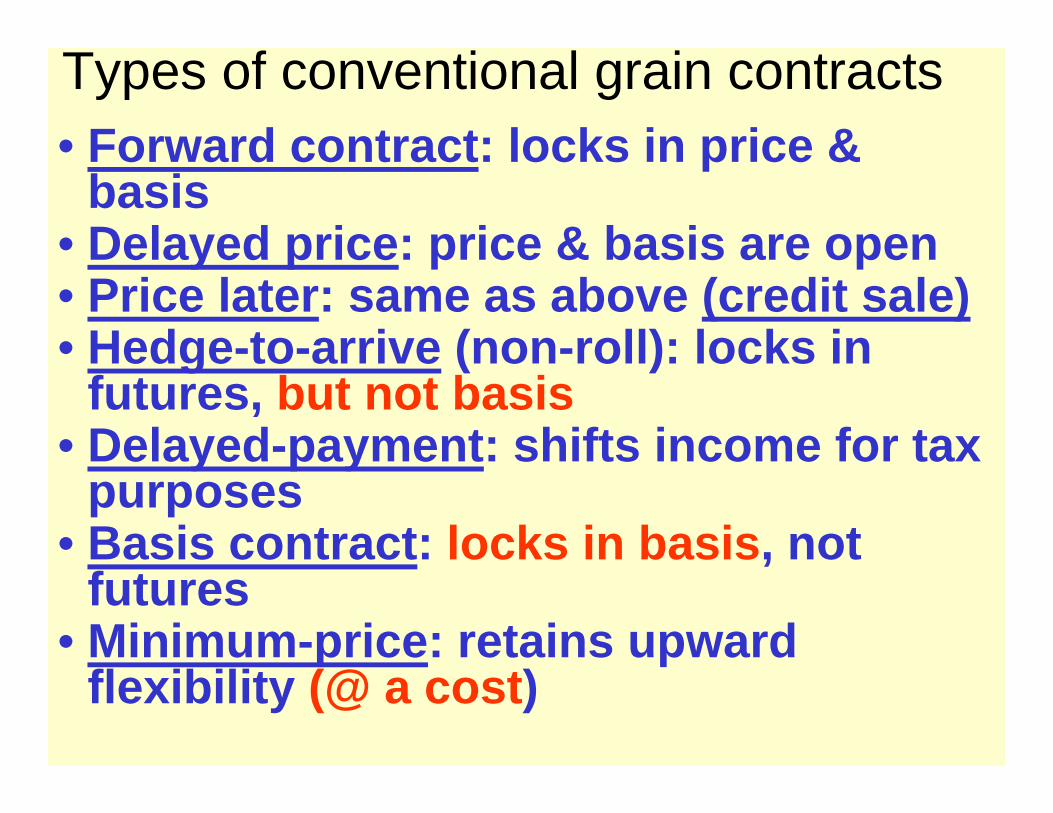
Types of conventional grain contracts• Forward contract: locks in price &
basis• Delayed price: price & basis are open• Price later: same as above (credit sale)• Hedge-to-arrive (non-roll): locks in
futures, but not basis• Delayed-payment: shifts income for tax
purposes• Basis contract: locks in basis, not
futures• Minimum-price: retains upward
flexibility (@ a cost)
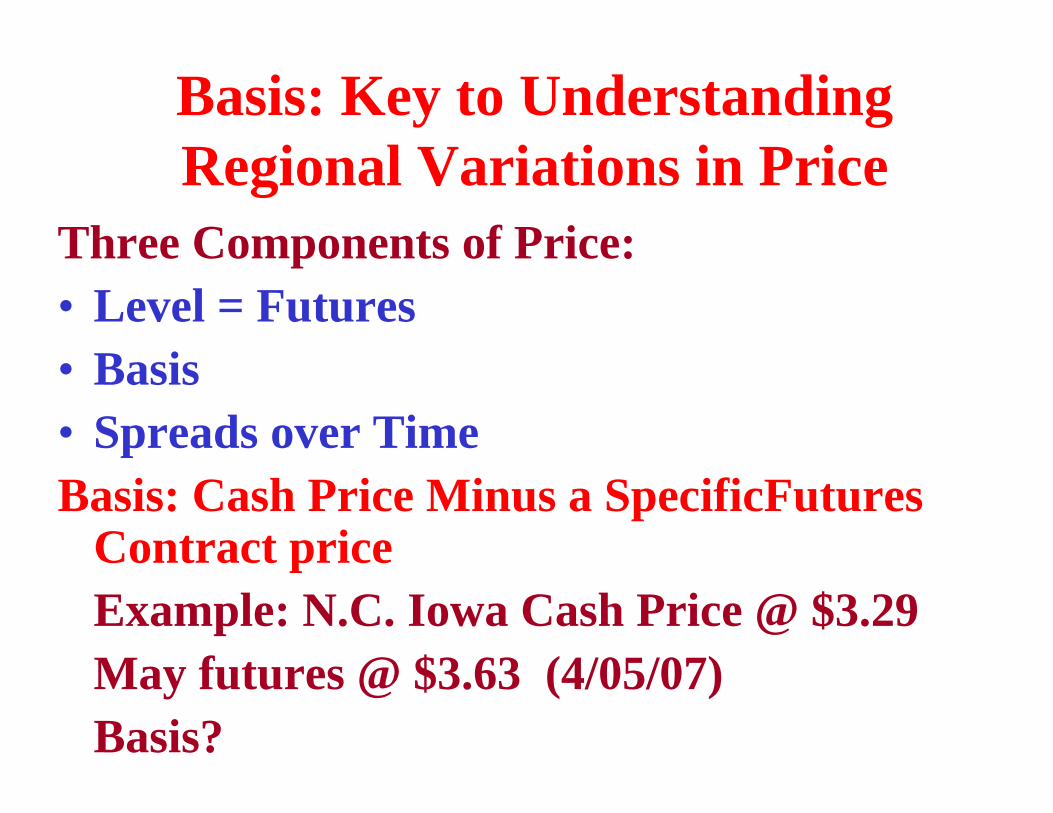
Basis: Key to Understanding Regional Variations in Price
Three Components of Price:• Level = Futures• Basis • Spreads over TimeBasis: Cash Price Minus a SpecificFutures
Contract priceExample: N.C. Iowa Cash Price @ $3.29May futures @ $3.63 (4/05/07)Basis?
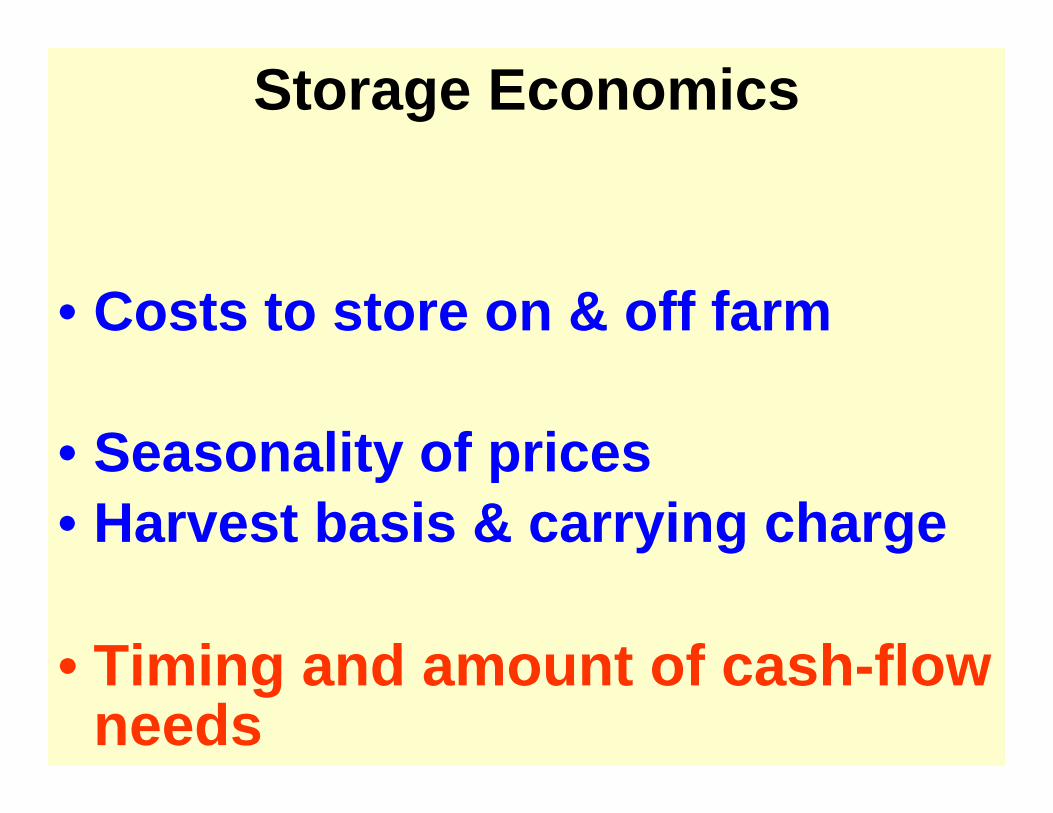
Storage Economics
• Costs to store on & off farm
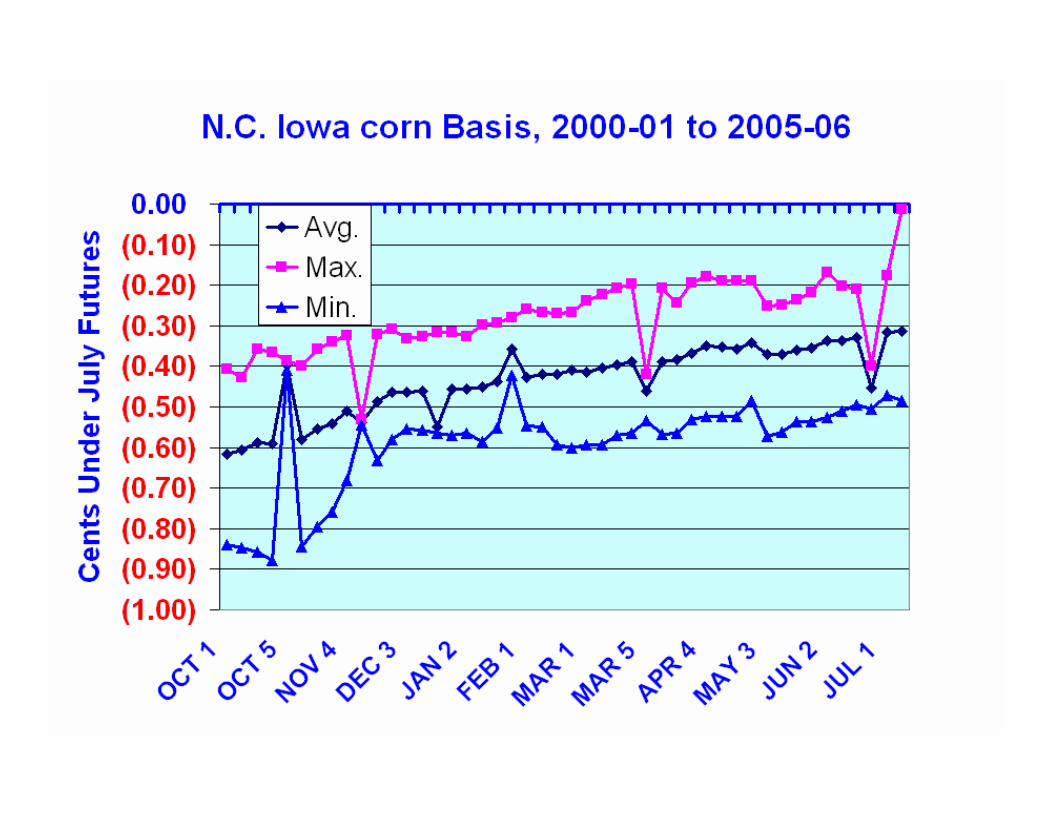
• Seasonality of prices• Harvest basis & carrying charge
• Timing and amount of cash-flow needs

Before Before BiofuelsBiofuels BoomBoom

Before Before BiofuelsBiofuels BoomBoom
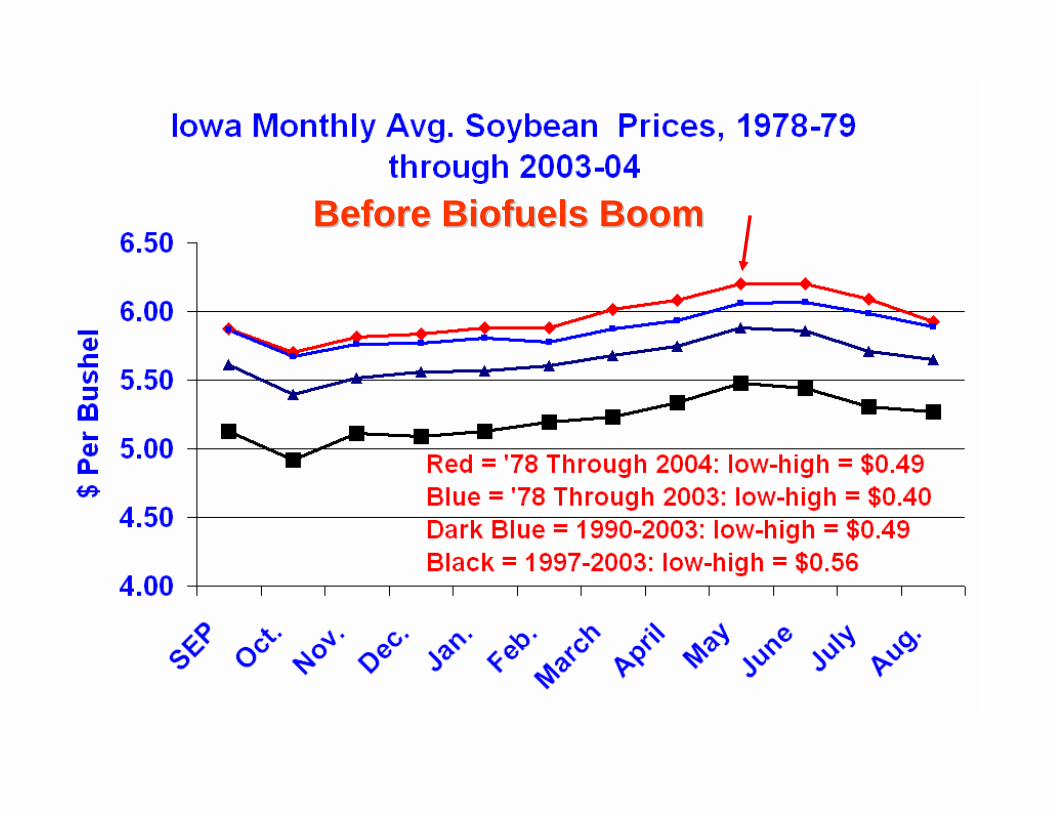
Before Before BiofuelsBiofuels BoomBoom
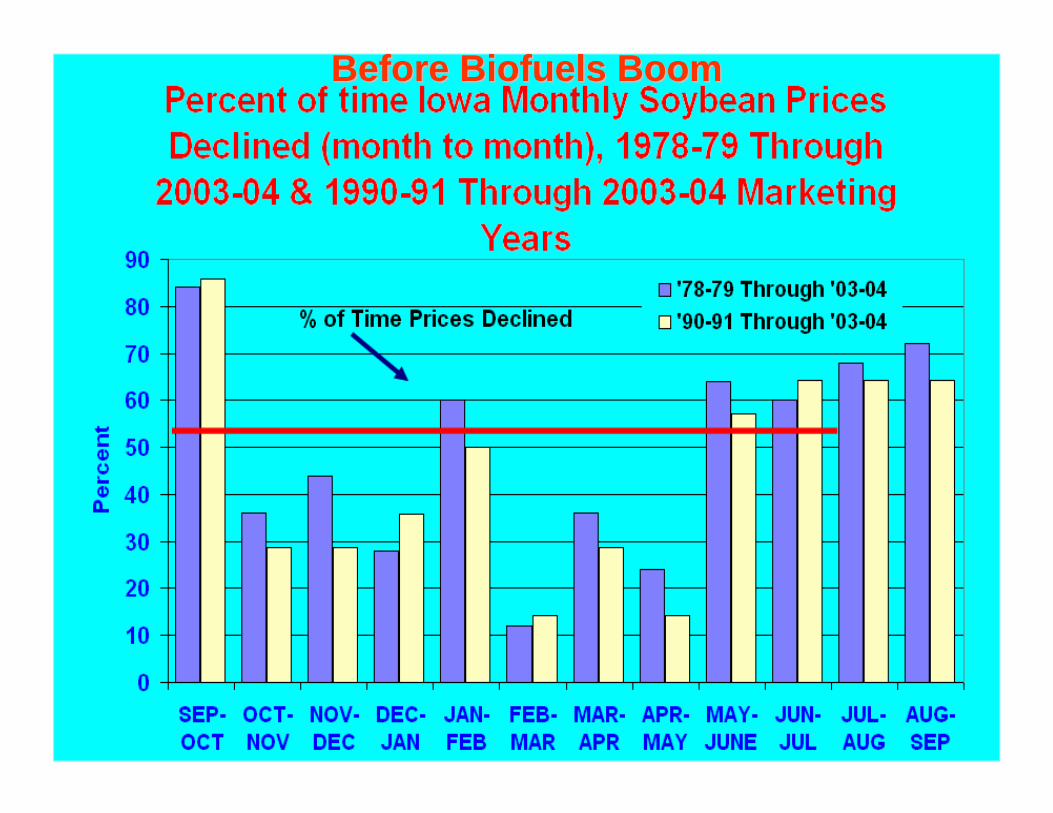
Before Before BiofuelsBiofuels BoomBoom
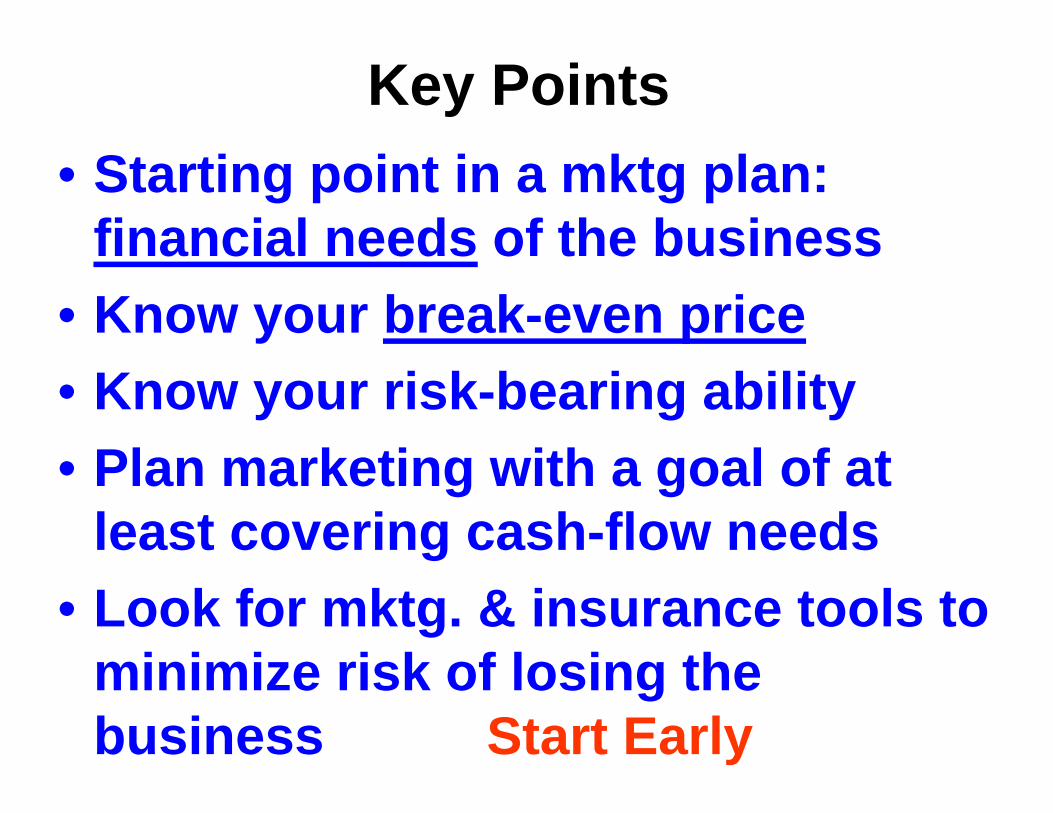
Key Points• Starting point in a mktg plan:
financial needs of the business• Know your break-even price• Know your risk-bearing ability• Plan marketing with a goal of at
least covering cash-flow needs• Look for mktg. & insurance tools to
minimize risk of losing the business Start Early
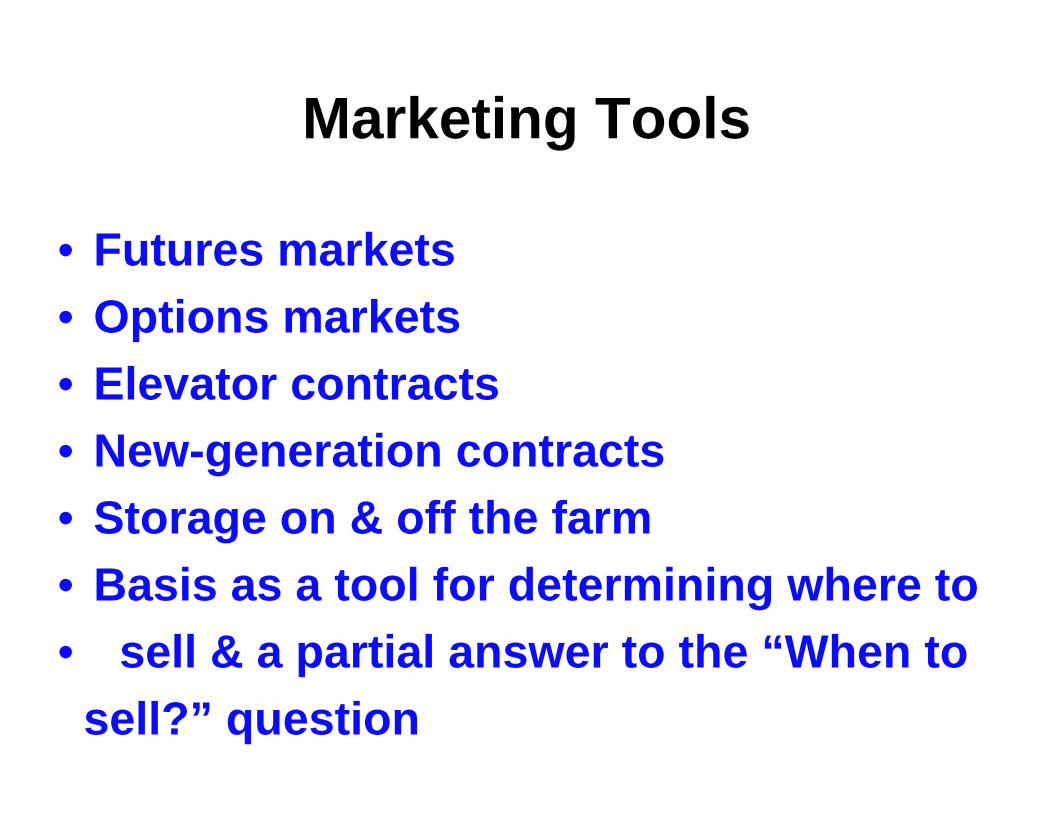
Marketing Tools
• Futures markets• Options markets• Elevator contracts• New-generation contracts• Storage on & off the farm• Basis as a tool for determining where to • sell & a partial answer to the “When to
sell?” question
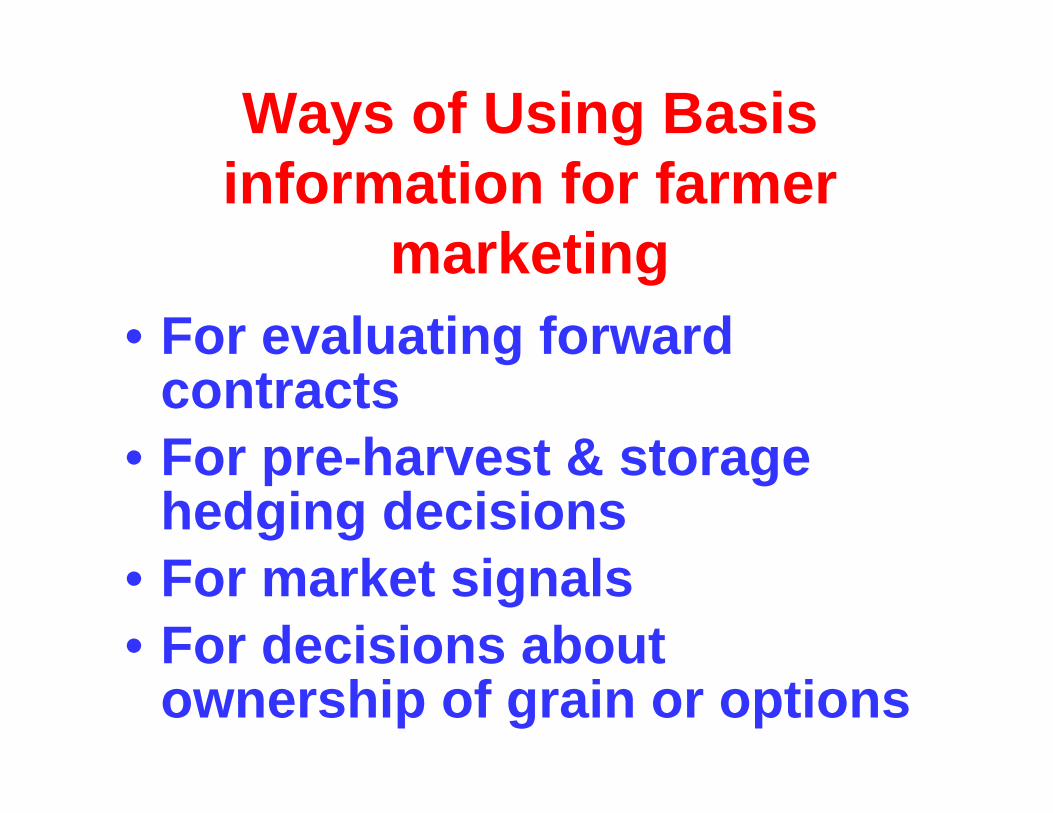
Ways of Using Basis information for farmer
marketing• For evaluating forward
contracts• For pre-harvest & storage
hedging decisions• For market signals• For decisions about
ownership of grain or options
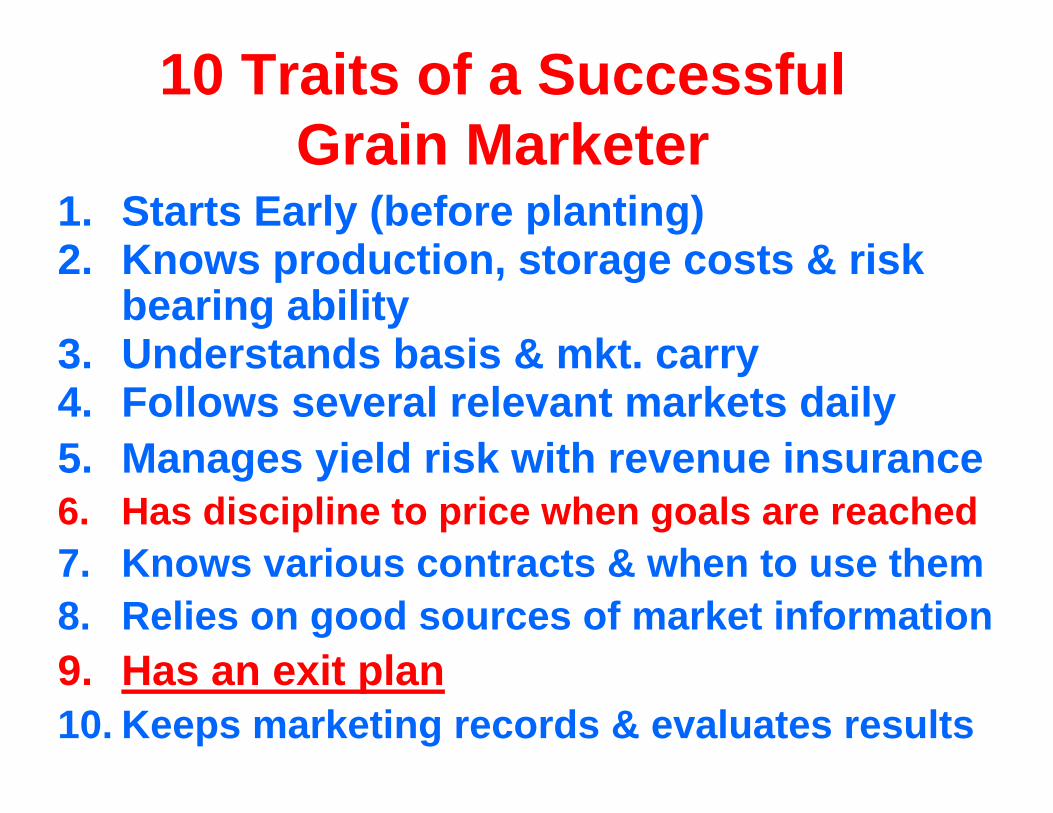
10 Traits of a Successful Grain Marketer
1. Starts Early (before planting)2. Knows production, storage costs & risk
bearing ability3. Understands basis & mkt. carry4. Follows several relevant markets daily5. Manages yield risk with revenue insurance6. Has discipline to price when goals are reached7. Knows various contracts & when to use them8. Relies on good sources of market information9. Has an exit plan10. Keeps marketing records & evaluates results
Assignment I
• Update Cash-flow break-even prices for corn & soybeans using Duffy & Smith “Costs of Crop Production, 2008”
http://www.farmdoc.uiuc.edu/agmas/reports/03_06/text.html
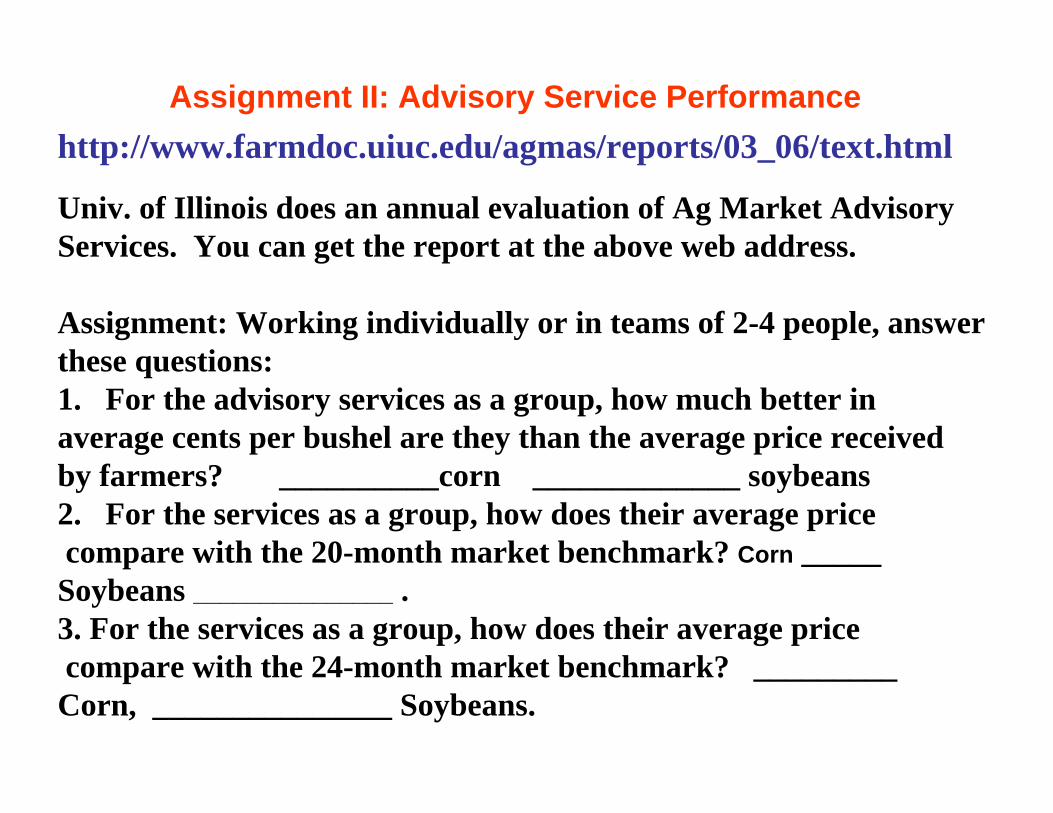
Univ. of Illinois does an annual evaluation of Ag Market Advisory Services. You can get the report at the above web address.
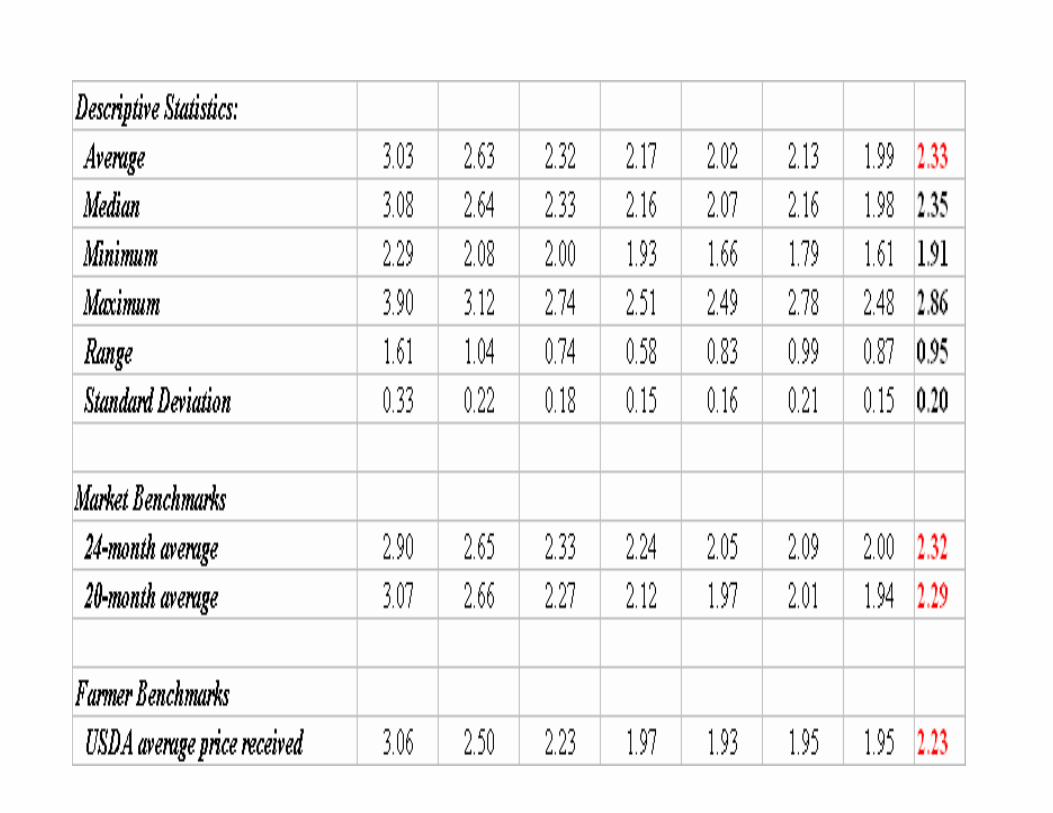
Assignment: Working individually or in teams of 2-4 people, answer these questions:1. For the advisory services as a group, how much better in average cents per bushel are they than the average price receivedby farmers? __________corn _____________ soybeans2. For the services as a group, how does their average price compare with the 20-month market benchmark? Corn _____Soybeans _______________ .3. For the services as a group, how does their average price compare with the 24-month market benchmark? _________ Corn, _______________ Soybeans.
Assignment II: Advisory Service Performance
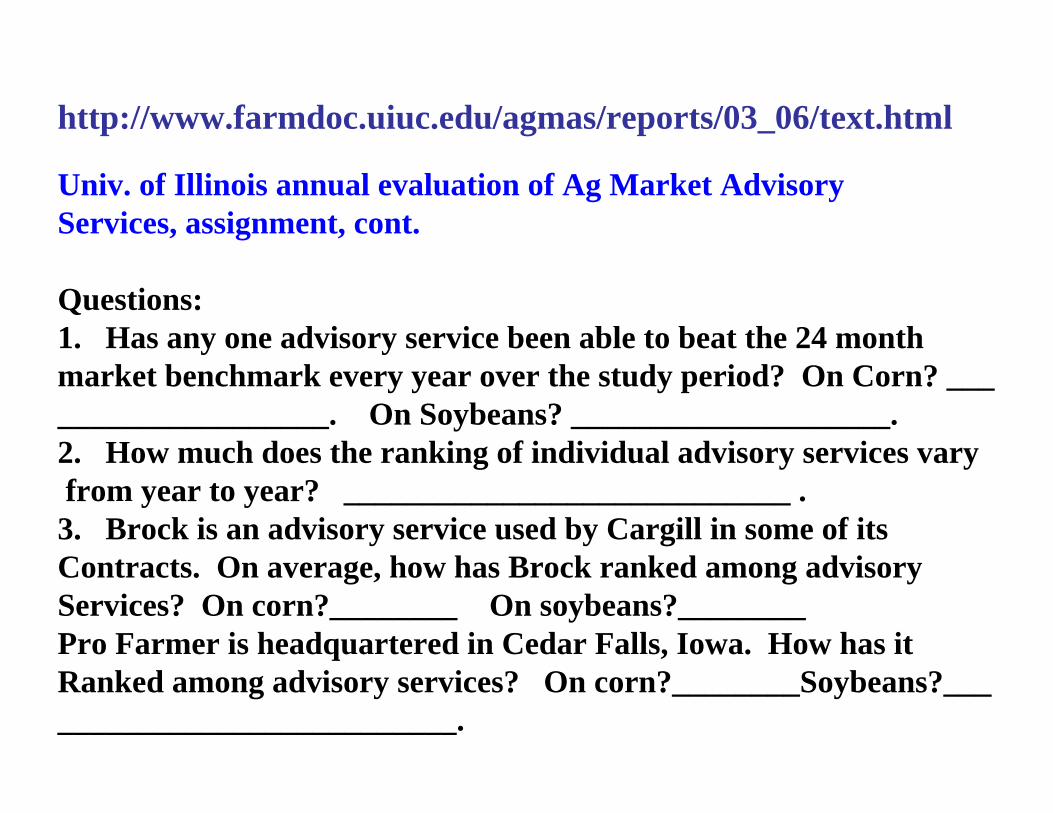
http://www.farmdoc.uiuc.edu/agmas/reports/03_06/text.html
Univ. of Illinois annual evaluation of Ag Market Advisory Services, assignment, cont.
Questions:1. Has any one advisory service been able to beat the 24 month market benchmark every year over the study period? On Corn? ____________________. On Soybeans? ____________________.2. How much does the ranking of individual advisory services varyfrom year to year? ____________________________ .3. Brock is an advisory service used by Cargill in some of its Contracts. On average, how has Brock ranked among advisoryServices? On corn?________ On soybeans?________Pro Farmer is headquartered in Cedar Falls, Iowa. How has it Ranked among advisory services? On corn?________Soybeans?____________________________.