chief executive scanning, environmental characteristics...
TRANSCRIPT
Chief Executive Scanning, Environmental Characteristics, and Company Performance: AnEmpirical StudyAuthor(s): Richard L. Daft, Juhani Sormunen, Don ParksSource: Strategic Management Journal, Vol. 9, No. 2 (Mar. - Apr., 1988), pp. 123-139Published by: John Wiley & SonsStable URL: http://www.jstor.org/stable/2486028 .Accessed: 21/02/2011 18:16
Your use of the JSTOR archive indicates your acceptance of JSTOR's Terms and Conditions of Use, available at .http://www.jstor.org/page/info/about/policies/terms.jsp. JSTOR's Terms and Conditions of Use provides, in part, that unlessyou have obtained prior permission, you may not download an entire issue of a journal or multiple copies of articles, and youmay use content in the JSTOR archive only for your personal, non-commercial use.
Please contact the publisher regarding any further use of this work. Publisher contact information may be obtained at .http://www.jstor.org/action/showPublisher?publisherCode=jwiley. .
Each copy of any part of a JSTOR transmission must contain the same copyright notice that appears on the screen or printedpage of such transmission.
JSTOR is a not-for-profit service that helps scholars, researchers, and students discover, use, and build upon a wide range ofcontent in a trusted digital archive. We use information technology and tools to increase productivity and facilitate new formsof scholarship. For more information about JSTOR, please contact [email protected].
John Wiley & Sons is collaborating with JSTOR to digitize, preserve and extend access to StrategicManagement Journal.
http://www.jstor.org

Strategic Maiagemnenit Jouirnial, Vol. 9, 123-139 (1988)
CHIEF EXECUTIVE SCANNING, ENVIRONMENTAL CHARACTERISTICS, AND COMPANY PERFORMANCE:a AN EMPIRICAL STU DY
RICHARD L. DAFT College of Business Administration, Texas A&M University, College Station, Texas, U.S.A.
JUHANI SORMUNEN College of Business Administration, Texas A&M University, College Station, Texas, U.S.A.
DON PARKS Management Department, Clemson University, Clemson, South Carolina, U.S.A.
Chief execuitives in 50 inanuicfactuirinig com1paniies were interviewed abolut tlle perceived strategic uncertainty in six environmental sectors, and the frequiency andic mniode of scanning used for each sector. The findings sluggest that custonmer, econio0m7ic and competitor sectors generated greater strategic uncertainty ti an technolo0gical, reglulatory and sociocultural sectors. When sector utncertainty was high, executives report-ed greater frequiency of scanning and greater uise of personal informnation sources. Chief executives in high-performning companies scanned rmore frequenitly and m more broadly in response to strategic uncertainty than their counterparts in low-performning com?lpanies.
Environments create both problems and oppor- tunities for organizations. Organizations depend on the environment for scarce and valued resources, and organizations often must cope with unstable, unpredictable external events. The environment, perhaps more than any other factor, affects organizational structure, internal processes and managerial decision-makinig (Duncan, 1972; Pfeffer and Salancik, 1978). A body of research has found that strategy, planning, coordination. structural complexity and organic versus mecha- nistic work processes tend to 'fit' environmental characteristics (Tung, 1979; Lawrence and Lorsch, 1967; Burns and Stalker, 1961; Lindsay and Rue, 1980; Javidan, 1984).
From an information processing perspective the environment is important because it creates uncertainty for managers, especially top man- agers. Environmental uncertainty increases infor- mation processing within organizations because
0143-2095/88/020123---17$08.50 ? 1988 by John Wiley & Sons, Ltd.
managers must identify opportunities, detect and interpret problem areas, and implement strategic or structural adaptations (Hambrick, 1982; Cul- nan, 1983; Tushman, 1977; Jemison, 1984; Galbraith, 1973). One means of competing for policy-makers is to acquire superior information about the environment. An information advan- tage about environmental opportunities and problems depends on management's perception of signals that other organizations miss (Dutton and Freedman, 1984).
Despite research on environimental uncertainty, the question remains, how do senior managers learn about the environment? Environmental scanning is the means through which top managers perceive external events and trends (Hambrick, 1982; Culnan, 1983). Scanning represents a difficult organizational problem because the environment is vast and complex, and managers experience bounded rationality-they cannot
Received 27 May 1986 Revised 17 March 1987

124 R. L. Daft et. al.
comprehensively understand the environment (Cyert and March, 1963). Senior managers must find scanning mechanisms that yield adequate information displays of external events. While a number of studies have explored the fit between organization and environment, there is less knowledge about how impressions of the environ- ment are formed among top managers who are responsible for responding with new strategies and structures. The purpose of this paper is to introduce evidence about the perceived uncer- tainty of external sectors, the means through which chief executives of manufacturing firms acquire information about those sectors, and chief executives' scanning patterns in high- and low-performing companies.
The potential significance of this research is based on four assumptions. First, scanning is the first link in the chain of perceptions and actions that permit an organization to adapt to its environment (Hambrick, 1981b). Scanning pro- vides the external intelligence that policy-makers use in planning, decision-making and strategy formulation (Ansoff, 1979; Rhyne, 1985; Hofer and Schendel, 1978; Miles, 1982; Meyer, 1979).
Second, chief executives are responsible for the organization/environment alignment. Of course, chief executives do not do all scanning (Hambrick, 1982; Aguilar, 1967, Kefalas and Schoderbek, 1973), but they are responsible for bringing together specialized information from various departments and functions. Coalignment between strategy, structure and environment is performed by senior management at the institutional level (Ritvo, Salipante and Notz, 1979).
Third, senior managers have limited time and capacity, and they must choose among scanning alternatives. Executives may choose to scan broadly across the general environment or focus narrowly on sectors in the task environment. Firms may attain a strategic information advan- tage or disadvantage depending on how scanning is conducted (Rhyne, 1985; Hambrick, 1982). Identifying executive scanning patterns in high- and low-performing companies may provide insight into effective scanning processes.
Fourth, there is a continuing puzzlement about formal versus informal scanning in organizations. A complex environment would seem to call for the increased use of sophisticated scanning systems. Executives have access to a variety of formal and informal media, yet most information
at top levels is gained through ad hoc, human sources (Preble, 1978; Thomas, 1980; Hambrick, 1981b; Mintzberg, 1973; Kefalas and Schoderbek, 1973). Top management scanning tends to be irregular rather than systematic (Fahey, King and Narayanan, 1981). An examination of formal and informal information media is a prerequisite to developing normative findings about how organizations and chief executives can achieve effective scanning.
THEORETICAL BACKGROUND AND HYPOTHESES
Environmental sectors and strategic uncertainty
The environment was defined by Duncan (1972) as the relevant physical and social factors outside the boundary of an organization that are taken into consideration during organizational decision- making. Initial research treated the environment as a single entity (Duncan, 1972; Tung, 1979). Recent studies have decomposed the environment into sectors, each of which may have distinct influence on policy-making and organizational actions (Hambrick, 1981b, 1982; Bourgeois, 1980; Boulton et al., 1982; Brown and Utterback, 1985).
The environment can be conceptualized as having several sectors that exist in two layers (Bourgeois, 1980; Dill, 1958). The layer closest to the organization is the task environment which includes sectors that have direct transactions with the organization. The task environment influences day-to-day organizational operations and goal attainment, and includes sectors such as competi- tors, suppliers and customers. The outer layer is called the general environment and refers to sectors that affect organizations indirectly. The general environment often includes social, demo- graphic and economic sectors. For a specific business firm, task versus general environment depends on how the firm's domain is defined and how policy-makers choose to navigate the domain (Bourgeois, 1980). In a manufacturing industry, customers, competitors, suppliers and technology may be part of the task environment. In the banking industry the regulatory sector may be part of the task environment because of frequent transactions with government agencies.
Sectors in the task and general environments are expected to influence scanning and other

Chief Executive Scanning and Company Performance 125
organizational activities because these sectors differ in uncertainty. Perceived environmental uncertainty is the absence of information about organizations, activities and events in the environ- ment (Huber and Daft, 1987). Perceived uncer- tainty is the difference between available information and derived information. Two environmental characteristics, complexity and rate of change, influence perceived uncertainty (Duncan, 1972; Jurkovich, 1974; Tung, 1979). Complexity refers to the heterogeneity of external events that are relevant to the organization (Child, 1972). The larger the number and diversity of external events, the higher the complexity. Rate of change refers to the frequency of changes that occur in the organization's environment. When rate of change is high, external activities and events shift rapidly so decision-makers do not have accurate information about them. As complexity and rate of change in environmental sectors increase, the amount of uncertainty perceived by top managers also increases (Dun- can, 1972).
However, uncertainty by itself will not lead to scanning behavior. Unless the external events are perceived as important to organizational performance, managers may have little interest in them (Pfeffer and Salancik, 1978; Aaker, 1983). Importance is related to the notion of resource dependency, which is the extent to which the sector provides resources for the attainment of organizational goals (Pfeffer, 1981; Daft, 1986; Hickson et al., 1971). Information from 'important' sectors may provide strategic advantage (Dutton and Freedman, 1984). In a sector of low importance, external problems or opportunities hardly affect the organization's performance. In a sector of high importance, external events are perceived to be directly linked to operations and performance. In an emerging company in the personal computer industry, for example, the technological sector would be considered strategically important because of the rate of change in technological developments.
Uncertainty and importance together create what is defined as 'strategic uncertainty' for top managers. The combination of perceived uncertainty and importance is expected to gener- ate a need for policy-makers to scan events in selected environmental sectors. One issue to be tested is whether sectors in the task environment generate greater strategic uncertainty than sectors
in the general environment. The task environment is expected to change more rapidly, to be more complex, and to be perceived as more important than the general environment. Customers' tastes change, competitive strategies change, and policy- makers must respond to unpredictable events. Economic conditions or social demographics may gradually and indirectly affect the organization, but customers and competitors may affect per- formance on a day-to-day basis. The first research hypothesis is about perceived sector differences.
Hypothesis 1: Sectors in the task environment create greater perceived strategic uncertainty for top executives than sectors in the general environment.
Scannling behavior
Executives can learn about environmental sectors in several ways. They may scan the environment directly or learn from others in the organization. They may increase or decrease the frequency with which they scan, and they may select among information modes or channels. Scanning frequency is the number of times executives receive data about the environment (Hambrick, 1981b; Farh, Hoffman and Hegarty, 1984). Scanning mode pertains to the source or medium through which executives learn about the environ- ment. Mode is derived from Aguilar's (1967) designation of information sources as personal, impersonal, internal or external.
Scanning frequency
Research into manager scanning behavior sug- gests that frequency of scanning indicates amount of information obtained about the environment (Hambrick, 1982). Managers may gather a large or small amount of data about environmental sectors. For example, Aguilar (1967) found that some managers were relatively passive and simply 'viewed' the environment, while other managers actively 'searched' for desired information. Fahey and King (1977) observed that managers could receive information along a continuum from irregular to continuous gathering. Depending on the nature of the environment executives may process data irregularly or continuously depend- ing upon the perceived need for data about external events.
126 R. L. Daft et. al.
Managers are extremely busy, and they have limited cognitive capacity for information search (Cyert and March, 1963; Hambrick, 1981a). Should they scan all sectors equally or focus narrowly on specific sectors? We expect that frequency of scanning will differ by sector and will be related to strategic uncertainty. The reason is that strategic uncertainty reflects the strategic value of information for organizational performance. Hence executives will more fre- quently acquire data about strategically uncertain sectors. Hypothesis 1 proposed that perceived strategic uncertainty would be greater in the task environment. Chief executive response to sector differences is hypothesized as follows:
HIypothesis 2: Perceived strategic uncertainty across sectors will have a positive relationship with top executive scanning frequency.
Scanning mode
Previous research also indicates that senior executives use different information modes to learn about the environment. The distinction used here is between personal and impersonal sources of information and whether information comes from sources external or internal to the organization (Aguilar, 1967; Culnan, 1983; Rhyne, 1985). Personal sources refer to direct human contact as typified by face-to-face and telephone media. Impersonal sources are written, and include formal reports, newspapers, survey results, and the output of management infor- mation systems. Personal versus impersonal is analogous to the human versus documentary sources described by Kefalas and Schoderbek (1973).
A puzzlement in the literature is whether personal or impersonal sources are better suited for interpreting an uncertain environment. Per- sonal sources of information have been found important to executives (Keegan, 1974), and are consistent with the informal, irregular scanning that typifies many organizations (Fahey and King, 1977; Thomas, 1980). On the other hand, the ability to condense a broad base of data into written form also makes impersonal sources useful for environmental scanning. Recent research into managerial information processing suggests that personal sources of information are richer than written sources (Daft and Lengel, 1984, 1986; Holland, Stead and Leibrock, 1976). Face-to-
face and telephone information exchanges provide multiple cues and allow for rapid feedback, thereby facilitating understanding when uncer- tainty is high. Several studies found that task uncertainty was associated with more frequent face-to-face communication and group meetings (Van de Ven, Delbecq and Koenig, 1976; Holland et al., 1976; Daft and Lengel, 1986). Personal communications are content-rich and enable executives to detect weak signals (Ansoff, 1975). Impersonal sources are appropriate when environ- mental events are discrete and analyzable. When strategic uncertainty is high, personal sources may provide the direct understanding needed by senior executives to interpret unclear issues (Weick, 1979; Daft and Weick, 1984). When strategic uncertainty is low, impersonal, written sources may provide sufficient data. This relation- ship is presented in the third hypothesis.
Hypothesis 3: Perceived strategic uncertainity across environmental sectors will be positively associated with use of personal sources and negatively associated with use of impersonal sources of information about the environment.
The other distinction in sources identified by Aguilar (1967) and Culnan (1983) is whether scanning information originates internal or exter- nal to the firm. Internal information pertains to data, reports, memos, or discussions with internal managers and employees about the external environment. External sources include personal tours, telephone discussions with peers in other companies, trade magazines, newspapers, infor- mation services, and attendance at association meetings. Since many people within the organi- zation scan parts of the environment, top execu- tives will tend to use both external and internal sources of information. However, as strategic uncertainty increases, it is expected that senior executives will want to form their impression through direct contact with key environmental sources. Direct contact means that data are undiluted and do not suffer from the loss of meaning associated with passing information through intermediaries. Moreover, research indi- cates that internal information tends to be distorted as it is passed up the hierarchy (Downs, 1966; O'Reilly, 1978; Roberts and O'Reilly, 1974). Internal sources may still be used by top managers to supplement external sources. On average, however, senior executives are expected
Chief Executive Scanning and Company Performance 127
Sector Importance
Sector CE Scanin
Complexity Frequency
Perceived Perceived Sector Strategic
EBUncertainty U ncertainty.
Sector CE Scannin
Change
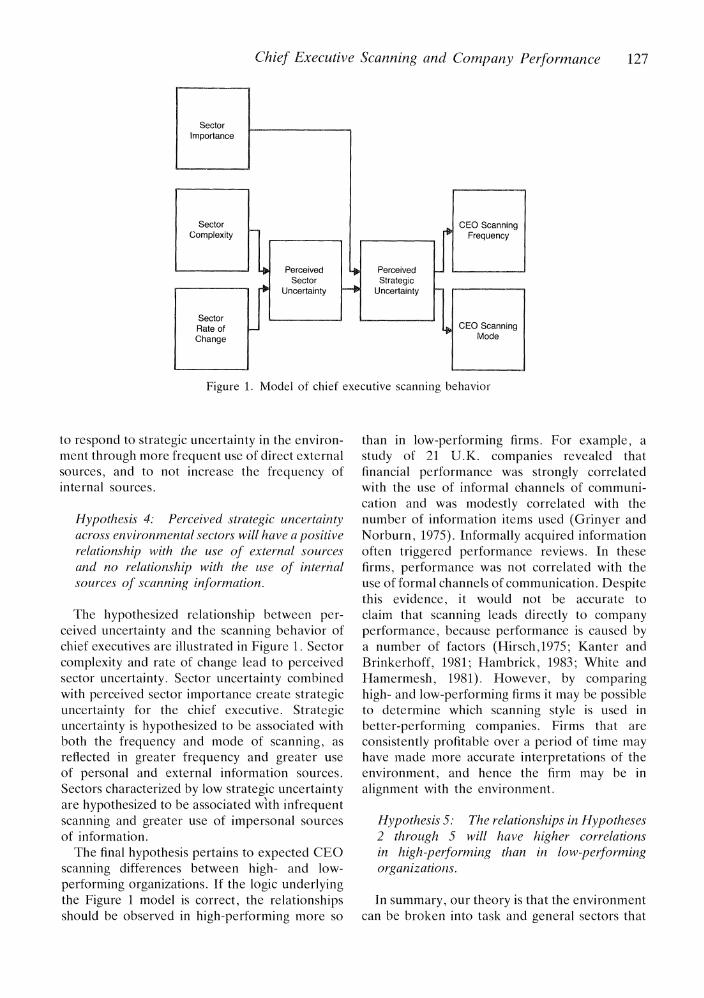
Figure 1. Model of chief executive scanning behavior
to respond to strategic uncertainty in the environ- ment through more frequent use of direct external sources, and to not increase the frequency of internal sources.
Hypothesis 4: Perceived strategic uncertainty across environmental sectors will have a positive relationship with the use of external sources and no relationship with the use of internal sources of scanning information.
The hypothesized relationship between per- ceived uncertainty and the scanning behavior of chief executives are illustrated in Figure 1. Sector complexity and rate of change lead to perceived sector uncertainty. Sector uncertainty combined with perceived sector importance create strategic uncertainty for the chief executive. Strategic uncertainty is hypothesized to be associated with both the frequency and mode of scanning, as reflected in greater frequency and greater use of personal and external information sources. Sectors characterized by low strategic uncertainty are hypothesized to be associated with infrequent scanning and greater use of impersonal sources of information.
The final hypothesis pertains to expected CEO scanning differences between high- and low- performing organizations. If the logic underlying the Figure 1 model is correct, the relationships should be observed in high-performing more so
than in low-performing firms. For example, a study of 21 U.K. companies revealed that financial performance was strongly correlated with the use of informal channels of communi- cation and was modestly correlated with the number of information items used (Grinyer and Norburn, 1975). Informally acquired information often triggered performance reviews. In these firms, performance was not correlated with the use of formal channels of communication. Despite this evidence, it would not be accurate to claim that scanning leads directly to company performance, because performance is caused by a number of factors (Hirsch,1975; Kanter and Brinkerhoff, 1981; Hambrick, 1983; White and Hamermesh, 1981). However, by comparing high- and low-performing firms it may be possible to determine which scanning style is used in better-performing companies. Firms that are consistently profitable over a period of time may have made more accurate interpretations of the environment, and hence the firm may be in alignment with the environment.
Hypothesis 5: The relationships in Hypotheses 2 through 5 will have higher correlations in high-performing than in low-performing organizationis.
In summary, our theory is that the environment can be broken into task and general sectors that
128 R. L. Daft et. al.
have different levels of strategic uncertainity for chief executives. Strategic uncertainty will be associated with greater scanning frequency and with differences in personal, impersonal, internal and external information sources because of the need for accurate understanding and content-rich data. Top managers are hypothesized to direct their scanning toward the uncertain sectors and to use sources that provide a better picture of the environment. The scanning patterns will also be compared to organizational performance.
RESEARCH METHOD
Sample selection
Sample selection was designed to include firms for which environmental sectors could be clearly defined and for which performance could be measured. These criteria lead to the selection of medium-sized, single-business manufacturing companies. A single business means the company has a defined task environment, which is not the case when the company is responsible for multiple businesses operating in multiple environments. Moreover, the selected firms were independent businesses, so scanning behavior would be related to environmental forces rather than to the policy of a parent corporation. The final criterion was that the companies be large enough to have the structural and behavioral characteristics of established organizations rather than of entrepre- neurial firms.
All firms fitting these criteria were drawn from the Directory of Texas Manufacturers. Seventy- three firms were selected for possible inclusion in the study. The 73 firms were contacted, and 50 agreed to participate in the research. The final sample included 50 small to medium-sized manufacturing firms with annual sales ranging from $2 million to $500 million, with a mean of $65 million. The number of employees ranged from 100 to 6000. The sample firms included 29 four-digit SIC groups and 12 two-digit SIC groups. The firms were located in the geographical areas of Houston, San Antonio, Dallas and Fort Worth, and there were very few direct competitors. Example firms included Alamo Steel Co., Blue Bell Creameries, Brandom Kitchens, Lufkin Industries, Otis Engineering, Plantation Foods, Rochester Gauges, and Tracor Aerospace.
Data collection
Interviews
The data were collected through personal inter- views with the chief executives in their offices. The focus of the research was on chief executive scanning, not scanning for the organization as a whole. The personal interview enabled the interviewer to explain the study to the respondent, answer questions, and to ensure that the respon- dent understood the questions. Of the 50 inter- views, 41 were with the chief executive officer of the firm. Of the remaining nine interviews, two were with manufacturing vice-presidents, three were with executive vice-presidents, and four were with senior vice-presidents designated by the president to have general management responsibility.
Variables
The interviews were the primary source of data to measure the environment and scanning variables. Questions were tested and revised through a series of pilot interviews with executives not included in the final sample. The final interview format included three parts.
1. The executive was given a chart that illustrated the six environmental sectors of cus- tomer, competition, technological, regulatory, economic and sociocultural. The executive was also given a written definition of each environ- mental sector which was read aloud and explained by the interviewer. The list of sector definitions is in the Appendix.
2. After the executive understood the six sectors, he was asked to answer questions about the complexity, rate of change, and importance of each sector. These responses were measured on five-point Likert scales. For example, the concept of change was defined and the respondent assessed the perceived rate of change in each sector. Assessing six sectors simultaneously enabled the executive to compare sectors and distinguish rates of change among them. The change question, as it appeared on the question- naire, is as follows.
The next question pertains to the amount of change taking place in each environmental sector. Change

Chief Executive Scanning and Company Performance 129
means the extent to which the important companies, agencies, problems, trends, issues, or opportunities change over time in your company's external environment. A low rate of change means things stay about the same from year to year, and a high rate of change means things change quickly and unpredictably from year to year. Based upon the same 5-point scale, how would you rate the change of each environmental sector?
Rate of change Low High
a. Competition sector 1 2 3 4 5 b. Customer sector 1 2 3 4 5 c. Technological sector 1 2 3 4 5 d. Regulatory sector 1 2 3 4 5 e. Economic sector 1 2 3 4 5 f. Socio-cultural sector 1 2 3 4 5
3. Scanning was measured using frequency questions similar to those developed by Hambrick (1982) and Culnan (1983) and validated by Farh, et al. (1984). T'he questions distinguished between internal vs. external sources and personal vs. impersonal (written) sources. The executive was given samples of information from each source, and then was asked to indicate whether useful information was received about each sector on a daily, weekly, monthly, or less frequent basis. For example, the question for external written information is as follows:
WRITTEN SOURCES OUTSIDE THE COM- PANY Written sources of information from outside your company include such things as trade magazines, newsletters, newspapers (e.g. Wall Street Journal), government reports, books, information services, and the like. Using the following scale, would you tell us how often you generally receive useful information from external written sources? We stress useful information to mean that it helps you understand the environment and plan company actions. Material you receive and do not use should not be counted. From external written sources, then, how often do you generally receive useful information?
Written external sources Daily Weekly Monthly Few times a Less thani once
year- a year a. Competition sector 1 2 3 4 5 b. Customer sector 1 2 3 4 5 c. Technological sector 1 2 3 4 5 d. Regulatory sector 1 2 3 4 5 e. Economic sector 1 2 3 4 5 f. Socio-cultural sector 1 2 3 4 5
The data concerning scanning sources were collected in four modes:
1. Written external sources (Wall Street Journal, trade magazines, information services, as in example above).
2. Written internal sources (special studies, reports, memos, MIS).
3. Personal external contacts (business associates, officials, customers, trips).
4. Personal internal contacts (subordinates, sales- people, staff people).
In addition, five new variables were created to test the hypotheses about written, personal, external and internal sources, and total scanning. These five variables overlap the four variables above, but enable a specific test of Hypotheses 3 and 4.
1. All written = (written external + written internal)/2.
2. All personal = (personal internal + personal external)/2.
3. All external = (written external + personal external)/2.
4. All internal (written internal + personal internal)/2.
5. All modes written internal + written external + personal internal + personal external/4.
An additional variable to be operationalized for the Figure 1 model is 'strategic uncertainty'. Strategic uncertainty is a combination of rate of change, complexity and importance of events in each sector. Complexity and rate of change have traditionally been combined as an indicator of environmental uncertainty (Duncan, 1972; Tung, 1979). In this study, sector 'importance' is combined with 'uncertainty' as a predictor of the
130 R. L. Daft et. al.
need for information impinging upon the chief executive. Strategic uncertainty is assumed to be a multiplicative rather than a linear function of importance and uncertainty. For example, if sector importance and uncertainty are both low, then perceived strategic uncertainty is also low. However, if importance and uncertainty are both high, perceived strategic uncertainty will be several times greater for the CEO than when importance and uncertainty are both low. The followinrg formula was used to construct the score for the strategic uncertainty variable for each environmental sector.
SU= I(C + R),
where SU perceived strategic uncertainty,
I perceived sector importance,
C + R= perceived uncertainty,
C perceived sector complexity,
R perceived sector rate of change.
Data analysis
Data analysis involved several statistical pro- cedures. The means and standard deviations for each uncertainty and scanning variable were computed for each of the six sectors. Scheffe's multiple range test was calculated to determine statistically significant differences in strategic uncertainty across sectors. Next, Pearson corre- lations were computed between the major inde- pendent and dependent variables. Major environmental and scanning differences occur across sectors, so sectors were treated as the unit of analysis (n = 300, six sectors for 50 organizations) for part of the analysis. Missing values reduced the size of the sample to 294. The later part of the analysis compared successful and unsuccessful firms and was based on the n = 50 firms.
Performance
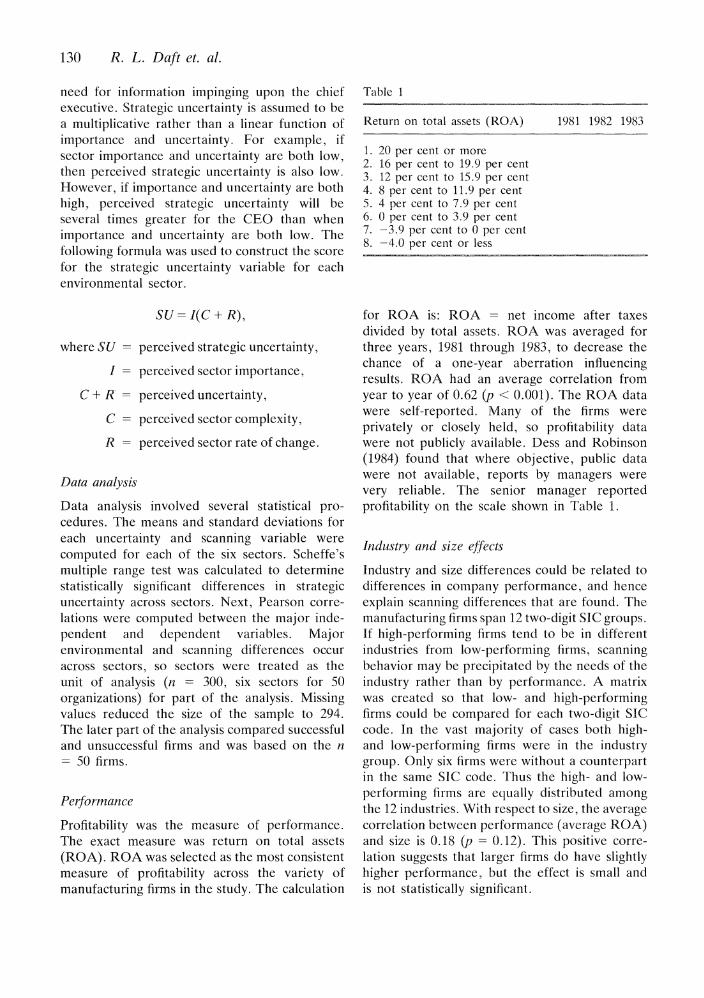
Profitability was the measure of performance. The exact measure was return on total assets (ROA). ROA was selected as the most consistent measure of profitability across the variety of manufacturing firms in the study. The calculation
Table 1
Return on total assets (ROA) 1981 1982 1983
1. 20 per cent or more 2. 16 per cent to 19.9 per cent 3. 12 per cent to 15.9 per cent 4. 8 per cent to 11.9 per cent 5. 4 per cent to 7.9 per cent 6. 0 per cent to 3.9 per cent 7. -3.9 per cent to 0 per cent 8. -4.0 per cent or less
for ROA is: ROA = net income after taxes divided by total assets. ROA was averaged for three years, 1981 through 1983, to decrease the chance of a one-year aberration influencing results. ROA had an average correlation from year to year of 0.62 (p < 0.001). The ROA data were self-reported. Many of the firms were privately or closely held, so profitability data were not publicly available. Dess and Robinson (1984) found that where objective, public data were not available, reports by managers were very reliable. The senior manager reported profitability on the scale shown in Table 1.
Industry and size effects
Industry and size differences could be related to differences in company performance, and hence explain scanning differences that are found. The manufacturing firms span 12 two-digit SIC groups. If high-performing firms tend to be in different industries from low-performing firms, scanning behavior may be precipitated by the needs of the industry rather than by performance. A matrix was created so that low- and high-performing firms could be compared for each two-digit SIC code. In the vast majority of cases both high- and low-performing firms were in the industry group. Only six firms were without a counterpart in the same SIC code. Thus the high- and low- performing firms are equally distributed among the 12 industries. With respect to size, the average correlation between performance (average ROA) and size is 0. 18 (p = 0.12). This positive corre- lation suggests that larger firms do have slightly higher performance, but the effect is small and is not statistically significant.

Chief Executive Scanning and Company Performance 131
Table 2. Means and rankings for environmental characteristics and scanning behavior
Sector characteristicsl Scanninig modes~'
Rate of Personal Personal Written Written
Importance Complexity change external internal external internal
Mean S.D. Mean S.D. Mean S.D. Mean S.D. Mean S.D. Mean S.D. Mean S.D.
Task environment Customer 4.5 0.81 4.3 1.11 3.2 1.30 3.1 0.87 3.6 0.56 2.4 1.12 2.8 1.19 Competitor 4.3 0.90 3.0 1.57 3.1 1.46 2.7 0.99 3.4 0.74 2.2 1.20 2.2 1.14 Technological 3.1 1.14 2.5 1.16 2.7 1.25 1.9 0.90 2.6 1.06 2.0 0.99 1.9 1.05
General environment Economic 4.1 0.98 3.2 1.42 3.4 1.24 2.8 0.94 2.7 1.17 3.2 1.05 1.7 1.21 Regulatory 2.7 1.22 2.2 1.41 2.2 1.09 1.5 1.00, 1.8 1.01 1.8 1.00 1.4 0.86 Sociocultural 2.2 1.15 1.7 1.02 2.0 1.04 1.5 1.30 1.6 1.15 1.6 1.17 1.0 0.87
I =low; 5 =high.
RESULTS
Profile of sector and scanning characteristics
The profile of sector characteristics and scanning modes is reported in Table 2. The mean scores in Table 2 are based on five-point Likert scales that range from 1 (very low) to 5 (very high). The mean scores and ranks in Table 2 suggest several points. First, customer and competitor sectors are perceived to be important, complex and changing. Although the economic sector is considered to be part of the general environment, it was ranked highest for rate of change, and fairly high for importance and complexity. The economic environment contained many uncer- tainties for manufacturing firms during 1982-84 because of declining inflation and a moderate recession.
With respect to scanning modes, personal external, personal internal and written internal, all are used most frequently for the customer sector. The written internal mode is ranked first for scanning of the economic sector, perhaps because most data about the economy come in the form of published reports. The sociocultural sector was ranked lowest for all four scanning modes. The profiles in Table 2 indicate major differences in perceived sector characteristics and in chief executive scanning of sectors. These differences provide the background for testing the hypotheses.
Hypothesis ]
The first hypothesis predicted that disaggregating the environment into sectors would show that the task environment created more strategic uncertainty than the general environment. Stra- tegic uncertainty for the chief executive was defined as the combination of sector importance, complexity, and rate of change. Perceived stra- tegic uncertainty across the six sectors are reported in Table 3. Based on Bourgeois' definition of task environment-sectors that have direct transactions with the organization- customer, competitor and technological sectors were considered to be in the task environment. These firms were not tightly regulated, so regulatory, economic, and socio-cultural sectors were considered part of the general environment.
Based on Scheffe's multiple range test at the 0.05 significance level, the Table 3 data indicate each sector presents a different level of strategic uncertainty to CEOs. The sectors in decreasing order of strategic uncertainty are customer, economic, competitor, technological, regulatory and sociocultural. The top three sectors in Table 3 are statistically different from the bottom three.
Hypothesis 1 about task versus general environ- ment sectors is not supported for this sample. Two of the top three strategically uncertain sectors-customer, competitor-are part of the task environment. The economic sector,

132 R. L. Daft et. al.
Table 3. Difference among sectors for strategic uncertainty
Strategic Sector uncertainty (a) (b) (c) (d) (e) (f)
(a) Customer (task) 3.4 (b) Economic (general) 2.8 (c) Competitor (task) 2.6 (d) Technological (task) 1.8 (e) Regulatory (general) 1.2 (f) Socio-Cultural (general) 1.0
The mean scores were divided by 10 to recapture original scale.
Note: asterisks denote significant difference between sectors at 0.05 level based on Scheffe's multiple range test.
considered part of the general environment, is ranked second in strategic uncertainty. For this sample of manufacturing firms the economic sector was especialy salient to chief executives. Several years of economic changes had been witnessed prior to 1984, so the uncertainty and importance attached to economic conditions were high.
The technological sector, which was considered part of the task environment for manufacturing firms, is ranked fourth. The technological sector was important, but had less strategic uncertainty than customer, economic and competitor sectors. The regulatory and sociocultural sectors had minor strategic uncertainty for these firms. These organizations were not tightly regulated at the local, state or federal level, nor were sociocultural changes having direct impact on them.
Hypotheses 2, 3 and 4
The second hypothesis stated that frequency of scanning by top managers would differ across sectors and would have a positive association with perceived strategic uncertainty. This hypoth- esis was tested by computing a correlation coefficient between the strategic uncertainty scores and scanning frequency from all scanning modes. The correlation coefficient between over- all scanning frequency and strategic uncertainty across the sectors is 0.58 (first row of Table 4), which is significant beyond the 0.001 level. Table 4 also reports correlations between strategic uncertainty and each scanning mode. The primary finding is that all correlations are positive and statistically significant. This means that chief executives report using every scanning mode more frequently when strategic uncertainty is
Table 4. Correlations between strategic uncertainty and frequency of scanning modes
Scanning mode Sector strategic uncertainty frequency (Correlation coefficient)
All modes 0.58* Written external 0.41* Written internal 0.37, Personal internal 0.54-t Personal external 0.49*t All written 0.48 All personal 0.55 t All external 0.53 All internal 0.53*
* Significant at 0.01 level.
t Personal internal and personal external are statistically greater than written internal and writteni external (p <0.05).
: All personal is statistically greater than all written (p <0.08).
high. These findings support Hypothesis 2 and indicate that strategic uncertainty is a predictor of the frequency with which top executives scan sectors.
Hypotheses 3 and 4 predicted that as strategic uncertainty in the environment increased, senior executives would rely more heavily on personal sources than on written sources, and on external rather than internal sources. The first part of Hypothesis 3, that personal sources would be used more as strategic uncertainty increased, receives support. In Table 3 the highest corre- lation (r = 0.55) is between personal modes and strategic uncertainty. The higher the uncertainty in environmental sectors, the more frequently top executives rely on personal modes both within
Chief Executive Scanning and Company Performance 133
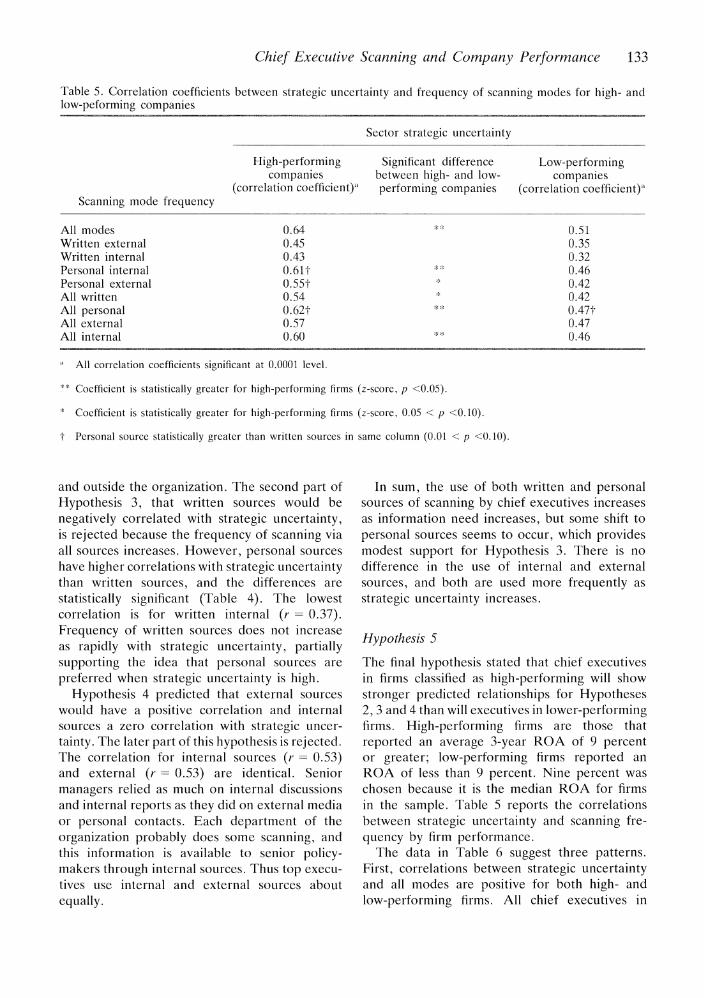
Table 5. Correlation coefficients between strategic uncertainty and frequency of scanning modes for high- and low-peforming companies
Sector strategic uncertainty
High-performing Significant difference Low-performing companies between high- and low- companies
(correlation coefficient)~' performing companies (correlation coefficient), Scanning mode frequency
All modes 0.64 0.51 Written external 0.45 0.35 Written internal 0.43 0.32 Personal internal 0.61t 0.46 Personal external 0.55t 0.42 All written 0.54 0.42 All personal 0. 62t 0. 47 t All external 0.57 0.47 All internal 0.60 0.46
aAll correlation coefficients significant at 0.0001 level.
**Coefficient is statistically greater for high-performing firms (z-score, p <0.05).
Coefficient is statistically greater for high-performing firms (z-score, 0.05 < p <0. 10).
tPersonal source statistically greater than written sources in same column (0.01 < p <0.10).
and outside the organization. The second part of Hypothesis 3, that written sources would be negatively correlated with strategic uncertainty, is rejected because the frequency of scanning via all sources increases. However, personal sources have higher correlations with strategic uncertainty than written sources, and the differences are statistically significant (Table 4). The lowest correlation is for written internal (r= 0.37). Frequency of written sources does not increase as rapidly with strategic uncertainty, partially supporting the idea that personal sources are preferred when strategic uncertainty is high.
Hypothesis 4 predicted that external sources would have a positive correlation and internal sources a zero correlation with strategic uncer- tainty. The later part of this hypothesis is rejected. The correlation for internal sources (r= 0.53) and external (r= 0.53) are identical. Senior managers relied as much on internal discussions and internal reports as they did on external media or personal contacts. Each department of the organization probably does some scanning, and this information is available to senior policy- makers through internal sources. Thus top execu- tives use internal and external sources about equally.
In sum, the use of both written and personal sources of scanning by chief executives increases as information need increases, but some shift to personal sources seems to occur, which provides modest support for Hypothesis 3. There is no difference in the use of internal and external sources, and both are used more frequently as strategic uncertainty increases.
Hypothesis 5
The final hypothesis stated that chief executives in firms classified as high-performing will show stronger predicted relationships for Hypotheses 2, 3 and 4 than will executives in lower-performing firms. High-performing firms are those that reported an average 3-year ROA of 9 percent or greater; low-performing firms reported an ROA of less than 9 percent. Nine percent was chosen because it is the median ROA for firms in the sample. Table 5 reports the correlations between strategic uncertainty and scanning fre- quency by firm performance.
The data in Table 6 suggest three patterns. First, correlations between strategic uncertainty and all modes are positive for both high- and low-performing firms. All chief executives in
134 R. L. Daft et. al.
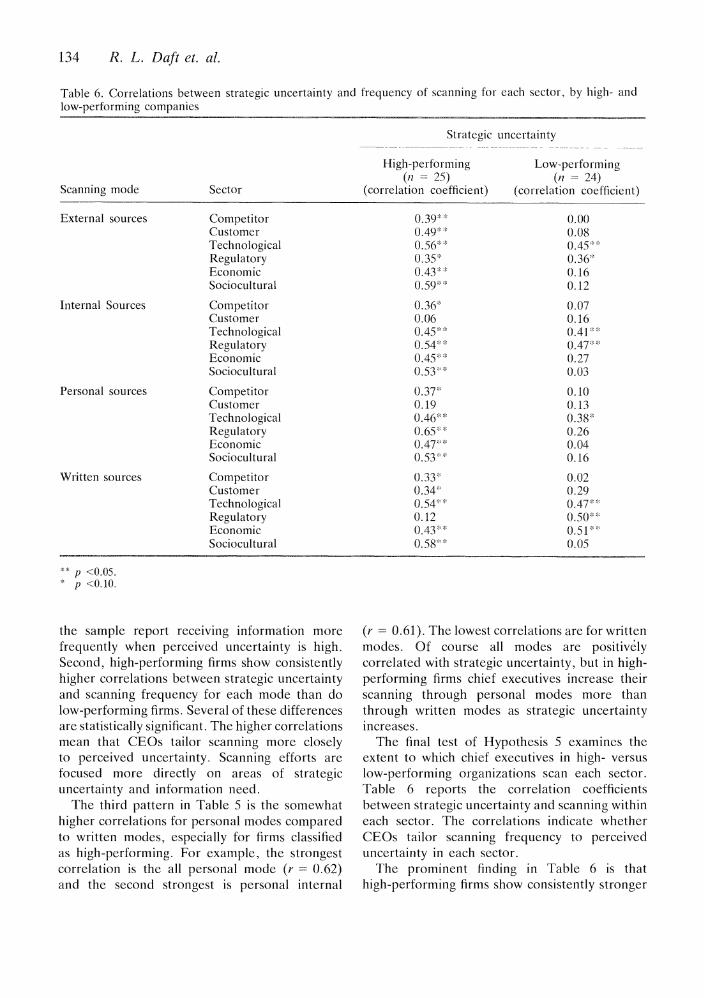
Table 6. Correlations between strategic uncertainty and frequency of scanning for each sector, by high- and low-performing companies
Strategic uncertainty
High-performing Low-performing (n = 25) (n - 24)
Scanning mode Sector (correlation coefficient) (correlation coefficient)
External sources Competitor 0.39- 0.00 Customer 0.49 0.08 Technological 0.56i 0.45 Regulatory 0.35: 0.36 6 Economic 0.43 0.16 Sociocultural 0.59}*i 0.12
Internal Sources Competitor 0.36: 0.07 Customer 0.06 0.16 Technological 0.45: 0.41e Regulatory 0.54i * 0.47* t Economic 0.45* i 0.27 Sociocultural 0.53I,l 0.03
Personal sources Competitor 0.37i 0.10 Customer 0.19 0.13 Technological 0.46 R 0.38" Regulatory 0.65* i 0.26 Economic 0.47 i 0.04 Sociocultural 0.53 1 0.16
Written sources Competitor 0.33- 0.02 Customer 0.34* 0.29 Technological 0.541i 0. 47 Regulatory 0.12 0.50 Economic 0.43 0. 51 Sociocultural 0.581 0.05
** p <0.05. p <0.10.
the sample report receiving information more frequently when perceived uncertainty is high. Second, high-performing firms show consistently higher correlations between strategic uncertainty and scanning frequency for each mode than do low-performing firms. Several of these differences are statistically significant. The higher correlations mean that CEOs tailor scanning more closely to perceived uncertainty. Scanning efforts are focused more directly on areas of strategic uncertainty and information need.
The third pattern in Table 5 is the somewhat higher correlations for personal modes compared to written modes, especially for firms classified as high-performing. For example, the strongest correlation is the all personal mode (r= 0.62) and the second strongest is personal internal
(r = 0.61). The lowest correlations are for written modes. Of course all modes are positively correlated with strategic uncertainty, but in high- performing firms chief executives increase their scanning through personal modes more than through written modes as strategic uncertainty increases.
The final test of Hypothesis 5 examines the extent to which chief executives in high- versus low-performing organizations scan each sector. Table 6 reports the correlation coefficients between strategic uncertainty and scanning within each sector. The correlations indicate whether CEOs tailor scanning frequency to perceived uncertainty in each sector.
The prominent finding in Table 6 is that high-performing firms show consistently stronger

Chief Executive Scanning and Company Performance 135
correlations between strategic uncertainty and scanning frequency in each sector than do chief executives in low-performing firms. Low- performing firms show only six correlations significant at the 0.05 level or higher, while high- performing firms show 16 correlations that are statistically significant. This suggests that CEOs in high-performing firms tailor scanning frequency to perceived uncertainty within each sector. Scanning behavior apparently is not fixed on any sector, but varies with perceived uncertainty and need for information. The lower correlations for low-performing firms mean that scanning behavior does not vary with strategic uncertainty to the same degree.
The second pattern in Table 6 is the sectors showing the strongest correlations. For firms classified as low-performing, the technology sector shows a significant correlation with all four modes, followed by the regulatory sector in three modes. This means that chief executives tailor scanning to perceived uncertainty in technology, followed by government regulation. CEOs in low-performing firms may be searching for solutions through existing routines and selective monitoring. Chief executives in high-performing firms also show positive correlations in the technology and regulatory sectors. In addition they show strong correlations through all media for the competition, economic and sociocultural sectors. The breadth of scanning is greater in the high-performing firms. The external intelligence for chief executives provides information about perceived strategic uncertainty in the general environment as well as in the task environment.
The larger correlations across sectors for high- performance firms could mean two things. First, these CEOs may have adopted a scanning pattern suited to finding opportunities and detecting problems. Broader scanning may be proactive, provide better knowledge of the environment, and enable the organization to achieve a better strategic fit. Second, high performance may enable a different scanning pattern. The high- performing firms may have more slack so the CEO can look for opportunities across a broader horizon. CEOs in lower-performing firms may be fighting fires, and hence be more concerned with immediate issues such as technology. High- performing firms provide sufficient resources that CEOs can scan in response to perceived
uncertainty from sociocultural as well as customer and competitor sectors.
DISCUSSION
The external environment is a significant contin- gency for organizations (Duncan, 1972; Tung, 1979; Daft, 1986). The purpose of this study was to examine the means through which the environment is scanned and interpreted by chief executives in medium-sized manufacturing firms. The research project gathered data to accomplish three outcomes: (1) document whether system- atic differences exist in perceived stategic uncer- tainty across sectors in the task and general environments; (2) determine whether perceived strategic uncertainty is correlated with the fre- quency of CEO scanning and with the use of personal/written and external/internal modes of information gathering; and (3) assess whether chief executives in high-performing firms show different scanning patterns than CEOs in low- performing firms.
Environmental characteristics and scanning
The first interpretation of the data with respect to environmental characteristics for this sample of manufacturing firms is as follows: sectors differed widely in the amount of strategic uncertainty created for chief executives, and customer, economic and competition sectors had greater strategic uncertainty than technological, regulatory and sociocultural sectors. The cus- tomer and competitor sectors are both in the task environment, but the economic sector is typically considered in the general environment (Bourgeois, 1980). Thus sectors in the general environment do create uncertainty and need to be scanned by policy-makers. This finding reinforces research by Hamnbrick (1981b, 1982), and Brown and Utterback (1985), who adopted a sector approach in their studies of the environ- ment. Earlier studies treated the environment as a single entity, and used a single score of uncertainty. In light of increasing evidence about the diversity of external environments, a single environmental measure may not be a useful way to understand how the environment influences organizational actions.

136 R. L. Daft et. al.
The second finding about the environment is: chief executives responded to perceived strategic uncertainty across sectors with greater scanning frequency in all modes, and somewhat greater use of personal compared to written modes. The literature on organizational information processing states that nonroutine, uncertain tasks require greater information processing (Culnan, 1983; Daft and Macintosh, 1981; Tushman and Nadler, 1978; Galbraith, 1973). The greater frequency of scanning in this study suggests a greater amount of information about uncertain sectors. Moreover, the greater scanning of sectors such as customer and economic are through all media. Chief executives do not have equal information about all sectors because information is gathered where uncertainty is greatest.
The greater use of all modes suggests that chief executives use multiple sources to interpret the environment. Written and personal sources may complement one another to give a better view of an uncertain environment. Personal sources are important because their richness enables subtle signals to be detected (Daft and Lengel, 1984). Written media are important because tangible data can be gathered and communicated about discrete events. The greater preference for personal modes as uncertainty increases reflects the inability to acquire hard data when events are rapidly changing and unclear (Weick, 1985). Managers use multiple media, and media may complement one another. A weak signal detected from a personal source may be supplemented with objective data. Scanning information through one medium may trigger the use of a complemen- tary medium.
Scanning and performance
The findings from the comparison of high- and low-performing manufacturing firms suggest the third interpretation: chief executive scanning in higher-performing firms was characterized by more frequent scanning and by careful tailoring of scanning to perceived strategic uncertainty compared to chief executives in lower-performing firms. Executives in high-performing firms reported more frequent information through all media when strategic uncertainty was high. The data also suggested that scanning was tailored to perceived uncertainty in each sector. Executives from lower-performing firms had correlations
between strategic uncertainty and frequency of scanning in the technology sector, and to some extent in the regulatory sector. For executives in high-performing companies, however, positive correlations also included competitors, customers, the economy, and sociocultural sectors. Execu- tives in the higher-performing companies did not have a limited scanning pattern.
The broad scanning base for executives in high- performing firms was unexpected. A distinctive feature in high-performing firms was the CEO's response to sectors such as sociocultural in the general environment. The significance of this finding may be that chief executives of successful firms do not form their impressions based strictly on narrow task environment data. They might miss opportunities, trends, problems and other issues that could provide input for incremental adjustments in strategy. High-performing com- panies may have slack resources available that enable chief executives to scan more broadly, while chief executives in low-performing firms are fighting fires and have to concentrate on a narrower range of environmental factors. Scan- ning and performance thus may be self-reinforc- ing, with broad scanning providing opportunities for improved performance, and improved per- formance providing slack resources for broad scanning. Scanning the less well understood sectors may contain weak signals about future developments. Learning about uncertainties across all sectors may provide a richer information display for the incremental decisions needed for strategy formulation.
SUMMARY AND IMPLICATIONS FOR RESEARCH
In summary, chief executives have limited scan- ning capacity, and organizations have limited resources. Resources devoted to environmental scanning can be focused on sectors where strategic uncertainty is greatest. For this sample of manufacturing firms the sectors more frequently scanned were customer, economic and competi- tor. Perhaps more important, executives in high- performing firms tailored scanning to perceived strategic uncertainty in all sectors. The implication is that scanning systems should not be locked into continuous data on limited sectors of the environment. Management information systems

Chief Executive Scanning and Company Performance 137
tend to provide periodic information of a repeti- tive nature. Repetitive data may be valuable for perceiving stable elements in task sectors (Hedberg, 1981; Hedberg and Jonsson, 1978), but may not be valuable for unstable or hard-to- measure sectors. Executives in successful firms seem to maintain 'information flexibility', which means scanning is carefully tailored to the amount of uncertainty across all sectors. Scanning behavior is flexible enough to accommodate uncertainty rather than being based on habit or stable patterns. An important question for future research is to examine whether information flexibility is an important scanning trait, and whether it is correlated with CEO and organi- zational characteristics.
Another question for future research is to explore how media complement one another, and whether cues picked up in one medium are used to corroborate information from another medium. Future research may also determine whether designers of information systems should try to provide only certain types of data through formal channels, and the extent to which the best view of the environment comes from multiple information sources.
Another research implication pertains to the debate about whether formal versus informal sources of information provide better input to the organizational planning process (Rhyne, 1985; Fahey etal., 1981). The data from these executives suggest that both personal and written sources are valued, and that both internal and external sources are used. Most important, the use of all sources increased as strategic uncertainty increased, suggesting that multiple sources are the appropriate information system for chief executives. Written sources provide systematic, periodic data that can show trends and provide other relevant facts. Written sources were especially important for the economic sector. Personal sources provide a view of intangible aspects of the environment that may be filtered out by written media (Weick, 1985; Daft and Huber, 1987).
To the extent that an organization strategy is incremental (Quinn, 1984), and reflects gradual organizational learning about the environment, bits and pieces of information from diverse sources can be assembled to provide cues to chief executives about the environment. This research has explored the link between environmental
characteristics and CEO scanning. Perhaps the next step in future research can be to explore the detailed linkage between environment, scanning, and actual strategic adjustments. Gradually unra- veling the sequence of activities associated with interpretation of the environment and strategic responses may provide a stronger normative basis for saying how firms can be designed to increase company performance in light of strategic and environmental contingencies.
ACKNOWLEDGEMENTS
This research was supported by Office of Naval Research Grant N00014-83-C-0025. Thanks to Mary Culnan, George Huber, Jim Skivington and Carl Zeithaml for helpful comments on earlier drafts of this paper.
APPENDIX: DEFINITION OF ENVIRONMENTAL SECTORS
This part of the interview is concerned with how you monitor and learn about things in the company's external environment. By the external environment we mean all the factors and phenom- ena that exist outside your company. The external environment can be divided into six sectors, as illustrated on Chart 1.
(1) The competition sector. This sector includes the firms and products that compete with your company's products, and companies that make substitute products. It also refers to competitive tactics and actions between your firm and the other competing firms in this industry.
(2) The customer sector. This sector refers to those companies or individuals that puirchase the products made by your company. Customers include com- panies that acquire your products for resale, as well as final consumers.
(3) The technological sector. This sectors includes the development of new production techniques and methods, innovation in materials and products, and general trends in research and science relevant to your company.
(4) The regulatory sector. This sector includes federal and state legislation and r egulations, city or community policies, and political developments at all levels of government.
(5) The economic sector. This sector includes economic factors such as stock markets, rate of inflation, foreign trade balance, federal and state budgets,

138 R. L. Daft et. al.
interest rates, unemployment and economic growth rate.
(6) The sociocultural sector. This sector comprises social values in the general population, the work ethic, and demographic trends such as an increasing number of women in the work force.
The purpose of the following questions is to determine the profile of each environmental sector. We would like to know how you would rate the importance, complexity, and rate of change of each sector in your company's external environment.
REFERENCES
Aaker, David A. 'Organizing a strategic information scanning system', California Managemenit Review, 25(2), January 1983, pp. 76-83.
Aguilar, Francis Joseph. Scanning the Blusiness Environment, Macmillan, New York, 1967.
Ansoff, H. Igor. 'Managing strategic surprise by response to weak signals', California AManagement Review, 18(2), Winter 1975, pp. 21-33.
Ansoff, H. Igor. Strategic Managenment, Macmillan, Hong Kong, 1979.
Boulton, William R., William M. Lindsay, Stephen G. Franklin and Leslie W. Rue. 'Strategic planning: determining the impact of environmental character- istics and uncertainty', Academy of Management Journal, 25, 1982, pp. 500-509.
Bourgeois, L. J. 'Strategy and environment: a concep- tual integration', Academy of Management Review, 5, 1980, pp. 25-39.
Brown, James W. and James M. Utterback. 'Uncer- tainty and technical communication patterns', Man- agement Science, 31, 1985, pp. 301-311.
Burns, Tom and G. M. Stalker. The Management of Innovation, Tavistock, London, 1961.
Child, John. 'Organizational structure, environment and performance the role of strategic choice', Sociology, 6, 1972, pp. 1-22.
Culnan, Mary. J. 'Environmental scanning: the effects of task complexity and source accessibility on information gathering behavior', Decision Sciences, 14, 1983, pp. 194-206.
Cyert, Richard M. and James G. March. A Behavioral Theory of the Firm, Prentice-Hall, Englewood Cliffs, NJ, 1963.
Daft, Richard L. Organization Theory and Design, West, St Paul, MN, 1986.
Daft, Richard L. and George Huber. 'How organi- zations learn: a communication framework', in Bacharach, S. and Nancy DiTomaso (eds), Research in Sociology of Organizations, 5, 1987 (in press).
Daft, Richard L. and Robert H. Lengel. 'Information richness: a new approach to manager information processing and organizational design'. In Staw, B. and L. L. Cummings (eds), Resear-ch in
Organizational Behavior, 1984, pp. 191-233. Daft, Richard L. and Robert H. Lengel, 'Organiz-
ational information requirements, media richness and structural design', Management Science, 32, May 1986, pp. 554-571.
Daft, Richard L. and Norman B. Macintosh. 'A tenative exploration into the amount and equivocal- ity of information processing in organizational work units', Administrative Science Quarterly, 26, 1981, pp. 207-224.
Daft, Richard L. and Karl E.Weick, 'Toward a model of organizations as interpretation systems', Academrly of Management Review, 9, 1984, pp. 284-295.
Dess, Gregory G. and Richard B. Robinson, Jr. 'Measuring organizational performance in the absence of objective measure', Strategic Manage- ment Journal, 5(3), 1984, pp. 265-273.
Dill, William, R. 'Environment as an influence on managerial autonomy', Administrative Science Quarterly, 3, 1958, pp. 409-443.
Downs, A. Inside Bureaucracy, Little, Brown, Boston, MA, 1966.
Duncan, Robert B. 'Characteristics of organizational environments and perceived environmental uncer- tainty', Administrative Science Quarterly, 17, 1972, pp. 313-327.
Dutton, John M. and Richard D. Freedman. 'Uncer- tainty and firms' strategic behaviors', Working Paper, New York University, 1984.
Fahey, Liam and William, R. King. 'Environmental scanning for corporate planning', Business Hor- izons, August 1977, pp. 61-71.
Fahey, Liam, William R. King and V. K. Narayanan. 'Environmental scanning and forecasting in strategic planning-the state of the art', Long Range Planning, 14(1), 1982, pp. 32-39.
Farh, Jiing-Lih, Richard C. Hoffman and W. Harvey Hegarty. 'Assessing environmental scanning at the subunit level: a multitrait-multimethod analysis', Decision Sciences, 15, 1984, pp. 197-220.
Galbraith, Jay R. Designing Complex Organizations, Addison-Wesley, Reading, MA, 1973.
Grinyer, P. H. and D. Norburn. 'Planning for existing markets: perceptions of executives and financial performance', Journal of the Research Statistical Society A, 138, Part 1, 1975, pp. 70-97.
Hambrick, Donald C. 'Environment, strategy, and power within top management teams', Administra- tive Science Quarterly, 26, 1981a, pp. 25 275.
Hambrick, Donald C. 'Specialization of environmental scanning activities among upper level executives', Journal of Management Studies, 18, 1981b, pp. 299-320.
Hambrick, Donald C. 'Environmental scanning and organizational strategy', Strategic Management Jour- nal, 3, 1982, pp. 159-174.
Hambrick, Donald C. 'High profit strategies in mature capital goods industries: a contingency approach', Academy of Management Journal, 26(4), 1983, pp. 87-107.
Hedberg, Bo L. T. 'How organizations learn and unlearn'. In Nystrom, P. C. and W. H. Starbuck
Chief Executive Scanning and Company Performance 139
(eds), Handbook of Organizational Design, vol. I, Oxford University Press, New York, 1981, pp. 3-27.
Hedberg, Bo L. T. and Sten A. Jonsson. 'Designing semi-confusing information systems for organi- zations in changing environments', Accounting, Organizations and Society, 3, 1978, pp. 47-64.
Hickson, D. J., C. R. Hinings, C. A. Lee, R. E. Schneck and J. M. Pennings. 'A strategic contingencies theory of intraorganizational power', Administrative Science Quarterly, 16, 1971, pp. 216-229.
Hirsch, Paul M. 'Organizational effectiveness and the institutional environment', Administrative Science Quarterly, 20, 1975, pp. 327-344.
Hofer, C. W. and D. Schendel, Strategy Formulation: Analytical Concepts, West Publishing, St Paul, MN, 1978.
Holland, W. E., B. A. Stead and R. C. Leibrock. 'Information channel source selection as a correlate of technical uncertainty in a research and develop- ment organization', IEEE Transactions on Enginieer- ing Management, 23, 1976, pp. 163-167.
Huber, George P. and Richard L. Daft. 'Information environments'. In Putnam, L., L. Porter, K. Roberts and F. Jablin (eds), Handbook of Organizational Comnmunication, Sage, Beverly Hills, CA, 1987 (in press).
Javidan, Mansour. 'The impact of environmental uncertainty on long-range planning practices of the U.S. savings and loan industry', Strategic Manaigement Journal, 5, 1984, pp. 381-392.
Jemison, David B. 'The importance of boundary spanning roles in strategic decision-making', Journal of Management Studies, 21(2), 1984, pp. 131-152.
Jurkovich, Ray. 'A cure typology of organizational environments', Administrative Science Quarterly, 19, 1974, pp. 380-394.
Kanter, Rosabeth Moss and Derick Brinkerlhoff. 'Organizational performance: recent developments in measure'. Anniual Review of Sociology, 7 1981, pp. 321-349.
Keegan, W. J. 'Multinational scanning: a study of the information sources utilized by headquarters' executives in multinational companies', Administra- tive Science Quarterly, 19, 1974, pp. 411-421.
Kefalas, Asterias and Peter P. Schoderbek. 'Scanning the business environment', Decision Sciences, 4, 1973, pp. 63-74.
Lawrence, Paul R. and Jay W. Lorsch. Organizations and Environment, Irwin, Homewood, IL, 1967.
Lindsay, W. M. and L. W. Rue. 'Impact of the organization environment on the long-range plan- ning process: a contingency view', Academiy of Management Journal, 23, 1980, pp. 385-404.
Meyer, Alan D. 'Adapting to environmental jolts', Administrative Science Quarterly, 17, 1979, pp. 313-327.
Miles, Robert H. Coffin Nails and Corporate Strategies,
Prentice-Hall, Englewood Cliffs, NJ, 1982. Mintzberg, H. The Nature of Managerial Work, Harper
& Row, New York, 1973. O'Reilly, Charles A. 'The intentional distortion of
information in organizational communications: a laboratory and field approach', Human Relations, 31, 1978, pp. 173-193.
Pfeffer, Jeffrey. Power and Organizations, Pitman, Marshfield, MA, 1981.
Pfeffer, J. and G. R. Salancik. The External Control of Organizations, Harper & Row, New York, 1978.
Preble, John F. 'Corporate use of environmental scanning', Michigan Business Review, 30(5), 1978, pp. 12-17.
Quinn, James B. 'Managing strategies incrementally'. In Lamb, R. (ed.), Competitive Strategic Manage- ment, Prentice-Hall, Englewood Cliffs, NJ, 1984, pp. 35-61.
Rhyne, Lawrence C. 'The relationship of information usage characteristics to planning system sophisti- cation: an empirical examination'. Strategic Manage- ment Journal, 6, 1985, pp. 319-337.
Ritvo, Roger A., Paul Salipante, Jr and William W. Notz. 'Environmental scanning and problem recognition by governing boards: the response of hospitals to declining birth rates', Hutman Relations, 32(3), 1979, pp. 227-235.
Roberts, Karlene H. and Charles A. O'Reilly. 'Failures in upward communications in organizations: three possible culprits', Academy of Maniagement Journal, 17, 1974, pp. 205-215.
Thomas, Philip S. 'Environmental scanninlg-the state of the art', Long Range Planning, 13, February, 1980, pp. 20-28.
Tung, Rosalie L. 'Dimensions of organizational environments: an exploratory study of their impact on organization structure', Academy of Management Journal, 22, 1979, pp. 672-693.
Tushman, Michael L. 'Special boundary roles in the innovation process', Administrative Science Quarterly, 22, 1977, pp. 587-605.
Tushman, Michael and David A. Nadler. 'An infor- mation processing approach to organizational design', Academay of Managenment Review, 3(3), 1978, pp. 613-624.
Van de Ven, A. H., A. L. Delbecq and R. Koenig, Jr. 'Determinants of coordination modes within organizations', Anmerican Sociological Review, 41, 1976, pp. 322-338.
Weick, Karl E. The Social Psychology of Organizing, Addison-Wesley, Reading, MA, 1979.
Weick, Karl E. 'Cosmos vs. chaos: sense and nonsense in electronic contexts', Or-ganizationail Dyniamics, Autumn 1985, pp. 50-65.
White, Roderick E. and Richard G. Hamiermesh. 'Toward a model of business unit perforrrmance: an integrative approach', Academay of Managemen t Review, 6(2), 1981, pp. 213-223.