child friendly school programming: global evaluation report
TRANSCRIPT
CHILD FRIENDLY SCHOOLS PROGRAMMING
Global Evaluation Report
EVALUATION OFFICE
DECEMBER 2009
EVALUATION REPORT

ii
CHILD FRIENDLY SCHOOLS PROGRAMMING
Global Evaluation Report
EVALUATION REPORT
EVALUATION OFFICE DECEMBER 2009

iii
Child Friendly Schools Programming: Global Evaluation Report © United Nations Children‘s Fund, New York, 2009 United Nations Children‘s Fund Three United Nations Plaza New York, New York 10017 December 2009 The purpose of the evaluation reports produced by the UNICEF Evaluation Office is to assess the situation, facilitate the exchange of knowledge and perspectives among UNICEF staff and to propose measures to address the concerns raised. The content of this report does not necessarily reflect UNICEF's official position. The text has not been edited to official publication standards and UNICEF accepts no responsibility for errors. The designations in this publication do not imply an opinion on legal status of any country or territory, or of its authorities, or the delimitation of frontiers. For further information, please contact: Evaluation Office United Nations Children‘s Fund Three United Nations Plaza New York, New York 10017, United States Tel: +1(212) 824-6322 Fax: +1(212) 824-6492

iv
PREFACE The Evaluation Office working closely with the Education Section commissioned American Institutes for Research (AIR) to conduct a global evaluation of UNICEF‘s Child-Friendly Schools (CFS) programming strategy in 2008. The purpose of the evaluation was to assess how CFS models have been implemented in multiple contexts to improve education quality, and to provide data on the extent to which key CFS principles of child-centeredness, inclusiveness, and democratic participation are being realized in countries that are implementing CFS. The evaluation was also expected to create CFS assessment tools and provide a baseline against which future progress can be evaluated. The evaluation methodology consisted of a desk review of CFS documents from all regions, site visits and primary data collection in six countries (Guyana, Nicaragua, Nigeria, Philippines, South Africa, Thailand), and an on-line Delphi survey of UNICEF Education Officers from all regions. The country visits included extensive new data collection via surveys, observations, interviews, photos and videos, and focus group discussions. In order to obtain the perspective of all key stakeholders, the evaluation teams collected data from teachers, school leaders, parents, and schoolchildren. Hence, in addition to this global evaluation report, six in-depth country case-study reports were produced from this work. We hope that readers from both the Education sector and the Evaluation discipline will be satisfied with the rigor of the methodologies and clarity of the analysis. Our appreciation for the effort and professionalism that was demonstrated in this evaluation goes to David Osher, the lead evaluator from AIR, and the AIR team and authors consisting of Elizabeth Spier, Dana Kelly, Nitika Tolani-Brown, Luke Shors, Chen-Su Chen, Cassandra Jessee and Olivia Padilla and Jeff Davis. We also extend thanks to the national research teams that assisted AIR in each country. We would also like to express gratitude to our colleagues in the Education Section - Cream Wright, Changu Mannathoko and Maida Pasic – for recognizing the need for an independent evaluation, for insightful contributions at every stage, and for mobilizing their Education colleagues in regional and country offices. Likewise, we appreciate the efforts made in all participating UNICEF country offices, especially in the six case study nations. Finally, sincere commendations go to my colleagues who managed the evaluation, Samuel Bickel (Senior Advisor) and Kathleen Letshabo (Evaluation Specialist, Education). Readers of this report inspired to learn more about the Child Friendly Schools approach are invited to visit the UNICEF website (www.unicef.org) for all the reports in this series. Readers interested in UNICEF‘s evaluation priorities and strategies will also find important information there. Finbar O‘Brien Director Evaluation Office UNICEF New York Headquarters

v
TABLE OF CONTENTS
EXECUTIVE SUMMARY ........................................................................................................................... viii
Résumé analytique ................................................................................................................................ xviii
Resumen Ejecutivo ................................................................................................................................ xxxi
Chapter 1 – Introduction ............................................................................................................................. 1
1.1 Background ........................................................................................................................................ 1
1.2 Evaluation approach and methodology .............................................................................................. 3
1.3 Country contexts: CFS in the sampled countries ............................................................................. 11
1.4 Overview of report ............................................................................................................................ 15
Chapter 2 – Inclusiveness ........................................................................................................................ 17
2.1 Summary of key findings on inclusiveness ....................................................................................... 18
2.2 Do school heads, teachers and parents value inclusiveness? ........................................................ 18
2.3 What CFSs do to seek out and retain children ................................................................................. 20
2.4 How do students in CFS experience school climate? ...................................................................... 21
2.5 Safety and inclusiveness policies and their relationship on school climate ..................................... 23
2.6 How inclusive were school environments for all children? ............................................................... 24
2.7 How responsive and inclusive are CFS for children with disabilities? ............................................. 28
2.8 CFS increasing and student participation ........................................................................................ 31
2.9 Challenges to being inclusive ........................................................................................................... 34
2.10 Previous research on CFS ......................................................................................................... 37
2.11 Lessons from the Delphi survey of UNICEF Education Officers ............................................... 38
Chapter 3 – Child-centredness: Providing safe and protective learning environments ................... 40
3.1 Summary of key findings .................................................................................................................. 41
3.2 Creating a safe and welcoming learning environment in CFSs ....................................................... 42
3.3 What adults do to create positive emotional environments in CFSs ................................................ 48
3.4 Do children in CFS feel safe and supported? .................................................................................. 50
3.5 What CFSs do to support children‘s health and hygiene ................................................................. 52
3.6 What are the challenges to supporting children‘s health and safety? .............................................. 58
3.7 Previous research on health, safety, school climate and CFSs ....................................................... 60
3.8 Health, safety and school climate from the Delphi survey ............................................................... 62
Chapter 4 – Child-centredness: teaching and learning ........................................................................ 63
4.1 Summary of key findings .................................................................................................................. 64
4.2 Do students experience academic support? .................................................................................... 65
4.3 To what degree is instruction in CFS child-centred? ........................................................................ 67
4.4 Teacher beliefs and attitudes on child-centred pedagogy................................................................ 71
4.5 What are the challenges to providing child-centred pedagogy? ...................................................... 72

vi
4.6 What did we learn from previously conducted research on CFS? ................................................... 76
4.7 What did we learn from the Delphi survey of UNICEF Education Officers? ..................................... 78
Chapter 5 – Democratic participation ..................................................................................................... 79
5.1 Summary of key findings .................................................................................................................. 80
5.2 In what ways do children participate in CFS? .................................................................................. 81
5.3 Promoting parent and community participation in CFSs .................................................................. 84
5.4 Student, parents and community participation ................................................................................. 93
5.5 Previously research on CFS and democratic participation .............................................................. 95
5.6 Lessons on democratic participation from the Delphi survey ........................................................... 97
Chapter 6 – Profiles of CFS ...................................................................................................................... 99
6.1 A child friendly school in Nigeria ...................................................................................................... 99
6.2 A child friendly school in South Africa ............................................................................................ 100
6.3 A child friendly school in Thailand .................................................................................................. 101
6.4 A child friendly school in the Philippines ........................................................................................ 101
6.5 A child friendly school in Guyana ................................................................................................... 102
6.6 A child friendly school in Nicaragua ............................................................................................... 103
Chapter 7 – Investment in CFS .............................................................................................................. 104
7.1 Global spending on CFS ................................................................................................................ 104
7.2 Comparisons of CFS spending in six countries ............................................................................. 107
7.3 UNICEF investment in CFS ............................................................................................................ 109
7.4 Cost of scaling up CFS ................................................................................................................... 118
7.5 Other cost issues ............................................................................................................................ 121
Chapter 8 – The promise of CFS: Summary and recommendations ................................................ 123
8.1 Evaluation findings ......................................................................................................................... 124
8.2 Recommendations.......................................................................................................................... 130
Appendix A: Evaluation Methodology and Analysis ........................................................................... 137
Appendix B: Hierarchical Linear Modeling Analysis ........................................................................... 154
Appendix C: Analysis of Cost ................................................................................................................ 173
Glossary ................................................................................................................................................... 180
References ............................................................................................................................................... 182

vii
Figures
Figure 1 CFS models as a pathway to quality education through the application of principles: child-centredness, democratic participation and inclusiveness .................................................................... 3
Figure 2 Hypothesized relationship between CFS principles and school climate ..................................... 11
Figure 3 SIRC in CFS: Student reports ...................................................................................................... 22
Figure 4 SIRC: School head reports .......................................................................................................... 23
Figure 5 SIRC: Teacher reports ................................................................................................................. 24
Figure 6 Inclusive school environment and climate: School observations ................................................ 25
Figure 7 Inclusive classroom climate: Classroom observations ................................................................ 26
Figure 8 Safe and welcoming school learning environment: School observations.................................... 42
Figure 9 Safe and welcoming classroom environments: Classroom observations ................................... 46
Figure 10 Students‘ physical and emotional safety in CFS: Student reports ............................................. 51
Figure 11 Emotionally Supportive Climate: Student reports ...................................................................... 52
Figure 12 Healthy learning environments: Hygiene and sanitation: School observations ......................... 53
Figure 13 Healthy learning environment: Child-centred services: School head reports ............................ 56
Figure 14 CSCLE in CFS: Student reports ................................................................................................ 65
Figure 15 Child-centred pedagogy: Classroom observation ...................................................................... 68
Figure 16 Support for teacher development and pedagogy: Teacher reports ........................................... 73
Figure 17 Child participation: Teacher reports ........................................................................................... 81
Figure 18 Child participation: School head reports .................................................................................... 82
Figure 19 Family and community participation: School head reports ........................................................ 86
Figure 20 Family and community participation: Teacher reports ............................................................... 87
Figure 21 CFS 2006-2007 average regional expenditures ...................................................................... 105
Figure 22 CFS combined 2006-2007 sources of funding ........................................................................ 106
Figure 23 Distribution of UNICEF CFS expenditures by activity and resource categories, 2006-2007 .. 107
Figure 24 Total per pupil expenditure by country .................................................................................... 108
Figure 25 Total per pupil expenditure by per capita GNP in Nigeria, the Philippines and South Africa .. 109
Figure 26 Total per pupil expenditure in sample of Child Friendly Schools, Guyana .............................. 111
Figure 27 Total per pupil expenditure in sample of Child Friendly Schools, Philippines .......................... 112
Figure 28 Total per pupil expenditure in sample of Child Friendly Schools, South Africa ........................ 113
Figure 29 Total per pupil expenditure in sample of Child Friendly Schools, Nicaragua ........................... 114
Figure 30 Total per pupil expenditure in sample of Child Friendly Schools, Thailand .............................. 115
Figure 31 Total per pupil expenditure in sample of Child Friendly Schools, Nigeria ................................ 116
Figure 32 Percentage of UNICEF CFS expenditures of total per pupil expenditure ............................... 117
Figure 33 Total per pupil expenditures by school enrolment ................................................................... 119

viii
Tables
Table 1 Reporting scales for CFS evaluation surveys and observation protocols ...................................... 9
Table 2 School heads‘ perceptions of school efforts to provide educational opportunities ....................... 19
Table 3 School heads‘ perceptions of school efforts to be child-seeking .................................................. 20
Table 4 Students‘ average score on the SIRC scale, overall and by subgroup ........................................ 23
Table 5 Students, teachers and school heads‘ perceptions of gender inclusivity and equality ................. 26
Table 6 Gender equality in instruction: Percentage of classrooms observed ............................................ 27
Table 7 School heads‘ perceptions efforts to provide opportunities for students with disabilities ............. 29
Table 8 Percentages of schools with facilities accessible to students with disabilities ............................. 29
Table 9 Percentage of students absent during the last year without permission ...................................... 32
Table 10 Percentage of students absent to work or help out at home: Student reports ........................... 32
Table 11 Absenteeism and dropping out: School reports .......................................................................... 33
Table 12 Structural and physical condition of schools: School observations ............................................ 43
Table 13 Percentage of classrooms with comfortable learning environments .......................................... 47
Table 14 Students‘ perceptions of their physical and emotional safety ..................................................... 51
Table 15 School facilities and practices supporting students‘ health and hygiene .................................... 54
Table 16 School heads‘ perceptions of school services supporting students‘ health ................................ 57
Table 17 School heads‘ perceptions of health education and social-emotional development .................. 58
Table 18 Students‘ average score on the CSCLE scale, overall and by subgroups ................................. 66
Table 19 Child-centred instructional methods: Percentage of classrooms observed ................................ 69
Table 20 Student perceptions about child-centred instructional methods ................................................. 69
Table 21 Teacher beliefs about child-centred instructional methods ........................................................ 71
Table 22 Teachers‘ perceptions regarding opportunities for professional development ........................... 73
Table 23 Teachers‘ and students‘ perceptions about access to materials supporting learning ................ 75
Table 24 Student, teacher and school head perceptions regarding family participation in CFS ............... 87
Table 25 Teacher and school head perceptions regarding community participation in CFS .................... 91
Table 26 Distribution of expenditures of total cost of CFS ....................................................................... 110
Table 27 Expenditures on CFS and estimated annual cost of expanding CFS to all public schools ...... 118
Table 28 Sensitivity analysis based on estimated life of durable goods .................................................. 121
Table 29 Prevalence of elements of CFS models: AIR site visitor ratings .............................................. 129

ix
Photographs
Photo 1 School with limited accessibility to students with disabilities, South Africa .................................. 30
Photo 2 School grounds accessible to students with disabilities, Nicaragua ........................................... 30
Photo 3 School garden, Philippines .......................................................................................................... 44
Photo 4 School garden, Philippines .......................................................................................................... 44
Photo 5 School grounds and play equipment, Nigeria .............................................................................. 44
Photo 6 Mural with school mission, Philippines ........................................................................................ 44
Photo 7 Concrete school building, Thailand ............................................................................................. 45
Photo 8 Wooden school building, Philippines ........................................................................................... 45
Photo 9 Broken window, South Africa ....................................................................................................... 45
Photo 10 Burning trash on school grounds, Nicaragua ............................................................................ 45
Photo 11 Spacious and well-lit classroom, Thailand ................................................................................ 48
Photo 12 Classroom reading corner, Guyana ........................................................................................... 48
Photo 13 Classroom with traditional desk arrangement, Nigeria .............................................................. 48
Photo 14 Crowded classroom, South Africa ............................................................................................. 48
Photo 15 Restroom in disrepair, South Africa ........................................................................................... 55
Photo 16 Sanitary, functioning latrines, Nicaragua ................................................................................... 55
Photo 17 Sinks with no water, Nicaragua ................................................................................................. 55
Photo 18 Children washing hands, Nicaragua .......................................................................................... 55
Photo 19 Students receive de-worming treatment, Nigeria ...................................................................... 57
Photo 20 Parents prepare lunch for a parent-led feeding programme, South Africa ................................ 57
Photo 21 Parent prepares lunch for a parent-led feeding programme, Nicaragua ................................... 58
Photo 22 Reading garden, Cambodia ....................................................................................................... 62
Photo 23 Lecture-based instruction, Nicaragua ........................................................................................ 70
Photo 24 Teacher engaging students, Nigeria .......................................................................................... 70
Photo 25 Student-led instruction, Philippines .......................................................................................... 70
Photo 26 Students work in small group on a science project, Guyana .................................................... 70
Photo 27 Students collaborate on a poem, Nicaragua ............................................................................. 70
Photo 28 Students work in pairs, South Africa .......................................................................................... 70
Photo 29 Students play a mathematics game, South Africa ..................................................................... 71
Photo 30 School library, Thailand ............................................................................................................. 76
Photo 31 School library, Guyana .............................................................................................................. 76
Photo 32 Computer lab, Thailand ............................................................................................................. 76
Photo 33 Children clean their school, South Africa .................................................................................. 83
Photo 34 Student government information board, Guyana ...................................................................... 83
Photo 35 List of parent advisory board members, Nicaragua ................................................................... 88
Photo 36 Parent volunteers run feeding programme, Nicaragua ............................................................. 88

x
ACRONYMS
CEE/CIS Central and Eastern Europe and the Commonwealth of Independent States
CFSs Child Friendly Schools
CSCLE Challenging Student-Centred Learning Environment
DOE Department of Education
EAPR East Asia and the Pacific Region
EASO Education Area Support Office
EMIS Education Management Information System
ESAR Eastern and Southern Africa Region
GDP Gross Domestic Product
GNP Gross National Product
HLM Hierarchical Linear Modeling
INSET In-Service Education and Training
LAC Latin America and the Caribbean
LGU Local Government Unit
LRC Learning Resource Center
MDG Millennium Development Goals
MENA Middle East and Northern Africa
MOE Ministry of Education
NETRC National Education Testing and Research Center
OVC Orphans and Vulnerable Children
PLD Performance Level Descriptors
PPP Purchasing Power Parity
PTCA Parent Teacher Community Association
ROSA Region of South Asia
SAGEN Strategy for Accelerating Girls‘ Education in Nigeria
SBMC School-Based Management Committees
SEL Social and Emotional Learning
SIRC Safe, Inclusive and Respectful Climate
SSA Secondary Schooling Alternative
TACR The Americas and Caribbean Region
UNDP United Nations Development Programme
UNESCO United Nations Educational, Scientific and Cultural Organization
WACR West and Central Africa Region

viii
EXECUTIVE SUMMARY
UNICEF contracted with the American Institutes for Research (AIR) in January 2008 to conduct a global evaluation of the CFS initiative, which was to be built upon site visits to Child Friendly Schools in six countries. The evaluation study was set out to be a baseline that addressed the challenge of variability and examined inclusiveness, pedagogy, architecture and services, participation and governance, systemic management, and cost. Specifically, the evaluation was to address three questions, each of which had several objectives:
1
What are the underlying principles of CFS schools and what do they look like in practice? Data and analyses here were to assist UNICEF promulgate empirically grounded principles for CFS.
Does CFS programming realize UNICEF‘s objectives for ‗child-friendly schools‘? Data and analyses were meant to provide evidence for quality improvement and strategic planning.
Can UNICEF CFS programming have an impact at the national level? Data and analyses here were to provide evidence for the added-value of CFS implementation and its sustainability in the national context.
This Executive Summary briefly describes the evaluation approach and presents the main findings from the evaluation. Detailed results and recommendations are presented in the full CFS evaluation report.
Overview of Evaluation The evaluation utilized a mixed-methods design to determine whether the CFS framework could produce the type of school that its designers visualized, as described by Bernard (1999, cited in Chabbott 2004):
The value being added by the child-friendly school framework is precisely in its bringing together and attempting to integrate, conceptually and operationally, under the auspices of the CRC: (i) the well-established conditions and characteristics of effective, child-focused teaching and learning and (ii) the goals of sustainable human and child development, including health, protection from harm and peaceful participation. (p. 13)
In addition, the evaluation was designed to describe how CFS models have been implemented in multiple contexts to provide data on the extent to which the key principles of CFS—child-centredness, inclusiveness, and democratic participation—are being realized, to identify challenges, and to provide a baseline and create tools to monitor future progress. The evaluation consisted of 10 distinguishing features.
2 It:
employed site visits by teams – the data collection included one-day or two-day site visits by teams to approximately 25 schools in two or more regions/districts in each of the six countries—Nigeria, South Africa, the Philippines, Thailand, Guyana and Nicaragua. A total of 150 schools were visited;
focused on the range of schools – schools were selected to represent the range of CFS schools in terms of location, duration of implementation and demography;
employed randomization – students, teachers and families were randomly selected for interviews, focus groups and/or surveys, and the classrooms to be visited were randomly selected;
addressed phenomenological issues – the evaluation employed survey instruments to explore how a representative group of students and staff experienced the school;
balanced sensitivity to local context and analytical uniformity by combining AIR and local evaluators/data collectors;
1
Following the award of the contract to conduct the evaluation, UNICEF and AIR collaborated to refine the evaluation design to address UNICEF‘s priorities for this evaluation. 2
More detail about the evaluation methodology, including instruments, sampling, and analysis is provided in Appendix A.

ix
created and/or tailored instruments and scales to address the needs of the evaluation – AIR developed and/or customized 14 instruments and 17 reporting scales to meet the needs of the global evaluation;
combined quantitative, qualitative and visual data and employed Hierarchical Linear Modeling (HLM) to apply a rigorous standard to the patterns observed in the quantitative and qualitative data. This combination allowed triangulation of data from multiple sources, tested the consistency of findings obtained from different stakeholders and through different instruments, and the evaluation team was able to clarify and nuance the findings appropriately (Greene et al., 1994; Johnson & Onwuegbuzie, 2004);
employed a Delphi survey of UNICEF Education Officers to contextualize findings – a web-based modified Delphi survey was designed and administered to contextualize findings that were limited to two or more regions in six countries; and
drew on AIR‘s experience with CFS through other projects with UNICEF and on AIR internal experts.
Overarching Findings The site visits to six countries with different experiences implementing CFS, data collected from UNICEF Education Officers around the world implementing CFS, and a review of prior studies and literature on CFS demonstrated the following:
CFSs in varying contexts successfully apply the three key principles of CFS models—inclusiveness, child-centredness and democratic participation. Schools operating in very different national contexts, with different levels of resources and serving populations with different needs have succeeded in being child-centred, promoting democratic participation, and being inclusive. Schools that had high levels of family and community participation and use of child-centred pedagogical approaches had stronger conditions for learning, that is, students felt safer, supported and engaged, and believed that the adults in the school supported the inclusion and success of each student.
UNICEF Education Officers state that the CFS model is flexible, adaptable to different contexts, heuristic and broadly appropriate—that CFS is ―not a blueprint‖ and can be implemented in different ways with different levels of support depending on local needs.
The CFS initiative has been effective in engaging stakeholders at all levels of education systems in creating schools with conditions that reflect effective, child-focused teaching and learning, and in encouraging educators to think about how to serve the whole child. School heads and teachers across all countries we visited 'speak the language' of CFS. The conceptualization of CFS appears to be ―sticky‖ (Heath & Heath, 2007), helping stakeholders grasp the need to address the whole child in a manner that embodies the principles of inclusiveness, child-centredness, and democratic participation. In interviews with teachers we heard—with the exception of one school—universal support for CFS principles. They are enthusiastic in their support of the ideals of CFS and committed to striving to meet them, even in challenging circumstances. This speaks to the ability that CFS has to effectively engage stakeholders, an important element in implementing the CFS model. Often when asked, teachers, school heads and families who have some comparative perspective stated that CFS changed the way in which they and others thought about education.
The CFS initiative has provided Ministries of Education with a useful and relevant framework for improving education that promotes child development and is inclusive, participatory and responsive. Ministries support and have embraced, to varying degrees, the principles of CFS models. More than half (54 percent) of UNICEF Education Officers who responded to the Delphi survey reported that countries had integrated the CFS initiative into its education strategy.
For the most part, countries where CFS is more established are more successful than countries that began creating CFSs more recently or have not integrated the initiative as well into the Ministry‘s strategy. The Philippines and Thailand, countries that have been implementing CFS since the late 1990s and in which CFS is implemented as a national strategy for school reform, have many schools that realize the goals of CFS. Survey and observational data indicate schools‘ success in creating child-centred learning environments and teachers and parents attest to

x
changes in outcomes. In both of these countries the Ministry of Education has embraced the CFS framework—it is the education strategy, and other donors rally around the CFS model. Moreover, the UNICEF Regional Office has been a champion of CFS. At the other end of the spectrum, UNICEF only recently began supporting the CFS initiative in South Africa. Although the evaluation indicates that the CFS initiative in South Africa has many challenges to overcome, the objectives of CFS are integrated into the Ministry‘s education strategy.
UNICEF Education Officers indicate that UNICEF collects and uses data on CFS. However, we were not able to obtain school-level data related to key CFS objectives (e.g., attendance, dropout rates) for this evaluation from UNICEF country offices. This suggests that these data are not regularly collected or accessible to UNICEF country offices. In some cases national education management information systems may not be fully operational, or are not being maintained systematically.
Having insufficient resources was perceived by school staff as a challenge to being child-friendly. School heads and teachers felt hampered by lack of resources to support instruction—from instructional materials to trained teachers—and schools struggled to maintain the physical plant. Reports from UNICEF Education Officers who note the difficulty schools have with these issues, demonstrate that these challenges extend beyond the six countries visited. At the same time, UNICEF Education Officers pointed out that many aspects of the CFS model are not resource-intensive and can be implemented with little expense.
When implemented effectively, CFS realize UNICEF‘s objectives. Based on the six country site visits, secondary sources that put the country visits in a global context, and other work AIR has carried out in CFS, the evaluation found the following:
School heads, teachers, and parents in CFS view inclusiveness as a key principle of the CFS model and make efforts to include, encourage and support students, regardless of gender or background. Schools make concerted efforts to retain children in school, and reach out to children not in school—although there was variation across countries in how much effort schools make. CFS provide inclusive classroom environments in which teachers demonstrate similar expectations for, and equal treatment of, all students regardless of background. The CFS visited appear to be particularly successful in creating an environment where female students feel safe, supported and challenged.
The majority of schools provide safe and comfortable environments conducive to learning (e.g., structurally sound buildings and classrooms, students protected from dangers such as toxic materials, sufficiently ventilated classrooms). During school visits we observed many beautiful schools, classrooms and grounds—colourful murals, children‘s artwork, well-cared-for gardens, bright open spaces—that reflected the pride that students, teachers, staff, parents and the communities feel in their school and the extent to which they view such environments as important to being child-friendly. Most students feel that adults in their school provide important emotional supports and nearly all schools provide health education to support children‘s health and safety.
Most schools in the six countries are successful in creating an environment that conveys to students that learning is important and worthwhile, encourages students‘ active engagement, and promotes learning. Teachers in most of the six countries are using child-centred instructional techniques, are creating environments that encourage active learning as well as trust and respect, and convey an understanding of the principles of the CFS model regarding pedagogy. HLM analyses suggest that these child-centred pedagogies contribute to positive conditions for learning where students feel safe, respected and included, challenged, and supported.
There are high levels of student involvement in many schools; schools make substantial efforts to create a welcoming atmosphere for parents and encourage parent and community participation in school events and decision-making. HLM analyses suggest that family and community involvement (as reported by teachers) contributed to positive conditions for learning where students feel safe, respected and included, challenged, and supported.
HLM analyses suggest that CFSs have created an environment where female students feel included. For example, female students consistently rated the three dimensions of school climate higher than male students.

xi
There are, however, challenges to meeting UNICEF‘s objectives for CFSs. Based on the six country site visits, and informed by other work AIR has carried out in CFSs, the evaluation found the following:
Schools struggle to be fully inclusive, particularly in the case of students with disabilities. School buildings and grounds often do not easily accommodate students with physical disabilities, and school heads and teachers overwhelmingly report that they are not equipped to meet the needs of children with special needs (learning disabilities, developmental disabilities, etc.). UNICEF Education Officers also report that more must be done to strengthen schools‘ ability to be inclusive of and support all children. Few say that schools in their countries take concrete actions to make their schools inclusive; most say that teachers have insufficient training in supporting children with special needs.
Although CFSs in the six countries have been successful in creating welcoming classroom environments and providing academic and emotional support to children, they have been less successful in creating conditions in which many students feel emotionally and physically safe—factors which have been demonstrated to affect attendance, academic performance and school dropout. Male students felt less safe than female students, and fifth grade students
3 had
consistently lower perceptions of safety than did students in grades 6, 7 and 8. Students who reported having to miss school for work felt less safe than students who did not report having to miss school due to work obligations. Also, schools provided health education, but did not provide systematic Social Emotional Learning (SEL), which helps students learn to manage their health-related behaviour. In addition, many schools struggle to provide healthy school environments, particularly sanitary and safe latrines and potable water.
Observations and student and teacher reports suggest that many teachers in CFSs are using child-centred pedagogical approaches. However, teachers are not necessarily following the pedagogical approaches one would expect in a CFSs. School heads and teachers identified the lack of trained teachers who can implement child-centred instructional methods as a challenge in the six countries, and UNICEF Education Officers concurred that teachers do not have the training they need to implement CFS.
Although school heads, teachers and parents enthusiastically embrace the idea of parent and community involvement in schools, they also identified obstacles to involving them in meaningful ways. UNICEF Education Officers echoed this—more than two-thirds said that parents and the community do not take responsibility for implementing CFS principles and are not involved substantively in CFS. Moreover, less than 3 percent of UNICEF‘s CFS budget supports community involvement.
Although having well-built, safe schools that provide comfortable learning environments is important, this alone is not sufficient to make a school child-friendly. Our analysis shows that school architecture and architectural features do not predict school climate. Rather, it is other, less tangible aspects that determine whether a school is child-friendly—factors such as child-centredness, engaged parents and mutual respect among students and teachers. However, there is a great emphasis on architecture in CFS programming: 67 percent of UNICEF‘s CFS budget in the funding cycle is allocated to architecture.
4 School heads feel burdened by their inability to
maintain their facilities, while UNICEF Education Officers report that schools have difficulty attaining CFS‘s school facilities goals even though UNICEF provides funds, training and technical support in many countries.
In the following sections we present key findings that address the key principles of CFS—inclusiveness; child-centredness in terms of supporting students and creating healthy, safe and protective learning environments; child-centredness in terms of child-centred teaching and learning; and democratic participation, on a three-point scale – needs improvement, satisfactory or excellent. We then present
3
Students who responded to the survey were in grade 5 or higher; explained in the introduction, at the time of the evaluation the survey had not been adapted or validated for use with young populations but since has been. In this analysis, Primary is defined as grade 5, Middle is defined as grades 6-8, and Secondary is defined as grades 9-12. 4 A high proportion of funding in EAPR and ROSA was emergency relief funding earmarked for reconstruction efforts.

xii
findings from our analysis using HLM to determine the relationship between elements of CFS models and student outcomes (student perceptions of school climate) and findings from the cost analysis of CFS. Inclusiveness
For the most part, in schools implementing the CFS approach, school heads, teachers and
parents express a commitment to inclusiveness, view inclusiveness as a key element of the CFS model, and make efforts to include, encourage and support students, regardless of gender or background.
According to school heads, schools make efforts to reach out to children not in school to engage them and make efforts within school to retain them. However, variation exists across countries in how much effort schools make.
In five of the six countries, the majority of students feel physically and emotionally safe in school and that their schools are inclusive. Still, many students do not feel safe or feel that their schools are inclusive; 19-56 percent provided responses that resulted in a rating of 'needs improvement'. Female students have, on average across countries, more positive feelings about safety than male students.
Teachers are somewhat more positive than students in their assessment of the school climate. Across all countries school heads report that policies and conditions are largely in place to support a positive school climate.
Schools struggle to provide buildings, classrooms and grounds that are accessible to all students, particularly those with disabilities. This was especially the case in Nigeria, South Africa and Guyana where 26–56 percent of schools needed improvement on this dimension.
Schools appear to be more successful at providing inclusive classroom environments where teachers demonstrate similar expectations for and equal treatment of students regardless of background. In Thailand and the Philippines, more than 80 percent of classrooms were deemed excellent on this dimension and in Nigeria, South Africa, Guyana and Nicaragua, 87 percent or more classrooms were judged to be satisfactory or excellent in terms of being inclusive.
HLM analyses suggest that students feel safer, supported and engaged, and believe that the adults in the school support the inclusion and success of all students when schools have high levels of family and community participation and use of child-centred pedagogical approaches. School heads and teachers identify few obstacles to gender inclusiveness and equality. Classroom observations did not find obvious bias, although some observations and interview data suggest that gender stereotyping is in practice.
Schools in all countries make fewer efforts to reach out to children with disabilities in the community than to children from minority groups, students living in poverty, or others at risk for poor educational outcomes.
School head survey responses, classroom observations, and interviews conducted with school heads, teachers and parents, indicate that school heads and teachers feel that serving students with disabilities is an enormous challenge for which they are not equipped.
These findings are consistent with a multitude of recent studies on the ways in which CFSs promote inclusiveness, respect and respond to diversity, and provide equal access to free, high quality educational opportunities for all children. Both these studies and the Delphi survey of UNICEF Education Officers suggest that although inclusive education and awareness of disability rights is an increasingly prominent theme in some countries, it is not so in all countries, and even in the countries where it is, only some CFSs were successful in their attempts to recruit and integrate children with disabilities. Previous evaluations also suggest that MOEs, UNICEF and schools can promote inclusiveness in several ways, ranging from community mobilization to teacher training programmes.
Child-Centredness: Supporting children and creating healthy, safe and protective learning environments
About two-thirds or more of the schools visited in each country had physical environments that
met at least minimum standards for providing safe and comfortable environments conducive to

xiii
learning (e.g., structurally sound buildings and classrooms, students protected from dangers such as toxic materials, sufficiently ventilated classrooms). However, school heads, teachers and parents reported pervasive challenges maintaining school buildings and grounds and in some schools reported severe problems related to security, such as vandalism.
Eighty-four percent of students stated that they 'feel safe at my school', but with between 15 and 52 percent of students feeling physically and emotionally unsafe, results on the Emotional and Physical Safety scale were mixed.
More than two-thirds of students in each country feel that adults in their schools provide important supports; students feel adults listen to, care about and help them.
In most countries nearly all schools met minimum requirements or better for providing safe and sanitary conditions. However, there is wide variation in the availability of services to support students‘ health and hygiene, and some schools are struggling to meet the basic needs, such as providing consistent access to drinking water, which was unavailable in 16 percent of schools across countries and in as many as 30 percent of schools within a country.
In all countries, school feeding programmes were cited as a key service to promote inclusion and student engagement and learning, but such programmes are not available in 30 percent of schools across countries and in as many as 65 percent of schools within some countries.
Nearly all schools across the six countries provide health education to students to support healthy living and develop positive social and emotional skills. However, there is much variation in how life skills education is implemented and there was little evidence of intentional SEL.
Results from the Delphi survey of UNICEF Education Officers suggest that UNICEF‘s advocacy and commitment to supporting students and creating healthy, safe and protective learning environments is high, yet it is a challenging principle to fully realize. In some places the challenge is providing necessary facilities to facilitate health and hygiene while in others the material supports are there, but changing behaviours is a challenge.
These findings are consistent with multiple evaluations of the degree to which learning environments are healthy, safe and protective, that have been conducted in recent years across geographic regions. These studies suggest that the primary foci of CFS initiatives within countries have often been on improvement to the physical plant, consistent provision of a safe water supply, and expanded sanitation and hygiene services, such as constructing sanitary latrines, providing hand-washing facilities next to areas where food is prepared and ensuring that school grounds are kept free of garbage and other contamination sources. Evaluations of CFSs also suggest that without parental and community involvement, many of the physical improvements observed would not be feasible.
Child-centredness: Child-centred teaching and learning
Most schools in the six countries are successful in creating an environment that conveys to
students that learning is important and worthwhile, encourages students‘ active engagement, and promotes learning. Eighty-three to 96 percent of students reported satisfactory or excellent on the Challenging Student-centred Learning Environment scale.
Classroom observations across the six countries found that teachers are using child-centred instructional techniques and are creating an environment that encourages trust and respect. Across five of the six countries, all classrooms were satisfactory or excellent on this dimension.
The use of child-centred pedagogies was statistically associated in a positive manner with higher students‘ perceptions of school climate. During teacher focus group discussions, teachers in all countries demonstrated an understanding of the fundamental principles of the CFS model regarding pedagogy and shared that there has been a shift from teacher-centred to student-centred, active learning with the implementation of the CFS model. However, traditional notions of effective instruction persist.
The success of CFSs in meeting teachers‘ needs regarding professional development and resources is mixed, although generally encouraging. In surveys, teachers report that opportunities for professional development and support are sufficient, but discussions with teachers and school heads indicate that there is a dearth of well-trained teachers.
xiv
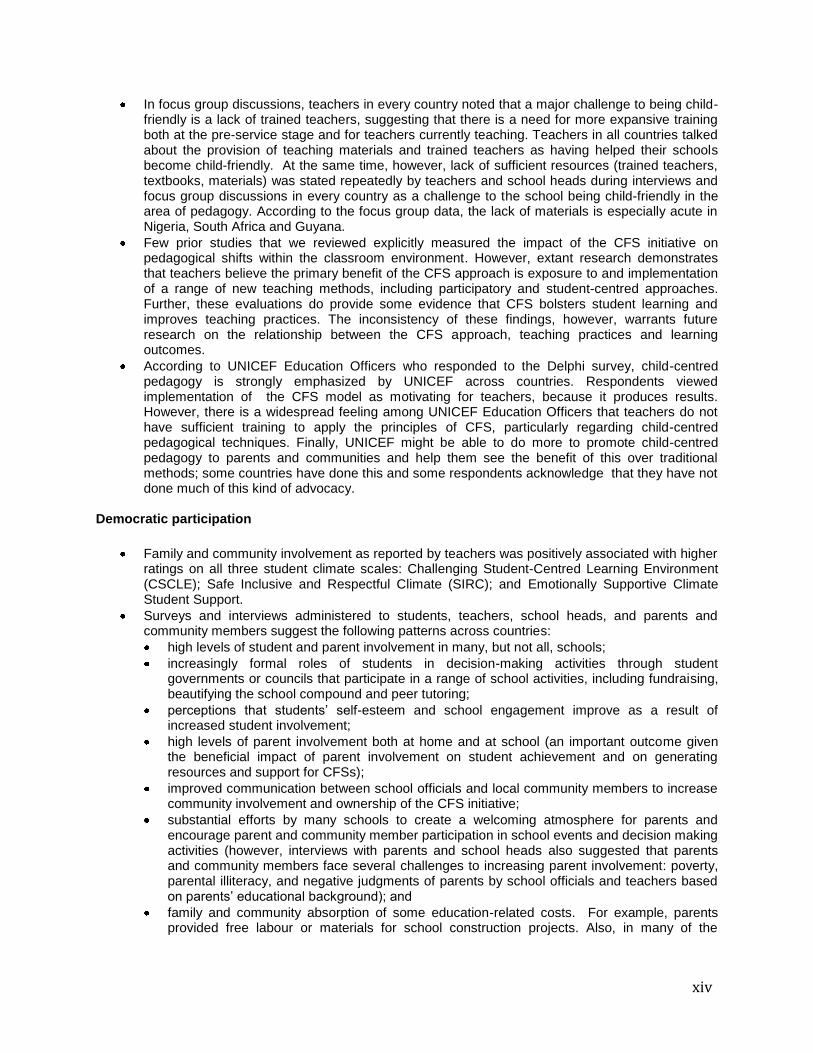
In focus group discussions, teachers in every country noted that a major challenge to being child-friendly is a lack of trained teachers, suggesting that there is a need for more expansive training both at the pre-service stage and for teachers currently teaching. Teachers in all countries talked about the provision of teaching materials and trained teachers as having helped their schools become child-friendly. At the same time, however, lack of sufficient resources (trained teachers, textbooks, materials) was stated repeatedly by teachers and school heads during interviews and focus group discussions in every country as a challenge to the school being child-friendly in the area of pedagogy. According to the focus group data, the lack of materials is especially acute in Nigeria, South Africa and Guyana.
Few prior studies that we reviewed explicitly measured the impact of the CFS initiative on pedagogical shifts within the classroom environment. However, extant research demonstrates that teachers believe the primary benefit of the CFS approach is exposure to and implementation of a range of new teaching methods, including participatory and student-centred approaches. Further, these evaluations do provide some evidence that CFS bolsters student learning and improves teaching practices. The inconsistency of these findings, however, warrants future research on the relationship between the CFS approach, teaching practices and learning outcomes.
According to UNICEF Education Officers who responded to the Delphi survey, child-centred pedagogy is strongly emphasized by UNICEF across countries. Respondents viewed implementation of the CFS model as motivating for teachers, because it produces results. However, there is a widespread feeling among UNICEF Education Officers that teachers do not have sufficient training to apply the principles of CFS, particularly regarding child-centred pedagogical techniques. Finally, UNICEF might be able to do more to promote child-centred pedagogy to parents and communities and help them see the benefit of this over traditional methods; some countries have done this and some respondents acknowledge that they have not done much of this kind of advocacy.
Democratic participation
Family and community involvement as reported by teachers was positively associated with higher
ratings on all three student climate scales: Challenging Student-Centred Learning Environment (CSCLE); Safe Inclusive and Respectful Climate (SIRC); and Emotionally Supportive Climate Student Support.
Surveys and interviews administered to students, teachers, school heads, and parents and community members suggest the following patterns across countries:
high levels of student and parent involvement in many, but not all, schools;
increasingly formal roles of students in decision-making activities through student governments or councils that participate in a range of school activities, including fundraising, beautifying the school compound and peer tutoring;
perceptions that students‘ self-esteem and school engagement improve as a result of increased student involvement;
high levels of parent involvement both at home and at school (an important outcome given the beneficial impact of parent involvement on student achievement and on generating resources and support for CFSs);
improved communication between school officials and local community members to increase community involvement and ownership of the CFS initiative;
substantial efforts by many schools to create a welcoming atmosphere for parents and encourage parent and community member participation in school events and decision making activities (however, interviews with parents and school heads also suggested that parents and community members face several challenges to increasing parent involvement: poverty, parental illiteracy, and negative judgments of parents by school officials and teachers based on parents‘ educational background); and
family and community absorption of some education-related costs. For example, parents provided free labour or materials for school construction projects. Also, in many of the

xv
schools visited in this sample—especially in Thailand and the Philippines—parents (often mothers) cooked simple and nutritious meals for the school feeding programme.
Previously conducted research on CFS consistently points to the increased involvement of students in their education and the powerful influence of family and community involvement on the degree to which schools were able to implement and sustain the CFS approach.
UNICEF Education Officers responding to the Delphi survey reported that community ownership of the school hinges on the strength and vision of the school head and that the school head is, more broadly, the key to the success of the school. Respondents suggest, though, that having other supports in place, such as trained school committee members, can ensure that responsibility for a school‘s success is not concentrated in one person, reiterating the importance of family and community involvement in school management. UNICEF Education Officers felt that parents and community members could contribute in more meaningful ways than they typically do.
Relationship between CFS and student outcomes Patterns across CFS programming elements
Two aspects of CFS were positively associated with higher ratings on all three dimensions of
students‘ perceptions of school climate—SIRC, CSCLE and Emotionally Supportive Climate: family and community involvement (as reported by teachers) and the use of child-centred pedagogy (as measured through classroom observations). This indicates that in schools that have high levels of family and community participation and use of child-centred pedagogical approaches, students have more positive perceptions of school climate.
Teachers‘ ratings of student involvement were positively associated with higher ratings on Emotionally Supportive Climate but were not significantly related to CSCLE. Mixed results were obtained in models predicting ratings on SIRC.
Inclusive classroom climate was not statistically associated with students‘ perceptions on SIRC, CSCLE, or Emotionally Supportive Climate.
Inclusiveness and safety at the school level were, in statistical terms, negatively associated with Emotionally Supportive Climate but not significantly associated with perceptions on SIRC or CSCLE.
Variables related to child-centredness in terms of student support and healthy, safe and protective learning environments were not statistically associated with student outcomes.
Having good grades was consistently associated with higher perceptions of academic and emotional support.
Students who reported earning excellent grades experienced the school environment as being safer, more respectful, inclusive, and emotionally and academically supportive than did students who reported poor or failing grades.
Patterns across student demographics
Female students consistently had higher perceptions on SIRC, CSCLE and Emotionally
Supportive Climate than male students.
Students who reported having to miss school for work had consistently lower perceptions on SIRC, CSCLE and Emotionally Supportive Climate than peers who did not report having to miss school due to work obligations.

xvi
Primary school students5 (grade 5) had consistently lower perceptions of SIRC and CSCLE,
although attending primary school was not significantly related to ratings on Emotionally Supportive Climate.
Middle, or lower secondary, school students (grades 6-8) had consistently higher perceptions of SIRC and Emotionally Supportive Climate, although attending middle school was not significantly related to ratings on CSCLE.
Having good grades was consistently associated with higher perceptions on CSCLE and Emotionally Supportive Climate but not on SIRC.
Having excellent grades was consistently associated with higher perceptions on SIRC, CSCLE and Emotionally Supportive Climate.
School characteristics
Neither urban locality nor years of implementation were statistically associated with students‘
perceptions. This finding must be interpreted cautiously, as it could be due to the small sample size. (Between 23 and 27 schools were sampled per country.) It is possible that there were not enough schools within each category (e.g., urban, rural) to demonstrate significant effects.
Effects of country 'membership' also differed across outcomes. Nicaraguan students had higher perceptions of SIRC; Filipino students had higher perceptions of CSCLE; and Thai students had higher perceptions of Emotionally Supportive Climate.
Cost analysis Findings from our global analysis of UNICEF’s chart of accounts
Funding for CFS increased substantially from 2006 to 2007 overall and in East Asia and the
Pacific Region (EAPR) and Eastern and Southern Africa Region (ESAR), and decreased in the Region of South Asia (ROSA).
Emergency resources constitute a significant portion of funding for CFS—36 percent globally and more than 50 percent in EAPR and ROSA.
EAPR spends more than any other region on CFS.
Sixty-seven percent of CFS funds are spent on supplies, equipment and construction. Findings from analysis of school-level data from the six countries
Expenditures on CFSs vary by country and variance relates closely to overall income inequality.
Where overall income variation is high, variation in per pupil expenditure is also high, except in South Africa where there is high variability in teacher wages.
In our analysis of school-level data from the six countries, we found that there were economies of scale—total expenditure per pupil decreases as school size increases. However, UNICEF‘s investments do not reflect this pattern—as school size increases UNICEF‘s proportional investment also increases.
Variance in UNICEF‘s expenditures on CFSs increased the longer schools received support.
5 Students who responded to the survey were in grade 5 or higher; explained in the introduction, at the time of the
evaluation the survey had not been adapted or validated for use with young populations but since has been . In this analysis, Primary is defined as grade 5, Middle is defined as grades 6-8, and Secondary is defined as grades 9-12.

xvii
Recommendations The evaluation recommended that UNICEF consider the following actions to improve CFS implementation and make schools child-friendly:
1. Focus on operationalizing the core principles of CFS by being clear about the underlying principles and providing concrete examples of what a CFSs looks like, and what it is not.
2. Include efforts to assess and enhance schools' and communities' readiness to implement CFS in implementation strategies, and where appropriate, extend the time line for the provision of training and technical assistance in order to help schools realize CFS principles.
3. Using the CFS principles, reconceptualise life skills to include a strong SEL component, and
provide for necessary adjustments to include intentional SEL and its assessment in programming for life-skills education.
4. Provide additional training for teachers to enable them to employ positive behavioural approaches
and child-centred pedagogies in a manner that enhances student learning and performance.
5. Improve the collection and use of data for monitoring, quality improvement and evaluation. For both school and subgroups, this would include data on attendance, attrition, achievement, conditions for learning, and how students perceive CFS.
The evaluation also recommended additional strategies to improve programming in post-conflict and transition countries, such as inclusion of a SEL component for teachers and students suffering from post-traumatic stress disorder. For middle income countries with high levels of income inequity, UNICEF was advised to target advocacy efforts and programming to pockets of poor and vulnerable children. A strategy recommended for UNICEF country officers was to use data-driven strategies to select programming priorities, including examining composite indices such as those contained in the Human Development Report, the Human Development Index, Human Poverty Index or Gender Empowerment Measure
6 when determining how to adapt and focus the CFS model.
6 See http://hdr.undp.org/en/statistics/

xviii
RESUME ANALYTIQUE L‘UNICEF a conclu un accord avec American Institutes for Research (AIR) en janvier 2008 pour se livrer à une évaluation mondiale de l‘initiative des écoles amies des enfants (EAE), qui devait être élaborée à partir de visites sur le terrain d‘écoles amies des enfants dans six pays. L‘étude d‘évaluation, amorcée comme de base de référence pour résoudre les problèmes posés par la variabilité, examinait l‘inclusion, la pédagogie, l‘architecture et les services, la participation et la gouvernance, la gestion systémique et le coût. De façon plus spécifique, l‘évaluation devait traiter de trois questions, dont chacune avait plusieurs objectifs
7 :
Quels sont les principes sous-jacents des EAE et à quoi ressemblent-elles en fait ? Les données et analyses devaient ici aider l‘UNICEF à promulguer pour les EAE des principes enracinés dans l‘expérience.
La programmation des EAE réalise-t-elle les objectifs d‘« écoles amies des enfants » de l‘UNICEF ? Les données et analyses étaient destinées à fournir des éléments probants pour des améliorations de qualité et pour la planification stratégique.
La programmation des EAE par l‘UNICEF a-t-elle un impact au niveau national ? Les données et les analyses devaient ici fournir des éléments probants à l‘appui de la valeur ajoutée que présentent la mise en œuvre des EAE et sa durabilité dans le contexte national.
Ce résumé analytique décrit brièvement l‘approche d‘évaluation et en présente les principales conclusions. Des résultats et des recommandations détaillés sont présentés dans le rapport d‘évaluation complet des EAE. Vue d’ensemble de l’évaluation L‘évaluation a eu recours à une conception multiméthodes pour déterminer si le cadre des EAE pouvait produire la sorte d‘école que ses concepteurs avaient visualisée et qu‘a décrite Bernard (1999, cité dans Chabbott 2004):
La valeur qui est ajoutée au cadre des EAE repose précisément sur le fait de rassembler et la tentative d‘intégrer conceptuellement et opérationnellement, sous les auspices de la CDE : (i) les conditions et caractéristiques bien établies d‘un enseignement et d‘un apprentissage efficaces et axés sur les enfants, (ii) les buts du développement durable des êtres humains et notamment des enfants, plus précisément la santé, la protection contre le mal qui peut leur être infligé et la participation pacifique. (p. 13)
De plus, l‘évaluation était conçue pour décrire comment les modèles des EAE ont été mis en œuvre dans de multiples contextes pour fournir des données sur le degré auquel sont réalisés les principes essentiels des EAE -- orientation vers l‘enfant, inclusion et participation démocratique-- pour identifier les difficultés, et pour fournir une base de référence et créer des outils destinés à assurer le suivi des progrès futurs. L‘évaluation consistait en 10 caractéristiques distinctives
8 :
Elle avait recours à des visites menées sur le terrain par des équipes : la collecte de données comprenait des visites de un ou deux jours à environ 25 écoles d‘un minimum de deux régions ou districts dans chacun des six pays concernés : Nigéria, Afrique du Sud, Philippines, Thaïlande, Guyana et Nicaragua. 150 écoles au total ont été visitées.
Elle se concentrait sur l‘éventail des écoles concernées : des écoles ont été sélectionnées pour représenter l‘éventail des écoles concernées par l‘initiative des EAE en termes d‘emplacement géographique, de durée de mise en œuvre et de démographie.
Elle employait la randomisation : élèves, enseignants et familles ont été sélectionnés au hasard pour subir des entretiens et participer à des groupes de discussion ou à des sondages, et les classes à visiter ont été choisies au hasard.
7 À l’adjudication du contrat d’évaluation, l’UNICEF et AIR ont collaboré pour affiner la conception de l’évaluation de manière à
traiter des priorités de l’UNICEF pour cette évaluation. 8 Voir description plus détaillée de la méthodologie d’évaluation (dont instruments, échantillonnage et analyse) à l’appendice A.

xix
Elle traitait de questions phénoménologiques : l‘évaluation employait des instruments de sondage pour explorer comment un groupe représentatif d‘étudiants et d‘enseignants vivait l‘école.
Elle équilibrait la sensibilité au contexte local et l‘uniformité analytique en combinant les évaluateurs et agents de collecte de données locaux à ceux d‘AIR.
Elle créait ou adaptait des instruments et des échelles en fonction des besoins de l‘évaluation. AIR a élaboré ou personnalisé 14 instruments et 17 échelles de comptes rendus pour répondre aux besoins de l‘évaluation mondiale.
Elle combinait des données quantitatives, qualitatives et visuelles et employait la modélisation hiérarchique linéaire (MHL) pour appliquer des normes rigoureuses aux schémas observés dans les données quantitatives et qualitatives. Cette combinaison a permis la triangulation des données de multiples sources et testé la cohérence des conclusions obtenues auprès des diverses parties prenantes. Grâce à des instruments divers, l‘équipe d‘évaluation a pu clarifier et nuancer les conclusions de la manière appropriée (Greene et al., 1994; Johnson & Onwuegbuzie, 2004).
Elle employait un sondage Delphi auprès des spécialistes de l‘éducation de l‘UNICEF pour contextualiser les conclusions : un sondage Delphi modifié en ligne a été conçu et administré pour contextualiser les conclusions qui étaient limitées à un minimum de deux régions des six pays.
Elle a puisé dans l‘expérience qu‘avait AIR des EAE par le truchement d‘autres projets avec l‘UNICEF et dans les compétences des experts internes d‘AIR.
Conclusions capitales Les visites sur le terrain dans six pays qui avaient diverses expériences de la mise en œuvre des EAE, les données rassemblées auprès de spécialistes de l‘éducation de l‘UNICEF qui appliquaient l‘initiative des AEA dans le monde entier et un examen des études et documents publiés précédemment sur les EAE ont mis en lumière les réalités suivantes :
Les écoles amies des enfants de divers contextes appliquent avec succès les principes fondamentaux des modèles d‘EAE --inclusion, orientation vers l‘enfant et participation démocratique. Des écoles fonctionnant dans différents contextes nationaux, avec différents niveaux de ressources et au service de populations aux besoins différents ont réussi à être orientées vers l‘enfant, à promouvoir la participation démocratique et à être inclusives. Des écoles connaissant un niveau élevé de participation familiale et communautaire et utilisant des méthodes pédagogiques orientées vers l‘enfant étaient dotées de meilleures conditions d‘apprentissage, c‘est-à-dire que les élèves s‘y sentaient plus en sécurité, mieux soutenus et engagés, et ils croyaient que les adultes de l‘école soutenaient l‘inclusion et le succès de chaque élève.
Les spécialistes de l‘éducation de l‘UNICEF déclarent que le modèle des EAE est souple, adaptable à différents contextes, heuristique et généralement approprié, que les EAE ne sont pas « un parcours imposé » et peuvent être appliquées de différentes manières avec différents niveaux de soutien selon les besoins locaux.
L‘initiative des EAE a bien réussi à engager les parties prenantes de tous les niveaux des systèmes d‘éducation pour créer des écoles aux conditions reflétant un enseignement et un apprentissage efficaces et orientés vers l‘enfant, et pour encourager les éducateurs à penser à la manière dont ils puissent servir l‘enfant « pris dans sa globalité ». Les chefs d‘établissements et les enseignants de tous les pays que nous avons visités « parlent la langue » des EAE. La conceptualisation des EAE apparaît « sticky » (délicate), (Heath & Heath, 2007), aidant les

xx
parties prenantes à saisir le besoin de traiter de l‘enfant sous tous ses aspects d‘une façon qui incarne les principes d‘inclusion, d‘orientation vers l‘enfant et de participation démocratique. Lors des entretiens avec les enseignants, nous avons entendu, à l‘exception d‘une seule école, un soutien universel des principes des EAE. Ils sont enthousiastes dans leur soutien des idéaux des EAE et déterminés à les réaliser, même dans les situations difficiles. Cela stimule la capacité qu‘ont les EAE de motiver véritablement des parties prenantes, élément important pour mettre en œuvre le modèle des EAE. Souvent, lorsqu‘on le leur a demandé, les enseignants, les chefs d‘établissements et les familles qui avaient des éléments de comparaison ont déclaré que les EAE avaient changé la façon dont eux-mêmes et d‘autres considéraient l‘éducation.
L‘initiative des EAE a fourni aux ministères de l‘éducation un cadre utile et pertinent pour améliorer une éducation qui favorise le développement de l‘enfant et qui soit inclusive, participative et réceptive. Les ministères soutiennent et ont épousé à des degrés divers les principes des modèles d‘EAE. Plus de la moitié (54 %) des spécialistes de l‘éducation de l‘UNICEF qui ont participé au sondage Delphi ont signalé que les pays avaient intégré l‘initiative des EAE à leur stratégie d‘éducation.
Pour la plupart, les pays où les EAE sont mieux établies connaissent plus de réussite que ceux qui ont commencé à créer des écoles amies des enfants plus récemment ou qui n‘ont pas aussi bien intégré l‘initiative dans la stratégie du ministère. Les Philippines et la Thaïlande, pays qui pratiquent les EAE depuis la fin des années 1990 et dans lesquels l‘initiative des EAE est appliquée comme stratégie nationale de réforme scolaire, ont de nombreuses écoles qui réalisent les objectifs des EAE. Les données provenant de sondages et d‘observations indiquent que le succès rencontré par les écoles dans la création d‘environnements et enseignants et parents attestent des changements obtenus dans les résultats. Dans ces deux pays, les ministères de l‘éducation ont épousé le cadre des EAE : c‘est la stratégie de l‘éducation, et d‘autres bailleurs de fonds se rallient autour du modèle des EAE. En outre, le Bureau régional de l‘UNICEF y a soutenu la stratégie des EAE. À l‘autre bout de l‘échelle, comme en Afrique du Sud, l‘UNICEF n‘a commencé que récemment à soutenir l‘initiative des EAE. Bien que l‘évaluation indique que dans les écoles amies des enfants d‘Afrique du Sud il y a de nombreuses difficultés à surmonter, les objectifs des EAE sont intégrés à la stratégie du ministère de l‘éducation.
Les spécialistes de l‘éducation de l‘UNICEF indiquent que l‘UNICEF recueille et utilise des données sur les EAE. Toutefois, nous n‘avons pas été en mesure d‘obtenir des bureaux nationaux de l‘UNICEF de données scolaires liées aux objectifs essentiels des EAE (assiduité, taux d‘abandon scolaire) pour cette évaluation. Cela suggère que ces données ne sont pas régulièrement recueillies ou rendues accessibles par les bureaux nationaux de l‘UNICEF. Dans certains cas, il se peut que les systèmes informatiques de gestion de l‘éducation nationale ne soient pas pleinement opérationnels ou systématiquement entretenus.
L‘insuffisance des ressources a été perçue par le personnel scolaire comme un obstacle au développement d‘écoles amies des enfants. Les chefs d‘établissements et les enseignants se sont sentis handicapés par le manque de ressources de soutien pédagogique, que ce soit le matériel ou le personnel compétent, et les écoles avaient des difficultés à entretenir leurs locaux. Des rapports de spécialistes de l‘éducation de l‘UNICEF qui notent les difficultés rencontrées par les écoles sur ces questions montrent que ces problèmes dépassent le cadre des six pays visités. En même temps, les spécialistes de l‘éducation de l‘UNICEF ont fait remarquer que de nombreux aspects du modèle des EAE ne demandaient pas beaucoup de ressources et pouvaient être appliqués à peu de frais.
Lorsque le modèle des EAE est appliqué efficacement, les écoles amies des enfants réalisent les objectifs de l‘UNICEF. Sur la base des six visites de pays sur le terrain, des sources secondaires mettant les visites de ces pays dans un contexte mondial et d‘autres travaux menés par AIR dans les écoles amies des enfants, l‘évaluation s‘est aperçue que :

xxi
Les chefs d‘établissements, les enfants et les parents des écoles amies des enfants considèrent l‘inclusion comme un principe essentiel du modèle des EAE et font des efforts d‘inclusion, d‘encouragement et de soutien des enfants quels que soient leur sexe ou leur origine. Les écoles se mobilisent pour retenir les enfants et toucher ceux qui ne s‘y trouvent pas, bien que les efforts déployés varient d‘un pays à l‘autre. Les écoles amies des enfants fournissent un environnement scolaire inclusif dans lequel les enseignants démontrent des attentes comparables et un traitement égal pour tous les élèves, indépendamment de leur origine. Les écoles amies des enfants visitées ont l‘air de réussir particulièrement bien à créer un environnement où les filles se sentent en sécurité, bien soutenues et stimulées.
Les écoles fournissent en majorité des environnements sûrs en confortables favorisant l‘apprentissage (bâtiments et salles de classes structurellement solides, élèves protégés de dangers comme les matériaux toxiques, ventilation suffisante dans les salles de classes). Au cours de nos visites, nous avons observé beaucoup d‘écoles, de salles de classes et de terrains agréables : peintures murales pittoresques, œuvres peintes par des enfants, jardins bien entretenus, qui reflétaient la fierté que les élèves, les enseignants, le personnel, les parents et les communautés éprouvaient à l‘égard de leurs écoles et à quel point ils considéraient ces environnements importants pour être amis des enfants. La plupart des élèves sentent que les adultes de leur école fournissent un soutien affectif important et presque toutes les écoles dispensent une éducation sanitaire pour renforcer la santé et la sécurité des enfants.
La plupart des écoles des six pays réussissent à créer un environnement qui communique aux élèves qu‘apprendre est important et utile, qui encourage la participation active des enfants et qui favorise l‘apprentissage. Les enseignants de la plupart des six pays utilisent des techniques d‘enseignement orientées vers l‘enfant, et créent des environnements qui encouragent l‘apprentissage actif ainsi que la confiance et le respect et communiquent leur compréhension des principes du modèle des EAE en ce qui concerne la pédagogie. Les analyses de MHL suggèrent que ces pédagogies orientées vers l‘enfant contribuent à des conditions d‘apprentissage positives où les élèves se sentent en sécurité, respectés et inclus, stimulés et soutenus.
Il y a des niveaux élevés de participation des élèves dans beaucoup d‘écoles; les écoles font de gros efforts pour créer une atmosphère conviviale pour les parents et encourager leur participation et celle de la communauté aux manifestations scolaires et au processus décisionnel. Les analyses de MHL suggèrent que la participation familiale et communautaire signalée par les enseignants a contribué à de bonnes conditions d‘apprentissage où les élèves se sentent en sécurité, respectés et inclus, stimulés et soutenus.
Les analyses de MHL suggèrent que les écoles amies des enfants ont créé un environnement où les filles se sentent incluses. Par exemple, les filles ont uniformément attribué aux trois dimensions du climat scolaire des notes plus élevées que les garçons.
Il y a toutefois des difficultés qui entravent la réalisation des objectifs de l‘UNICEF pour les écoles amies des enfants. Sur la base de nos visites sur le terrain dans les six pays concernés, et informée par d‘autres travaux qu‘AIR a menés dans les écoles amies des enfants, l‘évaluation a fait les constatations suivantes :
Les écoles ont des difficultés à être totalement inclusives, notamment dans le cas des élèves handicapés. Souvent, les bâtiments et les terrains sont mal adaptés aux élèves qui ont des déficiences physiques, et les chefs d‘établissements et les enseignants signalent dans leur écrasante majorité qu‘ils ne sont pas équipés pour répondre aux besoins d‘enfants qui ont des besoins particuliers (troubles d‘apprentissage ou du développement, etc.). Les spécialistes de l‘éducation de l‘UNICEF signalent également qu‘il faut en faire davantage pour renforcer la capacité qu‘ont les écoles d‘être inclusives et de soutenir tous les enfants. Peu d‘entre eux disent que les écoles de leur pays prennent des mesures concrètes pour rendre leurs écoles inclusives;

xxii
la plupart disent que les enseignants ne sont pas suffisamment formés pour soutenir des enfants qui ont des besoins particuliers.
Bien que les écoles amies des enfants des six pays aient bien réussi à créer des environnements scolaires conviviaux et à fournir aux enfants un soutien scolaire et affectif, elles ont moins bien réussi à créer les conditions dans lesquelles de nombreux élèves se sentent affectivement et physiquement en sécurité, facteurs dont on a prouvé qu‘ils affectaient l‘assiduité, le rendement scolaire et l‘abandon scolaire. Les garçons se sont sentis moins en sécurité que les filles, et les élèves de la cinquième année d‘enseignement
9 avaient uniformément une perception moins
favorable de la sécurité que les élèves des sixième, septième et huitième années.. Les élèves qui ont dit qu‘ils avaient dû manquer l‘école pour aller travailler se sentaient moins en sécurité que ceux qui n‘ont pas été contraints à l‘absentéisme en raison d‘obligations de travail. De plus, les écoles fournissent une éducation sanitaire, mais n‘ont pas prévu d‘enseignement socio-affectif systématique aux élèves qui apprennent à gérer leur comportement en matière de santé. Qui plus est, de nombreuses écoles ont du mal à fournir un environnement scolaire sain, notamment des latrines hygiéniques et sûres et de l‘eau potable.
Les observations et les rapports en provenance d‘élèves et d‘enseignants suggèrent que de nombreux enseignants des écoles amies des enfants utilisent des méthodes pédagogiques orientées vers l‘enfant. Toutefois, les enseignants ne suivent pas nécessairement les méthodes pédagogiques auxquelles on pourrait s‘attendre dans une école amie des enfants. Les chefs d‘établissements et les enseignants ont identifié le manque d‘enseignants formés qui puissent mettre en place des méthodes d‘éducation orientées vers l‘enfant comme un problème dans les six pays, et les spécialistes de l‘éducation de l‘UNICEF sont convenus que les enseignants n‘avaient pas la formation requise pour mettre en œuvre les écoles amies des enfants.
Bien que les chefs d‘établissements, les enseignants et les parents épousent avec enthousiasme l‘idée de la participation des parents et de la communauté dans les écoles, ils ont aussi identifié des obstacles qui entravent leur participation significative. Les spécialistes de l‘éducation de l‘UNICEF s‘en sont fait l‘écho : plus des deux tiers d‘entre eux ont dit que les parents et la communauté n‘acceptaient pas la responsabilité de mettre en œuvre les principes des écoles amies des enfants et que les parents ne s‘impliquaient pas de façon conséquente dans les écoles amies des enfants. De plus, moins de 3 pour cent du budget des EAE à l‘UNICEF sert de soutien à la participation communautaire.
Bien qu‘il soit important d‘avoir des écoles sûres qui fournissent un environnement d‘apprentissage confortable, cette condition ne suffit pas à elle seule pour faire d‘elles des écoles amies des enfants. Notre analyse démontre que l‘architecture et les caractéristiques architecturales des écoles n‘augurent pas du climat d‘une école; ce sont plutôt d‘autres aspects moins tangibles qui déterminent si une école est amie des enfants, des facteurs comme l‘orientation vers l‘enfant, la participation des parents et le respect mutuel chez les élèves et les enseignants. Toutefois, l‘accent est mis de façon importante sur l‘architecture dans la programmation des écoles amies des enfants : dans le cycle de financement, 67 pour cent du budget des EAE à l‘UNICEF est affecté à l‘architecture
10. Les chefs d‘établissements se sentent
accablés par leur incapacité à entretenir leurs installations, alors que les spécialistes de l‘éducation de l‘UNICEF signalent que les écoles ont des difficultés à atteindre les objectifs liés aux installations scolaires des EAE, même si l‘UNICEF fournit dans beaucoup de pays des fonds, des formations et du soutien technique.
9 Les élèves qui ont répondu au sondage étaient scolarisés en cinquième année ou au-dessus; comme cela est indiqué dans
l’introduction, au moment de l’évaluation le sondage n’avais pas été adapté ou validé pour être utilisé par les plus jeunes mais
cela s’est fait depuis lors. Dans cette analyse, le primaire va jusqu’à la cinquième année, le collège représente les trois années qui
suivent, et le lycée la 9e, 10e, 11e et 12e année. 10 Une proportion élevée du financement dans les régions de l’Asie orientale et du Pacifique et de l’Asie du Sud consistait en
financement des secours d’urgence et était affectée aux efforts de reconstruction.

xxiii
Dans les sections qui suivent, nous présentons les grandes conclusions répondant aux principes fondamentaux des EAE : inclusion, orientation vers l‘enfant en termes du soutien apporté aux élèves et de la création d‘environnements d‘apprentissage sains, sûrs et protecteurs, orientation vers l‘enfant en termes d‘enseignement et d‘apprentissage, et participation démocratique sur une échelle de 1 à 3 : Doit être améliorée, Satisfaisante et Excellente. Nous présentons ensuite les conclusions de notre analyse à partir d‘une modélisation hiérarchique linéaire pour déterminer la relation entre certains éléments des modèles des EAE et les réalisations des élèves (perceptions du climat scolaire par les élèves) et les conclusions tirées de l‘analyse du coût des EAE. Inclusion
En majeure partie, dans les écoles appliquant l‘approche des EAE, les chefs d‘établissements, les enseignants et les parents expriment leur attachement à l‘inclusion, la considèrent comme un élément essentiel des EAE et font des efforts pour inclure, encourager et soutenir les élèves, quels que soient leur sexe ou leur origine.
D‘après les chefs d‘établissements, les écoles font des efforts pour toucher les enfants non assidus ou non inscrits et tentent de les faire participer, puis de les retenir. Il existe toutefois des différences entre les pays quant à l‘intensité des efforts fournis.
Dans cinq des six pays, la majorité des élèves se sentent physiquement et affectivement en sécurité dans les écoles et pensent que leurs écoles sont inclusives. Toutefois, il y a encore beaucoup d‘élèves qui ne le pensent pas. De 19 à 56 % ont fourni des réponses de la catégorie Doit être améliorée. Dans l‘ensemble et pour tous les pays, les filles ont à l‘égard de la sécurité des sentiments plus positifs que les garçons.
Les enseignants sont un peu plus positifs que les élèves dans leur évaluation du climat scolaire. Dans tous les pays, les chefs d‘établissements signalent que les politiques et les conditions nécessaires sont largement en place pour soutenir un climat scolaire positif.
Les écoles ont du mal à fournir des bâtiments, des salles de classes et des terrains accessibles à tous les élèves, notamment les handicapés. C‘était particulièrement vrai dans le cas du Nigéria, de l‘Afrique du Sud et du Guyana, où 26 % à 56 % des écoles devaient être améliorées sur ce point.
Les écoles paraissent mieux réussir à fournir dans les classes des environnements inclusifs là où les enseignants démontrent des attentes analogues et un traitement égal des élèves quelle que soit leur origine. En Thaïlande et aux Philippines, plus de 80 pour cent des salles de classes ont été jugées excellentes sur ce point, et au Nigéria, en Afrique du Sud, au Guyana et au Nicaragua, 87 % des salles de classes ou davantage ont été jugées satisfaisantes ou excellentes quant à leur potentiel d‘inclusion.
Les analyses de MHL suggèrent que les élèves se sentent plus en sécurité, soutenus et motivés, et croient que les adultes de l‘école soutiennent l‘inclusion et le succès de tous les élèves, lorsque les écoles ont un degré élevé de participation familiale et communautaire et utilisent beaucoup les méthodes pédagogiques orientées vers l‘enfant. Les chefs d‘établissements et les enseignants identifient peu d‘obstacles à l‘inclusion et l‘égalité des sexes. Les observations effectuées dans les salles de classes n‘ont pas mis en évidence de partis pris évidents, bien que certaines observations et données d‘entretiens suggèrent la pratique du stéréotypage des sexes.
Les écoles de tous les pays font moins d‘efforts pour toucher les enfants handicapés dans la communauté que les enfants provenant de groupes minoritaires, les enfants vivant dans la pauvreté ou d‘autres exposés à de mauvais résultats scolaires.

xxiv
Les réponses des chefs d‘établissements aux sondages, les observations dans les salles de classes, les entretiens avec les chefs d‘établissements, les enseignants et les parents indiquent que, de l‘avis des chefs d‘établissements et des enseignants, répondre aux besoins des élèves handicapés est un défi énorme pour lequel ils ne sont pas équipés.
Ces conclusions sont corroborées par une multitude d‘études menées ces dernières années sur la manière dont les écoles amies des enfants favorisent l‘inclusion et le respect, répondent positivement à la diversité et donnent un accès égal à un enseignement gratuit de qualité pour tous les enfants. Les études comme le sondage Delphi suggèrent que bien que l‘éducation inclusive et la prise de conscience des droits des handicapés soient des thèmes de plus en plus au premier plan dans certains pays, ce n‘est pas le cas de tous, et même dans les pays où cela se vérifie, seules certaines écoles amies des enfants ont réussi à recruter et à intégrer des enfants handicapés. Des évaluations précédentes suggèrent que les ministères de l‘Éducation, l‘UNICEF et les écoles peuvent promouvoir l‘inclusion de diverses façons, qui vont de la mobilisation communautaire aux programmes de formation des enseignants.
L’orientation vers l’enfant : soutenir les enfants et créer des environnements d’apprentissage sains, sûrs et protecteurs
Environ les deux tiers ou plus des écoles visitées dans chaque pays avaient des environnements physiques qui répondaient au moins aux normes minimales d‘environnements sûrs et confortables propices à l‘apprentissage (bâtiments et salles de classes à structure solide, élèves protégés de dangers comme les matériaux toxiques, salles de classes suffisamment ventilées). Toutefois, les chefs d‘établissements, les enseignants et les parents ont signalé partout des difficultés d‘entretien des bâtiments et des terrains scolaires, et dans certaines écoles des problèmes sévères relevant de la sécurité, comme le vandalisme.
84 % des élèves ont déclaré qu‘ils « se sentaient en sécurité à l‘école », mais avec seulement entre 15 et 52 % qui ne se sentaient pas en sécurité physique et affective, les résultats ont été mitigés sur l‘échelle de la sécurité affective et physique.
Plus des deux tiers des élèves de chaque pays avaient l‘impression que les adultes de leur école fournissaient un soutien important; les élèves ont senti que les adultes les écoutaient, se souciaient d‘eux et les aidaient.
Dans la plupart des pays, presque toutes les écoles répondent au moins aux conditions minimales de sécurité et d‘hygiène. Toutefois, la disponibilité de services de soutien dans le domaine sanitaire et hygiénique présente de grandes variations, et certaines écoles ont du mal à répondre aux besoins de base comme l‘accès régulier à l‘eau potable, indisponible dans 16 % des écoles de tous les pays concernés, ce chiffre allant jusqu‘à 30 % dans l‘un d‘entre eux.
Dans tous les pays, les programmes alimentaires scolaires ont été cités comme un service fondamental pour promouvoir l‘inclusion et la participation et l‘apprentissage des élèves, mais ces programmes ne sont pas offerts dans 30 % des écoles des pays concernés, et jusqu‘à 65 % des écoles de certains pays.
Presque toutes les écoles des six pays fournissent une éducation en matière de santé aux élèves de façon à favoriser une vie saine et à développer des compétences sociales et affectives positives. Toutefois, il y a d‘amples variations dans la manière dont les aptitudes à la vie quotidienne sont enseignées, et il y a eu peu de signes d‘un apprentissage social et affectif délibéré.
Les résultats du sondage Delphi des spécialistes de l‘éducation de l‘UNICEF suggèrent que l‘UNICEF est très engagé dans le plaidoyer et le soutien des élèves par la création d‘environnements d‘apprentissage sains, sûrs et protecteurs, et pourtant c‘est un principe difficile

xxv
à appliquer totalement. À certains endroits, la difficulté consiste à fournir les installations nécessaires pour favoriser la santé et l‘hygiène, alors que dans d‘autres les soutiens matériels sont présents, mais c‘est le changement des comportements qui présente des difficultés.
Ces conclusions correspondent bien aux évaluations multiples menées ces dernières années dans toutes les régions géographiques pour déterminer à quel point ces environnements d‘apprentissage sont sains, sûrs et protecteurs. Ces études suggèrent que les pôles principaux des initiatives d‘EAE au sein des pays ont souvent été l‘amélioration des installations physiques, la capacité de fournir une source permanente d‘eau potable, et le développement des services d‘assainissement et d‘hygiène comme la construction de latrines saines, la mise en place d‘installations pour se laver les mains à proximité des secteurs où l‘on prépare la nourriture, et le maintien des ordures et autres sources de contamination à l‘écart des terrains scolaires. Les évaluations des écoles amies des enfants suggèrent également que sans participation parentale et communautaire, beaucoup des améliorations physiques observées ne seraient pas réalisables.
Orientation vers l’enfant : enseignement et apprentissage orientés vers l’enfant
La plupart des écoles des six pays réussissent bien à créer un environnement qui communique aux élèves que l‘apprentissage est important et en vaut la peine, qui encourage la participation active des élèves, et qui favorise l‘apprentissage. De 83 % à 96 % des élèves ont coché « Satisfaisant » sur l‘échelle « Environnement d‘apprentissage stimulant et orienté vers l‘élève ».
Les observations de classes dans les six pays ont prouvé que les enseignants utilisaient des techniques pédagogiques orientées vers l‘enfant et créaient un environnement encourageant la confiance et le respect. Dans cinq des six pays, toutes les salles de classes étaient satisfaisantes ou excellentes sur ce point.
Statistiquement, l‘utilisation de pédagogies orientées vers l‘enfant était associée de façon positive à des perceptions plus élogieuses du climat scolaire par les élèves. Au cours des discussions de groupe avec les enseignants, ces derniers ont démontré dans tous les pays une compréhension des principes fondamentaux du modèle des EAE pour ce qui avait trait à la pédagogie, et sont convenus qu‘avec la mise en place du modèle des EAE s‘était opéré un passage d‘un apprentissage orienté vers l‘enseignant à un apprentissage actif orienté vers l‘élève. Toutefois, les notions traditionnelles d‘enseignement efficace persistent.
La réalisation effective des besoins des enseignants en matière de perfectionnement professionnel et de ressources dans les écoles amies des enfants est mitigée, bien que généralement encourageante. Dans les sondages, les enseignants signalent que les occasions de perfectionnement et de soutien professionnels sont suffisantes, mais les discussions avec les enseignants et les chefs d‘établissements indiquent qu‘il y a une pénurie d‘enseignants bien formés.
Dans les discussions de groupes, les enseignants ont noté dans tous les pays qu‘une des difficultés principales à l‘initiative École amie des enfants était le manque d‘enseignants formés, suggérant qu‘il existait un besoin de formation plus vaste au stade qui précède le service d‘enseignement, de même que pour les enseignants actuellement en fonction. Les enseignants de tous les pays ont évoqué l‘octroi de matériel pédagogique et d‘enseignants formés comme un facteur contribuant à ce que leurs écoles soient amies des enfants. En même temps, toutefois, le manque de ressources en quantité suffisante (enseignants formés, manuels scolaires, matériel) ne cesse d‘être mentionné par les enseignants et les chefs d‘établissements au cours des entretiens et des discussions de groupes dans tous les pays comme un obstacle empêchant les écoles d‘être amies des enfants dans le secteur de la pédagogie. Selon les données des groupes de discussion, le manque de matériel est particulièrement critique au Nigéria, en Afrique du Sud et au Guyana.

xxvi
Bien que peu d‘études précédentes examinées par nos soins aient mesuré de façon explicite l‘impact des EAE sur les changements d‘orientation pédagogique au sein de l‘environnement scolaire, les travaux de recherche existants montrent que les enseignants croient que le principal avantage de l‘approche des EAE est de s‘exposer à toute une gamme de nouvelles méthodes d‘enseignement et d‘appliquer ces dernières, notamment les approches participatives et orientées vers l‘élève. De plus, ces évaluations fournissent bien la preuve que les EAE stimulent l‘apprentissage des élèves et améliorent les pratiques d‘enseignement. Le caractère disparate de ces conclusions justifie toutefois d‘autres recherches sur la relation entre l‘approche des EAE, les pratiques d‘enseignement et les réalisations de l‘apprentissage.
Selon les spécialistes de l‘éducation qui ont répondu au sondage Delphi, l‘UNICEF met fortement l‘accent sur la pédagogie orientée vers l‘enfant dans tous les pays. Les personnes interrogées considéraient l‘application du modèle des EAE motivante pour les enseignants parce qu‘elle produit des résultats. Toutefois, il y a le sentiment général parmi les spécialistes de l‘éducation de l‘UNICEF que les enseignants n‘ont pas une formation suffisante pour appliquer les principes des EAE, surtout pour ce qui est des techniques pédagogiques orientées vers l‘enfant. Enfin, l‘UNICEF pourrait être capable d‘en faire davantage pour promouvoir la pédagogie orientée vers l‘enfant auprès des parents et des communautés, et les aider à en voir les avantages par rapport aux méthodes traditionnelles; certains pays l‘ont fait, et certaines personnes interrogées reconnaissent qu‘elles ne se sont pas beaucoup adonnées à cette sorte de plaidoyer.
Participation démocratique
La participation des familles et des communautés signalée par les enseignants a été associée positivement à des notes plus élevées sur les trois échelles du climat chez les élèves : Environnement d‘apprentissage stimulant orienté vers l‘enfant, Climat sûr, inclusif et respectueux, et Soutien des élèves. Les sondages et entretiens administrés aux élèves, aux enseignants, aux chefs d‘établissements ainsi qu‘aux parents et aux membres de la communauté suggèrent les schémas suivants dans tous les pays :
des niveaux élevés de participation des élèves et des parents dans beaucoup d‘écoles mais pas toutes;
des rôles de plus en plus officiels attribués aux élèves dans les activités décisionnelles par le truchement de gouvernements ou de conseils d‘élèves prenant part à toute une série d‘activités scolaires, dont la collecte de fonds, l‘embellissement du complexe scolaire et l‘enseignement par les pairs;
la perception que l‘estime personnelle des élèves et l‘engagement de l‘école s‘améliorent à la suite d‘une participation accrue des élèves;
un niveau élevé de participation des parents à la maison comme à l‘école (résultats particulièrement important considérant l‘impact bénéfique de la participation des parents sur les succès scolaires des enfants et l‘obtention de ressources et de soutien pour les EAE);
une communication améliorée entre les autorités scolaires et les membres des communautés locales pour accroître la participation communautaire à l‘initiative des EAE et son appropriation par les communautés;
des efforts conséquents déployés par de nombreuses écoles pour créer une atmosphère accueillante pour les parents et encourager la participation des parents et des membres de la communauté aux manifestations scolaires et aux activités décisionnelles (toutefois, les entretiens avec les parents et des chefs d‘établissements ont également suggéré que les parents et les membres de la communauté devaient surmonter plusieurs obstacles qui freinent l‘accroissement de la participation des parents : la pauvreté, l‘analphabétisme des parents et des jugements
xxvii
négatifs sur les parents émis par les autorités solaires et les enseignants sur la base du niveau d‘éducation des parents);
l‘absorption par la famille et la communauté de certains coûts associés à l‘éducation. Par exemple, les parents ont fourni gratuitement du travail ou du matériel pour les projets de construction scolaires. De plus, dans de nombreuses écoles visitées dans cet échantillonnage, notamment en Thaïlande et aux Philippines, les parents (souvent les mères) ont cuisiné des repas simples et nutritifs pour le programme d‘alimentation scolaire.
Des recherches précédemment menées sur les EAE en arrivent uniformément à la constatation que les élèves s‘impliquent de plus en plus dans leur éducation et que la participation familiale et communautaire a une forte influence sur le degré auquel les écoles ont pu appliquer et maintenir l‘approche des EAE.
Les spécialistes de l‘éducation de l‘UNICEF répondant au sondage Delphi ont signalé que l‘appropriation communautaire des écoles reposait sur la force et la vision du chef d‘établissement et que c‘était lui qui, de façon plus générale, était la clé du succès de l‘école. Les personnes interrogées suggèrent toutefois qu‘avoir en place d‘autres soutiens comme des membres formés des comités scolaires pouvait être une garantie que la responsabilité du succès d‘une école ne se concentrait pas sur une seule personne, réitérant l‘importance de la participation familiale et communautaire à la gestion scolaire. Les spécialistes de l‘éducation de l‘UNICEF ont pensé que les parents et les membres de la communauté pouvaient contribuer de façon plus significative qu‘ils ne le font habituellement.
Relations entre les EAE et les résultats scolaires : schémas régissant les éléments de programmation des EAE
Deux aspects des écoles amies des enfants ont été positivement associés à des notes plus élevées dans les trois dimensions de la perception du climat scolaire par les élèves (Climat sûr, inclusif et respectueux, Environnement d‘apprentissage stimulant et orienté vers l‘élève, et Climat affectivement favorable) : la participation familiale et communautaire (signalée par les enseignants) et l‘utilisation d‘une psychologie orientée vers l‘enfant (mesurée par l‘observation de classe). Cela indique que dans les écoles au niveau élevé de participation familiale et communautaire qui utilisent des méthodes pédagogiques orientées vers l‘enfant, les élèves ont une perception plus positive du climat scolaire.
Les notes attribuées par les enseignants à la participation des élèves étaient positivement associées à des notes plus élevées pour la dimension Climat affectivement favorable, mais n‘étaient pas liées de façon significative à la dimension Environnement d‘apprentissage stimulant et orienté vers l‘élève. Des résultats mitigés ont été obtenus dans les modèles prédisant les notes qui seraient attribuées à la dimension Climat sûr, inclusif et respectueux.
Le climat inclusif de la classe n‘a pas été associé statistiquement à la perception par les élèves des trois dimensions (Climat sûr, inclusif et respectueux, Environnement d‘apprentissage stimulant et orienté vers l‘élève, et Climat affectivement favorable).
L‘inclusion et la sécurité au niveau de l‘école ont été, en termes statistiques, négativement associés au Climat affectivement favorable, mais pas associées de façon significative aux deux autres dimensions.
Les variables liées à l‘orientation vers l‘enfant en termes de Soutien des élèves et d‘Environnements sains, sûrs et protecteurs n‘ont pas été statistiquement associés aux résultats scolaires des élèves.

xxviii
Avoir de bonnes notes était uniformément associé à une perception plus positive du Soutien scolaire et affectif.
Les élèves qui ont indiqué avoir obtenu d‘excellentes notes ont ressenti l‘environnement scolaire comme plus sûr, plus respectueux, inclusif, et plus favorable des points de vue affectif et scolaire que les étudiants qui ont déclaré avoir eu de mauvaises notes ou dont les notes avaient baissé.
Relations entre les EAE et les résultats scolaires des élèves : schémas permanents dans la démographie des élèves
Les filles avaient uniformément une perception plus positive des trois dimensions que les
garçons.
Les élèves qui ont signalé qu‘ils ont dû manquer l‘école pour travailler avaient uniformément une perception plus négative des trois dimensions que leurs pairs qui n‘étaient pas dans cette situation.
Les élèves du primaire11
(cinquième année) avaient uniformément une perception moins positive des dimensions Climat sûr, inclusif et respectueux et Environnement d‘apprentissage stimulant et orienté vers l‘élève, alors qu‘aller à l‘école primaire n‘était pas lié de façon significative aux notes attribuées à la dimension Climat affectivement positif.
Les élèves de la première à la troisième année du secondaire avaient uniformément une perception plus positive des dimensions Climat sûr, inclusif et respectueux et Climat affectivement positif, mais être scolarisé à ce niveau n‘était pas significativement lié aux notes attribuées à la dimension Environnement d‘apprentissage stimulant et orienté vers l‘élève.
Le fait d‘avoir de bonnes notes était uniformément associé à une perception plus positive des dimensions Environnement d‘apprentissage stimulant et orienté vers l‘élève et Climat affectivement positif, mais pas de la dimension Climat sûr, inclusif et respectueux.
Le fait d‘avoir d‘excellentes notes était régulièrement associé à une perception plus positive des trois dimensions.
Relations entre les EAE et les résultats scolaires des élèves : caractéristiques des écoles
Ni les emplacements urbains ni les années de mise en œuvre n‘étaient statistiquement associés
à la perception des élèves. Cette constatation doit être interprétée avec prudence car elle pourrait être due à la petite taille de l‘échantillonnage (de 23 à 27 écoles par pays). Il est possible qu‘il n‘y ait pas eu suffisamment d‘écoles dans chaque catégorie (urbaine et rurale, par exemple) pour montrer des effets significatifs.
L‘origine nationale se traduisait par des résultats différents. Ainsi, les élèves du Nicaragua avaient une perception plus positive de la dimension Environnement d‘apprentissage stimulant et orienté vers l‘élève, les élèves des Philippines avaient une perception plus positive de la dimension Environnement d‘apprentissage stimulant et orienté vers l‘élève et les élèves thaïlandais de l‘aspect Climat affectivement positif.
11 Les élèves qui ont répondu au sondage étaient scolarisés dans la dernière année du primaire ou au-dessus; comme cela est
indiqué dans l’introduction, au moment de l’évaluation, le sondage n’avait pas été adapté ou validé pour être utilisé par les plus
jeunes mais cela s’est fait depuis lors. Dans cette analyse, le primaire va jusqu’à la cinquième année, le collège représente les
trois années qui suivent, et le lycée la 9e, 10e, 11e et 12e année.

xxix
Analyse de coût : constatations tirées de l’analyse mondiale du plan comptable de l’UNICEF
Le financement des EAE s‘est accru de façon substantielle de 2006 à 2007 dans l‘ensemble, et pour les régions de l‘UNICEF et pour celles de l‘Asie orientale et du Pacifique et de l‘Afrique de l‘Est et l‘Afrique australe, mais il a diminué dans l‘Asie du Sud.
Les ressources d‘urgence constituent une portion significative du financement des EAE, à raison de 36 % sur le plan mondial et plus de 50 % dans les régions de l‘Asie orientale et du Pacifique et de l‘Asie du Sud.
L‘Asie orientale et le Pacifique est une région qui dépense plus que toute autre pour les EAE.
67 % des fonds des EAE sont dépensés en approvisionnements, équipements et constructions.
Analyse de coût : conclusions des analyses des données de niveau scolaires de six pays
Les dépenses pour les EAE varient d‘un pays à l‘autre et les variations sont étroitement liées à
l‘inégalité générale des revenus. Là où les variations générales entre revenus sont élevées, les variations des dépenses par élève sont également élevées, sauf en Afrique du Sud, où il existe de grandes variations entre salaires d‘enseignants.
Dans notre analyse des données de niveau scolaire des six pays, nous avons découvert qu‘il existait des économies d‘échelle : plus les écoles sont grandes, plus les dépenses totales par élève sont faibles. Toutefois, les investissements de l‘UNICEF ne reflètent pas ce schéma : alors que la taille des écoles s‘accroît, les investissements proportionnels de l‘UNICEF s‘accroissent aussi.
Plus les écoles reçoivent longtemps le soutien de l‘UNICEF, plus l‘écart des dépenses de l‘UNICEF pour les écoles amies des enfants est grand.
Recommandations L‘évaluation a recommandé que l‘UNICEF envisage les actions suivantes pour améliorer la mise en œuvre des EAE et faire en sorte que les écoles soient amies des enfants :
1. Mettre l‘accent sur l‘opérationnalisation des principes fondamentaux des EAE en étant clair sur leurs principes sous-jacents et en fournissant des exemples concrets de ce à quoi ressemblent les écoles amies des enfants et de ce à quoi elles ne ressemblent pas.
2. Intégrer aux stratégies d‘application des efforts destinés à évaluer et à améliorer la
réceptivité des écoles et des communautés à la mise en œuvre des EAE et, lorsque c‘est possible, prolonger l‘échéancier des prestations de formation et d‘aide technique afin d‘aider les écoles à réaliser les principes des EAE.
3. Se servant des principes des EAE, reconceptualiser les aptitudes à la vie quotidienne pour y
intégrer une composante SEL importante, et se livrer aux ajustements nécessaires pour inclure délibérément SEL et son évaluation de la programmation de l‘enseignement des aptitudes à la vie quotidienne.
4. Fournir une formation supplémentaire aux enseignants pour leur permettre d‘employer des
approches de comportement positives et des pédagogies orientées vers l‘enfant d‘une façon qui améliore l‘apprentissage et le rendement des élèves.
5. Améliorer la collecte et l‘utilisation des données dans des buts de suivi, d‘amélioration de la
qualité, et d‘évaluation. Pour les écoles comme pour les sous-groupes, cela comprendrait

xxx
des données relatives à l‘assiduité, l‘abandon scolaire, la réussite, les conditions d‘apprentissage et la perception des EAE par les élèves.
L‘évaluation a aussi recommandé des stratégies supplémentaires d‘amélioration de la programmation dans les pays d‘après-conflit ou de transition : inclusion d‘une composante d‘apprentissage affectif pour les enseignants et les élèves souffrant de troubles post-traumatiques. Pour les pays à revenu moyen qui ont un niveau élevé d‘iniquité de revenus, on a conseillé à l‘UNICEF de cibler ses efforts de plaidoyer et de programmation sur des catégories d‘enfants pauvres et vulnérables. Une stratégie recommandée pour les agents nationaux de l‘UNICEF est d‘utiliser des stratégies imposées par des données pour sélectionner les priorités de programmation : examiner par exemple les indices composés du Rapport mondial sur le développement humain, l‘Indice du développement humain, l‘indicateur de la pauvreté humaine ou l‘indicateur de l‘habilitation des femmes
12 au moment de déterminer comment adapter et
focaliser le modèle des Écoles amies des enfants.
12 Voir http://hdr.undp.org/en/statistics/

xxxi
RESUMEN EJECUTIVO UNICEF estableció en enero de 2009 un contrato con American Institutes for Research (AIR) para llevar a cabo una evaluación mundial de la iniciativa de las escuelas amigas de la infancia basada en visitas a los lugares donde está en marcha la iniciativa en seis países. El estudio se configuró como una base de referencia que abordó el problema de la variabilidad y examinó la capacidad de inclusión, la pedagogía, la arquitectura y los servicios, la participación y la gobernanza, la gestión sistémica, y el costo. Concretamente, la evaluación estaba concebida para abordar tres cuestiones, cada una de las cuales presentaba varios objetivos
13:
¿Cuáles son los principios fundamentales de las escuelas amigas de la infancia y cómo son en la práctica? Los datos y análisis en este caso debían ayudar a UNICEF a promulgar principios para las escuelas amigas de la infancia con una base empírica.
¿Cumple la programación de las escuelas amigas de la infancia con los objetivos de UNICEF en favor de unas ―escuelas amigas de la infancia‖? Los datos y análisis debían ayudar a suministrar pruebas para la mejora de la calidad y la planificación estratégica.
¿Puede la programación de las escuelas amigas de la infancia de UNICEF tener consecuencias en el ámbito nacional? Los datos y análisis debían ayudar a suministrar pruebas sobre el valor añadido de la puesta en marcha de las escuelas amigas de la infancia y su sostenibilidad en el contexto nacional.
Este Resumen Ejecutivo describe brevemente el enfoque de la evaluación y presenta las conclusiones principales de la misma. En el informe completo de la evaluación de las escuelas amigas de la infancia figura una información más completa de los resultados y las recomendaciones.
Panorama general de la evaluación La evaluación empleó un diseño con métodos combinados para establecer si el marco de las escuelas amigas de la infancia puede producir el tipo de escuela que concibieron sus creadores, como lo describe Bernard (1999, citado en Chabbott 2004):
El valor que incorpora el marco de escuelas amigas de la infancia consiste precisamente en aunar y tratar de integrar de una forma conceptual y operacional, bajo los auspicios de la Convención sobre los Derechos del Niño, lo siguiente: (i) las condiciones y características bien establecidas de una enseñanza y un aprendizaje eficaces y centrados en el niño y (ii) los objetivos de un desarrollo sostenible del ser humano y del niño que incluyan la protección contra el daño y el fomento de la participación pacífica. (pág. 13)
Además, la evaluación estaba concebida para describir cómo los modelos de las escuelas amigas de la infancia se han aplicado en contextos múltiples para ofrecer datos sobre el alcance en que se ponen en práctica los principios básicos de las escuelas amigas de la infancia –enfoque en el niño, inclusión y participación democrática−, determinar los desafíos y ofrecer una base de referencia, y crear instrumentos para supervisar los progresos en el futuro. La evaluación constaba de 10 elementos diferenciados
14:
empleó visitas de equipos a los sitios: la recopilación de datos incluyó visitas de equipos de una duración de uno o dos días aproximadamente a 25 escuelas en dos o más regiones o distritos de los seis países: Nigeria, Sudáfrica, Filipinas, Tailandia, Guyana, y Nicaragua. Se visitaron un total de 150 escuelas;
se centró en toda la gama de escuelas: las escuelas se seleccionaron con la intención de que representaran toda la gama de las escuelas amigas de la infancia en lo que respecta a la ubicación, la duración de la ejecución y la demografía;
13 Después de escoger al candidato para realizar la evaluación, UNICEF y AIR colaboraron para refinar el diseño de la evaluación
a fin de abordar las prioridades de UNICEF para esta evaluación. 14 En el Apéndice A se ofrece más información sobre la metodología de la evaluación, incluidos los instrumentos, muestreo y
análisis.

xxxii
empleó una asignación aleatoria: los estudiantes, maestros y familias se seleccionaron al azar para las entrevistas, reuniones de grupo y/o cuestionarios, y las aulas que se visitaron se seleccionaron al azar;
abordó cuestiones fenomenológicas: la evaluación empleó instrumentos de encuesta para explorar la manera en que un grupo representativo de estudiantes y de personal experimentaban la escuela;
equilibró la sensibilidad hacia el contexto local y la uniformidad analítica mediante una combinación de evaluadores y recopiladores de datos de AIR y del medio local;
creó y/o adaptó instrumentos y escalas para abordar las necesidades de la evaluación. AIR desarrolló y/o personalizó 14 instrumentos y 17 escalas para satisfacer las necesidades de la evaluación mundial;
combinó datos cuantitativos, cualitativos y visuales y empleó el Modelo de Jerarquía Lineal para aplicar una norma rigurosa a las pautas observadas en los datos cuantitativos y cualitativos. Esta combinación facilitó la triangulación de los datos de fuentes múltiples, puso a prueba la uniformidad de las conclusiones obtenidas a partir de diferentes partes interesadas y, por medio de distintos instrumentos, el equipo de evaluación pudo clarificar y sopesar apropiadamente las conclusiones (Greene et al., 1994; Johnson & Onwuegbuzie, 2004);
empleó una encuesta Delphi en la que participaron oficiales de educación de UNICEF para contextualizar las conclusiones: se diseñó y administró una encuesta para contextualizar conclusiones que estaban limitadas a dos o más regiones en seis países; y
se basó en la experiencia de AIR con las escuelas amigas de la infancia por medio de otros proyectos con UNICEF y de los expertos internos de AIR.
Conclusiones generales Las visitas a los sitios en seis países con experiencias diferentes en la ejecución de las escuelas amigas de la infancia, los datos recopilados entre los funcionarios de educación de UNICEF en todo el mundo que se dedican a poner en marcha escuelas amigas de la infancia, y un examen de los estudios y las publicaciones anteriores sobre las escuelas amigas de la infancia, demostraron lo siguiente:
Las escuelas amigas de la infancia aplican con éxito en distintos contextos los tres principios clave de los modelos de escuelas amigas de la infancia: inclusión, enfoque en el niño y participación democrática. Escuelas que actúan en contextos nacionales muy diferentes, con niveles diferentes de recursos y que prestan servicios a poblaciones con necesidades diferentes, han conseguido centrarse en el niño, promover la participación democrática y lograr la inclusión. Las escuelas con un alto nivel de participación de la familia y la comunidad, y que utilizan enfoques pedagógicos centrados en el niño, presentaban condiciones más sólidas para el aprendizaje, es decir, los estudiantes se sentían más seguros, con mayor apoyo y más comprometidos, y creían que los adultos de la escuela apoyaban la inclusión y el éxito de cada estudiante.
Los oficiales de educación de UNICEF indican que el modelo de escuelas amigas de la infancia es flexible, se adapta a contextos diferentes, es heurístico y es generalmente apropiado, es decir, que las escuelas amigas de la infancia no son ―un plan maestro‖ y que es posible ponerlas en marcha de maneras diferentes con niveles diferentes de apoyo según las necesidades locales.
La iniciativa de las escuelas amigas de la infancia ha demostrado su eficacia al comprometer a las partes interesadas a todos los niveles de los sistemas educativos en la creación de escuelas con condiciones que reflejan una enseñanza y aprendizaje eficaces y centrados en el niño, y al alentar a los educadores a pensar en cómo abordar la personalidad integral del niño. La conceptualización de las escuelas amigas de la infancia parece dejar huella (Heath & Heath, 2007), y ayuda a las partes interesadas a comprender la necesidad de abordar la personalidad integral del niño de forma que se abarquen los principios de la inclusión, el enfoque en el niño, y la participación democrática. En entrevistas con maestros hemos observado –con excepción de

xxxiii
una escuela− un apoyo universal a los principios de las escuelas amigas de la infancia. Los maestros muestran su entusiasmo en apoyo de los ideales de las escuelas amigas de la infancia y están comprometidos en tratar de alcanzarlos, incluso en circunstancias difíciles. Esto revela la capacidad de las escuelas amigas de la infancia para comprometer con eficacia a las partes interesadas, un elemento importante para poner en marcha el modelo de escuelas amigas de la infancia. A menudo, cuando se les preguntó, los maestros, directores de escuela y familias que tenían alguna perspectiva comparativa dijeron que las escuelas amigas de la infancia habían cambiado la forma en que ellos y otras personas consideraban la educación.
La iniciativa de las escuelas amigas de la infancia ha proporcionado a los Ministerios de Educación un marco útil y pertinente para mejorar una enseñanza que promueva el desarrollo del niño y que sea integrador, participativo y sensible. Los ministerios apoyan y han adoptado, en grados diferentes, los principios de los modelos de escuelas amigas de la infancia. Más de la mitad (54%) de los oficiales de educación de UNICEF que respondieron a la encuesta Delphi dijeron que los países han integrado la iniciativa de las escuelas amigas de la infancia en su estrategia educativa.
En su mayoría, los países donde las escuelas amigas de la infancia están más establecidas tienen más éxito que los países que comenzaron a crear escuelas amigas de la infancia más recientemente o que no han integrado la iniciativa en la estrategia del Ministerio. En Filipinas y Tailandia, países que han puesto en marcha escuelas amigas de la infancia desde finales de los años 1990 y donde las escuelas amigas de la infancia forman parte de la estrategia nacional para la reforma educativa, hay muchas escuelas que han logrado realizar los objetivos de las escuelas amigas de la infancia. Los datos de encuestas y las observaciones indican que el éxito de las escuelas en la creación de entornos educativos centrados en el niño y los maestros y progenitores revela que se han producido cambios en los resultados. En estos dos países, el Ministerio de Educación ha adoptado el marco de las escuelas amigas de la infancia: es la estrategia educativa, y otros donantes se unen en torno al modelo de escuelas amigas de la infancia. Además, la Oficina Regional de UNICEF ha promovido las escuelas amigas de la infancia. Por otra parte, en algunos países como Sudáfrica UNICEF ha comenzado sólo recientemente a prestar apoyo a la iniciativa de las escuelas amigas de la infancia. Aunque la evaluación indica que las escuelas amigas de la infancia de Sudáfrica tienen que resolver aún muchos problemas, los objetivos del modelo están integrados en la estrategia educativa del Ministerio.
Los oficiales de educación de UNICEF indican que UNICEF recopila y utiliza datos sobre las escuelas amigas de la infancia. Sin embargo, nosotros no pudimos obtener para esta evaluación datos a nivel de escuela relacionados con objetivos clave de las escuelas amigas de la infancia (por ejemplo, asistencia, tasas de abandono) de las oficinas de país de UNICEF. Esto sugiere que estos datos no se recopilan sistemáticamente o que las oficinas de país de UNICEF no tienen acceso a ellos. En algunos casos los sistemas de información de la gestión de la educación nacional no funcionan completamente o no se mantienen sistemáticamente.
El personal de las escuelas percibía que la insuficiencia en materia de recursos era un problema para establecer este tipo de escuelas. Los directores de escuela y los maestros se sentían limitados por la falta de recursos para apoyar la instrucción –desde materiales de instrucción a maestros capacitados− y las escuelas tenían dificultades para mantener las plantas. Los informes de los oficiales de educación de UNICEF que destacan las dificultades de las escuelas a este respecto demuestran que estos problemas no afectan solo a los seis países visitados. Al mismo tiempo, los oficiales de educación de UNICEF destacaron que muchos aspectos del modelo de escuelas amigas de la infancia no consumen recursos de forma intensiva y pueden ejecutarse con pocos gastos.
Cuando se aplican de forma eficaz, las escuelas amigas de la infancia cumplen con los objetivos de UNICEF. Sobre la base de las visitas a los seis países, de las fuentes secundarias que colocan en una
xxxiv
perspectiva general las visitas a los países y otra labor que AIR ha llevado a cabo en escuelas amigas de la infancia, la evaluación llegó a las siguientes conclusiones:
Los directores de escuela, los maestros y los progenitores en las escuelas amigas de la infancia consideran la inclusión como un principio clave del modelo y hacen esfuerzos encaminados a incluir, alentar y apoyar a los estudiantes, independientemente de su género o sus antecedentes. Las escuelas realizan actividades concertadas para mantener a los niños en la escuela y llegar a los niños que no van a la escuela, aunque existe una variación entre los países sobre el alcance de los esfuerzos que deben hacer las escuelas. Las escuelas amigas de la infancia ofrecen entornos educativos integradores en los que los maestros demuestran tener las mismas expectativas para todos los estudiantes, a quienes también tratan del mismo modo, independientemente de sus antecedentes. Las escuelas amigas de la infancia visitadas parecen haber tenido un éxito especial en la creación de un entorno donde las estudiantes se sientan seguras, piensen que reciben apoyo y consideren que se les pone a prueba.
La mayoría de las escuelas ofrecen entornos seguros y cómodos que facilitan el aprendizaje (por ejemplo, edificios y aulas estructuralmente sólidos, estudiantes protegidos de peligros como materiales tóxicos, aulas suficientemente ventiladas). Durante las visitas a las escuelas observamos muchas escuelas, aulas y terrenos bonitos –murales de colores, arte producido por los alumnos, jardines bien cuidados, espacios luminosos y abiertos− que reflejan el orgullo que sienten por su escuela los estudiantes, los maestros, el personal, los progenitores y las comunidades, y el alcance en que consideran este tipo de entornos como importantes para que la escuela sea amiga de la infancia. La mayoría de los estudiantes consideran que los adultos de su escuela ofrecen un apoyo emocional importante y casi todas las escuelas ofrecen educación para la salud destinada a apoyar la salud y la seguridad de los alumnos.
La mayoría de las escuelas de los seis países han tenido éxito en la creación de entornos que trasmiten a los estudiantes que el aprendizaje es importante y valioso, alienta su participación activa y promueve el aprendizaje. En la mayoría de los seis países, los maestros utilizan técnicas de instrucción centradas en el niño y crean entornos que alientan un aprendizaje activo así como confianza y respeto, y trasmiten un conocimiento de los principios del modelo de escuelas amigas de la infancia con respecto a la pedagogía. Los análisis del Modelo de Jerarquía Lineal sugieren que estas pedagogías centradas en el niño contribuyen a crear condiciones positivas para el aprendizaje donde los estudiantes se sienten seguros, respetados e incluidos, estimulados y apoyados.
En muchas escuelas, los niveles de participación de los estudiantes son elevados; las escuelas hacen esfuerzos importantes para crear una atmósfera acogedora para los progenitores y alientan la participación de los progenitores y la comunidad en las actividades escolares y la toma de decisiones. Los análisis del Modelo de Jerarquía Lineal sugieren que la participación de la familia y la comunidad (según la información de los maestros) contribuye a crear condiciones positivas para un aprendizaje en el que los maestros se sienten seguros, respetados e incluidos, puestos a prueba y apoyados.
Los análisis del Modelo de Jerarquía Lineal sugieren que las Escuelas amigas de la infancia han creado un entorno en el que las estudiantes se sienten incluidas. Por ejemplo, las estudiantes califican uniformemente las tres dimensiones del clima escolar de manera más positiva que los estudiantes varones.
Sin embargo, hay desafíos para cumplir con los objetivos de UNICEF para las escuelas amigas de la infancia. Sobre la base de las seis visitas a los sitios en los países, y teniendo cuenta otros trabajos que AIR ha llevado a cabo en escuelas amigas de la infancia, la evaluación llegó a las siguientes conclusiones:
Las escuelas tienen dificultades para ser plenamente integradoras, especialmente en el caso de los estudiantes con discapacidades. Los edificios y los terrenos escolares no acomodan con

xxxv
facilidad estudiantes con discapacidades físicas, y los directores de escuela y los maestros informan de manera general que no están equipados para satisfacer las necesidades de los niños con necesidades especiales (discapacidades en el aprendizaje, discapacidades en el desarrollo, etc.). Los oficiales de educación de UNICEF informan también que es preciso adoptar más medidas a fin de reforzar la capacidad de las escuelas para integrar y apoyar a todos los niños. Pocos dicen que las escuelas en sus países adoptan medidas concretas para lograr que sus escuelas sean más integradoras; la mayoría dice que los maestros no reciben la suficiente capacitación para apoyar a los niños con necesidades especiales.
Aunque las escuelas amigas de la infancia en los seis países han tenido éxito en la creación de entornos pedagógicos acogedores y en proporcionar apoyo académico y emocional a los niños, han tenido menos éxito en la creación de condiciones en las cuales una mayoría de estudiantes se sientan seguros emocional y físicamente, factores que se ha demostrado que afectan la asistencia, el rendimiento académico y el abandono escolar. Los estudiantes varones se sienten menos seguros que las estudiantes y los estudiantes de quinto grado
15 tienen una percepción
más baja de la seguridad que los estudiantes de los grados 6, 7 y 8. Los estudiantes que informaron que habían tenido que abandonar la escuela para trabajar se sentían menos seguros que los estudiantes que no informaron haber tenido que abandonar la escuela debido a sus obligaciones laborales. Además, las escuelas ofrecen educación sobre la salud, pero no proporcionan un aprendizaje sistemático social y emocional para que los estudiantes aprendan a gestionar su conducta en relación con la salud. Además, muchas escuelas tratan de proporcionar un entorno escolar saludable, especialmente letrinas higiénicas y seguras y agua potable.
Las observaciones y los informes de los estudiantes y los maestros sugieren que muchos maestros de las escuelas amigas de la infancia están utilizando enfoques pedagógicos centrados en el niño. Sin embargo, los maestros no están siguiendo necesariamente los enfoques pedagógicos que deberían utilizarse en una escuela amiga de la infancia. Los directores de escuela y los maestros indican que la falta de maestros capacitados que puedan utilizar métodos de instrucción centrados en el niño es un problema en los seis países, y los oficiales de educación de UNICEF están de acuerdo en que los maestros no disponen de la capacidad que necesitan para poner en marcha escuelas amigas de la infancia.
Aunque los directores de escuela, los maestros y los progenitores acogen con entusiasmo la idea de la participación de los progenitores y la comunidad en las escuelas, también indicaron obstáculos que les impiden participar de manera significativa. Los oficiales de educación de UNICEF se hicieron eco de esta idea y más de dos terceras partes dijeron que los progenitores y la comunidad no se responsabilizan de poner en práctica los principios de las escuelas amigas de la infancia y que había progenitores que no participan de forma sustantiva en las escuelas amigas de la infancia. Además, menos del 3% del presupuesto de UNICEF para las escuelas amigas de la infancia sirve para apoyar la participación de la comunidad.
Aunque el disponer de escuelas bien construidas y seguras que proporcionen entornos confortables para el aprendizaje es importante, no es por sí solo suficiente para lograr que una escuela sea amiga de la infancia. Nuestro análisis indica que la arquitectura y las características arquitectónicas no predicen el clima de la escuela. En lugar de ello, son otros aspectos menos tangibles los que determinan si las escuelas son amigas de la infancia, factores como una enseñanza centrada en el niño, progenitores involucrados y respeto mutuo entre los estudiantes y los maestros. Sin embargo, en la programación de las escuelas amigas de la infancia se ha hecho un gran hincapié en la arquitectura: el 67% del presupuesto de UNICEF para las escuelas
15 Los estudiantes que respondieron a la encuesta se encontraban en el quinto grado o un grado superior; como se explicó en la
introducción, en el momento que se realizó la evaluación, la encuesta no se había adaptado o validado para su uso entre
poblaciones jóvenes, aunque sí se ha hecho desde entonces. En este análisis, la primaria se define hasta el quinto grado, la
enseñanza media del sexto al octavo grado y la enseñanza secundaria del noveno al duodécimo grado.

xxxvi
amigas de la infancia en el ciclo de financiación se asigna a la arquitectura16
. Los directores de escuela se sienten sobrecargados por su incapacidad para mantener sus instalaciones, mientras que los oficiales de educación de UNICEF informan que las escuelas tienen dificultades para lograr los objetivos de las escuelas amigas de la infancia relacionados con las instalaciones escolares, incluso a pesar de que UNICEF proporciona fondos, capacitación y apoyo técnico en muchos países.
En las secciones siguientes presentamos las conclusiones principales que abordan los principios clave de las escuelas amigas de la infancia: capacidad de inclusión; enfoque en el niño en el sentido de que se apoya a los estudiantes y se establecen entornos de aprendizaje saludables, seguros y protectores; enfoque en el niño en el sentido de que se ofrece una enseñanza y aprendizaje centrados en el niño; y participación democrática, en una escala de 3 puntos: necesita mejoras, satisfactorio o excelente. Posteriormente presentamos las conclusiones de nuestro análisis utilizando un modelo jerárquico lineal para determinar la relación entre los elementos de los modelos de escuelas amigas de la infancia y los resultados de los estudiantes (percepción del clima de la escuela por el estudiante) y conclusiones derivadas del análisis de los costos de las escuelas amigas de la infancia. Capacidad de inclusión
Por lo general, en las escuelas que ponen en práctica el enfoque de escuelas amigas de la infancia, los directores de escuela, los maestros y los progenitores expresan su compromiso con la inclusión, consideran la inclusión como un elemento fundamental del modelo de escuelas amigas de la infancia, y hacen todos los esfuerzos posibles encaminados a incluir, alentar y apoyar a los estudiantes, independientemente de su género o de sus antecedentes.
Según los directores de escuela, las escuelas hacen esfuerzos encaminados a llegar a los niños que no acuden a la escuela a fin de involucrarlos y hacen esfuerzos dentro de la escuela para mantenerlos. Sin embargo, existen variaciones entre los países sobre el alcance de los esfuerzos que deben hacerse.
En cinco de los seis países, la mayoría de los estudiantes se sienten física y emocionalmente seguros en la escuela y piensan que sus escuelas son integradoras. Sin embargo, muchos estudiantes no se sienten seguros ni sienten que sus escuelas sean integradoras; del 19% al 56% ofrecieron respuestas que dieron como resultado una calificación de ―necesita mejoras‖. Las estudiantes tienen, como promedio entre los países, más sentimientos positivos sobre la seguridad que los estudiantes varones.
Los maestros son en cierto modo más positivos que los estudiantes en su valoración del clima de la escuela. En todos los países, los directores de escuela informan que están en vigor las políticas y las condiciones necesarias para apoyar un clima escolar positivo.
Las escuelas tienen dificultades para proporcionar edificios, aulas y terrenos que sean accesibles a todos los estudiantes, especialmente a los que tienen discapacidades. Esto ocurrió especialmente en Nigeria, Sudáfrica y Guyana, donde del 26% al 56% de las escuelas necesitaban mejoras en esta dimensión.
Parece que las escuelas tienen más éxito a la hora de proporcionar entornos de aprendizaje integradores cuando los maestros demuestran expectativas similares sobre un tratamiento igualitario de los estudiantes independientemente de sus antecedentes. En Tailandia y Filipinas, más del 80% de las aulas se consideraron excelentes en esta dimensión, y en Nigeria, Sudáfrica,
16 Una elevada proporción de la financiación en EAPR y ROSA fue financiación de socorro de emergencia asignada a las
actividades de reconstrucción.

xxxvii
Guyana y Nicaragua se juzgó que el 87% o más de las aulas eran satisfactorias o excelentes en la dimensión de la inclusión.
Los análisis del Modelo de Jerarquía Lineal sugieren que los estudiantes se sienten más seguros, reciben más apoyo y participan más, y consideran que los adultos de la escuela apoyan la inclusión y el éxito de todos los estudiantes, cuando en las escuelas se produce un nivel alto de participación de la familia y de la comunidad y se utilizan enfoques pedagógicos centrados en el niño. Los directores de escuela y los maestros indican que hay pocos obstáculos a la inclusión e igualdad en materia de género. Las observaciones en las aulas no encontraron prejuicios obvios, aunque determinadas observaciones, y los datos de las entrevistas, sugieren que todavía existen estereotipos relacionados con el género.
Las escuelas en todos los países hacen menos esfuerzos para llegar a los niños con discapacidades de la comunidad que a los niños de los grupos minoritarios, los estudiantes que viven en la pobreza u otros que corren el riesgo de registrar resultados educativos deficientes.
Las respuestas a los cuestionarios de los directores de escuela, las observaciones en el aula y las entrevistas que se llevaron a cabo con los directores de escuela, los maestros y los progenitores indican que los directores de escuela y los maestros consideran que ofrecer servicios a los estudiantes con discapacidades es un problema considerable para el cual no están equipados.
Estas conclusiones guardan relación con numerosos estudios que se han llevado a cabo en los últimos años sobre la manera en que las escuelas amigas de la infancia promueven la inclusión, el respeto y responden a la diversidad, y ofrecen un acceso igualitario a oportunidades educativas gratuitas y de gran calidad para todos los niños. Tanto los estudios como la encuesta Delphi sugieren que aunque la educación integradora y la conciencia sobre los derechos de los discapacitados es un tema cada vez más prominente en algunos países, no lo es en todos los países, e incluso en los países donde sí lo es, solamente algunas escuelas amigas de la infancia tuvieron éxito en sus intentos encaminados a matricular e integrar a niños con discapacidades. Las evaluaciones anteriores sugieren también que los Ministerios de Educación, UNICEF y las escuelas pueden promover la inclusión de distintas maneras que van desde la movilización de la comunidad hasta los programas para la capacitación de maestros.
Enfoque en el niño: apoyar a los niños y crear entornos para el aprendizaje que sean saludables, seguros y protectores
Alrededor de dos terceras partes o más de las escuelas visitadas en cada país presentaban entornos físicos que cumplían por lo menos las normas mínimas para ofrecer entornos seguros y confortables que faciliten el aprendizaje (por ejemplo, edificios y aulas estructuralmente sólidos, estudiantes protegidos contra peligros como materias tóxicas, aulas suficientemente ventiladas). Sin embargo los directores de escuela, los maestros y los progenitores informaron sobre problemas arraigados para mantener los edificios y los terrenos de la escuela y en algunas escuelas informaron sobre graves problemas relacionados con la seguridad, como el vandalismo.
Un 84% de los estudiantes indicaron que ―me siento seguro en mi escuela‖, pero debido a que entre el 15% y el 52% de los estudiantes se sienten física y emocionalmente inseguros, los resultados en la escala de Seguridad Emocional y Física fueron diversos.
Más de dos terceras partes de los estudiantes de cada país sentían que los adultos de sus escuelas proporcionan apoyos importantes; los estudiantes sentían que los adultos les escuchaban, se ocupaban de ellos y les ayudaban.

xxxviii
En la mayoría de los países, casi todas las escuelas cumplían con requisitos mínimos o superiores para proporcionar condiciones seguras e higiénicas. Sin embargo, existe una variación amplia en la disponibilidad de servicios para prestar apoyo a la salud y la higiene de los estudiantes, y algunas escuelas tenían dificultades para cumplir con las necesidades básicas, como proporcionar un acceso constante al agua potable, que no estaba disponible en el 16% de las escuelas de los distintos países y en un 30% de las escuelas dentro de un país.
En todos los países, los programas de alimentación escolar fueron mencionados como un servicio clave para promover la inclusión y la participación y el aprendizaje del estudiante, pero estos programas no estaban disponibles en un 30% de las escuelas entre los países y en por lo menos un 65% de las escuelas en algunos países.
Casi todas las escuelas en los seis países proporcionaban educación sobre la salud a los estudiantes con el fin de fomentar el apoyo a una vida sana y desarrollar aptitudes sociales y emocionales positivas. Sin embargo, existe mucha variación en torno a la forma en que se aplica la educación para una vida práctica y hay muy pocas pruebas de una enseñanza social-emocional impartida de forma intencional.
Los resultados de la encuesta Delphi entre los oficiales de educación de UNICEF indican que la promoción y el compromiso de UNICEF en apoyo a los estudiantes y a la creación de entornos para el aprendizaje saludables, seguros y protectores son elevados, aunque llevarlos a cabo plenamente en la práctica es un principio de difícil aplicación. En algunos lugares el desafío consiste en proporcionar las instalaciones necesarias para facilitar la salud y la higiene, mientras que en otros se dan los apoyos materiales, pero cambiar los comportamientos es todavía un problema.
Estas conclusiones guardan relación con las evaluaciones múltiples sobre el alcance en que los entornos para el aprendizaje son sanos, seguros y protectores que se han llevado a cabo en los últimos años en diversas regiones geográficas. Estos estudios sugieren que el objetivo principal de las iniciativas de las escuelas amigas de la infancia dentro de los países se han centrado a menudo en la mejora de las plantas físicas, el abastecimiento constante de un suministro de agua potable y la ampliación de los servicios de saneamiento e higiene, como por ejemplo la construcción de letrinas sanitarias, la provisión de instalaciones para lavarse las manos cerca de las zonas donde se preparan los alimentos y garantizar que los terrenos escolares estén libres de basura o de otras fuentes de contaminación. Las evaluaciones de las escuelas amigas de la infancia indican también que sin la participación de los progenitores y de la comunidad, no sería posible realizar muchas de las mejoras físicas observadas.
Enfoque en el niño: enseñanza y aprendizaje centrados en el niño
La mayoría de las escuelas de los seis países ha tenido éxito en la creación de un entorno que exprese a los niños que el aprendizaje es importante y valioso, que aliente la participación activa de los estudiantes y promueva el aprendizaje. De un 83% a un 96% de los estudiantes respondieron ―satisfactorio‖ o ―excelente‖ en la escala ―Entorno para el aprendizaje centrado en el estudiante y estimulante‖.
Observaciones realizadas en el aula en los seis países revelaron que los maestros están utilizando técnicas de instrucción centradas en el niño y están creando un entorno que alienta la confianza y el respeto. En cinco de los seis países, todas las aulas mostraron índices satisfactorios o excelentes en esta dimensión.
La utilización de métodos pedagógicos centrados en el niño estaba asociada estadísticamente de manera positiva con una percepción más elevada del clima escolar por parte de los estudiantes. Durante debates de grupo con los maestros, los maestros de todos los países demostraron su comprensión de los principios fundamentales del modelo de escuelas amigas de

xxxix
la infancia en relación con la pedagogía y compartieron que desde la incorporación del modelo de escuelas amigas de la infancia se había producido una transformación en la enseñanza, que anteriormente se centraba en el maestro y ahora se centraba en el estudiante y en el aprendizaje activo. Sin embargo, persisten todavía nociones tradicionales sobre lo que debe ser una instrucción eficaz.
El éxito de las escuelas amigas de la infancia para satisfacer las necesidades de los maestros con respecto desarrollo profesional y los recursos varían, aunque los resultados son alentadores en general. En las encuestas, los maestros informaron que las oportunidades para el desarrollo profesional y el apoyo son suficientes, pero las conversaciones con los maestros y los directores de escuela indican que existe una falta de maestros bien capacitados.
En debates de grupo, los maestros de todos los países destacaron que uno de los principales problemas para lograr que la enseñanza sea amiga de la infancia es la falta de maestros capacitados, lo que sugiere que hay una necesidad de ampliar la capacitación antes del servicio y para los maestros que ya están enseñando. Los maestros de todos los países mencionaron la provisión de materiales pedagógicos y la capacitación de maestros como factores que contribuían a que las escuelas fueran amigas de la infancia. Al mismo tiempo, sin embargo, los maestros y los directores de escuela mencionaron una y otra vez la falta de recursos suficientes (maestros capacitados, libros de texto, materiales) durante las entrevistas y los debates del grupo en todos los países como un problema para que la escuela sea amiga de la infancia en la esfera de la pedagogía. Según los datos de los grupos de discusión, la falta de materiales es especialmente grave en Nigeria, Sudáfrica y Guyana.
Aunque pocos estudios anteriores analizados por los autores de este informe han medido explícitamente las repercusiones de la iniciativa de las escuelas amigas de la infancia sobre las transformaciones pedagógicas en el entorno del aprendizaje, las investigaciones realizadas hasta ahora demuestran que los maestros consideran que el beneficio primario del enfoque de las escuelas amigas de la infancia es la exposición a una gama de nuevos métodos de enseñanza y a su aplicación, entre ellos los enfoques participativos y centrados en el estudiante. Además, estas evaluaciones ofrecen algunas pruebas de que las escuelas amigas de la infancia impulsan el aprendizaje de los estudiantes y mejoran las prácticas pedagógicas. La falta de uniformidad de estas conclusiones, sin embargo, justifica que se realicen nuevas investigaciones sobre la relación entre el enfoque de las escuelas amigas de la infancia, las prácticas pedagógicas y los resultados en materia de aprendizaje.
Según los oficiales de educación de UNICEF que respondieron a la encuesta Delphi, UNICEF hace hincapié en todos los países en una pedagogía centrada en el niño. Los participantes en la encuesta consideraron que la puesta en práctica del modelo de escuelas amigas de la infancia motiva a los maestros porque produce resultados. Sin embargo, existe un sentimiento generalizado entre los oficiales de educación de UNICEF de que los maestros no tienen una capacitación suficiente para aplicar los principios de las escuelas amigas de la infancia, especialmente en las técnicas pedagógicas centradas en el niño. Finalmente, UNICEF podría lograr mejores resultados para promover una pedagogía centrada en el niño entre los progenitores y las comunidades y ayudarles a reconocer los beneficios de este método con respecto a los métodos tradicionales; esto ha ocurrido en algunos países y algunos participantes en la encuesta reconocen no haber realizado lo suficiente con respecto a este tipo de promoción.
Participación democrática
La participación de la familia y de la comunidad, según informaron los maestros, estaba asociada positivamente con una mejor clasificación en las tres escalas del clima escolar: Entorno para el aprendizaje centrado en el estudiante y estimulante; Clima seguro, integrador y respetuoso; y Apoyo al estudiante. Las encuestas y las entrevistas realizadas entre los estudiantes, los maestros, los directores de escuela y los progenitores y miembros de la comunidad indicaron las siguientes pautas en todos los países:

xl
un alto nivel de participación de los estudiantes y los progenitores en muchas escuelas, pero no en todas;
un aumento de la participación oficial de los estudiantes en las actividades para la toma de decisiones por medio de órganos estudiantiles de gobierno o consejos que participan en una serie de actividades escolares, entre ellas la recaudación de fondos, el mejoramiento de las instalaciones escolares y la instrucción entre pares;
percepciones de que la autoestima y el compromiso con la escuela de los estudiantes mejoran como resultado de un aumento de la participación del estudiante;
altos niveles de participación de los progenitores en el hogar y en la escuela (un resultado importante debido a las consecuencias beneficiosas de la participación del progenitor en el rendimiento del estudiante y en la generación de recursos y apoyo para las Escuelas amigas de la infancia);
una mejora de la comunicación entre los funcionarios de la escuela y los miembros de la comunidad local para aumentar la participación y la apropiación de la comunidad en relación con la iniciativa de las escuelas amigas de la infancia;
esfuerzos considerables realizados por muchas escuelas para crear una atmósfera acogedora para los progenitores y alentar la participación de los progenitores y los miembros de la comunidad en actividades escolares y en actividades de toma de decisiones (sin embargo, las entrevistas con los progenitores y los directores de escuela indican también que los progenitores y los miembros de la comunidad se encuentran con varios problemas para aumentar la participación de los progenitores: pobreza, analfabetismo y un juicio negativo de los progenitores por parte de los funcionarios de la escuela y los maestros sobre la base de los antecedentes educativos de los progenitores);
absorción por parte de la familia y de la comunidad de algunos de los costos relacionados con la educación. Por ejemplo, los progenitores ofrecieron mano de obra o materiales gratuitos para los proyectos de construcción de la escuela. Además, en muchas de las escuelas visitadas en esta muestra −especialmente en Tailandia y Filipinas− los progenitores (a menudo las madres) cocinaban alimentos simples y nutritivos para el programa de alimentación escolar.
las investigaciones realizadas anteriormente sobre las escuelas amigas de la infancia señalan uniformemente el aumento de la participación de los estudiantes en su educación y la poderosa influencia que tiene la participación de la familia y la comunidad en el grado en que las escuelas son capaces de poner en práctica y mantener el enfoque de las escuelas amigas de la infancia.
los oficiales de educación de UNICEF que respondieron a la encuesta Delphi informaron que la apropiación de la escuela por parte de la comunidad depende de la firmeza y de la visión del director de la escuela y que el director de la escuela es, más generalizadamente, el elemento clave para el éxito de la escuela. Los participantes en la encuesta indicaron, sin embargo, que disponer de otros apoyos, como miembros capacitados del Comité escolar, puede garantizar que la responsabilidad del éxito de una escuela no se concentre en una sola persona, lo que reitera la importancia de la participación de la familia y la comunidad en la gestión de la escuela. Los oficiales de educación de UNICEF consideran que los progenitores y los miembros de la comunidad pueden contribuir de una forma más significativa de la que generalmente se produce en la actualidad.

xli
Relación entre las escuelas amigas de la infancia y los resultados de los estudiantes: pautas en torno a los elementos de la programación de las escuelas amigas de la infancia
Dos aspectos de las escuelas amigas de la infancia estaban asociados positivamente con una mayor percepción en las tres dimensiones de las percepciones del clima escolar por parte de los estudiantes, es decir, Clima seguro, integrador y respetuoso (SIRC, según sus siglas en inglés); Entorno para el aprendizaje centrado en el estudiante y estimulante (CSCLE, según sus siglas en inglés); y Clima de apoyo emocional: la participación de la familia y la comunidad (según los informes de los maestros) y la utilización de una pedagogía centrada en el niño (según las mediciones realizadas por medio de observaciones en el aula). Esto indica que las escuelas donde existe un alto nivel de participación de la familia y la comunidad, y que utilizan enfoques pedagógicos centrados en el niño, los estudiantes tienen percepciones más positivas del clima escolar.
Las clasificaciones sobre la participación de los estudiantes por parte de los maestros estaban asociadas positivamente con clasificaciones más altas en relación con Clima de apoyo emocional, pero no estaban relacionadas de forma significativa con CSCLE. Se obtuvieron resultados variables en los modelos que predecían clasificaciones sobre SIRC.
Un clima integrador en el aula no estaba estadísticamente asociado con las percepciones de los estudiantes en relación con SIRC, CSCLE, o Clima de apoyo emocional.
La inclusión y la seguridad a nivel de la escuela estaban, en términos estadísticos, asociadas negativamente con Clima de apoyo emocional pero no estaban significativamente asociadas con percepciones sobre SIRC o CSCLE.
Las variables relacionadas con la enseñanza centrada en el niño con respecto al apoyo al estudiante y los entornos para el aprendizaje que sean saludables, seguros y protectores no estaban asociados estadísticamente con los resultados de los estudiantes.
Tener buenas notas estaba asociado de manera uniforme con percepciones más elevadas de apoyo académico y emocional.
Los estudiantes que informaron obtener notas excelentes consideraban que el entorno escolar era más seguro, más respetuoso, más integrador y con un mayor apoyo emocional y académico que los estudiantes obtuvieron malas notas o que no lograron aprobar.
Relación entre las escuelas amigas de la infancia y los resultados de los estudiantes: pautas en torno a la demografía de los estudiantes
Las estudiantes indicaron de manera uniforme una percepción más elevada con respecto a
SIRC, CSCLE y Clima de apoyo emocional que los estudiantes varones.
Los estudiantes que informaron haber perdido días de escuela debido al trabajo tenían una percepción más baja de manera uniforme con respecto a SIRC, CSCLE y Clima de apoyo emocional que sus compañeros que no habían tenido que perder días escolares debido a sus obligaciones laborales.
Los estudiantes de la escuela primaria17
(quinto grado) tenían de manera uniforme percepciones más bajas de SIRC y CSCLE, aunque acudir a la escuela primaria no estaba significativamente relacionado con las clasificaciones sobre Clima de apoyo emocional.
17 Los estudiantes que respondieron a la encuesta se encontraban en el quinto grado o un grado superior; como se explicó en la
introducción, en el momento en que se realizó la evaluación, la encuesta no se había adaptado o validado para su uso entre

xlii
Los estudiantes de escuela media o de enseñanza secundaria inferior (sexto y octavo grados) tenían de manera uniforme percepciones más elevadas de SIRC y Clima de apoyo emocional, aunque acudir a la escuela media no estaba significativamente relacionado con las clasificaciones sobre CSCLE.
Tener buenas notas estaba asociado de manera uniforme con mayores percepciones en CSCLE y Clima de apoyo emocional pero no SIRC.
Tener notas excelentes estaba asociado de manera uniforme con mayores percepciones en SIRC, CSCLE y Clima de apoyo emocional.
Relación entre las escuelas amigas de la infancia y los resultados escolares: características de la escuela
Ni la ubicación en una zona urbana ni los años de aplicación del modelo estaban asociados
estadísticamente con las percepciones de los estudiantes. Sin embargo, es preciso interpretar con cautela esta conclusión, ya que podría deberse a que el tamaño de la muestra es reducido. (Entre 23 y 27 escuelas participaron en la muestra por país.) Es posible que no hubiera suficientes escuelas en cada una de las categorías (por ejemplo, urbana, rural) para demostrar efectos significativos.
Los efectos con respecto a la pertenencia a un país fueron diferentes en toda la gama de resultados. Los estudiantes de Nicaragua tenían mayores percepciones de SIRC; los estudiantes de Filipinas tenían mayores percepciones de CSCLE; y los estudiantes de Tailandia tenían mayores percepciones de Clima de apoyo emocional.
Análisis del costo: conclusiones del análisis general del gráfico de cuentas de UNICEF
La financiación para las escuelas amigas de la infancia aumentó considerablemente desde 2006 hasta 2007 en general y en EAPR y ESAR, y descendió en ROSA.
Los recursos de emergencia constituyen una parte considerable de la financiación de las escuelas amigas de la infancia: un 36% a nivel mundial y más del 50% en las regiones de UNICEF de Asia Oriental y el Pacífico (EAP) y ROSA.
EAP gasta más que cualquier otra región en las escuelas amigas de la infancia.
Un 67% de los fondos para las escuelas amigas de la infancia se gastan en materiales, equipos y construcción.
Análisis del costo: conclusiones de los análisis a nivel de datos de escuela en seis países
Los gastos en las escuelas amigas de la infancia varían por país y estas variaciones se
relacionan estrechamente con la desigualdad general en los ingresos. Donde una variación general de los ingresos es elevada, la variación por gasto por alumno es también elevada, excepto en Sudáfrica, donde existe una variabilidad elevada en los salarios de los maestros.
En nuestro análisis de los datos a nivel de escuela en los seis países, encontramos que había economías de escala, es decir, el gasto total por alumno desciende a medida que aumenta el tamaño de la escuela. Sin embargo, las inversiones de UNICEF no reflejan esta pauta, ya que a
poblaciones jóvenes, aunque sí se ha hecho desde entonces. En este análisis, la primaria se define hasta el quinto grado, la
enseñanza media del sexto al octavo grado y la enseñanza secundaria del noveno al duodécimo grado.

xliii
medida que aumenta el tamaño de la escuela, la inversión proporcional de UNICEF también aumenta.
La variación en los gastos de UNICEF en las escuelas amigas de la infancia aumentó durante todo el tiempo en que las escuelas reciben apoyo.
Recomendaciones La evaluación recomendó que UNICEF considere las medidas siguientes para mejorar la aplicación de las escuelas amigas de la infancia y hacer que las escuelas sean amigas de la infancia:
1. Centrarse en la puesta en operación de los principios básicos de las escuelas amigas de la infancia mediante una clarificación de los principios fundamentales y la prestación de ejemplos concretos de lo que debe ser una escuela amiga de la infancia y lo que no lo es.
2. En las estrategias de ejecución, incluir actividades para evaluar y mejorar la disposición de
las escuelas y las comunidades para poner en marcha escuelas amigas de la infancia, y donde resulte apropiado, ampliar el calendario para la prestación de capacitación y asistencia técnica a fin de ayudar a las escuelas a poner en práctica los principios de las escuelas amigas de la infancia.
3. Utilizar los principios de las escuelas amigas de la infancia, volver a conceptualizar la
enseñanza para la vida práctica a fin de incluir un componente sólido de enseñanza social-emocional, y proporcionar los ajustes necesarios para incluir una enseñanza social-emocional impartida de forma intencional y su evaluación en la programación relativa a la educación para la vida práctica.
4. Ofrecer una capacitación adicional a los maestros para facilitar que empleen enfoques
positivos de comportamiento y pedagogías centradas en el niño de manera que mejoren el aprendizaje y el rendimiento del estudiante.
5. Mejorar la recopilación y la utilización de datos para el seguimiento, la mejora de la calidad y
la evaluación. Tanto en el caso de las escuelas como de los subgrupos, esto debe incluir datos sobre la asistencia, abandono escolar, logro, condiciones para el aprendizaje y la forma en que los estudiantes perciben las escuelas amigas de la infancia.
La evaluación recomendó también que se pongan en práctica nuevas estrategias para mejorar la programación en los países que se encuentran en situaciones después de un conflicto o en transición, como la inclusión de un componente de aprendizaje social y emocional para los maestros y los estudiantes que sufren trastornos postraumáticos. Para los países de medianos ingresos con altos niveles de desigualdad en los ingresos, se aconsejó a UNICEF que dirija las actividades de promoción y la programación hacia los sectores de niños pobres y vulnerables. Una estrategia recomendada para los oficiales de país de UNICEF fue la de utilizar estrategias basadas en los datos para seleccionar las prioridades en la programación, entre ellas examinar índices compuestos como los que figuran en el Informe de Desarrollo Humano, el Índice de Desarrollo Humano, el Índice de Pobreza Humana o la Medida de promoción de la autonomía del género
18 cuando decidan cómo adaptar y centralizar el
modelo de escuelas amigas de la infancia.
18 Véase http://hdr.undp.org/en/statistics/

1
CHAPTER 1 – INTRODUCTION The Education Section of UNICEF‘s Programme Office introduced the Child Friendly Schools (CFS) framework for schools that ‗serve the whole child‘ in 1999.
19 Today, the CFS initiative is UNICEF‘s
flagship education programme, and UNICEF supports implementation of the CFS framework in 95 countries
20 and promotes it at the global and regional levels. This chapter introduces the first global
evaluation of CFS. It contains three sections. The first describes CFS and its evolution and presents a conceptual model of CFS that was developed for and guided this evaluation. The second describes the evaluation approach and methodology. The third provides an overview of the report. 1.1 Background UNICEF grounded the CFS framework in the 1990 Convention on the Rights of the Child‘s principles of children‘s rights, as well as other international human rights instruments and international declarations such as the Declaration of Education for All (1990). These principles emphasize the right of all children to receive free and compulsory education in settings that encourage enrolment and attendance; institute discipline humanely and fairly; develop the personality, talents and abilities of students to their fullest potential; respect children‘s human rights and fundamental freedoms; respect and encourage the child‘s own cultural identity, language and values, as well as the national culture and values of the country where the child is living; and prepare the child to live as a free, responsible individual who is respectful of other persons and the natural environment.
21
Three other inputs shaped the early development of CFS. The first was effective school research, which emphasized the importance of school factors for disadvantaged students. The second was the World Health Organization‘s mental health promotion initiatives, which focus on the importance of connectedness, caring and access to support. The third was UNICEF‘s interest in child-, family-, and community-centred approaches to school improvement. UNICEF envisions and promotes CFS models not as abstract concepts or a rigid blueprint but rather as ‗pathways towards quality‘ in education that reflect three key, and inter-related, principles derived from the Convention on the Rights of the Child (UNICEF, in press):
Child-centredness: Central to all decision-making in education is safeguarding the interest of the child.
Democratic participation: As rights holders, children and those who facilitate their rights should have a say in the form and substance of their education.
Inclusiveness: All children have a right to education. Access to education is not a privilege that society grants to children; it is a duty that society fulfils to all children.
UNICEF anticipates that CFS will evolve and move towards quality education through the application of these principles. The following features of CFS derive from these principles and as the principles gain traction these features are strengthened.
22
19
The Chabbott (2004) desk review, in which she reviewed earlier documents and interviewed key personnel, provides the base for these historical observations. 20
CFS is implemented in 95 countries, one of which is identified as the Pacific Region, which consists of 13 independent island countries and 1 territory under New Zealand administration (Tokelau). 21
See http://www.unicef.org/crc/ 22
Adapted from the UNICEF Child Friendly Schools manual (UNICEF, in press).

2
Table 1 Child-friendly school principles and features
Principle Features of a child-friendly school derived from principle
Child-centredness
Child-centred pedagogy in which children are active participants, provided by reflective practitioners
Healthy, safe and protective learning environment provided through appropriate architecture, services, policies and action
Democratic participation
Children, families and communities are active participants in school decision-making
Strong links among home, school and community
Policies and services support fairness, non-discrimination and participation
Inclusiveness Child-seeking
Inclusive and welcoming for all students
Gender-sensitive and girl-friendly
Policies and services encourage attendance and retention
Although presented separately, the three principles are complementary, interactive, and to some degree overlapping. It is anticipated that when schools implement one principle they will inevitably touch on and begin to apply another. Democratic participation provides an example: safeguarding the interests of the child (child-centredness) through child-centred pedagogy and a focus on the needs of the whole child should be enhanced both by the active participation of children in their learning and well-being and by the participation by families and communities to provide necessary supports. Similarly, being inclusive of all children and seeking out children should be enhanced by child-centredness and the active participation of students, families and the community. Figure 1 presents a conceptual framework of CFS models. This framework was developed for and guided this evaluation. It shows how the application of the three principles should lead to quality education and positive student outcomes.
23 Reflecting the principle of inclusiveness, schools are accessible and
welcoming to all children and seek out children. Within a school, child-centred pedagogical approaches are implemented in a healthy, safe and protective learning environment that encourages the democratic participation of children, parents and the community. Together, these lead to children being safe and included, engaged and challenged, and supported, all of which are important outcomes because children are, in turn, more likely to learn and stay in school. This dynamic leads to students having greater opportunity to learn and succeed in life. It also leads to reduced dropout rates because students and their families see the value of school. Moreover, successful schools are viewed positively by the community and this improved reputation leads to greater demand. Schools are situated in a broader context than is depicted in this figure. National and local policies, advocacy efforts and multi-sectoral approaches will determine to varying degrees the availability and allocation of resources and school-level policies and practice. Another influence is the effort of UNICEF, the government and other partners such as non-governmental organizations (NGOs) and civil society organizations to promote and support schools. Finally, a country‘s economic health, demographic profile and political situation, and whether a country has recently experienced a natural disaster or political conflict will necessarily influence how the principles are implemented and realized.
23
While it is grounded in UNICEF‘s theory of action, it is also grounded in empirical research that emphasized the importance of providing students, teachers and families with the supports necessary to address barriers to participation and learning and to build conditions for learning and development (e.g., Battistich & Horn, 1997; Christenson & Thurlow, 2004; Greenberg et al., 2003; Hamre & Pienta, 2003; Osher, Dwyer & Jimerson, 2004; Osher et al, 2007; Osher & Kendziora in Press; Osterman, 2000; Slap, Lot, Daniyam, Zink & Succop, 2003; Teddlie & Reynolds, 2000; Wentzel & Wigfield, 1998).

3
Figure 1 CFS models as a pathway to quality education through the application of principles: child-centredness, democratic participation and inclusiveness
1.2 Evaluation approach and methodology UNICEF contracted with the American Institutes for Research (AIR) in January 2008 to conduct a global evaluation of the CFS initiative, which was to be built upon site visits to CFS in six countries. The evaluation was expected to be a baseline evaluation that addressed the challenge of variability and examined inclusiveness, pedagogy, architecture and services, participation and governance, systemic management and cost. Specifically, the evaluation was to address three questions, each of which had objectives:
24
What are the underlying principles of CFS and what do they look like in practice? Data and analyses here should help UNICEF promulgate empirically grounded principles for CFS.
Do CFS realize UNICEF‘s objectives for such schools? Data and analyses here should provide data for quality improvement and strategic planning.
Can UNICEF CFS programming have an impact at the national level? Data and analyses here should provide data for quality improvement and strategic planning.
AIR designed a mixed-methods evaluation to determine whether the CFS framework could produce the type of school that its designers visualized, as described by Bernard (1999, cited in Chabbott 2004):
―The value being added by the child-friendly school framework is precisely in its bringing together and attempting to integrate, conceptually and operationally, under the auspices of the CRC: (i) the well-established conditions and characteristics of effective, child-focused teaching and learning;
24
Following the award of the contract to conduct the evaluation, UNICEF and AIR collaborated to refine the evaluation design to address UNICEF‘s priorities for this evaluation.

4
and (ii) the goals of sustainable human and child development, including health, protection from harm and peaceful participation.‖ (p. 13)
In addition, the evaluation was designed to describe how CFS models have been implemented in multiple contexts to provide data on the extent to which the key principles of CFS are being realized, to identify challenges, and to provide a baseline and create tools to monitor future progress. The evaluation has 10 distinguishing features.
25 The evaluation:
employed site visits by teams – the data collection included one- and two-day site visits by teams to approximately 25 schools in two or more regions in each of the six countries for a total of 150 schools;
focused on the range of schools – schools were selected to represent the range of CFS in terms of urbanicity, duration of implementation and demography;
employed randomization – students, teachers and families were randomly selected for interviews, focus groups and/or surveys, and the classrooms to be visited were randomly selected;
addressed phenomenological issues – the evaluation employed survey instruments to explore how a representative group of students and staff experienced the school;
balanced sensitivity to local context and analytical uniformity by combining AIR and local site visitors;
created and/or tailored instruments and scales to address the needs of the evaluation – AIR customized and/or created 14 instruments and 17 reporting scales to meet the needs of the global evaluation;
combined quantitative, qualitative and visual data – the evaluation collected and analysed data from diverse sources to strengthen the integrity and descriptiveness of its findings and employed Hierarchical Linear Modeling (HLM) to apply a rigorous standard to the patterns observed in the quantitative and qualitative data. This combination of sources permitted AIR to triangulate data from multiple sources, test the consistency of findings obtained from different stakeholders and through different instruments, and clarify and nuance findings (Greene et al., 1994; Johnson & Onwuegbuzie, 2004);
set high bars for the inclusion of secondary studies – while examining a large array of evaluations to deepen our understanding of CFS, the evaluation only incorporated the findings of methodologically sound secondary studies;
employed a Delphi survey of UNICEF Education Officers to contextualize findings – the evaluation designed and administered a web-based modified Delphi survey to contextualize findings that were limited to two or more regions in six countries; and
drew on AIR‘s experience with CFS through other projects with UNICEF to evaluate and support social and emotional learning (SEL) in CFS.
25
More detail about the evaluation methodology, including instruments, sampling and analysis is provided in appendix A.

5
1.2.1 Data collection The researchers conducted country visits to six countries, which represented four of the seven UNICEF regions (see box), from June through August 2008. In each country
26 we visited 23-27 schools,
27 where
we observed the entire school facility and made structured observations in randomly selected classrooms. In addition, we interviewed school heads as well as students, faculty and parents who were randomly selected for surveys, interviews and focus groups. Our analyses are based in part upon:
10,222 student surveys;
1,811 teacher surveys;
143 school head surveys;
326 classroom observations;
145 school head interviews;
90 teacher interviews; and
88 parent interviews.28
In addition, we collected photographic and video data at schools, and in each country, AIR staff interviewed national leadership (including ministry of education staff), UNICEF staff, and donor and advocacy groups. Globally, we conducted a modified Delphi survey of UNICEF Education Officers in countries implementing CFS and reviewed UNICEF documents and prior studies of CFS. In addition, we conducted an analysis of the investment in CFS by UNICEF globally and within the countries we visited. Finally, where appropriate, we drew upon other research that AIR was doing on CFS. Country visits In each country we fielded an evaluation team consisting of two evaluators from AIR‘s home office and between six and eight local data collectors hired by AIR for this evaluation activity. AIR site visitors were researchers with experience in conducting field work in developing countries and in training and managing local data collection teams. The local data collection teams in each country consisted of experienced field researchers who understood the national education system and the communities in which the site visits were being conducted. The AIR evaluators conducted training and feedback sessions for local teams in each country to ensure common understanding and implementation of the evaluation procedures and instruments and to establish consistency across data collectors in translation, interpretation and ratings.
26
See appendix A for background information on the CFS initiative in each country. 27
In Nicaragua, the Philippines, South Africa and Thailand we visited 25 schools; in Nigeria we visited 23 schools; and in Guyana we visited 27 schools. 28
The goal was to administer up to 100 student surveys, up to 25 teacher surveys, and 1 school head survey in each school; complete 1 school observation for each school; observe 2-4 classrooms in each school; and conduct an interview with the school head. In half of the schools we conducted a more in-depth interview with the school head and a focus group discussion with both a teacher group and a parent group. In a small number of cases it was not possible to administer a particular instrument or completed forms were not returned to data collectors or to AIR, so we did not reach all of these goals.
Regions and countries visited for the global
evaluation
East Asia and the Pacific Region Philippines Thailand
Latin America and the Caribbean Guyana Nicaragua
East and Southern Africa South Africa
West and Central Africa Region Nigeria

6
School-level instruments and data. Data collection included:
school and classroom observations;
student, teacher and school head surveys;
parent and teacher focus group discussions;
interviews with school heads;
school demographic information and data to inform the cost analysis; and
visual data (photos and video). The student survey employed AIR‘s Conditions for Learning survey, which has been validated in numerous studies, including UNICEF (e.g., Osher et al., 2008; Spier et al., 2007) and adapted by AIR at a workshop with UNICEF EAPRO in Bangkok, Thailand, where its constructs were validated by Ministry of Education staff from nine countries. The teacher survey drew upon items from the teacher version of AIR‘s Alaska School Climate and Connectedness survey, which has been employed successfully to assess school climate in diverse cultural contexts and settings (Spier et al., 2007). Items were added to address CFS components. The school and classroom observation protocols were based in part on existing instruments used by AIR in previous evaluations of educational programming, with new items developed to target CFS programming elements. For example, items measuring the safety and healthiness of the physical environment of schools and classrooms were drawn from the World Health Organization‘s Information Series on School Health, a joint international initiative to promote effective school health called Focus Resources on Effective School Health (FRESH; Wargo, 2003). AIR developed structured interview protocols for school heads and focus group protocols for teachers and parents to ascertain school-level stakeholders‘ perceptions of how their schools have applied the principles of CFS and the challenges they have experienced in doing so. Teacher focus group discussions concentrated on school architecture and services and pedagogy; parent focus group discussions concentrated on inclusiveness, participation and governance, and pedagogy; interviews with school heads centred on inclusiveness, architecture and services, participation and governance, and pedagogy. There were two versions of the school head interview – a core set of questions was asked of all school heads and in half the schools AIR conducted a longer interview that addressed topics in greater depth. Surveys, observation protocols and interview/focus group protocols were standard across countries except for translation and local adaptation of terms. Instruments were translated from English into local languages by locally-based translators engaged by AIR. Prior to translation of instruments into local languages, UNICEF country offices reviewed the instruments to identify any potentially problematic questions or phrases and suggest appropriate adaptations. Few issues were flagged during this process and suggestions for adaptations were minor (e.g., using the term head teacher rather than school head). School selection in each country was based on a purposeful sampling strategy designed to ensure representation of all types of CFS. In each country, 25 schools across two or more regions were selected, with an effort to choose schools in both urban and rural locations and with varying number of years of having implemented the CFS model. In each country, schools were selected by UNICEF country offices using criteria provided by AIR and with guidance from AIR. AIR reviewed the selection of schools against the criteria provided to UNICEF. In each school, up to 100 students
29 and up to 25 teachers were randomly selected to respond to the
surveys; each school head was asked to complete a school head survey and participate in an interview, and two to four classrooms were randomly selected for observation. In half of the schools, approximately five teachers were randomly selected to participate in a focus group discussion and five or more parents were invited, with the assistance of the school head if necessary, to participate in a focus group
29
Surveys were administered to students in grades 5 and higher. At the time of the site visits, AIR‘s Conditions for Learning survey had been validated for grades 5 and above and had not yet been adapted and validated for younger populations. However, since that time AIR has adapted and piloted the survey at grades 2 to 4 in several countries in UNICEF‘s EAPR under a contract with UNICEF to provide technical assistance to countries in improving social and emotional learning.

7
discussion. Where appropriate, local leaders were also invited to participate in focus group discussions along with parents (e.g., chiefs in Nigeria). AIR also developed forms to collect school records data and cost data. The school records form asked questions about the number of students enrolled by grade and gender, the number of full-time equivalent teaching staff, student absenteeism and dropout rates, and students‘ passing rates on national exams (if available). The cost data form, designed to support the cost analysis component of the evaluation, asked questions on teacher characteristics such as their educational levels and years of experience, the number of teaching days per school year, the hours of instruction per week, the level of effort and time paid for teaching and administrative staff at the school, and non-personnel expenditures such as on- and off-site training costs. Finally, photographs and video clips were collected to provide visual evidence of aspects of the CFS experience.
30 Photos were taken of schools‘ physical infrastructure, including the façades, interiors,
school grounds and neighbouring buildings. Photos were also taken of classrooms, showing seating arrangements and classroom setups. Data collectors were also required to capture between 10 and 15 minutes of video in schools focusing on student and teacher interactions, including in-class instruction and student gatherings. We have included in this report selected photos to illustrate our findings. National-level data Evaluation teams met with representatives from Ministries of Education and other donor and advocacy groups to learn more about the management of the CFS initiative, costs associated with implementing the programme, and other critical implementation issues, such as ownership and scaling up. Although AIR evaluators had a standard protocol to guide these discussions, these interviews were necessarily tailored to the local context and often did not follow the standard protocol. Global data In order to contextualize and extend the results of our site visits, we analysed extant reports, descriptions, evaluations and other documents about CFS. We also conducted a web-based modified Delphi survey with UNICEF Education Officers that addressed a range of issues, primarily pertaining to opportunities, challenges, sustainability and scaling up of CFS programming. Review of prior studies and literature on CFS AIR reviewed existing documents and studies to put the evaluation in a broader context. We obtained from the UNICEF Headquarters‘ report database and through an independent search over 200 documents and studies related to CFS, of which approximately three-quarters were deemed potentially relevant to the global evaluation. A synthesis of study findings relative to CFS principles are presented in the relevant chapters. Web-based Delphi survey The Delphi technique is an iterative process wherein experts on the issue of interest are asked to provide ―…independent forecasts of events they expect to occur, and to identify the assumptions on which they base their forecasts…‖ (Stewart, Shamdasari & Rook, 2007). This process is repeated until consensus is obtained or no further changes occur in participants‘ responses. We used a modified version of this approach to collect information on UNICEF Education Officers‘ perceptions of and experiences with the CFS initiative in the countries in which they work in order to put the findings from the six countries into a broader context. To conduct this Delphi study we first obtained e-mail addresses from UNICEF Headquarters for all UNICEF Education Officers and cross-referenced this list with a list of all countries implementing CFS to ensure that we had the full list of eligible respondents. Leadership in the Education division of UNICEF Headquarters invited respondents to participate in the study and AIR subsequently sent an email invitation with a link to the survey. In the first round we asked participants to respond to 34 multiple-choice questions and 38 open-ended questions pertaining to the management of CFS and the findings from the six country site visits. After two weeks we closed the survey and analysed the survey data and summarized responses to the open-ended questions. In the second round we shared these results with
30
Photos and video footage were taken in about half of the schools visited.

8
respondents, whom we asked to provide feedback on the findings. Approximately 55 percent of the total sample responded to the first round and 22 percent of the total sample responded to the second round. AIR‘s accumulated knowledge of CFS through other projects. Over the last two years, AIR has conducted several CFS-focused projects for UNICEF. This work provided us with both a foundation for conducting this evaluation and opportunities to contextualize what we observed in the six countries and learned through the Delphi survey and literature review. For example, AIR evaluated the extent to which CFS in the East Asia and the Pacific Region (EAPR) were promoting SEL. As part of this work, AIR conducted one-week site visits in Cambodia, Thailand and the Philippines to meet with stakeholders and conduct focus-group discussions with teachers, school heads and students at five schools in each of the three countries. AIR is currently working with countries in EAPR to help UNICEF strengthen SEL in CFS. As part of this work, AIR has conducted site visits to Cambodia, China, Thailand and Timor-Leste. 1.2.2 Analysis This section describes how we processed and analysed the data collected. We first describe our analysis of the data gathered through interviews and then our analysis of the survey and observational data. Qualitative data: Following the completion of all site visits, interview/focus group data and observation comments were coded by trained coders. The coders used Atlas software and a coding scheme developed to provide a framework for subsequent analysis of stakeholders‘ perspectives on the purpose and implementation of CFS. The coding scheme was designed to capture the major issues addressed through the interviews and observations. Prior to use, UNICEF reviewed the draft coding scheme, which resulted in the addition of several codes. Throughout coding, codes were also added to capture issues that emerged from the data. The coding scheme enabled us to call up interview data based on single codes (e.g., Inclusiveness) as well as crossed codes (e.g., Inclusiveness and Professional Development). It also enabled us to examine interview data by variables, such as school locale or years a school had been implementing the CFS approach. The team of coders was trained in how to reliably code the data. The training included discussion about the meaning and operationalization of each code and practice training on a set of interviews. Once trainers demonstrated an understanding of the codes, coding began. Each rater had primary responsibility for one respondent group (e.g., parent interviews), although coders communicated with one another and with senior evaluation staff regularly on the meaning and operationalization of the codes. Inter-rater reliability checks were conducted several times a week to ensure consistent application of the codes. Quantitative data: Completed surveys were scanned into electronic files following data collection; observational protocols were entered manually. We then calculated frequency distributions across response categories and reviewed the item-level data within and across countries. In order to provide meaningful information about the CFS, we developed scales for reporting purposes. This involved combining items that measure similar and meaningful constructs. The reporting scales, described in Table 1 below, have reliability statistics (Cronbach‘s alpha) of more than .70, which is typically the minimum desired reliability for a reporting scale.
31 The reliabilities for each scale are reported in appendix A, along
with a list of items comprising the scales and a description of how missing data were treated.
31
Several additional scales are not reported due to low reliability, and several items did not fit conceptually into any of the reporting scales.
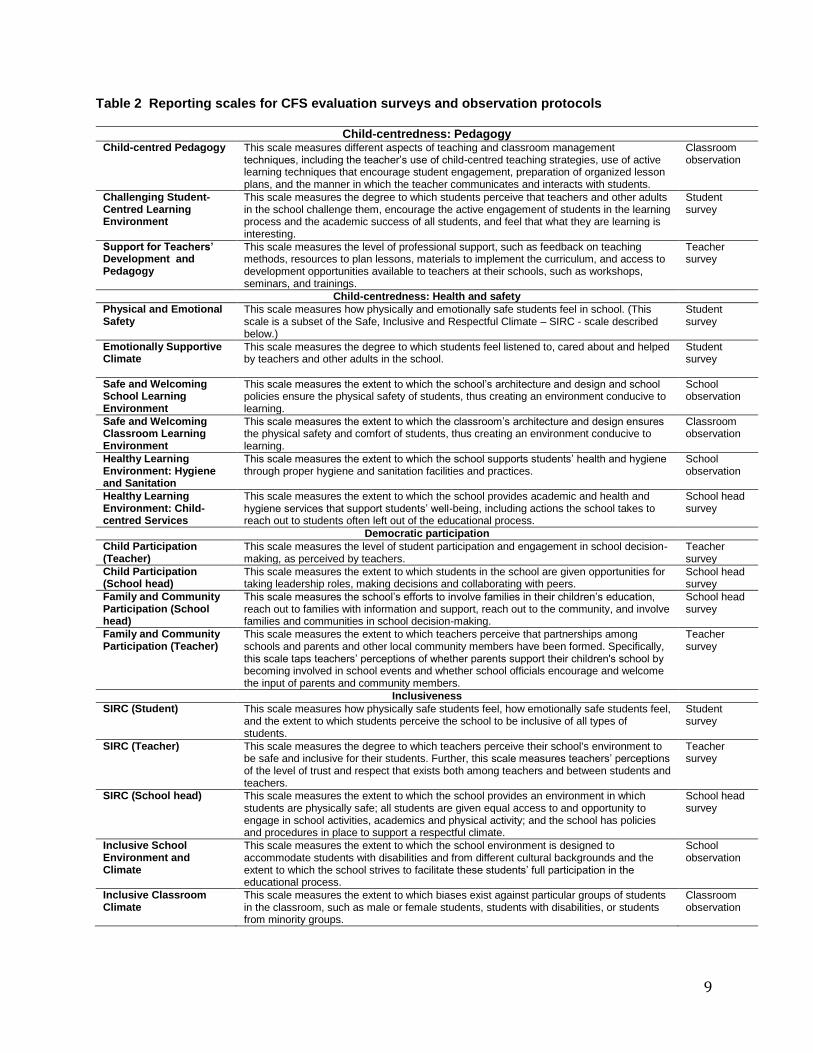
9
Table 2 Reporting scales for CFS evaluation surveys and observation protocols
Child-centredness: Pedagogy Child-centred Pedagogy This scale measures different aspects of teaching and classroom management
techniques, including the teacher‘s use of child-centred teaching strategies, use of active learning techniques that encourage student engagement, preparation of organized lesson plans, and the manner in which the teacher communicates and interacts with students.
Classroom observation
Challenging Student-Centred Learning Environment
This scale measures the degree to which students perceive that teachers and other adults in the school challenge them, encourage the active engagement of students in the learning process and the academic success of all students, and feel that what they are learning is interesting.
Student survey
Support for Teachers’ Development and Pedagogy
This scale measures the level of professional support, such as feedback on teaching methods, resources to plan lessons, materials to implement the curriculum, and access to development opportunities available to teachers at their schools, such as workshops, seminars, and trainings.
Teacher survey
Child-centredness: Health and safety
Physical and Emotional Safety
This scale measures how physically and emotionally safe students feel in school. (This scale is a subset of the Safe, Inclusive and Respectful Climate – SIRC - scale described below.)
Student survey
Emotionally Supportive Climate
This scale measures the degree to which students feel listened to, cared about and helped by teachers and other adults in the school.
Student survey
Safe and Welcoming School Learning Environment
This scale measures the extent to which the school‘s architecture and design and school policies ensure the physical safety of students, thus creating an environment conducive to learning.
School observation
Safe and Welcoming Classroom Learning Environment
This scale measures the extent to which the classroom‘s architecture and design ensures the physical safety and comfort of students, thus creating an environment conducive to learning.
Classroom observation
Healthy Learning Environment: Hygiene and Sanitation
This scale measures the extent to which the school supports students‘ health and hygiene through proper hygiene and sanitation facilities and practices.
School observation
Healthy Learning Environment: Child-centred Services
This scale measures the extent to which the school provides academic and health and hygiene services that support students‘ well-being, including actions the school takes to reach out to students often left out of the educational process.
School head survey
Democratic participation
Child Participation (Teacher)
This scale measures the level of student participation and engagement in school decision-making, as perceived by teachers.
Teacher survey
Child Participation (School head)
This scale measures the extent to which students in the school are given opportunities for taking leadership roles, making decisions and collaborating with peers.
School head survey
Family and Community Participation (School head)
This scale measures the school‘s efforts to involve families in their children‘s education, reach out to families with information and support, reach out to the community, and involve families and communities in school decision-making.
School head survey
Family and Community Participation (Teacher)
This scale measures the extent to which teachers perceive that partnerships among schools and parents and other local community members have been formed. Specifically, this scale taps teachers‘ perceptions of whether parents support their children's school by becoming involved in school events and whether school officials encourage and welcome the input of parents and community members.
Teacher survey
Inclusiveness
SIRC (Student) This scale measures how physically safe students feel, how emotionally safe students feel, and the extent to which students perceive the school to be inclusive of all types of students.
Student survey
SIRC (Teacher)
This scale measures the degree to which teachers perceive their school's environment to be safe and inclusive for their students. Further, this scale measures teachers‘ perceptions of the level of trust and respect that exists both among teachers and between students and teachers.
Teacher survey
SIRC (School head)
This scale measures the extent to which the school provides an environment in which students are physically safe; all students are given equal access to and opportunity to engage in school activities, academics and physical activity; and the school has policies and procedures in place to support a respectful climate.
School head survey
Inclusive School Environment and Climate
This scale measures the extent to which the school environment is designed to accommodate students with disabilities and from different cultural backgrounds and the extent to which the school strives to facilitate these students‘ full participation in the educational process.
School observation
Inclusive Classroom Climate
This scale measures the extent to which biases exist against particular groups of students in the classroom, such as male or female students, students with disabilities, or students from minority groups.
Classroom observation

10
In order to make judgments about the degree to which various CFS reflect the key principles of the model, we developed standards to guide the interpretation of the results based on the reporting scales for the student, teacher and school head surveys and school and classroom observations. These standards are grounded in established standards for school health and safety, and best practices for creating a school environment that fosters students‘ active engagement and improved learning outcomes.
32 They
were developed by a panel of experts with experience working in developing countries and with technical expertise in areas relevant to CFS, such as education, youth development, gender in education, children‘s rights, disability rights and conditions for learning. Appendix A includes a more detailed description of the procedures used to develop the standards and identify cut scores. In this report, results from the surveys and observation protocols are reported in terms of:
standards;
mean scale scores; and
percentage of respondents selecting response categories on individual items on the surveys or observation protocols.
To assess the relationship between the principles and the conditions for learning and development, we employ a statistical technique called Hierarchical Linear Modeling (HLM). HLM is widely acknowledged as the statistical technique most appropriate for analysing nested data in schools (Bryk & Raudenbush, 1992; Goldstein, 1987; Raudenbush & Bryk, 1986). HLM enables us to apply a rigorous standard to the patterns observed in the quantitative and qualitative data presented in the following chapters and to identify programme features that appear to be particularly powerful in setting the stage for learning and development.
33 This analysis explored the degree to which CFS features affect the conditions for learning
and development. Data on CFS programming elements were drawn from multiple sources, including teacher and school head surveys and school and classroom observation ratings. Data on student outcomes – namely, their perceptions on Safe, Inclusive and Respectful Climate (SIRC), Challenging Student-Centred Learning Environment (CSCLE), and Emotionally Supportive Climate – were drawn from student surveys. This analysis contributed to the triangulation of data as well as to our analyses of CFS investments and recommendations reported in Chapters 6 and 7, respectively. For the CFS model to be effective, it should foster a positive school climate where students feel safe, supported and engaged. An accumulating body of research suggests that these conditions contribute to improved attendance, learning and development and reduce the likelihood of drop out, as well as anti-social and unhealthy behaviours. Hence, school climate provides a proximal measure that suggests whether schools are on track to produce the longer term (and more distal) outcomes of academic achievement and healthy development. Figure 2 presents the analytic model guiding our approach. We hypothesized that each of the principles would be interconnected with one another and directly related to students‘ perceptions of school climate. These hypothesized relationships are based upon research that suggests that:
the quality of school infrastructure (buildings and grounds, heating/cooling and lighting, and instructional space) may have a relationship to student outcomes (Knapp, Noschis & Pasalar, 2007);
many students experience individual barriers to learning (such as social, economic or health challenges), and the provision of high-quality instruction (i.e., active and innovative pedagogic techniques), while crucial to improving student outcomes, alone will not improve their performance (Adelman & Taylor, 2000; Osher, Dwyer & Jackson, 2004);
educators face many barriers to addressing environmental and social factors including community-level disinterest, lack of knowledge and lack of resources; and
32
For example, Osher, D., Dwyer, K., & Jackson, J. (2004); UNICEF East Asia and Pacific Regional Office (2006); UNICEF (forthcoming); Skevington, S., Birdthistle, I., & Jones, J. (2003); Wargo, John (2003). 33
For a more detailed explanation of HLM techniques, the statistical models guiding the analysis, and the quantitative results from this analysis, see appendix B.

11
when families are more involved in their children‘s education, children achieve a variety of positive outcomes such as better grades, attend school more regularly, complete more homework, demonstrate more positive attitudes and behaviours, graduate from high school at higher rates, and are more likely to enrol in higher education than students with less-involved families. (Bryk & Schneider, 2002; Funkhouser, Gonzales & Moles, 1997; Haynes & Comer, 1996; Henderson & Mapp, 2002.)
Figure 2 Hypothesized relationship between CFS principles and school climate
Descriptive statistics for the three student outcomes (dependent variables) are presented in appendix B. 1.3 Country contexts: CFS in the sampled countries The diverse selection of countries AIR visited for the evaluation enabled it to look at CFS in a range of contexts. The countries are located in four different UNICEF regions, have implemented CFS for varying lengths of time, have integrated CFS with national education priorities and other interventions to varying degrees, have emphasized different elements of the model, and have operated the programme in different ways. In 2006, investment in CFS was $53,323,703 which increased substantially in 2007 to $85,610,571. Also, although all regions reported some expenses related to CFS activities, the level of spending across regions varied considerably. For example, EAPR represents 36 percent of all expenses on CFS (Chapter 7 presents detailed information on costs associated with implementing the CFS initiative within the six countries visited during this evaluation). On a developmental continuum, of the six
Child-centredness: Support for Students and Healthy, Safe and Protective Learning Environments
Safe and Welcoming School
Learning Environment (Sch)
Safe and Welcoming Classroom
Environment (C)
Healthy Learning Environment:
Hygiene and Sanitation (Sch)
Healthy Learning Environment:
Child-centred Services (D)
Child-centredness: Pedagogy
Child-centred Pedagogy (C)
Inclusiveness
Inclusive School Climate (Sch)
Inclusive Classroom Climate (C)
Democratic Participation
Family and Community
Participation (T)
Child Participation (T)
Conditions for Learning and Development
SIRC (S)
CSCLE (S)
Emotionally Supportive Climate (S)
(Sch) = School Observation; (C) = Classroom Observation; (S) = Student Survey; (T) = Teacher Survey; (D) = School head Survey

12
countries, the Philippines and Thailand have the most established and far-reaching CFS programming and by many accounts have been the most successful. In her 2004 desk review, Chabbott said that the Philippines and Thailand were the most ‗ready‘ for follow-up evaluation and they are located by a UNICEF Regional Office that has been very active in promoting and supporting the CFS initiative. At the other end of a developmental continuum, South Africa only recently began receiving support for the CFS initiative and thus is very ‗new‘. Below, we describe the scope of the CFS initiative in each country, including how it originated and operates, how many schools are supported and where they are, the regions that AIR visited during the site visits, and the foci of CFS programming. We begin with the most ‗established‘ countries through to the newest addition, South Africa. 1.3.1 The Philippines CFS in the Philippines was first implemented in 1999 in 131 schools in the poorest districts in both rural and urban areas. UNICEF, the Ministry of Education and other stakeholders identified the primary beneficiaries of this programme to be the most vulnerable children residing in these areas. The number of schools served steadily increased in the early 2000s and today more than 3500 schools in 14 regions, 20 provinces, 61 municipalities and 5 cities are CFS. The evaluation teams travelled to four of these regions: metro Manila, Camarines Norte, Guimaras and Negros Oriental. The overarching goal of the CFS programme in the Philippines is to improve the quality of and access to basic education for disadvantaged children through the development of a CFS system that includes: (1) model CFS that can be expanded nation-wide; and (2) improved literacy, elementary participation and achievement rates. UNICEF has provided two types of support to CFS in the Philippines. One type of support is given directly to schools in the form of school libraries, computers and training for teachers in CFS pedagogical techniques (e.g., child-centred, active learning). UNICEF chooses the schools to receive direct support every five years and then funds the Ministry of Education with money earmarked for specific inputs for specific schools. The other type of support provided by UNICEF is funds for the Ministry of Education to pilot different focal areas, such as Education Management Information System (EMIS) and other meta-level systemic management programmes. 1.3.2 Thailand CFS began in 1998 when UNICEF piloted the initiative in 23 primary/middle schools in 6 northern provinces. That number had since expanded; currently there are more than 1100 CFS across Thailand (Keenapan, 2008). The programme is primarily being implemented in specific districts in the north (Chang Mai, Chang Rai) and in the south of the country (Phuket and Krabi). The evaluation team visited the Mae Chan and Fang Districts in the far north and the Krabi and Phuket districts in the far south. The CFS model has served as the basis for a parallel set of educational reforms sponsored by the Office of Basic Education and Curriculum within the Ministry of Education called the ‗Lab Schools‘ initiative, which also seeks to sensitize stakeholders to children‘s rights and child-centred pedagogical practices. The Ministry of Education is currently scaling up CFS components such as the school self-assessment and the databases used by schools nationally and the School Management Information System. CFS interventions are carried out by the Education Area Support Offices, which provide four core interventions in schools:
1. School self-assessment: The school self-assessment serves to raise stakeholder awareness about children‘s rights and galvanize and unify stakeholder actions. Once complete, the teachers and school heads use the assessment results to help develop the school‘s improvement plan.
2. School Management Information System: This is a database that allows schools to monitor a student‘s development and tailor interventions for the unique needs of each student.
3. Child-centred approaches: Trainings provided by the Education Area Support Offices help acquaint or deepen teacher knowledge regarding a variety of child-centred approaches to pedagogy that are seen as central in realizing a CFS (UNICEF, 2008).

13
4. Life skills training: Life skills aims to more broadly complement a school‘s efforts to develop children‘s intellectual capacity vis-à-vis focusing on children‘s psycho-social development and acquisition of specific livelihood skills.
While much of UNICEF‘s funding is provided to the Ministry of Education at the national level, support is also provided to multi-district school-support entities called Education Area Support Offices, which provide direct training and supervision to schools. These Offices use several criteria to determine whether a school should receive support, including whether the school supports significant numbers of marginalized children, the capacity of the school head and the potential support of the surrounding community. Schools generally receive support for one year, although all previously supported schools also continue to be recognized as CFS. 1.3.3 Guyana Guyana adopted CFS in 1997 as a national strategy to improve its primary schools. CFS implementation was added to the national education strategy with the goal of improving primary schools and served as a complement to other existing initiatives such as school feeding programmes and Escuela Nueva, a programme that worked intensively with teachers and parents in the Berbice (Hinterlands) region. Both CFS and Escuela Nueva focused on child-centred pedagogical practices and were considered complementary in purpose. Fifty-six schools in the Berbice region were included in a pilot for CFS implementation in 1997. In 1998 and 1999, the regions of Santa Rosa, Surama and Aishalton also received support to implement CFS. The last wave of CFS was initiated in 2006 in the Essequibo region after a massive flood destroyed many schools. There are currently 97 CFS in Guyana. The evaluation team visited 27 primary schools in three regions: Georgetown (capital), Essequibo and Berbice. The two schools in the capital were urban schools but the rest were in rural or riverrain (close to the major rivers) areas. The implementation of CFS has varied across regions, which can be attributed to several factors, including differences in how the initiative began within each region, the length of implementation within the region, and the support provided by local governing authorities to schools within each region. However, according to a central ministry official, the foci of the programme are the same across regions and these are:
improving student self-esteem;
reducing prejudice in schools;
using cooperative group learning; and
providing learning corners in schools. UNICEF inputs to the CFS programme in Guyana included the coordination of school-level CFS Action Plans. UNICEF supported bi-annual planning meetings by providing direct funding to regional education offices during the first eight years of programme implementation. To sustain enthusiasm for CFS following the meetings, the regional Ministry of education coordinated a competition CFS to see which CFS could most closely achieve its Action Plan goals. According to a regional m Ministry of Education official, in 2003 funding ceased to be provided directly to the regional Ministries of Education and the bi-annual meetings ceased due to lack of funds to support them. 1.3.4 Nicaragua Nicaragua began implementing CFS in 2001 by selecting 17 schools in which to implement one component of the CFS programme, specifically, a component focused on improving the health and hygiene of students called School Hygiene and Clean Environment. The CFS programme was expanded in 2003 to 50 schools, all of which received the full five-component programme (described below). In 2005, the number of schools participating in the CFS programme increased to 150, and according to UNICEF, there are currently 342 schools implementing CFS. UNICEF Nicaragua planned CFS as a primary school intervention and nearly all the schools implementing the CFS programme are primary schools.

14
In Nicaragua, the CFS programme is primarily implemented in rural poor communities throughout the country where agricultural activities are the primary source of income. Some of the rural CFS are highly isolated and cannot be reached by public transportation, making travel in and out of these communities infrequent. Although there are no CFS in or near the capital city, Managua, there are some urban CFS in the regional capitals. Many CFS also receive support from USAID as part of its Excelencia programme. The Excelencia programme, vis-a-vis support at a national level, has developed an educational model that promotes active learning with community participation and a competency-based curriculum incorporating educational needs specific to the indigenous and ethnic communities. Other donors have also supported the implementation of parallel programmes to support children‘s education and development. For example, the evaluation team observed that World Vision has donated learning materials and school libraries to several of the CFS visited during this evaluation. Similarly, the World Feeding Program has donated food to some CFS. The evaluation team visited urban and rural schools in the northern region of Nicaragua in the provinces of Esteli, Madriz and Nueva Segovia. The UNICEF Nicaragua office spent significant time planning and adapting the CFS programming elements as defined by UNICEF Headquarters to the Nicaraguan context. The CFS programme was reorganized to consist of five components:
1. Quality Learning and Achievement;
2. Friendly and Secure Physical and Environmental Conditions;
3. School Hygiene and Clean Environment;
4. School Health and Nutrition; and
5. Rights, Responsibilities and Participation. The UNICEF vision for CFS in Nicaragua is to give ownership to and build capacity within the Ministry of Education to sustain the programme independently. To that end, all resources are funnelled through the Ministry of Education and other governing bodies (e.g., Ministry of Health to support the health and nutrition components of the programme) and no resources are allocated directly to the schools or to regional ministry offices. 1.3.5 Nigeria At the 2000 National Summit for Children, the Government of Nigeria announced its intention to place a greater focus on the nation‘s children, in particular girls, by implementing the UNICEF CFS programme. A blueprint for the CFS programme was presented and authorized by the government, in which CFS was defined and guidance for implementing the programme was provided. From 2002-2007 UNICEF worked with the Nigerian government to start implementing CFS. The initial strategy included starting with ‗focal schools‘ in the cities of Lagos, Ibadan, Kano, Kaduna, Onitsha and Port-Harcourt. The initial goal of CFS in Nigeria was to start 600 schools over six years. The agreement between UNICEF and the Nigerian government was that for every one CFS school that UNICEF supported financially, Nigeria would replicate the effort three times. The CFS programme in Nigeria is spread across the country, but schools identified were purposefully chosen in areas with low girls‘ enrolment and in areas where the demand for education is greater than the supply available. No local government received more than three CFS in their area and at the initiation of each CFS, an exit strategy was put in place that ensured a gradual reduction in UNICEF support over time. According to a 2005 evaluation, there were 164 CFS in Nigeria (Enueme & Ojo, 2005). The evaluation team visited schools in Abuja state, Niger state and Ebonyi state. The central foci of the CFS programme in Nigeria are (Enueme & Ojo, 2005):
1. renovation of school buildings and grounds; 2. training of teachers and principals in CFS methodologies such as child-centred pedagogy; and 3. encouraging families and communities to become involved in school management.

15
UNICEF has provided direct school support in the form of construction, materials, libraries and teacher trainings (pedagogy). 1.3.6 South Africa South Africa has been in the process of reforming its schools since the abolition of apartheid, when segregated schools were eliminated and an equality- and rights-based approach to education was initiated by the government. Despite political and legal reforms, many legacies of apartheid remain in South African society, legacies that are often evident within schools. In recognition of this, the Department of Education has created several initiatives, such as the Safe and Healthy Schools Initiative, which seek to address the range of social ills and neglect schools in each province face. Such programmes are aligned with the principles behind the CFS initiative, which was launched in South Africa in 2004, after the Department of Education identified 585 target schools (65 in each province) that were considered either drastically under-resourced, impoverished or extremely violent. UNICEF began supporting a few of these schools in 2005, with the number being expanded in 2007 and 2008. The programme is being implemented in KwaZulu-Natal, Limpopo and Eastern Cape provinces, which were identified as the provinces with the highest concentrations of poverty in the country (Park, 2006). There are currently 585 CFS in South Africa.The evaluation team was able to visit a cross-section of schools at varying levels of CFS implementation. The schools visited were in three distinct areas in South Africa: Paulpietersburg, Port Elizabeth and Durban. School interventions largely consist of UNICEF-funded trainings carried out by local service providers and in some cases, part-time school-based caregivers. UNICEF coordinates the contracting of a CFS service provider with the provincial government. The local service provider gives trainings and funds school-based caregivers who are responsible for helping target schools become child-friendly. Specific concerns and focuses of CFS in South Africa are school access, safety, gender sensitivity, acceptance of orphans and vulnerable children, and provision of emotional development and life skills services (Park, 2006). The majority of UNICEF CFS work occurs on a national scale in cooperation with the Department of Education. Most UNICEF support is funnelled through the government in the form of printing resources, trainings, development of an implementation handbook, and other such activities. UNICEF also funds and supports national research and evaluations.
1.4 Overview of report This describes the purpose of the evaluation and the methodological approach to addressing the main questions posed by UNICEF. The next four chapters describe CFS in terms of the key principles of the initiative:
inclusiveness;
child-centredness in terms of providing healthy, safe and protective learning environments;
child-centredness in terms of pedagogy; and
democratic participation. Each of the four chapters begins with a description of the key principle, what the evaluation examined , data sources and methods. Second, key findings are presented. Third, we present data from the six countries using multiple data sources, including surveys with students, teachers and school heads, observations of the school and classrooms, and interview/focus groups with school heads, teachers and parents. We also discuss the challenges schools face in applying the primary principle. Finally, to put findings in a broader context, we describe previously-conducted research on CFS and its principles and what we learned from UNICEF Education Officers globally through the web-based Delphi survey. Although these four chapters address each principle separately, as discussed earlier, these principles are complementary and overlapping. Chapter 6 presents narrative descriptions of CFS to convey what these schools are like in practice – —how they ‗feel‘ and the traditions and school ethos that make them child-friendly, while Chapter 7 presents results from the analysis of the costs associated with the CFS initiative by looking at the global

16
investment in CFS by UNICEF and at school-level costs. A summary of the findings relative to the three questions that drove the evaluation, challenges and opportunities for scaling up and expanding the CFS initiative, and strategic recommendations for the future of CFS are all presented in Chapter 8. Appendices provide additional information on the evaluation tools, methodology and analyses (including the HLM analyses), as well as background information on the CFS initiative in the six countries visited for the global evaluation.

17
CHAPTER 2 – INCLUSIVENESS We welcome this initiative because it strengthens us a lot. It makes the classroom very friendly for children. It improves the standard of education. It is helping us a great deal. We are noticing that the children‘s attendance and the quality of education have improved. It is really helping us in that way. We have seen improvement in terms of attendance in the schools in the area. In this area we find because the parents are involved, we have increased the attendance. Before they would come on and off but with this initiative the children are coming more often. Some parents can‘t afford to send [their children] to school – they don‘t have money for food. In the CFS programme they have implemented a school feeding programme which supplements food for children. They are coming now. Before it was all about the teachers and now children are now part of the decisions. The children feel they have a role in the initiative part of the school.‖ –Regional Ministry of Education Officer, Guyana
At the heart of the CFS framework is the belief that all children have a right to a quality education and that, to serve children well, schools must be experienced by children and families as welcoming and inclusive of all children, and must strive to ensure that no children are excluded from enrolling in school or discriminated against in any way. In its forthcoming CFS manual, UNICEF describes inclusiveness as follows:
One of the most self-evident principles generated by the rights-based ideology is inclusiveness, which requires schools to be open and welcoming to all children without exception. The school does not just passively receive children who seek schooling but actively seeks out all eligible children for enrolment. Beyond enrolment, it also helps children stay in school and attend regularly. This means that fair, transparent and non-discriminatory rules for accessing school are necessary but not sufficient. There must also be strategies in place to tackle the barriers that prevent children from taking the opportunities to participate in education. (UNICEF, in press, Chapter 2, page 9)
In this chapter we describe how child friendly schools apply the principle of inclusiveness and address the following issues through data from the six countries:
whether school heads, teachers and parents value inclusiveness of all children, an important condition for schools to authentically reach out to and be inclusive of all children;
what schools do to seek out children;
whether the school climate is such that children feel welcome, physically and emotionally safe, and included;
whether school staff perceive the school climate to be safe, respectful and inclusive;
whether the school environment and policies are such that all students are accommodated and provided equal opportunities;
whether CFS are facilitating greater attendance and retention; and
what challenges do schools face in being inclusive of all children. Multiple sources of data are used to address these issues:
survey data collected from students, teachers and school heads to report information on schools‘ efforts to be inclusive and welcoming to all students and how successful they are in creating safe, inclusive and respectful environments;
observations of schools and classrooms and whether there is equal treatment of and access by students regardless of gender, disability status and home background;
interviews with school heads, teachers and parents on issues germane to inclusion and gender-sensitivity; and
statistical analyses. Finally, to put the findings from this evaluation in a broader context we describe what we learned through a review of previously conducted research on inclusiveness in CFS globally and discuss findings germane to inclusiveness in CFS from the web-based Delphi survey of UNICEF Education Officers. Although not all issues are addressed by each source, we document when multiple sources converge or

18
diverge on a particular issue. When relevant and possible we disaggregate data by subgroups of the population.
2.1 Summary of key findings on inclusiveness
For the most part, in schools implementing the CFS approach, school heads, teachers and parents express a commitment to inclusiveness, view inclusiveness as a key element of the CFS model, and make efforts to include, encourage and support students, regardless of gender or background.
According to school heads, schools make efforts to reach out to children not in school to engage them and make efforts within school to retain them. However, variation exists across countries in how much effort schools make.
In five of the six countries the majority of students feel physically and emotionally safe in school and that their schools are inclusive. Still, many students do not feel safe or feel that their schools are inclusive; 19-56 percent provided responses that resulted in a rating of ‗needs improvement‘. Female students have, on average across countries, more positive feelings about safety than male students.
Teachers are somewhat more positive than students in their assessment of the school climate, with many fewer responding in the ‗needs improvement‘ category. Across all countries, school heads report that policies and conditions are largely in place to support a positive school climate.
Schools struggle to provide buildings, classrooms and grounds that are accessible to all students, particularly those with disabilities. This was especially the case in Nigeria, South Africa and Guyana where 26–56 percent of schools needed improvement on this dimension.
Schools appear to be more successful at providing inclusive classroom environments where teachers demonstrate similar expectations for and equal treatment of students regardless of background. In the Philippines and Thailand, 90 percent and 80 percent of classrooms, respectively, were deemed excellent on this dimension and in Nigeria, South Africa, Guyana and Nicaragua, 87 percent or more classrooms were judged to be satisfactory or excellent in terms of being inclusive.
Students believe that the adults in the school support the inclusion and success of all students in schools that have high levels of family and community participation and use child-centred pedagogical approaches. School heads and teachers identify few obstacles to gender inclusiveness and equality, and classroom observations did not find obvious bias, although some observations and interview data suggest that gender stereotyping is in practice. Schools in all countries make fewer efforts to reach out to children with disabilities in the community than to children from minority groups, students living in poverty, or others at risk for poor educational outcomes.
School head survey responses, classroom observations, interviews conducted with school heads, teachers and parents, indicate that school heads and teachers feel that serving students with disabilities is an enormous challenge for which they are not equipped.
Our findings are consistent with both a multitude of recent studies on the ways in which CFS promote inclusiveness, respect and respond to diversity, and provide equal access to free, high quality educational opportunities for all children, and our Delphi survey of UNICEF Education Officers. Both the studies and the Delphi survey suggest that although inclusive education and awareness of disability rights is an increasingly prominent theme in some countries, it is not so in all countries, and even in the countries where it is, only some CFS were successful in their attempts to recruit and integrate children with disabilities. Previous evaluations also suggest that Ministries of Education, UNICEF and schools can promote inclusiveness in several ways, ranging from community mobilization to teacher training programmes.
2.2 Do school heads, teachers and parents value inclusiveness? In most of the countries visited there was widespread appreciation by school heads, teachers and parents that one of the key principles of CFS models is inclusiveness – being open to all children, seeking and

19
retaining children, treating all students equally regardless of gender, home background, ethnicity, or disability status, and providing an environment where all children feel welcome and safe. At a conceptual level, school heads, teachers and parents understand that inclusiveness is an essential element of a CFS and of their own schools. School heads talked about inclusiveness as a core principle of the CFS model and cited examples of measures taken to be inclusive. For example, in Nigeria a school head responded to the question ‗What is a child-friendly school?‘
―The school welcomes children from all ethnic and religious groups, as well as [both] genders. The disabled and able pupils are all encouraged to go to school.‖ —School head 23, Nigeria.
In response to the same question a school head in Thailand said,
―School services should cover all targets of population, without discrimination on gender and religion . . . . All students are able to participate [in] all school/classroom activities as they need regardless of gender and religion.‖ —School head 22, Thailand.
Parents spoke about how the schools their children attended did not discriminate against any student in terms of admission to school or of providing opportunities for leadership and participation. Parents believed their schools did well in supporting equal access to all kinds of students.
―Yes, everybody has a chance to come to school. They are not turned away because of gender.‖ —Parents 08, Guyana. ―Parents are integrated into the school and very supportive, and teachers are striving to give of their time to improve education for our children, especially helping those with learning difficulties.‖ —Parents 02, Nicaragua.
Teachers in four of the countries had less to say about inclusiveness as an element of the child-friendly approach or what they saw in their schools. This may be due to the fact that they were asked fewer questions targeting the issue of inclusiveness during the country site visits than other stakeholders. Although some teachers noted that ‗equal treatment‘ and ‗equal opportunities‘ were important or evident – a Nigerian teacher stated that CFS should ―be all-inclusive‖ and ―welcome all manner of human beings‖ – most teachers did not specifically mention inclusiveness. However, teachers in Thailand and the Philippine appeared especially to appreciate that inclusiveness is a critical element of a CFS.
―[A CFS] promotes and practices equality among pupils. Everyone who wants to be enrolled is taken in [and the school] does not favour pupils with better academic or cognitive capabilities. Pupils are given the same opportunities inside the classroom. . . . Children with exceptionalities and in special circumstances are given the chance to enrol in the school . . .‖ —Teacher 05, Philippines. ―The school tried to be open for all types of students enrolling to study in this school because to give chances for children to access education is a basic child right.‖ —Teacher 22, Thailand.
Policy provides an indication of the value a school places on inclusiveness. So does the degree to which schools embrace diversity in the curriculum. As shown in Table 2, nearly all CFS have a written policy on educating all students, regardless of race, ethnicity, gender, language, disability or religion and nearly all CFS teach students about the history, culture and traditions of race, ethnicity, gender, language, disability or religion.
Table 2 School heads’ perceptions of efforts to provide educational opportunities to all students
Statement
Nig
eria
South
Afr
ica
Phili
ppin
es
Th
aila
nd
Guyana
Nic
ara
gua
Avera
ge
My school has a written policy on educating all students, regardless of race, ethnicity, gender, language, disability or religion.
83
92
92
96
100
100
94
This school teaches students about the history, culture and traditions of race, ethnicity, gender, language, disability or religion.
100
96
100
100
100
100
99

20
2.3 What CFSs do to seek out and retain children For schools to be inclusive of all children and strive to ensure that no children are left out of the educational process, they must reach out to vulnerable populations to encourage them to enrol and stay in school. When children have competing outside interests or face constraints such as earning an income for their families, schools must find ways to engage children and their families and to encourage them to see the benefits of enrolling and staying in school. In this section we examine how schools seek out children and take action to encourage the enrolment and retention of students who might otherwise not enrol or attend school. The first question is whether schools actively seek out all students. Table 3 presents school heads‘ reports on whether school staff seeks out children who have disabilities, are from minority groups, live in poverty, or are otherwise at risk for poor educational outcomes. There was great variation across countries in the extent to which schools seek out children from these vulnerable populations. Moreover, in every country, fewer schools seek out children with disabilities than children from minority groups, those living in poverty, or those otherwise at risk for poor educational outcomes. Table 3 School heads’ perceptions of school efforts to be child-seeking
Statement
Nig
eria
South
Afr
ica
Phili
ppin
es
Th
aila
nd
Guyana
Nic
ara
gua
Avera
ge
Staff from this school go into the community to encourage enrolment of minority students, students living in poverty, or others at risk for poor educational outcomes.
87
40
96
92
58
96
78
Staff from this school goes out into the community to encourage the enrolment of children with disabilities.
70
16
54
68
19
75
50
In interviews with school heads, we learned more about the ways that schools proactively supported inclusiveness. These actions generally fall into three categories:
identifying children who should be enrolled;
providing services and resources to enable children to enrol; and
providing services and resources to encourage children to stay in school.
2.3.1 Child-seeking Identifying out-of-school youth is a critical first step in supporting inclusiveness, and school heads in every country we visited talked about going out into the community to find children for enrolment in school. In many schools this was described as a systematic process to actively seek out children.
[We do] family mapping to check on participation of students, make sure they are in school – teachers visit area[s] rather than rely on Barangay [district] data.‖ —School head, Philippines. To ensure inclusiveness the school head needs to pretty much knock on every door and talk to the parents. . . The method of increasing student enrolment is first conducting a survey at each orange plantation to see how many kids should attend our school for the upcoming year. Then the school head and teachers follow up by talking with the parents to convince them to send their kids to school.‖ [This school head talks about the challenge of convincing parents of migrant workers or families that live near the border and are fearful that they will be deported.] —School head 11, Thailand. Visits are conducted house to house to raise the initial enrolment; this has meant that the school is expanded. . .‖ —School head 23, Nicaragua.

21
2.3.2 Providing services and resources to expand enrolment A smaller number of schools provide services and resources to students and their families in order to support the enrolment of children who would otherwise not be able to enrol. For example, in South Africa, where several schools have fees or other costs (e.g., uniforms) that make enrolment difficult for children, particularly orphans, some schools reported that they waive school fees. Such efforts help children who would not otherwise enrol, expanding access to a wider array of children. 2.3.3 Providing services and resources to encourage children to stay A major concern for many schools is keeping children in school, particularly children for whom attending requires overcoming a significant hurdle (such as travelling long distances or giving up the opportunity to contribute financially to the household) and children for whom the learning process is a struggle. An all-too-common situation that schools face is having students who come to school hungry. These children are often malnourished, which not only poses significant threats to their health but also makes them unable to concentrate. School feeding programmes are sometimes in place to ensure that children are not hungry.
34 Parents and teachers were very positive about the impacts of school feeding programmes
on students‘ experience. For example, teachers at multiple schools in Nigeria said things such as ―…nutritional improvement would improve the retention of students.‖ In addition, in schools that had feeding programmes, school heads and teachers saw these as boosting enrolment and attendance. In schools without a feeding programme, in place, or where it was only occasionally in place, many school heads and teachers noted that there was a great need for one, citing their understanding that providing for students‘ nutritional needs would increase enrolment. Other examples of services to encourage retention include home visits to better understand students‘ circumstances and figure out how to meet their needs. Some school heads in every country mentioned doing this. For example, one school head talked about making home visits to determine how best to serve students with learning disabilities and having school staff and community members collaborate to determine the best approach to helping orphans and vulnerable children. Similarly, a school head in Nigeria said that the school committee was charged with identifying orphans and proposing remedies to improve their condition. Teachers also reported on such efforts. For example, a teacher in the Philippines reported that his school ―…prioritized students who are at risk of dropping-out…‖ and intervened ―…through Home Visitation, Project CARE, Adopt-A-Child, Student Labour, Feeding Program and many more…‖(School head 18). In addition to special services, school staff recognized the importance of enhancing the students‘ learning experience to expand enrolment. This included both improving attendance (which is indirectly related to drop out rates) and enhancing the reputation of the schools ―…so many parents want their children to enrol…‖ (Thailand, 01), which in turn enhances the demand for the schools‘ services. For example, teachers in Guyana reported how focusing on attendance and improving the students ―likeness for school‖ improved attendance. Similarly, a Nigerian teacher reported that the ―attractive nature of the school and classes‖ increased attendance and class participation (which has an indirect effect on attendance).
2.4 How do students in CFS experience school climate? Students are more likely to ‗like‘ and remain in schools that they experience as safe, supportive and inclusive of them (e.g., Christenson & Thurlow, 2004; Osher & Kendziora, in press; Rumberger & Larson, 1998). For schools to be inclusive, all students should feel welcome, respected and treated equally. The
34
Across the six countries there is a school feeding programme in 62 percent of the schools visited; this is discussed in more detail in Chapter 3 (see Table 16).

22
SIRC scale for students measures how physically safe students feel, how emotionally safe students feel, and the extent to which students perceive the school as inclusive of all types of students. Similar scales are also used to measure teachers‘ and school heads‘ reports on this dimension. Figure 3 shows the percentage of students at three levels – needs improvement, satisfactory or excellent – on the SIRC scale. In five of the six countries, the majority of students felt physically and emotionally safe in school and perceived the school as inclusive (satisfactory or excellent). However, at the same time, many students did not feel safe or did not feel their schools were inclusive; 19-56 percent provided responses that resulted in a rating of ‗needs improvement‘. Table 4 presents students‘ perceptions of how safe, inclusive and respectful their schools are in terms of average scores on a scale from 1 (low) to 4 (high). Results are presented for subgroups of the population in order to see if perceptions vary by student background. Data are reported by gender, whether students‘ home language is the same as the language of instruction, and whether students‘ religions are the same as the religion of most of the students in their school. Results by gender indicate that female students have slightly more positive feelings about the school climate than do male students in all countries except Nigeria, although the differences are not large. Overall, across countries, students speaking a different language at home and in school have a less positive feeling about SIRC in their schools than students who speak the same language at home and in school. This was the case in Nigeria, South Africa, the Philippines and Thailand. Overall and in South Africa, the Philippines and Guyana, students who stated that they were members of a religious minority in a school had higher average scores on this scale.
Figure 3 SIRC in CFS: Student reports
46
56
19
41 44
24
51
42
68
54 51
67
3 2
125 5
9
0
20
40
60
80
100
Nigeria South Africa Philippines Thailand Guyana Nicaragua
Pe
rce
nta
ge o
f St
ud
en
ts
Needs Improvement Satisfactory Excellent
The SIRC scale measures how physically safe students feel, how emotionally safe students feel, and the extent to which students perceive the school as inclusive of all types of students.
Needs Improvement: Students do not feel physically safe at school; they worry about their safety and sometimes stay home because they do not feel safe. Students do not feel emotionally safe; students are disrespectful of one another, or adults do not demonstrate care and respect for students. Students do not feel that the school treats them all fairly or gives equal opportunities to them all.
Satisfactory: Students feel physically safe at school but they may occasionally worry about their safety going to or from school. They feel emotionally safe because students treat one another with respect, get along well together, and look out for one another, although they may occasionally feel that peers are disrespectful to one another. Students feel that they are treated fairly and that the school makes an effort to be inclusive and welcoming.
Excellent: Students feel physically safe in the school at all times. Adults are caring and treat students with respect. Students feel they are treated fairly and that all students are welcome and included.

23
Table 4 Students’ average score on the SIRC scale, by sex, language and status
Nig
eria
South
Afr
ica
Phili
ppin
es
Th
aila
nd
Guyana
Nic
ara
gua
Avera
ge
All students 3.08 2.94 3.37 3.16 3.12 3.32 3.15
Female 3.07 2.96 3.41 3.20 3.17 3.35 3.18
Male 3.09 2.93 3.33 3.11 3.07 3.28 3.12
Home Language
Same as in school 3.02 2.94 3.36 3.11 3.14 3.33 3.14
Different from in school 3.10 2.98 3.39 3.16 3.00 3.18 3.16
Religious Minority Status
Not a minority 3.07 2.99 3.42 3.16 3.17 3.32 3.18
Yes, minority 3.11 2.91 3.31 3.15 3.08 3.33 3.12
2.5 Safety and inclusiveness policies and their relationship on school climate
Although not as direct as student perceptions, staff perceptions of how safe, inclusive and respectful a school is are also important. School heads are responsible for leading the schools‘ efforts to be inclusive and can consider the schools‘ policies to promote inclusiveness and safety. Figure 4 shows that school heads‘ assessments of school climate – including whether conditions and policies are in place to engender a safe and respectful climate – were extremely positive. Figure 4 SIRC: School head reports
48
0 04
0
7480
54
80
65 63
22
12
46
20
3138
0
20
40
60
80
100
Nigeria South Africa Philippines Thailand Guyana Nicaragua
Pe
rce
nta
ge o
f D
ire
cto
rs
Needs Improvement Satisfactory Excellent
The SIRC scale measures the extent to which the school provides an environment in which students are physically safe; all students are given equal access to and opportunity to engage in school activities, academics and physical activity; and the school has policies and procedures in place to support a respectful climate.
Needs Improvement: The school head reports that school grounds are not always free from potential threats and not all staff members are trained in how to handle emergency situations. The school is not fully inclusive of all types of students, and procedures are not in place to support a respectful climate in which students, staff and families are aware of expected conduct.
Satisfactory: The school head reports that the school grounds are kept safe from potential threats at all times and most staff are trained in how to manage emergency situations. The school head reports a high degree of gender inclusiveness and inclusiveness of students with disabilities and students from different ethnic groups, although the school may not have a written policy about educating all students. The school takes action to encourage a respectful climate but may not have written policies in place.
Excellent: The school head reports that the school grounds are kept safe from potential threats at all times and the school has provisions in place to manage emergency situations. The school head reports a high degree of gender inclusiveness and inclusiveness of students with disabilities and students from different ethnic groups in school activities and classes, and has a written policy to that effect. The school has implemented policies that support a respectful climate, healthy teacher-student relationships, and procedures for students to report instances of harm

24
According to school heads‘ reports, few schools needed improvement on this dimension. The SIRC scale for school heads focused more on policy than the SIRC scales for teachers and students. Thus, although school heads report that policies and procedures are largely in place to support a positive school climate, those policies are not necessarily translating to positive school climates for students, and to some degree they are not translating to positive school climates for teachers. Teachers who have taught in other schools may have a comparative context, and they can speak to the degree of respect and inclusiveness by and among staff, as experienced by teachers. Teachers‘ perceptions were more tempered (Figure 5), but still more positive than the perceptions of students (see Figure 3). In Nigeria, the Philippines, Thailand and Nicaragua, 10 percent or fewer teachers responded in ways consistent with ‗needs improvement‘, a more positive assessment than that from students (see Figure 3). Teachers in South Africa, though, express similar views as students, with more than half reporting their schools as being unsafe, disrespectful, and lacking in trust between teachers and students. This may reflect the concerted effort made in South Africa to serve high-crime, high-poverty communities (Center for Justice and Crime Prevention, 2007).
Figure 5 SIRC: Teacher reports
9
53
7 10
21
9
74
43
6763
70
83
17
4
26 27
9 9
0
20
40
60
80
100
Nigeria South Africa Philippines Thailand Guyana Nicaragua
Per
cen
tage
of
Teac
he
rs
Needs Improvement Satisfactory Excellent
The SIRC scale measures the degree to which teachers perceive their school's environment to be safe and inclusive for their students. Further, this scale measures teachers‘ perceptions of the level of trust and respect that exists both among teachers and between students and teachers.
Needs Improvement: Teachers perceive their school environment to be unsafe, disrespectful and perhaps even hostile or crime-ridden. According to teachers, students and teachers do not support or trust each other and crime in the local community often pervades the school environment. Further, teachers do not believe that all students have equal opportunities to succeed at the school.
Satisfactory: Teachers perceive the school to have a highly safe environment for students, without any serious problems with bullying or crime and violence. Teachers report their relationships with students are trusting and respectful and that students are helpful or supportive of other students. Further, teachers perceive the school to have a welcoming environment for all children.
Excellent: Teachers perceive the school to have a highly safe environment for students, without any problems with bullying, crime, or violence either in the school or in the surrounding community. Further, the school is perceived by teachers to be free of biases against children who are at risk (e.g., children with disabilities). Teachers also feel that the school has highly respectful, supportive and trusting relationships among teachers, as well as between students and teachers.
2.6 How inclusive were school environments for all children? To examine how and how well schools are designed and have policies and resources to support inclusiveness, we looked at three things:
school infrastructure and policy;
teachers‘ behaviour and treatment of students; and

25
school resources and policies to support gender-sensitivity, inclusion of children with disabilities, and inclusion of children from other marginalized or otherwise vulnerable groups.
2.6.1 Physical environment Figure 6 provides information on whether the school environment – in terms of the physical environment and policies for grouping – accommodates all students. This scale, which shows the percentage of classrooms that need improvement, are satisfactory or are excellent, emphasizes physical accommodations for students with disabilities and how students are grouped. Many schools struggle to provide facilities (latrines, sinks, classrooms) that are accessible to all students, particularly those with disabilities, especially in Nigeria, South Africa and Guyana, where 26–56 percent of schools need improvement on this dimension.
35
Figure 6 Inclusive school environment and climate: School observations
26
56
816
37
20
4340
6872
4148
30
4
24
12
22
32
0
20
40
60
80
100
Nigeria South Africa Philippines Thailand Guyana Nicaragua
Per
cen
tage
of
Sch
oo
ls
Needs Improvement Satisfactory Excellent
The Inclusive School Environment and Climate scale measures the extent to which the school environment is designed to accommodate students with disabilities and from different cultural backgrounds, and the degree to which the school strives to facilitate these students‘ full participation in the educational process.
Needs Improvement: School facilities do not accommodate students with disabilities most of the time, and students may be grouped on the basis of background or disability status.
Satisfactory: School facilities are accessible to students with disabilities most of the time, and students are always grouped regardless of background or disability status.
ExcellentSchool facilities are accessible to students with disabilities all of the time, and students are always grouped regardless of background or disability status.
2.6.2 Classroom climate CFS are more successful at providing inclusive classroom climates, which depend upon the behaviour of teachers. Figure 7 provides the percentage of classrooms that need improvement, are satisfactory, or are excellent in terms of providing equal attention and support to all students regardless of background. In the Philippines and Thailand, 90 percent and 80 percent of classrooms, respectively, were deemed excellent on this dimension; in Nigeria, South Africa, Guyana and Nicaragua, 87 percent or more classrooms were judged to be satisfactory or excellent
35
In a later section we discuss aspects of the school environment that limit participation by students with physical disabilities.

26
Figure 7 Inclusive classroom climate: Classroom observations
713
28
46
27
10
20
43
23
46
60
90
80
56
69
0
20
40
60
80
100
Nigeria South Africa Philippines Thailand Guyana Nicaragua
Per
cen
tage
of
Cla
ssro
om
s
Needs Improvement Satisfactory Excellent
The Inclusive Classroom Climate scale measures the extent to which biases exist against particular groups of students in the classroom, such as male or female students, students with disabilities, or students from minority groups.
Needs Improvement: Teachers display an obvious bias against a particular group of students, for example male or female students, students with disabilities, or students from disadvantaged backgrounds. Moreover, students with disabilities are not given the appropriate guidance or support they need to succeed in the classroom.
Satisfactory: Teachers often encourage and support struggling students. Teachers usually pay similar amounts of attention to male and female students, as well as to students from disadvantaged backgrounds or minority groups.
Excellent: Teachers demonstrate similarly high expectations for both male and female students, and give both groups of students consistently equal attention. Regardless of students‘ race, ethnicity, language, or other socio-demographic characteristics, teachers usually provide each student with equal guidance, time and attention. Children who have special learning needs receive the necessary encouragement and guidance from teachers.
2.6.3 How gender-sensitive and inclusive are CFS?
Gender-sensitivity – the equal treatment and provision of access and opportunities to male and female students, as well as the provision of materials that are girl-friendly and devoid of stereotypes and derision – is a key element of the CFS model. Table 5 presents items from the student, teacher and school head surveys that are related to gender-sensitivity in schools. Students mostly feel that their schools provide female and male students with equal access to opportunities; about three-quarters or more in each country responded ‗mostly true‘ or ‗very true‘ to the statement ‗Both boys and girls have equal opportunities to succeed at this school‘. Table 5 Students, teachers and school heads’ perceptions of gender inclusivity and equality
Nig
eria
South
Afr
ica
Phili
ppin
es
Th
aila
nd
Guyana
Nic
ara
gua
Avera
ge
Both boys and girls have equal opportunities to succeed at this school.
All students 73 76 94 85 80 90 82
Female 72 76 95 86 81 92 84
Male 73 77 92 84 80 89 81
Teachers 97 93 99 98 99 99 97

27
Moreover, there was little disparity between female and male students on this issue. Teachers and school heads have an even more positive view of equality of opportunity for male and female students. In each country, at least 93 percent of teachers responded ‗mostly true‘ or ‗very true‘ to the above statement, while all school heads (100 percent) believed that about boys and girls being equally permitted and encouraged to participate in school activities, academic classes and physical activities. The site visit observations were consistent with the survey data. Table 6 presents the results of classroom observations on issues germane to gender inclusiveness and sensitivity. For the most part, site visitors observed that male and female students received equal time and attention from teachers and that teachers exhibited similar expectations for students, regardless of gender. Thailand and the Philippines were strongest in this regard; in 98-100 percent of classrooms, observers felt that it was ‗very true‘ that boys and girls received equal time and attention from the teacher, and in 96-98 percent of classrooms, observers said it was ‗very true‘ that the teacher showed similar expectations regardless of gender. While most classrooms in Nigeria, South Africa and Nicaragua demonstrated gender equality in terms of attention and expectations by the teacher, 11-20 percent were only ‗somewhat‘ or ‗not at all‘ gender sensitive. The pattern across countries is consistent with responses to the student survey shown in Table 4.
Table 6 Gender equality in instruction: percentage of classrooms observed
Statement
Nig
eria
South
Afr
ica
Phili
ppin
es
Th
aila
nd
Guyana
Nic
ara
gua
Avera
ge
In general, boys and girls receive equal time and attention from the teacher.
Very true 89 84 98 100 88 89 91
Somewhat true 11 13 2 0 12 9 8
Not at all true 0 3 0 0 0 2 1
The teacher shows similar expectations for both boys and girls (e.g., asks questions of similar difficulty).
Very true 86 80 96 98 85 85 88
Somewhat true 14 14 4 2 15 11 10
Not at all true 0 6 0 0 0 5 2
Interviews and focus groups with school heads, parents and teachers provide strong additional support for the above findings. These data also suggest that male and female students are afforded equal opportunities and that all three groups of stakeholders view gender inclusiveness as a critical element of a CFS. For example, teachers stated that CFS should be places where ―…equal opportunities abound for both sexes…‖ (Teacher, 02, Nigeria), based ―…on the principle of equality…‖ between and among all students (Teacher, 15, Thailand). School heads and parents expressed similar sentiments. For example:
Students take part in almost all activities. Both boys and girls have an opportunity to provide suggestions and express [their] opinions. When teachers and schools are more open for students to speak up, the school found that students are able to think and act [more] independently and reasonably than expected.‖ —School head 17, Thailand. A child-friendly school is a school that . . . promotes and practices gender equality among pupils: ensures that all children come to stay and learn in schools; anyone who wants to be enrolled [is] taken in; [the school] provides the same opportunities for boys and girls inside the classroom.‖ —School head 11, Philippines. [A CFS] is gender-sensitive. Girls have equal chances as boys—includes educational opportunities, curriculum, chores/school duties.‖ [This school head went on to describe his/her own school as gender-sensitive.] ―Girls are confident and show leadership qualities. Girls are doing technical subjects. Girls do the same chores as boys and work in class. There is no discrimination and students feel equal.‖ —School head 25, South Africa.

28
Both boys and girls have a chance to come to school.‖ —Parents 08, Guyana. It is also an inclusive school where all boys and girls have rights to come here.‖ —School head 09, Nicaragua.
The HLM analyses support these findings. Compared to male students, female students had higher perceptions of SIRC, academic challenge and the level of support provided by teachers and adults in the community. Nonetheless, some female students perceived barriers. Although classroom observations (Table 6) suggest high levels of gender-sensitive instruction, there were still some classrooms where boys and girls were not necessarily treated equally. Moreover, we observed that culturally-grounded gender stereotypes determined students‘ opportunities to some degree.
36
For example, although a school head explained to the site visitor that all children received all services regardless of gender, food from the school food programme was distributed to all the boys first, then to all the girls and the school head confirmed that this was the way it worked every day. Parent responses in some schools provide another example. In response to the question ‗How have [activities supporting inclusiveness] supported access for girl students in particular?‘ parents in one Thai school said, ―Equally treated, equal access, and similar opportunities to succeed. However, in terms of assigning tasks, there‘s still a difference due to the physical condition of the boys and girls.‖ They gave an example of boys doing ―…more difficult or labour work, girls doing indoors, household work.‖
2.7 How responsive and inclusive are CFS for children with disabilities? Around the world many students with disabilities are excluded from schools. Some have emotional and cognitive disabilities such as emotional disturbance and learning disabilities, which are sometimes called ‗invisible disabilities‘. Others have sensory and orthopaedic disabilities, which are visible. Often schools, particularly those with few resources to begin with, are not equipped to handle students with special needs, or school leaders and teachers feel that they are not. In the CFS we visited, our interviews and observations suggest three things:
there is no common definition of disability that includes both ‗invisible‘ and ‗visible‘ disabilities;
many teachers and school heads were sensitive to the needs of students with emotional and cognitive disabilities and understood the relationship of trauma and broken families to these disabilities; and
many school buildings and grounds were not designed to accommodate students with physical disabilities.
School head surveys suggested variability in efforts to reach out to and support children with disabilities; surveys and interviews indicated that school heads felt ill-equipped to serve children with disabilities, mainly due to lack of sufficient teacher training. Moreover, UNICEF Education Officers perceived that teachers did not have sufficient training in supporting children with special needs. Table 7 presents school heads‘ responses to survey statements related to schools‘ efforts to screen students for learning disabilities and provide equal opportunities to participate in school activities, as well as schools‘ access to teachers with special training in working with students with disabilities. There is wide variation across the six countries with respect to efforts to reach out to students with disabilities. While 75 percent of school heads in Nicaragua and 70 percent in Nigeria said that school staff go out into the community to encourage the enrolment of students with disabilities, only 16 percent in South Africa and 19 percent in Guyana said the same. Most of the schools visited in the Philippines and Thailand screened students for learning disabilities (83 percent and 88 percent, respectively), but only 40 percent in South Africa and 27 percent in Guyana screened students. Even when schools did provide screening, it was not clear if the results were used to provide services or simply to ‗label‘.
36
This finding is based upon anecdotal evidence and informal observation and was not captured in the observation protocols.

29
Overwhelmingly, school heads reported little access to teachers with special training in working with students with disabilities. The percentages ranged from 4 percent in South Africa to 29 percent in Nicaragua. This challenge was also reflected in numerous comments (presented later), mainly by school heads, regarding the difficulties they faced in appropriately serving children with disabilities. Although efforts to include and identify children with disabilities were uneven, and schools‘ resources to teach students with disabilities were lacking, most schools in the six countries reported that students with disabilities were afforded the same opportunities to participate in school activities. The percentages ranged from 83 percent in Nigeria to 100 percent in Thailand saying this was ‗mostly true‘ or ‗very true‘. Table 7 School heads’ perceptions of school efforts to provide educational opportunities for
students with disabilities
Statement
Nig
eria
South
Afr
ica
Phili
ppin
es
Th
aila
nd
Guyana
Nic
ara
gua
Avera
ge
This school screens students for learning disabilities, such as difficulty with reading and mathematics.
52 40 83 88 27 83 62
This school has teachers who have been specially trained to work with students with disabilities.
17 4 25 28 12 29 19
Students with disabilities are offered equal opportunities to participate in school activities.
83 84 96 100 88 92 90
Table 8 presents school observations on the accessibility of school facilities and opportunities for students with disabilities. Table 8 Percentages of schools with accessible facilities for students with disabilities
Nig
eria
South
A
fric
a
Phili
ppin
es
Th
aila
nd
Guyana
Nic
ara
gua
Avera
ge
All school buildings and classrooms are accessible to students with physical disabilities.
Very true 63 17 75 39 19 55 44
Somewhat true 31 43 17 48 43 23 34
Not at all true 6 39 8 13 38 23 22
Drinking water is accessible to students with disabilities.
Very true 53 33 54 61 19 50 46
Somewhat true 32 19 21 30 25 27 26
Not at all true 16 48 25 9 56 23 28
Latrines and sinks are accessible to students with disabilities.
Very true 53 32 67 39 16 78 48
Somewhat true 27 9 21 52 47 9 27
Not at all true 20 59 13 9 37 13 25
All outdoor play areas are accessible to students with physical disabilities.
Very true 61 25 76 63 56 45 54
Somewhat true 28 21 24 25 28 20 24
Not at all true 11 54 0 13 17 35 22

30
In this case, the focus is largely on students with physical disabilities. Overall, about a quarter of schools had limited accessibility to all classrooms and buildings, drinking water, latrines and sinks, and outdoor play areas, and there was wide variation across countries with respect to accessibility. For example, while 59 percent of the schools in South Africa had latrines and sinks that were not accessible to students with disabilities, this was true for only 9 percent of schools in Thailand and 13 percent in Nicaragua. There was also variation within countries in whether schools were accessible and regarding what was accessible. For example, while drinking water was inaccessible to students with disabilities in 25 percent of schools in the Philippines, latrines and sinks were inaccessible in 13 percent of schools and all outdoor play areas were at least somewhat accessible. Photos 1 and 2 illustrate the range of what was available in CFS in terms of accommodations for students with disabilities. Photo 1 shows the typical situation observed across countries; the school did not have ramps or other means of enabling easy access for children with physical disabilities. Photo 2 shows a school in Nicaragua that was fully fitted with ramps by an international NGO, Handicap International. About half of the schools visited in Nicaragua had these accommodations.
Photo 1 School with limited accessibility to
students with disabilities, South Africa (typical for
most countries)
Photo 2 School grounds accessible to students
with disabilities, Nicaragua (atypical for most
countries but present in many CFS in Nicaragua)

31
2.8 CFS increasing and student participation Enabling the participation of all children in school is a major goal of the CFS model and of UNICEF in its efforts to advocate on behalf of children. As discussed earlier in this chapter, CFS do this by seeking out children and creating the conditions to encourage them to enrol and persist. For example, schools seek out children through community mapping and home visits to identify eligible children and encourage them to enrol by providing incentives (e.g., providing feeding programmes) or helping overcome financial barriers (e.g., purchasing a school uniform). It is hoped, too, that by providing a quality and supportive learning environment and involving families, as described in subsequent chapters, schools will be able to help parents and children see the value of education and encourage children to stay engaged despite competing interests such as the need to help out at home or work to provide financial support to the family. Determining the degree to which CFS are successful at enrolling all eligible children in their catchment areas, and the degree to which certain groups of children (e.g., certain ethnic groups or students with disabilities) are excluded, was beyond the scope and resources available for the evaluation. We did, however, incorporate into the evaluation design an examination of outcome variables that speak to the level of student participation once enrolled: attendance (or absenteeism), persistence and learning outcomes. Our intention was to obtain these data for all CFS visited as well as for comparison schools (traditional government schools not implementing a major reform and government schools implementing another intervention) from the country‘s EMIS, and then to compare attendance and dropout rates to determine the impact of CFS on these outcomes variables.
37
However, EMIS data which would have enabled further analysis was incomplete. In some countries data was obtained during CFS visits, but often data were missing for at least some schools or for one or more variables, despite the efforts of the UNICEF country offices to obtain the data from the EMIS or schools directly. In some cases we were unable to get any data through the EMIS (or UNICEF country offices) for any of the schools visited. Another complication was that data across and even within countries was not always comparable (e.g., some schools reported pass rates and others reported scores).We were also unable to satisfactorily identify comparison schools and obtain credible or complete data for them. In some cases we were able to identify schools to serve as comparison schools but the data on the outcome variables was often unavailable or incomplete. In other cases identifying comparison schools was not possible. We ultimately determined that we could neither compare CFS to a set of comparison schools nor report the EMIS data we obtained for the CFS. The evaluation was successful, however, in collecting data related to student attendance and dropout rates from students and schools during the school site visits and we present these data here. Our four variables are as follows:
students‘ reports on being absent during the last year without permission from school or family (reported as percentage of students);
students‘ reports on being absent during the last year in order to work or help out at home (reported as percentage of students);
schools‘ reports on the percentage of students absent from school on a typical day (reported as percentage of schools); and
schools‘ reports on the percentage of students that dropped out of school in the previous year (reported as percentage of schools).
These data, although imperfect, provide some gauge of whether absenteeism and dropping out are a problem in CFS and which students may be at greater risk because of greater absenteeism. Students reported two types of absences: those for which students do not have permission from school or family,
37
In addition to school-level data on attendance rates, dropout rates, and learning outcomes, we sought (but were largely unsuccessful in getting) information on enrolment of children in minority groups.

32
and those because students were working or helping out at home. Presumably, neither of these includes absences due to illness, which could be substantial given some of the health risks in the communities served, or other reasonable and approved absences. Lengthy absences of migrant children would likely be categorized as absences due to needing to work or help out at home, but may not be. Thus, in reporting these two types of absences we are not reporting all possible types of absences; nor are we reporting all types of absences typical of children at risk (e.g., those with health problems). As shown in Table 9, a higher percentage of males than females missed school without permission from school or family in five of the six countries; the exception was Nigeria where more females missed school without permission. There is a clear, negative relationship between grades and unexcused absences; more low-performing students missed school without permission than higher-performing students. Students who speak the same language at home and at school were more likely to miss school without permission in most countries than students who speak a different language, and students who are in a religious minority group in their school are more likely to miss school without permission than students in the majority. Table 9 Percentage of students reporting absence from school without permission in last year
Nig
eria
South
Afr
ica
Phili
ppin
es
Th
aila
nd
Guyana
Nic
ara
gua
Avera
ge
All students 38 35 18 26 43 37 32
Female 40 34 14 22 42 34 30
Male 36 36 23 31 44 40 34
Self-reported Grades
Excellent 27 25 9 18 36 28 27
Good 44 31 15 23 41 41 29
Fair/Poor/Failing 54 47 33 36 54 43 43
Home Language
Same as in school 48 35 20 31 43 37 35
Different from in school 35 36 17 25 42 25 28
Religious Minority Status
Not a minority 40 33 16 25 41 38 30
Yes, a minority 34 38 23 30 46 34 35
The situation is slightly different for absences due to working or helping out at home, presented in Table 10. Table 10 Percentage of students absent from school in order to work or help out at home
Nig
eria
South
Afr
ica
Phili
ppin
es
Th
aila
nd
Guyana
Nic
ara
gua
Avera
ge
All students 38 18 20 16 33 17 24
Female 38 16 17 14 30 12 21
Male 38 20 25 17 37 25 27
Self-reported Grades
Excellent 31 13 12 10 27 14 22
Good 42 15 18 14 33 20 23
Fair 44 24 31 21 42 17 28
Home Language
Same as in school 45 19 23 14 33 17 24
Different from in school 36 15 18 16 36 30 23
Religious Minority Status
Not a minority 41 19 20 15 32 17 23
Yes, a minority 34 15 21 17 35 19 24

33
Males students are more likely – overall and in all countries but Nigeria – to miss work for this reason than females students; in Nigeria there was no difference between males and females. In Nicaragua the difference between male and female absenteeism due to work is striking (12 percent for females and 25 percent for males) and is also much greater than the difference between male and female absences without permission. Although the relationship between grades and absences due to work is also negative (higher grades mean fewer absences), it is not as strong as for absences without permission. The relationships between home language and absenteeism due to work, and between students belonging to a religious minority group and absenteeism due to work, are weak overall and in most countries. Nonetheless, our HLM analyses suggest which absences can be related to not feeling fully included: students who missed school due to work or family obligations reported that their school provided a significantly lower SIRC, lower CSCLE, and lower Emotionally Supportive Climate than students who did not need to miss school.
Students who reported missing school due to work or family commitments may be considered the most vulnerable students within CFS, since this group is likely to be socioeconomically disadvantaged, with fewer social supports. Students who are at risk or struggling need a diverse array of supports, both instructional (i.e., student-centred, innovative pedagogic techniques) and psychosocial (i.e., SEL and encouragement from parents and community members on the importance of continuing their education). Table 11 presents schools‘ reports on absenteeism (without qualifications for the reasons). With one exception (Guyana) there is not a great deal of variation from country to country. Table 11 School reports of absenteeism and drop out rates (in percent)
Nig
eria
South
Afr
ica
Phili
ppin
es
Th
aila
nd
Guyana
Nic
ara
gua
Avera
ge
Students absent on a typical day last year - 6 6 6 15 7 8
Students that dropped out last year - 4 1 1 3 4 2
a Data are not available for Nigeria.
The percentage of students that dropped out last year ranged from 1 percent in the Philippines and Thailand to 4 percent in South Africa and Nicaragua. Although dropout rates are notoriously hard to compare because there are myriad ways to define dropout, these rates are lower than the average dropout rates in developing countries – on the basis of 2004 data for all grades, UNESCO reports average dropout rates in developing countries at 22.4 percent,
38 while the average dropout rate reported
by the CFS visited in five of the six countries (data are not available for Nigeria) is 2 percent. Site visits in the Philippines, which had the lowest figure, suggest that many schools there were intentionally targeting dropouts or doing things which research suggest are likely to reduce dropouts (e.g., Chistensen & Thurlow, 2004). Here are two examples: The first involves home visits, which are often conducted through the Secondary Schooling Alternatives programme, which tracks Students at Risk of Dropping Out. When such a student is identified, the school will intervene. Teachers will visit and interview the parents to discern the primary cause of the student‘s absenteeism. If the reason is financial, teachers will often contribute a small amount of financial assistance to offset the costs of sending the child to school. The second example involves a school located in an extremely poor neighbourhood, where many children work in the small-scale mining industry. The school is located over five km away from most families‘ homes. With such a long walk to school and arduous working conditions, many children did not attend school. Under the CFS initiative, the school, the Parent Teacher Community Association (PTCA) and
38
Dropout rates just for the six countries visited were not available.

34
Baranguy collaborated to pass an ordinance prohibiting children from working during school days. These efforts required a large amount of advocacy work against child labour and in favour of a child‘s right to education. In addition, at this school, teachers and school officials developed a student adoption programme: students who live in distant areas and cannot walk home for lunch are adopted by a teacher who provides them with lunch during the school day.
2.9 Challenges to being inclusive School heads, teachers and parents value inclusiveness and view it as a key element of the CFS model, and mostly feel that their schools are inclusive in many ways. However, they also acknowledge some challenges and barriers, particularly around serving children with disabilities and otherwise vulnerable groups. 2.9.1 Challenges to being inclusive in respect to students with disabilities School heads felt that serving students with disabilities was an enormous challenge for which their schools were not equipped. When school heads and parents discussed serving children with disabilities, more often than not they talked about the challenges rather than the positive aspects of including such students. These challenges varied by the type of disability. Stakeholders did not necessarily say that serving physically disabled students was impossible or overtly challenging from the school‘s perspective. They did, however, describe challenges associated with serving children who had learning disabilities or other cognitive disabilities, including frustration with not having teachers trained to teach students with disabilities, particularly in Guyana and South Africa. For example:
New curriculum often adds barriers to slow learners. We do have a remedial class for those who are slowest and a trained teacher. She makes her own materials for these learners. Of course, many do not receive help.‖ —School head 02, South Africa. We have a few students with certain disabilities and we tried but there wasn‘t much we could have done. We would be willing to provide access to all students. In order to adapt to such a policy we would need special training.‖ —School head 12, Guyana. There is one child we think is extremely slow but the parents are not willing to accept [it]. Teachers are not trained to deal with that particular child (none of us has been trained to deal with the child).‖ —School head 03, Guyana. We don‘t discriminate. There is gender equality when we employ teachers, and even in management positions. We have children who are albinos and learners from different religions and we do not discriminate against them. As a barrier, our educators are not trained enough to teach learners who have specific needs.‖ —School head 12, South Africa.
In interviews, school heads described accessibility of physical structures to students with physical disabilities as a challenge, but this was never identified as a barrier to serving these students.
If we could rebuild the grounds I would make it child-friendly for disabled children.‖ —School head 01, South Africa. The whole class uses a downstairs classroom in order to create accessibility to their disabled friend to the classroom.‖ —School head 25, Thailand.
Site visitors did not see evidence that many students with sensory and orthopaedic disabilities were actually enrolled in the schools visited and the evaluation was not designed to systematically capture this information.
39 Moreover, it was not always evident whether students with disabilities who resided in the
community were enrolled in other schools in the community, such as schools especially for students for
39
The evaluation did not include a community mapping exercise to determine how well schools are reaching populations of students with disabilities, as well as other vulnerable populations, as doing so would have been cost prohibitive.

35
special needs; whether these children were enrolled but absent in greater numbers than students without disabilities; or whether they were not enrolled in school at all. When students with disabilities were not observed and site visitors probed, responses such as the following were elicited.
There may not be children with disabilities here because they are scared to come to the school. The grounds are very rough and they wouldn‘t be able to get around.‖ —Teacher, South Africa. The disabled are not many in this school because there are specialized schools for them. The government tries to help these disabled children by providing free chairs, uniforms, books, and everything.‖ —Parent 07, Nigeria. There are some children with disabilities in the area and the school provides a budget for toys for these children and teachers go to their home to teach them.‖ —Parent 08, Thailand. We have one special student (deaf/dumb). The parents could not afford to pay for transportation so he could not go to the Special Needs School. But, he is doing well in the arts section.‖ —School head 17, Guyana.
2.9.2 Challenges to gender equality In interviews conducted at the school level, school heads, teachers and parents identified few obstacles to gender inclusiveness and equality. That is not to say that there were no obstacles, such as cultural norms and ingrained stereotypes pertaining to gender roles that were not easily overcome, but rather that these were not viewed as obstacles. There was also a sense, particularly among parents and particularly in Thailand and the Philippines, that focusing on gender is not necessary, not because equal rights for boys and girls are not important but because schools already do treat female and male students the same way and provide them with equal opportunities.
This is not a real issue in the Philippines right now. Girls may have been receiving less than deserved or at least less than what their male counterparts received, but that was in the past. And even then, there is not much to complain about, since girl-children have about the same experiences as boy-children.‖ —Parents 05, Philippines. To the question ‗How have [activities supporting inclusiveness] supported access for girl students in particular?‘, parents said it was ―Not applicable to this country.‖ —Parents 03, Philippines. ―Girls and boys are given similar opportunities in this school – both within the classroom and outside the classroom – and parents do not feel there is a need to focus on girls‘ achievement. Treatment of students in based on their capacities, not their gender.‖ —Parents 22, Thailand. No gender issue at this school – girls are given the same opportunities as boys. For example, both boys and girls are selected to participate in sporting events and other school competitions.‖ —Parents 25, Thailand.
However, there are some specific challenges to ensuring equal access for girls that adult stakeholders acknowledge they grapple with. In Nigeria, early marriage of the girl child is noted as a challenge some schools face in being child-friendly and inclusive. Pregnancy of girl children was mentioned in several countries as a threat to girls‘ access to education, but particularly in South Africa.
Girls are given equal opportunity as boys. But parents [in the focus group] agreed to widespread early marriage and teen pregnancy. Thus girls do not seem to have equal opportunity as the boys because of the early marriage issue.‖ —Parent 12, Nigeria. There is a high teenage pregnancy rate. Usually these girls are orphans so they have to stay at home and look after their baby if they get pregnant. They are then excluded from school in that sense.‖ —Parents 21, South Africa.

36
2.9.3 Challenges to being inclusive of culturally and linguistically diverse and otherwise vulnerable populations The challenges schools face serving children with diverse cultural and language backgrounds and from impoverished families, and schools‘ responses to aiding such populations varied across countries. The challenges of serving children with different home languages than the language of instruction arose in many interviews with school heads, teachers and parents in Thailand and Nigeria, while less so or not at all in the other countries visited. Teachers in several schools in Nigeria said a ‗language barrier‘ existed and was a major challenge to the schools‘ being child-friendly. Teachers in another school in Nigeria explained that they resorted to using the local dialect if pupils didn‘t understand what was being taught in the official language of instruction (English). School heads, teachers and parents in Thailand talked about the challenges of serving ‗hill tribe‘ children (in northern Thailand), displaced children and ‗sea gypsies‘. Some of these challenges, although not all, were described as revolving around language. While teachers and school heads talked about the challenges around serving these populations, they also talked about the opportunities and, in doing so, reflected what a CFS is or should be.
― . . . small children, particularly Kindergarten level to Primary One level need to have additional teaching and learning media of all subjects, particularly Thai language teaching. Furthermore, teachers state that Muser or so called Lahu (hill tribe) students cannot speak Thai very well. . . All teachers conclude that the school does not have enough teaching and learning facility to develop their skills in reading, writing, and calculating.‖ —Teacher 09, Thailand. ―When the first groups of hill tribe students attended this school, they were not happy at all, due to the stereotype the lowland people have about them. . . And, the hill tribe dialect used by minority groups does create a problem. So, [the school head] had to explain to both groups to give each other some time to be patient, give a chance for their friend[s] to adjust, and not to let stereotype[s]…delude the reality. The school head also had to enforce people (students and teachers) to use central Thai as a common language, because the lowland students did not understand the hill tribe dialect and hill tribe students did not understand the northern dialect either. This problem happened three years ago. Now no more problems, everyone gets along well. There have [been] more hill tribe students who assimilate well and [have] become friends with lowland students.‖ —School head 02, Thailand. ―[CFS] means a school that provides support to all kinds of students regardless of their race, gender, and ethnicity. For example, in this school, Thai, hill tribe, and [ethnic] students can study and receive support from teachers and the School Committee and they feel they are part of the school.‖ —Parents 01, Thailand.
A major challenge in South Africa and Nigeria and in some Thai schools visited is serving orphan children, many of whom have been orphaned as a result of HIV/AIDS. School heads talked about the barriers to getting orphans and vulnerable children to attend and stay in school, including the need these children may have to support their siblings. Female orphan students may be particularly vulnerable to dropping out of school.
[It is] hard to teach a child who is heading a family and facing adult issues (e.g., sister is going hungry). Some kids absent themselves, child is pregnant and living with a grandmother who is ill and afraid [the girl] will drop out.‖ —School head 16, South Africa. [We provide] services targeting orphans and pregnant woman. Nearly 40 percent of our students do not have proper homes or families so we support extra programmes for those learners.‖ —School head 18, South Africa. [Our] school committee is charged with identifying orphans and proposing remedies to improve their condition.‖ —School head 01, Nigeria.
The issues here are complex and relate to the behavioural and mental health needs of children and youth. Teachers report that many of these children and youth, particularly girls, have been abused (e.g.,

37
South Africa 09). Although informants did not mention it, research suggests that such children will have powerful behavioural and mental health needs (e.g., American Academy of Pediatrics, 1994), which will place them at greater risk for early withdrawal from school (Boler & Carroll, 2003; Cole et al., 2005).
2.10 Previous research on CFS Findings in this evaluation are largely consistent with studies that have been conducted in the last five years on the ways in which CFS promote inclusiveness, respect and respond to diversity, and provide equal access to free, high quality educational opportunities for all children (e.g., Bernard, 2005; UNICEF Cambodia, 2005, 2007; UNICEF Kazakhstan, 2005; UNICEF Nigeria, 2005; UNICEF Tajikistan, 2007; UNICEF Thailand, 2006, 2007). These evaluations were conducted across geographic regions, in countries such as Kazakhstan, Tajikistan, Nigeria, Cambodia, Thailand and multiple countries in the eastern and southern Africa region. These evaluations identified common problems to ensuring that all children are enrolled in school, including structural factors (i.e., availability of safe classroom spaces; absence of qualified teachers) and behavioural factors (i.e., traditional teaching methodologies that do not cater to students‘ individual learning styles). These studies suggest that schools can promote inclusiveness in several ways. Schools can encourage and strengthen partnerships with parents and community members by encouraging their active participation in school events and decision making activities either informally or through the formation of Parent Teacher Associations (PTAs) and School Management Committees. To encourage enrolment, attendance and retention of traditionally marginalized students, such as females and students with disabilities, school leadership can implement scholarship, feeding and transportation programmes that directly address the obstacles these children face in coming and staying in school, such as poverty and transportation. School leadership can also provide teachers with ongoing training and support on innovative child-centred teaching methods that encourage students‘ active participation both inside and outside the classroom. In fact, although only a few evaluations point to blatant examples of differential treatment in the classroom or in teachers‘ and parents‘ expectations for boys and girls, most studies recommended ongoing training of teachers and school personnel, as well as advocacy among parents and community members on gender sensitization, disability rights and inclusive education. In 2007, a review of the CFS initiative in Pakistan was conducted by UNICEF to capture the myriad ways in which schools promote inclusiveness. This review found that several schools conduct community mapping activities and use community mobilizers to encourage parents to send their out-of-school children to school (UNICEF Pakistan, 2007). During the school year, if students are absent, teachers or other students visit the parents and encourage them to continue to send their children to school. PTAs are also employed to track student absenteeism. The Pakistan study (UNICEF Pakistan, 2007) results suggest that schools that invest heavily in training their teachers to use child-centred teaching methods and regularly monitor and mentor their teachers (i.e., form monthly cluster meetings; hire support staff to reduce teachers‘ workloads) are also more successful in reducing dropouts and retaining students, creating more child-friendly atmospheres. However, senior teachers often have a harder time adjusting to the innovative teaching techniques that are at the heart of the CFS approach. In addition, some schools are reluctant to invest in teacher training when staff turnover is high. Pakistan is also a country wherein gender roles are deeply embedded in cultural norms and society is segregated along gender lines. In the Pakistan evaluation (UNICEF Pakistan, 2007), the evaluators observed that in CFS, gender barriers have begun to break down. For example, two schools led active campaigns to enrol both boys and girls in preschool and early grades. In some schools, mixed groups are formed where boys and girls complete assignments together. Teachers also appear conscious of giving both boys and girls equal time and attention during class activities. And finally, to counteract discrimination, encourage input and provide opportunities for education and advocacy, Women‘s Village Education Committees and PTAs are formed at several single-sex schools. As a second example, Bernard (2005) conducted an evaluation of Cambodia‘s CFS project in three diverse regions of the country, again to examine the ways in which schools promote inclusiveness.

38
Students, parents and teachers in this study report that schools are devoting a great deal of effort to create welcoming and inviting classroom environments and as a result, students are indeed happier attending school. For example, classrooms are better decorated and stocked with learning games; teachers are kinder and encourage more interactions between students and themselves; nutritious and warm breakfasts are provided for students; and school play equipment is well-maintained. With these changes and the resultant positive attitudes among students, parents are more enthusiastic about becoming involved in their children‘s education and have greater expectations for their children‘s education. Although Bernard (2005) found few reliable statistics to support the claim that the CFS approach has reduced dropout rates in Cambodia, anecdotal evidence abounds. For example, scholarship programmes targeting poorer children have been developed as have remedial instruction and vocational courses in several schools, in collaboration with community members. Although quantitative evidence is scant, teachers and school heads report that dropout rates have decreased and retention rates have increased as a result of these programmes. Finally, results from Bernard‘s evaluation also suggest that the importance of inclusion for children with physical disabilities is just now ―…coming to prominence especially at the level of national policy…‖ in Cambodia (Bernard, 2005, p. 21). A more comprehensive definition of inclusiveness wherein students with learning disabilities are integrated into mainstream classrooms was also not yet widely recognized by stakeholders (Bernard, 2005, p. 21). As a result, some but not all Cambodian CFS were successful in their attempts to recruit and integrate children with disabilities. Interviews with teachers revealed that most schools are not prepared to receive children with disabilities; in fact only one school has successfully integrated visually-impaired students into classes.
2.11 Lessons from the Delphi survey of UNICEF Education Officers40 Responses from UNICEF Education Officers to the web-based Delphi survey were consistent with our findings from the six countries regarding challenges. Although respondents felt that inclusiveness was important, they also indicated that efforts to apply the principle of inclusiveness in CFS globally need to be strengthened. For example, 69 percent of respondents said that ―…teachers in Child Friendly Schools do not have sufficient training in how to support children with special needs…‖, which mirrors what we learned in the site visits about the challenges schools face in appropriately serving children with disabilities. Respondents view CFS as an important vehicle for improving the quality of education and in turn making education attractive to children and families of children out of school or at risk of dropping out so they enrol in and stay in school. A respondent wrote: ―The emphasis of the CFS is to address the issues of retention and learning for the most marginalized (the hidden dropout ones). Ways must be found to retain them (to make the school principals and teachers skilled [in] how to deal with equity/disparity issues) and the CFS is the major tool for this.‖ Another said that CFS can bring children to school ―…through a three-fold perspective: make the school attractive (physically, pedagogically, protection against violence...), sensitization of youth, and development of [an] alternative model of schooling responding to the specific needs of youth.‖ However, when asked to say how frequently elements of CFS – architecture, services, pedagogy, participation and governance, and inclusiveness – are implemented in the country in which they work, only 6 percent of respondents said that inclusiveness is ‗most often‘ implemented. Most respondents stated that there is greater emphasis in the countries in which they work on retaining children currently enrolled in school than on seeking out children not currently enrolled. In particular, although there are efforts that focus on getting children not enrolled to enrol, there is not a great deal of emphasis on ‗out-of-school youth‘ (interpreted as older youth not enrolled in school).
40
Based on responses to closed-response survey questions and open-ended questions. Frequency data for closed-response survey questions are presented in appendix D.

39
Respondents indicated that at the school level, more can be done to be inclusive and create conditions that facilitate the full participation of all children: only 37 percent said that administrators and teachers ‗take concrete actions to make their schools inclusive‘ (mostly or very true) and more than half of the respondents (54 percent) said that school stakeholders in the countries in which they work are not as well equipped to identify social barriers to achieving the goals of CFS compared with the ability to identify structural barriers. There has been progress at the government level in establishing or moving towards policies that support inclusiveness (e.g., local language instruction). However, most respondents felt that more should be done to address these less tangible barriers to inclusiveness.

40
CHAPTER 3 – CHILD-CENTREDNESS: PROVIDING SAFE AND PROTECTIVE LEARNING ENVIRONMENTS
A child-friendly school is more than just a place for formal learning. It is an institution that recognizes and respects the range of rights of children and not just their rights to be educated. These rights also include their rights to be healthy, to be given opportunities for play and leisure, to be protected from harm and abuse, to express their views freely and to participate in school decision-making according to their evolving capacities.
A child-friendly school takes the lead in shaping a learning environment that enables the children to learn as much as their intellectual facilities could take. It is a kind of environment that allows them to grow healthy, equips them with knowledge and skills that they can use throughout life, and enables them to become responsible and productive members of their community and society.
The core principle of child-friendly schools [is]creating a learning environment [that is] more than just a sum total of the pupils, teachers, families and community where the school is located…[and is]a healthy learning environment that enhances not only the child‘s academic achievement but ensures his/her whole being… physical, psychological, social, emotional as well as spiritual growth.
— School head, the Philippines
________
The Convention on the Rights of the Child articulated children‘s right to a healthy, safe and protective environment by calling for governments to provide education to ensure children‘s safety through protection from and prevention of maltreatment, and to take appropriate measures to provide children with necessary provisions and services that support their health and hygiene. Reflecting the emphasis on child rights in the CFS model, UNICEF calls for CFS to create:
…a learning environment that is free from fear, anxiety, danger, disease, exploitation, harm or injury. They need to create a healthy, safe, and protective environment through the provision of school-based health, nutrition, water and sanitation services, and codes of conduct against violence.‖ (UNICEF, in press, Chapter 5, p. 3).
By being child-centred and focusing on the needs of the whole child, CFS facilitate children‘s right to learn in a safe and secure environment with many of their basic needs met. In this section, we describe how and how well CFS are child-centred through their support for children‘s safety, health and hygiene. We address these issues through data from the six countries regarding:
school support for children‘s physical safety and comfort through appropriate architecture, design features, a welcoming appearance and appropriate school policies;
school support for children‘s emotional safety through services and positive student-teacher relationships;
school support for children‘s health and hygiene through the provision of proper hygiene, sanitation, nutrition services and health education; and
challenges schools face in providing support to children and healthy, safe and protective learning environments.
Multiple sources of data to were used to address these issues:
survey data collected from students to report on how emotionally and academically supported students feel;
survey data collected from school heads to report on services provided to support children‘s safety, health and hygiene;

41
observations of schools and classrooms to report on school architecture, design and appearance and the availability of key sanitation facilities;
interviews with school heads, teachers and parents on how and how well schools support children‘s safety, health and hygiene; and
statistical analyses. Finally, the evaluation provides a context for findings from the six countries by describing previously conducted research on child-centredness in terms of supporting students and providing healthy, safe and protective learning environments in CFS globally. We also discuss findings germane to child-centredness in CFS – in terms of support for students and healthy, safe and protective learning environments – from the web-based Delphi survey of UNICEF Education Officers. Although not all issues are addressed by each source, we document when multiple sources converge or diverge on a particular issue.
3.1 Summary of key findings
About two-thirds or more of the schools visited in each country had physical environments that met at least the minimum standards for providing safe and comfortable environments conducive to learning (e.g., structurally sound buildings and classrooms, students protected from dangers such as toxic materials, sufficiently ventilated classrooms). However, school heads, teachers and parents reported pervasive challenges to maintaining school buildings and grounds and in some schools reported severe problems related to security, such as vandalism.
Most students (more than two-thirds of students in each country) reported that adults in their schools supported them, listened to them, cared about and helped them.
Eighty-four percent of students stated that they felt safe in school, but when the items were expanded to include emotional safety and a respectful climate the number dropped to between 15 and 52 percent of the students in different sites.
Our HLM analyses determined that both family and community participation and the use of child-centred pedagogies had a consistently positive relationship with student perceptions of safety and support. In most countries, nearly all schools meet minimum requirements or better for providing safe and sanitary conditions. However, there is wide variation in the availability of services to support students‘ health and hygiene and some schools are struggling to meet the basic needs of their students, such as providing consistent access to drinking water (unavailable in 16 percent of schools across countries and as many as 32 percent within a country). In all countries, school feeding programmes were cited as a key service to promote inclusion and student engagement and learning, but such programmes are not available in 30 percent of schools across countries and in as many as 65 percent within a country.
Nearly all schools across the six countries provide health education to students to support healthy living and develop positive social and emotional skills.
There is much variation in how life skills education is implemented and there was little evidence of intentional SEL.
Our findings are consistent with multiple evaluations of the degrees to which learning environments are healthy, safe and protective, that have been conducted in recent years across geographic regions. These studies suggest that the primary foci of CFS initiatives within countries have often been improvement to the school building, consistent provision of a safe water supply, and expanded sanitation and hygiene services, such as constructing sanitary latrines, providing hand-washing facilities next to areas where food is prepared and ensuring that school grounds are kept free of garbage and other contamination sources. Evaluations of CFS also suggest that without parental and community involvement, many of the physical improvements observed would not be feasible.
Results from the Delphi survey of UNICEF Education Officers suggest that UNICEF‘s advocacy and commitment to supporting students and creating healthy, safe and protective learning environments is high, yet it is a challenging principle to fully realize. In some places the challenge is providing the necessary facilities to promote health and hygiene while in others, the material supports exist but changing behaviours is a challenge. Consistent with what we found in the six

42
countries regarding schools‘ difficulties in maintaining school buildings and grounds, UNICEF Education Officers globally cite this as a challenge for schools.
3.2 Creating a safe and welcoming learning environment in CFSs Most CFS teachers want to create schools where ―…all students enjoy their study…‖ (Thailand, 04) in an environment where the pupils are ―respected…and … are safe‖ (Philippines, 15). Both the physical structure of a school and its staff‘s approach to discipline and student support can contribute to health and safety as well as to inclusivity and academic achievement (Osher, Dwyer & Jackson, 2004). In this section, we describe the quality of the physical infrastructure of the CFS visited and how well schools ensure the physical safety and comfort of their students through school and classroom architecture and design. The section also describes perceptions by school heads, teachers and parents about what aspects of CFS may lead to more positive student-teacher relationships, which in turn make students feel that they are emotionally and academically supported. School observations in the six countries indicate that most schools implementing the CFS approach are successful in providing safe and welcoming environments in terms of the school‘s architecture and design and school policies. As shown in Figure 8, in four of the six countries, all schools were rated satisfactory or excellent on the Safe and Welcoming School Learning Environment scale. At a minimum, these schools had buildings that were structurally sound and in good physical condition, students were protected from the elements in the buildings and on the grounds, and students were protected from dangers such as toxic materials and unauthorized adults. In two countries (South Africa and Guyana), all but 4 percent of schools met these minimum standards or more. Figure 8 Safe and welcoming school learning environment: School observations
04
0 04
0
61
96
32 32
85 84
39
0
68 68
1116
0
20
40
60
80
100
Nigeria South Africa Philippines Thailand Guyana Nicaragua
Per
cen
tage
of
Sch
oo
ls
Needs Improvement Satisfactory Excellent
The Safe and Welcoming School Learning Environment scale measures the extent to which the school‘s architecture and design and school policies ensure the physical safety of students, thus creating an environment conducive to learning.
Needs Improvement: The school building is not completely structurally sound or in good physical condition, and students are at risk of being exposed to threats to their safety and well-being.
Satisfactory The school building is structurally sound and in good physical condition. Students are protected from the elements when in the school building and on the grounds, as well as from other potential dangers, such as toxic materials and unauthorized adults.
Excellent The school building is structurally sound and in good physical condition, and the environment is attractive and welcoming. Students are supervised at all times.

43
Table 12 presents three items from the Safe and Welcoming School Learning Environment school observation scale to provide a more detailed view of the condition of school buildings and grounds. About two-thirds (68 percent) of the schools were judged to be in ‗good structural condition‘ and about one-third (29 percent) were in ‗somewhat good structural condition‘, suggesting that the majority of schools, overall and in each country, are structurally sound and do not pose a danger to students.
Table 12 School observations of structural and physical condition of schools
Nig
eria
South
Afr
ica
Phili
ppin
es
Th
aila
nd
Guyana
Nic
ara
gua
Avera
ge
School buildings are in good structural condition.
Very True 68 52 60 61 81 84 68
Somewhat True 32 36 40 39 19 8 29
Not at All True 0 12 0 0 0 8 3
School buildings are in good physical condition (e.g., no peeling paint, broken windows, etc).
Very True 55 16 32 48 56 64 45
Somewhat True 35 68 64 52 44 32 50
Not at All True 10 16 4 0 0 4 6
School buildings and grounds have a welcoming appearance.
Very True 59 32 84 92 59 72 66
Somewhat True 41 56 16 8 41 28 32
Not at All True 0 12 0 0 0 0 2
Schools are less successful in maintaining the physical condition of school buildings (in terms of painting, condition of windows, etc.); overall, fewer than half (45 percent) of school buildings are in ‗good physical condition‘. Despite this, about two-thirds of schools (66 percent) overall have a welcoming appearance, suggesting that schools are able to make their schools welcoming. As described later in this chapter, maintaining the physical infrastructure and appearance of school buildings and grounds is difficult for schools according to school heads, teachers and parents, who cite lack of funds for maintenance and upkeep as a major hurdle. The following photos illustrate the variation in architecture and design of school buildings that site visitors observed. Site visitors observed many beautiful schools with well-cared for grounds and clean buildings decorated in ways that reflect the pride that students, teachers, staff, and parents and the community feel about their school. Photos 3 through 6 show schools with gardens, murals and play equipment on well-tended grounds to illustrate the welcoming physical spaces site visitors observed. In terms of the physical structure of school buildings, at one extreme were two or three story concrete structures that afford protection from the elements and at the other end of the continuum were one story wooden, less permanent structures (illustrated in photos 7 and 8). Although observers saw many soundly constructed school buildings and clean and attractive environments, site visitors also observed the struggles schools face with maintenance and upkeep, as illustrated in photos 9 and 10.

44
Photo 4 School garden, Philippines (fairly typical of
schools with gardens)
Photo 3 School garden, Philippines (unusually
ornate)
Photo 6 Mural with school mission, Philippines
(not typical)(observed in some schools
Photo 5 School grounds and play equipment,
Nigeria (fairly typical but not present at all schools)

45
Photo 9 Broken window, South Africa (illustrative of maintenance problems)
Photo 8 Wooden school building, Philippines
Photo 7 Concrete school building, Thailand
Photo 10 Burning trash on school grounds, Nicaragua

46
Schools have also been successful in creating safe and welcoming classroom environments, as shown in Figure 9, which gives the percentage of schools deemed excellent, satisfactory or needing improvement on the Safe and Welcoming Classroom Environment scale. In five countries, 100 percent of the schools visited, and in one country 94 percent of the schools visited, were satisfactory or excellent on this dimension, indicating that they all had classroom architecture and design that ensured the physical safety and comfort of students, thus creating an environment conducive to learning. Figure 9 Safe and welcoming classroom environments: Classroom observations
06
0 0 0 0
44
69
4845
35 35
56
25
5255
65 65
0
20
40
60
80
100
Nigeria South Africa Philippines Thailand Guyana Nicaragua
Per
cen
tage
of
Cla
ssro
om
s
Needs Improvement Satisfactory Excellent
The Safe and Welcoming Classroom Environment scale measures the extent to which the classroom‘s architecture and design ensures the physical safety and comfort of students, thus creating an environment conducive to learning.
Needs Improvement: The classroom lacks adequate ventilation and lighting. Students may not be protected from the elements. Outside noises affect teaching and learning within the classroom. Students do not have sufficient space to work, and the classroom may be dirty or disorderly in appearance.
Satisfactory: The classroom is protected from the elements, and has adequate ventilation and lighting so that students may complete their assignments. The classroom is also neat in appearance with some artwork or educational posters on the walls. Each student has his or her own space to work.
Excellent: The classroom is well ventilated and lighted, and is a comfortable temperature so that students are comfortable working. Students also have sufficient space to complete their class activities and their own chairs. The classroom is neat in appearance and attractive and welcoming, with student artwork posted on the walls. The classroom has been arranged with students in mind—for example, all students can easily see the blackboard from their seats, and the furniture is appropriate for students to work comfortably
Table 13 presents four items from the Safe and Welcoming Classroom Environment scale. Over three-fourths of classrooms were protected from the elements (i.e., had a solid roof, walls and a floor). Somewhat fewer (68 percent overall) were observed to be clean and orderly in appearance. Across countries, in over 70 percent of classrooms, students had sufficient space to work. What stands out is that across countries only 39 percent displayed student work or projects, which is something that seems simple to do as a means of making the classroom more attractive and welcoming; it is not dependent on the size and quality of the school building or on having the capacity to keep the building clean. Displaying student work does require that the school have access to materials for students to use to create projects but even without resources this can be achieved.
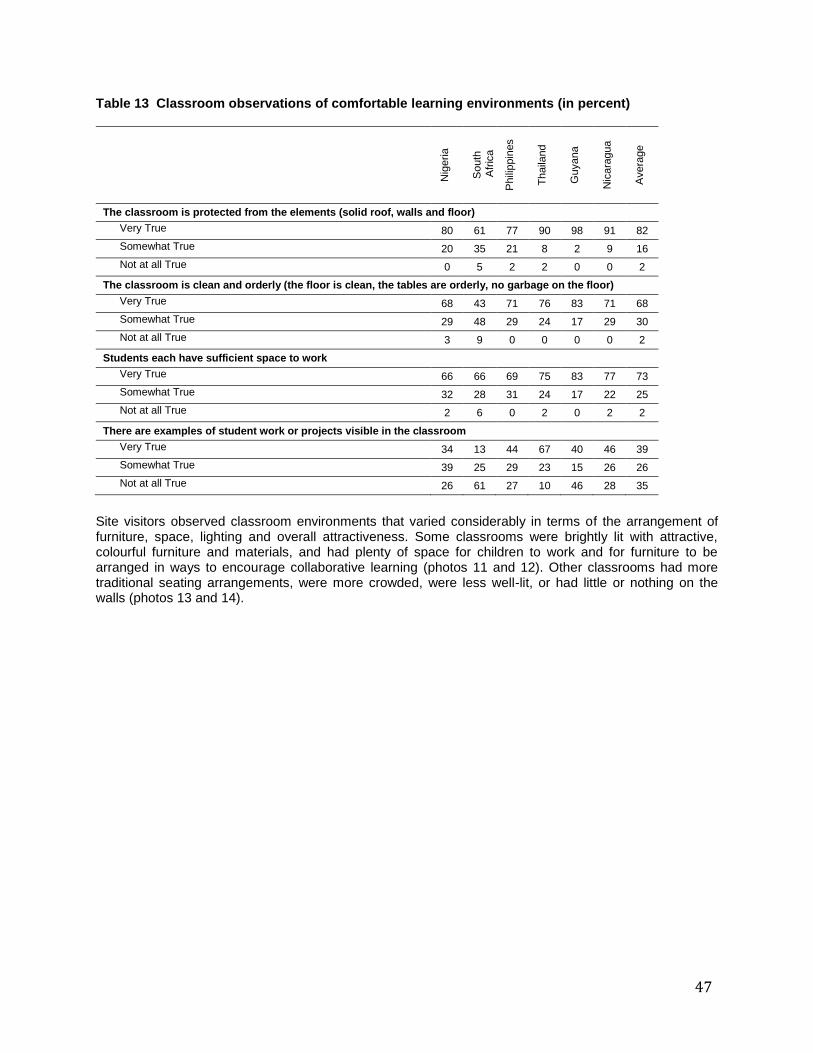
47
Table 13 Classroom observations of comfortable learning environments (in percent)
Nig
eria
South
Afr
ica
Phili
ppin
es
Th
aila
nd
Guyana
Nic
ara
gua
Avera
ge
The classroom is protected from the elements (solid roof, walls and floor)
Very True 80 61 77 90 98 91 82
Somewhat True 20 35 21 8 2 9 16
Not at all True 0 5 2 2 0 0 2
The classroom is clean and orderly (the floor is clean, the tables are orderly, no garbage on the floor)
Very True 68 43 71 76 83 71 68
Somewhat True 29 48 29 24 17 29 30
Not at all True 3 9 0 0 0 0 2
Students each have sufficient space to work
Very True 66 66 69 75 83 77 73
Somewhat True 32 28 31 24 17 22 25
Not at all True 2 6 0 2 0 2 2
There are examples of student work or projects visible in the classroom
Very True 34 13 44 67 40 46 39
Somewhat True 39 25 29 23 15 26 26
Not at all True 26 61 27 10 46 28 35
Site visitors observed classroom environments that varied considerably in terms of the arrangement of furniture, space, lighting and overall attractiveness. Some classrooms were brightly lit with attractive, colourful furniture and materials, and had plenty of space for children to work and for furniture to be arranged in ways to encourage collaborative learning (photos 11 and 12). Other classrooms had more traditional seating arrangements, were more crowded, were less well-lit, or had little or nothing on the walls (photos 13 and 14).

48
3.3 What adults do to create positive emotional environments in CFSs School heads, teachers and parents focus group/interviews indicate that, overwhelmingly, these stakeholders see positive student-teacher relationships as a key element of a CFS. For example, teachers saw refraining from verbal and physical abuse and eliminating ―…shaming and other activities that makes children feel less of themselves…‖ as core to CFS (Philippines, 12, 06). Our sources cited several developments that have led to more positive student-teacher relationships, which in turn support children‘s sense of emotional safety and support:
the abolition of corporal punishment;
stronger home-school connections; and
child-centred pedagogical practices that encourage student participation and active engagement in learning.
Photo 11 Spacious and well-lit classroom,
Thailand (typical in Thailand) Photo 12 Classroom reading corner, Guyana
(typical in Guyana)
Photo 13 Classroom with traditional desk
arrangement, Nigeria (typical in Nigeria)
Photo 14 Crowded classroom, South Africa
(typical in South Africa)

49
The majority of school heads said that any punishment given to a student should be of a constructive nature and nonviolent. In addition, school heads, teachers and parents reported that corporal punishment has essentially been eliminated, often as a result of schools implementing the CFS model. Although most school heads and teachers embrace the elimination of corporal punishment and agree with a no tolerance policy for corporal punishment, some teachers feel frustrated at not having an alternative that has the same type of impact on student behaviour as corporal punishment. Our interviews with teachers identified challenges that some of them faced in creating an environment that was both child centred and perceived as academically effective. The challenges are numerous and are particularly great in South Africa where the level of community violence and unmet student mental health needs appear to be greatest.
All of these children have psychological and financial problems. It is very poor here….Children feel alone and have to fight for everything in life.‖ –Teacher, 03, South Africa. ―There is no discipline…The children use the classes to do drugs, drinking and sleeping.‖ – Teacher, 02, South Africa. Since corporal punishment is being held off teaching has been hard in classrooms – learners have become uncontrollable. Punishment system is not as effective as before when corporal punishment was still practiced.‖ – Teacher, 07, South Africa.
The challenges, however, are not limited to South Africa. Some Thai teachers, for example, spoke of children who ―…do not have personal discipline…take responsibility… do not really know why they need to study…‖ (Thailand, 12). Some Philippine teachers spoke of ―naughty pupils who had no discipline at home or sometimes became ―…noisy because the teachers become friendly…‖ (Philippines, 16, 18, 19). Other teachers and parents reported that ―…teachers still [have] a hard time and [find it] difficult to deal with the students meanwhile the students show that they [have] realized more about [their] rights and legal protection…‖ (Thailand, 16). A few failed to eliminate corporal punishment completely:
―Teachers were told by the Department [of Education] not to use corporal punishment and while trying to follow it, they find they have no control over the classes and sometimes regress back to it.‖ (Teacher, 16, South Africa).
Most, however, employed one or more strategies to create a disciplined environment. The first strategy involves promulgating and enforcing clear rules. ―To guide the students' behaviour in the classroom, reminding students of the rules so that they should be aware, be conscious of their actions in school and even outside the school‖ (Teacher, 02, Philippines). Sometimes this strategy represents ―…a shift from strict and authoritative to [a] milder and facilitative mode of managing student behaviour,‖ and employs ―positive reinforcements‖ and ―constructive criticism.‖ At other times, this strategy employs punishments such as after school detention, putting a student on probation, and having the student do community work (Thailand, 11). A second strategy builds upon the relationships that teachers develop in CFS with students and families. ―I befriend my pupils so that [they] put their trust in me, thus I am able to create a classroom environment that is conducive to learning. This is how I promote a happy and healthy classroom environment,‖ a Philippine teacher observed (16). Teachers indicated that with the implementation of the child-centred pedagogical approaches in the classroom, students have become more comfortable approaching their teacher and asking questions about class work and, in some situations, about personal struggles they face. Moreover, parents say that students now think of teachers as their friends and that students are not scared of teachers. ―Teachers and students are very close so when problems arise, students are not hesitating to speak to their teachers…. In primary levels, teachers are like fathers and mothers to the students,‖ a Thai teacher observed (25). A Guyanian teacher described it as ―showing them love‖ thereby trying to reverse the ―…indiscipline [that] arises from a lack of love at home…‖ (Guyana, 11). A Nigerian teacher spoke of ―…a school where children are in love with each other, their teachers and often not afraid of their teachers but only respect them…‖ (10).

50
A third variant involves home visits. Although home visits were not universal in the schools visited, they are a common approach to strengthening the home-school link and student-teacher relationships. Through home visits, teachers and school staff have direct contact with the students and an opportunity to develop a more personal relationship. Making home visits to students who are struggling academically or are frequently absent provides an opportunity for the teacher to sit down with the parents to explain the problems that the child may be facing and in turn to understand the children‘s home context and challenges they may be facing that lead to problems in school. Sometimes this strategy is supplemented by the use of counselling by teachers and social workers – ―Counselling children rather than using corporal punishing…‖ (Teacher, 03, Nigeria). Notably absent in the interviews was mention of the use of SEL. This approach can build upon the relationships that CFS support to create the type of student self-discipline that can contribute to safe, responsible and productive learning environments where students balance a sense of entitlement with a commitment to building a strong student community and where ―…teachers and pupils communicate effectively…‖ (Teacher, 04, Nigeria). These approaches may be particularly important in the most challenged CFS , such as one in Thailand where many families are involved with drug smuggling and some families use drugs. ―Teachers,‖ the school head reported, ―want to teach their students to be a good person in the future, but it is very difficult to control their behaviour….when those students go back home, they would see their parents or people in their families or community are taking drugs or dealing with drug smuggling business.‖
3.4 Do children in CFS feel safe and supported? Creating a welcoming physical environment and abolishing corporal punishment, although very important, do not guarantee that students experience the school as safe and supportive. Creating an environment in which students feel safe, respected and cared about by adults and in which they can trust adults is an important element of CFS models. Research suggests the importance of safety and bonding to the school (Hawkins & Weis, 1985; Osher et al., 2006; Wehalage, Rutter, Smith, Lesko & Fernandez, 1989) and to creating a sense of community (Battistich & Horn, 1997). Research also shows that this bonding is linked to positive as well as negative academic and behavioural outcomes (McNeely & Falci, 2004; McNeely, Nonnemaker & Blum, 2002; Osterman, 2000; Osher et al., 2008), particularly for disadvantaged students and students at risk of dropping out (Muller, 2001; Osher, 2008). This section describes student perceptions of safety and whether they experience positive adult-student relationships, including the belief that adults care about, listen to and notice them. Eighty-four percent of students stated that they ‗feel safe at my school‘, but responses on an 18-item Physical and Emotional Safety scale were mixed – between 15 and 52 percent of students reported feeling physically and emotionally unsafe. Figure 10 presents results for the Physical and Emotional Safety scale, showing the percentage of students who indicate that their schools provide environments that are excellent, satisfactory or need improvement. Responses to scale items suggest that 15 to 52 percent of students across countries feel unsafe, both physically and emotionally.

51
Figure 10 Students’ physical and emotional safety in CFS: Student reports
40
52
15
3135
20
4541
5155
4855
157
34
14 1625
0
20
40
60
80
100
Nigeria South Africa Philippines Thailand Guyana Nicaragua
Perc
enta
ge o
f Stu
dent
s
Needs Improvement Satisfactory Excellent
The Physical and Emotional Safety scale measures how physically and emotionally safe students feel in school.
Needs Improvement: Students do not feel physically safe at school; they worry about their safety and sometimes stay home because they do not feel safe. Students do not feel emotionally safe; students are disrespectful of one another, or adults do not demonstrate care and respect for students.
Satisfactory: Students feel physically safe at school but they may occasionally worry about their safety going to or from school. They feel emotionally safe because students treat one another with respect, get along well together, and look out for one another, although they may occasionally feel that peers are disrespectful to one another.
Excellent: Students feel physically safe in the school at all times. Adults are caring and treat students with respect. Students feel they are treated with respect by peers.
The lack of safety reflects both school and community factors. This is suggested by an examination of items from the Physical and Emotional Safety scale, which suggest that community factors may contribute to student perceptions of safety (Table 14).
Table 14 Students’ perceptions of their physical and emotional safety
Nig
eria
South
Afr
ica
Phili
ppin
es
Th
aila
nd
Guyana
Nic
ara
gua
Avera
ge
I feel safe at my school 82 71 87 93 92 85 84
I feel safe walking both to and from my school 73 58 74 87 74 67 72
This school is badly affected by crime and violence in the community 38 43 10 20 10 27 26
Teachers defined CFS as ―caring‖ (Philippines, 01) settings ―...that pay a lot of attention to all children, and know about their problems and their situations,‖ (Thailand, 04), ―…where students and teachers…have a harmonious relationship,‖ (Philippines, 23). This focus is reflected in student perceptions of support. Although many students do not feel physically or emotionally safe in school, the data in Figure 11 suggests that students do feel that adults in school are supportive. More than two-thirds of students in each country feel listened to, cared about and helped by teachers and other adults in school. At a minimum, the majority of students mostly feel that teachers care about them, that they can approach adults in school for help with personal and academic issues, and that teachers notice them. However, in each country there is some percentage of students (6-22 percent) who do not feel

52
emotionally and academically supported by teachers or other adults and do not feel that teachers care about, notice or listen to them.
Figure 11 Emotionally Supportive Climate: Student reports
16 19
6
2216
7
71 69 72 71 7179
13 13
22
713 14
0
20
40
60
80
100
Nigeria South Africa Philippines Thailand Guyana Nicaragua
Perc
enta
ge o
f Stu
dent
s
Emotionally Supportive Climate (Student Survey)
Needs Improvement Satisfactory Excellent
Emotionally Supportive Climate scale measures the degree to which students feel listened to, cared about and helped by teachers and other adults in the school. Needs Improvement: Students do not feel emotionally and academically supported by their teachers or other adults in the school. They feel that most teachers do not care about, notice or listen to them, or provide help when it is needed. Students do not feel that there is an adult they can talk to at school about things that are bothering them. Students do not feel that their families are included in school decisions or are aware of what is going on at school. Students‘ food needs are not met.
Satisfactory: Students feel emotionally and academically supported by their teachers and other adults in the school most of the time. Students feel that, for the most part, teachers care about them and that they can approach the adults in the school for help with personal and academic issues. Students report that teachers usually notice when they are having trouble and readily provide extra help when it is needed. Students feel that their families are connected with and included in the school most of the time. Students‘ food needs are also met.
Excellent: Students feel emotionally and academically supported by their teachers and other adults in the school. Students feel that teachers care about them and say that they can talk with at least one adult about things that are bothering them. Students report that teachers notice when they are having trouble and readily provide extra help when it is needed. Students feel that their families are connected with and included in the school.
3.5 What CFSs do to support children’s health and hygiene Promoting and facilitating children‘s health and hygiene is an important aspect of being child-centred. Protecting children from disease, providing sanitary conditions and providing nourishment enables children to focus on learning. Parents and teachers at some of the schools visited during this evaluation attributed improvements in children‘s health to the promotion of health and hygiene by CFS. For example:
A CFS is different from other schools in its cleanliness, decoration, and type of teaching; in schools that aren‘t CFS the kids get sick more often because in our school the children are encouraged to have good hygiene habits.‖ —Teachers 2, Nicaragua. Feeding programme/hygiene of teeth/washing hands has decreased the rate of undernourished students, less students are sick, children do not need to go home for lunch, preventing that they cut classes, reducing absenteeism, decreased grade 1 dental problems.‖ —Teachers 19, Philippines.

53
The ministry of health gives talks about hygiene and health, they give us fluoride, toothbrushes and paste, and teach the children how to brush their teeth and how to wash their hands, and maintain hygiene in the school and in their homes.‖ —Parents 19, Thailand.
This section describes how CFS support students‘ physical and emotional health outcomes through facilities and practices that support health and hygiene and through services such as access to medical facilities, health care providers and school feeding programmes. 3.5.1 Creating a healthy environment Figure 12 presents the percentage of schools in the six countries that are excellent, satisfactory and in need of improvement in supporting students‘ health and hygiene through proper hygiene and sanitation facilities and practices, as measured by the Healthy Learning Environment: Hygiene and Sanitation scale. In most countries, nearly all schools met minimum requirements or better, indicating that most schools were successful in providing safe and sanitary conditions for students. Although the percentage needing improvement was fairly low (4 to 8 percent) in most countries, in South Africa 40 percent of schools needed improvement in providing healthy school environments. Figure 12 Healthy learning environments: Hygiene and sanitation: School observations
4
40
84 4
0
65
52
6064
85
76
30
8
32 32
11
24
0
20
40
60
80
100
Nigeria South Africa Philippines Thailand Guyana Nicaragua
Per
cen
tage
of
Sch
oo
ls
Needs Improvement Satisfactory Excellent
The Healthy Learning Environment: Hygiene and Sanitation scale measures the extent to which the school supports students‘ health and hygiene through proper hygiene and sanitation facilities and practices.
Needs Improvement: The school does not reflect a commitment to students‘ health and hygiene. Access to drinking water is inconsistent, and latrines are not always safe or sanitary. Students and staff may not demonstrate hygienic personal habits. Litter and other debris may be present in the school or grounds more than occasionally. There are few systems in place to dispose of waste.
Satisfactory: The school facilities and practices reflect a commitment to students‘ health and hygiene. Students have consistent access to drinking water and to safe and sanitary latrines, and for the most part, students and staff demonstrate hygienic personal habits. School buildings are mostly clean and sanitary, and the school is free of litter and other potential threats to school hygiene. The school has sanitary systems for disposal of waste water and latrine waste that are usually functioning.
Excellent: The school facilities and practices reflect a high commitment to students‘ health and hygiene. Students have access to drinking water and safe and sanitary latrines, and students and staff consistently demonstrate hygienic personal habits. School buildings and grounds are clean and sanitary, and the school has effective sanitary systems for disposal of waste water and latrine waste.
Table 15 presents several items from the Healthy Learning Environment: Hygiene and Sanitation scale to show the existence or lack of key facilities and practices: whether schools have access to potable water; whether latrines are safe and in good repair and are clean and sanitary; whether students and staff wash

54
their hands after using latrines; and whether school buildings are clean. Of these aspects of school facilities, schools have the most success in keeping school buildings clean (overall, 75 percent of respondents say it is ‗very true‘ that the schools are clean), thus providing a good foundation for supporting health and safety. Table 15 School facilities and practices supporting students’ health and hygiene: School
observations
Nig
eria
South
Afr
ica
Phili
ppin
es
Th
aila
nd
Guyana
Nic
ara
gua
Avera
ge
Students and staff have ongoing access to drinking water.
Very True 71 52 40 70 41 52 53
Somewhat True 14 16 40 30 41 36 30
Not at All True 14 32 20 0 19 12 16
Latrines are safe and in good repair.
Very True 71 40 68 58 37 72 57
Somewhat True 24 16 32 42 52 24 32
Not at All True 5 44 0 0 11 4 11
Latrines and sinks are clean and sanitary.
Very True 48 28 48 50 23 72 45
Somewhat True 43 32 48 50 58 28 43
Not at All True 10 40 4 0 19 0 12
Students and staff wash their hands after using latrines.
Very True 30 23 25 43 14 52 31
Somewhat True 65 50 65 50 67 43 57
Not at All True 5 27 10 7 19 4 31
The school buildings are clean.
Very True 73 44 84 83 78 88 75
Somewhat True 27 44 16 17 22 12 23
Not at All True 0 12 0 0 0 0 2
However, many schools have difficulty supporting more targeted aspects of health and hygiene. Slightly more than half of schools have access to potable water (53 percent report ‗very true‘). In other schools, access is inconsistent or non-existent. Slightly more than half of schools overall have latrines that are safe and in good repair (57 percent report ‗very true‘ across countries), and slightly fewer than half of schools have latrines and sinks that are clean and sanitary (45 percent report ‗very true‘ across countries). More worrisome is that basic hygiene habits are not consistently applied. Although observers saw consistent hand-washing after latrine use by students and staff in 31 percent of schools, they also saw no hand-washing in another 31 percent of schools. The type and conditions of the latrines/toilets and sinks in CFS was varied, as shown in photos 15 through 18. Some schools had indoor plumbing with clean and functioning toilets and sinks while others had indoor plumbing but poorly maintained or broken toilets or sinks. Other schools had latrines; in some schools these were clean and safe and in others they were dilapidated and students did not want to use them. Lack of sinks with running water does not prevent schools from encouraging hygienic practices, however, as seen in photo 18 in which children in a school without running water (shown in photo 17) wash their hands before a meal.

55
The Healthy Learning Environment: Child-centred Services scale, shown in Figure 13, measures the extent to which the school provides academic, health and hygiene services that support students‘ well-being, including medical services, health education, feeding programmes, and outreach to students not enrolled in school or challenged by home circumstances or a disability. Results indicate wide variation across countries in providing these services. In every country except the Philippines, some percentage of schools needed improvement on this dimension. The deficit in services was most acute in Nigeria (39 percent needed improvement), South Africa (64 percent needed improvement), and Guyana (62 percent needed improvement). In contrast, a high percentage of schools were deemed satisfactory on this dimension in the Philippines (100 percent), Thailand (92 percent), and Nicaragua (88 percent). No countries had any schools that were rated as excellent on this dimension.
Photo 15 Restroom in disrepair, South Africa
(atypical in most countries)
Photo 16 Sanitary, functioning latrines, Nicaragua
(more typical)
Photo 17 Sinks with no water, Nicaragua (varied by
country)
Photo 18 Children washing hands,
Nicaragua (fairly typical)

56
Figure 13 Healthy learning environment: Child-centred services: School head reports
39
64
0
8
62
13
61
36
10092
38
88
0 0 0 0 0 00
20
40
60
80
100
Nigeria South Africa Philippines Thailand Guyana Nicaragua
Per
cen
tage
of
Dir
ect
ors
Needs Improvement Satisfactory Excellent
The Healthy Learning Environment: Child-Centred Services scale measures the extent to which the school provides academic and health and hygiene services that support students‘ well-being, including actions the school takes to reach out to students often left out of the educational process.
Needs Improvement: The school head reports that there are few services that support students‘ health and well-being and little in the way of health education. The water supply is not regularly checked. There are few services that reach out to students with disabilities or in minority groups.
Satisfactory: The school head reports that key services that support students‘ health and hygiene are provided. The school curriculum includes health education that promotes healthy daily living and teaches students how to avoid high-risk behaviours. There is some attention to students‘ social and emotional development. A feeding programme is in place for all students in need. The school has procedures in place to ensure that the water supply is safe. The school has services in place to encourage enrolment of students with disabilities and in minority groups
Excellent: The school head reports that there are many services in place to support students‘ health and hygiene, such as medical examinations and screenings, mental health screenings, and medical assistance or referrals for assistance. Job-readiness education and education to support students‘ social and emotional development are firmly established. The school has a strong set of services to encourage the enrolment and retention of students with disabilities and in minority groups.
Table 16 presents several items from the Healthy Learning Environment: Child-Centred Services scale to show the existence or lack of key services. There is wide variation across countries with respect to the services schools provide. Whether services are provided may depend on several factors: the perceived need or importance of the service, given the population served and the context; the availability of a particular service in the broader community (e.g., community-based providers of health services); or simply whether the school has the resources to devote to providing the service. Across countries, two-thirds of school heads say that their schools are equipped to make referrals to community-based providers of medical and mental health services, although individual countries‘ scores range from 50-92 percent.
41 About half of school heads report that they provide routine vision and hearing
screenings, de-worming treatment for parasitic infections, or do height/weight screening to identify malnourished children. Sixty-two percent of schools overall have a feeding programme in place, although this includes schools in which the feeding programme is not necessarily consistent (48 percent saying that it is ‗very true‘ that their school has such a programme and 14 percent saying that it is ‗somewhat true‘), and some school heads may have included the provision of an on-site vendor in their response. In 30 percent of schools overall there is no feeding programme in place. Provision of feeding programmes
41
This evaluation did not assess the accessibility, quality, or timeliness of external services.

57
ranged considerably across countries, from 15 percent in Guyana to 92 percent in Thailand and the Philippines. Table 16 School heads’ perceptions of school services supporting students’ health
Statement
Nig
eria
South
Afr
ica
Phili
ppin
es
Th
aila
nd
Guyana
Nic
ara
gua
Avera
ge
The school is able to make referrals to community-based providers of medical and mental health services that are not offered by the school.
61 76 92 56 58 50 65
The school provides de-worming treatment of parasitic infections to students who need them.
43 20 83 60 23 67 49
The school provides routine vision and hearing screenings to students, and refers students to free or affordable follow-up services if needed.
39 28 67 92 23 42 48
The school uses height/weight screening to identify malnourished children. 39 16 100 96 12 63 54
Students are allowed access to latrines and drinking water whenever they need them (not only at specified times).
87 88 96 100 100 100 95
The school has a feeding programme for under-nourished students. 30 56 92 92 15 88 62
During interviews, school heads, teachers and parents identified school feeding programmes as a critical service to meet children‘s nutritional needs and to get children in school, help them concentrate and encourage them to stay in school – more so than any other health or hygiene support service. However, teachers were also candid about the challenges involved in sustaining such programmes. Photos 19 through 21 show de-worming treatment in Nigeria and the preparation and distribution of food through school feeding programmes in Nigeria and Nicaragua.
Photo 19 Students receive de-worming treatment,
Nigeria Photo 20 Parents prepare lunch for a parent-led feeding programme, South Africa

58
3.5.2 Promoting health
Another way that schools support children‘s health and safety is by empowering them with knowledge. As shown in Table 17 below, according to school heads, schools in all six countries are successful in providing health education, with all or nearly all school heads reporting providing health education in the avoidance of high-risk behaviour, healthy daily living, and the development of positive social and emotional skills. However, another AIR research study that examined life skills instruction in CFS in Cambodia, the Philippines and Thailand, suggests that there is great variability in life skills instruction and that the SEL that goes on is sporadic, unintentional and not assessed (Osher, Utne-O‘Brien, Shors & Weissberg, 2007). This gap is likely to limit the impact of health education, since students need to develop the capacity to manage their emotions and relationships and to make decisions that will help them stay out of harm‘s way.
Table 17 School heads’ perceptions of health education and social-emotional development
Statements
Nig
eria
South
A
fric
a
Phili
ppin
es
Th
aila
nd
Guyana
Nic
ara
gua
Avera
ge
The school provides health education to all students regarding the avoidance of high-risk behaviour (e.g., HIV/AIDS education, prevention of substance abuse).
100 100 100 100 96 100 99
The school provides health education to all students in the promotion of healthy daily living (e.g., nutrition, dental hygiene).
96 88 100 100 96 100 97
The school provides health education to all students in the development of positive social and emotional skills.
96 96 100 96 96 92 96
3.6 What are the challenges to supporting children’s health and safety? Many schools are able provide comfortable and welcoming environments and have buildings and grounds that are safe and secure. Many schools, however, are unable to provide conditions that support health and hygiene, particularly in terms of providing water and sanitary and accessible latrines. School safety is a serious concern in some schools. 3.6.1 Physical plant Physical plant issues remain a challenge in some schools. Interviews and focus groups with school heads, teachers and parents in all countries indicate that many schools struggle with maintenance of the school buildings and grounds, a finding that converges with our observations of the physical condition of the school buildings (overall, 45 percent are in good physical condition). Some school heads and teachers describe serious weaknesses in infrastructure and lament that they do not have the resources to fix the problems.
Our building is falling apart: Most of the (classroom) windows have been smashed and one building is burned down. . . . We do not have funds for repairs.‖—School head 11, South Africa. We need more space for kindergarten. The kids don‘t have seats or tables and they have to stand during class. The space is very small and sometimes they have to work outside.‖ —School head 12, Nicaragua.
Photo 21 Parent prepares lunch for a parent-led feeding
programme, Nicaragua

59
―There are challenges in classrooms; the buildings are old and need repair and improvement and also the chairs and tables in the classroom need to be repaired, improved, and repainted.‖ —Teachers, 22, Thailand.
When school officials from these schools were asked why greater efforts have not been made to invest in architecture, some school heads responded:
It is capital intensive. The school cannot afford to [without] funding.‖ —School head, 1, Nigeria. ―Limited budget has become the major concern to cover all aspects of CFS principles such as the component of architecture and services in particular.‖ —School head, 24, Guyana.
3.6.2 School climate School climate remains a concern – 15 to 52 percent of students across countries report feeling unsafe at school, both physically and emotionally. Up until this study, this aspect of child centredness had not been measured. Our data reveal a gap between adult perceptions and those of students, with students being more critical of the social and emotional climate. Absent a confidential survey of students, it is unlikely that schools will identify this challenge or feel the need to develop mechanisms for addressing school climate issues. Two factors that may affect perceptions of safety are student indiscipline and reactive or punitive faculty responses to disorder. As reported earlier, we saw no evidence of two approaches, which if applied, may help address these factors and in so doing improve the school climate by reducing discipline problems (Osher, Bear, Doyle & Sprague, under review). The first approach is SEL, which helps students learn to understand and manage their emotions and relationships as well as make appropriate choices. The second is positive behavioural strategies, which help school staff avoid reactive and punitive responses (Osher et al, 2007). 3.6.3 Security Although security is not a major concern in most schools across the six countries, in interviews and focus group discussions, school heads, teachers and parents in some schools described severe problems with security. In South Africa, Nicaragua and Nigeria, school heads, teachers and parents in several schools described severe problems with vandalism at their schools. Vandals have repeatedly stolen school resources including school supplies, food, learning materials, piping and electrical wires, faucets, windows and hoses. The loss of these materials, as well as the distrustful relationship between these schools and the communities in which they are located, are two significant barriers school officials face to providing safe and welcoming learning environments for students. Moreover, school heads, teachers and parents feel that ensuring the security of the facilities, staff and students is a necessary precursor to school improvement efforts; without a safe environment, teachers and learners cannot focus on teaching and learning, and any investments in infrastructure, equipment and materials are wasted. In an effort to improve security at their schools, school heads and parents at some schools in all countries report constructing a fence around the perimeter of the school grounds or hiring a guard, using either school funds or donations from parents. In some schools, parents reported volunteering as security guards for the school. Also, Philippine schools appear to effectively access and use school security officers. Finally, ensuring the security of students outside the boundaries of the school campus is also a concern of school-level stakeholders. As several studies have shown, the distance students must travel to school and the security threats students may face while travelling or walking to school are sometimes barriers to educational outcomes like enrolment, attendance and retention (e.g., Lockheed & Lewis, 2007). Despite improvements made in ensuring the security of students on school grounds, interview data from this evaluation suggest that transportation to and from school remains a serious concern at some schools for students, their parents, teachers and school heads due to crime or the natural environment. These concerns are also reflected in the student response to ‗I feel safe walking both to and from school‘; only

60
72 percent of CFS students across the six countries say that this is mostly or very true, with the percentages ranging from 58 percent in South Africa to 87 percent in the Philippines. Teachers in a school in South Africa described the fear they felt in school given the safety issues in the community: ―The gate is always closed because there are gangsters here. Before they would come in and rob the tape recorder, knives, food and almost everything that you had given us; that is why to this day we are a bit scared but thanks to god they haven‘t assaulted us again.‖ In the Philippines, a school head said about his students: ―During rainy seasons, teachers assist our children to cross the river so that they can go to and from school. Children are encouraged to spend the night at school during this time, but they do not want to as their parents are waiting for them.‖
3.7 Previous research on health, safety, school climate and CFSs Multiple evaluations of the degree to which learning environments are healthy, safe and protective have been conducted in recent years across geographic regions, including a qualitative multi-country case study conducted in Albania, Colombia, India and Turkey (UNICEF, 2004), China (UNICEF, 2005), Kazakhstan (UNICEF Kazakhstan, 2005), Nicaragua (Richards, 2005; UNICEF, 2005), Sri Lanka (UNICEF, 2004; Malteser International, 2007), Timor Leste (UNICEF, 2006) and several south and east African countries (Angola, Rwanda, Malawi, South Africa, Zimbabwe and Mozambique; UNICEF, 2007a). Such studies report that the primary foci of CFS initiatives within countries are often improvement to the physical plant; consistent provision of a safe water supply; and expanded sanitation and hygiene services, such as constructing sanitary latrines, providing hand-washing facilities next to areas where food is prepared and ensuring that school grounds are kept free of garbage and other contamination sources. For example, in 2007, UNICEF conducted a regional analysis report of the ‗CFS for Africa‘ campaign (UNICEF, 2007a), a five-year multi-country initiative with a special focus on the poorest and most disadvantaged children, including girls and other vulnerable children. This report, along with others cited earlier, noted that the majority of the funds (nearly 80 percent) were spent on infrastructure development (i.e., classroom construction, access to safe drinking water) and health promotion activities, while less than 10 percent was used for improving teaching and learning processes. For example, during the reporting period, 339 schools were constructed and an additional 198 classrooms were built or rehabilitated. Most countries also demonstrated that infrastructure development was aligned with other interventions, such as teacher training, health services and water and sanitation. Over 200 schools received water-related equipment and services, including hand pumps and water tanks, and training associated with health/hygiene education, life skills, community mobilization and facility maintenance. Most schools also received materials such as blackboards, in addition to teaching and learning materials. Across the six participating countries, 300,000 learner‘s materials and 5,000 teacher‘s materials were distributed. Another example is an external evaluation of the CFS programme in Sri Lanka conducted in 2004. Thirty primary schools were selected for comparison (15 were CFS and 15 were not) (UNICEF, 2004). Schools were also selected based on the size of their student population (i.e., less than 200 students, 201-400 students, or more than 401 students). The evaluation employed multiple approaches, including school and classroom observations, assessments of student learning and interviews and focus group discussions with school principals, teachers and parents at both CFS and non-CFS. The evaluation determined that the most essential improvements to the school‘s infrastructure or physical environment were the provision of a clean water supply; a canteen serving clean and nutritious food; toilet facilities with availability of water; a well maintained school garden; open air classrooms; and a boundary wall or fence. These factors played a critical role in the retention of students. Additionally, the involvement of parents and community members in implementing these physical improvements was critical. For example, the principal conducted regular meetings with students‘ parents and community volunteers to discuss students‘ nutritional needs and general health. Parents and community members often donated their time and available food (i.e., herbs, vegetables) for the students‘ lunch programme.

61
Based on observation and interview data, the evaluation concluded that the programme was successful in facility improvements and in the provision of training on the maintenance of these improvements across districts in Sri Lanka. Within CFS, the physical appearance of the classrooms observed was found to support and enhance learning activities more often than the appearance of classrooms at non-CFS. Compared with non-CFS classrooms, which received a rating of ‗satisfactory‘ or lower, CFS classrooms were assigned a rating of ‗very satisfactory‘ on 15 physical characteristics, including the condition of the floor, the amount of floor space in the classroom, the condition of the roof, arrangement of furniture, space for pupils‘ belongings and work arrangement of furniture and overall classroom surroundings. Although the programme was successful in addressing the physical plant, it did not create a positive school climate, which our student surveys and classroom observations assessed. The creation of a safe and welcoming learning environment is affected by the disciplinary strategies of teachers. Classroom observations found that harsh disciplinary strategies, such as ridiculing pupils for incorrect answers, showing an angry face for incorrect answers and ignoring pupils with learning disabilities, occurred as frequently in CFS classrooms as in non-CFS classrooms. These observations were consistent with site visits conducted by AIR in Cambodia. Students reported, and school heads and regional monitors confirmed the fact that some teachers cursed at students and employed humiliating punishments. Evaluations and observations such as these highlight the importance of monitoring and addressing the social and emotional conditions for learning in schools, which UNICEF is piloting in CFS in Cambodia, Thailand and East Timor. As is the case with our findings, previously conducted evaluations also highlight the importance of partnerships between schools and families, which will be covered in Chapter 4. Without parental and community involvement, many of the physical improvements observed in these evaluations would not be feasible. For example, when examining funding, several of these evaluations also pointed to the generation of a ‗snowball effect‘ wherein local governments and community residents supplement limited UNICEF investments to cover latrine construction costs and other improvements (e.g., UNICEF, 2005). Local investment in the form of parental and community involvement has also been found to ―…induce behavioural changes among people that can lead to a cleaner environment and ultimately strengthen the economic development in rural areas…‖ (UNICEF, 2006, p. i). In an evaluation of UNICEF‘s (2007) Child Friendly Water and Sanitation Project in 43 schools across 11 districts in Sri Lanka, the results suggested that a participatory approach involving the rights-holders themselves (i.e., students) increased the benefits of water and sanitation facilities for end users, such as positively influencing students‘ ownership of facilities and their willingness to maintain the facilities. Students formed health clubs that were active in health promotion and continually involved in monitoring and maintenance efforts such as cleaning up classrooms and the school grounds, garbage collection and oversight of latrine use (see also UNICEF, 2005). Finally, student surveys and observational data also revealed that almost 80 percent of students practiced proper hygiene (e.g., washing hands after toilet use and before eating) and 70 percent of teachers emphasized hygienic practices during class lessons. These practices are likely to extend beyond the immediate school environment to students‘ homes. A reading garden in a Cambodian CFS suggests the relationship between active community involvement and the creation of a child-centred involvement. The community built and maintained the beautiful reading garden in photo 22 below. When asked what would happen after UNICEF CFS funding was withdrawn (which was part of the scaling up process), a community leader proudly stated that the community would maintain the reading garden, which it had built for the students.

62
3.8 Health, safety and school climate from the Delphi survey42 Overall, UNICEF‘s advocacy and commitment to supporting students and creating and sustaining healthy, safe and protective learning environments is high. When asked to say how frequently elements of CFS – architecture, services, pedagogy, participation and governance, and inclusiveness – are implemented in the country in which they work, 40 percent of respondents said that architecture is ‗most often‘ or ‗usually‘ implemented and 25 percent said services are ‗most often‘ or ‗usually‘ implemented. According to respondents, UNICEF‘s support for particular aspects of these programmatic elements varies from country to country, presumably in response to local needs. The success of UNICEF‘s efforts also appears to vary considerably from country to country and responses indicate that this is a challenging principle to fully realize. For example, one respondent said that ―…health and sanitation goals are not on the agenda of CFS…‖ in his/her country and another said that ―…health and sanitation goals have largely been realized.‖ The latter respondent went on to say that most CFSs have hardware components (e.g., latrines, clean drinking water) and have been trained on ―…several health issues such as hygienic living, prevention of dengue fever, and prevention of violence against children in schools‖, but that more work could be done to promote behaviour changes. One respondent said that a ‗healthy lifestyles‘ course was introduced but ―…schools lack running water, health and sport facilities, qualified specialists…‖ and that promoting health and hygiene ―…is one of the weakest parts of our project.‖ According to respondents, schools ―…have difficulty attaining the school facilities goals of the Child Friendly Schools model because of the financial resources required.‖ (69 percent said this is ‗mostly‘ or ‗very‘ true.) We found in our site visits that schools struggle to maintain school buildings, although more than half of respondents (53 percent) to the Delphi survey said UNICEF provides funds, training or technical assistance to support maintenance of schools‘ physical environment. It is generally UNICEF‘s expectation that school maintenance is the responsibility of the government or should be carried out by schools and communities themselves.
42
Based on responses to closed-response survey questions and open-ended questions. Frequency data for closed-response survey questions are presented in appendix D.
Photo 22 Reading garden, Cambodia

63
CHAPTER 4 – CHILD-CENTREDNESS: TEACHING AND LEARNING
Child friendly school means the school that helps to take care of all children in all aspects, so that they grow up to be good citizen[s]. They will be taken care of in terms of love, affection, and safety, and all students must be able to survive in the real world. Child-right promotion activity should include four aspects: safety, development, protection, living in harmony. Teaching/learning activities focus on the following:
Child-centredness should be the core principle for teaching/learning activities.
The teaching/learning process should aim at enabling all students to develop themselves [at] their own pace and to their potential.
Educational provision, substance and activities [should be] in line with the learners‘ expectations, bearing in mind individual differences.
Boys and girls are given equal opportunity and are treated equally.
Teachers give equal attention to both boys and girls regardless of their background, ethnicity, and culture.
All related parties must be aware that in order to help develop children to meet desirable traits, they must understand child rights. All buildings must be safe for children, and classrooms must be organized in the way that it is safe, clean, and comfortable for children to study in.‖
— School head, Thailand
________
In its forthcoming manual for CFS, UNICEF describes child-centred learning as follows:
Learning is central to education and in line with the child-centred principle, the child as learner is central to the process of teaching and learning. In other words, the classroom process should not be one in which children are passive recipients of knowledge dispensed by a sole authority, the teacher. Rather, it should be an interactive process in which children are active participants in observing, exploring, listening, reasoning, questioning and ‗coming to know‘. This is at the heart of the classroom process in all child-friendly school models, and it is critical for teachers to be well trained in this pedagogy. (UNICEF, in press, Chapter 2, pg. 13)
A quality learning environment promotes high-quality teaching of relevant knowledge and skills through instruction that is adapted to meet students‘ needs and that encourages children‘s active engagement, rather than relying on traditional rote learning approaches. When teachers encourage students to be actively engaged in the learning process and to do well, and when students are presented with interesting learning opportunities, they are more likely to stay in school and succeed academically (National Research Council, 2004). Children‘s active participation in learning reflects not only a child-centred approach to pedagogy but also the principle of democratic participation. In this chapter, we describe how CFS realize child-centredness in terms of pedagogy. We address the following issues through data from the six countries:
the degree of academic support that students experience;
instructional methods used by teachers;
teachers‘ beliefs and attitudes about effective pedagogy;
professional development and support available to teachers;
instructional resources available to support learning; and
the challenges to providing effective child-centred pedagogy.

64
Multiple sources of data we used to address these issues:
survey data collected from students and teachers to report information on child-centred instructional methods, instructional resources, student-teacher relationships, perceptions of CSCLE (students), and opportunities for professional development (teachers);
classroom observations of the use of effective and child-centred instruction and communication; and
interviews with school heads, teachers and parents on issues around pedagogy. Finally, Finally, the evaluation provides a context for findings from the six countries by describing previous research on CFS globally and discuss findings germane to child-centredness – in terms of pedagogy – in CFS from the web-based Delphi survey of UNICEF Education Officers. Not all issues are addressed by each source, hence we highlight when multiple sources converge or diverge on an issue.
4.1 Summary of key findings
Most schools in the six countries are successful in creating an environment that conveys to students that learning is important and worthwhile, encourages students‘ active engagement, and promotes learning. Eighty three to 96 percent of students were at satisfactory or excellent on the Challenging Student-Centred Learning Environment scale.
Classroom observations across the six countries found that teachers are using effective pedagogies, including child-centred instructional techniques, and are creating an environment that encourages trust and respect. Across five of the six countries, all classrooms were satisfactory or excellent on this dimension.
During teacher focus group discussions, teachers in all countries demonstrated an understanding of the fundamental principles of the CFS model regarding pedagogy and shared that there has been a shift from teacher-centred to student-centred, active learning with the implementation of the CFS model. However, although teachers endorse active learning, traditional notions of effective instruction persist.
The success of CFS in meeting teachers‘ needs regarding professional development and resources is mixed, although generally encouraging. In surveys, teachers report that opportunities for professional development and support are sufficient, but discussions with teachers and school heads indicate that there is a dearth of well-trained teachers.
In focus group discussions, teachers in every country noted that a major challenge to being child-friendly is a lack of trained teachers, suggesting that there is a need for more expansive training both at the pre-service stage and for teachers currently teaching. Teachers in all countries talked about the provision of teaching materials and trained teachers as having helped their schools become child-friendly. At the same time, however, lack of sufficient resources (trained teachers, textbooks, materials) was stated repeatedly by teachers and school heads during interviews/focus group discussions in every country as a challenge to the school being child-friendly in the area of pedagogy. According to the focus group data, the lack of materials is especially acute in Nigeria, South Africa and Guyana.
Few prior studies that we reviewed explicitly measured the impact of the CFS initiative on pedagogical shifts within the classroom environment. However, extant research demonstrates that teachers believe the primary benefit of the CFS approach is exposure to and implementation of a range of new teaching methods, including participatory and student-centred approaches. Further, these evaluations do provide some evidence that CFS bolsters student learning and improves teaching practices. The inconsistency of these findings, however, warrants future research on the relationship between the CFS approach, teaching practices and learning outcomes.
According to UNICEF Education Officers who responded to the Delphi survey, child-centred pedagogy is strongly emphasized by UNICEF across countries. However, there is a widespread feeling among UNICEF Education Officers that teachers do not have sufficient training to apply the principles of CFS, particularly regarding child-centred pedagogical techniques. Respondents did view implementation of the CFS model as motivating for teachers, because it produces

65
results..Finally, UNICEF might be able to do more to promote child-centred pedagogy to parents and communities and help them see the benefit of this over traditional methods; some countries have done this and some acknowledge that they have not done much of this kind of advocacy.
4.2 Do students experience academic support? CFS teachers, who are the key providers of academic support, saw the following factors as key to a CFS: a CFS is ―…competitive for learning and the school is beautified with flowers…a place where effective teaching and learning take place between the teachers and their pupils…‖ (Nigerian teacher, 02). A CFS is one where ―…the teachers are doing everything to help the child learn and develop, both as a student and as a responsible person in the community,‖ (Philippine teacher, 10). Teachers took steps to operationalize this value. ―Teachers have implemented [an] open-door policy where students are always welcomed to speak out about their problems both in school and at home,‖ Thai teachers reported (20). A Philippines teacher focus group (02) described how these values are put into practice:
Conduct remedial study or mentoring sessions for students with low scores or ratings in some subjects like English and Math. These sessions are conducted before the class starts or during free periods.
Provide school materials to some students whose families cannot afford to buy these supplies. Teachers sometimes spend their own money or sometimes they ask for a donation from their friends and organization.
Hold regular conversations with students before a class starts; a simple kumusta kayo (how are you) really helps the students feel closer to the teachers.
Treat students equally, follow a ‗no favouritism policy‘. These values and actions may contribute to the fact that most schools in the six countries are successful in creating an environment that conveys to students that learning is important and worthwhile, encourages students‘ active engagement, and promotes learning, a concept we refer to as Challenging Student-Centred Learning Environment (CSCLE).
On the CSCLE scale (Figure 14 below), 83-96 percent of students in each country rated their schools as satisfactory or above on this dimension, indicating that their schools are providing interesting learning experiences in which students feel actively involved and academically supported.

66
Figure 14 CSCLE in CFS: Student reports
16 14
47
115
5863
48
70
57
67
25 24
48
22
3228
0
20
40
60
80
100
Nigeria South Africa Philippines Thailand Guyana Nicaragua
Perc
enta
ge o
f Stu
dent
s
Needs Improvement Satisfactory Excellent
The CSCLE scale measures the extent to which students perceive that teachers and other adults in the school challenge them, encourage the active engagement of students in the learning process and the academic success of all students, and feel that what they are learning is interesting.
Needs Improvement: Students think that teachers or other adults in the school do not expect all students to succeed academically and do not feel that their active participation in their own learning is encouraged often. They do not feel interested in what they are learning and may not like or see the value of school.
Satisfactory: Students generally think that their teachers and other adults in the school expect all students to succeed academically, encourage students to take school seriously, and provide challenging learning opportunities, although they may feel that students do not always put forth enough effort. Students feel that teachers encourage their active engagement in class most of the time. Students feel that for the most part, what they are learning is interesting.
Excellent: Students think that their teachers and other adults in the school expect all students to succeed academically, encourage students to take school seriously, and provide challenging learning opportunities. Students think that the teachers encourage students to participate in and share their ideas and opinions in class and that teachers will listen to students‘ explanations. Students think that what they are learning is interesting.
The results of HLM analyses also point to a consistent and positive relationship between child-centred classroom pedagogy and students‘ perceptions of school climate. The Child-Centred Pedagogy scale measured different aspects of teaching and classroom-management techniques, including the teacher‘s use of child-centred teaching strategies, preparation of organized lesson plans, and the manner in which the teacher interacted with students. This highlights the powerful effects of classroom behaviours and teaching processes on students‘ feelings about their overall school environment (i.e., not just the number of books or the school‘s level of CSCLE). Table 18 Students’ average score on the CSCLE scale, overall and by subgroups
Nig
eria
South
Afr
ica
Phili
ppin
es
Th
aila
nd
Guyana
Nic
ara
gua
Avera
ge
All students 3.32 3.35 3.63 3.41 3.43 3.49 3.43
Female 3.33 3.40 3.67 3.47 3.50 3.51 3.48
Male 3.31 3.31 3.59 3.35 3.37 3.47 3.39
Home Language
Same as in School 3.19 3.36 3.64 3.39 3.46 3.49 3.44
Different from in School 3.37 3.34 3.62 3.41 3.32 3.39 3.43
Religious Minority Status
Not a Minority 3.31 3.37 3.67 3.42 3.44 3.49 3.45
Yes, Minority 3.36 3.33 3.57 3.39 3.45 3.50 3.42

67
Table 18 presents students‘ perceptions of the degree of CSCLE afforded by their schools in terms of average scores on a scale from 1 (low) to 4 (high). Results are presented for subgroups of the population to show whether perceptions of CSCLE vary by student background. Data are reported by gender, whether students‘ home language is the same as the language of instruction, and whether students‘ religious affiliation is the same as the religious affiliation of most students in their schools. Results by gender indicate that female students were more positive on the CSCLE scale than males, both overall and in all countries. Results by home language and religious status do not indicate a clear pattern across countries: overall average ratings suggest that speaking the same language at home and at school and being of the majority religious group did not result in higher scores on this scale; however students speaking a different language at home and at school have a slight advantage in Nigeria, and students speaking the same language at home and school have an advantage in Guyana and Nicaragua (although the sample size for this category is very low in Guyana and Nicaragua so this must be interpreted with caution). Students in a religious minority group have an advantage in Nigeria, while students in the majority group have an advantage in South Africa and the Philippines.
4.3 To what degree is instruction in CFS child-centred? When students participate in discussions, debates and forms of peer-to-peer interaction, they are actively engaged in learning rather than merely being the recipients of knowledge. In contrast to traditional rote learning methods, in which the teacher lectures and students take notes, child-centred instructional approaches encourage students to construct their own understanding of content. Students are actively engaged in their own learning, reflecting the principle of democratic participation. Teacher focus groups provided many examples of how teachers operationalized student-centredness. Philippine educators (05) described how an urban school shifted from teacher-centred to child-centred teaching approaches. Previously, teachers would deliver a lecture on a lesson and the children would listen and try to absorb what the teacher was explaining. Now, teachers choose from a variety of teaching methods/strategies, opting for one that best suits the lesson and keeps the interests of the students to maximize the achievement of objectives. Now teachers employ:
collaborative learning among the students – this is increasingly practiced and is done through assigning students to work in groups, pairing fast learners with slow learners in some activities, and interest-based grouping. One criterion in the last type of grouping is that children are allowed to choose the group they work in, based on where/ with whom they are most likely to excel;
grouping for doing classroom work – to ensure that everyone contributes, a peer evaluation is done at the end of the group work; and
‗Show Me Boards‘ – each student has a board on which they write their answers during recitations and which they later show to the rest of the class.
Observers generally found child-centred approaches being applied. Figure 15 presents the percentage of classrooms deemed excellent, satisfactory, or needing improvement in terms of pedagogical approaches. Classroom observations suggest that across the six countries, teachers are for the most part using child-centred teaching techniques, creating organized lesson plans to guide classroom activities, and using child-friendly communication styles and disciplinary practices. In five of the six countries, all classrooms were rated satisfactory or above based on observations of aspects of instruction, classroom management, and teacher-student interactions (the Child-centred Pedagogy scale); in the sixth country, all but 9 percent of classrooms were so rated.

68
Figure 15 Child-centred pedagogy: Classroom observation
9
34
51
4
4137
52
66
40
96
5963
48
0
20
40
60
80
100
Nigeria South Africa Philippines Thailand Guyana Nicaragua
Perc
enta
ge o
f Cla
ssro
oms
Needs Improvement Satisfactory Excellent
The Child-Centred Pedagogy scale measures different aspects of teaching and classroom management techniques, including the teacher‘s use of child-centred teaching strategies, preparation of organized lesson plans, and the manner in which the teacher communicates and interacts with students.
Needs Improvement: Teachers do not know students by name. Students and teachers are disrespectful or unfriendly toward one another. Teachers rely on rote teaching techniques, such as requiring students to copy lessons from the blackboard or textbook. Students are not encouraged to ask questions or discuss the material that is being taught.
Satisfactory: Teachers use active, student-centred techniques to engage students during class time, with some attempt to elicit higher-order thinking and associate the content of the lessons to students‘ lives outside of the classroom. Teachers use positive disciplinary strategies. Teachers invite students to discuss class materials, and most students participate during class discussions. Students and teachers are respectful of one another, and teachers know students‘ names.
Excellent: Teachers are well organized and present material in an engaging manner, encouraging discussion among students and relying on active, student-centred teaching strategies. Teachers relate classroom activities to students‘ lives outside the class. Students are asked questions that prompt higher-order thinking, such as evaluation and analysis. Teachers provide students with support and guidance, ensuring that all students (including those with special learning needs) have the chance to succeed in their classroom. Teachers are respectful of students and know students by name. Students are respectful of their teachers, engaged during class time, and actively participate in class activities.
Table 19 presents some detail from the Child-Centred Pedagogy scale by presenting the percentage of classrooms observed exhibiting certain characteristics indicative of child-centred instruction: teachers encouraging discussion among students, teachers facilitating higher-order thinking, and students not spending a lot of time copying the lesson from the textbook. In slightly fewer than two-thirds of classrooms across the countries, teachers were observed encouraging discussions among students and asking questions that facilitate higher-order thinking. In close to two-third of classrooms, students were observed spending little time copying the lesson directly from the textbook. However, the prevalence of these practices varied by country. For example, while in the Philippines teachers were observed facilitating discussions among students in a large majority of classrooms (this was ‗very true‘ in 89 percent of the classrooms), this was the case in only 56 percent of classrooms in Nicaragua. Teachers in all countries related lessons to students‘ lives outside of the classroom or to life skills or SEL at least some of the time in most classes. This was done least in South Africa and Nicaragua.

69
Table 19 Child-centred instructional methods: Percentage of classrooms observed
Nig
eria
South
A
fric
a
Phili
ppin
es
Th
aila
nd
Guyana
Nic
ara
gua
Avera
ge
The teacher facilitates discussions among students.
Very True 68 47 89 66 70 56 64
Somewhat True 21 25 11 32 20 30 24
Not at All True 11 28 0 2 11 14 12
The teacher asks questions that facilitate higher-order thinking.
Very True 74 42 79 63 68 63 63
Somewhat True 21 34 21 38 27 29 29
Not at All True 5 24 0 0 5 8 8
The students spend little time (less than 20%) copying the lesson from the textbook or chalkboard into their notebooks.
Very True 75 57 70 57 60 46 59
Somewhat True 22 15 28 32 38 46 30
Not at All True 3 28 2 11 3 8 10
The teacher relates information presented in the lesson to students’ lives outside of the classroom, life skills, or SEL.
Very True 71 44 81 57 51 51 58
Somewhat True 29 30 19 30 35 27 28
Not at All True 0 26 0 13 14 22 14
Students were asked about different child-centred instructional methods and whether they are being used in the classroom. Their responses, shown in Table 20, support the classroom observations. About three-quarters or more of students in all countries said that students are encouraged to participate in class, work together in class, and share their ideas and opinions in class, and that teachers will listen to explanations of students‘ answers. Table 20 Student perceptions about child-centred instructional methods
Statement
Nig
eria
South
Afr
ica
Phili
ppin
es
Th
aila
nd
Guyana
Nic
ara
gua
Avera
ge
Every student is encouraged to participate in class discussions. 78 82 92 82 81 73 82
Students are encouraged to work together in class. 82 85 91 88 87 92 87
Students are encouraged to share their ideas and opinions in class. 80 82 88 79 76 91 82
Teachers at this school listen if students want to explain their answers in class 84 83 95 82 81 92 86
Site visitors observed the use of both lecture-oriented instruction in which the teacher delivered content, and more active, student-centred and cooperative learning techniques. Photos 23 through 29 show the range of what was observed: a typical classroom in Nicaragua in which the teacher stood at the front of the classroom and lectured to students taking notes; a traditionally arranged classroom in Nigeria in

70
which the teacher encouraged student participation; a
Photo 23 Lecture-based instruction, Nicaragua Photo 24 Teacher engaging students, Nigeria
Photo 25 Student-led instruction, Philippines Photo 26 Students work in small group on a science
project, Guyana
Photo 27 Students collaborate on a poem,
Nicaragua Photo 28 Students work in pairs, South Africa

71
classroom in the Philippines in which a student led a lesson for her peers; and examples of children working together in pairs or groups.
4.4 Teacher beliefs and attitudes on child-centred pedagogy Teacher surveys suggest a commitment to active learning and student engagement. This is important because research suggests that teachers‘ beliefs about teaching and learning are important (Aubusson & Webb, 1992; Ernest, 1994). Teachers‘ responses to statements on the teacher survey about the effectiveness of child-centred instructional methods, shown in Table 21, converge with the classroom observations and student survey data. Table 21 Teacher beliefs about child-centred instructional methods
Statement
Nig
eria
South
Afr
ica
Phili
ppin
es
Th
aila
nd
Guyana
Nic
ara
gua
Avera
ge
Students have better academic achievement in classrooms where their active participation in learning is encouraged.
97 90 98 96 97 95 96
Classroom learning is most effective when based primarily on lectures, with students responding when called on.
66 62 54 13 38 66 49
When teachers allow students to discuss or debate ideas in class, it takes time away from learning.
37 20 18 7 7 11 18
Students can benefit from learning that takes place outside the classroom.
72 77 73 89 75 61 76
Overwhelmingly, teachers in the six countries endorse the use of active participation by students in class – 90 percent or more reported that students have better academic achievement in classrooms where their active participation in learning is encouraged. Similarly, most teachers did not agree that allowing students to discuss or debate ideas in class takes time away from learning, which is consistent with their beliefs about active engagement, although these responses indicate that traditional notions of what works linger for some teachers. Furthermore, teachers are fairly enthusiastic about the benefit of learning outside the classroom, with, on average, 76 percent of teachers across the six countries endorsing this statement with a response of mostly or very true. However, these attitudes have limits; more than half of teachers in four countries still think that ‗classroom learning is most effective when based primarily on lectures, with students responding when called on‘, suggesting that while teachers may be trying to engage children, more traditional notions about effective instruction are ingrained. Teacher focus groups suggested an understanding of the fundamental principles of CFS models regarding child-centred pedagogy and that there has been a shift from teacher-centred to child-centred
Photo 29 Students play a mathematics game, South
Africa

72
techniques as well as an increased emphasis on active learning with the implementation of CFS models. For example:
Children are provided for in the teaching-learning encounter to participate actively, asking and answering questions. —Teachers 09, Nigeria. [There has been a] shift from teacher-centred to child-centred teaching approaches. Before, the teacher would be in the centre of the classroom and/or at the front, discussing the whole lesson. The children would be listening and trying to absorb what the teacher just explained. In recent years, teachers have employed collaborative learning among students more and more. This is done through assigning students to work in groups, pairing fast learners with slow learners, and through some activity or interest-based grouping. —Teacher 05, Philippines.
Moreover, teachers view active, student-centred approaches as beneficial in multiple ways, including improving instructional quality, increasing children‘s level of interest, and increasing enrolment and student learning.
―After the teachers started using the methods and student-centred learning process they found that the students like this learning process very much. The students always feel confident to express their ideas and opinions. . . Moreover, when the students share ideas, opinions and experiences, the teachers feel very happy hearing the students speak out what they think and how they feel. This makes the teachers realize that their students are growing both physically and mentally.‖ —Teachers 16, Thailand.
On recent changes in pedagogy, teachers in South Africa said: Yes, the changes have been effective. Teaching methods that are participatory, like two-minute discussions, debates, group work, poems, and drama are helping pupils to be more involved. School trips, excursions, and education visits are helpful in promoting changes. The use of technology like TVs and DVDs raises the interest of learners; however, they need more technology. Encourage learners to do research on their own and then present their work. Teachers only coach/facilitate what the learner presents.‖ —Teacher 22, South Africa.
In response to the question about the child-centred techniques used, teachers described the use of peer-to-peer teaching, group work, and learning by doing. Teachers in Nigeria and Guyana also talked about the use of instructional aides to facilitate learning by doing and indicated that the provision of such materials is one example of how the school has shifted to a more child-centred pedagogy.
[We use] a socialized recitation method wherein there are more pupil activities or learning by doing. We discourage lecture methods of teaching; instead, the teacher acts as moderator. Children are taught to be better classmates and how to deal with their classmates.‖ —Teachers 01, Philippines. Students are divided into groups to work on certain projects, and they then present their work to the rest of the class. . . . Discussions among students are encouraged, and students are rotated to work in different groups so that all students have an equal chance to work with all their friends. Teachers often encourage peer-to-peer learning because sometimes students can communicate with each other better than with the teachers.‖ —Teachers 20, Thailand. ― Teaching aids boost pupils‘ learning; pupils learn how to ask questions, thereby making teaching more interactive. It makes pupils attend school regularly.‖ — Teachers 10, Nigeria. ―We use three-dimensional teaching/manipulative aids and we try to get the real things, for example through role playing in the classroom.‖ —Teachers 21, Guyana.
4.5 What are the challenges to providing child-centred pedagogy? There are two main challenges schools face in providing child-centred pedagogy: ongoing training, and access to instructional materials. Implementing child-centred pedagogy consistently requires ongoing training and follow-up, and these needs may not be currently met. Teachers feel hampered by a lack of instructional materials.

73
4.5.1 Teacher professional development and support Although most teachers believe in child-centred pedagogies, their ability to operationalize them effectively may be challenged, particularly when they must teach large numbers of students. Teachers‘ access to training and other professional development is critical for their continuous improvement and for their sense of professionalism. This is particularly important in countries without strong induction processes and pre-service institutions. It is equally important when teachers are asked to change their approaches to instruction and classroom management. Teacher survey data indicate that teachers are satisfied with the level of professional support they receive. However, this satisfaction may be limited to the respondents‘ own case, since focus group discussions indicate that teachers feel that a major challenge to being child-friendly is the lack of trained teachers. In interviews, school heads in all six countries stated that workshops are provided to train teachers in innovative teaching tactics and to impart general training on CFS. School heads feel this training is especially useful for new teachers, who may not know or understand the principles of CFS. As shown in Figure 16, in all countries more than half of teachers were at the satisfactory or excellent levels on the Support for Teacher Development and Pedagogy scale, and in five of the six countries, close to 80 percent or more of teachers were at the satisfactory or excellent levels. Figure 16 Teacher reports on support teacher for development and pedagogy
18
38
5 8
2315
6053
43
67 64 66
22
9
52
25
1318
0
20
40
60
80
100
Nigeria South Africa Philippines Thailand Guyana Nicaragua
Per
cen
tage
of
Teac
her
s
Needs Improvement Satisfactory Excellent
The Support for Teacher Development and Pedagogy scale measures the level of professional support, such as feedback on teaching methods, resources to plan lessons, materials to implement the curriculum, and access to development opportunities such as workshops, seminars and trainings, available to teachers at their schools.
Needs Improvement: Teachers lack the materials and resources necessary to develop and implement lesson plans. Further, teachers may not feel they are guided by an effective curriculum or that school leadership provides them with sufficient professional development opportunities to continually improve their teaching abilities. Little or no feedback is provided regarding their performance within the classroom, either from school leadership or from peers.
Satisfactory: Teachers receive professional development opportunities and resources to plan and implement lessons. Teachers believe that they are guided by an effective curriculum. In addition, while school leadership provides teachers with some feedback on their teaching performance, sometimes their peers also provide them with helpful feedback.
Excellent: Teachers believe that they are provided with a number of professional development opportunities for improving their teaching abilities and learning new techniques that help them to be better teachers and ensure that all children in their classes succeed. Moreover, teachers believe that schools consistently provide them with the materials and resources (including time) needed to plan lessons and implement lessons effectively. Teachers also believe that they are guided by an effective curriculum. Teachers perceive that school leadership provides regular feedback on teaching performance through meetings and class observations. In addition, feedback on their performance is provided by their peers.
Table 22 presents several items from the Support for Teacher Development and Pedagogy scale. Teachers have generally positive feelings about their opportunities for professional development, such as
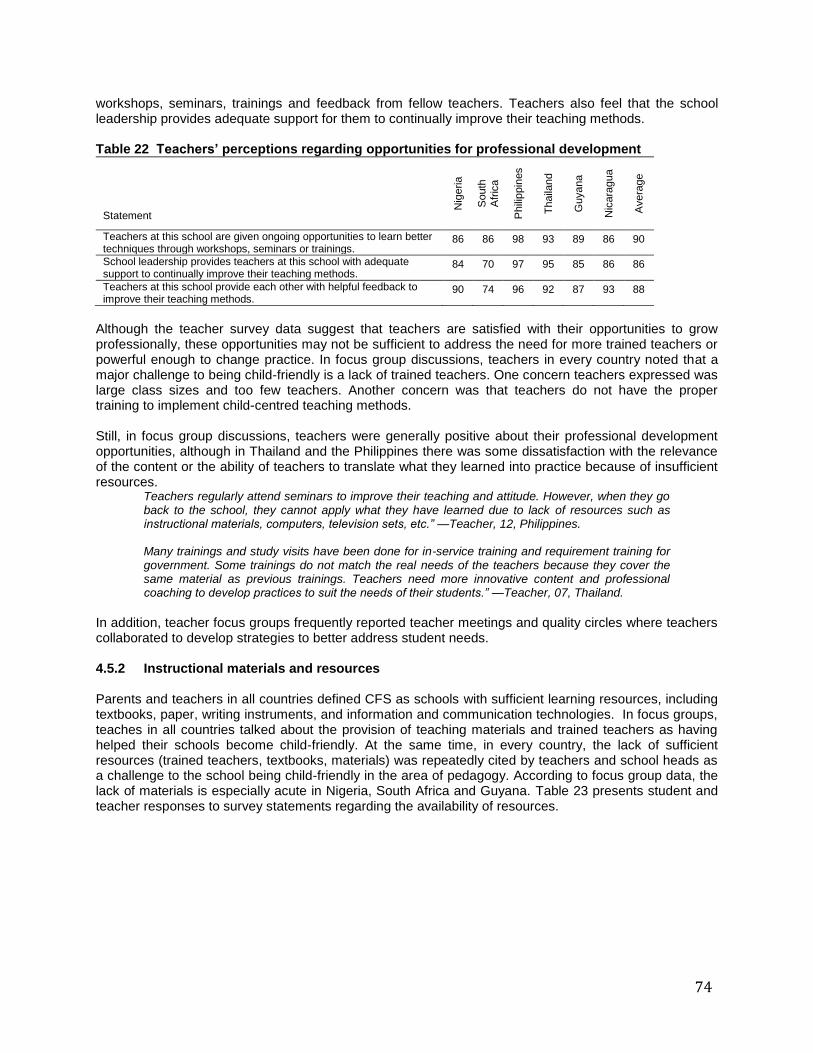
74
workshops, seminars, trainings and feedback from fellow teachers. Teachers also feel that the school leadership provides adequate support for them to continually improve their teaching methods. Table 22 Teachers’ perceptions regarding opportunities for professional development
Statement
Nig
eria
South
Afr
ica
Phili
ppin
es
Th
aila
nd
Guyana
Nic
ara
gua
Avera
ge
Teachers at this school are given ongoing opportunities to learn better techniques through workshops, seminars or trainings.
86 86 98 93 89 86 90
School leadership provides teachers at this school with adequate support to continually improve their teaching methods.
84 70 97 95 85 86 86
Teachers at this school provide each other with helpful feedback to improve their teaching methods.
90 74 96 92 87 93 88
Although the teacher survey data suggest that teachers are satisfied with their opportunities to grow professionally, these opportunities may not be sufficient to address the need for more trained teachers or powerful enough to change practice. In focus group discussions, teachers in every country noted that a major challenge to being child-friendly is a lack of trained teachers. One concern teachers expressed was large class sizes and too few teachers. Another concern was that teachers do not have the proper training to implement child-centred teaching methods. Still, in focus group discussions, teachers were generally positive about their professional development opportunities, although in Thailand and the Philippines there was some dissatisfaction with the relevance of the content or the ability of teachers to translate what they learned into practice because of insufficient resources.
Teachers regularly attend seminars to improve their teaching and attitude. However, when they go back to the school, they cannot apply what they have learned due to lack of resources such as instructional materials, computers, television sets, etc.‖ —Teacher, 12, Philippines. Many trainings and study visits have been done for in-service training and requirement training for government. Some trainings do not match the real needs of the teachers because they cover the same material as previous trainings. Teachers need more innovative content and professional coaching to develop practices to suit the needs of their students.‖ —Teacher, 07, Thailand.
In addition, teacher focus groups frequently reported teacher meetings and quality circles where teachers collaborated to develop strategies to better address student needs. 4.5.2 Instructional materials and resources Parents and teachers in all countries defined CFS as schools with sufficient learning resources, including textbooks, paper, writing instruments, and information and communication technologies. In focus groups, teaches in all countries talked about the provision of teaching materials and trained teachers as having helped their schools become child-friendly. At the same time, in every country, the lack of sufficient resources (trained teachers, textbooks, materials) was repeatedly cited by teachers and school heads as a challenge to the school being child-friendly in the area of pedagogy. According to focus group data, the lack of materials is especially acute in Nigeria, South Africa and Guyana. Table 23 presents student and teacher responses to survey statements regarding the availability of resources.

75
Table 23 Teachers’ and students’ perceptions about access to materials supporting learning
Nig
eria
South
A
fric
a
Phili
ppin
es
Th
aila
nd
Guyana
Nic
ara
gua
Avera
ge
Students
Students at this school have the materials they need to support their learning. 67 72 86 82 83 69 77
Teachers
Students at this school have the materials they need to learn. 44 35 74 83 57 47 57
Teachers at this school have the resources they need to plan effective lessons. 57 48 88 85 63 64 68
Teachers at this school are provided with an effective curriculum to guide their teaching.
85 76 97 93 88 86 88
Although students feel mostly positive about their access to materials to support their learning (67-86 percent responded mostly true or very true to a statement about having the materials they need), teachers are much less positive about students having access to the materials they need to learn. This is particularly true in Nigeria, South Africa, Guyana and Nicaragua, where 35-57 percent of teachers feel that students do not have the necessary materials. Moreover, only 48-64 percent of teachers in these four countries say they have sufficient resources to plan effective lessons. Teachers in the Philippines and Thailand are far more positive about their own and their students‘ access to materials and an effective curriculum. Teachers often improvise and make do with the materials available to them, but they generally feel that they need more resources to truly be child-friendly and be able to implement the kind of pedagogy emphasized in the CFS model. Moreover, when asked about priorities for their schools, teachers overwhelmingly mentioned the need for more instructional materials, ranging from very basic materials such as construction paper to computers and other technology.
One of the major problems we have had with the methodology and strategy used in the classroom is materials (lack of teaching materials and supplies). We have found means to replace materials. For example, if we do not have [something] like cylinders (used in science), we would use bottles and funnel. A challenge is lack of materials, adapted by making substitute materials.‖ —Teacher, 19, Guyana.
The challenge of insufficient resources in Nigeria is consistent with a 2005 baseline study for the Strategy for Accelerating Girls‘ Education in Nigeria, which compared CFS and non-CFS. This study found that although CFS were somewhat better resourced than non-CFS, basic instructional materials such as blackboards and chalk were insufficient and a substantial number of schools lacked sufficient textbooks and other basic materials. While teachers in Nigeria and Guyana mainly focused on meeting basic instructional material needs (textbooks, paper), many teachers in Thailand and the Philippines focused on having greater access to information and communication technology.
There‘s a lack of resources and they just make do with Manila paper when they could use existing technology like TV, computers, etc. However, they do not have this equipment in school. Students can learn more if all senses can be used by employing current modern technologies. Television and additional books can help a lot considering that they are just current[ly] confined to textbooks. —Teacher, 12, Philippines. The school would like to install VDO interface system and IT system in the whole school including personnel to be in charge of this department for management and maintenance [of] the system.‖ —School head, 25, Thailand.
Photos 30 through 32 given some sense of the variations in the level of resources available. While a typical library in a Thai CFS is spacious and well-stocked with reading material, in Guyana, a small

76
cabinet serves as the school‘s library. While many schools struggle for basic supplies, the school in photo 32 (Thailand) is fortunate to have multiple computers in a well-appointed computer lab.
Other components of the CFS model can buffer the impact of limited resources. For example, in the Philippines, teachers cited regular communication with parents as one way in which active change in classroom activities has been brought about and some CFS employ cross-age or peer tutoring. Furthermore, we saw many examples of family and community involvement generating important resources. The next chapter will describe CFS efforts to actively engage students, families, and, in some cases, the community.
4.6 What did we learn from previously conducted research on CFS? We were only able to locate a few studies that explicitly measure the impact of the CFS initiative on pedagogical approaches at the school level. Included within this discussion are studies measuring the impact of the CFS approach on student achievement, including proficiency in core subject areas such as
Photo 30 School library, Thailand Photo 31 School library, Guyana
Photo 32 Computer lab, Thailand (not usual in
Thailand but very atypical for other countries)

77
science and mathematics. Student performance on standardized tests is an indirect way of measuring programme impact as we hypothesize that improvements in teaching and learning environments brought about by implementation of the CFS approach results in students having significantly higher achievement compared to their peers in non-CFS. Several comparative evaluations measuring differences in achievement between these two groups have been conducted in recent years across geographic regions, including Cambodia (Marshall, 2007), India (Vine, 2006), the Philippines (National Education Testing and Research Center, 2008), Sri Lanka (UNICEF, 2004) and Timor Leste (Ninnes, 2005). Additional studies focusing more closely on the depth and breadth of CFS teacher training initiatives, as well as the resultant shifts in pedagogical techniques at the classroom level, have been conducted in Bosnia and Herzegovina (Center for Education Initiatives, 2003) and China (Government of China-UNICEF, 2005). In the majority of these evaluations, teachers reported that the primary benefit of the CFS programme has been exposure to and implementation of a range of new teaching methods, including participatory and student-centred methods (Ninnes, 2005). For example, in their 2003 evaluation of CFS training series in Bosnia and Herzegovina, the Center for Education Initiatives found that of the more than 600 teachers who participated, the majority reported that ―…for the past five to ten years, they did not attend any similar seminar or that any training they had… was theoretical in nature and insubstantial.‖ (p. 16). Other benefits, including how to make and use teaching and learning materials during classroom activities, greater levels of self-reliance and the ability to develop formative student assessments, were also identified by CFS teachers but less often (i.e., Center for Education Initiatives, 2003; Marshall, 2007; Ninnes, 2005). Some teachers also requested additional training in working with families and maximizing parental involvement in a way that complements the innovative pedagogical techniques they are adopting (i.e., Center for Education Initiatives, 2003). Although these evaluations do not consistently demonstrate higher CFS student performance on standardized tests of achievement, they do provide some evidence of CFS bolstering learning and improving teaching practices. For example, in 2008, UNICEF-EAPRO initiated an assessment of the quality of learning at the primary level in the region. The National Education Testing and Research Center of the Philippines Department of Education implemented the evaluation in the Philippines. The primary foci of this evaluation were to assess the learning achievement of Grade IV and Grade VI pupils in science, mathematics, English and HeKaSi (social studies) and to determine the success of the CFS system in bolstering student learning compared to students in non-CFS. Grade IV and Grade VI learners were selected from 9 divisions (N = 640) throughout the Philippines representative of both urban and rural communities. Overall, students in both groups performed similarly. Among Grade IV learners, the exception was science – CFS students performed higher compared to their non-CFS peers. The authors note that this could be due to the presence of more science equipment in CFS. Among older students (Grade VI learners), CFS students performed significantly higher on English achievement tests only. Further, across grades, female students tended to perform higher on English achievement tests compared to male students. The evaluation also examined differences in pedagogical techniques within the classroom and found that teachers within CFS maximized the instructional materials available to them within their classrooms and more strongly expressed their enjoyment for working with children. However, evaluation findings also suggested the need for additional teacher training, particularly in ―…scaffolding learners to extend or stretch further what they can do with the content they are learning…‖ (p. v). Similarly, Vine (2006) found that Grade V learners attending CFS in Punjab, India, performed higher on standardized tests of English, mathematics, social sciences, science and Urdu. Within this group, male students performed better in mathematics and social sciences compared to female students who performed better in English and Urdu. These patterns did not hold within and across the six districts, indicating that not all CFS within Punjab have been able to effectively promote higher levels of learning in all subjects. Although differences between learning environments were quite small, CFS students did report greater involvement in class discussions, such as more trips to the blackboard to demonstrate their solutions to homework problems, compared to their peers at non-CFS. Although this finding is suggestive

78
of a more dynamic teaching and learning environment, Vine (2006) notes that future efforts to determine the relationship between the CFS approach and academic performance must also include more detailed measures of ―CFS-ness,‖ or a school‘s location along the CFS dimensions (child centredness, democratic participation and inclusiveness).
4.7 What did we learn from the Delphi survey of UNICEF Education Officers? According to UNICEF Education Officers, child-centredness in terms of pedagogy is strongly emphasized across countries. When asked to say how frequently elements of CFS – architecture, services, pedagogy, participation and governance, and inclusiveness – are implemented in the country in which they work, 17 percent of respondents said that pedagogy is ‗most often‘ implemented, second after architecture. Indeed, UNICEF has promoted child-centred pedagogy across countries. Initiatives to this end include two-week long training of teachers, using a cascade model, on the various dimensions of CFS with a major focus on child-centred active learning, and the development of a ―…national strategy and programme for in-service education and training of primary teachers.‖ One country has focused on training teachers in pilot schools and has developed a pre-service training programme. In addition to training on child-centred teaching methods, training of teachers across countries has addressed sensitization to child rights, team building, HIV/AIDS, prevention of violence, and life skills education. There is, however, a widespread feeling among UNICEF Education Officers that teachers do not have sufficient training to apply the principles of CFS (only 27 percent said ‗teachers have sufficient training in how to implement CFS‘). One respondent wrote: ―Although teachers often have a basic understanding of the need for child-centred pedagogy due to initial teacher training they are often poorly trained in such methods and do not carry the theoretical over into practice.‖ The respondent went on to explain that as a result, UNICEF‘s strategy in that country is to support the ―…development of a national INSET [in-service education and training] strategy and programme for all primary teachers, linked to support for a review of pre-service training which UNESCO will focus on.‖ Delphi respondents also indicated that there are efforts in place to address teacher motivation and to make schools ‗teacher friendly‘. One of the ways of doing this is teacher training. One respondent wrote: ―In-service teacher training itself is a tremendous motivating factor, especially where teachers have been recruited without any basic training or teaching qualifications. [Our] focus on non-threatening teacher supervision and support is being increased to promote teacher development in an interactive manner. Teachers see the CFS framework and approach as a tremendous aid in addressing issues and problem-solving, which makes them feel more empowered.‖ Other strategies for making schools teacher-friendly workplaces include using volunteer teachers, who provide support to the teacher in class – and advocating for a more focused curriculum. Applying the principles of CFS may also lead to greater teacher satisfaction. As one respondent put it, ―CFS implementation shows that teachers do get satisfaction from positive outcomes that CFS brings in terms of supportive environment in school, learning outcomes, and team work.‖ Child-centred teaching methods, which are often introduced as a replacement to traditional teacher-centred methods and adult-child communication patterns, may be met with some resistance by parents and communities who are not familiar with such approaches and may not see their value. This resistance makes it difficult to successfully implement such methods. UNICEF has taken steps in some countries to communicate the value of child-centred teaching approaches to parents, for example through training of education committee members, although some respondents acknowledge that they have not focused on this kind of advocacy in their countries. One respondent described the use of the community dialogue process ―…to educate parents about the value of child centred pedagogy, including such basic concepts as the use of textbooks enhances learning, not least reading, while it also reduces the wastage of time caused by simply copying text off the board. We also discuss the importance of learning outcomes with parents, including literacy, numeracy and life skills and try to ensure that Whole School Development Plans are geared to quality learning outcomes as well as to issues of equity.‖

79
CHAPTER 5 – DEMOCRATIC PARTICIPATION
The moment the school became CFS the community members were invited. [This] led to the formation of mothers club. Community members are always called up whenever materials are brought to the school. Even though there is no fathers club… father[s] are actively involved in PTA meetings. The men work effectively to improve the school.
The children are invited during meetings of PTA to find out their problems. They also participated through their parents. They also serve as prefects and monitors in order to maintain discipline in the school. It is important that children are part of decision making. This is because they are the ones whom all decisions are taken for. If they do not participate, what will be [decided] may not be liked by them.
There are great changes…The changes came from the moment CFS started. The school management now meets regularly to discuss issues concerning the school.‖
— Parents, Nigeria
________
As a rights-based approach, CFS emphasizes the participation of children and those who facilitate their rights in determining the structure, content and process of education. The principle of democratic participation means that in CFS, children, parents and communities are actively engaged in school decision-making and management. Education does not happen to children, it happens with children. International studies have shown that when schools perceive their relationship with families as a two-way partnership in which there is shared responsibility for children‘s outcomes, the resultant collaboration fosters higher enrolment, retention, achievement and engagement with school (Lewis & Lockheed, 2006; Postlethwaite & Ross, 1992; UNESCO, 2006). Parents from socially excluded groups in particular need to be involved in their children‘s schooling, given the unique challenges facing those students. Programmes that engage parents in PTAs or provide other opportunities for involvement help parents who have not attended school or who have lower levels of education understand the objectives of schooling and bring them into the decision making process (Lewis & Lockheed, 2006; UNESCO, 2006). Without support from parents, it is difficult both for schools to implement initiatives such as CFS and for parents to effectively address behavioural/academic issues with their children at home. Parents may have competing demands, such as the need for children to contribute financially to the household, and if they do not see the value of attending school – if the quality of education is poor – those demands win out. Although some middle-income countries have developed targeted interventions that strive to integrate excluded populations into educational programming, many developing nations continue to struggle due to lack of resources (Lewis & Lockheed, 2006). But some studies have shown (e.g., De & Dreze, 1999) that low-cost methods of garnering parent and community member involvement, such as town meetings and one-on-one canvassing, can create effective community oversight of teacher attendance and performance, student attendance and school safety. When schools and families extend their partnership to include community members, the benefits are even greater (Lindert, 2004; UNICEF, 2007b; Woessman, 2000). In fact, the sustainability of educational reforms and initiatives often hinges on the degree to which programmes are integrated into the community (e.g., Shingles & Lopez-Rayna, 2002). CFS models also emphasize building a sense of community both within the school (i.e., among students, teachers and school leaders) and outside the school (i.e., among school officials, students‘ families and local community members), in recognition of the fact that schools are part of the communities they serve.

80
In this chapter, we describe how CFS apply the principle of democratic participation by actively engaging children, parents and communities in school management and decision-making. We address the following issues through data from the six countries:
the ways in which children participate in school decision-making;
what schools do to promote parent and community participation;
the ways in which parents and communities participate in school management and children‘s education; and
the challenges schools face in fostering democratic participation. Multiple sources of data to address these issues:
survey data collected from students, teachers and school heads to report information on the frequency and type of involvement for each of these groups in decision-making activities at the school and school events; and
interviews with school heads, teachers and parents on the ways in which the CFS approach has prompted schools to reach out to families and community stakeholders.
The last section of the chapter presents findings from the six countries in a broader context by discussing findings germane to democratic participation in CFS from our review of previously conducted research on democratic participation in CFS globally and what we learned from the web-based Delphi survey of UNICEF Education Officers. Although not all issues are addressed by each source, we highlight when multiple sources converge or diverge on an issue.
5.1 Summary of key findings In brief, the results from surveys and interviews administered to students, teachers, school heads, and parents and community members suggest the following patterns across countries:
high levels of student and parent involvement in many, but not all, schools;
increasingly formal roles of students in decision-making activities through student governments or councils that participate in a range of school activities, including fundraising, beautifying the school compound and peer tutoring;
perceptions that students‘ self-esteem and school engagement improve as a result of increased student involvement;
high levels of parental involvement both at home and at school (an important outcome given the beneficial impact of parent involvement on student achievement and on generating resources and support for CFS);
a consistently significant and positive relationship between family and community participation with all three student outcomes in HLM analyses. We uncovered evidence that the involvement of parents in school events and decision-making activities, as well as the support of community members for the school and their encouragement for students to continue their education, plays a substantial role in students‘ perceptions of school climate and their level of connectedness to their school;
improved communication between school officials and local community members to increase community involvement and ownership of the CFS initiative;
substantial efforts by many schools to create a welcoming atmosphere for parents and encourage parent and community member participation in school events and decision-making activities (however, interviews with parents and school heads also suggested that parents and community members face several challenges to increasing parent involvement: poverty, parental illiteracy and negative judgments of parents by school officials and teachers based on parents‘ educational background);
absorption by families and communities of some education-related costs. For the most part, for example, parents provided free labour or materials for school construction projects. Also, in many of the schools visited in this sample – especially in Thailand and the Philippines – parents (often mothers) cooked simple and nutritious meals for the school feeding programme;
previously conducted research on CFS consistently points to the increased involvement of students in their education, such as the formation of health and other special interest clubs and
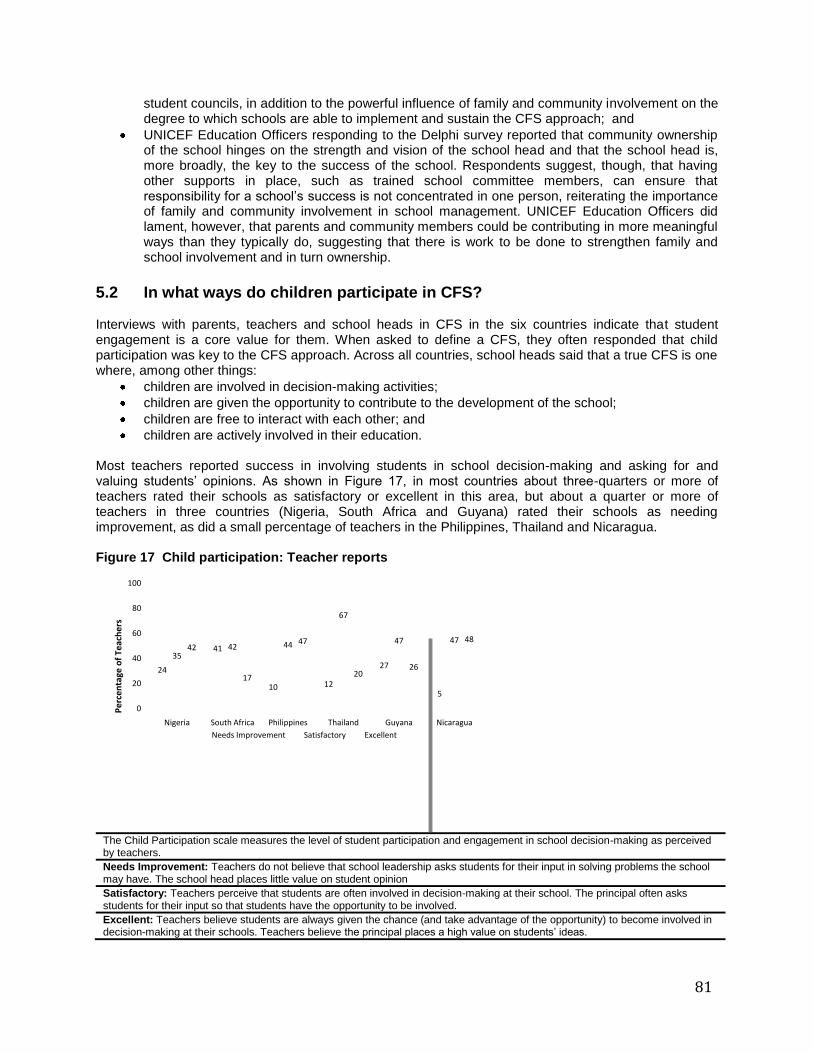
81
student councils, in addition to the powerful influence of family and community involvement on the degree to which schools are able to implement and sustain the CFS approach; and
UNICEF Education Officers responding to the Delphi survey reported that community ownership of the school hinges on the strength and vision of the school head and that the school head is, more broadly, the key to the success of the school. Respondents suggest, though, that having other supports in place, such as trained school committee members, can ensure that responsibility for a school‘s success is not concentrated in one person, reiterating the importance of family and community involvement in school management. UNICEF Education Officers did lament, however, that parents and community members could be contributing in more meaningful ways than they typically do, suggesting that there is work to be done to strengthen family and school involvement and in turn ownership.
5.2 In what ways do children participate in CFS? Interviews with parents, teachers and school heads in CFS in the six countries indicate that student engagement is a core value for them. When asked to define a CFS, they often responded that child participation was key to the CFS approach. Across all countries, school heads said that a true CFS is one where, among other things:
children are involved in decision-making activities;
children are given the opportunity to contribute to the development of the school;
children are free to interact with each other; and
children are actively involved in their education. Most teachers reported success in involving students in school decision-making and asking for and valuing students‘ opinions. As shown in Figure 17, in most countries about three-quarters or more of teachers rated their schools as satisfactory or excellent in this area, but about a quarter or more of teachers in three countries (Nigeria, South Africa and Guyana) rated their schools as needing improvement, as did a small percentage of teachers in the Philippines, Thailand and Nicaragua.
Figure 17 Child participation: Teacher reports
24
41
10 12
27
5
3542 44
67
47 4742
17
47
2026
48
0
20
40
60
80
100
Nigeria South Africa Philippines Thailand Guyana Nicaragua
Pe
rcen
tage
of
Teac
he
rs
Needs Improvement Satisfactory Excellent
The Child Participation scale measures the level of student participation and engagement in school decision-making as perceived by teachers.
Needs Improvement: Teachers do not believe that school leadership asks students for their input in solving problems the school may have. The school head places little value on student opinion
Satisfactory: Teachers perceive that students are often involved in decision-making at their school. The principal often asks students for their input so that students have the opportunity to be involved.
Excellent: Teachers believe students are always given the chance (and take advantage of the opportunity) to become involved in decision-making at their schools. Teachers believe the principal places a high value on students‘ ideas.

82
School heads were more positive than teachers regarding student involvement, including leadership and decision-making, with higher percentages of school heads in five of the six countries rating their schools as satisfactory or excellent than did teachers (Figure 18). In Thailand and the Philippines, all school heads rated their schools as satisfactory or excellent.
Figure 18 Child participation: School head reports
13
24
8 8
57
44
29
60
50
71
30 32
71
40 42
21
0
20
40
60
80
100
Nigeria South Africa Philippines Thailand Guyana Nicaragua
Pe
rce
nta
ge o
f D
ire
cto
rs
Needs Improvement Satisfactory Excellent
The Child Participation scale measures the extent to which students in the school are given opportunities for taking leadership roles, making decisions and collaborating with peers.
Needs Improvement: The school head reports little evidence that students provide leadership or are engaged in school decision-making, and little evidence that the school fosters peer-to-peer collaboration.
Satisfactory: The school head describes the school as a place where students are engaged in leadership and decision-making, often planning and implementing activities and contributing to decisions. Students often collaborate with one another.
Excellent: The school head describes the school as very strong on student leadership and decision-making, with students frequently planning and implementing activities and contributing to decisions. Students regularly collaborate with one another.
Most often, child participation is formally enacted through student councils or student government. Student governments, pupil parliaments, student councils and similar groups exist across the six countries. For example, in several schools in Nigeria, students are elected to a student council headed by the general monitor (each class also has its own monitor). The council is charged with discussing student issues with the headmaster. Student groups often come together to discuss the issues students and the larger school community face. Often, each classroom will have a representative who will have duties to perform as a member of a specific committee, such as an assembly committee or a sanitation committee. Students rotate these roles so that every child has a chance to serve on a committee (and so that children have a wider range of experiences). Further, as a school head in Thailand noted, ―…students get the chance to practice living together in a democratic system. Whenever there is a problem, they will decide as a group.‖ A school head in Guyana posited that one of the primary differences between his school and other schools that do not participate in CFS was the formation of a student government body; this student government organized celebrations (involving singing and dancing) to mark the anniversary of CFS implementation. This school head believed that CFS has led to increased student participation and improved academic performance. The type of student participation in CFS varies both within and across countries, ranging from school beautification projects to fundraising. In Guyana, for example, several school heads reported that the student government participates in school assemblies and implements tasks such as beautifying the school compound, making trash bins for the school and related chores. In Thailand, some school heads mentioned that students are responsible for classroom decoration and cleaning; students organize their
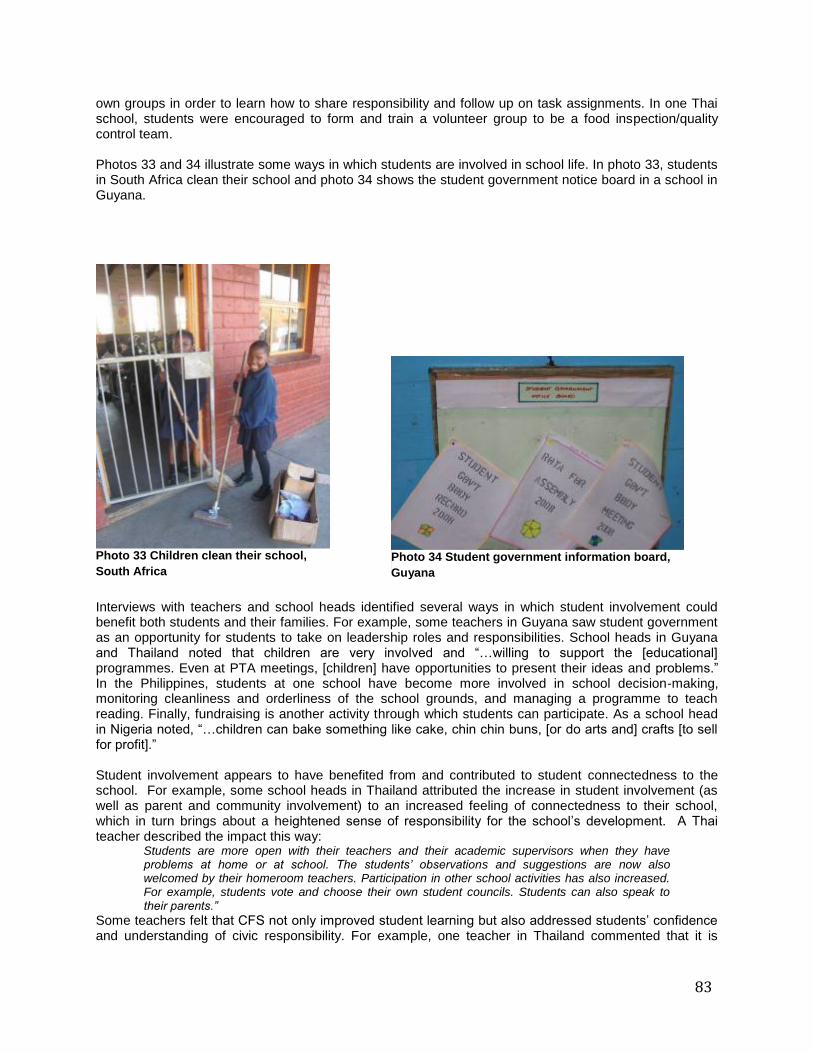
83
own groups in order to learn how to share responsibility and follow up on task assignments. In one Thai school, students were encouraged to form and train a volunteer group to be a food inspection/quality control team. Photos 33 and 34 illustrate some ways in which students are involved in school life. In photo 33, students in South Africa clean their school and photo 34 shows the student government notice board in a school in Guyana.
Interviews with teachers and school heads identified several ways in which student involvement could benefit both students and their families. For example, some teachers in Guyana saw student government as an opportunity for students to take on leadership roles and responsibilities. School heads in Guyana and Thailand noted that children are very involved and ―…willing to support the [educational] programmes. Even at PTA meetings, [children] have opportunities to present their ideas and problems.‖ In the Philippines, students at one school have become more involved in school decision-making, monitoring cleanliness and orderliness of the school grounds, and managing a programme to teach reading. Finally, fundraising is another activity through which students can participate. As a school head in Nigeria noted, ―…children can bake something like cake, chin chin buns, [or do arts and] crafts [to sell for profit].‖ Student involvement appears to have benefited from and contributed to student connectedness to the school. For example, some school heads in Thailand attributed the increase in student involvement (as well as parent and community involvement) to an increased feeling of connectedness to their school, which in turn brings about a heightened sense of responsibility for the school‘s development. A Thai teacher described the impact this way:
Students are more open with their teachers and their academic supervisors when they have problems at home or at school. The students‘ observations and suggestions are now also welcomed by their homeroom teachers. Participation in other school activities has also increased. For example, students vote and choose their own student councils. Students can also speak to their parents.‖
Some teachers felt that CFS not only improved student learning but also addressed students‘ confidence and understanding of civic responsibility. For example, one teacher in Thailand commented that it is
Photo 33 Children clean their school,
South Africa
Photo 34 Student government information board,
Guyana

84
―…obvious that the total environment of the school has improved qualitatively and quantitatively because students learned how to use their rights and how to participate in student development.‖ CFS programming is, for some school heads, associated with greater independence and autonomy for students. One school head mentioned that CFS has led to substantial increases in student involvement at his/her school:
[Students] can decide on their own as to what they want to do. There is this boldness in them where the students can say [to their teacher] ‗This is what I want to do today‘. They can share their ideas and we can work together towards these ideas. They would tell us that the toilet facilities should be improved or they want better interaction between teachers and pupils. The student government brings these issues to the platform once per month. —School head 15, Guyana.
Teachers at some schools in the Philippines also commented that students‘ involvement in school activities has made them more committed to the quality of education they receive and to the quality of their school environment. For example, teachers noted that students have:
planted flowers and vegetables in the school garden;
established and operate a Children‘s Right Club;
organized a student union to manage school matters, together with teachers and board members; and
organized peer tutoring networks to help slower students and organized study groups (e.g., Galing Ko Ibahagi Ko – My Knowledge I Will Share).
Views such as these suggest that the implementation of CFS has had an important effect both on children‘s ability to engage their parents and teachers and on their self-confidence, given that children increasingly discuss their thoughts with parents and teachers. According to a teacher in Thailand, students are ―…less stressed and are happier because they get to participate in all kinds of activities in school.‖ At schools with peer tutoring networks, teachers often reported that these programmes ―…have somewhat reduced the frustration of underachieving students because they were able to complete school work and assignments.‖ Further, according to some teachers in Thailand, such student-led initiatives are viewed as exemplars of the CFS approach because ―…children have the right to choose the career they want and students can participate in their own learning more, which leads to the career of their choice.‖ Several parents in Nicaragua also agreed with teachers and school heads that student involvement – particularly in student governing bodies, which formalize students‘ roles and decision making powers – has helped students take responsibility for the situations that arise within their schools and also to speak with their parents about these situations. Children now have a voice and representation during decision-making activities. Parents who described this phenomenon were very supportive of it, stating that ―…this is good that they are taking responsibility, that‘s part of education.‖ As children were more ―united in purpose‖, there was less friction among them. Such cohesion also, according to one parent, reduced the chances of children engaging with out-of-school children who were selling or abusing drugs. According to a school head in Nigeria, some pupils also report absenteeism or student problems to the school authority. In addition, parents also believed that student government had taught their children practical life skills, such as cleanliness and organization.
5.3 Promoting parent and community participation in CFSs As multilevel analyses suggested, there was a consistently significant and positive relationship between family and community participation with all three student outcomes. We uncovered evidence that the involvement of parents in school events and decision-making activities, as well as the support of community members for the school and their encouragement for students to continue their education, plays a substantial role in students‘ perceptions of school climate and their level of connectedness to their school. A school‘s commitment to involve parents and community members also plays a critical role in students‘ perceptions of school climate and connectedness. According to parents, a unique difference between CFS and schools that do not implement this programme is that CFS gives parents the

85
opportunity to make contributions. School heads also reported wanting parental input in decision-making activities. In Guyana, for example, some teachers and school heads discussed the value of PTA meetings where parents and community members can make suggestions on issues facing the school. If these suggestions are in line with achieving the school‘s child-friendly goals, the school works with parents to implement them. For many parents, teachers and school heads interviewed in the six countries, strengthened school-family partnerships were a key component of the CFS approach. School heads in Nigeria, Guyana and the Philippines reported that a CFS is one where teachers and parents have a ―cordial relationship‖ and work together to achieve ―…progress in terms of [students‘] learning activities.‖ Several parents stated that they have embraced the changes brought about by the CFS programme and that parents are the driving agent of change in CFS. Moreover, rapport between existing PTAs and schools has continued to increase since CFS began in some communities in Nigeria and the Philippines. A school head in the Philippines reported that:
The implementation of CFS has changed the way the school reaches out to parents and community members. Since they know what is happening in the school, they have become more cooperative. With the community‘s assistance, the school can attain more goals. And a community where CFS is located can be transformed to a better community. – School head, 14, Philippines.
The importance of parent participation is also an oft-repeated theme throughout interviews with school heads across the six countries. One school head in Guyana suggested that parents and other community stakeholders should participate in school activities and decision making processes to ensure engagement with the CFS programme. In the Philippines, one school head noted the importance of:
Active involvement of parents as the primary partners of the school in the growth and development of children – especially their mental, physical, emotional, social and spiritual development. [Moreover,] people of the community serve as role models to the children. —School head 14, Philippines.
Not only is parental involvement a value, it is operationalized. When asked how CFS changed the amount or way in which the school reaches out to families and the community, parents in a high-performing CFS said:
the school makes it a point to dialogue with the parents and reaches out to out-of-school children so that they go back to school;
the teachers provide extra time and days to ensure that those needing more instruction are attended to;
parents and teachers help each other to ensure that the children study hard; and
school discipline is being realized through cooperation between the teachers and parents. As shown in Figure 19, school heads reported high levels of effort to increase family and community involvement, with only one country (Nigeria) having any school heads responding in the ‗needs improvement‘ category (and even then, only 4 percent did so). Teachers (shown in Figure 20) are mostly positive about their schools‘ efforts to involve families and communities and their success in doing so, with more than 80 percent rating schools satisfactory or above.

86
Figure 19 Family and community participation: School head reports
4
48
60
13
48
65
5448
40
88
52
35
46
0
20
40
60
80
100
Nigeria South Africa Philippines Thailand Guyana Nicaragua
Per
cen
tage
of
Dir
ect
ors
Needs Improvement Satisfactory Excellent
The Family and Community Participation scale measures the school‘s efforts to involve families in their children‘s education, reach out to families with information and support, reach out to the community, and involve families and communities in school decision-making.
Needs Improvement: The school head reports inconsistent contact with families about student progress or school activities, and there is an uneven attempt to contact families of students who may be at risk. Families are not active in school decision-making. There is little contact with the community, and partnerships with local business or organizations are weak or nonexistent.
Satisfactory: The school head reports that the school keeps families informed of student progress, regularly contacts families of children who may be at risk, and informs families about what is happening at school. The school head reports that families are encouraged to participate in decision-making. The school usually keeps the community informed about school activities and often includes members of the community in school decision-making. The school has some partnerships with local businesses or organizations.
Excellent: The school head reports that the school consistently keeps families informed of student progress through a variety of means, regularly contacts families of children who may be at risk, and actively informs families about what is happening at school, including school policies. The school head also reports that families are regularly included in school decisions. The school actively includes the community in the school by informing the community of school activities and including community members in decision-making. School partnerships with local businesses or community organizations support student learning.
Table 24 presents the percentage of students, teachers and school heads who agreed highly (responding either ‗mostly true‘ or ‗very true‘) with select survey items related to family involvement by country. As Table 24 illustrates, nearly all school heads report a high level of effort to engage families and students, and teachers mostly agree that families are aware of what is going on in school and are invited to participate. Teachers acknowledge, however, that there are some barriers. Interviews with teachers and school heads also suggest that there are limits to family engagement and that there can be a cultural disconnect between schools and parents that limits family engagement.

87
Table 24 Student, teacher and school head perceptions regarding family participation in CFS
Statement
Nig
eria
South
Afr
ica
Phili
ppin
es
Th
aila
nd
Guyana
Nic
ara
gua
Avera
ge
Student Survey
My family knows what goes on inside this school. 68 71 80 52 62 74 68
Families like mine are involved in making decisions that affect this school. 69 72 71 58 61 41 64
Teacher Survey
This school fails to involve parents in most school events or activities. 21 19 12 8 9 43 17
At this school, it is difficult to overcome the cultural barriers between teachers and parents.
62 80 81 90 86 82 80
Lots of parents come to events at this school. 77 53 92 90 70 89 78
School Head Survey
Staff make direct contact with families whose children drop out of school to encourage the child‘s continued enrolment.
91 84 100 100 88 100 94
This school provides information about school activities to families in a language and format they understand (e.g., written or oral).
100 96 96 100 100 96 98
All types of families are encouraged to participate in decision making , regardless of race, ethnicity, gender, language, disability or religion.
100 92 92 100 92 96 95
This school has an active Parent Teacher Association or School Management Council.
96 100 100 92 100 96 97
Figure 20 Family and community participation: Teacher reports
14
34
4 7
18
9
73
5458
7267
84
13 12
38
2115
7
0
20
40
60
80
100
Nigeria South Africa Philippines Thailand Guyana Nicaragua
Perc
enta
ge o
f Tea
cher
s
Needs Improvement Satisfactory Excellent
The Family and Community Participation scale measures the extent to which teachers perceive that partnerships among schools and parents and other local community members have been formed. Specifically, this scale taps teachers‘ perceptions of whether parents support their children's school by becoming involved in school events and whether school officials encourage and welcome the input of parents and community members.
Needs Improvement: Parent and community involvement in school activities is minimal or nonexistent, either because the school does not create a welcoming environment for parents or parents are not supportive of the school. Cultural barriers between teachers and parents exist and have not been overcome. Adults in the community do not encourage students to take school seriously or support school activities.
Satisfactory: Teachers report that families and community members participate in school events and decision-making activities at least some of the time or to at least some degree. Teachers also report that some or most adults in the community support the school and encourage youth to take school seriously.
Excellent: Parent attendance at school events is high and consistent. Teachers perceive the school to be enthusiastic about parent participation at events and family participation in decision-making at the school. Communities also demonstrate their support of the school through regular attendance at and participation in school activities. Cultural barriers between parents and teachers are easily overcome.

88
Photos 35 and 36 illustrate ways in which parents are involved and demonstrate their commitment to the school. Photo 35 shows a wall in a school in Nicaragua listing members of the parent advisory board and photo 36 shows parents who run a school feeding programme distributing food to children.
5.3.1 How do CFS engage families? Although parent participation is an important aspect of the CFS approach, it is a relatively new concept for many schools, so the school administration must recruit parents. School officials do this in different ways. In countries such as Nigeria and Guyana, school heads often distribute pamphlets to parents, local leaders and other community members and hang posters around local neighbourhoods to illustrate the different ways in which the community can become involved in decision-making activities at the school. Teachers in Guyana also noted that school leadership has encouraged parents to become involved by telling them what the school needs and the different ways in which they can help. In the sections that follow, many of the examples of parent engagement that are provided were observed or described during interviews in the Philippines. However, these examples are representative of parent engagement across countries – activities such as fundraising, serving as classroom aids, donating time and materials towards architectural improvements on school grounds, cooking fresh hot lunches for students, serving on PTAs and other school governance committees – and are activities in which parents across the six countries participated. Parents as volunteers and fundraisers For many parents, providing financial support towards school events is burdensome due to their financial instability or chronic poverty. According to interviews with parents, teachers and school heads, poverty and illiteracy limit parent involvement across the six countries. Further, parents who work long hours do not have close contact with the school or with their own children about their school experiences and so cannot express opinions because they are unfamiliar with the challenges the school and their children may be facing. Thus, parents often become involved in their children‘s schools via the provision of in-kind labour or the donation of materials and food. At one school in Thailand, teachers noted that:
―In the end, the school head does not have the policy to request financial support from the parents and community because it is an imposition. So if any furniture or a part of the classroom needs to be fixed, the school will handle it. But if any parents or community members volunteer to help or contribute, then it‘s fine.‖ —Teachers 1, Thailand.
Photo 35 List of parent advisory
board members, Nicaragua
Photo 36 Parent volunteers run feeding
programme, Nicaragua

89
When parents have a greater sense of belonging to schools, they tend to take on more responsibility for school development, such as cleaning classrooms or the school grounds. Some parents in Guyana also reported that school heads give them the opportunity to donate either time or money and because of this flexibility, the number of parents who visit the school has increased. Groups such as mothers‘ clubs, PTAs and civic organizations (e.g., Rotary Clubs) in the community often assist in fundraising efforts as well. At several schools in the Philippines, PTA organizations have extended support to schools by funding teacher trainings and providing donations. In Nigeria, teachers reported that ―…parents and teachers cooperated to build a school library. Further, the Mothers‘ Club has been keeping the school environment tidy.‖ Across schools and countries, parents reported engaging in a variety of activities, such as:
mounting tanks to provide potable water for pupils and teachers;
holding monthly meetings to monitor the progress of the school;
initiating building a fence around the school compound;
planting flowers in the school;
attending school events such as dances, fairs and sports days;
participating in assigned cleanup days;
contributing money to run the home economics department;
going on school drives to ensure all children are in school;
assisting in canteen construction;
intervening when corporal or tedious forms of punishment are used;
funding feeding programmes for malnourished students and school supply programmes for disadvantaged students; and
augmenting the work of formal teachers by serving as classroom aides. Parents as partners with teachers In some schools, particularly in the Philippines, parents mentioned their participation is not limited to school building repairs or manual labour but extends to the classroom. For example, in one school in the Philippines, parents help prepare instructional materials. At another school, parents and teachers use a common notebook to promote information sharing. Teachers leave notes for parents on students‘ progress and instructions for completing homework assignments, and parents sign off on such notes; teachers also meet with parents on Saturdays to discuss student performance. In Nicaragua, some parents mentioned that they are able to support teachers‘ efforts to maintain child-friendly practices within the classrooms so that children are healthy and well. These parents also noted that parent participation offers another perspective for school staff when wrestling with students‘ behavioural problems, funding issues and other matters. Parent-teacher meetings are also an opportunity for school officials to demonstrate the importance of being child-friendly and how child development can benefit from CFS principles and activities. At several schools in Guyana, such meetings discuss disciplinary strategies for children and effective behaviour management techniques. One school in Guyana has scheduled ‗open days‘ once per term, wherein parents can observe classes and have open conversations with their children‘s teachers. In addition to this formal forum, the school head reports that parents are always welcome to talk with their children‘s teachers and check their books to learn more about school activities. Teachers and parents alike noted an improvement in students‘ academic performance that may be due to a strengthened partnership between the school and family. Parent involvement also extends to helping children with their homework, encouraging them to attend school regularly and be on time for classes, and emphasizing the importance of education for their future. In Guyana, some teachers also stressed the importance of parents making learning fun. In many countries, treating parents as partners in children‘s education has prompted an increase in student achievement. Indeed, parents in Nicaragua consistently asserted that communication between teachers and families has improved with the CFS initiative. For example, a group of teachers in Nicaragua have collaborated with parents to develop a learning guide for pupils with learning difficulties.

90
During our site visits we saw several powerful examples of school-family partnerships. One came from the Philippines and involved a school that was located in a crime-ridden, drug-infested community characterized by violence and gang membership. Maintaining ―…peace and order was the top priority…‖ for school officials, students and parents. Through the involvement and collaboration of the PTCA, the school administration organized a series of seminars with parents and Barangay [district] officials. Through this strengthened relationship, the school was able to prohibit gang activity on school property, provide security to children as they walked to and from school, and facilitate a series of workshops for students and parents on the negative effects of drug abuse, with local policemen serving as resource speakers. Parent interviews suggested that the PTCA shouldered the salary for the security guards at the school. In addition, at this same school, prior to the implementation of the CFS model, some teachers used corporal punishment as a disciplinary strategy; teachers would force students to stand or squat for hours outside under the sun. Now the PTCA and teachers require students to complete community service projects. This type of collaboration is most effective when all stakeholders have a clear understanding of the school‘s direction and the principles by which CFS operate. Home visits to promote family engagement The sense of ownership and collaboration depicted in these two examples drives the success of CFS. But for this sense to exist, the school needs to create an accommodating environment for families. A striking example is found in the Philippines, where several parents noted that PTCA meetings are rarely devoted to problems with teachers because teachers live in the community and are friends with the parents. Parents can trust these teachers and speak to them both during and after school hours. In addition, school heads are creative in generating solutions to any tensions between parents and teachers. For example, a school head at another school in the Philippines hopes to create a ‗values formation seminar for parents‘ so that parents and teachers can agree upon a shared set of values regarding their children‘s education. Another school head, also in the Philippines, has scheduled home room meetings with PTAs on a regular basis so teachers and administrators can update parents on their children‘s progress. Home visits are one solution to ameliorate weak or problematic school-family partnerships. For example, a school head in Guyana noted that his teachers have organized school visits to homes within the community to encourage parents to become involved in school events and decision making activities and, more broadly, in their children‘s education. These home visits are also used to make parents aware of student problems in school, such as absenteeism. In the first step, parents are sent letters requesting that students be sent to school, or valid reasons given for absenteeism. Home visits are often the second step, followed by discussions at a PTA meeting to determine how to help resolve problems related to student attendance. During home visits, if possible, teachers or school staff will suggest where parents can find appropriate aid. A school head in Guyana noted that the purpose of this is ―…so that the child can come to school regardless of what is happening at home.‖ Teachers at one school in Thailand noted that home visits help teachers ―…screen their students on their attitudes, likeness, talents and individual problems in order to assist the students in their self development.‖ Parents across the countries, when referring to home visits, concurred that such visits ―…built a better understanding and relationship among the parents, students and teachers.‖ For the most part, focus group discussions with parents across the six countries did shed light on parents‘ perceptions on the value of their involvement in their children‘s education and schools. Typically, when asked if and how they are involved in school activities and decision making, parents provide lists of the ways in which they are involved with minimal reflection on the value of these activities either to the school or themselves. None of the parents interviewed in this evaluation reported actively resisting the changes brought about by school leadership. In fact, some parents stated that they were satisfied and indeed excited by the increased involvement in school activities and decision-making. For example, one parent in Nigeria notes that parents in her community are pleased with their involvement in school governance, while a mother in Guyana notes that ―…parents realize [their participation in their children‘s school] betters their children.‖ Parents are especially gratified by the increasingly reciprocal relationship with school leadership. They enjoy being viewed as resources, models and mentors to their children and are

91
especially encouraged when, as one father in the Philippines stated, ―…the school listens to the parents and takes decisions.‖ 5.3.2 How do CFS engage communities? Parents, teachers and school heads interviewed identified community involvement as a critical component to the success and sustainability of CFS. A successful CFS programme is one in which the entire educational community – children, teachers, mothers, fathers – supports students‘ achievement and success. For example, a school head in the Philippines noted that community attendance at orientation meetings, school consultations and other community activities has led to community-wide acceptance of the CFS initiative. Table 25 presents the percentage of teachers and school heads who agreed highly with select survey statements related to community involvement. Overall, school heads unanimously agreed that they regularly inform the community of school events, and on average, 82 percent of teachers indicated that adults in the community are aware of what goes on inside schools. However, there was variation in schools‘ success in developing partnerships with the community: 50-96 percent of school heads within countries said their schools have partnerships with local businesses or community organizations. Interview and focus group data with school heads suggest a high degree of collaboration with community members. In Guyana, school heads at multiple schools noted that even community members who do not have children attending the school (e.g., local business owners) are on school governing boards. Moreover, alumni and parents of students who have already graduated often participate in school events in a variety of ways, including making donations to the school, buying gifts, and making trophies for winners of sports or other competitions. In some communities, school heads also noted that because CFS can be implemented with projects targeting other outcomes (such as health and nutrition), this cross-sector work encourages schools to collaborate actively with all stakeholders – particularly parents and community members – to ensure successful implementation of these overlapping projects. Table 25 Teacher and school head perceptions regarding community participation in CFS
Statement
Nig
eria
South
Afr
ica
Phili
ppin
es
Th
aila
nd
Guyana
Nic
ara
gua
Avera
ge
Teacher Survey
Adults in the community support this school. 79 56 95 95 71 85 80
Adults in the community encourage youth to take school seriously. 85 58 94 91 72 79 80
Adults in the community know what goes on inside schools. 77 68 91 89 88 84 82
School Head Survey
This school actively informs the community about what is happening at the school at least several times a year.
100
100 100 100 100 100 100
This school provides training for community representatives on the school‘s decision-making or advisory committees.
65 60 88 88 54 92 74
This school has partnerships with local businesses or community organizations to support student learning.
57 52 96 96 50 63 69
Engaging other community members‘ support has a direct and important impact on sustainability. Indeed, one school head in Thailand noted that ―…strengthening public relations activities such as frequently meeting with stakeholders – private companies, parents, school committees, local organizations, etc….‖ is a key method for school leadership to achieve the goals of CFS. However, as another school head in Thailand noted, this engagement is a work in progress: ―…both the school and students have to be more active in terms of opening more channels for outsiders to participate in school development.‖ Interviews with parents and school heads suggest that community members are involved in CFS in multiple ways across the six countries:

92
participation in CFS orientation sessions, trainings and projects;
building school gardens;
participation in annual cleaning days where parents and community members help maintain, repair and clean school facilities and classrooms;
installation of water distribution systems;
construction of multi-purpose halls for classes and PTCA meetings; and
provision of school security and vehicular traffic control during school hours. Interview data with parents across the six countries also suggest that community members were involved in the implementation of CFS. However, their participation varied in terms of their roles and responsibilities. For instance, in Nigeria, village leaders were identified to enlist their support for CFS. Then, communities were asked to support the soft‘ components of the CFS (such as providing cleaning supplies) and to participate in training activities around CFS. Respondents in South Africa saw ‗local people‘ as the key to programme implementation and in some cases helped nurture enthusiastic community leadership. For schools with limited resources, community participation is of the utmost importance. Parents, teachers and school heads in Nicaragua, for example, repeatedly mentioned that without the support of parents and community members, their schools would have been unable to make necessary repairs, provide lunches for students, or purchase textbooks and other supplies. Parents have also contributed towards the salary of the security guard to protect school property from vandalism and theft. Focus group discussions in the Philippines suggested that community support was equally essential there. In one school, the ―…kindergarten class is supported by a private individual who provides the monthly salary of the teacher and will also support the construction of one classroom/library worth one million Filipino pesos.‖ Teachers in the Philippines regularly reported that ―…continuous generation of support from the [local government unit] helped fund needs of the children.‖ Local congressmen often contributed to schools in the form of financial donations, school supplies and food for the canteen and feeding programme. Some teachers noted that the governor provided toothbrushes and toothpaste to grade 1 pupils and sponsored a free noon meal for students. In Nicaragua, schools have also partnered with community organizations, most often to improve the physical infrastructure and capacities of the school environment. For example, in one school, the sixth grade class wanted to build a dais. The school only had a small portion of the funds necessary, but with the financial support of community groups and the labour provided by many parents, the school was able to complete construction. In Nigeria, some teachers noted that a library was built by the community and that repair of the classrooms had been initiated and completed by the PTA. Moreover, the UNICEF women‘s club, comprised of local mothers and female community leaders, has regularly contributed money to enrich the PTA‘s work. A kindergarten class in Nigeria is also supported by the local mothers‘ club, which provides meals for the students. In Guyana, a school head noted that the regional democratic council helped to clear the school‘s drains after heavy rains and has since helped to keep the school environment clean. Parents and other community members have also helped to paint the school‘s furniture and floor for events like prize-giving activities. Students even brought plants to enhance the school‘s façade. Further, at several schools in the Philippines, the teachers described how the head of the school conducted a series of meetings with the PTCA and the Baranguy Council for the Protection of Children to discuss possible improvements in classroom pedagogy and facilities/architecture. The school head also discussed these issues with other public and private organizations. These schools have developed a history of strong cooperation with the community and city government, working with the Baranguy and city councils on school concerns that are relevant to these organizations‘ mandates. As one group of teachers explained:

93
The Baranguy Council is co-opted to help with the registration of some of the students who do not have birth certificates or other necessary documentation to enrol. The Baranguy Council also provides security personnel to assist in keeping order and safety in the school premises during school days – for example, helping children cross the street, traffic management, facilitating entry and exit through proper school passageways, securing the school perimeter during weekends, etc. —Teacher, 12, Philippines.
Finally, in one community in the Philippines, teachers described a ‗foster parenting programme‘, wherein wealthier families shoulder some of the expenses of poorer students (e.g., school supplies, fees). In South Africa, a similar programme exists; teachers stated that ―…some of the rich parents give us financial help that the other schools don‘t get.‖
5.4 Student, parents and community participation 5.4.1 Challenges to increasing child participation Interview data with school heads did not point to consistent challenges to increasing student involvement and leadership across or within the six countries. One school head in Thailand noted that while students are ―…welcome to express their feelings, opinions, and suggestions, sometimes students are still confused with their roles and responsibilities.‖ However, children‘s ‗role confusion‘ was not reiterated in interviews with teachers, parents and community members participating in this evaluation. In South Africa, some teachers mentioned that student participation in school events has actually decreased compared to previous years. A primary reason for this may be increased instability in the local community. Teachers described an ―increase in problems‖ and said that it ―…is not easy for learners to be here…‖ due to high levels of criminal activity and safety concerns. In addition, harsh discipline and the absence of intentional SEL instruction (discussed in Chapter 4) may limit the development of students‘ leadership and participatory skills, affecting their ability to assert themselves in a culturally appropriate manner and to appropriately handle interactions with adults and other students. 5.4.2 Challenges to increasing parent participation Although most school heads agree that parental participation is a core principle of CFS and necessary for effecting sustainable change within the school and the community at large, some school heads report that it is difficult to engage parents. For example, a school head in Guyana reported that:
Parents cannot be persuaded to involve themselves in school efforts, possibly due to poverty within the community. Some parents are also teens or may have died, leaving their children in the care of older guardians. Schools try to provide parents with opportunities to improve their education, but the response is poor. —School head 5, Guyana.
Multiple barriers exist to parental involvement in their children‘s schools. First, parents cannot always participate in their children‘s education in the way school staff hope. For example:
In Guyana, some teachers mentioned that ―…the timing of an activity often conflicts with parents‘ work schedules; therefore parent participation is usually low.‖
In Thailand, some teachers and school heads reported that parents are asked to check their children‘s homework to ensure the assignments are completed on time. But many parents work all day on rubber plantations and cannot check their children‘s assignments.
In the Philippines, one school head mentioned that many parents are day labourers and very poor so they cannot provide food or other material resources for the school‘s feeding programme. The parents do however sometimes provide their time; for example, parents help maintain and harvest plants from the vegetable garden.
School officials need to be flexible to meet the needs of parents and to schedule school activities around parental schedules. Such flexibility should facilitate stronger teacher-family relationships, enhance trust, and foster respect between the two groups. For example, schools may want to encourage informal meetings with parents before or after school hours. Schools also need to be creative and think of different

94
ways in which parents and families can participate, as well as consider the topics parents may be most interested in (such as regular meetings on pupil progress and enrolment in school feeding programmes). A second barrier to parent involvement, suggested by interviews with school heads in Nigeria, the Philippines and Guyana, is that parents need ―…constant sensitization to the basic principles of child-friendly school initiatives.‖ Some parents in Nigeria concurred that some of their peers lacked an appreciation for their children‘s education – some parents cared but others did not. A third barrier is illiteracy and the cultural disconnect between schools and families. This was raised in teacher and school head interviews in almost all countries as a challenge to participation. Some parents in the Philippines, especially those with low levels of education, feel that they are looked down upon by school teachers and some parents in South Africa noted that the cooperation of the school governing board is limited by its members‘ education levels and the feeling that ―…they cannot challenge the principal.‖ Interviews with school heads and teachers suggest that both groups know that they must treat parents as partners in effective learning and that teachers in particular must create an open and continuous dialogue with parents. However, it is not clear that all schools are employing family-driven approaches to engage families and bridge the cultural disconnect between schools and families. As discussed earlier, limited parental participation can serve as a barrier to implementing CFS goals. Several school heads noted that they are able to involve parents and increase their awareness of educational programmes and activities through a participatory consent process. For example, one school head in Guyana mentioned that the school needs parental consent for children to participate in programmes such as a remedial reading programme. This helps increase parents‘ appreciation for such programmes and for their children‘s education in general. A school in the Philippines reported conducting alternative learning systems for parents and out-of-school youth to improve literacy for both groups. This school also sought assistance from Baranguy officials in encouraging parents to send children to school. Similarly, some teachers in Nicaragua suggested that to truly create a child-friendly environment, the school should provide parents with math and Spanish classes so that they can help their children at home. School heads facing lower levels of parental involvement reiterated the importance of capacity-building activities for parents who are illiterate and/or unemployed. At one school in South Africa, for example, students and parents performed shows to raise money and received donations from community organizations and other donors. Indeed, some teachers and students have even written proposals to wealthy individuals asking for maintenance funds. (There is no information on whether these proposals were funded.) Another way to foster parental involvement and strengthen family-school partnerships is through resource sharing and/or transparency among stakeholders. Transparency was identified as a key factor to retaining the support of parents and the public, especially with regard to fundraising activities. For example, one school head in Guyana reported that the school publishes a financial report that it posts on a bulletin board and presents at school assemblies so students and parents are aware of the school‘s financial constraints and budget. This school head succinctly summarized the benefits: ―…once you get transparent you do get a lot of support.‖ Finally, teachers and school heads need to be impartial and approachable, as well as open to collaborating with parents. The benefits of such an approach were described by school heads in the Philippines and South Africa; as one school head in the Philippines noted, ―…there was no [stakeholder] resistance that [school officials] were not able to manage through dialogues and open communication.‖ 5.4.3 Challenges to increasing community participation Although there is a general acceptance of the principles of CFS models, there is some scepticism about the impact of the model on students. A school head in the Philippines noted that schools must be able to motivate community members and governments at the municipal and Baranguy levels to participate in CFS, but that these groups‘ willingness to participate and allocate resources towards school activities depends on whether they see results. In Thailand, a school head echoed a similar sentiment, reporting
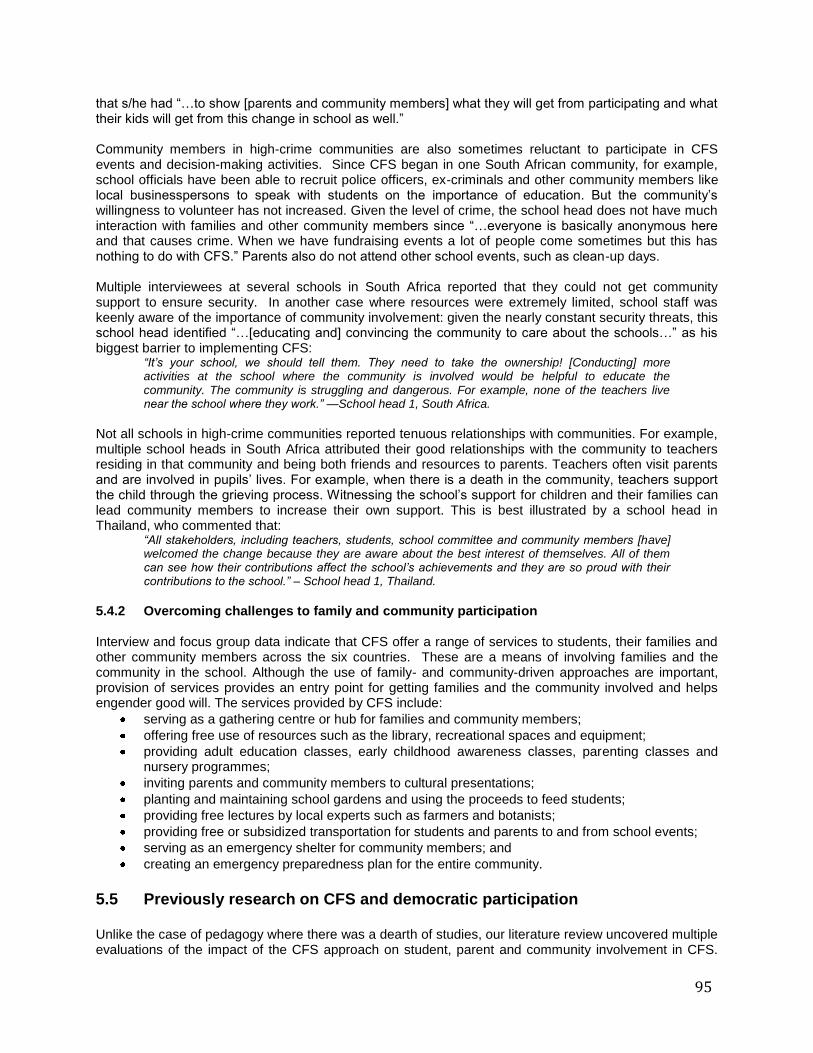
95
that s/he had ―…to show [parents and community members] what they will get from participating and what their kids will get from this change in school as well.‖ Community members in high-crime communities are also sometimes reluctant to participate in CFS events and decision-making activities. Since CFS began in one South African community, for example, school officials have been able to recruit police officers, ex-criminals and other community members like local businesspersons to speak with students on the importance of education. But the community‘s willingness to volunteer has not increased. Given the level of crime, the school head does not have much interaction with families and other community members since ―…everyone is basically anonymous here and that causes crime. When we have fundraising events a lot of people come sometimes but this has nothing to do with CFS.‖ Parents also do not attend other school events, such as clean-up days. Multiple interviewees at several schools in South Africa reported that they could not get community support to ensure security. In another case where resources were extremely limited, school staff was keenly aware of the importance of community involvement: given the nearly constant security threats, this school head identified ―…[educating and] convincing the community to care about the schools…‖ as his biggest barrier to implementing CFS:
―It‘s your school, we should tell them. They need to take the ownership! [Conducting] more activities at the school where the community is involved would be helpful to educate the community. The community is struggling and dangerous. For example, none of the teachers live near the school where they work.‖ —School head 1, South Africa.
Not all schools in high-crime communities reported tenuous relationships with communities. For example, multiple school heads in South Africa attributed their good relationships with the community to teachers residing in that community and being both friends and resources to parents. Teachers often visit parents and are involved in pupils‘ lives. For example, when there is a death in the community, teachers support the child through the grieving process. Witnessing the school‘s support for children and their families can lead community members to increase their own support. This is best illustrated by a school head in Thailand, who commented that:
―All stakeholders, including teachers, students, school committee and community members [have] welcomed the change because they are aware about the best interest of themselves. All of them can see how their contributions affect the school‘s achievements and they are so proud with their contributions to the school.‖ – School head 1, Thailand.
5.4.2 Overcoming challenges to family and community participation Interview and focus group data indicate that CFS offer a range of services to students, their families and other community members across the six countries. These are a means of involving families and the community in the school. Although the use of family- and community-driven approaches are important, provision of services provides an entry point for getting families and the community involved and helps engender good will. The services provided by CFS include:
serving as a gathering centre or hub for families and community members;
offering free use of resources such as the library, recreational spaces and equipment;
providing adult education classes, early childhood awareness classes, parenting classes and nursery programmes;
inviting parents and community members to cultural presentations;
planting and maintaining school gardens and using the proceeds to feed students;
providing free lectures by local experts such as farmers and botanists;
providing free or subsidized transportation for students and parents to and from school events;
serving as an emergency shelter for community members; and
creating an emergency preparedness plan for the entire community.
5.5 Previously research on CFS and democratic participation Unlike the case of pedagogy where there was a dearth of studies, our literature review uncovered multiple evaluations of the impact of the CFS approach on student, parent and community involvement in CFS.

96
Many of these evaluations, conducted in countries such as Bosnia and Herzegovina, Cambodia, China, Macedonia, Nigeria, Pakistan, the Philippines, South Africa and Vanuatu, point to the increased involvement of students in their education, such as the formation of health and other special interest clubs and student councils (e.g., Malteser International, 2007; O‘Sullivan, 2007; Proactive Information Services, 2005; Proman, 2006; UNICEF Cambodia, 2005; UNICEF-Government of China, 2005, 2007; UNICEF Macedonia, 2007; UNICEF South Africa, 2006; UNICEF Vanuatu, 2006). These evaluations also highlight the powerful influence of family and community involvement on the degree to which schools are able to implement the CFS approach. When schools and families extend their partnership to include stakeholders, such as parents and community members, the benefits to students are great (Lindert, 2004; UNICEF, 2007b; Woessman, 2000). For example, with increased parent involvement, students often report feeling excited to see their parents visit their schools and feel more comfortable sharing positive and negative experiences they may have at school (e.g., Proactive Information Services, 2005). The CFS approach rigorously promotes school, parent and community partnerships in order to support the learning and growth of children. Respondents view strong democratic participation, particularly by parents and teachers, as the main aspect of CFS that positively differentiates them from other schools. One respondent writes: ―…as long as parents are used to tak[ing] ownership and are committed in the running/maintenance of the schools [then] schools are really child friendly and create [a] protective environment.‖ Another writes: ―Teachers see opportunity for participation in the decision-making related to the school life. They are seen as equal partner[s] in the school community.‖ A respondent in Nigeria writes: ―From my experience in Nigeria, the more a child friendly school is community-based, the easier it is for its immediate community members (i.e., parents of pupils) to take attractive and more regular part in the day to day activities and action which promote, support and sustain elements of Child Friendly Schooling. If we take the Community School, Ndufu Igbudu as an example, we will find that the success of this school as one of our pilot child friendly schools in Ebonyi state is mainly dependent on the unending support from members of the community where this school is located. The success recorded here has impacted on the enthusiasm being demonstrated by adjacent communities where we have found that the people are also trying in their own little way to show interest in making their community schools child friendly, the way the people of Ndufu Igbudu are striving to keep the CFS flag of its community school flying.‖ Respondents indicate that UNICEF has provided tangible support to promoting democratic participation and community enthusiasm for school support. UNICEF has supported training at the local level of school heads, local inspectors, teachers and school management committees; supported the establishment of PTAs or School-Based Management Committees, promoting the establishment of student governments; promoted school self-assessments and the involvement of school staff, school support committee members and students in the development of school improvement plans; and supported the development of national standards. One respondent described a ‗community dialogue process‘ that UNICEF supports: ―This involves focus group discussion with various groups, including parents, girls, boys, teachers, community members etc. Each group analyses the existing situation in the school and identifies strategies to improve the school. CFS and human rights principles are fed into the discussions to influence the various groups on areas like inclusion and gender, although many groups already prioritize such issues. This is followed by dialogues between the groups and arrival at a consensus on what should go into the whole school development plan. This has been a very useful process and we have linked it to ward and district level development planning as per government guidelines for decentralization by devolution. Ministry officials also participate in and help facilitate the process.‖ Extant evaluations on the role of students, parents and community members consistently report that students are more active participants in classroom activities and in their overall education, and that parent and community awareness on the importance of education for children has risen as a result of CFS implementation. For example, results of a 2005 evaluation of the CFS project in Bosnia and Herzegovina

97
(Proactive Information Services, 2005) suggest that students increasingly demonstrate the ability to ask questions of each other, help define classroom rules and suggest class activities to their teachers. Improved communication, increased independence and confidence, and respect for teamwork and collaboration are other positive child outcomes noted in this evaluation. Over 58,000 parents have been included in the project due to their children‘s enrolment in CFS. Parent participation takes many forms, such as purchasing materials for classes, meeting with teachers to discuss their child‘s performance, assisting teachers in the classroom and attending parent council meetings. Further, parents remark that compared to the traditional system (i.e., non-CFS), the atmosphere in their children‘s schools is more open, respectful and cooperative. Principals are also careful to note the increased participation of Roma parents in particular, a traditionally marginalized group in this region. In these schools, Roma parents often assist in organizing student performances. Further, involvement in CFS activities leads parents to recognize that their children are the key to creating a more open and inclusive society (p. ii). Interviews with teachers at CFS reveal that many teachers feel parents are equal and active partners in educating children. As one teacher notes, parents are ―…the first teachers of their children. Everything starts with the family … if cooperation with them is not well developed, there is little teachers can do.‖ (Proactive Information Services, 2005, p. 29). Stakeholder capacities and commitment are also key to ongoing development and sustainability of the CFS approach. Some studies have suggested (e.g., De & Dreze, 1999) that low-cost methods of garnering parent and community member involvement, such as town meetings and one-on-one canvassing, are effective in promoting community oversight of teacher attendance and performance, student attendance and school safety. In an evaluation conducted by UNICEF Vanuatu (2006), the authors found that the CFS project is successful in part due to the ―…major capacity building orientation, with resulting commitment, enthusiasm, pride and a cooperative approach to CFS development at the local level.‖ (p. v). Interviews with teachers and community members indicate a range of positive outcomes linked with sustainability, including an enhanced sense of local ownership of schools, an understanding of what constitutes a good school, an understanding of child rights, enthusiasm and commitment to transform all schools into child-friendly ones, as well as an appreciation of the importance of the school-community relationship. Such commitment serves to create a wider governance structure and circle of support beyond school leadership. Community members interviewed in this study, and others cited above, recognize that they are responsible for creating a child-friendly environment for students to foster learning outcomes and provide them with a sense of emotional security and physical safety.
5.6 Lessons on democratic participation from the Delphi survey UNICEF Education Officers responding to the Delphi survey reported that community ownership of the school hinges on the strength and vision of the school head. One respondent wrote: ―School and community ownership depends largely on the status and leadership of the respective school head and is highly related to the importance a community gives to the education of their children.‖ Another echoed this by saying ―…it is true that the extent of ownership depended to a large degree on whether the head of school and senior management had strong buy-in for CFS approach. This is true in nearly all schools where CFS is seen to be working effectively – there is strong management support and in turn support from the community and parents.‖ More broadly, respondents overwhelmingly recognized the importance of the school head for the success of CFS. Respondents described the school head as ―the pivot‖ and said ―…a strong school head is critical.‖ At the same time, respondents also acknowledged that other players are also important to the success of CFS and a strong management committee and committed teachers can in some cases make up for a weak school head. One respondent also pointed out the need to ―…ensure that you train other staff who can move into the position if the head or teachers are moved. The cluster training of teachers and heads is also an important strategy, ensuring that capacity remains at the local level, which can still be tapped by schools in the cluster. The school should also be managed by a school committee and the

98
training of that committee and its chair is also very important and helps reduce the potential shock caused by redeployment or retirement.‖ Although democratic participation is viewed as critically important and UNICEF has contributed in significant and tangible ways to promoting the principle, there is also a sense that parents and community members are not participating to the degree that they could be: only 25 percent of respondents said that ‗Parents and community members take responsibility for implementing the principles of Child Friendly Schools‘ and only 29 percent said that ‗Parents are involved in decision-making about school level policies and procedures‘. One respondent said that ―…participation of parents and communities often is targeted at reconstructing and cleaning schools rather than promoting their participation in real management issues such as effective school improvement planning and school budgeting.‖ This view was corroborated by our own observations We also observed this during our site visits. One respondent attributed uneven ownership to realities that are largely outside the control of the school or UNICEF, including a national education policy that does not sufficiently promote CFS; poor motivation of technical school heads; frequent turnover of technical school heads, inspectors and teachers; a high percentage of unqualified teachers; and unequal distribution of resources.

99
CHAPTER 6 – PROFILES OF CFS
In the previous chapters the evaluation describes how well CFS apply the key principles of CFS models – child-centredness, democratic participation and inclusiveness – as they move towards quality education. Conclusions were reached from visits to 150 schools across the six countries, and through a systematic review of previous research on CFS around the world, and from a survey of UNICEF Education Officers globally. The evaluation also presented an analysis based on data from the school visits that shows which elements of CFS are the strongest predictors of important student outcomes. But what does an authentic CFS look and feel like? How does one know when in a CFS? Beyond health services, policies that promote equal treatment of all children, active PTAs, active learning techniques, and other elements that reflect the key principles of CFS models, CFS stand out in terms of school ethos, traditions and the feeling that one has in the presence of committed adults and actively engaged and supported children. In this chapter, we present ideal types of CFS, which are realizing CFS principles. The objective of this chapter is to convey the gestalt of a successful CFS as experienced by our site visitors. We asked site visitors to describe one or more schools that stood out in terms of successfully applying the principles of CFS models and realizing the fruits of those efforts. In some cases the profile describes a specific school, although the name of the school has been omitted to maintain the confidentiality promised to schools. In some cases the profile is a composite one, based on two or three outstanding CFS in the country.
6.1 A child friendly school in Nigeria As we approached the primary school in a remote village in Ebonyi State, a region long neglected by the central government due to tribal issues, we saw the low, concrete school buildings surrounded by well-maintained hedges and clean grounds, an orchard and a large school garden. The campus is physically welcoming and we were greeted by an enthusiastic school principal who welcomed us heartily to the school. The school buildings and classrooms are clean and structurally sound, although by no means bright and cheerful. The classrooms have dirt floors and lack electricity. Many of the classrooms seem dark and austere. Although there is no student work on the walls, labelled drawings of farming tools and household objects adorn the walls above students‘ desks. Despite the physical appearance of the school buildings and classrooms, we feel an energy in the school that reflects the commitment of the school head and the active participation and support of the community. The Mothers‘ Club teaches children sewing, cooking and broom making. In the sewing room, garments that children are making hang next to a sewing machine, ready to be completed. Teachers have regular staff meetings to discuss best practices and understand new techniques learned by a teacher who attended a recent workshop outside the school. The latrines are clean and well-maintained and children use them. Children wear their clean bright blue uniforms with pride. They are happy and cheerful. Although all schools received the same inputs from UNICEF several years earlier (UNICEF provided each of the CFS intervention schools with desks, books, sewing machines, boreholes and latrines) not all schools used those inputs to the same effect. This school, with the support of families and the community, spun them into gold. For example, the Mothers‘ Club donated some fabric and taught students how to use the sewing machines supplied by UNICEF. Students made school uniforms and other items of clothing, which were then sold at the market and the profits were used to purchase fruit trees for the school orchard. These in turn provided food for the early childhood class. This was a sustainable enterprise that not only generated further material resources for the school and improved nutrition, but also taught students valuable skills such as sewing, horticulture and how to run a small business.

100
6.2 A child friendly school in South Africa Veering off the main tarmac highway, bouncing for 15 minutes on the pitted dirt road through rolling hills dotted with grazing cattle and ostrich, one can finally distinguish the green corrugated metal roofs of the primary school in the valley below. There are at least a dozen roofs, surprising given the rural, largely unpopulated landscape of the surrounding valley and hills. Empty concrete market stalls usher the entrance of the school, echoing with the ghosts of a more prosperous past. However, upon entering the chain linked fence, laced with barbed wire, one is warmly welcomed by an oversized, colourfully painted, albeit crude, map of South Africa laid out in concrete and rocks. This map, creatively using local resources and centring the student at his/her place in the world, seems to be a sign that this campus may be an oasis. Despite a physical plant that is approximately a half a century old, the pride in the school and its grounds is apparent. The grounds are well swept, the grass courtyard well groomed and the exterior of the buildings well painted. Even the pit toilets are clean; a feat achieved for the first time using student leadership recently deployed to oversee them. This is not to say it is a school with ample resources. Although sufficient, a few school blocks need structural repairs. There are no teacher‘s houses and only eight toilets against 963 learners. The library has only curricular books lining one wall and classroom books are shared by more than one learner. Many of the desks and chairs are broken, but students are part of the repair team, learning valuable life skills while supporting their own education. Modern equipment like computers, projectors and other A/V equipment are desperately wanted by teachers and the school principal to bring their learners into the ‗modern era‘ and provide the best quality education. But despite this, the school is the envy of the surrounding schools, even the private school, for its academic achievement. The smell of maize porridge and beans draws one to the back of the school. Under a temporary structure, two female volunteers stir an enormous vat over an open fire, preparing for the lower primary children‘s morning break. The school has a feeding programme run by the local community and sponsored by the Department of Education. The programme has proved a powerful lure for students, re-enrolling them and keeping them in school every day, as apparent from the nearly 100 percent daily attendance rate. Each garden bed is filled with young to older seedlings of mustard seed, kale and other greens; the garden provides life skills training for the upper classes and food for the neediest child. Additional volunteers water and weed these beds. When asked, community members say they feel engaged in the school management, not just through these efforts, but through meetings and discussions with teachers. Parents understand the importance of supporting their children‘s education and assisting with homework. If only all children had parents; many in this area live with their grandparents or other relations as work is scarce and parents are in ‗―the big city‘ trying to earn wages for their families. Students too feel part of the education process. Beyond just promoting a more hygienic environment, school leaders are being used to promote a culture free of bullying and violence at the school, a problem rife in many of South Africa‘s targeted CFS. Teachers are creating open forums with learners about bullying and the importance of getting along. In the classroom, they promote working together in pairs and groups to build partnerships and communities and use role playing, sporting and cultural events to raise awareness and provide alternative means of relating with others. Watching learners during break and playtime, it seems these efforts are paying off. Children interact freely, chatting, kicking a football, or otherwise enjoying life at the school campus. This is not to say that all is perfect. Corporal punishment was recently banned by the government and teachers are still struggling to find effective means of discipline. Withholding playtime seems to be working best as everyone wants to play. In the classroom, learning is happening. Teachers and pupils are engaged through participatory methods and open inquiry that is respectful. The chalkboards are well used and classroom seating is adjusted according to the day‘s lesson. Academic trophies are proudly displayed in the principal‘s office and are evidence of just how successful the child-centred approaches have been. However, resources are somewhat scarce. Walls could be better utilized, particularly by employing locally made materials and pupils‘ work, although a few teachers are trying. Too many learning resources are locked in classroom cabinets for fear of vandals or theft, but fear has been the biggest thief as these important learning aids

101
remain hidden from students. As the school principal eagerly described, ―…the learner is a future human being. Our role is to help them enter adulthood.‖ This school is one of the best examples we saw of a school trying to apply the principles of CFS. Although the interventions of CFS are still new, with UNICEF‘s support, the foundation is set for the students of this school to be a ‗well of hope‘ for not only their families, but for the poor of South Africa.
6.3 A child friendly school in Thailand The day was almost unbearably hot with a cloudless sky and no promise of rain. The school we visited was remarkable because it was a boarding school for orphans, including those children who had lost parents in the tsunami. It was also memorable because of its well-maintained play equipment for primary school students, colourful paintings on water silos, open-air structures for student meetings in the centre of campus, and the presence of both student and teacher dormitories. The campus was also quite large – well-manicured lawns, palm trees and colourful flowering bushes, and wide grass fields for sports, all-school meetings and performances. There was a newly constructed basketball court adjacent to a newly constructed classroom building for secondary students that had not yet been used. Wide cement sidewalks provide students, teachers and visitors with a clear and safe path between school buildings and dormitories. The school head insists his primary obligation is to make this school a home for these students, considered among the most disadvantaged in Thailand. Evidence of that is demonstrated at every turn, from the beautiful and expansive landscape and well-maintained architectural elements of the campus, to the insides of classrooms and dormitories themselves. Classroom walls have been painted in vivid colours, depicting flowers, sunshine and other cheery scenes. Teachers live on campus either as resident advisors in student dormitories or with their colleagues in dormitories designated for teachers. Students and teachers we met with agreed that this helped create the familial atmosphere the school head was striving towards. And while both groups are required to tidy their bunks and living spaces before beginning the school day (we visited in the late morning/afternoon), the dorms have a comfortable, ‗lived in‘ atmosphere with paintings adorning the walls, games left on the floor, and clothes peeking out from underneath some of the beds. The classrooms are bright and airy, each equipped with fans. Windows are also kept open. Two air-conditioned computer labs have been constructed for students – a smaller one for primary students with individual ‗Little Tykes‘ learning stations and a larger one for secondary students (in a class we observed, there was a 1:1 student to computer ratio). In a mathematics class we see evidence of innovative and participatory learning. Students sit in pairs before computers, working to apply the day‘s lesson (summarized on the blackboard) to a practical writing assignment. The teacher circulates among the students, answering questions and encouraging the students not to be afraid to ask questions and expand upon their ideas. Conversation among the students is encouraged.
6.4 A child friendly school in the Philippines It is the height of monsoon season in the Philippines, and the air is pregnant with the promise of a heavy afternoon shower. The school sits at the end of a gravel path, a short distance from the town centre where young children and adults often gather for receptions with the mayor, town hall meetings and community fairs. The main road leading to the school is paved and dotted with small businesses – a grocery store, a beauty parlour and a video game arcade, which parents fear serve as a distraction to students attending this school. It is the middle of a weekday but these businesses are empty for the most part, their employees perched by their storefronts as we drive past. At the foot of the school‘s driveway is a newly constructed gate with a cement shelter painted a refreshing yellow, similar to those at bus stops. We learn later that the student council initiated plans for this structure and raised the funds necessary for its construction. Students said they wanted a protective shelter for parents and other adults who wait at the end of the driveway every afternoon to walk their children home. Exposed to the elements, parents often waited in the heavy monsoon rains or the
102
powerful afternoon sun. The shelter also provides some respite for us as we introduce ourselves to the volunteer security men guarding the property. The school campus is immediately striking – vividly colourful murals depicting child-friendly slogans and concepts (e.g., ‗Mathematics for life!‘) adorn almost every school building. These murals have been painted by school children, their parents and local artists in the community. The school‘s landscape is lush and green, with gently sloping hills. At the centre of the circle of school buildings are two small ponds linked by a wooden bridge. It is quite obvious the care and energy required to cultivate and maintain the school grounds. The school head excitedly remarks that such grounds-keeping is evidence of the devotion of children, parents and teachers to this school. The school head also points out a large medicinal and vegetable garden, tended to by students, parents and teachers, and the pride of the community. The vegetables are cooked and prepared for students‘ lunches. As we are guided by the school head on a tour of the campus and classrooms, evidence of student learning and enthusiasm for learning abounds. Inside classrooms, students listen attentively, in spite of the heat, as their teachers recite the day‘s lessons. Samples of students‘ work – paintings, poems, arts and crafts projects – hang on most walls, interspersed with educational posters.
6.5 A child friendly school in Guyana Arriving at the school one was immediately struck by the dilapidated building, since the exterior was in great need of repair. Initial impressions were quickly put aside after the warm greeting we received by representatives of student government, who were waiting for us at the gate. They shook our hands and welcomed us with handmade corsages filled with bows and plastic flowers. We quickly felt at ease as they escorted us to the Head Teacher. Upon our arrival, the school gathered for an assembly where a few students performed a short skit. The children laughed and enjoyed the theatrics. Walking inside the school building, we were struck by its beauty, which was in stark contrast to the exterior. Plants and flowers potted in tin cans adorn classrooms. Desks and tables are painted bright colours. Student work and posters adorn the walls. In addition, teachers have set up learning corners for reading, shop, science, math and health with activities and homemade manipulatives that students can work with in small groups. For example, the math corner has cardboard geometric objects and buttons for counting, among other things. All of these elements contribute to a visually appealing learning environment. The hum of productive chatter is heard in many classrooms as the students work together. For example, in a fifth and sixth grade classroom, we observed a science lesson in which students worked on an experiment in small groups and then representatives of the group reported the findings to the whole classroom. The teacher walked around the room monitoring the students‘ work and facilitating learning by asking questions. Several classes include students with disabilities such as physical, learning, or cognitive. These students appear to be accepted by their peers and teachers. For example, students assisted a child with physical disabilities by carrying her around the school, since the building is not accessible to the physically disabled. Teachers attempt to address the needs of the children, but it appears that they need more training in order to make appropriate instructional adaptations for the children. Outside the head teacher‘s office hangs a bulletin board with the student government materials and records. The school has several student committees: assembly, environment and celebrations. For students not participating in student government, there is a suggestion box that acts as a vehicle for their comments or voice to be heard. Parent and community participation is evident in the school. Parents were present in the building. Community members donated computers for a lab in the school. However, we observed no students using the lab during our visit. The parent governance committee has a large role in determining how the school‘s budget is spent each year.

103
6.6 A child friendly school in Nicaragua The evaluators approached the school by walking up a steep set of stairs at the top of a hill. We heard gushing water from the two rivers that flank the hill. We recognized at once that this was difficult terrain for anyone but particularly for people with physical disabilities. But the school itself is a sanctuary. The campus comprises multiple school buildings that are all in very good condition. The landscaping and condition of the grounds are immaculate. The school has a physically welcoming environment. We observed teachers using active learning techniques. For example, one teacher was teaching students vocabulary by putting cards with words in envelopes and then in a satchel and having one child pretend he/she was a mail carrier. The mail carrier delivered an envelope to a child in the class, who was asked to define the word and then use it in a sentence. The children were active participants in the ‗game‘ and seemed to be enjoying it greatly. In a nearby first grade classroom, children were learning new words through song. The school has a large area where we observed children happily playing. It also has a ‗stage‘ where the school holds events such as school assemblies, skits and awards ceremonies. The latrines are in good condition and the school has running water. There is also a feeding programme and mothers work in the kitchen to prepare food. This school stands out largely because of the high levels of child and family participation and the strong link between the school and community. Students are very involved in student government and school decision-making. The students often organize themselves and go out in the community to ask local businesses for donations. For example, students asked the local department of natural resources for trees and other plants to plant on school grounds and asked the hardware store for paint so they could paint the buildings. They also asked local stores to donate food and other sundries for their mother‘s day celebration. The community responded. We also observed mothers at the school, serving lunch and simply being present, an indication of the commitment that families have to the school.

104
CHAPTER 7 – INVESTMENT IN CFS As part of our evaluation we examined the financial costs of implementing CFS. This examination addressed:
the amount and allocation of funds on CFS globally and in six countries;
the relationship between spending and school size;
how spending changes over the lifetime of a given CFS; and
the relationship between UNICEF and government investments in CFS and local spending and support for CFS.
We drew on several data sources to address these issues:
43
literature on the CFS framework and education expenditures;
UNICEF‘s 2006 and 2007 budgets;
UNICEF budgets for the six countries visited; and
information on resources and spending gathered from school heads in the six countries visited. Summary of key findings from our global analysis of UNICEF’s chart of accounts
Funding for CFS increased substantially from 2006 to 2007 overall and in EAPR and the Eastern and Southern Africa Region (ESAR), and decreased in the Region of South Asia (ROSA).
Emergency resources constitute a significant portion of funding for CFS – 36 percent globally and more than 50 percent in UNICEF‘s EAPR and ROSA.
EAPR spends more than any other region on CFS.
Two-thirds (67 percent) of CFS funds is spent on supplies, equipment and construction. Summary of key findings from our analysis of school-level data from the six countries
Expenditures on CFS vary by country and variance relates closely to overall income inequality. Where overall income variation is high, variation in per pupil expenditure is also high, except in South Africa where there is high variability in teacher wages.
There were economies of scale. Our analysis of school-level data from the six countries found that total expenditure per pupil decreases as school size increases. However, UNICEF‘s investment does not reflect this pattern – as school size increases UNICEF‘s proportional investment also increases.
Variance in UNICEF‘s expenditures on CFS increased the longer schools received support.
7.1 Global spending on CFS In 2006, UNICEF introduced a global chart of accounts for CFS, thereby making it possible to investigate aggregate spending on the programme. Prior to 2006, the lack of uniformity/standardization in budget creation prevented accurate cross-national comparisons. In this section we present our analysis of UNICEF‘s expenditures on CFS using the chart of accounts. We present information about how much money is spent on CFS in each UNICEF region and the source of that funding within the UNICEF budget. We also discuss what the funds have been spent on. Figure 21 shows average regional expenses on CFS by region for the years 2006 and 2007 combined. In 2006, investment in CFS overall was US$53,427, which increased substantially in 2007 to US$85,610,571. Funding increased five-fold in EAPR and two-fold in ESAR from 2006 to 2007 and decreased by more than half in ROSA. As the figure below shows, although all regions reported some expenses related to CFS activities, the level of spending across regions varied considerably.
43
Appendix C provides a full description of the sources and methods used in the cost analysis.

105
Figure 21 CFS 2006-2007 average regional expenditures44
*Units are 2007 US dollars.
EAPR represented 36 percent of all of UNICEF‘s expenses on CFS in 2006 and 2007. EAPR‘s financial commitment to CFS may reflect the number of countries in the region that see CFS as a central part of UNICEF‘s education strategy. However, as Figure 22 shows, over 60 percent of EAPR and ROSA funds were special earmarked emergency funds to support reconstruction after the 2005 tsunami. It is possible, therefore, that with the ending of funds earmarked for post-tsunami reconstruction efforts, CFS spending in EAPR and ROSA will be comparable to other regions. The source of funds has ramifications for sustainability and programme design. For example, emergency funds allow for extremely rapid scale up as their presence may dramatically and suddenly increase a given UNICEF country budget. However, emergency funds continue for a short time period, and this can lead to challenges in the continuity of programming. Outside of EAPR and ROSA, emergency funds averaged 11.1 percent of total CFS funds in 2006 and 2007, ranging from 3.1 percent in Central and Eastern Europe and the Commonwealth of Independent States, to 19.5 percent in the Middle East and Northern Africa.
44
CEECIS= Central and Eastern Europe and the Commonwealth of Independent States; EAPR= East Asia and the Pacific Region; ESAR=East and Southern Africa Region; MENA=Middle East and Northern Africa; ROSA=Regional Office for South Asia; TACR= The Americas and Caribbean Region; WCAR=West and Central Africa Region

106
Figure 22 CFS combined 2006-2007 sources of funding
Figure 23 presents the distribution of funds across broad categories of activities and resources that support CFS programming.
45 Approximately two-thirds (67 percent) of all UNICEF expenditures support
school supplies, equipment and construction. Training and monitoring also represent substantial portions of the total expenditure. Monitoring activities include development and implementation of school databases, a part of the CFS strategy in some countries to aid reaching inclusiveness goals. Omitting the tsunami-affected countries results in a substantial reduction in funds spent on supplies, equipment and construction. However, the distribution of funds across activities and resources is largely consistent across all but one region. The Americas and Caribbean Region is the exception, with only 13 percent of funds spent on supplies, equipment and construction. The majority of funds in this region during 2006-2007 were spent on training, suggesting a substantially different investment model than in other regions.
45
For this analysis we grouped line items from the chart of accounts into these five broad categories, as documented in appendix C.

107
Figure 23 Distribution of UNICEF CFS expenditures by activity and resource categories, 2006-
2007
7.2 Comparisons of CFS spending in six countries
To further explore global investment trends, we conducted an in-depth examination of CFS investment strategies and patterns in the six countries visited. Collectively, these countries provide a view of CFS spending and related cost issues in four of the five regions where CFS spending is US$5 million or greater. (ROSA is the one region with more than US$5 million that we did not visit for the evaluation.) The school-level cost model is described in appendix C. In brief, we developed a school-level costing model, and populated that model with data gathered from school heads and administrative staff. Information was also obtained from UNICEF national budgets, the 2007 Global Monitoring Report (UNESCO, 2007), and from Ministries of Education. Although they have limitations, these sources allowed us to model all financial resources supporting a given school. This section presents the results of our model to determine per pupil expenditures in the schools visited in the six countries. We compare this model to published reports of per pupil expenditures and to the GDP of countries. We also discuss the relationship between per pupil expenditures and overall income inequality. 7.2.1 Total per pupil expenditure Figure 24 depicts the results of our model for the schools visited across the six countries. In the graph, the lower and upper limit of each box represents the lower and upper quartile of each country‘s cost distribution, while the line within each box indicates its median. The figure shows that per-child expenditure in CFS varies widely, from over US$500 in certain schools in South Africa and Thailand to less than US$50 in Nigeria and the Philippines. The figure also shows us that substantial variation exists in the inter-quartile range among countries, with compressed variation in Nicaragua and Nigeria, moderate variation in Guyana and the Philippines, and substantial variation in per pupil spending in Thailand and South Africa.

108
Figure 24 Total per pupil expenditure by country
50
100
150
200
250
300
350
400
450
500
550
600
650
700
750
800
850
900
950
1,000
1,050
1,100
1,150
To
tal P
er-
Pu
pil
Expe
nd
itu
re in
US
$
Guyana Nicaragua Nigeria Philippines South Africa Thailand
For four of the countries we visited (all expect Thailand and Nigeria), data on current per pupil expenditures are reported in the 2008 Global Monitoring Report (UNESCO, 2008), which allows us to compare our findings. We found that the total per pupil expenditures that we determined for Guyana, Nicaragua, the Philippines and South Africa are less than the values modelled by UNESCO. There are several potential reasons for these differences. First, UNESCO‘s estimate is a country-level average, and therefore includes all public schools in a given country. In contrast, our analyses included only a sample of CFS that were selected purposively for the evaluation. Second, UNESCO‘s figures include expenditures related to the educational management infrastructure, such as local, provincial and central government structures involved in public education, while ours do not. Finally, the way in which investments are accounted for is different. Our approach is to consider the lifetime of infrastructure investments and only count the depreciation of this infrastructure as expenditure in the current year. Official country education statistics, reported in the Global Monitoring Report, follow traditional accounting methods, wherein the whole investment in infrastructure is included in the estimation of the current expenditure. Since this approach overestimates the amount of resources that are being used during a given year, our analysis only counted the depreciation when determining expenditures for a given year.
46
46
See UNESCO (2007), Global Education Digest, pg. 17.

109
We also looked at total per pupil expenditure against GNP based on purchasing-power-parity.47
As shown in Figure 25, differences in education spending generally follow patterns observed across countries in per-capita income. Figure 25 Total per pupil expenditure by per capita GNP in Nigeria, the Philippines and South
Africa
7.2.1 Relationship between total per pupil expenditures and overall income inequality We also explored the relationship between total per pupil expenditures (obtained through our research) and overall income inequality in each of the six countries. The Gini-coefficient, the most commonly used measure of overall income inequality, provides a simple measure for visualizing overall income inequality.
48 It ranges from 0 to 1, with 0 representing perfect equality and 1 perfect inequality.
The 2007/2008 UNDP data, produced Gini-coefficients of .42 (Thailand), .43 (Nicaragua), .44 (Nigeria), .45 (Philippines) and .58 (South Africa).
49 Data are not available for Guyana.
These inequality measures
reflect the general trend of educational spending (Figure 24). It is possible that Thailand is an exception to this trend because some schools in Thailand received significant financial investments following the 2005 tsunami which created a (temporary) inequality in educational spending.
7.3 UNICEF investment in CFS In this section we present the results of our analysis of school-level data collected in the six countries. We first present the distribution of expenditures across three categories: percent of UNICEF expenditures out of the total expenditures of CFS (based on school heads‘ reports), percent of salary expenditures, and percent of other expenditures. We then look at the distribution of per pupil expenditures at the school level. We then look at expenditures by the number of years a school has been implementing the CFS model.
47
Source: World Economic Outlook Database, October 2008 48
Downloaded from http://web.worldbank.org/WBSITE/EXTERNAL/TOPICS/EXTPOVERTY/EXTPA/ 0,,contentMDK:20238991~menuPK:492138~pagePK:148956~piPK:216618~theSitePK:430367,00.html 49
http://hdrstats.undp.org/indicators/147.html

110
For each school we calculated the expenditures for eight categories: salaries; non-UNICEF non-personnel expenditures for instruction and support; non-UNICEF professional development expenditures; UNICEF professional development expenditures; UNICEF non-personnel expenditures for instruction and support; UNICEF programme partner expenditures; UNICEF maintenance and operations; and direct family contributions. Table 26 shows the average distribution of expenditures in each country (average schools visited) across three categories: salaries; UNICEF expenditures; and other, non-UNICEF expenditures. Figures 6.7 through 6.12 show, for each country, the distribution of expenditures by school across the eight categories listed above, which were used to calculate the averages presented in Table 26. As shown in Table 26 the bulk of expenditures are devoted to salaries – from 66.8 percent in Thailand to 97.5 percent in Guyana. UNICEF‘s contribution ranges from .04 percent in Guyana to 6.4 percent in Nicaragua. An important caveat associated with these estimates is that the data shown in this table was provided by school heads and administrative staff, who may be unaware of the source of the funds (e.g., whether funds are from UNICEF or from the government), especially where UNICEF works though government structures. Table 26 Distribution of expenditures of total cost of CFS
Expenditure Nigeria South Africa Philippines Thailand Guyana Nicaragua
% of UNICEF Expenditures 4.40% 3.50% 0.04% 2.70% 0.40% 6.40%
% of Salary Expenditures 87.70% 82.10% 94.30% 66.80% 97.50% 87.20%
% of Other Expenditures 7.90% 14.40% 5.70% 30.50% 2.10% 6.40%
Total 100.00% 100.00% 100.00% 100.00% 100.00% 100.00%
For instance, in Guyana, UNICEF does not provide much direct support for supplies, equipment and construction and all trainings are delivered via Ministry of Education structures. This may result in informants dramatically understating UNICEF contributions. In Guyana, we also found an exceptionally high percentage of personnel expenses and few other expenses (Figure 26). In the Philippine informants reported a very low level of support by UNICEF, as shown in Table 26 and Figure 27. Like Guyana, in part we assumed this was due to funding operating through government structures and school stakeholders being unaware of direct UNICEF contributions. However, unlike Guyana, this may also be due to: (1) a reduction and eventual elimination of financial support over time, since schools are expected to become self-sufficient; and/or (2) the scale of CFS in the Philippines, which dilutes per school investments. In South Africa, after salaries, the second largest cost is for non-personnel expenditures for instruction and support (14.4 percent), as shown in Table 26. Figure 28 shows that there is wide variation across schools in both salaries and non-personnel expenses. In the meantime UNICEF expenditures in Nicaragua constitute, on average, 6.4 percent of all expenditures, which is half of all non-salary expenses (Table 26). This suggests that even modest investments by UNICEF and others can substantially impact school-level resources available for non-personnel expenses such as purchasing learning materials. In Thailand, there is substantial variation in school expenditures across schools, as shown in Figure 30 We hypothesize that this is attributable to large amounts of capital available to schools hit by the 2005 tsunami. In these schools it was common to find multiple programmes operating simultaneously. In at least one school, programme investments from development partners equalled 60 percent of the school‘s total budget. When funds for the tsunami end, we expect levels of UNICEF and other donor support to schools to decrease.

111
Due to data limitations, Nigeria (Figure 31), we had to use national level teacher salary scales to calculate staff expenditures. These data are questionable since teacher comments suggest that the actual teachers‘ wages are less than the national teacher salary levels, thereby causing us to over-estimate the percentage of school expenses constituted by personnel expenses. Figure 26 Total per pupil expenditure in sample of Child Friendly Schools, Guyana
Overall Average: US$173
0 50 100 150 200 250 300 350 400 450
Per-Pupil Expenditure in 2008 US$
School 608
School 615
School 621
School 612
School 619
School 607
School 611
School 624
School 605
School 603
School 617
School 626
School 623
Total Per-Pupil Expenditure in Sample ofChild-Friendly Schools, Guyana

112
Figure 27 Total per pupil expenditure in sample of Child Friendly Schools, Philippines
Overall Average: US$99
0 50 100 150 200 250
Per-Pupil Expenditure in 2008 US$
School 410
School 417
School 415
School 420
School 413
School 414
School 416
School 406
School 412
School 421
School 409
School 422
School 419
School 425
School 424
School 402
School 404
School 423
School 401
School 418
Total Per-Pupil Expenditure in Sample ofChild-Friendly Schools, Philippines

113
Figure 28 Total per pupil expenditure in sample of Child Friendly Schools, South Africa
Overall Average: US$368
0 100 200 300 400 500 600 700 800
Per-Pupil Expenditure in 2008 US$
School 217School 216School 223School 203School 212School 202School 209School 211School 210School 201School 220School 206School 222School 214School 225School 219School 224School 213School 207School 221School 218School 215
Total Per-Pupil Expenditure in Sample ofChild-Friendly Schools, South Africa

114
Figure 29 Total per pupil expenditure in sample of Child Friendly Schools, Nicaragua
Overall Average: US$119
0 50 100 150 200 250 300
Per-Pupil Expenditure in 2008 US$
School 506School 520School 501School 504School 521School 517School 510School 503School 516School 505School 508School 507School 518School 514School 515School 512School 524School 522School 519School 525School 513School 509School 502
Total Per-Pupil Expenditure in Sample ofChild-Friendly Schools, Nicaragua

115
Figure 30 Total per pupil expenditure in sample of Child Friendly Schools, Thailand
Overall Average: US$431
0 200 400 600 800 1,000 1,200
Per-Pupil Expenditure in 2008 US$
School 324
School 310
School 319
School 321
School 323
School 318
School 317
School 311
School 316
School 322
School 309
School 325
School 306
School 320
Total Per-Pupil Expenditure in Sample ofChild-Friendly Schools, Thailand

116
Figure 31 Total per pupil expenditure in sample of Child Friendly Schools, Nigeria
Overall Average: US$59
0 50 100 150 200
Per-Pupil Expenditure in 2008 US$
School 124
School 112
School 113
School 104
School 109
School 118
School 107
School 116
School 117
School 111
School 125
School 119
School 121
School 101
School 114
School 123
Total Per-Pupil Expenditure in Sample ofChild-Friendly Schools, Nigeria

117
To explore UNICEF‘s school-level investments further, Figure 32 shows how the percentage of UNICEF expenditures of the total per pupil cost changes with the years that these schools have been supported by the CFS programme (with schools visited across the six countries plotted). The regression line suggests that, on average, support to CFS decreased slightly over time. However, there are two observable groups of schools: (1) those for which, regardless of the number of years they have been CFS, UNICEF CFS resources represent a very small fraction of their overall expenditures; and (2) those for which there is hardly any trend observable over time. Moreover, we observe that variation in the percentage of UNICEF expenditures of the total per pupil cost increases as schools stay in the CFS programme. During the first four years, CFS support ranges from 2 to 4 percent of the total costs, but after four years of CFS support, the percentages tend to fluctuate between 2 and 7 percent (without considering the outliers). It is likely that these findings reflect different models of support to schools. For example, some country programmes may curtail investment in a given CFS after a certain amount of time. Some country programmes may continue to provide support that school stakeholders perceive to come from UNICEF. Other country programmes operate only through government structures and UNICEF contributions may not be perceived to be taking place at the local level.
Figure 32 Percentage of UNICEF CFS expenditures of total per pupil expenditure by number of
years a school has been implementing the CFS model
0%
2%
4%
6%
8%
10%
% o
f U
NIC
EF
CF
S E
xp
end
itu
res
of T
ota
l P
er-
Pu
pil
Expe
nditure
0 5 10 15
Years of UNICEF CFS Support

118
7.4 Cost of scaling up CFS In this section we explore the costs to UNICEF of scaling up CFS. First we show the results of an analysis to estimate the costs and then present and discuss an analysis on economies of scale. 7.4.1 Annual cost of expanding CFS In order to estimate the overall cost of expanding the CFS programme nation-wide in the six countries visited during this evaluation, it is necessary to: (a) multiply the current per pupil expenditure by the total enrolment in primary education, in order to estimate the total resources involved in traditional primary schools in these countries; and (b) multiply the estimated total cost by the percentage of UNICEF expenditures of the total cost of CFS. This gives us the total annual cost to UNICEF of supporting all public schools into CFS. This is shown in Table 27. We are unable to calculate the estimated annual cost of expanding CFS to all schools in Nigeria and Thailand because public per pupil expenditures are not available. Table 27 Expenditures on CFS and estimated annual cost of expanding CFS to all public schools
Expenditure category
Nig
eri
a
So
uth
Afr
ica
Ph
ilip
pin
e
s*
Th
ail
an
d
Gu
yan
a
Nic
ara
gu
a
Percent UNICEF expenditures of total cost of CFS
4.40 3.50 0.04 2.70 0.40 6.40
Enrolment in primary education (000)
22,267.40 7,444.10 13,083.70 5,843.50 116.8 945.1
Public current expenditure per primary pupil
-- 599 94 -- 172 68
Estimated annual cost of expanding CFS programme to all public schools
-- 156,065,557 4,919,471 -- 80,358 4,113,075
*In the Philippines CFS has already been scaled up in that it is a national programme.
7.4.2 Relationship between total per pupil expenditures and school enrolment In order to address the possibility of economies of scale, we analysed the relationship between total per pupil expenditures and school enrolment. A negative association between these two factors, wherein per pupil education costs decrease with enrolment, will demonstrate evidence of economies of scale. Figure 33 presents results for the six countries involved in the study. The relationship between per pupil education costs and school enrolment trends in five of the countries appears to be negative, though it is clearer in some countries than in others. Specifically, Nicaragua, Nigeria and Thailand show the clearest relationship of decreasing total per pupil education costs relative to increasing school enrolment. The correlation coefficient of total education costs and enrolment is equal to -0.10, -0.02 and -0.30 in these countries respectively. This means that for each additional 100 students served in a certain school, per pupil expenditures at that school decrease by $10, $2 and $30 per year, respectively. There was no evidence of economies of scale in the schools visited in South Africa. Total per pupil expenditures remain the same whether school enrolment is 200 through 1,000 students. Large variation in teacher salaries combined with more highly paid teachers in large schools in South Africa may undermine any economies of scale. In addressing economies of scale it is important to understand whether the CFS model involves an investment that is relatively independent of the number of students attending the school. Some economies of scale may reduce value. Take for example the creation of a library with a specified number of books in the Philippines. Whether the school is large or small, the cost of the library could remain the same. Although this is an economy of scale, there may be more limited access to books or seats for students in larger schools. Other efforts, such as bringing potable water to

119
the school, may involve true economies of scale as incremental costs per additional pupil will be quite low after the initial investment.
Figure 33 Total per pupil expenditures by
school enrolment
Nigeria
0
50
100
150
200
To
tal P
er-
Pu
pil
Expe
nd
itu
re
0 1000 2000 3000 4000
Total School Enrollment
South Africa
0
100
200
300
400
500
600
700
To
tal P
er-
Pu
pil
Expe
nd
itu
re
0 500 1000 1500
Total School Enrollment
Philippines
0
50
100
150
200
To
tal P
er-
Pu
pil
Expe
nd
itu
re
0 1000 2000 3000 4000 5000 6000 7000 8000
Total School Enrollment
2%
4%
6%
8%
10%
% o
f U
NIC
EF
CF
S E
xp
end
itu
res
of T
ota
l P
er-
Pu
pil
Expe
nditure
0 1000 2000 3000 4000
Total School Enrollment
2%
3%
4%
5%
6%
7%
% o
f U
NIC
EF
CF
S E
xp
end
itu
res
of T
ota
l P
er-
Pu
pil
Expe
nditure
0 250 500 750 1000 1250 1500
Total School Enrollment
0%
0.005%
0.010%
0.015%
% o
f U
NIC
EF
CF
S E
xp
end
itu
res
of T
ota
l P
er-
Pu
pil
Expe
nditure
0 1000 2000 3000 4000 5000 6000 7000 8000
Total School Enrollment

120
Thailand
0
200
400
600
800
1000
1200
To
tal P
er-
Pu
pil
Expe
nd
itu
re
0 200 400 600 800 1000
Total School Enrollment
Guyana
0
100
200
300
400
500
To
tal P
er-
Pu
pil
Expe
nd
itu
re
0 200 400 600 800
Total School Enrollment
Nicaragua
0
50
100
150
200
250
300
To
tal P
er-
Pu
pil
Expe
nd
itu
re
0 200 400 600 800 1000
Total School Enrollment
1%
2%
3%
4%
5%
% o
f U
NIC
EF
CF
S E
xp
end
itu
res
of T
ota
l P
er-
Pu
pil
Expe
nditure
0 200 400 600 800 1000
Total School Enrollment
0.2%
0.3%
0.4%
0.5%
0.6%
% o
f U
NIC
EF
CF
S E
xp
end
itu
res
of T
ota
l P
er-
Pu
pil
Expe
nditure
0 100 200 300 400 500 600 700 800
Total School Enrollment
2%
4%
6%
8%
10%
% o
f U
NIC
EF
CF
S E
xp
end
itu
res
of T
ota
l P
er-
Pu
pil
Expe
nditure
0 100 200 300 400 500 600 700 800 900 1000
Total School Enrollment

121
7.4.3 Sensitivity analysis of the cost model An important sensitivity analysis is to study how our estimated annual costs of expanding the CFS programme nation-wide changes as the assumed lifespan of some investments is modified. For example, for some investments, such as infrastructure and technology, we assumed a lifespan of five years. In this section, we analyse how our results change if we assume a lifespan of ten years for these investments. Table 28 shows that the implications are minimal. Given that many UNICEF investments are also made in durable goods, the change in lifespan tends to decrease the estimated total cost. But as noted, the difference is less than US$5,000 per year in the case of Guyana, Nicaragua and the Philippines. This may be due to the fact that investment in durable goods is minimal in these countries; thus, modification of the lifespan assumption has a relatively minor impact in terms of overall costs. Only in South Africa is this figure substantial, reducing the total estimated cost by about US$500,000 a year. Table 28 Sensitivity analysis based on estimated life of durable goods
Lifetime of durable goods
Nig
eria
South
A
fric
a
Phili
ppin
es
Th
aila
nd
Guyana
Nic
ara
gua
Percent UNICEF expenditures of total cost of CFS
Investment lifetime of 5 years 4.4 3.50 0.0450 2.710 0.44 6.425
Investment lifetime of 10 years 3.2 3.49 0.0449 2.710 0.43 6.420
Estimated annual cost of expanding CFS programme to all public schools (2008 US$)
Investment lifetime of 5 years -- 176,131,128 624,597 -- 99,759 4,660,032
Investment lifetime of 10 years -- 175,627,896 623,209 -- 97,492 4,656,405
7.5 Other cost issues To date, few evaluations have examined in-depth the costs associated with managing and implementing CFS. In this study, we identified several other important issues that should be examined in future evaluations. First, UNICEF recently developed a CFS costing model that is an add-on to UNESCO‘s school costing model. This is an important development as UNICEF Education Officers responding to the Delphi survey reported that although government enthusiasm, support and ownership of the initiative was substantial, sometimes this was not reflected in implementation at the school level. For the first time, the CFS costing model allows governments to practically determine the resources needed for a school to become child-friendly and, as a consequence, consider scale-up of the initiative from a more realistic perspective. Second, an important cost issue is how UNICEF supports CFS stakeholders in thinking through the resources needed to become child-friendly. In the Delphi survey, UNICEF Education Officers overwhelmingly reported that the key to sustained success of the CFS initiative is local support. However, widely-implemented and accessible CFS instruments, such as school self-assessment tools, provide no explicit guidance on how to budget for costs. Some UNICEF countries may provide guidance on costing out these things but we did not observe this in the six countries visited. As an Education Service Area Officer reported in Thailand, there is no existing CFS mechanism for addressing the thematic areas that the community identifies as important during the self-assessment. What may be needed is a strategy that assists stakeholders in developing a school improvement plan that addresses operational and logistical issues. Providing stakeholders with tools to think through the resource implications of activities identified as essential in making the school child-friendly may be an important step in developing realistic and sustainable plans. In the course of our site visits we went to many schools that were supported by

122
multiple funding streams. In the Philippines, for example, was reported to us by World Bank staff reported that the best effects were realized in sites where CFS and a World Bank-funded conditional cash transfer programme were operating simultaneously. Future studies should examine the unique and joint effects of multiple funding streams and interventions on students in CFS to better understand if and how a school should be supported by UNICEF.

123
CHAPTER 8 – THE PROMISE OF CFS: SUMMARY AND RECOMMENDATIONS
What should a CFS look like? The school head of a high performing CFS in the Philippines provided an answer, as did all the other school heads interviewed. The school head‘s answer, like those of the other school heads, was contextualized, in this case to the Barangay (village) in which the school was located. The school head described a CFS as:
A haven or a place where children and people in the community can find peace, appreciate life and learn to manage the environment wisely.
A school with complete learning facilities like a library and a learning resource centre; better services in the canteen like serving nutritious but affordable food; adequate classrooms conducive to learning with proper lighting, ventilation, adequate learning materials to work with and comfortable spaces.
Being safe and protective for children, with a strong school fence, grounds free from hazards, and with playgrounds and lawns.
A school that children can call their home, or a second home where children can live during school hours.
A school with well-trained teachers who are innovative and wise decision-makers and adept at employing effective teaching strategies gained from in-service education and training in order to effect higher academic achievement and maximize materials from UNICEF (e.g., multi-level materials). The teachers are also sensitive and responsive to the needs of their learners and attend in-service education and training at least five times a year.
A school that inspires positive transformations in the wider community where it is located.
A community of learners who will become productive members of the Barangay, the municipality, the country.
A school where Barangay and PTCA officials are always at hand to extend support.
Having a student tracking system built upon the student information sheet that parents are asked to complete at the beginning of every school year. This helps the teacher understand the circumstances of the children thus providing knowledge on how to handle them both in school and in the classroom.
A school that is flexible in adapting to the circumstances of its students. For example, in some schools, birth certificates are required before a child is admitted to grade 1. However, in rural areas, it is not easy to get a birth certificate and thus some parents are unable to present birth certificates during school enrolment. Unlike in other schools, the principal in a CFS accepts such students and facilitates getting the student a birth certificate by the time he or she reaches grade 6, at which time the submission of a birth certificate should be mandatory. At least with this kind of school policy, no child is left out from school just because he or she is not registered.
Although no one school would look exactly like this, many schools might strive for similar characteristics. This evaluation attempted to capture some of the characteristics in order to help identify the common principles that underlie such visions and to identify the barriers to and achievements in realizing those visions. Specifically, this global evaluation examined how the CFS model has been implemented at the ground level in multiple contexts, how stakeholders understand key CFS principles – child-centredness, democratic participation and inclusiveness – and how stakeholders view CFS. The evaluation addressed three main questions:
Do CFS realize UNICEF‘s objectives for such schools?
What are the underlying principles of CFS and what do they look like in practice?
Can UNICEF CFS programming have an impact at the national level?

124
The previous chapters of the report have provided detailed information and findings from the site visits to six countries and what we learned from our review of previously conducted research on CFS and a survey we conducted among UNICEF Education Officers globally. This chapter presents the major findings from the evaluation and provides strategic recommendations to UNICEF based on those findings. We first present our broad, overarching findings about CFS. We then address the three questions that guided the evaluation, citing what we learned from the country site visits and putting those findings in a broader context by describing what we learned from UNICEF Education Officers who participated in the Delphi survey. Finally, we present our strategic recommendations based on the key findings and our responses to the three questions.
8.1 Evaluation findings 8.1.1 Overarching findings The site visits to six countries with different experiences implementing CFS, data collected from UNICEF Education Officers around the world implementing CFS, and a review of prior studies and literature on CFS have demonstrated the following:
The CFS initiative has been effective in engaging stakeholders at all levels of education systems in creating schools with conditions that reflect effective, child-focused teaching and learning and in encouraging educators to think about how to serve the whole child. School heads and teachers across all countries we visited ‗speak the language‘ of CFS. The conceptualization of CFS appears to be ―sticky‖ (Heath & Heath, 2007), helping stakeholders grasp the need to address the whole child in a manner that embodies the principles of inclusiveness, child-centredness and democratic participation. In interviews with teachers we heard – with the exception of one school – universal support for CFS principles. They are enthusiastic in their support of the ideals of CFS and committed to striving to meet them, even in challenging circumstances. This speaks to the ability that CFS has to effectively engage stakeholders, an important element in implementing the CFS model. Often when asked, teachers, school heads and families who have some comparative perspective stated that CFS changed the way in which they and others thought about education.
The CFS initiative has provided Ministries of Education with a useful framework for improving education that promotes child development and is inclusive, participatory and responsive. Ministries support and have embraced, although to varying degrees, the principles of CFS models. According to more than half (54 percent) of UNICEF Education Officers who responded to the Delphi survey, the Ministry of Education has ―…integrated the Child Friendly Schools initiative into its education strategy.‖ However, ministries do not ‗operate‘ CFS in all cases.
CFS in varying contexts successfully apply the key principles of CFS models. We observed schools operating in very different national contexts and with different levels of resources and serving populations with different needs succeed in being child-centred, promoting democratic participation and being inclusive. UNICEF Education Officers state that the CFS model is one that can be and is adapted and adopted successfully to meet local needs. Most agree that the CFS model is flexible, adaptable to different contexts and broadly appropriate, and is a model that is heuristic and changeable – CFS is ―not a blueprint‖ and can be implemented in different ways with different levels of support depending on local needs.
For the most part, countries where the CFS initiative is more established are more successful than countries that began creating CFS more recently or have not integrated the initiative as well into their respective education sector strategy. The Philippines and Thailand, which have been implementing CFS since the late 1990s and where the CFS model is now implemented as a national strategy for school reform, have many schools that realize the goals of CFS; our survey and observational data indicate schools‘ success in creating child-centred learning environments and teachers and parents attest to changes in outcomes. In both of these countries, the Ministry of Education has embraced the CFS framework. It is the education strategy and other donors rally around the CFS model. Moreover, the UNICEF Regional Office has been a champion of

125
CFS. At the other end of the spectrum, UNICEF only recently began supporting the CFS initiative in South Africa. Although the evaluation indicates that the CFS initiative in South Africa has many challenges to overcome, the objectives of CFS are integrated into the education sector strategy.
UNICEF Education Officers indicate that UNICEF collects and uses data on CFS. However, we were unable to obtain school-level data related to key CFS objectives (e.g., attendance, dropout rates) for this evaluation from UNICEF country offices. This suggests that these data are not regularly collected or accessible to UNICEF country offices. In some cases national education management information systems may not be fully operational, or they may not be maintaining data systematically.
Having insufficient resources is perceived by school staff as a challenge to being child-friendly. We observed that school heads and teachers feel hampered by lack of resources to support instruction – from instructional materials to trained teachers – and schools struggle to maintain the physical plant. Reports from UNICEF Education Officers, who note the difficulty schools have with these issues, demonstrate that these challenges extend beyond the six countries we visited. At the same time, many aspects of the CFS model are not resource-intensive and can be implemented with little expense, which UNICEF Education Officers also point out.
8.1.2 Does CFS realize UNICEF’s objectives for participating schools? When implemented effectively, CFS do realize UNICEF‘s objectives for these schools. Based on our site visits and informed by other work AIR has carried out in CFS as well as secondary sources that put the country visits in a global context, we found the following:
School heads, teachers and parents in CFS view inclusiveness as a key principle of the CFS model and make efforts to include, encourage and support students, regardless of gender or background. Schools reach out to children not in school to engage them and reach out to children in school to retain them, although there is variation across countries in how much effort schools make. CFS provide inclusive classroom environments in which teachers demonstrate similar expectations for, and equal treatment of, all students regardless of background.
The majority of schools provide safe and comfortable environments conducive to learning (e.g., structurally sound buildings and classrooms, students protected from dangers such as toxic materials, sufficiently ventilated classrooms). During school visits we observed many beautiful schools, classrooms and grounds – colourful murals, children‘s artwork, well-cared-for gardens, bright open spaces – that reflected the pride that students, teachers, staff, parents and the communities feel in their school and the extent to which they view such environments as important to being child-friendly. Most students feel that adults in their school provide important emotional support and nearly all schools provide health education to support children‘s health and safety.
Most schools in the six countries are successful in creating an environment that conveys to students that learning is important and worthwhile, encourages students‘ active engagement, and promotes learning. Teachers in most of the six countries are using effective pedagogies, including child-centred instructional techniques; are creating environments that encourage active learning as well as trust and respect; and convey an understanding of the principles of the CFS model regarding pedagogy.
There are high levels of student involvement in many schools. Schools make substantial efforts to create a welcoming atmosphere for parents, and encourage parent and community participation in school events and decision-making.
There are certainly challenges to meeting UNCIEF‘s objectives for CFS, however. Based on the six country site visits and informed by other work AIR has carried out in CFS, the evaluation found the following:

126
Schools struggle to be fully inclusive, particularly in the case of students with disabilities. School buildings and grounds often do not easily accommodate students with physical disabilities, and school heads and teachers overwhelmingly report that they are not equipped to meet the needs of children with special needs (learning disabilities, developmental disabilities, etc.). UNICEF Education Officers also report that more must be done to strengthen schools‘ ability to be inclusive of and support all children. Few say that schools in their countries take concrete actions to make their schools inclusive; most say that teachers have insufficient training in supporting children with special needs.
Although CFS in the six countries have been successful in creating welcoming classroom environments and providing academic and emotional support to children, they have been less successful in creating conditions in which many students feel emotionally and physically safe – factors which have been demonstrated to affect attendance, academic performance and school dropout.
Although nearly all schools provide health education, they do not provide systematic SEL, which helps students learn to manage their health-related behaviour. In addition, many schools struggle to provide healthy school environments, particularly sanitary and safe latrines and potable water.
Our analysis shows that child-centred pedagogy and family and community participation are the two most important factors in creating a positive school climate.
Observations and student and teacher reports suggest that many teachers in CFS are using child-centred pedagogical approaches; we also observed a commitment to child-centred teaching. However, teachers are not necessarily following the pedagogical approaches one would expect in a CFS. School heads and teachers identified the lack of trained teachers who can implement child-centred instructional methods as a challenge in the six countries, and UNICEF Education Officers said that teachers do not have the training they need to implement CFS approaches.
Although school heads, teachers and parents enthusiastically embrace the idea of parent and community involvement in schools, they also identified obstacles to involving them in meaningful ways. UNICEF Education Officers echoed this: more than two-thirds said that parents and the community do not take responsibility for implementing CFS principles and that parents are not involved substantively in CFS. Moreover, less than 3 percent of UNICEF‘s CFS budget supports community involvement.
Although having well-built, safe schools that provide comfortable learning environments is important, this alone is not sufficient to make a school child-friendly. Our analysis shows that school architecture and architectural features do not predict school climate. Rather, it is other, less tangible aspects that determine whether a school is child-friendly – factors such as child-centredness, engaged parents, and mutual respect among students and teachers. However, there is a great emphasis on architecture in CFS programming: 67 percent of UNICEF‘s CFS budget is allocated to architecture. School heads feel burdened by their inability to maintain their facilities, while UNICEF Education Officers report that schools have difficulty attaining CFS‘s school facilities goals even though UNICEF provides funds, training and technical support in many countries.

127
8.1.3 What are the underlying principles of CFS and what do they look like in practice?
UNICEF envisions and promotes CFS models not as abstract concepts or a rigid blueprint but rather as ―pathways towards quality‖ in education that reflect three key, and inter-related, principles derived from the Convention on the Rights of the Child (UNICEF, in press):
Child-centredness: Central to all decision-making in education is safeguarding the interest of the child.
Democratic participation: As rights holders, children and those who facilitate their rights should have a say in the form and substance of their education.
Inclusiveness: All children have a right to education. Access to education is not a privilege that society grants to children; it is a duty that society fulfils to all children.
In order to develop an empirical base for delineating the underlying principles of CFS we:
analysed secondary literature on what is necessary to realize the CFS objectives, which helped us to operationalize the importance of school climate;
used Chabbott‘s Desk Review (2004) to frame empirical questions for our site visitors;
employed HLM analyses to estimate the impact of key principles on students‘ perceptions of school climate; and
validated and contextualized our quantitative and qualitative data by comparing them with the results of our Delphi survey, observations in other CFS, and analyses of the secondary literature.
The analysis of the secondary literature highlighted the importance of the conditions for learning and development, which we operationalized as students‘ perceptions of school climate. Since continuity with past research is important, we also operationalized the characteristics codified in Chabbott‘s (2004) desk review.
50 Chabbott codified components of the CFS framework based on extant
regional and country-specific UNICEF documents. We asked the AIR site visitors to assess the degree to which a commitment to each of those components in Chabbott‘s codification was present in the CFS in the six countries. For each component, we determined if there is:
a consistent commitment across countries and observed in most or all schools;
a commitment in some but not all countries and observed in some schools; or
no observable commitment and observed in few or no schools. As shown in Table 29, there is some level of effort in the six countries we visited to address nearly all of the components in Chabbott‘s compilation and by extension the key principles of CFS. For some elements, there is a consistent commitment across countries and we observed many schools demonstrating concerted efforts to address the underlying principle. Consistent with our survey, observational and interview data, site visitor assessments demonstrate that CFS focus on making their schools academically effective and relevant, particularly in terms of instructional methods and content; work towards creating appropriate physical environments; are oriented towards protecting and respecting children; and make efforts to involve parents and the community. Statistical analysis using multi-level modelling showed the importance of family and community participation and child-centred pedagogy for students to perceive the school climate as positive and to feel connected to school.
50
In 2004, Chabbott conducted a desk review of CFS for UNICEF as the first of a two-phase study to analyse the various ways CFS has been conceptualized and operationalized and the extent to which it has contributed to meeting UNICEF‘s broader goals. As stated in the report, ―The purpose of this desk review is to document how the CFS framework has been conceptualized and operationalized in different regions and to explore how the overall impact of CFS on UNICEF programming might be measured. Special attention is paid to the goals of increasing access to schooling, improving the quality of education, increasing gender responsiveness and equality and improving learning achievement in terms of literacy, numeracy and life skills.‖ (pg. 2).

128
Finally, UNICEF Education Officers‘ reports through the Delphi survey provide further support to the school-level data and AIR site visitors‘ ratings. We synthesized all of these data sources and identified the following underlying principles or ‗pre-conditions‘ as essential for a school to be child-friendly: Inclusiveness
The school environment is welcoming for all children and families – culturally and linguistically diverse children and families and children from marginalized populations.
School leadership and teachers recognize that students have different learning styles and needs and accommodate those needs.
Child-centredness
The school staff prioritizes children‘s physical and mental health, physical and emotional safety, and overall well-being.
Relationships among students and staff are caring, positive and respectful.
Students are actively engaged in the learning process through teachers‘ use of child-centred pedagogical techniques and eliciting students‘ active participation.
Democratic participation
There are high levels of family and community participation.
Students are actively engaged in school activities and decision-making and their roles in decision-making are formalized through student governments or councils.
Many schools demonstrate these principles or at least demonstrate that they are working towards them. Moreover, schools also realize these principles in different ways; characteristics of CFS vary within and across countries depending on local context and needs. However, our research indicates that these are the fundamental elements of the principles that make a school child-friendly.

129
Table 29 Prevalence of elements of CFS models from site visits
= consistent commitment across countries; observed in most or all schools = commitment in some but not all countries; observed in some schools
= no observable commitment; observed in few or no schools
RIGHTS-BASED, INCLUSIVE AND PROTECTIVE, ETHNICALLY, CULTURALLY, SOCIO-ECONOMICALLY AND IN TERMS OF ABILITY.
Compulsory, affordable (lowering cost to parents) and accessible to all children (shorten distance to school, provide transportation).
Encourages respect for children‘s dignity and protects children from harm and abuse (no drugs, corporal punishment, zero tolerance for bullying).
Children, teachers and parents know, respect and fulfil student rights (CRC included in the curriculum).
Provides sanctuary in a violent environment.
Promotes and monitors the rights and well-being of all children in the community.
Puts the needs of children ahead of other actors in the system.
Ensures respect for diversity.
Responds appropriately to the differing needs of children.
Does not stereotype, exclude, or discriminate on the basis of difference.
Curriculum is sensitive to different values of the students.
Monitors attendance and progress of at-risk children.
Facilitates outreach support for children in need and their families.
Provides incentives for at-risk students to attend school (stipends, uniforms, textbooks).
At-risk children know where to go for help, advice and support.
Ensures equality of learning for all children, especially for working children, children of ethnic minorities and those living with/affected by HIV/AIDS, children with disabilities and child victims of exploitation and violence.
Allows children to use their first language during the school day when this language is other than the language used locally.
Assists in the integration of newcomers into the school.
Provides lessons to help students learn the value of the differences between them.
Provides a mechanism for children to express their opinions about school work and school life.
GENDER SENSITIVE AND EQUITABLE
Provides gender sensitive curricula, textbooks and learning materials.
Eliminates discrimination and stereotypes.
Promotes equality in enrolment, retention and achievement.
Teacher training programmes incorporate gender awareness, and are available close to communities to ensure female teachers can attend.
Attitudes of school staff, parents and communities encourage equal opportunities.
Provides incentives for girls (stipends, uniforms, textbooks, housing).
Socializes boys and girls in a non-violent environment.
EFFECTIVE ACADEMICALLY AND RELEVANT IN TERMS OF LIFE AND LIVELIHOOD SKILLS
Quality process, content and outcomes: Provides basic skills of literacy and numeracy, and life skills including peace and democracy.
Provides a child-centred curricula, teaching and learning methods.
Helps children to master the essential skills of writing, reading, speaking, listening and mathematics.
Promotes good quality teaching and learning processes, including individualized instruction appropriate to each child, and active, cooperative and democratic learning methods.
Provides education based on the reality of children‘s lives.
Ensures curricular content responds to the learning needs of individual children, the general objectives of the education system, the local context and traditional knowledge of families and communities.
Provides a mechanism for children to express their opinions about school work and school life.
Encourages children to contribute during each lesson by asking questions.
Quality learners:
Adequately prepares children for school through formal and non-formal pre-school education programmes.
Provides a positive experience for children.
Concerned with what happens to children before they enter the system (e.g., school readiness, nutrition status, social and linguistic skills).
Quality teachers:
- Teachers are professionally competent, well-motivated, and receive regular support through in-service teacher training opportunities.
- Teachers actively participate in education reform.
- Teachers‘ capacity, morale, commitment, status and income are enhanced.

130
Table 30 Prevalence of elements of CFS models from site visits (continued)
= consistent commitment across countries; observed in most or all schools = commitment in some but not all countries; observed in some schools
= no observable commitment; observed in few or no schools
HEALTHY, SAFE AND SECURE
Psycho-social environment: Promotes mental and physical health.
Encourages participation, creativity, self-esteem and psycho-social well-being of children.
Provides emotional support; encourages healthy behaviours and practices (e.g., information on HIV/AIDS, drugs) both inside the classroom and when the children return to their homes, the community and the workplace.
Children can go to someone if they have a problem.
Teachers support children in distress and children with special needs.
Teachers and other staff encourage caring amongst the children.
Physical environment: Accommodates all children in the community (e.g., sufficient schools, sufficient classrooms, sufficient teachers, etc.).
Designed to meet the basic needs of children (e.g., cafeteria, playgrounds, sports facilities).
Gender sensitive (e.g., secure dormitory accommodations, separate and private restrooms for boys/girls).
Hygienic, safe and secure environment (drinking water, safe haven in violent communities).
Conducive to learning (adequate supplies, visual aids and teaching/learning materials).
PARTICIPATION OF STUDENTS, FAMILIES AND COMMUNITIES
Plans events that include family and community members.
Welcomes families and community members.
Actively involves parent associations and student committees in shaping school life.
Involves parents in activities and decisions that affect their children.
Arranges parent-teacher meetings to reflect parents‘ work schedules.
Family focused, works to strengthen families as the child‘s primary caregivers and educators, and to help children, parents and teachers establish harmonious relationships.
Encourages parents, local government, community organizations and other institutions of civil society to participate in the management as well as the financing of education.
Promotes community partnerships and networks focused on the rights and well-being of children.
Invites parents to discuss the learning experiences of their children with the teacher.
Encourages parents to support the consolidation of their child‘s learning at home, i.e., suggests ways in which parents can help their children put into practice what they have learned at school.
Teachers are kept informed about major changes in the home situation of each child in their class.
Provides children with opportunities to develop projects that provide assistance to their local communities.
8.1.4 Can UNICEF CFS programming have an impact at the national level? There is real potential for scaling up the CFS initiative within and across countries. Our recommendations below, which address questions posed by UNICEF in the Terms of Reference for this evaluation contract, target actions that will enable UNICEF to further promulgate the CFS model and support scale-up and sustainability of the initiative.
8.2 Recommendations 8.2.1 Core components of CFS
1. When and under what circumstances should CFS components be considered core elements not to be dispensed with, and under what circumstances can they be substantially altered to adapt to local context?
Educational innovations should have a set of core elements by which the innovations are defined (Osher, Dwyer & Jackson, 2004). Similarly, there are essential features without which a school should not be considered child-friendly. Our CFS research suggests that child-centredness, democratic participation and inclusiveness serve as this core. Since variation in settings requires flexibility in implementing these principles, it is important to operationalize these principles. We suggest the following:
CFS principles are understood first and foremost as supporting children‘s learning and physical and emotional safety;

131
Schools implementing these CFS principles have a set of strong conditions for learning, the results of which are assessed at the student level; and
Schools implementing these CFS principles produce strong academic and SEL outcomes, which are assessed at student and school levels.
Child-centredness can be assessed through observation, teacher and school head surveys, interviews and anonymous student surveys. It is important to conduct these assessments for two reasons: First, research on dissemination and implementation suggests that there is a tendency to water down innovation (e.g., Berman & McLaughlin, 1976). Second, as findings in this evaluation suggest, there is a gap between how adults and students experience environments (e.g., Pervin & Turner, 1994), and the operationalization of child-friendliness should be confirmed by objective data collected with some assurance of anonymity. Attention to teaching and learning outcomes is important because stakeholders expect students to achieve, and these outcomes are unlikely to be realized without a focus on learning (e.g., Cook et al. 1999). This focus can be part of child-centred instruction. Learning outcomes can be both academic and social-emotional. Learning outcomes should be assessed against academic and SEL standards which can be used to monitor student and school progress. The three core principles should be adapted to meet particular needs. For example, in post-conflict and post-disaster situations, adults and students may suffer from post-traumatic stress disorder. In AIR‘s SEL work in EAPR, we observed children in the Mindanao region of the Philippines who jumped when a bus stopped outside a school. The teacher explained that many children were conditioned to react to any loud noise that sounded like gunfire. Not only does research suggest that this kind of stress impedes students‘ learning and well-being, but unaddressed, teacher stress may manifest itself in violence towards children. In Timor-Leste and Cambodia, AIR staff observed that although UNICEF worked to help create policy provisions banning corporal punishment in schools, verbal abuse was still routinely employed. Realizing CFS goals in such settings may require addressing post-traumatic stress disorder, depression and anxiety through mental health supports, and efforts to improve SEL. One of the Thai schools we visited for this evaluation did the former, when they brought in a psychologist to work with students after the tsunami. UNICEF China is beginning SEL work within the earthquake-affected region. 8.2.2 Targeting CFS investments
2. Should CFS be targeted at certain settings or circumstances? If indeed there are optimal
settings, what pre-optimal settings should be targeted for preparatory actions to make them more welcoming?
The evaluation found considerable within-country variation in the degree to which CFS intervention schools have successfully applied the key principles of the CFS model. While variation of implementation is the norm in the scale-up of complex school interventions (e.g., Aladjem & Borman, 2006), it should be consistent with the core components. The variation we observed appeared to be in part due to schools'—and to some extent communities‘—readiness and capacity to implement CFS interventions. The readiness of the school head appeared to be at the core of this variability, since the leader is key to developing the capacity of other stakeholders. While research suggests that more schools have the potential to successfully change than one would anticipate (Slavin, 2005), leadership is key, particularly in an intervention that requires changes in attitudes, behaviours and capacity. The presence of a school head that embraced CFS core values and was a leader who was skilled at gaining buy-in and guiding teachers, parents and community members through change seemed to be the most essential pre-requisite for success. This observation is consistent with literature on school change and relational trust that suggests that effective leadership helps focus change while creating the trust and sense of mission, collective efficacy and resilience that are necessary for change to be effective (Aladjem & Borman, 2006; Bryk & Schneider, 2002; Bohn, 2002;). By identifying a school‘s and community‘s readiness for change, and better understanding school leader capacity, UNICEF could both improve its selection of schools and targeting of resources. It could both

132
focus on those schools ready to benefit from intervention, and/or tailor support to increase readiness for CFS. Since all school heads will not be both supportive of CFS and be effective leaders, we recommend that UNICEF should target more resources as needed to build the capacity of school heads to engage in effective leadership and to guide the school community through change. In addition (or in the absence of a potentially effective school head), UNICEF can improve readiness by a greater focus on building stronger community and teacher engagement in implementing CFS. To assess administrator, school and community‘s readiness to implement a CFS model, UNICEF should use and/or improve upon self-assessments that commonly constitute the first step in CFS engagement. Alternatively, UNICEF could develop simple readiness checklists that could be implemented by UNICEF or MOEs. The assessment process should be sensitive to local context. For example, CFS must pay particular attention to school selection, school readiness and the sequencing of CFS activities in post-conflict and post-disaster settings. We can envision a situation in which a UNICEF-sponsored CFS teacher training occurs in a school where the building and grounds have been badly damaged. In this instance, teachers may perceive training on pedagogy as too far ‗down-stream‘ to be relevant when the school may be without water, toilets or even a roof. This same training in another school not affected by the conflict may be effective.
3. Should the CFS initiative focus its efforts in particular ways to achieve the greatest impact, for example, in primary schools but not in secondary schools? What are the factors that would determine whether to focus or not?
Research suggests that the CFS principles are equally important at the secondary school level (e.g., Osher, Dwyer, & Jackson, 2004). However, UNICEF‘s resources are limited and must be targeted. In order to focus efforts and target resources efficiently, UNICEF should establish overarching criteria for weighing its investments. Since variations of need and capacity exist among countries, targeting must occur at the country level. However, three overarching criteria may be useful in all cases: opportunity costs, equity and cost-effectiveness/cost-benefits. All investments have opportunity costs, in terms of both financial and human resources expended and the time taken. Hence, CFS investments should always be examined in terms of the opportunity costs of not making alternative investments. Equity means that all children and youth have equal access to and derive benefits from resources that help them thrive. According to UNESCO‘s 2007 Global Education Digest,
51
substantial inequities exist in the allocation of educational funds within countries. These inequities may include who goes to school, who drops out and when they drop out, and the quality of education that students receive. Given UNICEF‘s especial advocacy mission, identifying and addressing inequities must be an overriding concern. Cost-effectiveness and cost benefits means that limited resources are used wisely. For example, in deciding whether to focus on primary or secondary schools, research suggests it may be more cost-effective and cost-beneficial to target primary schools since these primary school interventions may be cheaper and may reduce the likelihood of secondary school dropout (Balfanz & Herzog; Kennelly & Monrad, 2007). A focus on cost-benefits is also important. For example, although it may be more immediately cost-effective to invest in schools that serve larger numbers of students, greater levels of long-term change may be achieved by focusing on smaller schools that have greater needs (as in the case of South Africa with the focus is on the most unsafe schools), particularly if these schools in aggregate serve large numbers of students. Targeting based on considerations of opportunity costs, equity, and cost-effectiveness and cost benefit, requires understanding the country context. One important contextual factor is country income. For middle-income countries, investments in school infrastructure may be more appropriately carried out through the government with UNICEF instead focusing even more on highly-leveraged investment
51
UNESCO (2007).Global Education Digest: Comparing Education Statistics Across the World. Montreal: UNESCO Institute for Statistics.

133
activities or technical assistance, such as provision of SEL training. In middle income countries with high levels of income inequity there may still be very poor areas that require UNICEF‘s direct support or advocacy efforts. In this regard, UNICEF country officers may find it useful to examine composite indices such as those found in the Human Development Report, for example, the Human Development Index, Human Poverty Index or Gender Empowerment Measure,
52 when determining how to adapt and focus the
CFS model.
4. Under what circumstances should CFS approaches be mainstreamed and sustained within the ongoing educational system, and when is it better to start from scratch (completely overhaul the system)?
These evaluation findings suggest that UNICEF‘s commitment to addressing the whole child in a rights-based, child-centred manner has great potential to capture the vision of teachers and communities, and in so doing, to start the process of school transformation. UNICEF occupies a unique place in the developmental landscape as the interlocutor between grass roots engagement and national and international policy. This is an important position and can lead to mainstreaming. However, a critical step in realizing sustainability goals is to better understand and communicate information regarding the resources needed to establish and maintain a school‘s child-friendly characteristics beyond the duration of UNICEF‘s intervention. This is also important as UNICEF‘s resources are never sufficient for it to do this at scale and yield maximum impact for children. Our research found evidence of this in both the Philippines and Thailand where CFS is now the model for elementary education. Members of our team also observed the importance of UNICEF‘s ability to influence national education policy in such nations as Cambodia, South Africa and Timor Leste. If governments incorporate CFS into a sector-wide approach, donor buy-in and sustainability are more likely. This buy-in will be enhanced by collecting data for performance measurement and continuous improvement, and by doing research on CFS impacts. UNICEF should focus its efforts on encouraging education ministries to adopt the CFS framework and principles, build it into their national education strategies and budgets, and monitor its implementation to ensure quality and evaluate outcomes to assess impact. Governments‘ commitment to CFS ideals and the collection of outcome data are likely to impact other donors and in turn provide additional support for CFS implementation. This is discussed further in response to the question on research and evaluation. While government adoption and enhanced donor support is important to sustainability, it will not eliminate the need for UNICEF to advocate to ensure that the goals of CFS are realized. Specifically, UNICEF must ensure that all efforts:
increase access by creating physical and social environments that are accessible to every child and pedagogical environments that are ready for every child;
build the social and emotional capacity of teachers to respond well to students‘ needs and provide students with strong conditions for learning; and
engage harder to reach parents and community members. However, there may be situations in which there is no national or systemic readiness to support the core principles of CFS, and there may be instances where national leaders do not have children‘s best interests in mind when designing educational policy. In these circumstances, it may make sense to ‗start from scratch‘ by focusing more direct efforts on building schools which can serve as exemplars for advocacy. 8.2.3 Addressing the future
5. Looking ahead five to ten years from now, what components of the CFS approach appear most
likely to need revision from present practice /understandings? Why are these areas considered most likely to need new approaches?
52
See http://hdr.undp.org/en/statistics/

134
It is unlikely that the key principles of CFS (inclusiveness, child-centredness and democratic participation) will need to be altered in the near future. However, the interpretation and emphasis of the principles and the support needed to realize their fulfilment will evolve. For instance, in some middle-income countries UNICEF is beginning to realize the goal of inclusiveness in the sense that children are in school. In schools in these countries, inclusiveness efforts now speak more to the inclusion of children with disabilities, gender equity, marginalized subpopulations, and even the subjective sense of how included a child feels in school. Beyond these general revisions, we anticipate several specific adaptations:
Life Skills and Social Emotional Learning (SEL). CFS‘ whole child focus can include a broadened version of life skills. Life skills are currently viewed as the most difficult EFA goal to measure. UNICEF could position CFS as a good model for teaching life skills. SEL develops the capacities of individuals to understand and manage their emotions, understand and manage relationships, and to make responsible and culturally-appropriate decisions. There is emerging research based on SEL that suggests its importance in realizing academic and social goals. For example, a meta-analysis of 213 SEL interventions found that SEL programmes enhanced students‘ behavioural adjustment in the form of increased prosocial behaviours and reduced conduct and internalizing problems, and improved academic performance on achievement tests and grades (Durlak, Weissberg, Dymnicki, Taylor, & Schellinger, in press). UNICEF is already taking steps to make this adjustment in EAPR and in its Life Skills office. SEL can enhance both CFS immediate goals as well as long-term life goals. SEL helps students stay in school and participate in child-centred instruction (e.g., cooperative learning), promotes democratic participation (e.g., culturally-appropriate assertiveness and interpersonal competence), and contributes to a more civil and less violent school climate. SEL can also contribute to more effective parenting of the next generation of young people, improved vocational performance and active citizenship.
Conditions for Learning. A research-based argument for whole child-centred approaches can complement UNICEF‘s advocacy. CFS‘ focus on what some call the 'conditions for learning' is supported by an increasing body of research that shows the relationship between a student‘s experience of connectedness, safety, engagement and peer social responsibility, and academic outcomes of interest (improved attendance, learning, achievement and reduced drop-out) (e.g., Fredricks et al., 2004; Goodenow, 1993; Osher & Kendziora, in press; Osterman, 2000; Wentzel, 1998). This research provides additional support for UNICEF‘s child-centred approaches which can complement UNICEF‘s rights-based argument for its model.
Information technology and communications. Our site visits found that, although technology was used effectively in some places, information technology and communications are still relatively limited in CFS. With efforts such as One Laptop per Child, we anticipate that the price point for computers will continue to decrease in the next five to ten years, until the point where it is cheaper to provide children with computers than with traditional learning materials. Other technologies that could be used effectively in instruction will also likely drop in price. In this regard, UNICEF must put more effort into understanding how to realize child-centred learning approaches through computers and other technologies.
Natural disasters, social migration and trauma. Our analysis showed that in 2007, emergency funds constituted 28 percent of UNICEF‘s global budget and 43 percent of the CFS global budget. This indicates that CFS is used preferentially as a vehicle for programming emergency funds. UNICEF needs to give more thought to whether CFS is the appropriate vehicle for these funds and if so, consider more carefully how to plan for sustainability issues inherent with the deployment of these temporary resources. Also, the confluence of climate change, ecological degradation, population growth and human settlement patterns makes it likely that disasters will increase in the future and that these will generate migration. The combination of increased disasters and improvements in child survival approaches will likely also increase the number of children with disabilities, including children with post-traumatic stress disporder and other emotional and behavioural disorders, which will require intentional approaches to address the impact of these disasters.

135
Teacher preparation and pedagogy. We found substantial variability in the use of child-centred approaches in classrooms, even within countries or within sub-regions of countries. There is substantial evidence that a shift to more child-centred teaching methods in the classroom requires a long-term approach, and that meaningful and sustainable change can take several years to achieve (e.g., see Kraft, 2004). Teacher training workshops can introduce teachers to new concepts and methods, but this approach alone is not sufficient for teachers to truly be able to adapt and apply what they have learned in their own classrooms, and there can be an ongoing need to start over again and again in areas with high teacher turnover. Attempts to increase the use of child-centred pedagogy will be most effective if UNICEF builds in elements of sustainability and local capacity-building as a core of the intervention. For example, Nicaragua has provided training and support to teachers and school heads in a smaller number of 'model' schools, and these schools in turn provide ongoing mentoring and support to a larger number of schools in their communities.
53 Other effective models could include a 'train the trainers' approach to build
local expertise in communities, and working in partnership with education officials to integrate ongoing, direct support for teachers within the educational infrastructure.
8.2.4 Evaluation and monitoring
6. What are recommended research and evaluation approaches to promote good conceptual
evolution, as well as proper advocacy? What is the required structure for CFS within UNICEF/partners to respond to the needs for data collection, dissemination and analysis in the future?
UNICEF cannot target its resources without information that can help it understand the impact of CFS. UNICEF needs access to information in each country about how funds are being used and to what effect, and such data must be accurate, consistent, accessible and actionable. UNICEF offices in the countries we visited for this evaluation did not have ready access to such data and, in many cases, could not obtain it from schools or from the country‘s EMIS. In addition, UNICEF does not use all available extant data. School self-assessments and UNICEF-supported EMIS in countries, especially in EAPR, capture several important indicators and could become part of a UNICEF E MIS. UNICEF should strengthen its monitoring and evaluation of CFS by systematically collecting data on key indicators of basic education access and quality from schools that it supports. In some countries it may be necessary to provide support at all levels – school, regional, national – to ensure that the appropriate data are collected consistently and systematically. Performance metrics should focus on how schools are doing in terms of inclusiveness, child-centredness and democratic participation as well as academic outcomes. Metrics should include measures of how students are experiencing the school and how students are improving over time, which can be used for performance measurement and accountability. Instruments from the current evaluation can be employed for this purpose as long as those using them are provided with clear guidance as to their effective and ethical use. In terms of evaluations, UNICEF should consider the use of rigorous experimental and quasi-experimental designs, to see how well CFS and MDG goals can be realized within different contexts. Evaluations should control for student diversity and implementation quality and be longitudinal, using comparison groups identified through random assignment or matching on key characteristics. 8.2.5 Global communication strategy
7. What are the recommended elements of a global communication strategy to encourage other
partners to join UNICEF in CFS programming, if CFS is found to be effective?
53
This school mentoring program was developed in partnership between the Ministry of Education and the USAID-funded EXCELENCIA project.

136
Any global communication strategy needs to emphasize efficacy as well as focus on:
Equity: Why continued investment in primary education in many countries corrects existing inequity in educational spending and how CFS facilitates addressing inequity relating to gender and disabilities.
Child development literature including child-centredness and SEL: Why and how student-centredness and SEL produce important school and community outcomes such as improved attendance, performance, personal development and post-graduation outcomes.
Conditions for learning: Why the social and emotional conditions for learning are important for student learning across academics as well as life skills and SEL. CFS helps provide these conditions through its holistic approach at the school level and through multi-sectored engagement at the national and regional levels.
Sustainability: Why the conceptualization of CFS is ―sticky‖ among educators and provides a powerful metaphor for holistic, child-centred approaches that can be grasped and then generalized by stakeholders. This metaphor can help stakeholders visualize and come to judgment regarding what is necessary to create and sustain effective schools.

137
APPENDIX A: EVALUATION METHODOLOGY AND ANALYSIS
This appendix provides more information about the evaluation methodology and analysis, elaborating upon what was provided in the Introduction. Data Collection Instruments The evaluation collected quantitative and qualitative data from multiple data sources in order to be able to triangulate data. Instruments and sources included
school and classroom observations;
student, teacher, and school head surveys;
parent and teacher focus group discussions;
in-depth interviews with school heads; and
visual data (photos and video). Table A.1 lists the data sources and instruments used to gather data for the evaluation, with an indication of the information gathered with each. Copies of the instruments used in this evaluation are in the evaluation Inception Report (AIR, 2008; see Annex 2). Table A.1. Data Collection Instruments School
Student Survey Challenging Student-Centred Learning Environment Safe, Inclusive, and Respectful Climate Emotionally Supportive Climate Child Participation
Teacher Survey Family and Community Participation Safe, Inclusive, and Respectful Climate School Leadership Child Participation Child-Centred Pedagogy Support for Teacher Development and Pedagogy
School head Survey Family and Community Participation Safe, Inclusive, and Respectful Climate Healthy Learning Environment: Child-Centred Services Child Participation Teacher Development and Involvement
School Observation Safe and Welcoming School Learning Environment Healthy Learning Environment: Hygiene and Sanitation Inclusive School Climate
Classroom Observation Safe and Welcoming Classroom Environment Child-Centred Pedagogy Inclusive Classroom Climate
School-Level Stakeholder Interviews/Focus Groups School heads Teachers Parents
School Records Enrolment and student body Staffing Cost data
Country
Country-Level Stakeholder and Implementer Interviews Ministry of Education and other government UNICEF Advocacy groups
Global
Global Stakeholder and Implementer Web Surveys UNICEF education officers in countries implementing CFS (Delphi analysis) Ministry of Education representatives in countries implementing CFS
Literature Review
Global Data on Investment in CFS (Cost Data)

138
Prior to implementation, draft surveys observation checklists, and interview/focus group protocols were sent to the UNICEF office in each country for review for cultural appropriateness and to seek recommendations for local adaptations. Typical changes suggested by local offices were to accommodate local terms, such as changing school head to school principal (South Africa) or head teacher (Guyana). When responding to these suggestions, we were first guided by the need to ensure that the instruments, even when adapted, would support cross-national comparisons and that the surveys would not become so long as to be arduous to children and other respondents. If these constraints did not appear to pose a problem, we accommodated requests for adaptation.
We relied on UNICEF country offices for advice on if and when instruments would need to be translated into another language, as well as on the languages spoken by the populations included in the schools and communities in the sample. When translation was needed, UNICEF either took responsibility for translating the instruments or directed AIR to a recommended local translator. In three countries—Guyana, Nigeria, and the Philippines—the instruments were not translated into local languages because English is the official language (in the case of the Philippines it is one of two official languages) and it was believed that English would be readily understood by participants.
In South Africa, the student surveys were translated into Afrikaans, Xhosa, and Zulu, and the teacher surveys into Xhosa and Zulu, depending on the predominant language of the community and what the UNICEF country office deemed appropriate. In Thailand, the survey instruments were translated into Thai, while the qualitative protocols, administered by the data collectors, who were fluent in English and Thai, remained in English. In Nicaragua, all instruments were translated into Spanish, the country‘s official language and the language of instruction in the schools visited. Table A.2 shows the languages in which the instruments were administered in each country.
Table A.2. Languages of CFS Evaluation Instruments
Student Survey Teacher Survey
School head Survey
Interview and observations protocols
Guyana English English English English Nicaragua Spanish Spanish Spanish Spanish Nigeria English English English English Philippines English English English English Thailand Thai Thai Thai English South Africa Afrikaans, Xhosa, Zulu Xhosa, Zulu English English
Sampling Countries for the Site Visits In the evaluation Terms of Reference, UNICEF suggested that the evaluation should take place in two or three of UNICEF‘s regions. The evaluation design was guided both by this recommendation and the belief that to properly understand how the Child Friendly Schools model is implemented in different contexts, it was necessary to visit countries with differing social, political and cultural contexts and varying levels of implementation. Table A.3 shows the countries visited by region: two countries from East Asia and the Pacific Rim (EAPRO) (Thailand, Philippines), two from Latin America and the Caribbean (Nicaragua, Guyana), and on from East and Southern Africa (EASA) (South Africa) and one from West and Central Africa (Nigeria). Table A.3. Final Country Sample
East Asia and the Pacific Region (EAPRO) Philippines Thailand
Latin America and the Caribbean (TACRO) Guyana Nicaragua
East and Southern Africa (ESAR) South Africa
West and Central Africa (WCAR) Nigeria

139
The selection of these three regions ensured that the evaluation was sufficiently global in scope and would not be unduly biased by the characteristics of any given regional approach to implementing CFS. In additional, basing the study in four regions would help make the findings and recommendations more contextually relevant to UNICEF country offices just beginning to implement CFS. The six countries provide cultural, linguistic, and religious variation as well as variations in CFS implementation experience. A description of CFS in each country, drawn from site visit reports and background information provided by UNICEF, is provided in Appendix B. Sampling Schools and School-Level Respondents The evaluation design called for visiting 25 schools in each country sampled using a purposeful sampling approach. These schools were to be as representative of CFS schools in each country as possible in terms of student and community characteristics and range of intervention duration. To that end, we worked with UNICEF to identify schools that had been implementing CFS for varying amounts of time and stratified along key demographic characteristics, such as school locality (urban/rural) and ethnicity or religious affiliation of the student body. There was also a need to balance diversity in schools with a simultaneous need to make the site visits cost-effective and time-efficient. For this, we asked countries to explore the possibility of selecting two different regions of the country for visiting schools without compromising the integrity and quality of the sample. Although we recognized the need for some geographic clustering for logistical and cost purposes, there was an effort to ensure that school selection was random, and not based on any other criteria that would result in a biased selection of CFS schools in the country. School Sample Characteristics Overall, we visited 150 schools across the six countries, 25 in each country, with the exception of Nigeria, where we visited 23 schools (two schools could not be visited due to a teacher strike) and Guyana where we visited 27 schools. The number of schools by school locale and the length of time the schools had been implementing the CFS approach, key characteristics in the sampling of schools, are shown in Table A.4. In Nigeria, the Philippines, Thailand, and Nicaragua school visits were primarily conducted in schools in rural areas, reflecting the fact that the CFS approach is concentrated in rural areas in these countries. In South Africa, however, about half of the schools visited were in urban communities and half in rural areas. In Guyana, more than half of the schools (n = 15) were in rural areas, while about one-third of the schools visited were in riverain communities, or those that are on the bank of or near natural watercourses such as rivers. Table A.4. Number of Schools in Evaluation Sample by Key Characteristics
Nigeria South
Africa Philippines Thailand Guyana Nicaragua Total
Overall 23 25 25 25 27 25 150
School Locale
Urban 3 12 6 7 4 5 37
Rural 20 13 19 18 15 20 105 Riverain - - - - 8 - 8
Duration CFS
2 years or fewer 1 16 5 16 12 2 52
More than 2 years 22 9 20 9 15 23 98
Student, Teacher, and School head Sample Characteristics As we stated earlier, students, teachers, and school heads in each of the schools visited during this evaluation completed surveys. In each school, 100 students in grades 5 and higher were randomly sampled to complete the survey. Site visitors requested from school heads student or class lists and randomly selected students from these lists. In some cases, there were fewer than 100 students in grades 5 and higher, and in those situations, all available students completed the survey. In each school

140
as many as 25 teachers teaching grades 5 or higher were also randomly sampled to complete the survey. Finally, in each school visited during this evaluation, the school head was asked to complete the school survey. Note that in three schools in Nigeria the school head survey was not returned. The number of students, teachers, and school heads for whom we have survey data are presented in Tables A.5, A.6, and A.7, overall and by subgroups for which results are reported. Due to non-response on specific survey items, the number of cases included for particular survey items varies.
Table A.5. Student Survey Sample Size by Demographic Characteristics, Grade 5 and Higher
a
Nig
eria
South
A
fric
a
Phili
ppin
es
Th
aila
nd
Guyana
Nic
ara
gua
Female 881 1,119 1,076 950 720 540
Male 972 1,059 857 890 712 446
School Locale
Urban 295 1,155 586 544 250 357
Rural 1,570 1,070 1,347 1,301 948 648
Riverain - - - - 244 -
Grade
Grade 5 886 402 559 542 676 432
Grade 6 943 423 872 597 676 411
Grade 7 - 372 111 290 47 81
Grade 8 - 214 60 202 21 21
Grade 9 or higher - 783 331 214 8 52
Language of instruction the same as language used at home
Yes 495 1,611 979 292 1,201 963
No 1,353 575 942 1,546 229 20
Religion practiced at home the same as of most other students in school
Yes 1,033 1,167 1,241 1,540 805 607
No 766 878 642 299 570 320
Do not practice any religion 31 131 39 3 58 61 a Based on students in grades 5 and higher who were randomly selected in each school to take a student survey.
Table A.6. Teacher Survey Sample Size by Demographic Characteristics
Nig
eria
South
Afr
ica
Phili
ppin
es
Th
aila
nd
Guyana
Nic
ara
gua
Gender
Female 234 234 309 282 199 141
Male 139 117 35 81 35 5
School Locale
Urban 70 230 145 127 68 61
Rural 303 144 199 239 144 91
Riverain - - - - 27 - aBased on teachers who were randomly selected in each school to take a teacher survey.

141
Table A.7. School head Survey Sample Size by Gendera
Nig
eria
South
Afr
ica
Phili
ppin
es
Th
aila
nd
Guyana
Nic
ara
gua
Gender
Female 5 6 17 1 20 16
Male 17 17 7 23 6 8 aThe school head of each school was asked to complete a school head survey.
Table A.8. National and Regional-level Interviews Guyana
CPIC Monique Caring Hands Support Centre
National Commission on Disability (Ms. Beverly Pile)
St. Francis Community Developers (Alex M. Foster)
Comforting Hearts
Region 6 MOE School head
MOE Chief Education Officer (Mr. Tiwari)
Region 2 MOE School head
MoE School head of Education Planning (Evelyn Hamilton)
Nicaragua PROGEDES-CARE (Roberto Paramo – Project Officer)
EXCELENCIA, former IEAS coordinador (Lucrecia Davila- Facilitator)
EXCELENCIA (Dra. Jeannette Chavarría - Mujer y Adolescencia)
IPADE Instituto para el Desarrollo y la Democracia (Dionila del Carmen Guzmán - Proyecto Educación para la Ciudadanía y la Paz)
Regional MoE Officer for Northern Nicaragua (Martha Eudomilia)
ENACAL National Water Agency (María Soledad Guillén)
Nigeria World Bank, Abuja (Dr. Tunde Adekola, Senior Education Specialist)
JICA (Mr. Ayandele M. Kola, Education Expert; Ms. Naoi Suwa, Project Formulation Advisor)
Multi-lateral and National Partnerships Division, Policy, Planning, Management and Research Department, Federal Ministry of Education, Abuja (Mrs. Mariam Katagum, Deputy School head)
Federal Inspectorate Services, FME(Mr. D.C.U. Okoro, retired School head)
Oyo State Primary Education Board, Ibadan (Dr. Suleiman Adediran, retired Executive Chairperson)
Benue State Ministry of Education, former Executive Chairperson, Benue State Primary Education Board, Makurdi (Mrs. Lydia Utoo, retired Permanent Secretary)
National Institute for Educational Planning & Administration (NIEPA), Ondo (Professor Taiwo Ajayi, School head & CEO)
Policy, Planning Management and Research Dept., Federal Ministry of Education, Abuja (Dr. (Mrs.) Gladys Makoju - Acting School head)
Federal Inspectorate, Federal Ministry of Education, Abuja (Dr. Mrs. Lami Amodu, Head)
Nigerian Armed Forces (General Abdulsalami A. Abubakar - Former Military President, Commander-in-Chief) A major ally of UNICEF on CFSI and pioneer National Grand Patron on CFSI.
The Philippines AusAid (Dr. Linda Laige)
Senior Education Officer at the World Bank (Lynette Perez)

142
Table A.8. National and Regional-level Interviews (continued)
South Africa
UNICEF Paulpietersburg (Joyce Mbatha, contractor)Paulpietersburg District, KZN, South Africa
UNICEF (Andre Vivers, Education Specialist)
LINK for Community Development (Dr. Singh and Eric Radela)Kwamashu area, KZN, South Africa
Media in Education Trust (MIET) (Buhle Mngadi)Kwamashu area, KZN, South Africa (met at Engonweni School)
AREPPE Theatre for life—and NGO that travels the country with a theatre troupe raising awareness about children‘s
rights and HIV and other dangers
Catholic Institute for Education(CIE)—an NGO that runs ―Caring Schools‖, a program that supports Catholic schools
using the same principles as CFS
Health and Development Africa(HAD)—Consulting group in the area of health and development that is implementing
the ―Cycles of Support‖ model that tries to combine communities and schools.
Cooperating Investment Unit—Group that helps facilitate investment in schools to mitigate the HIV pandemic. They
look for a holistic model to support children, especially orphans and vulnerable children.
DOE- School head of the office of the Rights of the Child (Mary Mononela)
DOE - National School Safety Specialist (Charles Wilson)
DOE - National School Management and Leadership Programmer (Selaelo Makatu)
Thailand Mae Ai Legal Assistance Clinic
UNICEF (Rangsun Wiboonuppatum, Chief of Education and Andrew Morris, Deputy Representative)
Office of the Basic Education Commission (OBEC) (Dr. Kasama Vorawan- Secretary General)
Bureau of Policy and Planning (OBEC) (Dr. RangsunManeelek- School head)
Bureau of Academic Affairs and Educational Standards (OBEC) (Dr. Benjalug Namfa, School head)
Bureau for Innovative Development in Education (OBEC) (Dr. Orathai Moonkham, School head)
Country Site Visit Schedule The country site visits were conducted from June to August 2008, as shown in Table A.9. During a two-week period (in Nigeria it was three) in each country, AIR evaluators trained a team of local data collectors were trained, the entire team conducted the school-level data collections, and AIR conducted interviews with Ministry of Education (and other government), UNICEF, and advocacy groups. Table A.9. Country Site Visit Schedule
Country Site Visit Dates Nigeria June 16–July 4
Guyana June 23–July 4
Thailand June 30–July11
Philippines July 14–July 25
Nicaragua July 21–August 1
South Africa July 21–August 1
Delphi Study A modified Delphi Web survey was also developed for UNICEF education officers in countries implementing the CFS model. The Delphi technique is an iterative process wherein experts on the issue of interest are asked to provide ―independent forecasts of events they expect to occur, and to identify the assumptions on which they base their forecasts‖ (Stewart, Shamdasari, & Rook, 2007). This process is repeated until consensus is obtained or no further changes occur in participants‘ responses. AIR obtained e-mail addresses from UNICEF Headquarters for all education officers and cross-referenced this list with a list of all countries implementing CFS to ensure that we had the full list of eligible respondents. Respondents were asked to complete 34 multiple choice questions and 38 open-ended questions. Rather than addressing school-level topics, this survey addressed broader questions regarding the systemic management of CFS and further investigated findings that emerged from the six country site visits. Table A.10 presents the response rates by region for the Delphi process. As the table illustrates, we had about

143
55% of our total sample respond to the first round and 22% of our total sample respond to the second round. Table A.10. Response Rates for Delphi Study: UNICEF Education Officers
UNICEF Region Number contacted
Number responded (1
st Round)
Number responded (2
nd Round)
Central/Eastern Europe & Independent States
13 6 2
East Asia & Pacific 14 8 0
Eastern & Southern Africa 17 9 5
Industrialized Countries 2 1 0
Americas & the Caribbean 9 4 2
Middle East & North Africa 9 10 5
Regional Office for South Asia 7 3 2
Western & Central Africa 16 7 3
Total 87 48 19
Analysis of qualitative data Following the completion of all site visits, interview/focus group data and observation comments were coded by trained coders, using Atlas software and a coding scheme developed to provide a framework for subsequent analysis of stakeholders‘ perspectives on the purpose and implementation of CFS. The coding scheme was designed to capture the major issues addressed through the interviews and observations. Prior to use, the draft coding scheme was reviewed by UNICEF, which resulted in the addition of several codes. Throughout coding, codes were also added to capture issues that emerged from the data. The coding scheme enabled analysts to call up interview data based on single codes (e.g., Inclusiveness), as well as crossed codes (e.g., Inclusiveness and Professional Development), and to examine interview data by variables, such as school locale or years a school had been implementing the CFS approach. The team of coders was trained in how to reliably code the data. The training included discussion about the meaning and operationalization of each code and practice training on a set of interviews. Once trainers demonstrated an understanding of the codes, coding began. Each rater had primary responsibility for one respondent group (e.g., parent interviews), although coders communicated with one another and senior evaluation staff regularly on the meaning and operationalization of the codes. Inter-rater reliability checks were conducted several times a week to ensure consistent application of the codes. Survey and Observation Data: Scales and Treatment of Missing Data Completed surveys and observational protocols were scanned (surveys) or entered manually (observational protocols) into electronic files following data collection. As a first step, we calculated frequency distributions across response categories were calculated and reviewed the item-level data within and across countries. In order to provide meaningful information about the CFS schools we developed scales for reporting purposes. This involved combining items that measure similar and meaningful constructs. Table A.11 describes the scales created from the items in the surveys and observation checklists, including the number of items in each scale and reliability statistic. Only scales with reliabilities of at least .70 will be reported as scales. Items that did not fit into scales with sufficient reliability might be reported as individual items in the report.

144
Table A.11. Scale Descriptive for Survey and Observation Instruments
Student Survey Number of Items
Alpha
I. Challenging Student-Centred Learning Environment. The CSCLE scale measures how strongly students perceive that teachers and other adults in the school encourage the active engagement of students in the learning process and the academic success of all students, and feel that what they are learning is interesting. When students are actively engaged in their own learning and encouraged to do well, they are more likely to stay in school and succeed academically.
14 .79
II. Safe, Inclusive, and Respectful Climate The Safe, Inclusive and Respectful Climate scale measures how physically safe students feel, how emotionally safe students feel, and the extent to which students perceive the school to be inclusive of all types of students. Students who attend safe schools are more likely to be academically engaged and are less likely to exhibit problem behaviors or to drop out of school.
Among the 27 items in the SIRC scale, eighteen items measuring how physically and emotionally safe student feel in school comprise Physical and Emotional Safety scale. The reliability (alpha) is .77.
27 .83
III. Emotionally Supportive Climate. The Emotionally Supportive Climate scale measures how much students feel listened to, cared about, and helped by teachers and other adults in the school. Strong relationships between teachers and students lead to higher academic achievement, even for students who have previously done poorly in school or who come from disadvantaged backgrounds.
15 .74
Teacher Survey Number of Items
Alpha
I. Family and Community Participation. The Family and Community Participation scale measures the extent teachers perceive partnerships between schools and parents and other local community members have been formed. Specifically, this scale taps teachers‘ perceptions of whether parents support their children's school by becoming involved in school events and whether school officials encourage and welcome the input of parents and community members.
8 .71
II. Safe, Inclusive, and Respectful Climate. The Safe, Inclusive and Respectful Climate scale measures the degree to which teachers perceive their school's environment to be safe and inclusive for their students. Further, this scale measures teachers‘ perceptions of the level of trust and respect that exists both among teachers and between students and teachers.
15 .81
III. School Leadership. The School Leadership scale measures the degree to which teachers are involved in decision-making at their schools, how satisfied they are with their involvement, as well as teachers' perceptions of equity in decisions that are made by school leadership (e.g., the principal).
9 .79
IV. Child Participation. The Child Participation scale measures the level of student participation and engagement in school decision-making, as perceived by teachers.
3 .77
V. Support for Teacher Development and Pedagogy. The Support for Teacher Development and Pedagogy scale measures the level of professional support, such as feedback on teaching methods, resources to plan lessons and materials to implement the curriculum, and access to development opportunities, such as workshops, seminars and trainings, available to teachers at their schools.
10 .85

145
Table A.11. Scale Descriptive for Survey and Observation Instruments (continued)
School head survey Number of Items
Alpha
I. Family and Community Participation. The Family and Community Participation scale measures the school‘s efforts to involve families in their children‘s education, reach out to families with information and support, reach out to the community, and involve families and communities in school decision-making.
15 .77
II. Safe, Inclusive, and Respectful Climate. The SIRC scale measures the extent to which the school provides an environment in which students are physically safe; students of all types are respected and given equal access to, and opportunity to engage in, school activities, academics, and physical activity; and the school has policies and procedures in place to support a respectful climate.
16 .73
III. Healthy Learning Environment: Child-Centred Services. The Healthy Learning Environment: Child-Centred Services scale measures the extent to which the school provides academic and health and hygiene services that support students‘ well-being, including actions the school takes to reach out to students often left out of the educational process.
25 .89
IV. Child Participation. The Child Participation scale measures the extent to which students in the school are given opportunities for leadership roles, making decisions, and collaborating with peers.
4 .70
School Observation Number of Items
Alpha
I. Safe and Welcoming School Learning Environment. The Safe and Welcoming School Learning Environment scale measures the extent to which the school‘s architecture and design, and school policies, ensure the physical safety of students, thus creating an environment conducive to learning.
15 .76
II. Healthy Learning Environment: Hygiene and Sanitation. The Healthy Learning Environment: Hygiene and Sanitation scale measures the extent to which the school supports students‘ health and hygiene through proper hygiene and sanitation facilities and practices.
18 .87
III. Inclusive School Climate. The Inclusive School Climate scale measures the extent to which the school environment is designed to accommodate students with disabilities and from different cultural backgrounds, and strives to facilitate their full participation in the educational process.
6 .72
Classroom Observation Number of Items
Alpha
I. Safe and Welcoming Classroom Environment. The Safe and Welcoming Classroom Environment scale measures the extent to which the classroom‘s architecture and design ensures the physical safety and comfort of students, thus creating an environment conducive to learning.
12 .73
II. Child-Centred Pedagogy. The Child-Centred Pedagogy scale measures different aspects of teaching and classroom management techniques, including the teacher‘s use of child-centred teaching strategies, preparation of organized lesson plans, and the manner in which the teacher communicates and interacts with students.
17 .86
III. Inclusive Classroom Climate. The Inclusive Classroom Climate scale measures the extent to which the classroom accommodates particular groups of students in the classroom, such as male or female students, students with disabilities, or students from minority groups.
4 .76

146
Table A.12. List of Items in Scales
Student Survey
I. Challenging Student-Centred Learning Environment
Q49 When students master their lessons, they are given more challenging work.
Q51 The topics we are studying at this school are interesting.
Q64 Lessons at this school are boring. (R)
Q56 Every student is encouraged to participate in class discussions.
Q59 Teachers at this school will listen if you want to explain your answers in class or on assignments.
Q67 Students are encouraged to work together in class.
Q68 Students are encouraged to share their ideas and opinions in class.
Q12 I have given up on school. (R)
Q15 I want to complete secondary school.
Q20 Adults in the community encourage me to take school seriously.
Q23 Teachers and school staff believe that all students can learn.
Q44 Teachers at this school expect students like me to succeed in life.
Q52 Students at this school think that it is okay to cheat. (R)
Q53 Students at this school try to do a good job on their lessons, even if they are difficult or not interesting.
II. Safe, Inclusive, and Respectful Climate
Q24 I feel safe at my school.
Q25 I feel safe walking both to and from school.
Q26 I sometimes stay home from school because I am worried about my safety. (R)
Q30 This school is badly affected by crime and violence in the community. (R)
Q09 Students at this school help each other, even if they‘re not friends.
Q13 Students at this school treat each other with respect.
Q19 If students see another student being picked on, they try to stop it.
Q27 Students at this school like to put each other down. (R)
Q28 This school is being ruined by bullies. (R)
Q34 There are some students in this school who nobody talks to. (R)
Q35 There are some students at this school who everybody teases. (R)
Q36 Students at this school think it is okay to fight someone who insults them. (R)
Q42 Students at this school know how to disagree without starting a fight or an argument.
Q31 My teachers treat me with respect.
Q38 This school places a high value on understanding and respecting children‘s rights.
Q39 Teachers at my school say unkind things to students. (R)
Q41 Sometimes I do not want to come to school because of how the teachers treat me. (R)
Q45 Teachers at this school are interested in what students like me have to say.
Q21 I think that this school respects families like mine.
Q29 I look forward to coming to school.
Q32 Some types of students at this school are treated better than others by teachers and school staff. (R)
Q33 Both boys and girls have equal opportunities to succeed at this school.
Q43 This school is a welcoming place for all types of students.
Q46 When students break rules, they are treated fairly.
Q55 Adults in this school apply the same rules to all students equally.
Q63 I wish I went to a different school. (R)

147
Q65 The school is a welcoming and inviting place for families like mine.
III. Emotionally Supportive Climate
Q11 I can talk with at least one adult at school about things that are bothering me.
Q17 Teachers at this school really care about students like me.
Q69 It is difficult for students like me to get extra help from teachers. (R)
Q37 This school does a good job teaching students what they really need to know in life.
Q47 This school does not try to help students who are behind in their work to catch up. (R)
Q48 My teachers give me feedback on my assignments that help me to improve my work.
Q50 This school does a good job in preparing students to continue on for more education after they graduate.
Q54 Adults in this school are usually willing to give students extra help.
Q57 Teachers notice if I am having difficulty with my lessons.
Q58 Teachers give students opportunities to improve their work if they do poorly on an assignment.
Q60 Students at this school have the materials they need to support their learning.
Q62 I can talk to teachers or other adults at school if I am having problems in class.
Q22 My family knows what goes on inside this school.
Q66 Families like mine are involved in making decisions that affect this school.
Q61 Sometimes I am too hungry to pay attention in school. (R)
Teacher Survey
I. Family and Community Involvement
Q07 This school fails to involve parents in most school events or activities. (R)
Q11 At this school, it is difficult to overcome the cultural barriers between teachers and parents. (R)
Q14 The school is a welcoming and inviting place for parents.
Q15 Adults in the community support this school.
Q16 Lots of parents come to events at this school.
Q18 Adults in the community encourage youth to take school seriously.
Q21 Adults in the community know what goes on inside schools.
Q63 Families are involved in making decisions that affect this school.
II. Safe, Inclusive, and Respectful Climate
Q24 I feel safe at my school.
Q25 My students are safe at school.
Q26 This school is being ruined by bullies. (R)
Q27 This school is badly affected by crime and violence in the community. (R)
Q31 Crime and violence are or should be major concerns at school. (R)
Q23 Both boys and girls have equal opportunities to succeed at this school.
Q60 Some types of students at this school are treated better than others by teachers and school staff. (R)
Q64 This school is a welcoming place for all types of children.
Q05 At this school, students and teachers get along really well.
Q06 Students in this school help each other, even if they are not friends.
Q09 Teachers and students treat each other with respect in this school.
Q12 Teachers in this school treat each other with respect.
Q49 Teachers at this school help each other.
Q50 Teachers in this school trust each other.
Q61 This school places a high value on understanding and respecting children‘s rights.

148
III. School Leadership
Q08 At school, decisions are made based on what is best for students.
Q10 I trust the principal (school director) will keep his or her word.
Q13 The principal (school director) and other leaders in this school make good decisions.
Q17 The principal (school director) looks out for the personal welfare of school staff members.
Q28 I am satisfied with my involvement with decision-making at this school.
Q29 When students break rules, they are treated fairly.
Q30 School staff members have a lot of informal opportunities to influence what happens here.
Q32 The work rules at this school make it easy for teachers to do their jobs well.
Q54 School leadership provides teachers at this school with adequate support to continually improve their relationships with all types of students.
IV. Child Participation
Q19 Students are involved in helping to solve school problems.
Q20 In this school, students are given a chance to help make decisions.
Q33 The principal (school director) asks students about their ideas.
VI. Support for Teacher Development and Pedagogy
Q44 This school provides me with adequate resources to help every student in my class to succeed.
Q51 Teachers at this school are given ongoing opportunities to learn better techniques through workshops, seminars, or trainings.
Q52 I have been provided with professional development opportunities that have helped me to be a better teacher at this school.
Q53 School leadership provides teachers at this school with adequate support to continually improve their teaching methods.
Q55 Teachers at this school provide each other with helpful feedback to improve their teaching methods.
Q56 Students at this school have the materials they need to learn.
Q57 Teachers at this school have the resources they need to plan effective lessons.
Q58 Teachers at this school are provided with an effective curriculum to guide their teaching.
Q59 Teachers at this school have adequate opportunities to prepare their lessons.
Q62 I am unable to implement the curriculum as well as I would like because I don‘t have the right materials available. (R)
School Head Survey
I. Family and Community Involvement Q18 Staff from this school makes direct contact with families whose children drop out of school or are
at risk of dropping out to encourage the child‘s continued enrolment.
Q19 When students are absent from school for more than a few days, school staff makes direct contact with their families to find out what the problem is and to facilitate the child‘s return to school as soon as possible.
Q22 School staff regularly keeps families informed of student progress (at least twice during the school year).
Q23 School staff contacts families promptly if there are concerns about a student‘s learning or behavior.
Q24 School staff talks to families about how to help their children with their academic studies.
Q33 This school provides information about what is happening at the school to families in a language and format they understand (written or oral).
Q34 This school provides information to all families about school policies on bullying, harassment, and physical and sexual violence to families in a language and format they understand (written or oral).
Q38 All types of families are encouraged to participate in decision-making at this school, regardless of race, ethnicity, gender, language, disability, or religion.
Q40 The school conducts conferences with parents at least twice a year.
Q41 This school provides information on student progress to families in a language and format they understand (written or oral).
Q42 This school has an active Parent Teacher Association (PTA) or School Management Council (SMC).
Q32 This school actively informs the community about what is happening at the school at least several times a year.
Q36 This school includes community members on all decision-making and advisory committees.
Q37 This school provides training for community representatives on the school's decision-making or advisory committees.
Q39 This school has partnerships with local businesses or community organizations to support student learning.

149
II. Safe, Inclusive, and Respectful Climate Q53 The school is able to teach students how to protect themselves from risks in the community.
Q73 School grounds are kept free from weapons.
Q74 School grounds are kept free from drugs and alcohol.
Q75 School staff has been trained in managing emergencies that impact the school.
Q10 Boys and girls are equally permitted and encouraged to participate in school activities.
Q11 Boys and girls are equally permitted and encouraged to participate in academic classes.
Q12 Boys and girls are equally permitted and encouraged to participate in physical activity at school.
Q20 My school has a written policy on educating all students, regardless of race, ethnicity, gender, language, disability, or religion.
Q45 This school teaches students about the history, culture, and traditions of different ethnic groups in our country.
Q77 Students with disabilities are offered equal opportunities to participate in school activities.
Q08 There is a procedure in place for students to safely report instances of bullying, harassment, or harm from other students without fear.
Q09 There is a procedure in place for students to safely report instances of bullying, harassment, or harm from teachers without fear.
Q25 School staff talks to families about child labor and children‘s rights.
Q26 All teachers, students and parents have been told about the teacher code of conduct.
Q27 My school has a policy on appropriate teacher-student behavior.
Q28 This school has a policy prohibiting the release of student information or displaying or posting student information such as exam scores for the public to see.
III. Healthy Learning Environment: Child-Centred Services
Q14 This school screens students for learning disabilities, such as difficulty with reading or mathematics.
Q15 This school has teachers who have been specially trained to work with students with disabilities.
Q16 Staff from this school goes out into the community to encourage the enrolment of children with disabilities.
Q17 Staff from this school goes out into the community to encourage the enrolment of minority students, students living in poverty, or others at risk for poor educational outcomes.
Q49 This school recruits teachers who speak the home language(s) of the students.
Q50 Students at this school have daily contact with a teacher who speaks their home language.
Q57 The school provides job-readiness skills education to all students in grades 5 and up.
Q51 The school is able to make referrals to community-based providers of medical and mental health services that are not offered by the school.
Q52 The school is able to access child welfare services and other support systems for orphans and vulnerable children.
Q54 The school provides health education to all students regarding the avoidance of high-risk behaviors (e.g., HIV/AIDS education, prevention of substance abuse).
Q55 The school provides health education to all students in the promotion of healthy daily living (e.g., nutrition, dental hygiene).
Q56 The school provides education to all students in the development of positive social and emotional skills.
Q58 Student health and development programs are adapted to meet local socio-cultural norms, values, and beliefs.
Q59 The school provides students with access to annual health examinations.
Q60 The school provides students with access to annual mental health screening.
Q61 The school provides micronutrient supplements to students who need them.
Q62 The school provides de-worming treatment of parasitic infections to students who need them.
Q63 The school provides routine vision and hearing screenings to students, and refers students to free or affordable follow-up services if needed.
Q64 The school uses height/weight screening to identify malnourished children.
Q65 The school has a feeding program for under-nourished students. [Mark Very True if the program is provided to all students]
Q66 Students have an opportunity to eat at least every 4 hours while at school.
Q68 Students are allowed access to latrines and drinking water whenever they need them (not only at specified times).
Q71 The school‘s water supply is checked regularly to ensure that it is always safe for drinking.
Q72 The school follows procedures to reduce the presence of disease vectors (e.g., mosquitoes) on or near school grounds.

150
Q76 There is at least one staff member present at all times who knows basic first aid.
IV. Child Participation
Q29 Students play a formal role in decision-making at school (for example, through student government).
Q30 Students at this school plan and implement community outreach activities.
Q31 Students at my school have opportunities to serve in leadership roles, such as a member of the student council, governing board, or prefect.
Q46 Students regularly take part in activities like group projects, field trips, group brainstorming, etc.
School Observation
(GO= General Observation; IA = Indoor Areas; OA = Outdoor Areas.)
I. Safe and Welcoming School Learning Environment
GO1 Students are protected from access by unauthorized adults while at school.
GO2 Students are within sight or hearing of school staff at all times except for brief periods (e.g., when using the latrine).
GO3 Students are not permitted to roam the hallways or school grounds when class is in session.
GO4 Students are not permitted to leave school grounds without the knowledge and permission of school staff.
GO5 Older students do not have unsupervised access to younger students while on school grounds (except siblings or other close family members).
GO6 School buildings are in good structural condition.
GO7 School buildings are in good physical condition (e.g., no peeling paint, broken windows, etc.)
GO21 Students have adequate space to work and play without being disturbed by others.
IA2 Toxic materials (e.g., cleaning chemicals) are kept inaccessible to students at all times.
IA3 The school keeps a stocked first aid kit accessible at all times.
OA1 If the school is located near a road, there is a physical barrier between traffic and school grounds.
OA2 School buildings and grounds have a welcoming appearance.
OA3 Examples of student work or achievements are displayed in common areas.
OA9 Outdoor play areas and equipment are safe and in good repair.
OA10 Students are protected from the elements while using outdoor play areas (e.g., protected from excessive sun, dust, rain, or wind).
II. Healthy Learning Environment: Hygiene and Sanitation
GO8 Students and staff have ongoing, easy access to drinking water.
GO10 Functioning sinks with soap are located close to latrines.
GO12 Latrines are designed to allow students privacy.
GO13 There is an adequate number of functioning latrines available so that students do not have to wait an excessive amount of time to use them.
GO14 Latrines are safe and in good repair.
GO15 Latrines are accessible to classrooms.
GO16 Latrines and sinks are clean and sanitary.
GO17 Students and staff wash their hands after using latrines.
GO18 Students and staff wash their hands prior to eating or handling food.
GO19 Functioning sinks with soap are located close to food preparation areas.
GO20 Any food prepared and served at school is prepared and stored in sanitary conditions.
IA1 The school buildings are clean.
IA4 School buildings provide adequate protection from the elements (rain, heat, cold, wind, dust)
OA4 The school grounds are kept free of litter and garbage, except in designated containers.
OA5 The school grounds are kept free of unwanted animals and animal waste (e.g., stray dogs). Any school pets are kept in sanitary conditions.
OA6 The school has a sanitary system for the disposal of waste water.
OA7 The school has a sanitary system for the disposal of latrine waste.

151
OA8 Smoking is prohibited on the school grounds.
III. Inclusive School Climate
GO9 Drinking water is accessible to students with disabilities.
GO11 Latrines and sinks are accessible to students with disabilities.
GO22 All school buildings and classrooms are accessible to students with physical disabilities.
GO23 Students with disabilities are grouped with non-disabled students whenever possible.
GO24 Students are not separated into different groups for instruction or school activities based on cultural or social background (with the exception of language instruction or transitional programs if needed). (Mark Not Applicable where it is the norm for older boys and girls to be kept separate from one another).
OA11 All outdoor play areas are accessible to students with physical disabilities.
Classroom Observation
I. Safe and Welcoming Classroom Environment
A1 The classroom is protected from the elements (solid roof, walls, and floor).
A2 The classroom has adequate ventilation.
A3 The classroom is a comfortable temperature.
A4 The classroom lighting is adequate for students to work.
A5 The classroom is clean and orderly (the floor is clean, the tables are orderly, no garbage on the floor).
A6 Outside noise does not affect communication within the classroom.
A7 Students each have sufficient space to work.
A8 Students each have a chair or bench to sit on while working.
A9 Furniture is of the right size for students to work comfortably.
A10 There is a blackboard/whiteboard in the classroom that all students can see clearly from their seats.
A11 Posters, artwork, or maps (commercially produced or handmade) appear on the walls of the classroom.
A12 There are examples of student work or projects visible in the classroom.
II. Child-Centred Pedagogy
P13 The teacher presents lessons in a well-prepared and organized manner.
P14 The teacher maintains an engaging class, without pressuring the students.
P15 The teacher facilitates discussions among students.
P16 The teacher gives the students the opportunity to present their work to the rest of the class in groups or on their own. [Ask teacher for examples if not observed.]
P17 The teacher asks questions that facilitate higher order thinking activities (e.g., application, analysis, synthesis, and evaluation, etc).
P18 The teacher relates information presented in the lesson to students‘ lives outside of the classroom, or to life skills or social emotional learning.
P19 While the students are working, the teacher moves around the classroom to provide support and guidance.
P20 The teacher addresses students by name.
P21 The teacher communicates both verbally and nonverbally in a positive and friendly manner.
P22 The teacher interacts with the students in a respectful manner.
P23 The teacher uses positive methods to manage student behavior.
P24 The teacher adapts lessons for student with special learning needs. [Ask teacher for examples if not observed.]
P25 The students pay attention when the teacher gives them instructions.
P26 The students ask the teacher questions.
P27 The majority of the students participate in class activities. [Note any observable patterns of non-participation (girls, minorities, etc.) in comments].
P28 The students spend little time (less than 20%) copying the lesson literally from the textbook or chalkboard into their notebooks.
P29 The students interact with the teacher in a respectful manner.
III. Inclusive Classroom Environment
I30 In general, boys and girls receive equal time and attention from the teacher.

152
I31 The teacher shows similar expectations for both boys and girls (e.g., asks questions of similar difficulty).
I32 In general, students receive equal time and attention regardless of their background (e.g., ethnicity, religion, language, etc). [Leave blank and note in the comments section if cannot identify these students by observation.]
I33 The teacher encourages and supports participation by struggling students. [Leave blank and note in the comments section if cannot identify these students by observation.]
(R) Reverse Scored Item
Missing data are always an issue in social science research. Individuals do not always respond to every question asked. Our goal in treating missing data was to retain as many data as possible without compromising the validity of our interpretations. The following steps were taken to address missing data in the surveys and observation protocols. Surveys.
Inclusion of Cases, Students who answered at least 50% of the 62 survey items were included in the analysis. In total, 31 students (0.3%) were excluded from the master data set. Teachers who answered at least 50% of the 60 survey items were included in the analysis. In total, 2 teachers (0.1%) were excluded from the master data set. All the school heads were included in the master data file, because all answered at least 50% of the survey items (36 items). Imputation of Missing Responses to Survey Items. Data for missing responses to survey items (not demographic items) were imputed. Reliability. Reliability statistics were calculated before and after imputation. For the student survey, the reliability statistics before and after imputation were identical. Reliability statistics for the teacher survey and school head survey are shown below.
Table A.13. Teacher Survey: Reliability Statistics Before and After Imputation
α Before Imputation
α After Imputation
Family and Community Participation .71 .71
Safe, Inclusive, and Respectful Climate .81 .80
School Leadership .79 .79
Child Participation .78 .77
Child-Centred Pedagogy (not used in analyses) .45 .44
Support for Teacher Development and Pedagogy .85 .85
Table A.14. School head Survey: Reliability Statistics Before and After Imputation
α Before Imputation
α After Imputation
Family and Community Participation .77 .78
Safe, Inclusive, and Respectful Climate .73 .70
Healthy Learning Environment: Child-Centred Services .89 .89
Child Participation .70 .71
Teacher Development and Involvement (not used in analyses) .67 .67
School and Classroom Observations. Our assumption is that, when data are missing for an item on the observation protocol, the action or characteristic was not observable or applicable during the observation. Therefore, imputation was not used. When calculating the scale mean for each case, we calculated the mean of the valid (completed) items contained in the scale. When reporting the percentage of responses to individual items, we calculate the valid percentage of responses. Standards In order to make judgments about how well Child Friendly Schools perform on the various dimensions measured and reported in chapter 2, it was necessary to set standards to guide the interpretation of the results. Standard setting is essentially a two-part process. The first part is the development of descriptions of different levels of performance (Performance Level Descriptors) on a particular dimension. These are essentially the characteristics that we deem necessary for a student, for example, to be at a certain level

153
on a particular dimension. The second part of standard setting is establishing cut scores on the scale that differentiate one level from the next. Standard setting is common practice in educational testing, and there are numerous methods by which to set cut scores. The method used to set standards for this evaluation is a variation of the Yes/No method pioneered by (Plake, Ferdous, Buckendahl, & Impara, 2005). The standards were developed by a panel that included members of AIR‘s evaluation management team and two of site visitors, taking into consideration internationally established standards for school health and safety, an understanding of the impact of aspects of the school climate on student outcomes, and best practices for creating a school environment that fosters students‘ active engagement and improved learning outcomes. Panel members have expertise in education, promoting youth development, gender in education, child rights, disability rights, conditions for learning, and experience working in developing countries. Performance Level Descriptors were developed for each scale on the student, teacher, and school head surveys, and the school and classroom observation protocols. The three levels—Excellent, Satisfactory, and Needs Improvement—for each scale describe what ―performance‖ on that particular category comprises. The determination of ―cut scores‖ to differentiate one level on a scale from the next was accomplished in two rounds. In round 1, panel members independently examined each survey statement and response category (e.g., a little bit true) and determined whether that statement and response indicated that the respondent was at the ―needs improvement‖ level, ―satisfactory level,‖ or ―excellent‖ level. Ratings given by all panel members were tallied and the cut scores calculated. In round 2, the panel convened and discussed the survey statements on which there was disagreement. Although it was not necessary for all panel members to agree on how a statement/response should be rated, the purpose of the discussion was to provide panelists‘ an opportunity to ensure that there was a common understanding of the standards. Some ratings were changed in this process. The cut scores were recalculated based on the revised ratings from round 2.

154
APPENDIX B: HIERARCHICAL LINEAR MODELING ANALYSIS
One way to treat nested data is to disaggregate them from a higher to a lower level. For instance, we may want to examine the effects of student and teacher characteristics on student achievement. Students from the same classroom are likely to have different individual characteristics, such as attitudes toward schooling or socioeconomic status, but the same classroom characteristics, such as teacher experience and teacher certification status. In multiple regression, the teacher characteristics, which are at a higher level since they are associated with the classroom, are assigned the same values at the lower student level for all students in a classroom. An analysis is conducted by regressing a dependent achievement variable (i.e., student achievement) on each of these independent variables (i.e., student attitudes toward schooling, student socioeconomic status, teacher experience, and teacher certification status) at the student level in what is termed a total regression (Kreft & de Leeuw, 1998). This approach, however, renders the student-level variables dependent on each other for the classroom-level variables (i.e., the disaggregated teacher characteristics) that they share, thus violating the assumption in regression analysis of independence of observations. Another way to treat nested data is to aggregate them from a lower to a higher level. In the example above, the student-level data can be aggregated to the classroom level by using the mean values for the students (i.e., mean attitude toward schooling and mean socioeconomic status). This is followed by a regression of the higher-level variables (i.e., aggregated student-level variables and the teacher characteristics) on mean student achievement in what is called an aggregated regression (Kreft & de Leeuw, 1998). The problem with this approach is that it ignores the student-level variation, since the aggregated data set only includes mean scores for the students, and lowers statistical power by using a smaller number of cases. Hierarchical linear models solve the problems of the total regression and aggregated regression approaches by treating variables at their respective level of measurement (e.g., student or classroom level). HLM accounts for the fact that the variances at the student level (―within classrooms‖) are different from those at the classroom level (―between classrooms‖). Such models allow for the analysis and pooling of regressions for each classroom that take into consideration the clustering of students. Specifically, hierarchical analysis estimates statistics for each unit of a hierarchical structure, using data from that unit while borrowing strength from the information available on all units (Willms, 1995). In this way, HLM allows researchers to investigate contextual aspects of social outcomes at different levels (e.g., classroom and school levels). The primary assumption underlying traditional regression techniques is the independence of observations, or the assumption that an observation for an individual is not systematically related to the observation of another individual. However, this assumption is violated when examining individuals nested within the same families, classrooms, schools, or communities. Another difference between traditional regression techniques and HLM is the statistic of interest. Within both techniques, researchers typically examine variance, or the spread or distribution of a group of numbers, or data points. In regression, the overall percentage of variance in the dependent variable explained by independent variables is one of the primary statistics of interest. However, with HLM, the variance is first divided into within-school and between-school components. The proportion of variance explained by predictor variables is then examined at each level. Because traditional regression analyses do not partition variance in this manner, they may also lead to biased estimates of school effects. In sum, the introduction of HLM to educational research has resolved the ―level-of-analysis problem,‖ in which researchers debate the appropriateness of examining outcomes at the student, school, or community level. Now researchers are able to model independent (i.e., explanatory) variables at different levels of aggregation on individual social outcomes.

155
It is important to note, however, that these analyses do not attempt to assess the impact of CFS, since we lacked a comparison group. However, neither regression nor HLM allows researchers to specify causation; with these techniques, we can only conclude that variables are associated with or related to one another but not that one variable causes another. What Are the Statistical Models Guiding These Analyses? The present study sought to unpack the relationship between CFS programming components, including Architecture and Services, Inclusiveness, Pedagogy, and Participation and Governance, and students‘ perceptions of school climate, specifically SIRC, CSCLE, and Emotionally Supportive Climate. Student demographics and school characteristics were also included as independent variables in analytic models. Prior to conducting our analyses, Pearson product-moment correlations were first calculated to assess the degree to which student outcomes were related to student-level and school characteristics. Correlation coefficients are a common and useful statistic as they describe both the direction and magnitude of the relationship between two variables. Next, HLM techniques were used to examine the relationship between CFS programming components, as well as student demographics and school characteristics, and students‘ perceptions of school climate. Three sets of multilevel analyses (one for each outcome variable) were specified with student demographics entered at Level 1 and variables representing CFS programming components and school-level characteristics entered at Level 2. Table B.1 presents information on each of these variables. As Table B.1 illustrates, dummy-coded variables, wherein a 1 indicates that the person or school is a member of that category and a 0 indicates otherwise, included student demographics (i.e., female gender, absences due to work)
54 and most school characteristics (e.g., urban locality). Dummy-coded
variables specified at both levels were not centred and were entered as fixed effects. In HLM, independent variables that are dummy-coded are typically entered as uncentred, a method that is particularly useful when zero is a meaningful point on a predictor scale. Continuous variables entered at Level 2 (e.g., years of CFS implementation) were centred around the overall mean (usually referred to as ―grand-mean centering,‖ wherein one subtracts the mean for the entire sample from each observation in the sample). In social science research, continuous variables are entered in statistical models as either group or grand-mean centred because a value of 0 is often not a meaningful point on continuous predictor scales (using uncentred variables can lead to difficulties interpreting results).
54
In the student survey, students were asked, ―During the past year, how many days did you have to miss school in order to work or to help out at home?‖ Students had four response options: never, 15 days or less, 16 to 30 days, or more than 30 days. In order to dummy-code the variable, students who responded ―never‖ were coded as 0, whereas students who indicated that they had missed 1 or more days due to work or family obligations (i.e., selected one of the other three responses) were coded as 1.

156
Table B.1. Independent Variables by Level Outcome variable for the first set of analyses: SIRC Outcome variable for the second set of analyses: Challenging Student-Centred Learning Environment Outcome variable for the third set of analyses: Emotionally Supportive Climate
Predictors for all three set of multilevel analyses Coding for Categorical
Variables Centring for Continuous
Variables
Level 1 student characteristic variables
Gender dummy coding -
School type effect coding -
Self-reported grades effect coding -
Miss school to work - -
Level 2 CFS programming elements
Inclusiveness
Inclusive School Climate (Sch) - grand mean
Inclusiveness in Classroom (C) - grand mean
Architecture and Services
Safe and Welcoming School Learning Environment (Sch) - grand mean
Safe and Welcoming Classroom Environment (C) -
grand mean
Healthy Learning Environment: Hygiene and Sanitation (Sch) -
grand mean
Healthy Learning Environment: Child-Centred Services (D) - grand mean
Participation and Governance
Family and Community Participation (T) -
grand mean
Child Participation (T) -
grand mean
Level 2 school characteristics
Locality dummy coding -
CFS implementing years - grand mean
Country effect coding -
(Sch) = School Observation; (C) = Classroom Observation; (T) = Teacher Survey; (D) = School head Survey.
It is important to note also that, since analyses were conducted across (rather than within) countries, scale scores for the four CFS programming components were entered as aggregate scores. However, categorical variables entered at Level 2 (i.e., school type and grades) were effects coded, in a technique that is similar to dummy coding, with the exception that the comparison group is identified by the number -1 rather than 0, as in dummy coding.
55 Instead of comparing each group to a referent group, effects-
coded variables compare each group to the mean of all groups (McClendon, 1994). This coding technique is most appropriate when there is no theoretical basis from which to choose a reference group. For each of the three dependent variables (SIRC, CSCLE, and Emotionally Supportive Climate), the theoretically conservative and statistically rigorous method of block entry was used (Cohen & Cohen, 1983).
55
In the present study, school level is defined as Primary, Middle, or High. On the student survey, students were asked to identify the grade they currently attend. Students in grade 5 were categorized as Primary level, students in grades 6 through 8 as Middle level, and students in grades 9 through 12 as Secondary level. Students were also asked to identify ―what kind of grades [they] usually [got],‖ and could select one of four options: mostly excellent, mostly good, mostly fair, mostly poor/failing. Due to the small number of students who selected the last two categories, students who selected ―mostly fair‖ or ―mostly poor/failing‖ were combined to form one category.

157
The block-entry method also permits researchers to statistically control for potentially confounding independent variables and to isolate the unique effects of predictors on outcomes of interest. In total, seven models were specified, beginning with a null model (Model 0). The null model determines the extent to which observations within classes are correlated. It also permits us to partition the variance in the outcome, in this case, students‘ perceptions on SIRC, CSCLE, and Emotionally Supportive Climate, into within-class and between-class components. This tells us how much of the variation in students‘ scores on these scales is due to individual factors, such as gender, and how much of the variation is due to differences between classroom and school characteristics (Level 2 variables). Six subsequent comparative models were then specified, each building on the previous with the addition of a ―block‖ (or group) of conceptually linked independent variables. In this way, we were able to measure the unique proportion of variance in the three outcomes, which is explained by each block of independent variables. Model 1 included female gender, primary school level, middle school level, good grades, excellent grades and whether students missed school due to work. The final Level 1 model for each of the three outcomes is specified below. (Eq. 1) SIRC_Sij = β0j + β1j (Female ij) + β2j (Primaryij) + β3j (Middle ij) +
β4j (Grades_Goodij) + β5j (Grades_Excellentij) + β6j (Work ij) + γij
(Eq. 2) CSCLE_Sij = β0j + β1j (Female ij) + β2j (Primaryij) + β3j (Middle ij) + β4j (Grades_Goodij) + β5j (Grades_Excellentij) + β6j (Work ij) + γij
(Eq. 3) Emotionally Supportive Climate_Sij = β0j + β1j (Female ij) + β2j (Primaryij) + β3j (Middle ij)
+ β4j (Grades_Goodij) + β5j (Grades_Excellentij) + β6j (Work ij) + γij
In these models, two subscripts are used to represent the two levels of analysis—the student and the school. On the left side of the equation is the observed value of outcome S for student i nested within school j (e.g., SIRC_Sij). The intercept term (β0j) is also assigned a subscript, j, to represent ―the school effect‖ or its variability from school to school. The intercept is the average scale score (SIRC, CSCLE, or Emotionally Supportive Climate) within schools. In addition to the intercept, the two-level model used in HLM also allows for the slope of an independent variable (β1j) to vary from unit to unit (in this case, schools), as attending a particular school may have differential impact on the association between an independent variable and the outcome. In these models, β1j, β2j, β3j, and so on, represent the regression slopes, or average effects, of the outcome variables (Sij) on the independent variable listed parenthetically within group j. Finally, the error term (γij) denotes the person and group-specific residual variance in the outcome left unexplained by the independent variables.
In HLM, the intercepts and slopes from the predictors entered at the first level also serve as dependent variables at the second level. In the present study, the dependent variable from Level 1—students‘ average scores on one of three scales—was modeled as a function of variables representing CFS programming components, country, and school-level characteristics at Level 2. This portion of the analysis demonstrated how these school-level variables conditioned the effects of variables entered at Level 1 (student demographics) on the outcome variables. The slopes of Level 2 variables were specified as random in order to test the effects of average levels of these variables across groups. In Model 2, two variables representing Inclusiveness within the school and classroom were included. Model 3 included four variables representing Architecture and Services, specifically the extent to which schools and classrooms created safe, healthy, and welcoming environments for students and school heads‘ perceptions of the services available to students. Model 4 included Pedagogy, specifically teachers‘ perceptions on effective pedagogy within their classrooms. Model 5 included two variables representing Participation and Governance within the schools, specifically teachers‘ perceptions of student, family, and community involvement within their schools. Model 6 included school characteristics, such as locality, years of CFS implementation, and country.

158
The final Level 2 model is specified below (note that it is identical for each of the three outcomes):
(Eq. 4) β0j = γ00 + γ01 (ISE_Schj) + γ02 (IC_Cj) + γ03 (SWE_Schj) + γ04 (SWCE_Cj) + γ05
(HSE_Schj) + γ06 (SS_Dj) + γ07 (EP_Cj) + γ08 (FCI_Tj) + γ09 (SI_Tj) + γ010 (SouthAfricaj) + γ011
(Philippinesj) + γ012 (Thailandj) + γ013 (Nicaraguaj) + γ014 (Guyanaj) + γ015 (Localityj) + γ016
(CFSyearsj) + µ0j
β0j is the average scale score within school j. The mean outcome or scale score across schools is represented by γ00. The average impact of independent variables on student scale scores across schools is represented by γ02, γ03, γ04, and so on. Finally, µ0j represents the unique effect of school j on mean scale scores. Variance Calculations. As described earlier, the multilevel modeling process also provided estimates of variance that permit researchers to calculate the proportion of variance in student outcomes that are attributable to predictor variables (see also Raudenbush & Kim, 2002; Snijders & Bosker, 1999). For each analytic model, percentages of total variance, between-school variance, and within-school variance uniquely explained by that model (in comparison to the variance explained by the null model) are calculated and presented. Intraclass Correlation. As we noted earlier, the null model partitions variation in the dependent variable into two components: between-class and within-class. The null model serves as a baseline for comparison for later, more complex models that include predictors at the student and class and school levels. The intraclass correlation (ICC), a statistic that measures the degree of similarity among the outcomes of students in the same school, is calculated by dividing the between-class variance by the total variance for each model. It is an important statistic to consider because students clustered within the same class or school may be more similar to one another than to students clustered together within other schools, as students in the same class are likely to share a number of social and economic characteristics. Estimates of ICC in multilevel analyses predicting students‘ perceptions on SIRC, CSCLE, and Emotionally Supportive Climate were calculated for the null model, to establish the amount of variation in students‘ scores for each scale that is between classes. ICC values are as follows: SIRC = 0.349; CSCLE = 0.228; and Emotionally Supportive Climate = 0.251. What do these numbers imply about the possible reasons behind variation in student outcomes for this study? These ICC values suggest that about 35% of variation in students‘ scores on SIRC is attributable to between-class differences, while about 23% of students‘ scores on CSCLE and 25% of scores on Emotionally Supportive Climate can also be attributed to between-class differences. This means that there is considerable variation in the outcome variables (students‘ scores on the three scales) that could be explained using within-school or within-class variables, which comprise many of the predictors that we have included in this study. This degree of between-class variation is consistent with previous cross-national studies using multilevel techniques to predict child outcomes, such as school achievement, well-being, problem behaviors, and alcohol use, and this variation highlights the contributions of the school environment to student outcomes (e.g., Sellström & Bremberg, 2006; Willms & Somers, 2001). The fact that the ICC value for SIRC is notably higher value compared to the ICC values for CSCLE and Emotionally Supportive Climate suggests that a larger proportion of variation of individual differences in SIRC is conditioned by differences between schools. Correlations Table B.2. presents correlation coefficients for outcome and continuous predictor variables entered in analytic models. As we mentioned earlier, correlations between the dependent variables and predictors were calculated to measure the degree to which two variables are associated. Correlation coefficients can range from -1 to +1. A correlation of 0 indicates that there is no relationship. A negative correlation (-1) indicates an inverse relationship between two variables, whereas a positive correlation indicates that, as scores increase on one variable, scores also increase on the second variable.

159
Table B.2. Correlations Between Outcome and Predictor Variables
SIRC
(S)
CSCLE
(S)
SS
(S)
CFS
Years
ISE
(Sch)
IC
(C)
SWE
(Sch)
SWCE
(C)
HSE
(Sch)
SS
(D)
EP
(C)
FCI
(T)
SI
(T)
SIRC_S 1
CSCLE _S 0.83* 1
SS_S 0.81* 0.87* 1
CFS years 0.20* 0.17* 0.21* 1
ISE_Sch 0.20* 0.05 0.01 0.12 1
IC_C 0.14 0.11 0.07 0.06 0.33* 1
SWE_Sch 0.27* 0.16 0.10 0.30* 0.43* 0.44* 1
SWCE_C 0.27* 0.15 0.14 0.10 0.37* 0.30* 0.47* 1
HSE_Sch 0.23* 0.09 0.06 0.17* 0.56* 0.32* 0.51* 0.51* 1
SS_D 0.34* 0.19* 0.17* 0.07 0.25* 0.08 0.31* 0.16 0.32* 1
EP_C 0.37* 0.27* 0.29* 0.28* 0.40* 0.52* 0.51* 0.38* 0.34* 0.25* 1
FCI_T 0.58* 0.47* 0.46* 0.22* 0.29* 0.16* 0.38* 0.21* 0.30* 0.44* 0.40* 1
SI_T 0.55* 0.38* 0.43* 0.28* 0.36* -0.01 0.26* 0.23* 0.29* 0.35* 0.30* 0.70* 1
(Sch) = School Observation; (C) = Classroom Observation; (S) = Student Survey; (T) = Teacher Survey; (D) = School head Survey.
* Correlation is significant at the 0.05 level (2-tailed).
As Table B.2. illustrates, correlations between independent variables used to predict each of three outcome variables were weakly to moderately related to one another. With the exception one relationship, the majority of these associations were also positive, indicating that, as scores for one variable increased, scores on the second scale also increased. The strongest relationships, as indicated by their correlation coefficients, are between teachers‘ perceptions of Child Participation (SI_T) and teachers‘ perceptions of Family and Community Participation (FCI_T) (r = 0.70, p <. 05) and school observation ratings of Inclusive School Climate and Healthy Learning Environment: Hygiene and Sanitation (r = 0.56, p < .05). Correlations between the three outcome variables were also examined. As expected, the outcomes were positively and strongly correlated (r = .81 - .83, p < .05), suggesting that students‘ scores on SIRC were significantly associated with their scores on CSCLE and Emotionally Supportive Climate (and vice versa). Finally, correlations between each of the three outcomes and independent variables were examined. Although SIRC was weakly to moderately correlated with most predictors (exception: IC_C, Inclusive Classroom Climate, r = 0.14), CSCLE and Emotionally Supportive Climate were not significantly correlated with most predictors drawn from the school and classroom observations, including safe and welcoming school and classroom environments and inclusiveness in the school and classroom. Descriptive Statistics for Student Outcomes Table B.3. presents the frequencies of student characteristics (Level 1 variables) and school and community characteristics (Level 2 variables), which were also included as predictors in this analysis. As it shows, an equal percentage of male and female students (grades 5 and above) were sampled to complete the student survey. Further, although about one-third of the sample consisted of primary school students (grade 5), slightly over half of the sample consisted of middle (lower secondary) school students (grades 6-8) and about 13% of students were at the secondary level (grades 9-12). More than half of the students reported receiving ―good‖ grades, while about 20% reported receiving either ―excellent‖ or ―fair/failing‖ grades. About 23% of students reported having to miss school at least once due to work or family obligations. Table B.3. also presents the frequencies on school characteristics. Approximately three-fourths of the schools sampled are categorized as rural or riverain.
56 Data on school locales were collected by
56
Riverain communities are defined as those that are on the bank of or near natural watercourses such as rivers. Since this category exists only in Guyana, riverain schools were combined with rural schools for multilevel analyses.

160
observers in the field. However, UNICEF country offices were given the opportunity to verify schools‘ placement in these categories prior to data analysis. Finally, within each country, AIR sampled 25 schools to participate in the evaluation. Due to a teachers‘ strike, only 23 site visits were conducted in Nigeria. In Guyana, however, since the majority of schools visited were rural or riverain, two additional schools were sampled from urban communities to make the sample more representative.
Table B.3. Frequencies of Student and School Characteristics
N count (%)
Level 1 Student Characteristic Variables
Male 5,170 (51.8)
Female 4,820 (48.2)
Primary school student 3,399 (34.0)
Middle school student 5,237 (52.5)
Secondary school student 1,338 (13.5)
Self-reported grades good 5,545 (55.5)
Self-reported grades excellent 2,155 (21.6)
Self-reported grades fair/failing 2,290 (22.9)
Need to miss school to work/family obligations 2,356 (23.6)
Do not need to miss school to work 7,634 (76.4)
Level 2 School Characteristic Variables
Urban 37 (24.7)
Rural/riverain 113 (75.3)
Nigeria 23 (15.2)
South Africa 25 (16.7)
Philippines 25 (16.7)
Thailand 25 (16.7)
Nicaragua 25 (16.7)
Guyana 27 (18.0)
Table B.4 presents descriptive statistics for the three student outcomes (dependent variables). Mean scale scores for each of the three outcome variables were quite high (possible values ranged from 1 to 4). This table also presents descriptions of the key predictors (or independent variables). These values were also moderately high (survey scale values ranged from 1 to 4; school and classroom observation scale values ranged from 1 to 3).

161
Table B.4. Descriptive Statistics for Outcome and Predictor Variables
Outcome Variables Mean Std. Dev.
Safe, Inclusive, and Respectful Climate (S) 3.183 0.270
Challenging Student-Centred Learning Environment (CSCLE) (S) 3.442 0.232
Emotionally Supportive Climate (S) 3.193 0.240
Predictors
Inclusiveness
Inclusive School Climate (Sch) 2.402 0.522
Inclusiveness in Classroom (C) 2.836 0.262
Child-Centredness: Support for Students and Healthy, Safe and Protective Learning Environments
Safe and Welcoming School Learning Environment (Sch) 2.518 0.296
Safe and Welcoming Classroom Environment (C) 2.680 0.238
Healthy Learning Environment: Hygiene and Sanitation (Sch) 2.489 0.344
Healthy Learning Environment: Child-Centred Services (D) 2.823 0.500
Child-Centredness: Pedagogy
Child-Centred Pedagogy (C) 2.671 0.255
Democratic Participation
Family and Community Participation (T) 3.257 0.344
Child Participation (T) 3.149 0.453
Years of Implementing CFS 4.140 2.807
(Sch) = School Observation; (C) = Classroom Observation; (S) = Student Survey; (T) = Teacher Survey; (D) = School head Survey.
Summary of Results Table B.5 summarizes the effects predictors had on the student outcomes modeled in this analysis.
57 A
plus sign (+) denotes a statistically significant and positive relationship between the independent variable and the outcome; a minus sign (-) denotes a statistically significant and negative relationship; NS indicates that there was no significant relationship between the independent variable and the outcome. Following the table is a description of these findings.
57
Many of the predictors used in this analysis simplify rather complex constructs. This simplification could have affected the size of the impacts that predictors had on student outcomes, as well as their levels of significance, leading to an underestimation or overestimation of the magnitude of relationships between predictors and outcomes (also referred to as ―effect sizes‖).

162
Table B.5. Summary of Effects on Key Student Outcomes SIRC CSCLE Emotionally
Supportive Climate
Student Characteristics Female + + +
Primary - - NS Middle Secondary
+ NS
NS NS
+ NS
Fair/Poor Grades Good Grades
- NS
- +
- +
Excellent Grades + + +
Miss school due to work - - -
Inclusiveness Inclusive School Climate NS NS - Inclusive Classroom Climate NS NS NS
Child-Centredness: Support for Students and Healthy, Safe and Protective Learning Environments
Safe and Welcoming School Environment NS NS NS Safe and Welcoming Classroom Environment NS NS NS Healthy Learning Environment: Hygiene and Sanitation NS NS NS Healthy Learning Environment: Child-Centred Services NS NS NS
Child-Centredness: Pedagogy
Child-Centred Pedagogy + + +
Democratic Participation
Family and Community Participation + + + Child Participation NS NS +
School Characteristics Nigeria South Africa
NS NS
- NS
NS NS
Philippines NS + NS Thailand NS NS + Nicaragua + NS NS Guyana NS NS NS Urban Locality NS NS NS Years of Implementing CFS NS NS NS

163
Multilevel Models Predicting Students’ Perceptions on SIRC Effects of Student Characteristics. As Table B.6 illustrates, female students had higher perceptions than males of the degree of SIRC that their schools had. However, students who had to miss school for work had lower perceptions of SIRC than students who did not need to miss school for work. Students who reported having good grades did not have perceptions of SIRC that were significantly different from students who reported excellent or fair/failing grades (the referent group). However, students who reported excellent or fair/failing grades did significantly differ from each other in their perceptions of SIRC. Specifically, students who reported fair/failing grades had lower perceptions of SIRC when compared to the overall group mean, while students who reported excellent grades had higher perceptions of SIRC when compared to the overall group mean. Interestingly, the coefficient for ―school level (primary school)‖ was significant but negative in direction. Recall that school level was effects coded. Thus, it may be interpreted that younger, primary-aged students had significantly lower ratings of SIRC compared to average ratings of all students across school levels, including middle and secondary school. (Note that secondary students served as the referent group and their perceptions were not significantly different from the overall mean.) Effects of CFS Programming Components. Variables representing the degree to which schools and classrooms were inclusive were not significantly related to students‘ perceptions of SIRC at their schools. One possible explanation for this is that these variables were based on site visitors‘ ratings of the school and classroom environment on one particular day, whereas students‘ ratings were likely more holistic in scope, capturing their experiences and feelings over a longer period of time (i.e., students were privy to the day-to-day realities of attending that school, whereas site visitors were probably not). With one exception, variables representing Architecture and Services were not significantly associated with students‘ perceptions of SIRC. Although school and classroom observations on the degree to which these spaces fostered a safe, healthy, and welcoming environment for students were not significantly related to SIRC, school heads‘ perceptions of services provided to students were positively and significantly related to students‘ perceptions of SIRC. However, with the addition of Pedagogy to the multilevel model, the magnitude of relationship between school heads‘ perceptions of student services and SIRC scores decreased slightly. And with the addition of variables representing Participation and Governance to the model, the relationship between school heads‘ perceptions of services for students and SIRC scores became insignificant, indicating the robust effects of family and community involvement on students‘ perceptions of SIRC. As we mentioned earlier, classroom observations of Pedagogy were positively and significantly associated with students‘ perceptions of SIRC. This association remained significant even with the addition of variables representing Participation and Governance and school characteristics. Teachers‘ perceptions of family, community, and student involvement were also positively associated with students‘ perceptions of SIRC. However, the relationship between student involvement and SIRC became statistically insignificant with the addition of school characteristics (i.e., years of implementation; urban locality). Effects of School Characteristics. Note that years of CFS implementation and school locality were not significantly associated with students‘ perceptions of SIRC. It is also important to note that only the coefficient for Nicaragua was significantly predictive of students‘ perceptions of SIRC. Recall that country was effects coded, so that each country‘s aggregate score on SIRC was compared to the overall cross-national mean score on SIRC. (Note: Nigeria served as the referent group and was not significant.) These results suggest that students‘ perceptions on SIRC in Nicaragua, after statistically controlling for the effects of student demographics, school characteristics, and ratings on CFS programming components, were significantly higher compared to overall mean rating of SIRC across countries. Students‘ perceptions on SIRC within other countries did not differ significantly from the overall mean.

164
Variance Estimates. As a whole, student demographics accounted uniquely for 3.7% of the original variance in students‘ scores on the SIRC scale. The addition of ratings on CFS programming components did increase the amount of variation explained in students‘ scores. Specifically, Inclusiveness uniquely accounted for about 7% (above and beyond student demographics); Architecture and Services uniquely accounted for 8.6%; Pedagogy uniquely accounted for 5.%; Participation and Governance uniquely accounted for 20.3% of the total variance in students‘ scores on the SIRC scale; and finally, the inclusion of school characteristics uniquely explained 2.4% of the total variance in students‘ scores on this scale. Multilevel Models Predicting Students’ Perceptions of Challenging Student-Centred Learning Environment Effects of Student Characteristics. As Table B.7. illustrates, female students, as in models predicting SIRC, had higher ratings on the CSCLE scale than did male students. Also, students who had to miss school for work had lower ratings on the CSCLE scale compared to students who did not need to miss school for work. The magnitude of both coefficients remained consistent across models, indicating that CFS programming components did not significantly mitigate these students‘ ratings on CSCLE. As in models predicting SIRC, the coefficient for ―school level (primary school)‖ was again negative and significant, meaning that younger, primary-aged students had significantly lower ratings on the CSCLE scale compared to the average rating of all students across school levels, including middle and secondary school. (Note: secondary students served as the referent group, and their ratings of CSCLE were not significantly different from the overall mean). Interestingly, students at the middle school level initially had ratings on CSCLE that were significantly higher than the average rating of all students across levels, but this effect washed out once variables representing Inclusiveness in the school and classroom were entered into the model. Students who self-reported having good grades had perceptions of Academic Support that were significantly higher than the average rating provided by all students across performance levels. Students who self-reported having excellent grades also had significantly higher ratings on CSCLE compared to the overall group mean, while students who self-reported poor or failing grades (the referent group) had ratings on the CSCLE scale that were significantly lower than the average rating provided by all students across performance levels. Effects of CFS Programming Components. As was the case in models predicting students‘ perceptions of SIRC, variables representing the degree to which schools and classrooms were inclusive were not significantly related to students‘ ratings on CSCLE at their schools. Nor were variables representing Architecture and Services significantly associated with students‘ ratings of CSCLE. However, classroom observations of Pedagogy were positively related to students‘ ratings of CSCLE, although the magnitude of the coefficient reduced almost by half once variables representing Participation and Governance were entered into the model. Of these variables, however, only teachers‘ perceptions of family and community involvement were significantly associated with students‘ ratings of CSCLE, a finding that highlights the importance of parental support and encouragement. Finally, teachers‘ perceptions of student involvement were not significantly predictive of students‘ perceptions of CSCLE. Effects of School Characteristics. As was the case in models predicting students‘ perceptions of SIRC, years of CFS implementation and school locality were not significantly associated with students‘ ratings of CSCLE. In this final model, only the coefficient for the Philippines was significant.

165
Table B.6: HLM Results Predicting Students' Scores on Safe, Inclusive and Respectful Climate
Coeff. (SE) Coeff. (SE) Coeff. (SE) Coeff. (SE) Coeff. (SE) Coeff. (SE) Intercept 3.164 ***
(-0.022) 3.165 *** (0.022) 3.165 ***
(0.02) 3.166 *** (0.020) 3.166 ***
(0.017) 3.172 *** (0.019)
Student-Level Characteristics gender (Female) 0.054 ***
(0.009) 0.054 *** (0.009) 0.054 ***
(0.009) 0.054 *** (0.009) 0.054 ***
(0.009) 0.054 *** (0.009)
school level (primary school) -0.039 * (0.016) -0.040 * (0.016) -0.040 * (0.016) -0.042 ** (0.016) -0.043 **
(0.016) -0.043 ** (0.016)
school level (middle school) 0.038 ** (0.011) 0.038 ** (0.011) 0.037 * (0.011) 0.036 ** (0.011) 0.035 ** (0.011) 0.035 ** (0.011) self-reported grades (good) 0.010 (0.007) 0.010 (0.007) 0.010 (0.007) 0.010 (0.007) 0.010 (0.007) 0.009 (0.007) self-reported grades (excellent) 0.062 ***
(0.009) 0.062 *** (0.009) 0.062 ***
(0.009) 0.062 *** (0.009) 0.062 ***
(0.009) 0.063 *** (0.009)
need to miss school to work (yes) -0.085 *** (0.013) -0.085 ***
(0.013) -0.085 *** (0.013) -0.085 ***
(0.013) -0.085 *** (0.013) -0.085 ***
(0.013)
Inclusiveness inclusive school environment_school 0.089 (0.046) 0.023 (0.046) -0.001 (0.045) -0.043 (0.039) -0.050 (0.034) inclusive classroom environment_class 0.081 (0.079) 0.028 (0.067) -0.081 (0.063) 0.022 (0.056) -0.004 (0.052)
Architecture & Services safe and welcoming school learning environment_school 0.066 (0.083) 0.001 (0.083) -0.053 (0.073) -0.022 (0.079) safe and welcoming classroom environment_class 0.184 (0.100) 0.138 (0.090) 0.127 (0.079) 0.113 (0.078) healthy learning environment: hygiene and sanitation_school -0.018 (0.080) -0.001 (0.074) -0.018 (0.061) -0.043 (0.062) healthy learning environment: child-centred services_school head 0.141 **
(0.043) 0.123 ** (0.041) 0.038 (0.032) -0.003 (0.036)
Pedagogy child-centred pedagogy_class 0.326 ***
(0.086) 0.171 * (0.077) 0.160 * (0.076)
Participation & Governance family and community participation_teacher 0.251 ***
(0.067) 0.269 *** (0.071)
student participation_teacher 0.156 ** (0.052) 0.094 (0.053)
School Characteristics country (South Africa) -0.071 (0.046) country (Philippines) 0.080 (0.045) country (Thailand) -0.013 (0.040) country (Nicaragua) 0.111 * (0.042) country (Guyana) -0.034 (0.038) locality (urban) -0.021 (0.037) years of implementing CFS 0.001 (0.006) Note . * p <.05; ** p <.01; *** p <.001. Robust standard errors are presented.
Model 6 Model 1 Model 2 Model 3 Model 4 Model 5

166

167
Table B.7.: HLM Results Predicting Students' Scores on Academic Support
Coeff. (SE) Coeff. (SE) Coeff. (SE) Coeff. (SE) Coeff. (SE) Coeff. (SE) Intercept 3.420 ***
(0.021) 3.420 *** (0.021) 3.420 ***
(0.020) 3.421 *** (0.020) 3.422 ***
(0.018) 3.406 *** (0.020)
Student-Level Characteristics gender (Female) 0.071 ***
(0.011) 0.071 *** (0.011) 0.071 ***
(0.011) 0.071 *** (0.011) 0.071 ***
(0.011) 0.071 *** (0.011)
school level (primary school) -0.045 *** (0.017) -0.046 **
(0.017) -0.047 ** (0.017) -0.049 **
(0.017) -0.051 ** (0.017) -0.048 **
(0.017) school level (middle school) 0.024 **
(0.013) 0.024 (0.013) 0.023 (0.013) 0.022 (0.013) 0.021 (0.013) 0.022 (0.013) self-reported grades (good) 0.021 **
(0.008) 0.021 * (0.008) 0.021 * (0.008) 0.021 * (0.008) 0.021 ** (0.008) 0.020 * (0.008)
self-reported grades (excellent) 0.066 *** (0.010) 0.066 ***
(0.010) 0.066 *** (0.010) 0.066 ***
(0.010) 0.066 *** (0.010) 0.068 ***
(0.010) need to miss school to work (yes) -0.081 ***
(0.016) -0.081 *** (0.015) -0.080 ***
(0.016) -0.081 *** (0.016) -0.081 ***
(0.016) -0.080 *** (0.015)
Inclusiveness inclusive and safe environment_school 0.006 (0.038) -0.026 (0.040) -0.045 (0.040) -0.068 (0.038) -0.059 (0.037) inclusiveness in classroom_class 0.092 (0.055) 0.062 (0.052) -0.028 (0.048) 0.030 (0.053) -0.022 (0.055)
Architecture & Services safe and welcoming environment_school 0.045 (0.076) -0.008 (0.078) -0.064 (0.073) -0.082 (0.076) safe and welcoming classroom environment_class 0.100 (0.084) 0.062 (0.080) 0.067 (0.075) 0.114 (0.074) healthy learning environment: hygiene and sanitation_school -0.023 (0.074) -0.008 (0.072) -0.021 (0.061) -0.002 (0.061) healthy learning environment: child-centred services_school head 0.069 (0.039) 0.054 (0.038) -0.015 (0.036) -0.060 (0.038)
Pedagogy child-centred pedagogy_class 0.269 ***
(0.070) 0.148 * (0.065) 0.144 * (0.065)
Participation & Governance family and community participation_teacher 0.280 ***
(0.061) 0.265 *** (0.069)
child participation_teacher 0.052 (0.047) 0.056 (0.052)
School Characteristics country (South Africa) 0.024 (0.038) country (Philippines) 0.106 **
(0.038) country (Thailand) 0.007 (0.040) country (Nicaragua) -0.002 (0.041) country (Guyana) -0.018 (0.035) locality (urban) 0.053 (0.031) years of implementing CFS 0.008 (0.005) Note . * p <.05; ** p <.01; *** p <.001. Robust standard errors are presented.
Model 5 Model 6 Model 1 Model 2 Model 3 Model 4

168
This means that students‘ ratings of CSCLE in the Philippines, after statistically controlling for the effects of student demographics, school characteristics, and ratings on CFS programming components, were significantly higher than the overall mean ratings on CSCLE across countries. In this model, Nigeria again served as the referent group; however, its coefficient is now negative and significant, suggesting that, on average, students‘ perceptions of CSCLE in Nigeria are significantly lower than the overall average of students‘ ratings on this scale across countries. Variance Estimates. On the whole, student demographics accounted uniquely for 7.2% of the variance in students‘ scores on the CSCLE scale. The addition of ratings on CFS programming components did increase the amount of variation explained in students‘ scores. Specifically, Inclusiveness uniquely accounted for less than 1% (.10% above and beyond student demographics); Architecture and Services uniquely accounted for 1.2%; Pedagogy uniquely accounted for 5%; Participation and Governance uniquely accounted for about 17% of the total variance in students‘ scores on the CSCLE scale; and finally, the inclusion of school characteristics uniquely explained 6.3% of the total variance in students‘ scores on this scale. Multilevel Models Predicting Students’ Perceptions of Emotionally Supportive Climate Effects of Student Characteristics. As Table B.8. illustrates, female students, as in models predicting both SIRC and CSCLE, had significantly higher ratings on the Emotionally Supportive Climate scale than did male students. Also, students who had to miss school for work had significantly lower ratings on the Emotionally Supportive Climate scale compared to students who did not need to miss school for work. As with models predicting students‘ perception of other aspects of the school environment, the magnitude of coefficients for gender and absences due to work remained consistent across models, suggesting that CFS programming components did not significantly mitigate these students‘ ratings on Emotionally Supportive Climate. The perceptions of primary school students and secondary school students (referent group; not presented in Table B.8.) regarding Emotionally Supportive Climate did not significantly differ from the average of all students across school levels. However, middle school students‘ perceptions of Emotionally Supportive Climate were significantly higher than the overall average ratings on Emotionally Supportive Climate across all school levels. Students who self-reported having good grades had perceptions of Emotionally Supportive Climate that were significantly higher than the average rating of all students across performance levels. Students who self-reported having excellent grades also had significantly higher ratings on Emotionally Supportive Climate compared to the overall group mean, while students who self-reported poor or failing grades (referent group; not presented in Table B.8.) had significantly lower ratings on Emotionally Supportive Climate. Effects of CFS Programming Components. Although ratings of inclusiveness within the classroom were not significantly associated with students‘ ratings of Emotionally Supportive Climate, ratings of inclusiveness and safety within the broader school campus were negatively and significantly related to students‘ ratings of Emotionally Supportive Climate. However, the coefficient for this variable was not consistently significant across models; rather the coefficient for Inclusive and Safe School Environment became significant with the addition of variables representing Participation and Governance to the model (Model 5). This suggests that the effect of inclusiveness within the school on Emotionally Supportive Climate ratings becomes stronger in the presence of student, family, and community involvement. This finding should be interpreted with caution due to the unexpected negative direction of the coefficient. Although the exact cause of this is unclear, one explanation is that there is a spurious correlation between Emotionally Supportive Climate and Inclusive and Safe School Environment. Inclusive and Safe School Environment tapped the extent to which data collectors felt that schools were accessible to students with disabilities, while Emotionally Supportive Climate measured the extent to which students felt emotionally, academically, and nutritionally supported by teachers and adults within their community. As was the case in models predicting students‘ perceptions of SIRC and CSCLE, variables representing Architecture and Services were not significantly associated with students‘ ratings of Emotionally Supportive Climate. However, classroom observations of Pedagogy were positively related to students‘

169
ratings of Emotionally Supportive Climate, although the magnitude of the coefficient was reduced almost by half once variables representing Participation and Governance were entered into the model (similar to what happened with models predicting CSCLE). Both teachers‘ perceptions of fam ily and community involvement and teachers‘ perceptions of student involvement were significantly related to students‘ perceptions of Emotionally Supportive Climate. Effects of School Characteristics. As in models predicting students‘ perceptions of SIRC and CSCLE, years of CFS implementation and school locality were not significantly associated with students‘ ratings of Emotionally Supportive Climate. In this final model, only the coefficient for Thailand was significant (and negative). This means that students‘ ratings of Emotionally Supportive Climate in Thailand, after statistically controlling for the effects of student demographics, school characteristics, and ratings on CFS programming components, were significantly lower than the overall mean rating on Emotionally Supportive Climate across countries. In this model, Nigeria again served as the referent group and was not significant (not presented in Table B.8.). Variance Estimates. Overall, student demographics accounted uniquely for 9.3% of the variance in students‘ scores on the Emotionally Supportive Climate scale. As was the case with SIRC and CSCLE, the addition of ratings on CFS programming components to models predicting Emotionally Supportive Climate did increase the amount of variation explained in students‘ scores. Specifically, Inclusiveness uniquely accounted for less than 1% (.90%) above and beyond student demographics; Architecture and Services uniquely accounted for less than 1% (.74%); Pedagogy uniquely accounted for 7.2%; Participation and Governance uniquely accounted for about 18%; and finally, the inclusion of school characteristics uniquely explained 8.1% of the total variance in students‘ scores on the Emotionally Supportive Climate scale.

170
Table B.8.: HLM Results Predicting Students' Scores on Emotionally Supportive Climate
Coeff. (SE) Coeff. (SE) Coeff. (SE) Coeff. (SE) Coeff. (SE) Coeff. (SE) Intercept 3.159 ***
(0.021) 3.159 *** (0.021) 3.159 ***
(0.020) 3.160 *** (0.020) 3.161 ***
(0.018) 3.145 *** (0.018)
Student-Level Characteristics gender (Female) 0.078 *** (0.011) 0.078 *** (0.011) 0.077 *** (0.011) 0.077 *** (0.011) 0.078 *** (0.011) 0.078 *** (0.011) school level (primary school) -0.018 (0.017) -0.018 (0.018) -0.019 (0.018) -0.021 (0.018) -0.023 (0.018) -0.021 (0.017) school level (middle school) 0.031 * (0.014) 0.031 * (0.014) 0.030 * (0.014) 0.029 * (0.014) 0.028 * (0.014) 0.029 * (0.014) self-reported grades (good) 0.020 **
(0.007) 0.020 ** (0.007) 0.020 **
(0.007) 0.020 ** (0.007) 0.020 **
(0.007) 0.019 ** (0.007)
self-reported grades (excellent) 0.052 *** (0.010) 0.052 ***
(0.010) 0.052 *** (0.010) 0.052 ***
(0.010) 0.052 *** (0.010) 0.053 ***
(0.010) need to miss school to work (yes) -0.084 ***
(0.015) -0.084 *** (0.015) -0.083 ***
(0.015) -0.084 *** (0.015) -0.083 ***
(0.015) -0.083 *** (0.015)
Inclusiveness inclusive schooll environment_school -0.009 (0.035) -0.033 (0.041) -0.057 (0.041) -0.092 **
(0.038) -0.075 * (0.036) inclusive classroom environment_class 0.062 (0.058) 0.045 (0.060) -0.065 (0.054) 0.021 (0.055) 0.025 (0.058)
Architecture & Services safe and welcoming school learning environment_school 0.007 (0.074) -0.058 (0.075) -0.106 (0.072) -0.063 (0.068) safe and welcoming classroom environment_class 0.125 (0.088) 0.078 (0.088) 0.070 (0.084) 0.104 (0.076) healthy learning environment: hygiene and sanitation_school -0.038 (0.075) -0.020 (0.072) -0.033 (0.061) -0.018 (0.059) healthy learning environment: child-centred services_school head 0.072 (0.0400 0.053 (0.038) -0.018 (0.033) -0.028 (0.034)
Pedagogy child-centred pedagogy_class 0.329 ***
(0.078) 0.199 ** (0.077) 0.153 * (0.073)
Participation & Governance family and community participation_teacher 0.211 **
(0.063) 0.269 *** (0.063)
student participation_teacher 0.131 ** (0.048) 0.095 * (0.047)
School Characteristics country (South Africa) 0.075 (0.042) country (Philippines) 0.068 (0.038) country (Thailand) -0.140 **
(0.044) country (Nicaragua) 0.022 (0.037) country (Guyana) -0.007 (0.033) locality (urban) 0.060 (0.033) years of implementing CFS 0.005 (0.006) Note . * p <.05; ** p <.01; *** p <.001. Robust standard errors are presented.
Model 6 Model 1 Model 2 Model 3 Model 4 Model 5
171
Effectiveness of Multilevel Analysis for Students’ Perceptions on Safe Inclusive and Respectful Climate, Challenging Student-Centred Learning Environment, and Emotionally Supportive Climate
This study also calculated variance components and proportions of variance that were accounted for by multilevel models predicting students‘ scores on each of the three outcome variables: SIRC, CSCLE, and Emotionally Supportive Climate. Final HLM models predicting students‘ perceptions on these variables show fairly different proportions of total explained variance at the student level (3.7% to 9.3%) and sizeable differences of total explained variance at the school level by the CFS programming components across the three outcomes. Therefore, the final models indicate two things: First, student demographics do not account for a substantial amount of variance at the student level—that is, student characteristics such as gender, grades, school level do not fully explain variation in their scores on SIRC, CSCLE, and Emotionally Supportive Climate scales. Second, although the two-level HLM models identified some of the predictors that are significantly associated with students‘ perceptions of SIRC, CSCLE, and Emotionally Supportive Climate, substantial differences remain to be explained. However, because sizeable differences exist in explained variance at the school level, we may conclude that the school characteristics included in the final model differentially affect students‘ perceptions of the three aspects of school climate, depending on the country.

172

173
APPENDIX C: ANALYSIS OF COST
Cost Methods
In the following, we provide a brief description of the techniques employed to inform the cost analysis presented in the report. Four techniques were used: a literature review on cost issues pertinent to CFS; an analysis of UNICEF NY‘s 2006-2007 budgets; an analysis of UNICEF and Ministry of Education cost data in the six countries visited; and quantitative and qualitative cost data collected at all schools where an intensive site visit took place. Intensive visits were those that included qualitative data collection, such as focus groups with teachers and parents and lengthier interviews with school heads. Table C.1 provides a summary of these research techniques.
Table C.1: Research Activities to Support Economic Analysis
When examining UNICEF NY‘s 2006 and 2007 budgets, line items were grouped into five categories, as shown in Table C.2.
Table C.2: Grouping of Line Items in UNICEF Chart of Accounts Line Items Category
21. Fund-raising; 26. Direct beneficiary cash support; 33. Operating costs including project staff (UNICEF); 34. Operating costs for UNICEF systems; 37. Contribution to UN Joint operating costs; SB. Support/PSD Budget costs
Operating Costs
24. Child, youth, adolescent, and family participation; 25. Service delivery via program partners; 35. Training/Human resource development (UNICEF); 36. Training/Human resource development (Partners)
Training
29. Analysis, research, and studies; 30. Program planning and monitoring; 31. Data, data bases, surveys and statistics; 32. Evaluations
Monitoring
27. Supplies and Equipment (Program Assistance); 28. Construction/physical infrastructure and rehabilitation
Supplies, equipment and construction
20. Advocacy; 22. Policy development advocacy; 23. Program communication and Social mobilization Advocacy
The Cost Model Our school-based cost model was our major means of assessing cost issues at the school level for the six countries visited during this evaluation. The cost model used in this analysis has six main components:
Expenditures in salaries (S)
Non-personnel expenditures for instruction and support (N)
Direct family contributions (F)
Professional development (D)
UNICEF program partner expenditures (P)
UNICEF maintenance and operations (M) Expenditures in Salaries Expenditure in salaries constitutes by far the largest cost item in public education. UNESCO data suggest that wages represent more than 70% of the total current expenditure in education in these countries
Stream of Work Primary Sources of Information Purpose
Literature review EFA Global Monitoring Report, Chapter 7 CFS Manual, UNESCO Global Education Digest 2007, UNESCO‘s Episim model etc.
Help contextualize primary cost data
UNICEF Budget Analysis UNICEF NY 2006, 2007 budgets, Identify global spending trends by region and activity
Country Visits UNICEF country case-study budgets 2002-2007, MOE data
Develop more fine-grained understanding of costs in site visit countries
School Visits School head (principal), teachers, parents, school accountant
Collect primary data on CFS costs at schools

174
(school year of 2005), reaching 89.4 and 93.6% in Philippines and Nicaragua, respectively. Because of this, per pupil education expenditures are very sensitive to the following three elements: a) wages, b) number of teachers and general staff, and c) total enrolment. To be more precise, the total expenditures in salaries are estimated using the following formula:
T represents the number of teachers employed at each school. Their average wage (WT) was obtained from the respective Ministry of Education. Note that some countries, such as Nigeria, provided information on the average teacher salary (14,000 - 15,000 Nigerian Naira per month), while others, such as the Philippines, provided information about the pay schedule and how a teacher‘s salary depends on his/her education and experience. Whenever a pay schedule was provided, the midpoint of the schedule was used in our calculations. The second component of the total salary expenditures is the wage of the principal (WP). For some countries, like South Africa, this principal wage data was available (13,700 South African Rand per month), but for others, such as Nigeria, it was not. In these cases, we assumed a principal salary two times the average teacher salary. Whenever we had a teacher pay schedule, we used the upper end of the scale for the principal‘s wage. Finally, we also collected information on the number of educational assistants, administrative staff, custodial and maintenance staff, and security personnel employed in each school (O). In order to account for their salary expenditures we assumed a wage (WO) equal to half the average teacher wage prevailing in each country. The per pupil expenditure in salaries is then simply estimated as:
2. Non-Personnel Expenditures for Instruction and Support Besides personnel, schools need a series of other inputs to function effectively. Facilities have to be constructed and maintained, students need books and other educational materials, and technology investments in schools have become more and more common. In developing countries, food, transportation, and/or clothing are oftentimes provided to students, especially to those of low socio-economic background. We collected data on each of these inputs for each CFS school. The challenge that we face when dealing with non-personnel expenditures is that some of them need to be considered investments rather than mere expenditures of a single school year. This means that some of them have a certain lifetime - maybe three, five, or ten years - during which they provide services to students in a given school. Imagine for instance that a school constructs a new building for $100,000. If the lifetime of this building is 10 years, then only $10,000 of the total investment should be assigned to non-personnel expenditures during the current year. The rest will be accounted for during the next nine years. As noted, the longer the assumed lifetime of a certain investment, the lower the portion of it that is assigned to expenditures in the current school year. Because of this inverse relationship, the assumption we make on the lifetime of non-personnel investments is crucial for our cost estimates. We make the following lifetime assumptions:
Supplies and equipment: 5 years Construction/physical infrastructure and rehabilitation: 5 years Direct beneficiary cash support: 1 year Investment in educational materials: 5 years Investment in technology: 5 years Investment in school library: 5 years Other school administration and maintenance and operations: 1 year Food: 1 year Transportation: 1 year Clothing and uniforms: 5 year
175
Note that UNICEF, as well as local governments, makes investments in non-personnel expenditures for instruction and support in CFS schools. Therefore, we need to distinguish both sources of investments separately. In UNICEF‘s case, data are provided annually and are in U.S. dollars. These data show the investment in supplies and equipment, infrastructure, and direct cash support given to all CFS schools in each country. Given that the schools included in this cost study are only a subsample of all CFS schools in each country, we need to estimate the portion of these UNICEF funds allocated to these particular CFS schools. This is done applying the ratio of the number of CFS schools included in the cost study divided by the total number of CFS schools supported by UNICEF in each country to these investment funds. In other words:
The Total NU,I represents the non-personnel investment in input I (i.e., supplies and equipment, infrastructure, or cash) made by UNICEF. Once the total amount of this investment for the CFS sample schools is estimated, it is necessary to allocate these funds among all CFS schools included in the cost study. For this, we use the total student enrolment for assigning these funds (i.e., we assume that larger CFS schools receive relatively larger UNICEF non-personnel investments). Of course, these assumptions are only necessary because exact school-level investment figures are not available. The estimated non-personnel investment made by UNICEF in a certain CFS school is then calculated as follows:
NU,I represents UNICEF‘s non-personnel investment in input I in a given CFS school. As observed, it is necessary to include the exchange rate in this equation given that the provided UNICEF data are in U.S. dollars, while country-specific data are in the local currency. Finally, we need to estimate how much of this investment will be assigned to expenditures during the current school year. Therefore, we need to divide NU,I by the estimated lifetime of each input:
To obtain UNICEF‘s total investment in non-personnel expenditures in a certain school we just need to add this current expenditure estimates across supplies and equipment, infrastructure, and direct cash contributions. The data on investments in non-personnel expenditures for instruction and support financed by local governments was obtained directly during the data collection process of the study. Therefore, for these non-UNICEF investments it is only a matter of applying the appropriate assumed lifetime of these investments and add them up. The overall investment in non-personnel expenditures is then obtained adding the UNICEF and non-UNICEF figures in the local currency:
3. Direct Family Contributions Oftentimes families in developing countries make cash or other types of donations to their local schools in order to help finance part of the education costs of their children. We collected this type of information for each CFS school included in the cost study. Besides asking about these direct family contributions, we also tried to gather data on the time investment in school activities that families make to support CFS schools. Unfortunately, we were not successful at getting this community involvement data. 4. Professional Development Professional development activities are another cost component in which UNICEF, as well as the respective local government, makes investments. UNICEF provides annual data (in U.S. dollars) on training/human resource development of UNICEF and partner staff. As with non-personnel expenditures, we applied again the ratio of CFS sample schools to total number of CFS schools in each country, and the student enrolment figures to get UNICEF professional development expenditure estimates for each

176
CFS school. For non-UNICEF professional investment data, we collected information of on-site and off-site training activities, separately for teachers and principals. Applying the respective exchange rate to the UNICEF professional development expenditures, we can add both UNICEF and local government costs:
5. UNICEF Program Partner Expenditures UNICEF expenditures in program partners constitute another cost component of CFS schools. Again, these data are provided annually in U.S. dollars for each country by UNICEF. The same approach used for investment in non-personnel expenditures and professional development is used to allocate these UNICEF program partner expenditures among the analyzed CFS schools. 6. UNICEF Maintenance and Operations Finally, the cost of maintaining UNICEF local offices in each country, as well as fund-raising, advocacy and communication activities, and data analysis and evaluation expenditures have to be added to the overall cost of running the Child Friendly School Program. We allocate again these costs among each CFS school using the method described above. Note that the overall education cost of CFS schools is then estimated adding these six different elements:

177
Appendix D: Delphi Survey Questions and Results Not applicable Not at all true A little bit true Mostly true Very true
1. The Ministry of Education has integrated the
Child Friendly Schools initiative into its education
strategy. 2% 6% 38% 35% 19%
2. Parents and community members take
responsibility for implementing the principles of
Child Friendly Schools. 8% 23% 44% 21% 4%
3. Administrators and teachers in school
implementing the Child Friendly Schools approach
take concrete actions to make their schools
inclusive for all students. 4% 8% 50% 31% 6%
4. UNICEF provides funds, training, or technical
assistance to Child Friendly Schools to support
maintenance of the schools' physical environment
(i.e. buildings and grounds). 6% 15% 27% 40% 13%
5. The Child Friendly Schools model is equally
effective in rural and urban settings. 13% 10% 15% 44% 19%
6. Schools have difficulty attaining the school
facilities goals of the Child Friendly Schools model
because of the financial resources required. 2% 10% 19% 40% 29%
7. Schools often say that lack of financial
resources is the greatest barrier to them
becoming child friendly. 2% 10% 21% 46% 21%
8. It is difficult to sustain local governmental and
non-governmental partner support (i.e. funding,
in-kind contributions, advocacy) of Child Friendly
Schools. 4% 11% 34% 43% 9%
9. The government operates the Child Friendly
Schools initiative. 13% 8% 40% 19% 21%
10. CFS is compatible with other school-based
reform initiatives in my country. 10% 6% 15% 29% 40%
11. All Child Friendly Schools in my country
receive the same level and type of support from
UNICEF and its implementing partners. 6% 28% 23% 32% 11%
12. The degree to which Child Friendly Schools
in my country meet the CFS model varies from
school to school. 2% 6% 13% 40% 40%
13. It is difficult to attribute school outcomes
(i.e. school quality, access to school, student
achievement) to the Child Friendly Schools
initiative because often there are other programs
with similar goals being implemented in CFS
schools. 17% 21% 27% 31% 4%
14. Teachers in Child Friendly Schools do not
have sufficient training in how to support children
with special needs. 2% 8% 21% 31% 38%
15. Different government sectors work together
to support the goals of the Child Friendly Schools
initiative. 6% 38% 29% 21% 6%
16. Government sectors and non-governmental
organizations work together to support the goals
of the Child Friendly Schools initiative. 8% 23% 31% 29% 8%
17. Teachers in Child Friendly Schools are more
willing to spend extra time and energy on their
work than teachers in non-CFS government
schools. 15% 15% 35% 31% 4%
18. UNICEF effectively coordinates the Child
Friendly Schools initiative with other child-
protection programs. 2% 13% 31% 46% 8%

178
19. Parents are involved in decision-making about school level policies and procedures. 2% 17% 52% 25% 4% 20. A strong, supportive school head (principal) is the most important factor in whether a Child Friendly School will be successful in meeting the goals of the Child Friendly Schools initiative. 4% 2% 2% 55% 36% 21. Child Friendly Schools are prepared for the turnover of teachers and principals trained in CFS principles. 9% 30% 40% 19% 2% 22. Child Friendly Schools generate school improvement plans that are realistic in terms of cost. 10% 8% 38% 35% 8% 23. Established and effective Child Friendly Schools provide support to newer or less effective Child Friendly Schools. 9% 21% 36% 26% 9% 24. School stakeholders are equally able to identify social barriers (i.e. gender, language, religion, school climate) to achieving the goals of the Child Friendly Schools model as they are able to identify structural barriers (i.e. lack of food, lack of transportation) to achieving the goals of the Child Friendly Schools model. 4% 6% 48% 38% 4% 25. Reaching out-of-school youth is often the first step that new Child Friendly Schools take. 13% 31% 38% 17% 2% 26. Child Friendly Schools life skills curriculum focuses on social-emotional learning. 15% 25% 27% 23% 10% 27. UNICEF collects data on Child Friendly Schools in my country. 6% 4% 29% 33% 27% 28. UNICEF uses the data collected from Child Friendly Schools in my country to make continuous improvements to the initiative. 4% 4% 25% 46% 21% 29. School stakeholders' understanding of the goals of the Child Friendly Schools model deepens as their experience with the implementation increases. 2% 6% 19% 54% 19% 30. Over the next 10 years the Child Friendly Schools model will have to be significantly changed to be or remain effective. 4% 13% 29% 35% 19% 31. Other donors contribute funding or other resources to support the Child Friendly Schools initiative. 4% 19% 35% 23% 19% 32. There is effective knowledge-sharing of Child Friendly Schools best practices among UNICEF country offices in this region. 4% 17% 42% 25% 13% 33. Teachers have sufficient training in how to implement CFS. 2% 19% 42% 33% 4%

179

180
GLOSSARY
Challenging Student-Centred Learning Environment (CSCLE): Measures the extent to which
students feel learning is interesting and adults support active learning and the success of all students.
Child-centredness: The school staff prioritizes children‘s physical and mental health, physical and
emotional safety, and overall well-being. Relationships among students and staff are caring, positive and respectful. Students are actively engaged in the learning process through teachers‘ use of child-centred pedagogical techniques and eliciting students‘ active participation. Central to all decision-making in education is safeguarding the interest of the child.
Child-seeking: Identifying out-of-school youth by going out into the community to find children for
enrolment in school. In many schools this is described as a systematic process. Democratic participation: There are high levels of family and community participation. Students are
actively engaged in school activities and decision-making and their roles in decision-making are formalized through student governments or councils. As rights-holders, children and those who facilitate their rights should have a say in the form and substance of their education.
Emotionally Supportive Climate: Measures the degree to which students feel listened to, cared about,
and helped by teachers and other adults in the school. Hierarchical Linear Models (HLM): An advanced statistical technique, HLM is widely acknowledged as
most appropriate for analysing nested data in schools. Specifically, hierarchical analysis estimates statistics for each unit of a hierarchical structure, using data from that unit while borrowing strength from the information available on all units (Willms, 1995). HLM allows researchers to investigate contextual aspects of social outcomes at different levels (e.g., classroom and school levels). It solves the problems of the total regression and aggregated regression approaches by treating variables at their respective level of measurement (e.g., student or classroom level) and accounts for the fact that the variances at the student level (‗within classrooms‘) are different from those at the classroom level (‗between classrooms‘).
Inclusiveness: The school environment is welcoming for all children and families – culturally and
linguistically diverse children and families and children from marginalized populations. School leadership and teachers recognize that students have different learning styles and needs and accommodate those needs. All children have a right to education. Access to education is not a privilege that society grants to children; it is a duty that society fulfills to all children.
Intraclass Correlation (ICC): A statistic that measures the degree of similarity among the outcomes of
students in the same cluster or group (e.g., school). The ICC is calculated by dividing the between-class variance by the total variance for each HLM model.
Purchasing Power Parity: The rates of currency conversion that equalize the purchasing power of
different currencies by eliminating the differences in price levels between countries. In their simplest form, PPPs are simply price relatives which show the ratio of the prices in national currencies of the same good or service in different countries (http://stats.oecd.org/glossary/index.htm).
Riverain: Communities that are on the bank of or near natural watercourses such as rivers. Safe, Inclusive, and Supportive Climate (SIRC): Measures how physically and emotionally safe students
feel and how inclusive they feel the school is.

181
Variance Calculations: The multilevel modeling process providing estimates of variance that permit researchers to calculate the proportion of variance that are attributable to predictor variables (see also Raudenbush & Kim, 2002; Snijders & Bosker, 1999).

182
REFERENCES
Abbott, R. D., O'Donnell, J., Hawkins, J. D., Hill, K. G., Kosterman, R., & Catalano, R. F., ‗Changing teaching practices to promote achievement and bonding to school‘, American Journal of Orthopsychiatry, 68,1998, p. 542–552.
Adelman, H. S., & Taylor, L., ‗Moving prevention from the fringes into the fabric of school improvement‘, Journal of Education and Psychological Consultation, 11(1), 2000, p 7–36.
Ahlefeld, H. von, ‗What the OECD PISA study reveals about the physical learning environment‘, in Knapp, E., Noschis, K. & Pasalar, Ç, Eds., School Design and Learning Performance with a Focus on Schools in Developing Countries, Imprimerie Chabloz, Lausanne, Switzerland, 2007.
AIR, Excelencia Project/Proyecto Excelencia Estudio Anual 2006 sobre el Programa de Escuelas Mentoras, Washington, DC, 2006.
AIR, Evaluation of the Child Friendly Schools Programming Strategy, Inception report, Washington, DC, 2008.
Akey, T. M. (2006, January), ‗School context, student attitudes and behavior, and academic achievement: An exploratory analysis‘, MDRC, New York, retrieved 23 April 2007, from http://www.mdrc.org/publications/419/full.pdf.
American Academy of Pediatrics, ‗Health care of children in foster care‘, (RE9404), Pediatrics, 93(2), 1994, p. 335-338.
Aubusson, P. & Webb, C., ‗Teacher beliefs about learning and teaching in primary science and technology‘, Research in Science Education, 1992, Volume 22, Issue 1, p.20-29.
Battin-Pearson, S., Newcomb, M. D., Abbott, R. D., Hill, K. G., Catalano, R. F., & Hawkins, J. D., ‗Predictors of early high school dropout: A test of five theories‘, Journal of Educational Psychology, 92, 2000, p. 568–582.
Battistich, V. & Horn, A, ‗The relationship between students‘ sense of their school as a community and their problem behaviors‘, American Journal of Public Health 87 (12), 1997.
Bekuis T., ‗Unsafe public schools and the risk of dropping out: A longitudinal study of adolescents‘, paper presented at the annual meeting of the Eastern Psychological Association, Boston, MA, 1995.
Berman, P. & McLaughlin, M. W., ‗Implementation of educational innovation‘, The Educational Forum, 40, 1976, p. 345–370.
Bernard, A., Evaluation of UNICEF's child-friendly school project in Cambodia, UNICEF, New York, 2005.
Bernard, A., Thai Child Friendly School Initiative (CFSI): A Forward-Looking Assessment, prepared for UNICEF/Bangkok Education Section, 2006.
Boler, T. & Carroll, K., ‗Addressing the educational needs of orphans and vulnerable children‘, Action AID International and Save the Children Fund, London, 2003.
Bryk, A. S., & Raudenbush, S. W., Hierarchical linear models for social and behavioral research: Applications and data analysis methods, Sage, Newbury Park, CA, 1992.
Bryk, A. S., & Schneider, B., Trust in schools: A core resource for improvement, Russell Sage Foundation, New York, 2002.
Bryk, A., & Thum, Y. M., ‗The effects of high school organization on dropping out: An exploratory investigation‘, American Educational Research Journal, 26(3), 1989, p. 353–383.
Center for Education Initiatives, Child friendly schools annual report: Step by step Bosnia and Herzegovina and implementation teams, UNICEF, New York, 2003.
Center for Justice and Crime Prevention, National over report on the baseline audit of priority schools, South Africa, 2007.

183
Chabbott, C., UNICEF‘s Child-Friendly Schools Framework: A Desk Review, report to UNICEF, 2004.
Christenson, S. L. & Thurlow, M. L., ‗School dropouts: Prevention considerations, interventions, and challenges‘, Current Directions in Psychological Science, 13:1, 2004, p. 36-39.
Cohen, J., & Cohen, P., Applied multiple regression/correlation analysis for the behavioral sciences (2nd ed.)., Erlbaum, Hillsdale, NJ, 1983.
Cole, S., O‘Brien, J., Gadd, M., Ristuccia, J., Wallace, D., & Gregory, M., Helping traumatized children learn: A report and policy agenda: Supportive school environments for children traumatized by family violence, Massachusetts Advocates for Children, Cambridge, MA, 2005.
Cook, T. D., F. Habib, M. Phillips, R. A. Settersten, S. C. Shagle & S. M. Degirmencioglu, ‗Comer's School Development Program in Prince George's County: A theory-based evaluation‘ American Educational Research Journal 36(3), 1999, p. 543-597.
De, A. & Dreze, J., Public report on basic education in India (PROBE Report), Oxford University Press.
Enueme, C., & Oju, E. (2005), ‗The impact of child-friendly school initiative on delta state primary schools in Nigeria‘, retrieved 30 December 2008 from: http://www.csus.edu/org/capcr/documents/archives/2005/ConferenceProceedings/Enueme.pdf.
Ernest, P., ‗The Impact of Beliefs on the Teaching of Mathematics‘, in Bloomfield, A. and Harries, T. (Eds.), Teaching and Learning Mathematics, Association of Teachers of Mathematics, Derby, 1994.
Funkhouser, J., Gonzales, M., & Moles, O., Family involvement in children's education: Successful local approaches, An Ideas Book, Office of Educational Research and Improvement, U.S. Department of Education, Washington, DC, 1997.
Garcia-Reid, P., Reid, R., & Peterson, N. A., ‗School engagement among Latino youth in an urban middle school context: Valuing the role of social support‘, Education and Urban Society, 37(3), May 2005, p. 257–275.
Goldstein, H., Multilevel models in educational and social research, Oxford University Press, New York, 1987
Goleman, D., Social intelligence: The revolutionary new science of human relationships, Random House, Inc., New York, 2006.
Greenberg, E., Skidmore, D., & Rhodes, D., ‗Climates for learning: mathematics achievement and its relationship to school wide student behavior, school wide parental involvement, and school morale‘, paper presented at the annual meeting of the American Educational Researchers Association, San Diego, CA, 2004.
Greene, Jennifer C., Caracelli, Valerie J. & Graham, Wendy F., ‗Toward a conceptual framework for mixed-method evaluation design‘, Educational Evaluation and Policy Analysis, 11(3), 1989, p. 255-274.
Hawkins, J.D., & Weis, J.G., ‗The social development model: An integrated approach to delinquency prevention‘, Journal of Primary Prevention, 6, 1985, p.73-97.
Haynes, N.M., & Comer, J.P., ‗Integrating schools, families, and communities through successful school reform: The school development program‘, School Psychology Review, 25(4), 1996, p. 501-506.
Heath, C. & Heath, D.Why some ideas survive and others die, Random House, New York, 2007.
Heller, R., Calderon, S., & Medrich, E. (2003), ‗Academic achievement in the middle grades: What does research tell us? A review of the literature‘, Southern Regional Education Board, Atlanta, GA, retrieved 23 April 2007, from http://www.sreb.org/programs/hstw/publications/pubs/02V47_AchievementReview.pdf.

184
Henderson, A. T., & Mapp, K. L., A new wave of evidence: The impact of school, family, and community connections on student achievement, Annual Synthesis, 2002, U.S.; National Center for Family & Community Connections with Schools, Austin, TX, 2002.
Izzo, C. V., Weissberg, R. P., Kasprow, W. J., & Fendrich, M., ‗A longitudinal assessment of teacher perceptions of parent involvement in children's education and school performance‘, American Journal of Community Psychology, 27, 1999, p. 817–839.
Johnson, R. B., & Onwuegbuzie, A. J., ‗Mixed methods research: A research paradigm whose time has come‘, Educational Researcher, 33(7), 2004, p. 14–26.
Keenapan, N. (2008), ‗Schools that work for children‘, retrieved 30 December 2008 from: http://www.unicef.org/thailand/reallives_7761.html.
Kennelly, L., & Monrad, M., Approaches to dropout prevention: Heeding early warning signs with appropriate interventions, National High School Center, American Institutes for Research, Washington, DC, 2007.
Klem, A., & Connell, J., ‗Relationships matter: Linking teacher support to student engagement and achievement‘, Journal of School Health, 74, 2004, p. 262–273.
Knapp, E., Noschis, K. & Pasalar, C. (2007), ‗School building design and learning performance, with a focus on schools in developing countries, colloquium report‘, Parc Scientifique à l‘Ecole Polytechnique Fédérale de Lausanne, Lausanne, Switzerland, retrieved 1 October 2008, from http://www.colloquia.ch/PDF/School%20Building%20Design.pdf.
Kreft & de Leeuw, Introducing multilevel modeling, Sage, Thousand Oaks, CA, 1998.
Lewis, M.A., & M.E. Lockheed, Exclusion, Gender and Schooling: Case Studies from the Developing World, Center for Global Development, Washington, D.C., 2007.
Lewis, M.A. & Lockheed, M.E., Inexcusable absence: Why 60 million girls still aren‘t in school and what to do about it, Center for Global Development, Washington, DC, 2006.
Lindert, P., Growing public: Social spending and economic growth since the Eighteenth century, Cambridge University Press, Cambridge, UK, 2004.
Lockheed, M. E. & Lewis, M.A., Inexcusable absences, Center for Global Development, Washington, DC, 2007.
Malteser International, Support to ZEOs of the southern province for the development of ToTT-Modules for child friendly water and sanitation in schools and pilot implementation in 43 schools, Malteser International, Sri Lanka, 2007.
Marshall. J.H., Child friendly schools: Comparisons from the CESSP student achievement surveys,
UNICEF, New York, 2007.
McClendon, M. J., Multiple regression and causal analysis, F. E. Peacock Publishers, Inc., Itasca, IL, 1994.
McKinney, S. E., Flenner, C., Frazier, W., & Abrams, L., ‗Responding to the needs of at-risk students in poverty‘, working paper (No. 17), The University of South Carolina Aiken, Aiken, SC, 2006.
McNeely, C., & Falci, C., ‗School connectedness and the transition into and out of health-risk behavior among adolescents: A comparison of social belonging and teacher support‘, Journal of School Health, 74(7), 2004, p. 284-299.
McNeeley, C. A., Nonnemaker, J. M., & Blum, R. W., ‗Promoting school connectedness: Evidence from the National Longitudinal Study of Adolescent Health‘, Journal of School Health, 72, 2002, p. 138–146.
Mihalic, S., Ballard, D., Michalski, A., Tortorice, J., Cunningham, L., & Argamaso, S., Blueprints for violence prevention initiative: Final process evaluation report, CSPV, Colorado Springs, CO, 2002.

185
Muller, C., ‗The role of caring in the teacher students‘ relationship for at-risk students‘, Sociological Inquiry, 71 (2), 2001, p. 241-255.
National Education Testing and Research Center, Learning achievement study: The Philippine experience, NETRC, Manila, 2008.
Ninnes, P., Report on the evaluation of the 100 friendly schools project, UNICEF, Timor Leste, 2005. O‘Sullivan, K., Study of the Child Friendly movement, UNICEF-Philippines, Manila, 2007.
Osher, D., (2008) ‗Improving conditions for learning for youth who are neglected or delinquent‘, The National evaluation and Technical assistance Center for the Education of Children and Youth who are Neglected, Delinquent, or At Risk, Washington, DC, 2008.
Osher, D, Bear, G., Doyle, W., & Sprague, J. (under review), ‗How can we improve school discipline?‘ Educational Researcher.
Osher, D., Dwyer, K., & Jackson, J., Safe, supportive, and successful schools step by step, Sopris West Educational Services, Longmont, CO, 2004.
Osher, D., Dwyer, K., & Jimerson, S., ‗Foundations of school violence and safety‘, In S. Jimerson and M. Furlong (Eds.), Handbook of school violence and school safety: From research to practice, Erlbaum, Mahwah, NJ, 2006, p.51–71.
Osher, D. & Kendziora, K. (in press), ‗Building conditions for learning and healthy adolescent development: A strategic approach‘, in Doll, B., Pfohl, W., & Yoon, J. (Eds.) (in press), Handbook of Youth Prevention Science, Routledge, New York.
Osher, D., Poirer, J. M., Dwyer, K. P., Hicks, R., Brown. L. J., Lampron, S., et al., Cleveland Metropolitan School District human ware audit: Findings and recommendations, AIR, Washington, DC, 2008.
Osher, D. Sprague, S., Axelrod, J., Keenan, S., Weissberg, R., Kendziora, K., & Zins, J., ‗A comprehensive approach to addressing behavioral and academic challenges in contemporary schools‘, in J. Grimes & A. Thomas (Eds.), Best Practices in School Psychology (5
th Edition),
2007.
Osher, D. Utne-O‘Brien, M. Shors, L, Weissberg, R., Strengthening Social and Emotional Learning in UNICEF‘s Child-Friendly Schools in East Asia and the Pacific, UNICEF East Asia and Pacific Region, 2007.
Osterman, K. F. (2000). Students' need for belonging in the school community. Review of Educational Research, 70(3), 323
Pervin, K. & Turner, A., ‗An investigation into staff and pupil knowledge, attitudes, and beliefs about bullying in an inner city school‘, Pastoral Care in Education, 12, 1994, p. 16-22.
Plake, B. S., Ferdous, A. A., Buckendahl, C., & Impara, J., ‗Setting multiple performance standards using the Yes/No Method: An alternative item mapping procedure‘, paper presented at the annual meeting of the National Council on Measurement in Education, Montreal, Canada, 2005.
Postlethwaite, N. & Ross, K., Effective schools in reading: Implications for educational planners, International Association for the Evaluation of Education in Achievement, Amsterdam, 1992.
Proactive Information Services Inc., Evaluation of child friendly schools project final report. Manitoba, Canada, 2005, Author.
Smulders, A., Child friendly school initiative project, Bettembourg, Kosovo, 2004.
Raudenbush, S. W., & Bryk, A. S., ‗A hierarchical linear model for studying school effects‘, Sociology of Education, 59, 1986, p. 1–17.
Raudenbush, S. W., & Kim, J. S., ‗Statistical issues in analysis of international comparisons of educational achievement‘, in A. C. Porter & A. Gamoran (Eds.), Methodological advances in

186
cross-national surveys of educational achievement, National Academy Press, Washington, DC, 2002, p. 267–294.
Richards, G., Systematization of the Friendly and Healthy School Initiative‘s School Sanitation and Hygiene Education Component, UNICEF, Managua, Nicaragua, 2005.
Rumberger, R & Larson, K.A., ‗Student Mobility and the Increased Risk of High School Dropout‘, American Journal of Education, 107(1), 1998, p. 1-35.
Sellström, E., & Bremberg, S., ‗Is there a school effect on pupil outcomes? A review of multilevel studies‘, Journal of Epidemiology and Community Health, 60, 2006, p. 149–155.
Shingles, B. & Lopez-Rayna, N., Cultural sensitivity in the implementation of discipline policies and practices, Council for Exceptional Children, Arlington, VA, 2002.
UNICEF/Federal Government of Nigeria, Situation analysis of primary schools and early childhood development centers: Sagen baseline study 1 panel report, 2005.
Skevington, S., Birdthistle, I., & Jones, J., Creating an environment for emotional and social well-being: An important responsibility of a health-promoting and child-friendly school, Information Series on School Health, World Health Organization, Geneva, 2003.
Slavin, R., ‗Sand, bricks, and seeds: School change strategies and readiness for reform‘, in David Hopkins (ed.), The Practice and Theory of School Improvement: International Handbook of Educational Change, Springer, Netherlands, 2005, p. 265-279.
Snijders, T., & Bosker, R., Multilevel analysis, Sage Publications, London, 1999.
Southern, S., The Multi-Country Child Friendly Schools for Africa Capacity Development Workshop II, Maputo, Mozambique, 2006, Author.
Spier, E., Cai, C., Kendziora, K., & Osher, D., School climate and connectedness and student achievement, Association of Alaska School Boards, Juneau, AK, 2007.
Stewart, D. W., Shamdasani, P. N., & Rook, D. W., ‗Focus groups: Theory and practice‘, Applied Social Research Methods Series (Vol. 20), Sage Publications, Thousand Oaks, CA, 2007.
UNESCO, Getting girls out of work and into school: Policy brief, UNESCO, Bangkok, 2006.
UNICEF, The right to quality education: Creating Child-Friendly Schools in Central Asia, UNICEF, Almaty, Kazakhstan, 2002.
UNICEF, Child friendly schools in East Asia and the Pacific: How friendly can they be? UNICEF,
Bangkok, Thailand, 2004. UNICEF, Mid-term review report: UNICEF & Government of China's Education and Child Development
Program, UNICEF, New York, 2005. UNICEF, Child Friendly Space in Timor Leste: An assessment and evaluation of Child Friendly space in
four districts, UNICEF, East Timor, 2006. UNICEF, Regional analysis report on the child-friendly ‗Schools for Africa‘, UNICEF, New York, 2007a. UNICEF, Review of UNICEF programs in Tajikistan from a Child Friendly School perspective: Embracing
diversity, UNICEF, Dushanbe, 2007b.
UNICEF (2009), Child-friendly schools manual, UNICEF, New York.
UNICEF Cambodia, Cambodia child-friendly school project: Report summary, UNICEF, New York, 2005. UNICEF EAPRO, End-of-cycle Evaluation Report: UNICEF–Government of China Child's Environment
and Sanitation (CES) Programme (2001-2005), UNICEF, Bangkok, Thailand, 2005.

187
UNICEF EAPRO, Assessing Child-Friendly Schools: A guide for programme managers in East Asia and the Pacific, UNICEF EAPRO, Bangkok, Thailand, 2006.
UNICEF Kazakhstan, A Child-Friendly Environment in Schools: Theory and Practice, Research in the framework of the Monitoring of Learning Achievements in Kazakhstan, UNICEF, Astana, Kazakhstan, 2005.
UNICEF Macedonia, Child-friendly schools: A situation analysis for FYR Macedonia, UNICEF,
Macedonia, 2007. UNICEF Nicaragua, Evaluation of the friendly and healthy schools initiative‘s school sanitation and
hygiene education component, UNICEF, Managua, Nicaragua, 2005. UNICEF Nigeria, Global writing Workshop: The impact of the child friendly school initiative in Nigeria,
UNICEF, New York, 2005. UNICEF Pakistan, Pakistan: Annual report 2007, UNICEF, New York, 2007. UNICEF South Africa, Progress report for the United Kingdom Committee for UNICEF, UNICEF, Pretoria,
South Africa, 2007. UNICEF Sri Lanka, External evaluation of child friendly schools program in Sri Lanka, MG Consultants
(Pvt.) Limited, Sri Lanka, 2004. UNICEF Thailand, Assessing, monitoring and evaluating the child-friendly school approach: Thailand's
CFS assessment, UNICEF, Bangkok, Thailand, 2006. UNICEF/University of Pittsburgh, ‗The UNICEF Child Friendly Spaces/Environments: Experience in
CEE/CIS TACRO and other Regions‘, [Unpublished draft], August 2004. UNICEF Vanuatu, Vanuatu Child-Friendly Schools Project, Tafea Province: Project Review, UNICEF,
Port Vila, Vanuatu, 2006. Vine, K., Comparison of performance of CFS Schools with non CFS schools in the 2006 grade 5
examinations in the Punjab, UNICEF, New Delhi, 2006.
Wargo, John, The physical school environment: An essential component of a health-promoting school, Information Series on School Health, World Health Organization, Geneva, 2003.
Wehlage, G.G., Rutter, R.A., Smith, G.A., Lesko, N., & Fernandez R. R., Reducing the risk: Schools as communities of support, Falmer Press, London, 1989.
Weiss, I. R., & Pasley, J. D. (2004, February), ‗What is high-quality instruction?‘, Educational Leadership, 61(5), p. 24–28, retrieved 23 April 2007, from http://www.ascd.org/authors/ed_lead/el200402_weiss.html.
Willms, J. D., ‗The challenge of developing new educational indicators‘, Educational Evaluation and Policy Analysis, 17(1), 1995, p. 113–131.
Willms, J. D., & Somers, M. A., ‗Family, classroom, and school effects on children‘s educational outcomes in Latin America‘, School Effectiveness and School Improvement, 12(4), 2001, p. 409–445.
Woessman, L., Schooling resources, educational institutions, and student performance: The international evidence, Kiel working paper (No. 983), Kiel Institute of World Economics, Kiel, Germany, 2000.
Yankelovitch, D., Coming to public judgment, Syracuse University Press, New York, 1992.
Zins, J. E., Weissberg, R. P., Wang, M. C., & Walberg, H. J. (Eds.), Building academic success on social and emotional learning: What does the research say?, Teachers College Press, New York, 2004

188
Acknowledgements Many people contributed to the evaluation and preparation of this report and the authors acknowledge their important contributions. AIR staff who led the site visits to the six countries provided both technical leadership in the field and valuable insights to help us interpret the data: Mona Habib and Susan Skipper Caceres (Guyana); Markus Broer and Olivia Padilla (Nicaragua); Elizabeth Spier and Gwen Willis-Darpo (Nigeria); Luke Shors and Nitika Tolani-Brown (the Philippines and Thailand); and Tom Bewick and Cassandra Jessee (South Africa). Laurence (Lolo) Dessein organized the country site visits in collaboration with UNICEF country offices and supported the field teams from the home office with the support of Rob Hurtekant. Rima Azzam managed the project during the inception phase. Roy Zimmermann managed project logistics in the home office throughout the data collection period. Corbrett Hodson contributed to data analysis and report production. Miguel Socias developed the cost model and conducted analyses for the cost analysis. Elizabeth Spier played a key role in the development of many instruments. Judy Benjamin, Jeff Davis and Jerry Mindes provided quality assurance oversight throughout the project and reviewed drafts of the report and provided valuable suggestions. Mark Strickland of Schoolhouse Partners provided valuable consultation on the cost model and analyses. The authors would like to thank the staff of the UNICEF country offices for the extraordinary effort they made to facilitate our country site visits, before, during and after our time in-country: in Guyana, Sekeywi Carruthers, Deguene Fall and Bhagmattie Bhojedat; in Nicaragua, Anyoli Sanabria, Maria Elena Ubeda and Fatima Aguado; in Nigeria, Maman Sidikou, Valentina Solarin and George Igelegbai; in the Philippines, Lulay de Vera and Martin Ignatius Bernardo; in Thailand, Rangsun Wiboonuppatum and Marut Jatiket; and in South Africa, Andries Viviers, Nadi Albino and Rosaria Kunda. We thank Cream Wright, Changu Mannathoko and Maida Pasic of the Education Section and Sam Bickel and Kathleen Letshabo of the Evaluation Unit of UNICEF Headquarters for their guidance and support throughout the evaluation. Finally, we thank the school heads, teachers, parents and students in the schools we visited for speaking with us about their experiences and the government, donor and NGO representatives that we met with during our site visits for taking the time to meet with us and help us understand CFS in their countries.