child progress index - iasmantra.com
TRANSCRIPT

1
Districts of Uttar Pradesh
CHILD PROGRESS
INDEX
A study by Institute for Competitiveness
Institute for Competitiveness, India is the Indian knot in the global network of the Institute for Strategy and Competitiveness at Harvard Business School. Institute for Competitiveness, India is an international initiative centered in India, dedicated to enlarging and purposeful disseminating of the body of research and knowledge on competition and strategy, as pioneered over the last 25 years by Professor Michael Porter of the Institute for Strategy and Competitiveness at Harvard Business School. Institute for Competitiveness, India conducts & supports indigenous research; offers academic & executive courses; provides advisory services to the Corporate & the Governments and organizes events. The institute studies competition and its implications for company strategy; the competitiveness of nations, regions & cities and thus generate guidelines for businesses and those in governance; and suggests & provides solutions for socio-economic problems
© 2019 The Institute for Competitiveness. All rights reserved. For more information about obtaining additional copies of this or other Institute for Competitiveness publications, please visit IFC's website, www.competitiveness.in
Visit www.competitiveness.in for more information
U 24/8DLF Phase 3Gurgaon 122002Haryana, IndiaPhone: +91-124 437 6676E.mail: [email protected]
ABOUT THE INSTITUTE FOR COMPETITIVENESS
The Institute for Competitiveness

The Institute for Competitiveness
CHILD PROGRESS INDEX
Amit KapoorChairInstitute for Competitiveness, India
Petra KrylovaSenior AnalystSocial Progress Imperative
Aniruddh DuttaaResearcherInstitute for Competitiveness, India
Litmus Ink
Institute for CompetitivenessU 24/8, DLF Phase 3, Gurgaon 122002, Haryana IndiaWebsite: www.competitiveness.in
Abhinandan MenonResearcherInstitute for Competitiveness, India
© 2019 The Institute for Competitiveness. All rights reserved.
Manisha KapoorSenior ResearcherInstitute for Competitiveness, India
Authors
With Inputs from
Research Support
Designed by
Publisher


Content07
09
11
15
19
23
27
31
45
53
55
56
129
130
Preface
Why a Child Progress Index?
Child Progress Index: Framework
How it complements the 2030 Global Agenda for
Sustainable Development?
Methodology
Results: District Level Analysis
How Uttar Pradesh Scores on Child Progress?
Discussion of Results
Child Progress & Economic Development
Learnings & Recommendations
From Indexto Action
Scorecards
References
Appendix 1: District Wise Scores on Child Progress, its
dimensions & components

Child Progress Index | 6

Child Progress Index | 7
PrefaceA society’s future is indubitably tied with its children – how they survive, grow, and thrive. A region that provides
its children with the opportunities to grow and learn,
protect their rights, and presents to them a healthy living
environment will not only help them to create a better life
for themselves but also contribute to society’s growth and
development.
On this front, around 40 percent of the population in India is below 18 years of age. And with a fertility rate of 2.3, which is higher compared to its peers, it will have a substantially high child population during the coming years. Therefore, investment during the early years for the growth and development of children is imperative to reap the future demographic dividend.
However, there are still significant deficits in child progress. Thirty-seven percent of the world’s poor and nearly half of the world’s malnourished children come from the region. According to the 2018 Global Nutrition Report, the country will fail to achieve all the nine nutrition goals set by WHO. In addition to these burdens children also face other societal challenges such as caste and gender discrimination that leaves people, particularly poor, even more vulnerable.
These facts highlight there is an urgent need for the nation to invest in its children. One of the biggest challenges to take up such interventions is the regional level variations that exist in the country. There are some regions that are doing well on the education front and need to invest in healthcare, while there are some that should work towards addressing prejudices that exist in the society that prevent the formation of an inclusive society.
Therefore, Institute for Competitiveness has developed a data-driven measurement tool that can provide insights about different facets of child progress at the regional level. It will equip policymakers, businesses, and NGOs by highlighting the strengths and weaknesses of all the regions and by identifying areas of intervention.
The Child Progress Index draws conceptual antecedents from the Social Progress Index. A multi-stage iterative process was followed to reach the right set of indicators that can capture the wellbeing of children.
The first stage involved identifying a broad set of indicators that met the Social Progress principles. There are numerous publicly available indicators that can be used to reflect the true state of children. The second stage involved interaction with Social Progress Imperative, who provided valuable feedback on the framework as well as the methodology of the index.
The Institute is thankful to everyone who has contributed to this effort.
while under-five deaths have fallen below 1 million for the first time ever. The education landscape has been improved due to rising enrolment and completion rates and addressing gender parity.
2006
2016
In recent times, India has made considerable progress towards ensuring child progress. On the health front, child stunting has declined from
48%
38%

Child Progress Index | 8

Child Progress Index | 9
Why a Child Progress Index?
In the last few decades, the world has made significant
progress towards reducing child mortality, giving millions
of children a better chance of survival. The under-five
mortality rate has declined from 93 deaths per 1000 live
births in 1990 to 39 in 2017. The decline in child mortality
has been steady and encouraging, with the annual rate
of reduction of 3.8 percent in the past two decades. Now,
there is a need to look beyond child survival. It is important
to follow the progress achieved in reducing mortality by
providing opportunities for children to thrive. There are
still around 385 million children living under extreme
poverty; undernourishment is the leading cause for nearly
half the deaths of children under five; nearly 262 million
children and youth aged 6 to 17 were out of school in 2017.
These statistics show that it is imperative to invest in early
child development for breaking the intergenerational cycle
of deprivation and poverty.
While these changes require commitment from every country in the world, India can be a major driving force since it inhabits the world’s child population in the world. India was also one of the major contributors to the progress that the world has registered in child mortality. The rapid economic growth in the country over the past two decades has also resulted in improvements on development indicators such as reduction in poverty headcount ratio that fell fromHowever, there still remain significant challenges from access to
quality education to affordable healthcare. Consider the impact of malnutrition. Since half the women in the country are anaemic, it not only damages their health and cognitive development but also has a negative impact on the development of their children. As a result, India has the largest number of malnourished children in the world.1 Malnourishment results in a high prevalence of stunting (low-height-for-age) and wasting (low-weight-for-height) among Indian children. Evidently, the productive capacity of such children is severely impacted as their brains do not develop fully, and the effect is irreversible. Thus, malnourishment not only affects the current healthcare scenario of the country’s population but also its future economic potential.
Similarly, there are shortcomings in the education ecosystem of the country as well. While India has achieved universal enrolment at the elementary level, reflecting noteworthy improvements in providing basic education, there is a fall in levels of enrolment at the subsequent levels. As per the All India Survey of Higher Education (2017-18), the gross enrolment ratio for higher education is at 25.8 percent, implying that around 74 percent of the youth lack access to higher education severely hindering the future growth prospects of children and thus the country.
1990
2011-12
47.8%
21.9%
universalization of primary education, improvement in the sex ratio and increasing retention rates in school.
1 ASSOCHAM & EY (2017), “Bridging the gap: Tapping the agriculture potential for optimum nutrition”.

Child Progress Index | 10
The widespread issues still prevalent across the country hamper the Prime Minister’s vision of ‘Sabka Saath Sabka Vikas’- inclusive growth-and lead to inequality not only in economic terms but also in opportunity for the most vulnerable sections of the society. Investing in children can help achieve this objective and promote equitable, inclusive societies, allowing more people to effectively participate in their economic development. All children should have access to essential health, educational, and nutritional requirements. Providing these will allow equitable access to better-paying jobs later in life, as well as improve productivity.
The benefits of investing in children far outweigh the costs. Various studies find that investments at relatively low financial costs during childhood in health and education can yield long term gains. For instance, increasing the time that children spend at school enhances their cognitive development and knowledge, enabling them to become a more qualified, productive part of the society as adults in contrast to children who receive less schooling. A study of 139 countries shows that, on average, each year of schooling increases a person’s wages as an adult by nearly 9 percent2.
Also, the benefits of investing in children are not limited to those receiving the investment but are far outreaching. The country can ensure a prosperous future for itself if it successfully taps into the talent of its young, burgeoning population by addressing the challenges that children are facing through adequate investment in early childhood development. A healthy and more educated society benefits everybody. Although there exists some lag between the time when the investments are made, and the time when the society starts experiencing the benefits, these gains can be remarkable and long-lasting.
Furthermore, as the poorest and the most vulnerable sections in the society are unable to make adequate investments on their own, there is a strong rationale for public investment in social sectors linked to children- especially when focussed at those in most need.
Policy choices and interventions made today will determine whether millions of children and youth are able to achieve their full potential or are left to face a future of worsening inequity and marginalization. And the successful implementation of the policies is only possible if they are based on empirical evidence rather than instincts, dogma, or personal experiences. The evidence-based on data improves the government’s ability to manage risks and produce results. To facilitate the data-driven policymaking in the area of child development, the Institute for Competitiveness has developed a framework to access the performance of Indian districts on the same.
The Child Progress Index is a multidimensional tool that would enable policymakers and other stakeholders to monitor how individual districts across India are performing with respect to the wellbeing of their children. The index focusses on what matters to children from basic needs to foundations of wellbeing to the level of opportunity. The results of the index are not just meant to project a snapshot about how regions across India are performing on different aspects relevant to the quality of life of children such as healthcare, education, etc., but also to provide insights about how lives can be improved. The index encourages the spirit of competitive federalism among the Indian districts where regions can draw learnings from the performance of their peers. The pilot study accesses the wellbeing of children across the districts of Uttar Pradesh.
2 Montenegro, C. E., & Patrinos, H. A. (2014). Comparable estimates of returns to schooling around the world. The World Bank.

Child Progress Index | 11
3 Defining a child in India is under constant debate as different laws have different age limits. For this project, individuals between the age of 0 – 18 years are considered as children.
Child Progress Index: Framework
The Child Progress Index that draws conceptual
antecedents from the work on Social Progress focuses
on capturing all the facets of child well-being. It
provides policymakers a tool to better understand how
to improve opportunities for children and enhance
their conditions of livelihood.
Child Progress3 is defined as the “capacity of a society to meet the basic human needs of its children, establish the building blocks that allow children to enhance and sustain the quality of their lives, and create the conditions for all children to reach their full potential.”
Each dimension is then broken down into four components. These components capture different aspects that form the dimension.
BASIC HUMAN NEEDS FOUNDATIONS OFWELL-BEING OPPORTUNITY
The definition alludes three broad dimensions of child progress:
Basic Human Needs
Foundations of Wellbeing
Opportunity
Nutrition and Basic Medical Care
Access to Basic Knowledge Personal Rights
Water and Sanitation
Access to Information and Communications
Personal Freedom and Choice
Shelter Health and Wellness Inclusion
Personal Safety
Environmental Quality
Access to Quality Education
Child Progress Index | 12
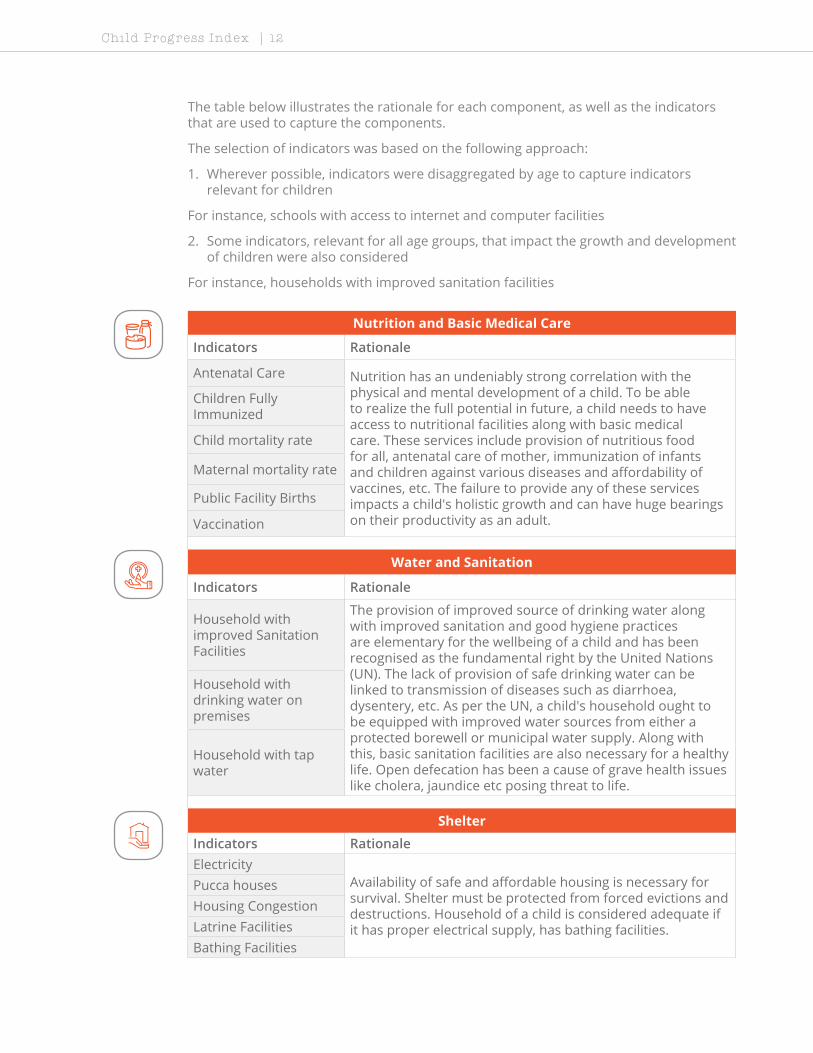
The table below illustrates the rationale for each component, as well as the indicators that are used to capture the components.
The selection of indicators was based on the following approach:
1. Wherever possible, indicators were disaggregated by age to capture indicators relevant for children
For instance, schools with access to internet and computer facilities
2. Some indicators, relevant for all age groups, that impact the growth and development of children were also considered
For instance, households with improved sanitation facilities
Nutrition and Basic Medical Care
Indicators Rationale
Antenatal Care Nutrition has an undeniably strong correlation with the physical and mental development of a child. To be able to realize the full potential in future, a child needs to have access to nutritional facilities along with basic medical care. These services include provision of nutritious food for all, antenatal care of mother, immunization of infants and children against various diseases and affordability of vaccines, etc. The failure to provide any of these services impacts a child's holistic growth and can have huge bearings on their productivity as an adult.
Children Fully Immunized
Child mortality rate
Maternal mortality rate
Public Facility Births
Vaccination
Water and Sanitation
Indicators Rationale
Household with improved Sanitation Facilities
The provision of improved source of drinking water along with improved sanitation and good hygiene practices are elementary for the wellbeing of a child and has been recognised as the fundamental right by the United Nations (UN). The lack of provision of safe drinking water can be linked to transmission of diseases such as diarrhoea, dysentery, etc. As per the UN, a child's household ought to be equipped with improved water sources from either a protected borewell or municipal water supply. Along with this, basic sanitation facilities are also necessary for a healthy life. Open defecation has been a cause of grave health issues like cholera, jaundice etc posing threat to life.
Household with drinking water on premises
Household with tap water
ShelterIndicators RationaleElectricity
Availability of safe and affordable housing is necessary for survival. Shelter must be protected from forced evictions and destructions. Household of a child is considered adequate if it has proper electrical supply, has bathing facilities.
Pucca housesHousing CongestionLatrine FacilitiesBathing Facilities

Child Progress Index | 13
Personal Safety
Indicators Rationale
Rape Crimes
One of the most important elements to define the future development of a child is his/her personal safety. Safe and secure environment is the right of every child. Crime and violence committed against a child are impediments to their mental and emotional well-being
Murder crimes
Kidnapping
Buying Minors for Prostitution
Selling Minors for Prostitution
Access to Basic Knowledge
Indicators Rationale
Primary Enrolment Knowledge has been one of the most important components of human development. It is the most precious 'wealth’ that humans possess and an important factor for the evolution of societies. Today's society is knowledge driven, and knowledge sharing is at the heart of it. It is imperative that children in every society have access to these avenues of knowledge sharing.
Secondary enrolment
Gender parity
Dropout rates
Transition rates
Access to Information and Communication
Indicators Rationale
TV Availability Information and Communication can be viewed as both a means and an end for development of any region. As access to ICT facility not only eases dissemination of information but can also be used to develop critical thinking in a child by means of internet facilities.
Internet Facilities
Phone Availability
Health and Wellness
Indicators Rationale
Underweight Children A person's health is rooted in everyday life. It has a direct bearing on learning, providing for the family, building a home and future or realising their true potential. A healthy population is good for the economy as a whole. This component specifically talks about the health conditions of a child. Taking into consideration anaemia, diarrhoea and stunted as main indicators, this component focusses on how health can be a major part of an individual’s productivity and his/her contribution to the economy.
Acute Respiratory infections
Diarrhoea
Anaemic Children
Stunted Children
Child Progress Index | 14
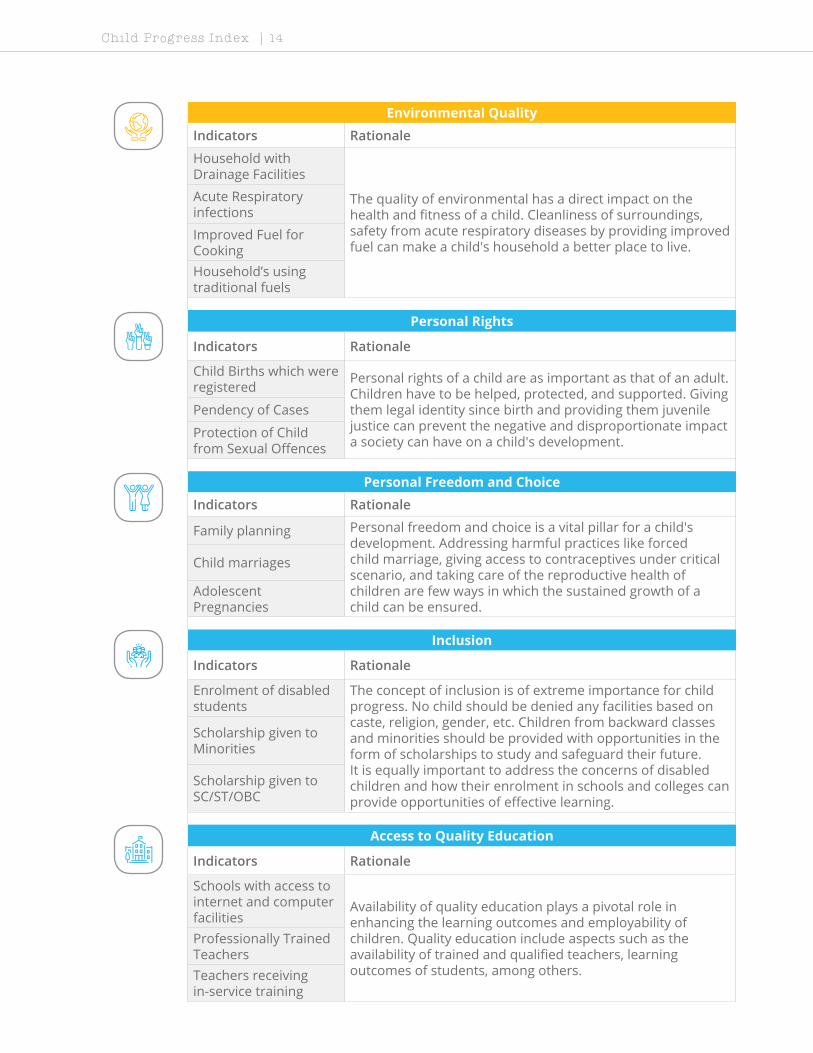
Environmental Quality
Indicators Rationale
Household with Drainage Facilities
The quality of environmental has a direct impact on the health and fitness of a child. Cleanliness of surroundings, safety from acute respiratory diseases by providing improved fuel can make a child's household a better place to live.
Acute Respiratory infections
Improved Fuel for Cooking Household’s using traditional fuels
Personal Rights
Indicators Rationale
Child Births which were registered
Personal rights of a child are as important as that of an adult. Children have to be helped, protected, and supported. Giving them legal identity since birth and providing them juvenile justice can prevent the negative and disproportionate impact a society can have on a child's development.
Pendency of Cases
Protection of Child from Sexual Offences
Personal Freedom and ChoiceIndicators Rationale
Family planning Personal freedom and choice is a vital pillar for a child's development. Addressing harmful practices like forced child marriage, giving access to contraceptives under critical scenario, and taking care of the reproductive health of children are few ways in which the sustained growth of a child can be ensured.
Child marriages
Adolescent Pregnancies
Inclusion
Indicators Rationale
Enrolment of disabled students
The concept of inclusion is of extreme importance for child progress. No child should be denied any facilities based on caste, religion, gender, etc. Children from backward classes and minorities should be provided with opportunities in the form of scholarships to study and safeguard their future. It is equally important to address the concerns of disabled children and how their enrolment in schools and colleges can provide opportunities of effective learning.
Scholarship given to Minorities
Scholarship given to SC/ST/OBC
Access to Quality Education
Indicators Rationale
Schools with access to internet and computer facilities
Availability of quality education plays a pivotal role in enhancing the learning outcomes and employability of children. Quality education include aspects such as the availability of trained and qualified teachers, learning outcomes of students, among others.
Professionally Trained TeachersTeachers receiving in-service training

Child Progress Index | 15
How it complements the 2030 Global Agenda for Sustainable Development?The Child Progress Index, by providing a district-level tool for evidence-based
policy making on aspects such as quality access, personal rights, nutrition,
environmental quality, amongst others, complements the global efforts
towards the Sustainable Development Goals (SDGs).
SDGs represent the commitment by the world leaders for creating a better world by improving the quality of life of all the people across the globe. Having 169 targets grouped in 17 goals, the idea of SDGs set out a universal and an unprecedented agenda which embraces economic, environmental, and social aspects of the society’s well-being. It is an extension of the Millennium Development Goals, which were focused only on least developed or developing countries.
Figure 1: Child Progress Index and Sustainable Development Goals |
Nutrition and Basic Medical Care
Basic Human Needs Foundations of Well-Being Opportunity
Water and Sanitation
Shelter
Personal Safety
Access to Basic Knowledge
Access to Information and Communications
Health and Wellness
Environmental Quality
Source: Social Progress Imperative
Personal Rights
Personal Freedom & Choice
Inclusion
Access to Quality Education

Child Progress Index | 16
Although the goals are universal in scope, children are at the top of the agenda. According to UNICEF4, the greatest responsibility is “to provide children and young people today with the services, skills, and opportunities they need tomorrow to build better futures for themselves, their families, and their societies.” The idea that our future depends on how well we are able to fulfil the needs of the children is at the core of SDGs. There are around 44 children related indicators across the 17 goals. These include the provision of quality antenatal, delivery and postnatal care for mothers and their new-borns, prevention of mother-to-child transmission of HIV, immunization to protect children from infectious diseases, access to adequate and nutritious food.
However, studies suggest that over half a billion of the world’s children live in 64 countries that lack enough data to assess the position of children, India being one of them. And India, with 8 percent of the world’s child population would be a deciding factor in the global achievement of these goals. The biggest data challenge that these countries face is that the vastness in scope of indicators makes it difficult to track them, especially the presence of indicators such as number of students who know how to read and write in their lower secondary standard, mental health among others. The inefficiency in tracking also poses a challenge in implementing policies to achieve these goals. Leaders across the globe are posed with the question of how translating the SDGs into action.
The Child Progress Index offers the provision of capturing the spirit of SDGs. There is a wide stratum of SDG’s that can be looked at and can be measured through the index due to the coherence between the two (Figure 3). However, unlike the SDGs, the Child Progress Index has a general framework that can be aggregated in a single number and can be tracked over time. This Index acts as a means in providing a solution to the problem of capturing, implementation, and as a result achieving these goals till 2030.
There are certain efforts by the government towards measuring these goals, such as National Indicator Framework by (Ministry of Statistics and Program Implementation) MoSPI, SDG India Index by NITI Aayog. The Child Progress Index can add onto these initiatives by providing details at the district level and help India achieve its 2030 SDGs.
4 Atnic, T. M., & Wright, E. G. (2014). Brookings. Retrieved from Brookings.Claeson, M., Bos, E. R., Mawji, T., & Pathmanathan, I. (n.d.). Reducing child mortality in India in the new millennium. Bulletin of the World Health Organization.Cortina, J. M. (1993). What is the co-efficient alpha? An examination of theory and applications . Journal of applied psychology, 78(1),98.Devercelli, A., & Saavedra, J. (2019, April 10). World Bank Blogs. Retrieved from World Bank Group US: https://blogs.worldbank.org/education/world-bank-s-unwavering-commitment-early-childhoodGertler, P., Heckman, J., Pinto, R., Zanolini, A., Vermeersch, C., Walker, S., . . . Grantham-McGregor, S. (2014). Labor Market returns to an early childhood stimulation intervention in Jamaica.

Studies suggest that over half a billion of the world’s children live in
that lack enough data to assess the position
of children, India being one of them.
countries64
Child Progress Index | 17

Child Progress Index | 18
Child Progress Index | 19
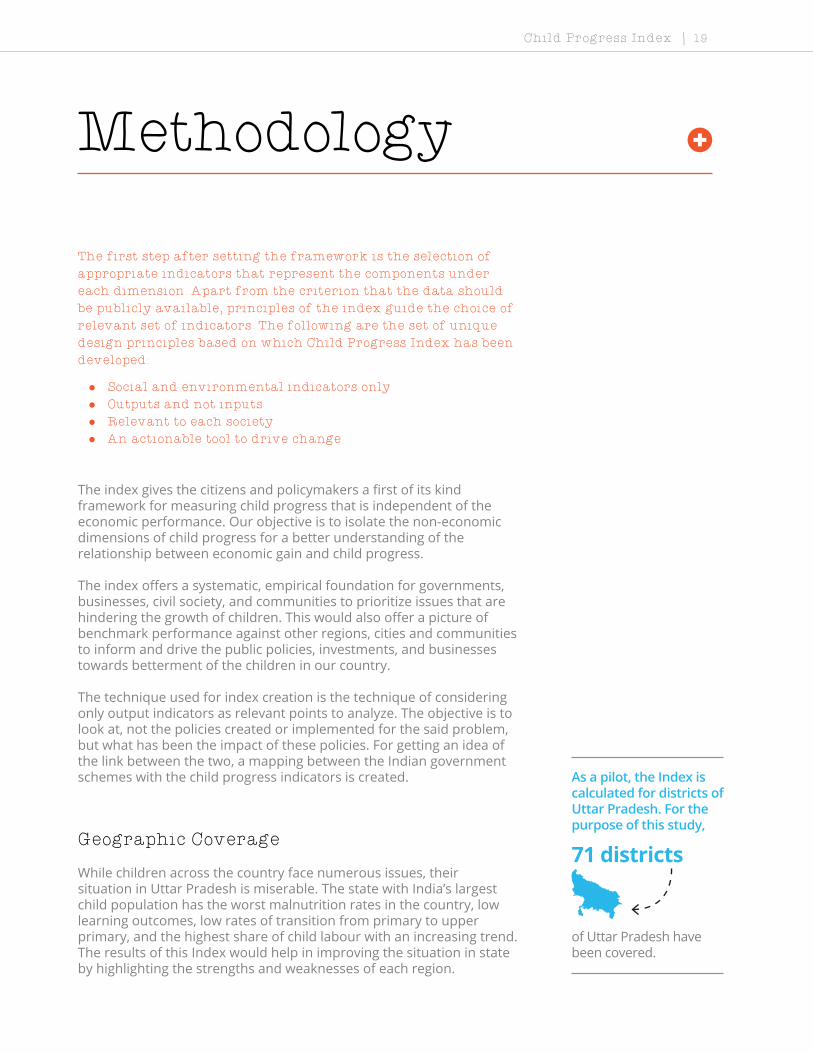
Methodology
The first step after setting the framework is the selection of
appropriate indicators that represent the components under
each dimension. Apart from the criterion that the data should
be publicly available, principles of the index guide the choice of
relevant set of indicators. The following are the set of unique
design principles based on which Child Progress Index has been
developed:
l Social and environmental indicators only
l Outputs and not inputs
l Relevant to each society
l An actionable tool to drive change
Geographic Coverage
The index gives the citizens and policymakers a first of its kind framework for measuring child progress that is independent of the economic performance. Our objective is to isolate the non-economic dimensions of child progress for a better understanding of the relationship between economic gain and child progress.
The index offers a systematic, empirical foundation for governments, businesses, civil society, and communities to prioritize issues that are hindering the growth of children. This would also offer a picture of benchmark performance against other regions, cities and communities to inform and drive the public policies, investments, and businesses towards betterment of the children in our country.
The technique used for index creation is the technique of considering only output indicators as relevant points to analyze. The objective is to look at, not the policies created or implemented for the said problem, but what has been the impact of these policies. For getting an idea of the link between the two, a mapping between the Indian government schemes with the child progress indicators is created.
While children across the country face numerous issues, their situation in Uttar Pradesh is miserable. The state with India’s largest child population has the worst malnutrition rates in the country, low learning outcomes, low rates of transition from primary to upper primary, and the highest share of child labour with an increasing trend. The results of this Index would help in improving the situation in state by highlighting the strengths and weaknesses of each region.
As a pilot, the Index is calculated for districts of Uttar Pradesh. For the purpose of this study,
71 districts
of Uttar Pradesh have been covered.

The case for investing in children during their formative years is compelling. As per World Bank, the first few years of an individual’s life are the most crucial years. Stable livelihood, nurturing relationships and rich learning experiences are factors that do provide lifelong benefits. According to UNICEF, cognitive, emotional and social capacities of a child is what determines their future. Optimizing the early years of children’s lives is the best investment we can make as a society in ensuring their and the country’s future success.
India, since 2018, has entered a 37-year period of demographic dividend. Demographic dividend is the accelerated growth achieved because of increased levels of income, productivity and savings due to change in the age structure of the economy. This can be only achieved when the population is more in the working age group (20-59 years) rather than the dependent age
group i.e. children and elderly. At present, India has a large proportion of population that is young. Approximately 30% of India’s population is in the age group of 0-14 years. Uttar Pradesh being the highest contributor to this, with an estimated child population of 120.9 Million in 2021 (Economic Survey 2018-19), can play a huge role in capitalizing on this and increase their dividend. According to Economic Survey 2018-19, Uttar Pradesh has an increasing proportion of working population till 2041. As shown in the below figure, States like Kerala and Karnataka have a very limited window left for gaining demographic dividend whereas Uttar Pradesh is estimated to have approximately 60% of its population in the working age group of 20-59 years in 2041 (Economic Survey 2018-19). This surely points at an opportunity for Uttar Pradesh to capitalize and transform its child population demographic of present into a boon for its economic growth in the future.
Investing in early childhood has been found to be a cost-effective strategy. According to Professor Heckman’s analysis of the Perry Preschool Program, there is a 7% to 10% per year return on investment based on increased quality schooling years. Along with this, reduced costs have been observed in remedial education, health and criminal justice system expenditures. Early intervention in the health conditions of a child does have a positive influence on the child’s future. According to Brookings, a healthy child transforms into being a vital part of our country’s skilled workforce. By enhancing the efficiency and productivity levels, a child’s future earning would boost by approximately 25% (Heckman’s analysis). This would not only reduce the income disparity but also the achievement gaps that
are present between disadvantaged and privileged peers.
Looking at these implications of early interventions in a child’s life, the policy makers should understand the need to invest in childhood. Improving the conditions of aforementioned factors such as education, health and basic amenities would not only have a positive influence on an individual’s childhood but also would enable the individual to be a productive, self-sustaining and contributing part of the labor force hence, the economy. The children of Uttar Pradesh, if provided with adequate environment for maximized development, would surely play a major role in driving India’s economy to great extents in future.
DEMOGRAPHIC DIVIDEND- The future of Uttar Pradesh
Kerala
56.2
57.3
43.2
44.6
56.2
59.7
48.9
52.7
54.7
59.2
55.9
57.9
52.8
56.9
58.3
60.3
2011 2011 2011 20112021 2021 2021 20212031 2031 2031 20312041 2041 2041 2041
% o
f wor
king
age
po
pula
tion
BiharTamil Nadu Uttar Pradesh
Child Progress Index | 20

Child Progress Index | 21
The calculation of the child progress index is a multi-stage process outlined below:
1. Indicators selection and data collection
The indicators for the child progress index were selected based on discussions with Social Progress Imperative. Along with this, the credibility of the sources, expert feedback, and data availability were also considered. All the data used in the Index were compiled from government sources. A descriptive analysis was performed on the selected indicators. Such an analysis informs decisions pertaining to the variables that should be included in the analysis as well as highlight data management issues, such as coding of variables and missing values.
2. Data Transformation
The indicator set includes some indicators that are positively correlated with the phenomenon that we are trying to capture through the index, while some other indicators that are negatively correlated with the overall index. For example, lower the ratio of child mortality, better the conditions of a child’s livelihood. These indicators, which have a negative effect on the index, must be inverted for the purpose of calculating the index.
3. Data normalization
The next step after data transformation is of data normalization. This involves normalizing the data so that they become comparable with each other. This is done before making any data aggregation because the indicators have different units. For instance, child mortality is a ratio, but the number of wasted children is in percentage, which makes these indicators incomparable by any standard. The normalization procedure is carried out to make every data point into dimensionless numbers.
Normalization is done using Z-scores that can be used in a normal distribution. A Z-score is the number of standard deviations a data point is from the mean. It ranges from -3 S.D to a +3 S.D. Standardization rescales the indicators with a mean of zero and standard deviation of one to make them comparable with each other.
4. Evaluating the fit
The selection process of indicators includes indicators that describe the concept best as well as are conceptually linked to each other. The rigor of the Child Progress Index methodology is strengthened by assessing multiple aspects of fit between the indicators. First the exploratory factor analysis is used to test the underlying factors among the set of selected indicators in each component. In this process, the indicators that are statistically incompatible are removed. Furthermore, the methodology involves
The following formula is used:
Z=(X-μ)/σ
Index Calculation
Indicator Selection and Data Collection
Dealing with Missing Values
Data Transformation
Evaluating the Fit
Aggregation
1
2
3
4
5
Where, Z represents the Z-scoreX is the indicator value µ is the mean σ is the standard deviation

Child Progress Index | 22
evaluating the fit between the individual indicators by calculating Cronbach’s alpha for each component.
Alpha was developed by Lee Cronbach in 1951, which provided a measure of the internal consistency of a text or scale, it is expressed as a number between 0 to 1 (Tavakol and Dennick 2011). Internal consistency is the extent that all the items in a test measure the same concept or construct and hence it is connected to the inter-relatedness of the items within the test. Internal consistency can be employed for research or examination process to ensure validity. An applied practitioner’s rule of thumb is that the alpha value should be above 0.7 for any logical grouping of variables (Cortina, 1993)
5. Aggregation
Component Scores
The child progress index uses the technique of Principal Component Analysis along with expert opinions for calculating the weights of indicators within a pillar.
The component values are calculated by summing the weighted indicator scores using the following formula
COMPONENT= ∑(w(i)*Indicator Scores)
Dimension(d)= ∑(w(i)*component)
These scores are then be transformed into a 0 to 100 scale, using the following formula:
Where “X” is the district score
Dimension Scores
Each dimension score is taken to be a weighted average of its components.
Index Scores
The final index score is the weighted average of the three-dimension scores and is calculated as follows:
(X-Minimum Score)
Child Progress Score =W(i) * (Scores of Basic Human Needs) + W(i) * (Scores of Foundations of Well-Being) + W(i) * (Scores of Opportunity)
(Maximum Score-Minimum Score)
Child Progress Index | 23
Child Progress Score
26.58 69.10
Pivot Field Values
Map based on Longitude (generated) and Latitude (generated). Color shows sum of Pivot Field Values.Details are shown for District. The data is filtered on Pivot Field Names, which keeps Child Progress Score.
Figure 3: Child Progress Index Scores
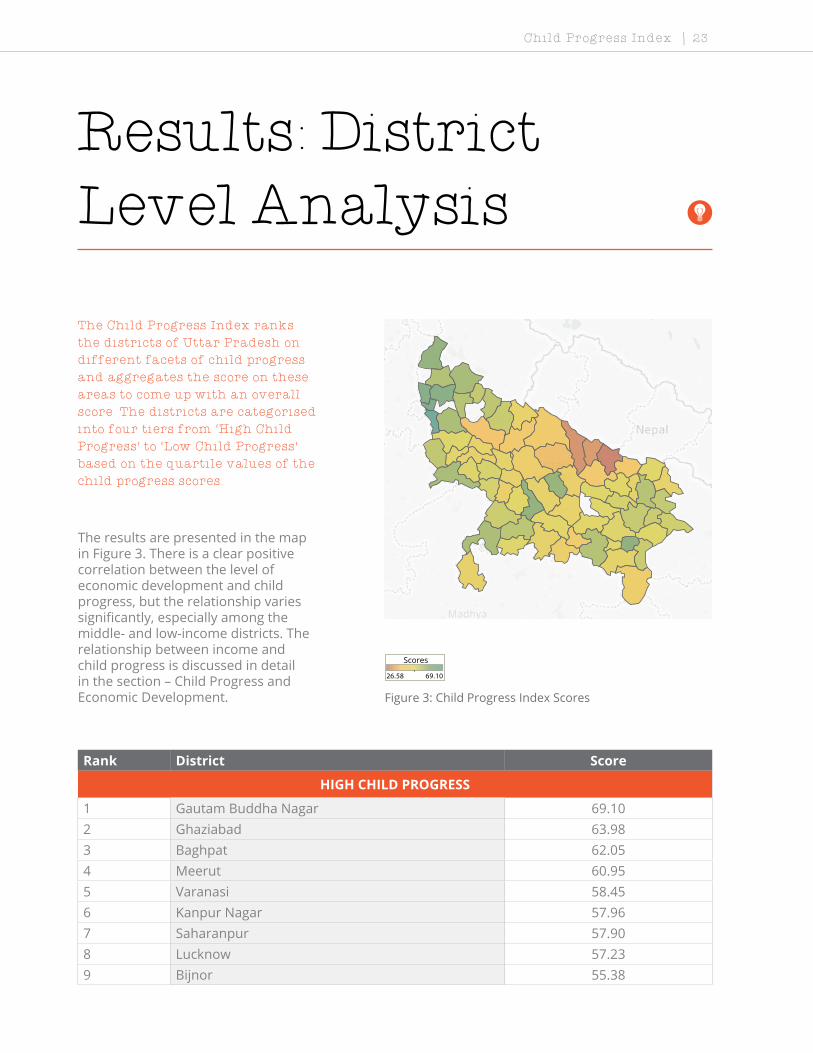
Results: District Level Analysis
The Child Progress Index ranks
the districts of Uttar Pradesh on
different facets of child progress
and aggregates the score on these
areas to come up with an overall
score. The districts are categorised
into four tiers from ‘High Child
Progress’ to ‘Low Child Progress’
based on the quartile values of the
child progress scores.
The results are presented in the map in Figure 3. There is a clear positive correlation between the level of economic development and child progress, but the relationship varies significantly, especially among the middle- and low-income districts. The relationship between income and child progress is discussed in detail in the section – Child Progress and Economic Development.
Rank District Score
HIGH CHILD PROGRESS
1 Gautam Buddha Nagar 69.102 Ghaziabad 63.983 Baghpat 62.054 Meerut 60.955 Varanasi 58.456 Kanpur Nagar 57.967 Saharanpur 57.908 Lucknow 57.239 Bijnor 55.38
Scores

Child Progress Index | 24
10 Agra 55.1511 Jhansi 54.7012 Bulandshahr 54.6813 Muzaffarnagar 53.8814 Allahabad 53.5315 Gorakhpur 53.3716 Jyotiba Phule Nagar 53.3317 Hamirpur_UP 52.5318 Rampur 52.33
UPPER MIDDLE CHILD PROGRESS
19 Mathura 51.9720 Deoria 51.7421 Moradabad 51.6222 Azamgarh 51.4123 Bareilly 51.0624 Chandauli 50.6625 Mau 50.6526 Jalaun 50.5727 Ballia 50.0628 Ambedkar Nagar 49.4529 Etawah 49.4430 Mainpuri 49.1431 Jaunpur 48.3732 Aligarh 48.2633 Mahoba 48.2434 Firozabad 48.1835 Faizabad 48.1236 Ghazipur 47.98
LOWER MIDDLE CHILD PROGRESS
37 Sultanpur 47.8438 Mahrajganj 47.3539 Basti 47.2740 Kanpur Dehat 47.1841 Fatehpur 46.8342 Pratapgarh_UP 46.8043 Sant Ravidas Nagar (Bhadohi) 46.2944 Mahamaya Nagar 45.8245 Mirzapur 45.5446 Farrukhabad 45.34

Child Progress Index | 25
47 Kushinagar 45.0948 Banda 44.5849 Sant Kabir Nagar 44.4850 Unnao 44.4551 Rae Bareli 43.9652 Kanshiram Nagar 43.9353 Pilibhit 43.93
LOW CHILD PROGRESS
54 Kannauj 43.8255 Lalitpur 43.6956 Etah 43.6957 Auraiya 42.5758 Bara Banki 42.5759 Sonbhadra 41.8860 Hardoi 41.3061 Chitrakoot 41.3062 Kaushambi 40.0363 Kheri 39.5964 Gonda 38.7065 Shahjahanpur 38.5666 Siddharthnagar 38.1067 Budaun 36.7568 Sitapur 35.8069 Shrawasti 30.2470 Bahraich 29.0271 Balrampur 26.58
The child progress index reveals significant differences among the districts of Uttar Pradesh.
• Eighteen districts in the state represent the “top tier” in terms of child progress and register relatively strong performance across all three dimensions. The average dimension scores for the tier are: Basic Human Needs is 67.70, Foundations of Wellbeing is 53.74, and Opportunity is 49.64. These districts show generally strong performance on Water and Sanitation, Shelter, and Access to Information and Communication. Nearly all the districts in this tier are among the relative high-income bracket, but not all high- or upper-middle-income districts rank in the top half of child progress districts.
• The next eighteen districts in the upper-middle child progress trier have tightly clustered overall scores from 51.97 to 41.98. The districts in this tier perform best on Basic Human Needs, averaging 55.38, followed by Foundations of Wellbeing (47.89) and Opportunity (49.64). They also score highly on Access to Basic Knowledge and Health and Wellness. On some components, a high variance in performance is also observed:

Child Progress Index | 26
Ambedkar Nagar is the leading performer on Personal Safety in the state with a score of 98.40; however, Aligarh ranks last (38.34) due to high child rate in the district. Five of the eighteen districts are among the lowest income districts in the state.
High Child Progress 67.70
55.38
49.21
41.96
53.74
47.89
45.58
39.01
49.64
46.22
42.28
34.72
Upper Middle Child Progress
Lower Middle Child Progress
Low Child Progress
Tier Basic Human Needs
Foundations of Wellbeing Opportunity
Average performance across different tiers of districts
• The third group of seventeen districts forms the lower middle child progress tier. The overall scores across the districts record extremely low variance with only 4 points separating the 37th ranked Sultanpur from Pilbhit at 53. The average scores for this tier are: Basic Human Needs is 49.21, Foundations of Wellbeing is 45.58, and Opportunity is 42.28. Compared to higher tiers, the districts in this tier perform better on Access to Basic Knowledge and Health and Wellness with an average score of 59.75 and 60.87, respectively.
• A final group of seventeen districts registers the lowest levels of child progress in the state from Kannauj (43.82) to Balrampur (26.58). The districts in this tier account for around one-fourth of Uttar Pradesh’s child population underlining the need to invest in child progress as even basic necessities elude a high proportion of children in the state. The group consists of districts at different levels of economic development. The inclusion of Sonbhadra and Chitrakoot, the two high-income districts in this group, highlights that higher per capita GDP does not guarantee that the region would provide its children with better facilities to learn and grow.

Child Progress Index | 27
5 The average score for Uttar Pradesh is calculated by weighting the score of each district by population and then summing across district.
Figure 4: Scores of Uttar Pradesh on Child Progress, its dimensions, and components
How Uttar Pradesh Scores on Child Progress?
The district-level analysis, once averaged5, provides valuable
insights about how the state of Uttar Pradesh performs on
parameters of child progress (Figure 4). The overall score of Uttar
Pradesh is 48.18, placing between districts of Faizabad (48.12)
and Firozabad (48.18). Among the dimensions, it achieves the best
results in Basic Human Needs (54.60), followed by Foundation of
Wellbeing (46.84). Opportunity, that captures whether children
have freedom to make their own choices, is the most challenging
aspect of child progress with a score of 43.09. This shows the
performance of state is best when it comes to providing basic
necessities such as Shelter, Water, and Sanitation, etc but become
increasingly challenging as the complexity of the provision of
services increase.
Child
Pro
gres
s Sc
ore
Scor
e
0
40
20
60
10
50
30
70
80
Acc
ess
to In
form
atio
n an
d Co
mm
unic
atio
n
Bas
ic H
uman
Nee
ds
Hea
lth
and
Wel
lnes
s
Nut
riti
on a
nd B
asic
M
edic
al C
are
Envi
ronm
enta
l Q
ualit
y
Wat
er a
nd
Sani
tati
on
Opp
ortu
nity
Shel
ter
Pers
onal
Ri
ghts
Pers
onal
Saf
ety
Pers
onal
fre
edom
an
d Ch
oice
Foun
dati
ons
of
Wel
lbei
ng
Incl
usio
n
Acc
ess
to B
asic
Kn
owle
dge
Acc
ess
to Q
ualit
y Ed
ucat
ion

The score of Uttar Pradesh on child
progress
reveals that there are systematic issues
that are preventing the growth and
development of children within the state.
on a scale of 0-100,48.18
Child Progress Index | 28

Child Progress Index | 29
A closer analysis of the 12 components that form these dimensions demonstrates that the performance of the state is best on Personal Safety, Personal Freedom and Choice, and Nutrition and Basic Medical Care. The areas that require immediate attention comprises Inclusion, Access to Information and Communication, Access to Quality Education, and Water and Sanitation. The progress in these areas is essential to India’s success in the 2030 Agenda for Sustainable Development, and since Uttar Pradesh inhabits 42 percent of India’s child population it is important for the state to address these concerns.
A final peek into the state-level analysis is presented in Figure 5, which shows the variation in the performance of districts across dimensions and components. The figure illustrates that the degree of variation varies across different aspects of child progress. There are some areas in which the districts perform uniformly, and their scores have a low range compared to others.
In absolute terms, the highest variation is experienced in Water and Sanitation, where district scores range from almost 0 to 90. Since there are some districts that have achieved high progress they can serve as examples for other districts that are lagging. The lowest variation is observed in Personal Rights where scores are clustered within 21 and 79.
These results are aligned with the Global Youth Progress Index where the biggest difference is within Water and Sanitation and the smallest on Personal Rights. This highlights that across the world providing necessities such as Water and Sanitation, which is a region-specific thing has high variation. There are some regional level policymakers that are making more concerted efforts to provide their children with better living conditions and can serve as role models for others.
Pivot Field Names
ChildProgress
Index
Basic HumanNeeds
Nutrition &Basic Medical
Care
Water &Sanitation
Shelter PersonalSafety
Foundationsof Wellbeing
Access toBasic
Knowledge
Access toInformationTechnology
Health &Wellness
Environmental Quality
Opportunity PersonalRights
PersonalFreedom and
Choice
Inclusion Access toQuality
Education
0
10
20
30
40
50
60
70
80
90
100
Scor
es
Gautam Buddha Nagar
Gautam Buddha Nagar
Gautam Buddha Nagar
Gautam Buddha Nagar
Gautam Buddha Nagar
Gautam Buddha Nagar
Mahamaya NagarKanshiram Nagar
Sant Kabir Nagar
Muzaffarnagar
Shahjahanpur
Bulandshahr
Kushinagar
Kaushambi
Sonbhadra
Ghaziabad
GhaziabadGhaziabad
Chitrakoot
BalrampurBalrampur
Balrampur
Balrampur
Balrampur
BalrampurShrawasti
ShrawastiMirzapur
Bahraich
Bahraich
Bahraich
Bahraich
Mahoba
Jaunpur
Budaun
MeerutBareilly
Sitapur
SitapurPilibhit
Jalaun
Mau
Box and WhiskersPivot Field Names
Child Progress IndexBasic Human NeedsNutrition & Basic Medical CareWater & SanitationShelterPersonal SafetyFoundations of WellbeingAccess to Basic KnowledgeAccess to Information TechnologyHealth & WellnessEnvironmental QualityOpportunityPersonal RightsPersonal Freedom and ChoiceInclusionAccess to Quality Education
Sum of Pivot Field Values for each Pivot Field Names. Color shows details about Pivot Field Names. The marks are labeled by District. Details are shown for District.
Figure 5: Variation within the state
Child Progress Index | 30

Child Progress Index | 31
Discussion of Results
A more illuminating analysis that can provide the policymakers
with actionable insights is the evaluation of the components that
form the Child Progress Index. The examination of components can
help in identifying the areas that are creating challenging across
every district in the state and would also bring out the areas in
which almost all the districts are performing well. Moreover, this
would help districts in ascertaining any specific challenges that
they face and identifying the peer districts from whom they can
draw learning to move forward.
Based on careful examination, the components are divided into three categories:
• Leading Components This includes areas in which the performance of all the districts is above
average.
• Progressing Components This includes areas in which some districts are performing well, while
some others are lagging behind.
• Challenging Components This includes the areas in which the performance of almost all the
districts is below average.
Leading Components Progressing Components
Challenging Components
Nutrition and Basic Medical Care
Access to Information and Communication
Access to Quality Education
Access to Basic Knowledge
Environmental Quality Inclusion
Personal Freedom and Choice
Health and Wellness
Personal Safety Personal RightsShelterWater and Sanitation

Child Progress Index | 32
The following components are the best-performing aspects within the Child Progress Index for the state of Uttar Pradesh. This section discusses their individual performance in greater depth to identify the regional variations that are hidden underneath the averages and the means to improve them.
Nutrition and Basic Medical Care
The developments in Uttar Pradesh in the area of medical care are clearly reflected by the index, leading to an average score of 59.1. A potential contributing factor for these advancements lies in the Millennium Development Goals (MDGs), which included targets focusing on various aspects of the Nutrition and Basic Medical Care component, such as child and maternal mortality. The indicators captured are also a part of the 2030 Sustainable Development Goals (SDGs) agenda.
Though, a score of 59 also reflects that there is immense scope of improvement for the state and its districts. They can devise strategies based on specific areas in which they are facing challenges by drawing learnings from their peers.
The district scores range from 20 to 85; however, there are just 15 districts that have a score of lower than 50. These districts lie mainly in the central region of Uttar Pradesh. They can draw insights from high performing districts – Baghpat (85), Deoria (82), Kanpur Nagar (81), and Chandauli (79) that have managed to achieve goals related to child healthcare.
The category of over performers includes only four districts – Meerut, Gorakhpur, Ghaziabad, Pratapgarh, and they belong to all the income categories. Despite the high and clustered absolute performance of almost all the districts, there are a large number of districts that underperform compared to their peers.
Leading Components
District
Meerut
Gorakh
purGha
ziabad
Pratapg
arh_UP Bas
tiAlig
arhPilib
hitSult
anpur
Mahoba
Lalitpu
rJyot
iba Phu
le Naga
rChit
rakoot
Etawah
Saharan
purFiro
zabad Mau
Mirzap
urBula
ndshah
rSan
t Ravida
s Naga
r (B..
Kushina
garRam
purJau
npur
Auraiya
Allahab
adSan
t Kabir
Nagar
Banda
Ghazipu
rUnn
aoMat
hura
Fatehpu
rSon
bhadra
Shahjah
anpur
Faizaba
dKan
nauj
Morad
abad
Mainpu
riBare
illyGon
daBud
aunKau
shamb
iKhe
ri Etah Hardoi
Bara Ban
kiFarr
ukhaba
dSita
purSidd
harth na
garKan
shiram
Nagar
Shrawa
stiBalr
ampur
Bahraic
h
-45
-40
-35
-30
-25
-20
-15
-10
-5
0
5
Overperformance and Underperformance
-44.75 6.09
From Boundary wi..
Sum of From Boundary with Sign for each District. Color shows sum of From Boundary with Sign. The data is filtered on Indicator, which keeps Nutrition and Basic Medical Care. The viewis filtered on sum of From Boundary with Sign, which keeps non-Null values only.
Nutrition & Basic Medical Care
20.01 85.44
Pivot Field Values
Map based on Longitude (generated) and Latitude (generated). Color shows sum of Pivot Field Values. Details are shown for District. The data is filtered on Pivot FieldNames, which keeps Nutrition & Basic Medical Care.
Overperformance and Underperformance
Amou
nt o
f Und
erpe
rfor
man
ce/O
verp
erfo
rman
ce
Scores

Child Progress Index | 33
Access to Basic Knowledge
Without acquiring the right skill set and knowledge from an early stage in life, children face countless barriers to earning potential and employment. They are more likely to fall into the poverty trap, more likely to suffer adverse health consequences, and less likely to make political contributions in the decisions that affect them – threatening their ability to build a create a better society for themselves. This makes it imperative for every region to invest in and ensure that no child is excluded from learning.
The average score of Uttar Pradesh on this component – 56 reflects that the state is performing relatively well in this area compared to other aspects of child progress. It can be attributed mainly to the progress made during the last decade in enrolment rates for all as well as improving the gender parity in school education. This reflects success in an area that has been the focus of the Indian government as well as the global SDG commitment.
The district scores are mostly clustered between 50 and 80, with just 15 districts scoring below 19. The best performing districts include – Allahabad (80), Kannauj (75), Ghazipur (74), Basti (73), Fatehpur (71), and Baghpat (71). The highest score of 80 depicts that even the best performing districts have to work on certain areas, which includes transition and dropout rates.
On a relative basis, there are 46 districts that underperform compared to their peers. The range of underperformance varies significantly from -0.33 to -41.66. Despite the improved performance of most of the districts on this aspect, there is still a long way to go for Uttar Pradesh. Districts have to focus more on the data-driven policymaking that can guide investments in the areas where they are needed the most.
District
Baghpa
tLali
tpur
Varana
siSah
aranpur
Chanda
uliAur
aiya Gonda
Jhansi
Gautam
Buddha
Nagar
Mainpu
riKan
shiram
Nagar
Deoria
Azamg
arhGor
akhpur
Sant Ra
vidas N
agar (B
..Chi
trakoot
Faizaba
dKus
hinagar
Mahama
ya Naga
rBall
iaBijn
orMat
hura
Pilibhit
Jalaun
Bara Ba
nkiSita
purBula
ndshah
rKhe
riRam
purFiro
zabad
Mirzap
urBan
daHar
doiSha
hjahanp
urSidd
harthna
garBar
eillySult
anpur
Kausha
mbi
Agra
MauShr
awasti
Aligarh
Bahraic
hMee
rutMo
radaba
dGha
ziabad
Budaun
Muzaff
arnagar
Rae Bar
eliBalr
ampur
-40
-35
-30
-25
-20
-15
-10
-5
0
5
10
Overperformance and Underperformance
-41.66 7.89
From Boundary wi..
Sum of From Boundary with Sign for each District. Color shows sum of From Boundary with Sign. The data is filtered on Indicator, which keeps Access to Basic Knowledge. The view isfiltered on sum of From Boundary with Sign, which keeps non-Null values only.
Access to Basic Knowledge
19.53 80.36
Pivot Field Values
Map based on Longitude (generated) and Latitude (generated). Color shows sum of Pivot Field Values. Details are shown for District. The data is filtered on Pivot FieldNames, which keeps Access to Basic Knowledge.
Overperformance and Underperformance
Scores
Amou
nt o
f Und
erpe
rfor
man
ce/O
verp
erfo
rman
ce

Child Progress Index | 34
Personal Freedom and Choice
Considering the prevalence of child marriages and adolescent pregnancies, the personal freedom and choice of children forms an important component of child progress. Regions at early stages of development where even the most basic human needs are left wanting at times, usually perform poorly on such aspects of well-being. It is, thus, a positive achievement for Uttar Pradesh to have personal freedom and choice among the leading components of the index.
The state has an average score of 66.07. Saharanpur has emerged as the best-performing district on this component, with a score of 92.72. However, despite the promising outlook of the state on the aspect of personal freedom and choice, issues like child marriages are quite pertinent to the state of Uttar Pradesh. The district of Shrawasti, for instance, has a particularly high incidence of child marriage and the highest fertility rate in the country.6 The lack of access to contraceptives can be a leading cause for the latter. Unsurprisingly, the district is also the worst performer on the component with a score of 15.11.
The scope for improvement even shows up when the districts are compared with their peer groups. As shown in the second illustration, more than 50 districts under-perform compared to their peers and can make rapid advancements towards the median value of their peers simply by drawing learnings from their policy experience. Considering the state is one of the laggards on these aspects of child progress when compared on a national scale, addressing these issues should gain prominence in state policy. Since these are behavioural issues, their returns will only become evident over the long run.
District
Meerut
Morad
abad
Pratapg
arh_UP
Pilibhit
Rae Bar
eliAur
aiyaJau
npur
Allahab
adKau
shamb
iUnn
aoBula
ndshah
rGor
akhpur
Kanpur
Dehat
Deoria
Sultanp
urFaiz
abad
Hamirpu
r_UP
Kannau
jVar
anasi
Aligarh Ball
iaFiro
zabad
Mainpu
riBar
a Banki
Jalaun Agr
aHar
doiSan
t Ravida
s Naga
r (B..
Gautam
Buddha
Nagar
Ghazipu
rBas
tiEtaw
ahJha
nsiSan
t Kabir
Nagar
Shahjah
anpur
Kanshir
am Nag
arMir
zapur
Kushina
garMah
rajganj
Farrukh
abad
Mahoba
Mahama
ya Naga
rEtah
Chitrak
ootCha
ndauli
Sonbha
draSita
pur Kheri
Siddhart
hnagar
Mathur
aBud
aun Gonda
Balramp
urLali
tpur
Bahraic
hShr
awasti
-60
-50
-40
-30
-20
-10
0
10
Overperformance and Underperformance
-60.36 11.72
From Boundary wi..
Sum of From Boundary with Sign for each District. Color shows sum of From Boundary with Sign. The data is filtered on Indicator, which keeps Personal freedom and Choice. The view isfiltered on sum of From Boundary with Sign, which keeps non-Null values only.
Personal Freedom and Choice
15.11 92.72
Pivot Field Values
Map based on Longitude (generated) and Latitude (generated). Color shows sum of Pivot Field Values. Details are shown for District. The data is filtered on Pivot FieldNames, which keeps Personal Freedom and Choice.
6 Khandelwal, S. (2018). Early to Wed, The Caravan.
Overperformance and Underperformance
Scores
Amou
nt o
f Und
erpe
rfor
man
ce/O
verp
erfo
rman
ce

Child Progress Index | 35
Personal Safety
A final component where Uttar Pradesh performs relatively well is ‘Personal Safety.’ The state has secured an average of 73.29, which is the highest among all components within the index. It also has the lowest variation among states with the best-performing district, Ambedkar Nagar, having a score of 98.4 while the district with the poorest performance, Mahamaya Nagar, has a score of 34.3. Thus, the range of 64.1 between districts is the lowest among all components.
However, such a performance does not imply there can be complacency on the part of the state and local governments on this front. The aspect of personal safety always carries the scope for further improvement. Children must grow in an environment that is safe and conducive to their holistic development. The prevalence of crime against children can impede their progress in society in significant ways.
Moreover, the fact that more districts are underperformers relative to their peers than there are over-performers points towards the scope for improvement that remains on the component of personal safety. Therefore, despite the improved performance of the state on this front, the state government should seek ways to ensure that the children across the state are provided with a safe and nurturing environment. To begin with, the under-performing districts provide viable regional focus areas.
District
Shrawa
stiLali
tpur
Baghpa
tGha
zipur
Mahrajg
anjKus
hinagar Mau
Varana
siGon
daMo
radaba
dSon
bhadra
Muzaff
arnagar
Mathur
aAgr
aKau
shamb
iKan
pur Na
garGha
ziabad
Bahraic
hRam
purBar
eilly Deoria
Budaun
Farrukh
abad
Faizaba
dGor
akhpur Khe
riJha
nsiLuc
know
Sitapur
Jyotiba
Phule N
agar
Kanshir
am Nag
arBijn
orPilib
hitFate
hpur
Banda
Balramp
urEtaw
ahChi
trakoot
Auraiya Unn
aoKan
nauj
Meerut
Mahoba
Firozab
adSha
hjahanp
urGau
tam Bud
dha Na
gar Etah Aligarh
Mahama
ya Naga
r-45
-40
-35
-30
-25
-20
-15
-10
-5
0
5
10
Overperformance and Underperformance
-43.77 9.29
From Boundary wi..
Sum of From Boundary with Sign for each District. Color shows sum of From Boundary with Sign. The data is filtered on Indicator, which keeps Personal Security. The view is filtered onsum of From Boundary with Sign, which keeps non-Null values only.
Personal Safety
34.30 98.40
Pivot Field Values
Map based on Longitude (generated) and Latitude (generated). Color shows sum of Pivot Field Values. Details are shown for District. The data is filtered on Pivot FieldNames, which keeps Personal Safety.
Overperformance and Underperformance
Scores
Amou
nt o
f Und
erpe
rfor
man
ce/O
verp
erfo
rman
ce

Child Progress Index | 36
The following components are the ones where the districts of Uttar Pradesh are showing significant progress but still have scope for improvement. These can be said to be the low-hanging fruits for the state and can give the highest return with slightly improved focus.
Access to Information and Communication
With an average score of 30.15, access to information and communication is one of the most concerning components on the Child Progress Index. Only the component of inclusion has a poorer performance on an average. It does not come as a surprise that districts with prominent cities of Uttar Pradesh perform the best on the provision of information and communication – Gautam Buddha Nagar (97.09), Ghaziabad (69.38), Lucknow (58.97), Agra (58.9) and Meerut (55.63) being the leading districts. The disparity between the best and worst-performing districts is also significantly high for this component, with Sharawasti scoring a humble 10.
However, better provision of information and communication across the districts of the state is crucial because such advancements can help children access better services, like education, for instance, that are otherwise difficult to access in economically weaker areas. Better access to information and communication can also provide the government with necessary cost-effective infrastructure to deliver such quality services to children. Therefore, the betterment of this component can result in child development in other related areas as well.
The accompanying figure of over-performing and under-performing districts paints a similar picture. Apart from three districts (Aligarh, Kanpur Nagar and Bulandshahr), most regions are under-performing in their respective peer groups. This implies that most districts perform lower than expected based on deviation from median score of the peer group. The scope for improvement in access to education and communication, thus, is immense and the government should begin by targeting the worst-performing districts.
Progressing Components
Access to Information Technology
10.01 97.09
Pivot Field Values
Map based on Longitude (generated) and Latitude (generated). Color shows sum of Pivot Field Values. Details are shown for District. The data is filtered on Pivot FieldNames, which keeps Access to Information Technology.
District
Kanpur
Nagar
Aligarh
Bulands
hahr
Sultanp
urJha
nsiGor
akhpur
Mirzap
urBag
hpat
Sonbha
draSan
t Ravida
s Naga
r (Bhad
..Bijn
orCha
ndauli
Deoria
Mahama
ya Naga
rAza
mgarh Bas
ti EtahFaiz
abad
Saharan
purEtaw
ahJala
unAur
aiya Ballia
Ghazipu
rJau
npur
Rae Bar
eli MauSan
t Kabir
Nagar
Firozab
adFarr
ukhaba
dJyot
iba Phu
le Naga
rMai
npuri
Rampur
Pratapg
arh_UP
Hamirpu
r_UP
Shahjah
anpur
Fatehpu
rAm
bedkar
Nagar
Morad
abad
Unnao
Gonda
Bahraic
hBud
aunBar
a Banki
Chitrak
ootKan
shiram
Nagar
Kannau
jKau
shamb
iMah
oba Banda
Kanpur
Dehat Khe
riMah
rajganj
Balramp
urSita
purHar
doiPilib
hitKus
hinagar
Siddhart
hnagar
Lalitpu
rShr
awasti
-25
-20
-15
-10
-5
0
5
10
Overperformance and Underperformance
-25.68 11.99
From Boundary with ..
Sum of From Boundary with Sign for each District. Color shows sum of From Boundary with Sign. The data is filtered on Indicator, which keeps Access to Information and Communication. The view is filtered on sumof From Boundary with Sign, which keeps non-Null values only.
Overperformance and Underperformance
Scores
Amou
nt o
f Und
erpe
rfor
man
ce/O
verp
erfo
rman
ce
Child Progress Index | 37
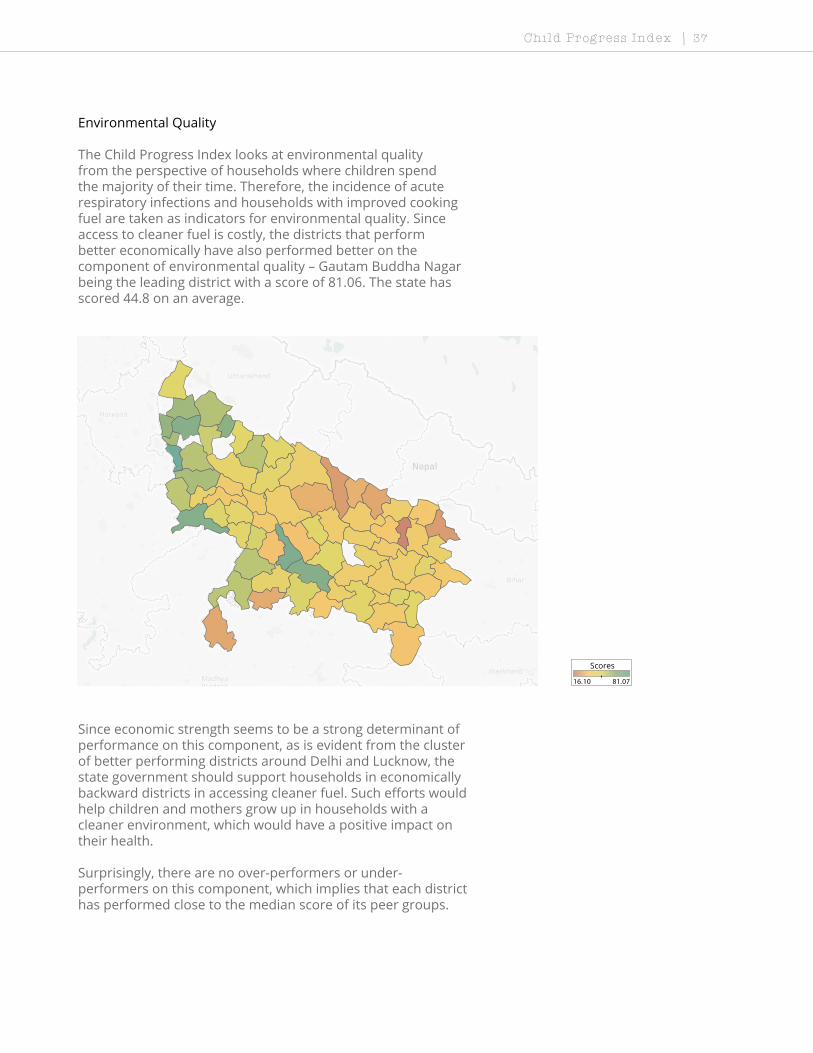
Environmental Quality
The Child Progress Index looks at environmental quality from the perspective of households where children spend the majority of their time. Therefore, the incidence of acute respiratory infections and households with improved cooking fuel are taken as indicators for environmental quality. Since access to cleaner fuel is costly, the districts that perform better economically have also performed better on the component of environmental quality – Gautam Buddha Nagar being the leading district with a score of 81.06. The state has scored 44.8 on an average.
Since economic strength seems to be a strong determinant of performance on this component, as is evident from the cluster of better performing districts around Delhi and Lucknow, the state government should support households in economically backward districts in accessing cleaner fuel. Such efforts would help children and mothers grow up in households with a cleaner environment, which would have a positive impact on their health.
Surprisingly, there are no over-performers or under-performers on this component, which implies that each district has performed close to the median score of its peer groups.
Environmental Quality
16.10 81.07
Pivot Field Values
Map based on Longitude (generated) and Latitude (generated). Color shows sum of Pivot Field Values. Details are shown for District. The data is filtered on Pivot FieldNames, which keeps Environmental Quality.
Scores

Child Progress Index | 38
Health & Wellness
20.35 88.17
Pivot Field Values
Map based on Longitude (generated) and Latitude (generated). Color shows sum of Pivot Field Values. Details are shown for District. The data is filtered on Pivot FieldNames, which keeps Health & Wellness.
Health and Wellness
The component of health and wellness is a relatively better performer than other components with an average score of 56.37. However, the districts show considerable variation with the best-performing district (Farrukhabad) having a score of 88.16 and the worst-performing one (Jalaun) having a score of 20.34. This implies there remains immense scope for improvement among the districts. Such districts can draw learnings from the districts that are performing well.
Meanwhile, it must be noted that a majority of the districts are clustered around the score of 60, which implies that there is scope for improvement among the better-performing districts as well. The scope and need for improvement in health and wellness become more pertinent in light of the fact that Uttar Pradesh not only has the worst child health outcomes in the country but in the world. As per a Lancet study, while 41 out of 1000 new-born babies die in the state, the commensurate figure for sub-Saharan countries like Congo, Ghana, and Kenya stands at 20.7
Therefore, addressing health and wellness should gain paramount concern for the state of Uttar Pradesh. The accompanying figure for over-performance and under-performance shows that there are more under-performers when compared to their peer group districts. These districts can make immense gains by following the learnings and experiences of their peers identified by the index.
7 Ahmed, I., Ali, S. M., Amenga-Etego, S., Ariff, S., Bahl, R., Baqui, A. H., & Biemba, G. (2018). Population-based rates, timing, and causes of maternal deaths, stillbirths, and neonatal deaths in south Asia and sub-Saharan Africa: a multi-country prospective cohort study. The Lancet Global Health, 6(12), e1297-e1308.
Overperformance and UnderperformanceDistrict
Mahama
ya Naga
rUnn
aoGau
tam Bud
dha Na
garDeo
riaKus
hinagar
Ghazipu
rGor
akhpur
Fatehpu
rKhe
riSan
t Kabir
Nagar
Aligarh
Chanda
uli Mau Meerut
Gonda
Mahrajg
anjSah
aranpur
Shrawa
stiBan
daAlla
habad
Sultanp
urAm
bedkar
Nagar
Hamirpu
r_UP
Balramp
urBijn
orMu
zaffarna
garPrat
apgarh_
UPSita
purFaiz
abad
Siddhart
hnagar
Mahoba
Morad
abad
Bareilly
Varana
siRae
Bareli
Jhansi
Sonbha
draJyot
iba Phu
le Naga
rMir
zapur
Bahraic
hRam
purKan
pur Na
garPilib
hitSan
t R avida
s Naga
r (B..
Budaun
Jaunpu
rLuc
know
Auraiya
Kausha
mbi
Shahjah
anpur
Chitrak
ootLali
tpur
Jalaun
-45
-40
-35
-30
-25
-20
-15
-10
-5
0
5
10
15
Overperformance and Underperformance
-42.72 14.88
From Boundary wi..
Sum of From Boundary with Sign for each District. Color shows sum of From Boundary with Sign. The data is filtered on Indicator, which keeps Health and Wellness. The view is filtered onsum of From Boundary with Sign, which keeps non-Null values only.
Scores
Amou
nt o
f Und
erpe
rfor
man
ce/O
verp
erfo
rman
ce

Child Progress Index | 39
Personal Rights
21.15 78.92
Pivot Field Values
Map based on Longitude (generated) and Latitude (generated). Color shows sum of Pivot Field Values. Details are shown for District. The data is filtered on Pivot FieldNames, which keeps Personal Rights.
Personal Rights
The only component of the ‘Opportunity’ pillar in the progressing category is ‘Personal Rights.’ This becomes an important element in ensuring child progress because personal rights are crucial in enabling a child to exercise any opportunity throughout life. The state secures an average score of 47.24 on this component.
However, the average conceals the high degree of variation among the districts, with Jhansi being the best-performing district with a score of 78.92 and Balrampur scoring the lowest score of 21.15. The proportion of children registered at birth, for instance, is significantly high for the former. Every district needs to ensure that the rights of the children within it are sufficiently secured.
In relative terms, a significantly higher proportion of districts under-perform compared to their peers. This is shown in the second illustration. Such districts can make vast improvements merely by identifying how their peers are ensuring better personal rights for children.
Overperformance and UnderperformanceDistrict
Lalitpu
rChi
trakoot
Mahoba
Hamirpu
r_UP
Baghpa
tJyot
iba Phu
le Naga
rFaiz
abad
Luckno
wRam
purSah
aranpur
Varana
siUnn
ao EtahCha
ndauli Mau
Sonbha
draMee
rutGha
ziabad
Banda
Sant Ra
vidas N
agar (B
..Rae
Bareli
Pilibhit
Pratapg
arh_UP
Auraiya Etaw
ahMo
radaba
dMu
zaffarna
garMir
zapur
Mahama
ya Naga
rBijn
orKan
shiram
Nagar
Bara Ba
nkiKan
pur Na
garGha
zipur
Bulands
hahr
Allahab
ad Ballia
Sant Ka
bir Nag
arMai
npuri
Deoria
Kausha
mbi
Bareilly
Sultanp
urFarr
uk haba
dFiro
zabad
Fatehpu
rHar
doiBud
aunJau
npur
Kannau
jSita
pur Basti
Siddhart
hnagar
Shahjah
anpur
Shrawa
sti Kheri
Gonda
Bahraic
hBalr
ampur
-35
-30
-25
-20
-15
-10
-5
0
5
10
15
20
Overperformance and Underperformance
-35.87 19.42
From Boundary wi..
Sum of From Boundary with Sign for each District. Color shows sum of From Boundary with Sign. The data is filtered on Indicator, which keeps Personal Rights. The view is filtered on sumof From Boundary with Sign, which keeps non-Null values only.
Scores
Amou
nt o
f Und
erpe
rfor
man
ce/O
verp
erfo
rman
ce

Child Progress Index | 40
Shelter
Access to shelter is one of the most basic needs that is not just necessary for child progress but human development itself. It is, therefore, concerning that Uttar Pradesh has a low average score of 44.4. This is also another component that presents high levels of disparity among its district performance, with Ghaziabad scoring the highest at 89.95 and Sitapur scoring the lowest at 7.82. A range exceeding 82 points between the best and worst-performing districts shows the level of disparity that exists across these districts and is indicative of significant scope for improvement.
It will be difficult to ensure child progress when even basic requirements like shelter are left wanting in the state. This is a typical example of a low-hanging fruit for the state of Uttar Pradesh in achieving improved child progress. The lagging districts can draw significant learnings from regions like Ghaziabad and Gautam Buddha Nagar on their achievement of improved shelter facilities.
Like most components, the under-performing districts with respect to their peers far outweigh the over-performing ones. Only three districts – Saharanpur, Bulandshahr, and Varanasi – perform better than their peers. The majority of under-performers are such due to lack of improved housing, poor access to electricity and high levels of housing congestion. In the short-term, it is necessary that these districts at least catch up with their peer groups and then attempt to make further advancements. Child progress will remain an elusive endeavour until such basic needs such as shelter are met by the state.
Shelter
7.83 89.96
Pivot Field Values
Map based on Longitude (generated) and Latitude (generated). Color shows sum of Pivot Field Values. Details are shown for District. The data is filtered on Pivot FieldNames, which keeps Shelter.
Overperformance and UnderperformanceDistrict
Saharan
purBula
ndshah
rVar
anasi
Azamg
arhKan
pur Na
garMah
obaCha
ndauli
Gorakh
purEtaw
ahDeo
riaBan
daJau
npur
Sant Ra
vidas N
agar (B
..Alla
habad Ballia
Chitrak
ootMir
zapur
Firozab
adLali
tpur
Ghazipu
rPrat
apgarh_
UPSult
anpur
Ambed
kar Nag
arMai
npuri
Siddhart
hnagar Bas
tiFarr
ukhaba
dPilib
hitSan
t Kabir
Nagar
Faizaba
dAur
aiyaSon
bhadra Etah
Mahrajg
anjKan
nauj
Rae Bar
eliKus
hinagar
Kanshir
am Nag
arSha
hjahanp
urKau
shamb
iBalr
ampur
Kanpur
Dehat
Ba ra Ba
nkiFate
hpur
Gonda
Budaun Unnao Kheri
Hardoi
Shrawa
stiBah
raich
Sitapur
-40
-30
-20
-10
0
10
Overperformance and Underperformance
-43.51 16.10
From Boundary wi..
Sum of From Boundary with Sign for each District. Color shows sum of From Boundary with Sign. The data is filtered on Indicator, which keeps Shelter. The view is filtered on sum of FromBoundary with Sign, which keeps non-Null values only.
Scores
Amou
nt o
f Und
erpe
rfor
man
ce/O
verp
erfo
rman
ce

Child Progress Index | 41
Water and Sanitation
Another basic need that is still in the intermediate stage of progressing components is that of water and sanitation. The provision of clean drinking water and proper sanitation facilities are crucial in ensuring improved child health and a low prevalence of diseases. The state, however, manages an average score of 40.4 on the component. The component also has the highest amount of variation among its district scores, with Gautam Buddha Nagar scoring 91.54 while Kaushambi scoring 4.36. Such a huge variation among district scores points to the immense scope for improvement that exists across these regions.
There exists a very significant north-south divide in the performance of the districts with the regions in close proximity to Delhi have better water and sanitation facilities than the rest of the state, with only the exception of Lucknow and Kanpur. The southern districts of the state like Kaushambi, Chitrakoot, and Lalitpur and the worst-performing districts on this component. The state government should, thus, give a disproportionate focus towards these regions for improvement in water and sanitation facilities.
The three aforementioned districts that perform poorly are also the ones that underperform with respect to their peers. Varanasi, on the other hand, is the highest over-performer due to access to treated water facilities and in the district. The experience of such districts can provide a vital road map for other lagging regions to improve their performance on this front, which is an indispensable component of child progress.
Water & Sanitation
4.36 91.54
Pivot Field Values
Map based on Longitude (generated) and Latitude (generated). Color shows sum of Pivot Field Values. Details are shown for District. The data is filtered on Pivot FieldNames, which keeps Water & Sanitation.
Overperformance and UnderperformanceDistrict
Saharan
purVar
anasi
Bulands
hahr
Pilibhit
Aligarh
Gorakh
purMat
hura
Jhansi
Budaun
Kanshir
am Nag
arAlla
habad
Jalaun Kheri
Deoria
Mahrajg
anjKus
hinagar
Sant Ka
bir Nag
arFaiz
abad
Mahama
ya Naga
rSidd
harthna
gar Ballia
Hamirpu
r_UP
Firozab
adHar
doiGon
daAm
bedkar
Nagar Mau Aur
aiyaShr
awasti Basti
Mainpu
riSita
pur Etah Etawah
Balramp
urBah
raich
Bara Ba
nkiAza
mgarh
Jaunpu
rFarr
ukhaba
dSult
anpur
Chanda
uliUnn
aoKan
pur De
hatRae
Bareli
Banda
Pratapg
arh_UP
Kannau
jGha
zipur
Sonbha
draSan
t Ravida
s Naga
r (B..
Fatehpu
rMah
obaMir
zapur
Chitrak
ootLali
tpur
Kausha
mbi-45
-40
-35
-30
-25
-20
-15
-10
-5
0
5
10
15
Overperformance and Underperformance
-43.67 12.89
From Boundary wi..
Sum of From Boundary with Sign for each District. Color shows sum of From Boundary with Sign. The data is filtered on Indicator, which keeps Water and Sanitation. The view is filteredon sum of From Boundary with Sign, which keeps non-Null values only.
Scores
Amou
nt o
f Und
erpe
rfor
man
ce/O
verp
erfo
rman
ce

Child Progress Index | 42
The following components are the most concerning set of areas that the state of Uttar Pradesh needs to work upon to improve child progress. These are aspects where state-wide policy action is the need of the hour since there are only a few positive outliers.
Access to Quality Education
The districts of Uttar Pradesh have made significant progress in providing access to education to its children. However, the quality of educational institutes is not at par with the country in most of the districts. The mean score on this component is 38.95, which is one of the lowest achieved by the state in any component, so is the median score.
On an absolute basis, the scores of most of the districts are below 50. There are just nine districts – Gautam Buddha Nagar (88.5), Ghaziabad (65), Varanasi (59), Allahabad (56), Faizabad (53), Jaunpur (51), Saharanpur (51) and Meerut (51) that score above 50. It can also be seen that there a huge difference between the best and the second-best district.
This depicts that while most of the districts have managed to open up schools and have impacted enrolment rates using various schemes such as mid-day meals, they have not been able to provide basic services in these schools, such as professionally qualified teachers in-house training to teachers and computer facilities.
On a relative basis, there are five districts – Varanasi, Firozabad, Saharanpur, Aligarh, Bahraich - that overperform compared to their peers. And there are 51 districts that underperform compared to their peers with the range of underperformance as -0.21 to -36.70. Their performance is lower than their expected performance based on deviation from the median score of the peer group. This highlights the immense scope of improvement that exists in the provision of quality education.
Varanasi is one of the districts that not only performs well on an absolute basis but also on a relative basis. It can serve as a benchmark to its peers that can understand additional factors that played a role in Varanasi’s growth.
Challenging Components
Access to Quality Education
5.25 88.55
Pivot Field Values
Map based on Longitude (generated) and Latitude (generated). Color shows sum of Pivot Field Values. Details are shown for District. The data is filtered on Pivot FieldNames, which keeps Access to Quality Education.
Overperformance and UnderperformanceDistrict
Varana
siFiro
zabad
Saharan
purAlig
arhBah
raich
Kanpur
Nagar
Gorakh
purKan
shiram
Nagar
Luckno
wMo
radaba
dUnn
aoFarr
ukhaba
dBula
ndshah
rKus
hinagar
Bareilly
Sant Ra
vidas N
agar (B
had..
Chitrako
otMir
zapur Etah Kheri
Etawah
Ghazipu
rMai
npuri Mau
Muzaff
arnagar
Sitapur Agr
aSult
anpur
Bara Ba
nki Basti
Kannau
jDeo
riaCha
ndauli
Lalitpu
rAur
aiyaBud
aunMat
hura
Gonda
Fatehpu
rAm
bedkar
Nagar
Mahama
ya Naga
rSha
hjahanp
urAza
mgarh
Hardoi
Mahoba Ball
iaKan
pur De
hatRae
Bareli
Banda
Shrawa
stiSan
t Kabir
Nagar
Siddhart
hnagar
Pratapg
arh_UP
Sonbha
draBalr
ampur
Pilibhit
-35
-30
-25
-20
-15
-10
-5
0
5
10
15
Overperformance and Underperformance
-36.70 15.54
From Boundary with ..
Sum of From Boundary with Sign for each District. Color shows sum of From Boundary with Sign. The data is filtered on Indicator, which keeps Access to Quality Education. The view is filtered on sum of FromBoundary with Sign, which keeps non-Null values only.
Scores
Amou
nt o
f Und
erpe
rfor
man
ce/O
verp
erfo
rman
ce

Child Progress Index | 43
Inclusion
With a mean score of 20 on a 0-100 scale and a median score 19 on the same scale, Inclusion is the most pressing issue for the districts of Uttar Pradesh. The creation of an inclusive society that takes into account the needs of disabled children and provides equal opportunities to its minorities is still a distant dream for the state. All the districts, barring Mahoba that has a score of 81, score less than 50.
Even the most progressive districts, socially as well as economically, are no exception. They also struggle to provide children with an environment that is inclusive. For instance, Gautam Buddha Nagar that is the best district on child progress and contributes the most to the state GDP,8 has a very low score on this aspect.
The relative analysis reveals that 20 districts perform within their expected range. There are five districts that overperform, one of them being Mahoba since its score is higher than the rest of the districts with a significantly high margin. This performance can be accounted by the high levels of SC, ST, and OBC enrolments as well as enrolments of disabled students.
Uttar Pradesh should strive for creating a society where every child has the right to pursue his or her dreams, and there should be no discrimination based on caste, creed or religion.
8 It has the highest per capita GDP in Uttar Pradesh, according to 2011-12 data.
Inclusion
0.00 81.09
Pivot Field Values
Map based on Longitude (generated) and Latitude (generated). Color shows sum of Pivot Field Values. Details are shown for District. The data is filtered on Pivot FieldNames, which keeps Inclusion.
Overperformance and UnderperformanceDistrict
Mahoba
Kausha
mbi
Deoria Agr
aKan
pur De
hatSan
t Kabir
Nagar Kheri
Bijnor
Jalaun
Firozab
adKan
nauj
Fatehpu
rVar
anasi
Chitrako
otJyot
iba Phu
le Naga
rMir
zapur Etah Banda
Sitapur
Pilibhit
Saharan
purFarr
ukhaba
dAur
aiyaSha
hjahanp
urKus
hinagar
Aligarh
Bulands
hahr
Pratapg
arh_UP
Morad
abad
Siddhart
hnagar
Unnao
Mahama
ya Naga
rSon
bhadra
Bara Ba
nki Jhansi
Bareilly Gon
daKan
shiram
Nagar
Mahrajg
anjMee
rutBag
hpat
Kanpur
Nagar
Hardoi
Budaun
Muzaff
arnagar
M athu
raRam
purShr
awasti
Balramp
urGau
tam Bud
dha Na
garGha
ziabad
Luckno
wBah
raich
-20
-10
0
10
20
30
40
50
Overperformance and Underperformance
-22.37 54.16
From Boundary with ..
Sum of From Boundary with Sign for each District. Color shows sum of From Boundary with Sign. The data is filtered on Indicator, which keeps Inclusion. The view is filtered on sum of From Boundary with Sign, whichkeeps non-Null values only.
Scores
Amou
nt o
f Und
erpe
rfor
man
ce/O
verp
erfo
rman
ce

Child Progress Index | 44
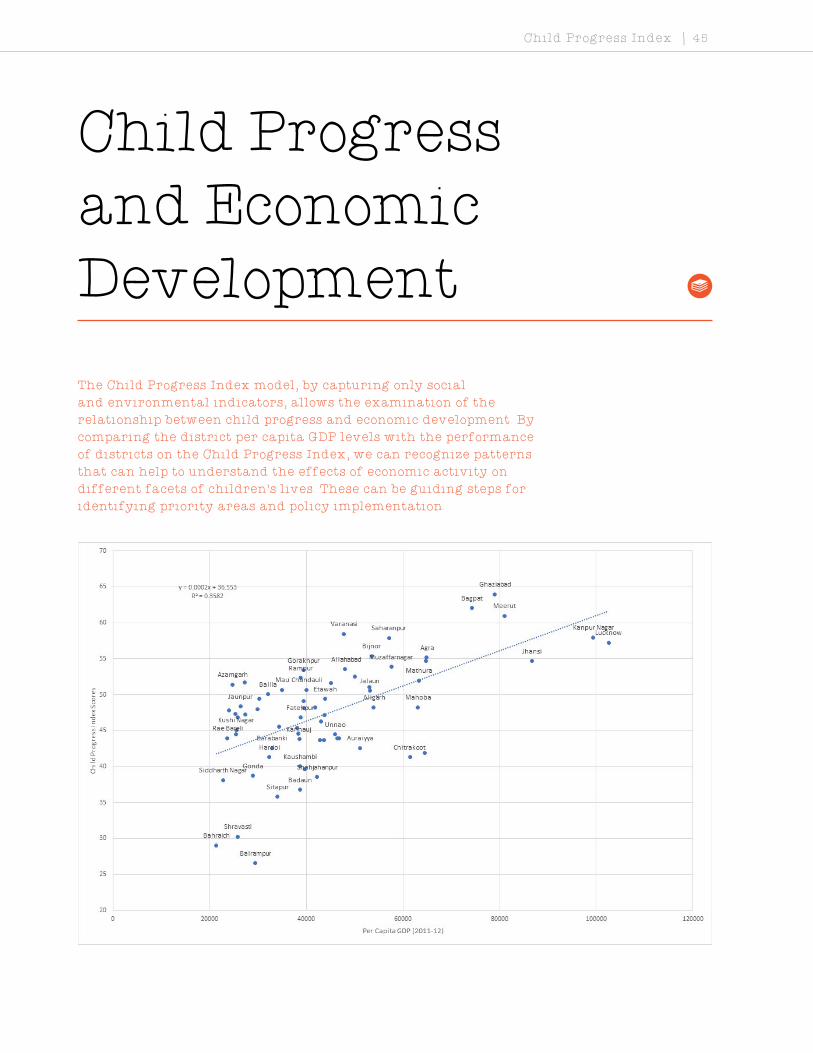
Child Progress Index | 45
Child Progress and Economic Development
The Child Progress Index model, by capturing only social
and environmental indicators, allows the examination of the
relationship between child progress and economic development. By
comparing the district per capita GDP levels with the performance
of districts on the Child Progress Index, we can recognize patterns
that can help to understand the effects of economic activity on
different facets of children’s lives. These can be guiding steps for
identifying priority areas and policy implementation.
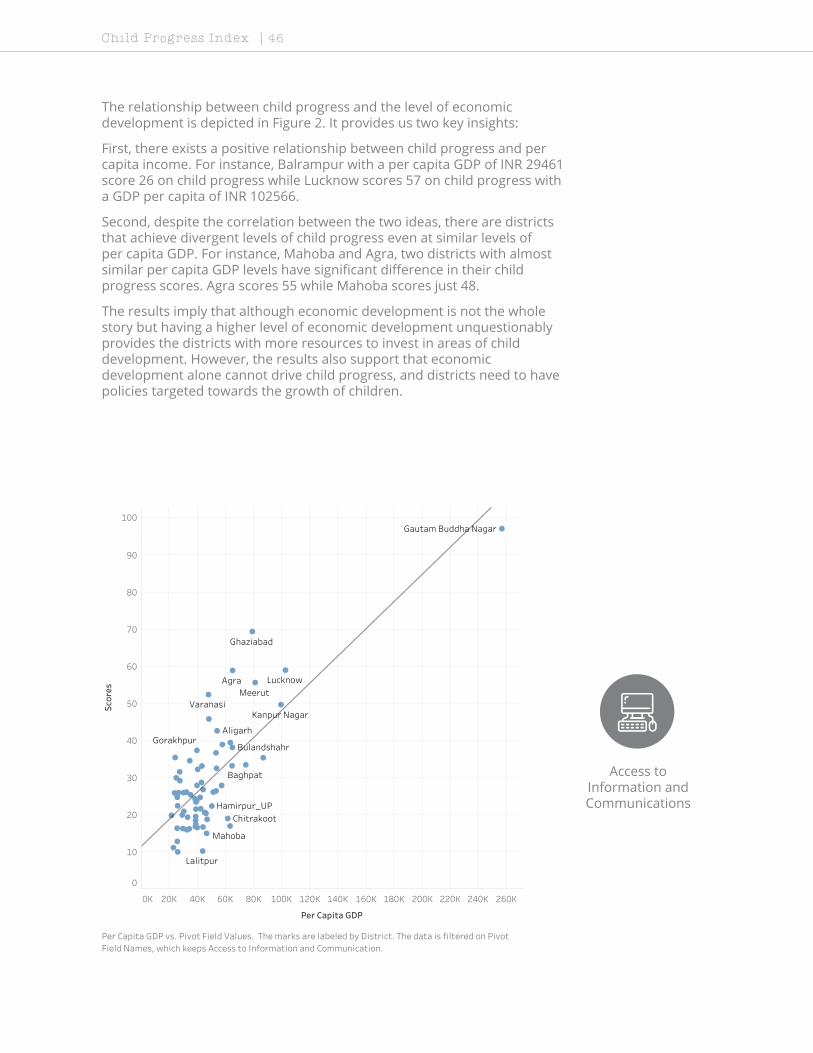
Child Progress Index | 46
The relationship between child progress and the level of economic development is depicted in Figure 2. It provides us two key insights:
First, there exists a positive relationship between child progress and per capita income. For instance, Balrampur with a per capita GDP of INR 29461 score 26 on child progress while Lucknow scores 57 on child progress with a GDP per capita of INR 102566.
Second, despite the correlation between the two ideas, there are districts that achieve divergent levels of child progress even at similar levels of per capita GDP. For instance, Mahoba and Agra, two districts with almost similar per capita GDP levels have significant difference in their child progress scores. Agra scores 55 while Mahoba scores just 48.
The results imply that although economic development is not the whole story but having a higher level of economic development unquestionably provides the districts with more resources to invest in areas of child development. However, the results also support that economic development alone cannot drive child progress, and districts need to have policies targeted towards the growth of children.
0K 20K 40K 60K 80K 100K 120K 140K 160K 180K 200K 220K 240K 260K
Per Capita GDP
0
10
20
30
40
50
60
70
80
90
100
Scor
es
Agra
Aligarh
Baghpat
Bulandshahr
Chitrakoot
Gautam Buddha Nagar
Ghaziabad
Gorakhpur
Hamirpur_UP
Kanpur Nagar
Lalitpur
Lucknow
Mahoba
MeerutVaranasi
Access to Information and Communication
Per Capita GDP vs. Pivot Field Values. The marks are labeled by District. The data is filtered on PivotField Names, which keeps Access to Information and Communication.
Access to Information and Communications

0K 20K 40K 60K 80K 100K 120K 140K 160K 180K 200K 220K 240K 260K
Per Capita GDP
0
10
20
30
40
50
60
70
80
90
Scor
es
Agra
Aligarh
Allahabad
BaghpatBahraich
Balrampur
Banda
Chitrakoot
Faizabad
Gautam Buddha Nagar
Ghaziabad
Jhansi
Kanpur Dehat
Kanpur Nagar
Mathura
Meerut
Pilibhit
Sonbhadra
Varanasi
Access to Quality Education
Per Capita GDP vs. Pivot Field Values. The marks are labeled by District. The data is filtered on PivotField Names, which keeps Access to Quality Education.
0K 20K 40K 60K 80K 100K 120K 140K 160K 180K 200K 220K 240K 260K
Per Capita GDP
0
10
20
30
40
50
60
70
80
Scor
es
Agra
Aligarh
Auraiya
Baghpat
Balrampur
Bareilly
Chitrakoot
Deoria
Fatehpur
Gautam Buddha Nagar
Ghaziabad
Hamirpur_UP
Jhansi
Kanpur Dehat
Kanpur Nagar
Kushinagar
Moradabad
Saharanpur
Sant Kabir Nagar
Sant Ravidas Nagar (Bhadohi)
Sitapur
Environmental Quality
Per Capita GDP vs. Pivot Field Values. The marks are labeled by District. The data is filtered on PivotField Names, which keeps Environmental Quality.
Access to Quality Education
Environmental Quality
Child Progress Index | 47

Child Progress Index | 48
0K 20K 40K 60K 80K 100K 120K 140K 160K 180K 200K 220K 240K 260K
Per Capita GDP
0
10
20
30
40
50
60
70
80
90
Scor
es
Agra
Auraiya
Baghpat
Bareilly
Bijnor
Budaun
Chitrakoot
Etawah
Fatehpur
Gautam Buddha Nagar
Ghaziabad
Gorakhpur
Jalaun
Jhansi
Kanpur Nagar
Kaushambi
LucknowMeerut
Moradabad
Pilibhit
Rampur
Sonbhadra
Unnao
Varanasi
Water and Sanitation
Per Capita GDP vs. Pivot Field Values. The marks are labeled by District. The data is filtered on PivotField Names, which keeps Water and Sanitation.
0K 20K 40K 60K 80K 100K 120K 140K 160K 180K 200K 220K 240K 260K
Per Capita GDP
0
10
20
30
40
50
60
70
80
90
Scor
es
Agra
Allahabad
Auraiya
Baghpat
Bijnor
Budaun
Bulandshahr
ChitrakootDeoria
Etah
Gautam Buddha Nagar
Hamirpur_UP
Hardoi
Jhansi
Kanpur Dehat
Kanpur Nagar
Kanshiram Nagar
Kheri
LucknowMau
Meerut
Muzaffarnagar
Saharanpur
Shrawasti
Sitapur
Varanasi
Shelter
Per Capita GDP vs. Pivot Field Values. The marks are labeled by District. The data is filtered on PivotField Names, which keeps Shelter.
Water and Sanitation
Shelter

0K 20K 40K 60K 80K 100K 120K 140K 160K 180K 200K 220K 240K 260K
Per Capita GDP
0
10
20
30
40
50
60
70
80
Scor
es
Agra
Allahabad
Auraiya
Baghpat
Balrampur
Bareilly
Basti
Chitrakoot
FaizabadGautam Buddha Nagar
Ghaziabad
GorakhpurHamirpur_UP
Jhansi
Kanpur Nagar
Kheri
Lalitpur
Lucknow
ShahjahanpurSitapur
Personal Rights
Per Capita GDP vs. Pivot Field Values. The marks are labeled by District. The data is filtered on PivotField Names, which keeps Personal Rights.
0K 20K 40K 60K 80K 100K 120K 140K 160K 180K 200K 220K 240K 260K
Per Capita GDP
0
10
20
30
40
50
60
70
80
90
Scor
es
Agra
Auraiya
Baghpat
Bahraich
Balrampur
BareillyBudaun
Chandauli
Farrukhabad
Fatehpur
Gautam Buddha Nagar
Ghaziabad
Gonda
Gorakhpur
Hardoi
Jhansi
Kanpur Nagar
Kanshiram Nagar
Lucknow
Mahoba
Meerut
Nutrition and Basic Medical Care
Per Capita GDP vs. Pivot Field Values. The marks are labeled by District. The data is filtered on PivotField Names, which keeps Nutrition and Basic Medical Care.
Personal Rights
Nutrition and Basic Medical Care
Child Progress Index | 49
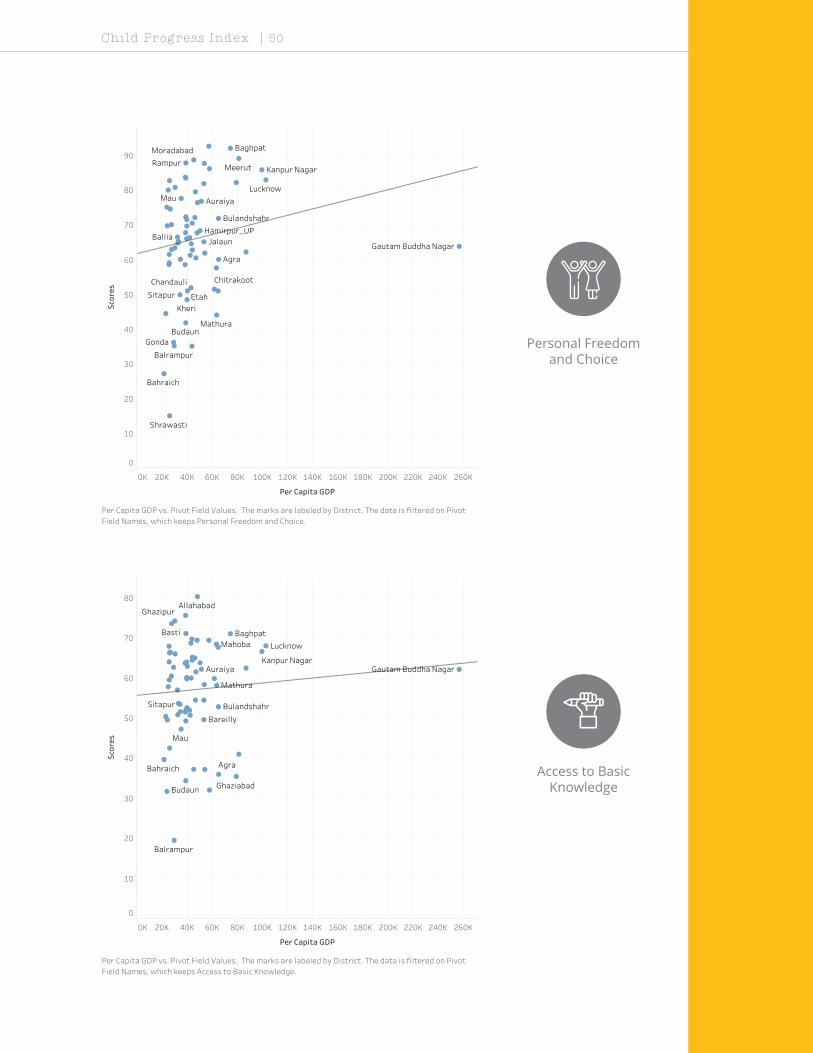
Child Progress Index | 50
0K 20K 40K 60K 80K 100K 120K 140K 160K 180K 200K 220K 240K 260K
Per Capita GDP
0
10
20
30
40
50
60
70
80
90
Scor
es
Agra
Auraiya
Baghpat
Bahraich
Ballia
Balrampur
Budaun
Bulandshahr
Chandauli Chitrakoot
Etah
Gautam Buddha Nagar
Gonda
Hamirpur_UPJalaun
Kanpur Nagar
Kheri
Lucknow
Mathura
Mau
Meerut
MoradabadRampur
Shrawasti
Sitapur
Personal Freedom and Choice
Per Capita GDP vs. Pivot Field Values. The marks are labeled by District. The data is filtered on PivotField Names, which keeps Personal Freedom and Choice.
0K 20K 40K 60K 80K 100K 120K 140K 160K 180K 200K 220K 240K 260K
Per Capita GDP
0
10
20
30
40
50
60
70
80
Scor
es
Agra
Allahabad
Auraiya
Baghpat
Bahraich
Balrampur
Bareilly
Basti
Budaun
Bulandshahr
Gautam Buddha Nagar
Ghaziabad
Ghazipur
Kanpur Nagar
LucknowMahoba
Mathura
Mau
Sitapur
Access to Basic Knowledge
Per Capita GDP vs. Pivot Field Values. The marks are labeled by District. The data is filtered on PivotField Names, which keeps Access to Basic Knowledge.
Access to Basic Knowledge
Personal Freedom and Choice

0K 20K 40K 60K 80K 100K 120K 140K 160K 180K 200K 220K 240K 260K
Per Capita GDP
0
10
20
30
40
50
60
70
80
90
Scor
es
Agra
Aligarh
Auraiya
AzamgarhBaghpat
Bahraich
Ballia
Bareilly
Budaun
Chitrakoot
Deoria
Farrukhabad
Gautam Buddha NagarGhaziabad
Jalaun
Jaunpur
Jhansi
Kannauj
Kanpur Nagar
Kaushambi
Lalitpur
Lucknow
Mahoba
MainpuriMathura
Meerut
Muzaffarnagar
Shahjahanpur
Health and Wellness
Per Capita GDP vs. Pivot Field Values. The marks are labeled by District. The data is filtered on PivotField Names, which keeps Health and Wellness.
0K 20K 40K 60K 80K 100K 120K 140K 160K 180K 200K 220K 240K 260K
Per Capita GDP
0
10
20
30
40
50
60
70
80
90
100
Scor
es
Agra
Aligarh
Ambedkar Nagar
Baghpat
Banda Bijnor
Bulandshahr
Chitrakoot
Deoria
Etawah
Gautam Buddha Nagar
Ghaziabad
Hardoi
Jhansi
Kannauj
Kanpur Dehat
Mahoba
Personal Safety
Per Capita GDP vs. Pivot Field Values. The marks are labeled by District. The data is filtered on PivotField Names, which keeps Personal Safety.
Health and Wellness
Personal Safety
Child Progress Index | 51

Child Progress Index | 52
Figure 3 plots economic development against all the facets of child progress. The results from this analysis would be instrumental in identifying areas of child progress that are highly correlated with economic development. These are the areas that can be improved with marginal changes in economic development.
The first six areas – Access to Information and Communication, Access to Quality Education, Environmental Quality, Water and Sanitation, Shelter, and Personal Rights depicts a strong positive relationship with the level of development. These are the areas that can improve significantly with the level of economic development.
The next four areas – Nutrition and Basic Medical Care, Personal Freedom and Choice, Access to Basic Knowledge and Health and Wellness, show a very weak positive relationship with economic development. These are the areas that show developments with GDP per capita, but their relationship is highly variable. For instance, the improvements in per capita GDP levels can help in improving the access to education; however, these advancements are not as easily converted into tangible increases in the welfare of children.
The last two areas – Personal Safety and Inclusion have a negative relationship with the level of economic development. These are the areas of child wellbeing that pose a greater challenge to society since they require a lot of effort than just investments in economic development.
0K 20K 40K 60K 80K 100K 120K 140K 160K 180K 200K 220K 240K 260K
Per Capita GDP
0
10
20
30
40
50
60
70
80
Scor
es
Agra
Aligarh
Bahraich
Ballia
Balrampur
Bulandshahr
Etawah
Gautam Buddha Nagar
Hamirpur_UP
Hardoi
Jalaun
Kanpur Nagar
Lalitpur
Lucknow
Mahoba
Mau
Mirzapur
Inclusion
Per Capita GDP vs. Pivot Field Values. The marks are labeled by District. The data is filtered on PivotField Names, which keeps Inclusion.
Inclusion

Child Progress Index | 53
The improvements in many of these areas would translate into considerable development in other areas of child progress also. For instance, better access to information and communication would help in advancing the learning outcomes of children.
Learnings and Recommendations
The Low Hanging Fruits
The Child Progress Index is a practical tool designed to improve
the state of children. It has identified six “Progressing Areas”
– they are the ones where some districts of Uttar Pradesh are
showing significant progress but still, there is immense scope for
improvement. These can be said to be the low-hanging fruits for the
state and can give the highest return with slightly more focused
policies and investment. These are:
l Access to Information and Communication
l Environmental Quality
l Health and Wellness
l Personal Rights
l Shelter
l Water and Sanitation
The toughest challenges are the aspects of child progress that are the pressing issues for the entire state. These are the areas where (barring one or two) the performance of all the districts is below average. These are aspects where state-wide policy action is the need of the hour since there are only a few positive outliers. It includes:
Access to Quality Education
Inclusion
The Toughest Challenges
The results depict that while the state has made progress in providing education to its children, it has not paid much attention to the quality of education being imparted to them. There is a lack of professionally qualified teachers which can be compensated by investing in in-house trainings etc but that is also lacking.
Moreover, it is highly likely that children with disabilities and those belonging to minorities are left behind. These are the areas that would have a significant impact on the economy of Uttar Pradesh in the future. The lack of quality education would translate into productivity losses for individuals and would thus impact the overall economic status of Uttar Pradesh. Therefore, the government must focus on addressing these concerns.

Child Progress Index | 54
It highlights that achieving a comparable level of performance across different areas is not possible, and districts can draw learnings from their peers. For instance, Gautam Buddha Nagar outperforms both Ghaziabad and Baghpat on Access to Information and Communication and Access to Quality Education while Baghpat sets an example for the other two by performing well in Personal Freedom and Choice.
The same holds for the low performing districts as well. For instance, Etah, a district performing in the Low Child Progress tier, has an exceptional score of 79.28 in the component of Health and Wellness. With low numbers of cases regarding children being underweight and stunted, Etah can set an example for its peers to improve.
The best performing districts - Gautam Buddha Nagar, Ghaziabad and, Baghpat have similar scores on Child Progress Index, but the scores vary on different aspects of child progress.
There is room for improvement for each districtSc
ore
0
30
90
20
5060
10
40
7080
Nut
ritio
n an
dB
asic
Med
ical
Care
Wat
er a
ndSa
nita
tion
Pers
onal
Safe
ty
Bas
ic H
uman
Nee
ds
Acce
ss to
Bas
icKn
owle
dge
Acce
ss to
Info
.and
Com
mun
icat
ion
Hea
lth a
ndW
elln
ess
Envi
ronm
enta
lQ
ualit
y
Foun
datio
n of
Wel
lbei
ng
Pers
onal
Fre
edom
and
Choi
ce
Pers
onal
Righ
ts
Incl
usio
n
Acce
ss to
Qua
lity
Educ
atio
n
Opp
ortu
nity
Child
Pro
gres
sSc
ore
Shel
ter
Scor
e
0
80
40
20
100
60
Nut
ritio
n an
dB
asic
Med
ical
Care
Wat
er a
ndSa
nita
tion
Pers
onal
Safe
ty
Bas
ic H
uman
Nee
ds
Acce
ss to
Bas
icKn
owle
dge
Acce
ss to
Info
.and
Com
mun
icat
ion
Hea
lth a
ndW
elln
ess
Envi
ronm
enta
lQ
ualit
y
Foun
datio
n of
Wel
lbei
ng
Pers
onal
Fre
edom
and
Choi
ce
Pers
onal
Righ
ts
Incl
usio
n
Acce
ss to
Qua
lity
Educ
atio
n
Opp
ortu
nity
Shel
ter
Gautam Buddh Nagar Ghaziabad Baghpat

It can also help businesses in taking actions to improve child wellbeing in the communities where they operate. The Companies Act formally introduced Corporate Social Responsibility guidelines in 2013 that made it mandatory for companies having net worth of Rs 500 crore or more or turnover of Rs 1000 crore or more or net profit of Rs 5 crore or more to spend at least 2 percent of their average net profits9. However, reports indicate that more than 50 percent companies fail to comply with these norms as they don’t have enough knowledge about the areas where they can invest. Child Progress Index can help these businesses to identify key areas of intervention.
The index is about measuring progress to drive progress.
From Index to Action
The aim of the Child Progress Index is to go
beyond measurement; it is about how one
can use the insights from the index to make
real improvements in the life of children.
The Index can be used by state and district
level policymakers from crafting long term
strategies as it sheds light on the strengths
and weaknesses of the regions. Based on
their current position, the government can
set targets and track progress by using the
Child Progress Index tool. The uniqueness
of the tool is that it can provide locally-
tailored solutions to the changemakers that
can help in driving child progress.
9 Ministry of Corporate Affairs
Child Progress Index | 55

Sco
reca
rds
Child Progress Index | 56

Child Progress Index | 57
Agra 5 5 .1 5
Basic Human Needs
Foundation of Well-Being
Opportunity63.62 58.86 42.96
Antenatal Care Drop-out Rates Pendency of Cases
Access to Electric Supply Anaemic Enrollment of Disabled Students
Kidnapping Drainage Facilities Access to Technology at School
Houses with treated tap water Access to Computer Access to Contraceptives
Child Mortality Gender Parity in Students Registered Birth
Bathing Facilities Diarrhea Scholarship for Minority
Murder Improved fuel for cooking Professionally Trained Teachers
Improved Drinking Water Access to Television Sets Adolescent Mothers
Financial Assistance to Mother Girl's Enrollment Sexual Offences
Housing Congestion Stunted Scholarship for SC/ST/OBC
Rape Crimes Respiratory Disease Teachers receiving in-service trainingTraditional Fuel for Energy
Improved Sanitation Households with Mobiles Child Marriages
Immunization Primary School Enrollment Sterilization
Improved Houses Underweight
Maternal Mortality Secondary Enrollment
Latrine Facilities Wasted Children
Public Facility Births Transition Rates
Vaccination
73.33 36 59.42
51.5458.9 60.12
58.19 69.8 22.05
71.42 70.74 30.27
Nutrition & Basic Medical Care
Access to Basic Knowledge
Personal Rights
Water & SanitationAccess to Information & Communication
Personal Freedom & Choice
Shelter Health & Wellness Inclusion
Personal Security Environmental Quality Access to Quality Education
54.68 20.33 79.14
93.23 71.8 12.51
67.47 11.16 10.17
52.26 30.8 80.81
74.19 70.59 65.9
26.4 75.79 33.77
59.92 44.62 55.46
44.97 86 40.52
50.08 45.5 78.88
56.32 62.01 20.49
84.8 83.74 3.91
6.78
57.14 82.6 62.58
80.18 64.16 42.56
95.55 73.31
73.24 24.78
16.76 75.55
61.52 13.53
83.18
Strength and Weakness is relative to 10 districts with similar demographic structure
How to read the scorecard: All the values are scores on a scale of 0-100. So, higher score represents better performance. For instance, a score of 91 on access to contraceptives will depict high score of the indicator.
OverperformingPerforming within expected range
Underperforming

Child Progress Index | 58
Aligarh 4 8 . 2 6
Basic Human Needs
Foundation of Well-Being
Opportunity51.65 50.19 42.92
Antenatal Care Drop-out Rates Pendency of Cases
Access to Electric Supply Anaemic Enrollment of Disabled Students
Kidnapping Drainage Facilities Access to Technology at School
Houses with treated tap water Access to Computer Access to Contraceptives
Child Mortality Gender Parity in Students Registered Birth
Bathing Facilities Diarrhea Scholarship for Minority
Murder Improved fuel for cooking Professionally Trained Teachers
Improved Drinking Water Access to Television Sets Adolescent Mothers
Financial Assistance to Mother Girl's Enrollment Sexual Offences
Housing Congestion Stunted Scholarship for SC/ST/OBC
Rape Crimes Respiratory Disease Teachers receiving in-service trainingTraditional Fuel for Energy
Improved Sanitation Households with Mobiles Child Marriages
Immunization Primary School Enrollment Sterilization
Improved Houses Underweight
Maternal Mortality Secondary Enrollment
Latrine Facilities Wasted Children
Public Facility Births Transition Rates
Vaccination
63.6 37.22 53.15
49.0342.63 61.95
55.64 61.08 10.92
38.34 59.84 45.66
Nutrition & Basic Medical Care
Access to Basic Knowledge
Personal Rights
Water & SanitationAccess to Information & Communication
Personal Freedom & Choice
Shelter Health & Wellness Inclusion
Personal Security Environmental Quality Access to Quality Education
31.45 15.77 75.73
79.84 39.05 9.41
0 7.44 26.61
35.68 19.64 77.89
45.16 47.06 61.9
34.2 59.28 10.1
66.24 36.99 83.47
66.71 53.38 43.97
44.24 35.83 51.94
44.83 48.63 12.74
55.2 87.8 2.71
54.34
49.38 81.54 65.88
90.61 33.17 98.46
88.38 60.53
60.56 51.15
26.01 84.95
44.19 40.88
84.3
Strength and Weakness is relative to 10 districts with similar demographic structure
How to read the scorecard: All the values are scores on a scale of 0-100. So, higher score represents better performance. For instance, a score of 91 on access to contraceptives will depict high score of the indicator.
OverperformingPerforming within expected range
Underperforming

Child Progress Index | 59
Allahabad 5 3 . 5 3
Basic Human Needs
Foundation of Well-Being
Opportunity55.25 56.35 49
Antenatal Care Drop-out Rates Pendency of Cases
Access to Electric Supply Anaemic Enrollment of Disabled Students
Kidnapping Drainage Facilities Access to Technology at School
Houses with treated tap water Access to Computer Access to Contraceptives
Child Mortality Gender Parity in Students Registered Birth
Bathing Facilities Diarrhea Scholarship for Minority
Murder Improved fuel for cooking Professionally Trained Teachers
Improved Drinking Water Access to Television Sets Adolescent Mothers
Financial Assistance to Mother Girl's Enrollment Sexual Offences
Housing Congestion Stunted Scholarship for SC/ST/OBC
Rape Crimes Respiratory Disease Teachers receiving in-service trainingTraditional Fuel for Energy
Improved Sanitation Households with Mobiles Child Marriages
Immunization Primary School Enrollment Sterilization
Improved Houses Underweight
Maternal Mortality Secondary Enrollment
Latrine Facilities Wasted Children
Public Facility Births Transition Rates
Vaccination
54.46 80.36 32.52
38.3545.82 76.48
46.06 53.23 30.55
82.12 46 56.45
Nutrition & Basic Medical Care
Access to Basic Knowledge
Personal Rights
Water & SanitationAccess to Information & Communication
Personal Freedom & Choice
Shelter Health & Wellness Inclusion
Personal Security Environmental Quality Access to Quality Education
86.37 85.89 25.47
71.58 52.28 19.17
78.42 56.67 13.1
42.46 33.48 48.68
22.58 100 23.35
15.8 42.99 44.86
80.34 33.98 80.87
31.81 47.69 94.83
55.26 72.37 100
78.39 64.74 28.43
87.36 69.92 14.93
55.96
39.33 73.37 78.77
45.9 93.2 41.03
59.68 40.98
47.89 61.86
14.84 60.82
92.34 76.47
83.86
Strength and Weakness is relative to 10 districts with similar demographic structure
How to read the scorecard: All the values are scores on a scale of 0-100. So, higher score represents better performance. For instance, a score of 91 on access to contraceptives will depict high score of the indicator.
OverperformingPerforming within expected range
Underperforming

Child Progress Index | 60
Ambedkar Nagar 4 9 .4 5
Basic Human Needs
Foundation of Well-Being
Opportunity58.16 43.47 46.73
Antenatal Care Drop-out Rates Pendency of Cases
Access to Electric Supply Anaemic Enrollment of Disabled Students
Kidnapping Drainage Facilities Access to Technology at School
Houses with treated tap water Access to Computer Access to Contraceptives
Child Mortality Gender Parity in Students Registered Birth
Bathing Facilities Diarrhea Scholarship for Minority
Murder Improved fuel for cooking Professionally Trained Teachers
Improved Drinking Water Access to Television Sets Adolescent Mothers
Financial Assistance to Mother Girl's Enrollment Sexual Offences
Housing Congestion Stunted Scholarship for SC/ST/OBC
Rape Crimes Respiratory Disease Teachers receiving in-service trainingTraditional Fuel for Energy
Improved Sanitation Households with Mobiles Child Marriages
Immunization Primary School Enrollment Sterilization
Improved Houses Underweight
Maternal Mortality Secondary Enrollment
Latrine Facilities Wasted Children
Public Facility Births Transition Rates
Vaccination
64.93 66.06 51.15
29.8320.94 80.86
39.45 51.54 24.59
98.4 35.34 30.33
Nutrition & Basic Medical Care
Access to Basic Knowledge
Personal Rights
Water & SanitationAccess to Information & Communication
Personal Freedom & Choice
Shelter Health & Wellness Inclusion
Personal Security Environmental Quality Access to Quality Education
20.85 51.87 54.98
63.6 49.46 4.47
100 54.81 6.55
26.13 3.12 45.76
58.06 82.35 81.57
11.2 86.2 31.41
100 9.25 71.76
48.05 12.77 95.69
55.26 28.64 66.22
57.7 67.17 35.08
95.47 75.61 0.7
78.18
16.58 79.27 89.62
80.63 69.78 90.77
58.81 50
83.1 80.93
11.56 55.8
21.32 58.24
5.83
Strength and Weakness is relative to 10 districts with similar demographic structure
How to read the scorecard: All the values are scores on a scale of 0-100. So, higher score represents better performance. For instance, a score of 91 on access to contraceptives will depict high score of the indicator.
OverperformingPerforming within expected range
Underperforming

Child Progress Index | 61
Auraiya 4 2 . 5 7
Basic Human Needs
Foundation of Well-Being
Opportunity44 42.37 41.35
Antenatal Care Drop-out Rates Pendency of Cases
Access to Electric Supply Anaemic Enrollment of Disabled Students
Kidnapping Drainage Facilities Access to Technology at School
Houses with treated tap water Access to Computer Access to Contraceptives
Child Mortality Gender Parity in Students Registered Birth
Bathing Facilities Diarrhea Scholarship for Minority
Murder Improved fuel for cooking Professionally Trained Teachers
Improved Drinking Water Access to Television Sets Adolescent Mothers
Financial Assistance to Mother Girl's Enrollment Sexual Offences
Housing Congestion Stunted Scholarship for SC/ST/OBC
Rape Crimes Respiratory Disease Teachers receiving in-service trainingTraditional Fuel for Energy
Improved Sanitation Households with Mobiles Child Marriages
Immunization Primary School Enrollment Sterilization
Improved Houses Underweight
Maternal Mortality Secondary Enrollment
Latrine Facilities Wasted Children
Public Facility Births Transition Rates
Vaccination
54.79 62.23 39.23
29.4826.12 76.88
36.79 30.56 15.99
54.92 50.56 33.31
Nutrition & Basic Medical Care
Access to Basic Knowledge
Personal Rights
Water & SanitationAccess to Information & Communication
Personal Freedom & Choice
Shelter Health & Wellness Inclusion
Personal Security Environmental Quality Access to Quality Education
10.96 51.87 40.59
57.24 10.2 12.04
58.18 17.29 3.61
18.09 6.25 58.14
70.97 58.82 44.55
24.4 44.57 22.49
45.66 23.76 80.32
29.93 24 89.66
64.27 12.58 33.7
38.62 65.35 14.09
59.09 97.56 1.4
79.54
44.44 79.27 78.14
40.09 69.78 100
38.26 29.7
80.28 100
24.08 30.09
4.71 27.65
92.15
Strength and Weakness is relative to 10 districts with similar demographic structure
How to read the scorecard: All the values are scores on a scale of 0-100. So, higher score represents better performance. For instance, a score of 91 on access to contraceptives will depict high score of the indicator.
OverperformingPerforming within expected range
Underperforming

Child Progress Index | 62
Azamgarh 5 1 .4 1
Basic Human Needs
Foundation of Well-Being
Opportunity58.75 48.62 46.86
Antenatal Care Drop-out Rates Pendency of Cases
Access to Electric Supply Anaemic Enrollment of Disabled Students
Kidnapping Drainage Facilities Access to Technology at School
Houses with treated tap water Access to Computer Access to Contraceptives
Child Mortality Gender Parity in Students Registered Birth
Bathing Facilities Diarrhea Scholarship for Minority
Murder Improved fuel for cooking Professionally Trained Teachers
Improved Drinking Water Access to Television Sets Adolescent Mothers
Financial Assistance to Mother Girl's Enrollment Sexual Offences
Housing Congestion Stunted Scholarship for SC/ST/OBC
Rape Crimes Respiratory Disease Teachers receiving in-service trainingTraditional Fuel for Energy
Improved Sanitation Households with Mobiles Child Marriages
Immunization Primary School Enrollment Sterilization
Improved Houses Underweight
Maternal Mortality Secondary Enrollment
Latrine Facilities Wasted Children
Public Facility Births Transition Rates
Vaccination
68.12 57.87 50.62
25.2729.96 80.12
51.15 68.18 27.16
90.47 38.49 29.54
Nutrition & Basic Medical Care
Access to Basic Knowledge
Personal Rights
Water & SanitationAccess to Information & Communication
Personal Freedom & Choice
Shelter Health & Wellness Inclusion
Personal Security Environmental Quality Access to Quality Education
100 62.24 49.73
77.54 49.89 21.03
96.32 47.81 2.84
8.54 11.16 47.84
96.77 82.35 70.97
23.2 42.08 21.11
91.25 20.22 63.8
47.92 24 89.66
44.91 65.95 89.52
78.16 76.29 36.62
83.81 67.48 3.31
77.64
25.22 86.99 91.04
41.88 69.78 98.97
67.23 80.08
78.87 48.28
17.15 69.28
56.48 33.53
72.2
Strength and Weakness is relative to 10 districts with similar demographic structure
How to read the scorecard: All the values are scores on a scale of 0-100. So, higher score represents better performance. For instance, a score of 91 on access to contraceptives will depict high score of the indicator.
OverperformingPerforming within expected range
Underperforming

Child Progress Index | 63
Baghpat 6 2 . 0 5
Basic Human Needs
Foundation of Well-Being
Opportunity75.86 57.83 52.47
Antenatal Care Drop-out Rates Pendency of Cases
Access to Electric Supply Anaemic Enrollment of Disabled Students
Kidnapping Drainage Facilities Access to Technology at School
Houses with treated tap water Access to Computer Access to Contraceptives
Child Mortality Gender Parity in Students Registered Birth
Bathing Facilities Diarrhea Scholarship for Minority
Murder Improved fuel for cooking Professionally Trained Teachers
Improved Drinking Water Access to Television Sets Adolescent Mothers
Financial Assistance to Mother Girl's Enrollment Sexual Offences
Housing Congestion Stunted Scholarship for SC/ST/OBC
Rape Crimes Respiratory Disease Teachers receiving in-service trainingTraditional Fuel for Energy
Improved Sanitation Households with Mobiles Child Marriages
Immunization Primary School Enrollment Sterilization
Improved Houses Underweight
Maternal Mortality Secondary Enrollment
Latrine Facilities Wasted Children
Public Facility Births Transition Rates
Vaccination
85.44 71.08 60.76
52.3133.46 92.14
84.55 62.93 10.94
81.13 63.87 46.04
Nutrition & Basic Medical Care
Access to Basic Knowledge
Personal Rights
Water & SanitationAccess to Information & Communication
Personal Freedom & Choice
Shelter Health & Wellness Inclusion
Personal Security Environmental Quality Access to Quality Education
3.82 92.53 75.13
89.85 13.02 5.58
72.15 3.39 21.46
24.62 10.27 91.1
83.87 0 78.49
100 7.24 17.83
83.42 40.32 100
46.31 69.69 96.55
28.55 5.43 60.28
80.46 89.06 9.84
88.51 79.67 0.1
36.31
95.77 29.35 89.62
93.44 92.31 27.69
49.55 78.95
97.18 73.25
98.07 69.91
0 89.71
58.74
Strength and Weakness is relative to 10 districts with similar demographic structure
How to read the scorecard: All the values are scores on a scale of 0-100. So, higher score represents better performance. For instance, a score of 91 on access to contraceptives will depict high score of the indicator.
OverperformingPerforming within expected range
Underperforming

Child Progress Index | 64
Bahraich 2 9 . 0 2
Basic Human Needs
Foundation of Well-Being
Opportunity33.15 30.68 23.24
Antenatal Care Drop-out Rates Pendency of Cases
Access to Electric Supply Anaemic Enrollment of Disabled Students
Kidnapping Drainage Facilities Access to Technology at School
Houses with treated tap water Access to Computer Access to Contraceptives
Child Mortality Gender Parity in Students Registered Birth
Bathing Facilities Diarrhea Scholarship for Minority
Murder Improved fuel for cooking Professionally Trained Teachers
Improved Drinking Water Access to Television Sets Adolescent Mothers
Financial Assistance to Mother Girl's Enrollment Sexual Offences
Housing Congestion Stunted Scholarship for SC/ST/OBC
Rape Crimes Respiratory Disease Teachers receiving in-service trainingTraditional Fuel for Energy
Improved Sanitation Households with Mobiles Child Marriages
Immunization Primary School Enrollment Sterilization
Improved Houses Underweight
Maternal Mortality Secondary Enrollment
Latrine Facilities Wasted Children
Public Facility Births Transition Rates
Vaccination
20.01 39.7 21.66
26.7419.84 27.22
11.37 41.43 0
74.48 21.77 44.08
Nutrition & Basic Medical Care
Access to Basic Knowledge
Personal Rights
Water & SanitationAccess to Information & Communication
Personal Freedom & Choice
Shelter Health & Wellness Inclusion
Personal Security Environmental Quality Access to Quality Education
65.53 56.02 43.38
7.71 24.51 0
69.84 91.36 5.6
20.6 4.91 11.13
22.58 29.41 18.59
4.4 95.93 0
80.44 0 52.75
57.32 5.23 14.66
55.43 47.62 79.63
26.67 0 0
74.42 73.98 15.73
95.53
4.41 82 44.81
3.43 85.69 94.87
19.63 38.72
98.59 21.22
5.01 76.18
87.55 0
28.48
Strength and Weakness is relative to 10 districts with similar demographic structure
How to read the scorecard: All the values are scores on a scale of 0-100. So, higher score represents better performance. For instance, a score of 91 on access to contraceptives will depict high score of the indicator.
OverperformingPerforming within expected range
Underperforming

Child Progress Index | 65
Ballia 5 0 . 0 6
Basic Human Needs
Foundation of Well-Being
Opportunity55.96 48.18 46.03
Antenatal Care Drop-out Rates Pendency of Cases
Access to Electric Supply Anaemic Enrollment of Disabled Students
Kidnapping Drainage Facilities Access to Technology at School
Houses with treated tap water Access to Computer Access to Contraceptives
Child Mortality Gender Parity in Students Registered Birth
Bathing Facilities Diarrhea Scholarship for Minority
Murder Improved fuel for cooking Professionally Trained Teachers
Improved Drinking Water Access to Television Sets Adolescent Mothers
Financial Assistance to Mother Girl's Enrollment Sexual Offences
Housing Congestion Stunted Scholarship for SC/ST/OBC
Rape Crimes Respiratory Disease Teachers receiving in-service trainingTraditional Fuel for Energy
Improved Sanitation Households with Mobiles Child Marriages
Immunization Primary School Enrollment Sterilization
Improved Houses Underweight
Maternal Mortality Secondary Enrollment
Latrine Facilities Wasted Children
Public Facility Births Transition Rates
Vaccination
66.73 57.05 43.53
31.6826.12 66.55
45.16 74.78 47.75
80.28 34.76 26.28
Nutrition & Basic Medical Care
Access to Basic Knowledge
Personal Rights
Water & SanitationAccess to Information & Communication
Personal Freedom & Choice
Shelter Health & Wellness Inclusion
Personal Security Environmental Quality Access to Quality Education
48.41 63.49 12.73
59.81 53.36 34.53
73.11 39.39 5.98
9.8 6.25 42
87.1 100 72.81
18.4 16.74 72.9
90.08 19.78 58.06
68.72 23.54 70.69
47.08 31.07 62.81
66.21 77.51 38.73
79.73 43.9 1.6
80.89
24.16 80.03 77.04
54.69 90.37 100
62.3 87.22
100 41.36
27.55 76.18
35.72 14.12
47.53
Strength and Weakness is relative to 10 districts with similar demographic structure
How to read the scorecard: All the values are scores on a scale of 0-100. So, higher score represents better performance. For instance, a score of 91 on access to contraceptives will depict high score of the indicator.
OverperformingPerforming within expected range
Underperforming

Child Progress Index | 66
Balrampur 2 6 . 5 8
Basic Human Needs
Foundation of Well-Being
Opportunity33.58 27.81 18.36
Antenatal Care Drop-out Rates Pendency of Cases
Access to Electric Supply Anaemic Enrollment of Disabled Students
Kidnapping Drainage Facilities Access to Technology at School
Houses with treated tap water Access to Computer Access to Contraceptives
Child Mortality Gender Parity in Students Registered Birth
Bathing Facilities Diarrhea Scholarship for Minority
Murder Improved fuel for cooking Professionally Trained Teachers
Improved Drinking Water Access to Television Sets Adolescent Mothers
Financial Assistance to Mother Girl's Enrollment Sexual Offences
Housing Congestion Stunted Scholarship for SC/ST/OBC
Rape Crimes Respiratory Disease Teachers receiving in-service trainingTraditional Fuel for Energy
Improved Sanitation Households with Mobiles Child Marriages
Immunization Primary School Enrollment Sterilization
Improved Houses Underweight
Maternal Mortality Secondary Enrollment
Latrine Facilities Wasted Children
Public Facility Births Transition Rates
Vaccination
24.06 19.53 21.15
27.1716.3 35.23
24.68 51.19 3.37
58.4 24.24 13.68
Nutrition & Basic Medical Care
Access to Basic Knowledge
Personal Rights
Water & SanitationAccess to Information & Communication
Personal Freedom & Choice
Shelter Health & Wellness Inclusion
Personal Security Environmental Quality Access to Quality Education
40.98 0 56.24
13.8 26.9 7.34
99.97 91.36 0.04
15.83 4.91 0
29.03 41.18 13.98
8 35.07 2.08
77.68 0 31.82
63.62 3.23 53.45
21.7 30.54 71.18
60.69 6.99 1.27
0 82.11 1.3
91.19
6 67.02 41.67
0 68.47 100
52.21 40.6
81.69 0
4.43 90.6
35.02 0
86.1
Strength and Weakness is relative to 10 districts with similar demographic structure
How to read the scorecard: All the values are scores on a scale of 0-100. So, higher score represents better performance. For instance, a score of 91 on access to contraceptives will depict high score of the indicator.
OverperformingPerforming within expected range
Underperforming
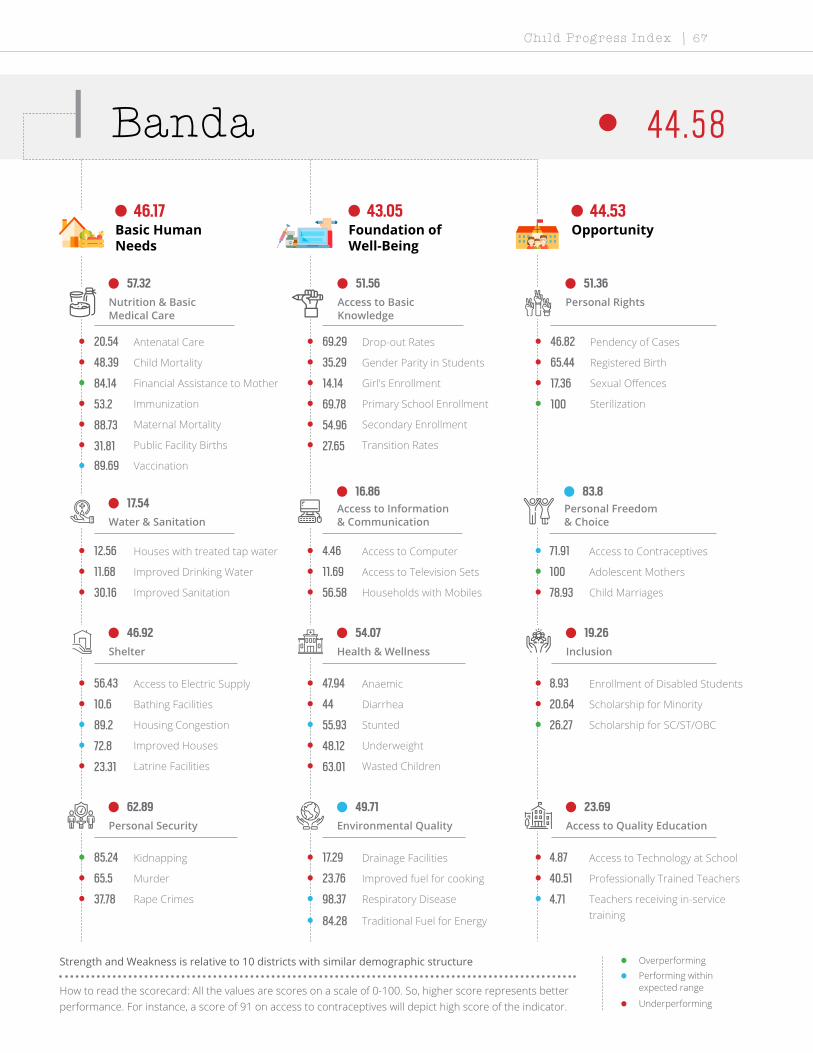
Child Progress Index | 67
Banda 4 4 . 5 8
Basic Human Needs
Foundation of Well-Being
Opportunity46.17 43.05 44.53
Antenatal Care Drop-out Rates Pendency of Cases
Access to Electric Supply Anaemic Enrollment of Disabled Students
Kidnapping Drainage Facilities Access to Technology at School
Houses with treated tap water Access to Computer Access to Contraceptives
Child Mortality Gender Parity in Students Registered Birth
Bathing Facilities Diarrhea Scholarship for Minority
Murder Improved fuel for cooking Professionally Trained Teachers
Improved Drinking Water Access to Television Sets Adolescent Mothers
Financial Assistance to Mother Girl's Enrollment Sexual Offences
Housing Congestion Stunted Scholarship for SC/ST/OBC
Rape Crimes Respiratory Disease Teachers receiving in-service trainingTraditional Fuel for Energy
Improved Sanitation Households with Mobiles Child Marriages
Immunization Primary School Enrollment Sterilization
Improved Houses Underweight
Maternal Mortality Secondary Enrollment
Latrine Facilities Wasted Children
Public Facility Births Transition Rates
Vaccination
57.32 51.56 51.36
17.5416.86 83.8
46.92 54.07 19.26
62.89 49.71 23.69
Nutrition & Basic Medical Care
Access to Basic Knowledge
Personal Rights
Water & SanitationAccess to Information & Communication
Personal Freedom & Choice
Shelter Health & Wellness Inclusion
Personal Security Environmental Quality Access to Quality Education
20.54 69.29 46.82
56.43 47.94 8.93
85.24 17.29 4.87
12.56 4.46 71.91
48.39 35.29 65.44
10.6 44 20.64
65.5 23.76 40.51
11.68 11.69 100
84.14 14.14 17.36
89.2 55.93 26.27
37.78 98.37 4.71
84.28
30.16 56.58 78.93
53.2 69.78 100
72.8 48.12
88.73 54.96
23.31 63.01
31.81 27.65
89.69
Strength and Weakness is relative to 10 districts with similar demographic structure
How to read the scorecard: All the values are scores on a scale of 0-100. So, higher score represents better performance. For instance, a score of 91 on access to contraceptives will depict high score of the indicator.
OverperformingPerforming within expected range
Underperforming

Child Progress Index | 68
Bara Banki 4 2 . 5 7
Basic Human Needs
Foundation of Well-Being
Opportunity42.55 45.27 39.87
Antenatal Care Drop-out Rates Pendency of Cases
Access to Electric Supply Anaemic Enrollment of Disabled Students
Kidnapping Drainage Facilities Access to Technology at School
Houses with treated tap water Access to Computer Access to Contraceptives
Child Mortality Gender Parity in Students Registered Birth
Bathing Facilities Diarrhea Scholarship for Minority
Murder Improved fuel for cooking Professionally Trained Teachers
Improved Drinking Water Access to Television Sets Adolescent Mothers
Financial Assistance to Mother Girl's Enrollment Sexual Offences
Housing Congestion Stunted Scholarship for SC/ST/OBC
Rape Crimes Respiratory Disease Teachers receiving in-service trainingTraditional Fuel for Energy
Improved Sanitation Households with Mobiles Child Marriages
Immunization Primary School Enrollment Sterilization
Improved Houses Underweight
Maternal Mortality Secondary Enrollment
Latrine Facilities Wasted Children
Public Facility Births Transition Rates
Vaccination
41.02 53.7 45.56
25.9919.34 65.32
24.14 70.68 14.41
79.07 37.37 34.21
Nutrition & Basic Medical Care
Access to Basic Knowledge
Personal Rights
Water & SanitationAccess to Information & Communication
Personal Freedom & Choice
Shelter Health & Wellness Inclusion
Personal Security Environmental Quality Access to Quality Education
48.75 64.32 51.12
32.61 88.72 23.19
93.39 29.65 14.7
17.34 5.36 48.96
6.45 76.47 72.96
18.4 13.57 5.9
71.44 24.41 53.89
46.17 18.31 68.97
55.59 30.58 57.7
22.07 41.34 14.09
70.51 49.59 5.81
88.75
17.46 55.98 71.7
49.18 64.39 98.46
35.66 53.01
50.7 36.57
10.21 81.19
53.68 46.76
80.72
Strength and Weakness is relative to 10 districts with similar demographic structure
How to read the scorecard: All the values are scores on a scale of 0-100. So, higher score represents better performance. For instance, a score of 91 on access to contraceptives will depict high score of the indicator.
OverperformingPerforming within expected range
Underperforming

Child Progress Index | 69
Bareilly 5 1 . 0 6
Basic Human Needs
Foundation of Well-Being
Opportunity63.24 46.98 42.96
Antenatal Care Drop-out Rates Pendency of Cases
Access to Electric Supply Anaemic Enrollment of Disabled Students
Kidnapping Drainage Facilities Access to Technology at School
Houses with treated tap water Access to Computer Access to Contraceptives
Child Mortality Gender Parity in Students Registered Birth
Bathing Facilities Diarrhea Scholarship for Minority
Murder Improved fuel for cooking Professionally Trained Teachers
Improved Drinking Water Access to Television Sets Adolescent Mothers
Financial Assistance to Mother Girl's Enrollment Sexual Offences
Housing Congestion Stunted Scholarship for SC/ST/OBC
Rape Crimes Respiratory Disease Teachers receiving in-service trainingTraditional Fuel for Energy
Improved Sanitation Households with Mobiles Child Marriages
Immunization Primary School Enrollment Sterilization
Improved Houses Underweight
Maternal Mortality Secondary Enrollment
Latrine Facilities Wasted Children
Public Facility Births Transition Rates
Vaccination
49.95 49.64 38.14
77.2236.69 81.95
51.86 45.4 13.02
73.9 56.18 38.72
Nutrition & Basic Medical Care
Access to Basic Knowledge
Personal Rights
Water & SanitationAccess to Information & Communication
Personal Freedom & Choice
Shelter Health & Wellness Inclusion
Personal Security Environmental Quality Access to Quality Education
51.92 38.59 42.95
59.54 22.78 6.6
80.46 7.88 12.52
60.3 15.63 86.51
25.81 47.06 45.78
24 64.93 18.77
66.07 41.83 81.33
99.87 48.77 78.45
57.76 78.4 37.33
30.57 59.27 13.62
73.47 73.17 2.4
64.91
77.43 68.53 81.92
62 88.48 91.79
72.72 45.86
91.55 28.02
71.1 58.31
38.63 45
39.01
Strength and Weakness is relative to 10 districts with similar demographic structure
How to read the scorecard: All the values are scores on a scale of 0-100. So, higher score represents better performance. For instance, a score of 91 on access to contraceptives will depict high score of the indicator.
OverperformingPerforming within expected range
Underperforming
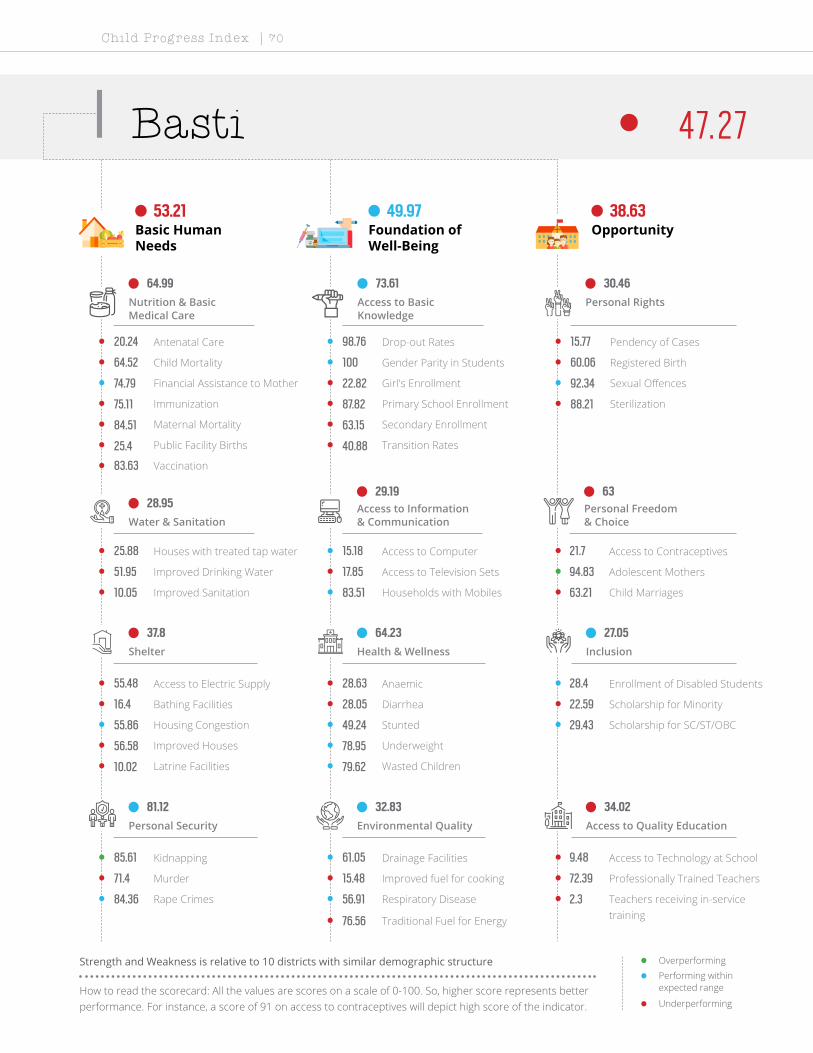
Child Progress Index | 70
Basti 4 7. 2 7
Basic Human Needs
Foundation of Well-Being
Opportunity53.21 49.97 38.63
Antenatal Care Drop-out Rates Pendency of Cases
Access to Electric Supply Anaemic Enrollment of Disabled Students
Kidnapping Drainage Facilities Access to Technology at School
Houses with treated tap water Access to Computer Access to Contraceptives
Child Mortality Gender Parity in Students Registered Birth
Bathing Facilities Diarrhea Scholarship for Minority
Murder Improved fuel for cooking Professionally Trained Teachers
Improved Drinking Water Access to Television Sets Adolescent Mothers
Financial Assistance to Mother Girl's Enrollment Sexual Offences
Housing Congestion Stunted Scholarship for SC/ST/OBC
Rape Crimes Respiratory Disease Teachers receiving in-service trainingTraditional Fuel for Energy
Improved Sanitation Households with Mobiles Child Marriages
Immunization Primary School Enrollment Sterilization
Improved Houses Underweight
Maternal Mortality Secondary Enrollment
Latrine Facilities Wasted Children
Public Facility Births Transition Rates
Vaccination
64.99 73.61 30.46
28.9529.19 63
37.8 64.23 27.05
81.12 32.83 34.02
Nutrition & Basic Medical Care
Access to Basic Knowledge
Personal Rights
Water & SanitationAccess to Information & Communication
Personal Freedom & Choice
Shelter Health & Wellness Inclusion
Personal Security Environmental Quality Access to Quality Education
20.24 98.76 15.77
55.48 28.63 28.4
85.61 61.05 9.48
25.88 15.18 21.7
64.52 100 60.06
16.4 28.05 22.59
71.4 15.48 72.39
51.95 17.85 94.83
74.79 22.82 92.34
55.86 49.24 29.43
84.36 56.91 2.3
76.56
10.05 83.51 63.21
75.11 87.82 88.21
56.58 78.95
84.51 63.15
10.02 79.62
25.4 40.88
83.63
Strength and Weakness is relative to 10 districts with similar demographic structure
How to read the scorecard: All the values are scores on a scale of 0-100. So, higher score represents better performance. For instance, a score of 91 on access to contraceptives will depict high score of the indicator.
OverperformingPerforming within expected range
Underperforming

Child Progress Index | 71
Bijnor 5 5 . 3 8
Basic Human Needs
Foundation of Well-Being
Opportunity66.59 50.01 49.53
Antenatal Care Drop-out Rates Pendency of Cases
Access to Electric Supply Anaemic Enrollment of Disabled Students
Kidnapping Drainage Facilities Access to Technology at School
Houses with treated tap water Access to Computer Access to Contraceptives
Child Mortality Gender Parity in Students Registered Birth
Bathing Facilities Diarrhea Scholarship for Minority
Murder Improved fuel for cooking Professionally Trained Teachers
Improved Drinking Water Access to Television Sets Adolescent Mothers
Financial Assistance to Mother Girl's Enrollment Sexual Offences
Housing Congestion Stunted Scholarship for SC/ST/OBC
Rape Crimes Respiratory Disease Teachers receiving in-service trainingTraditional Fuel for Energy
Improved Sanitation Households with Mobiles Child Marriages
Immunization Primary School Enrollment Sterilization
Improved Houses Underweight
Maternal Mortality Secondary Enrollment
Latrine Facilities Wasted Children
Public Facility Births Transition Rates
Vaccination
68.73 58.4 45.79
67.8632.54 87.78
65.44 51.29 23.05
64.35 57.81 41.5
Nutrition & Basic Medical Care
Access to Basic Knowledge
Personal Rights
Water & SanitationAccess to Information & Communication
Personal Freedom & Choice
Shelter Health & Wellness Inclusion
Personal Security Environmental Quality Access to Quality Education
41.5 38.59 59.17
73.07 26.9 27.79
79.02 10.07 25.93
45.23 5.8 69.96
35.48 94.12 62.98
71 0 23
36.49 30.54 71.13
78.12 50.46 85.34
22.54 40.3 26.36
25.98 68.39 19.38
71.81 92.68 3.21
56.91
88.18 68.53 99.21
93.89 67.33 100
61.2 46.99
73.24 47.71
81.89 58.62
35.78 71.18
92.6
Strength and Weakness is relative to 10 districts with similar demographic structure
How to read the scorecard: All the values are scores on a scale of 0-100. So, higher score represents better performance. For instance, a score of 91 on access to contraceptives will depict high score of the indicator.
OverperformingPerforming within expected range
Underperforming

Child Progress Index | 72
Budaun 3 6 . 7 5
Basic Human Needs
Foundation of Well-Being
Opportunity45.77 34.01 30.48
Antenatal Care Drop-out Rates Pendency of Cases
Access to Electric Supply Anaemic Enrollment of Disabled Students
Kidnapping Drainage Facilities Access to Technology at School
Houses with treated tap water Access to Computer Access to Contraceptives
Child Mortality Gender Parity in Students Registered Birth
Bathing Facilities Diarrhea Scholarship for Minority
Murder Improved fuel for cooking Professionally Trained Teachers
Improved Drinking Water Access to Television Sets Adolescent Mothers
Financial Assistance to Mother Girl's Enrollment Sexual Offences
Housing Congestion Stunted Scholarship for SC/ST/OBC
Rape Crimes Respiratory Disease Teachers receiving in-service trainingTraditional Fuel for Energy
Improved Sanitation Households with Mobiles Child Marriages
Immunization Primary School Enrollment Sterilization
Improved Houses Underweight
Maternal Mortality Secondary Enrollment
Latrine Facilities Wasted Children
Public Facility Births Transition Rates
Vaccination
46.74 34.41 35.94
39.8619.55 41.88
23.18 37.42 11.23
73.3 44.65 32.87
Nutrition & Basic Medical Care
Access to Basic Knowledge
Personal Rights
Water & SanitationAccess to Information & Communication
Personal Freedom & Choice
Shelter Health & Wellness Inclusion
Personal Security Environmental Quality Access to Quality Education
50.21 50.62 58.29
36.27 57.48 17.22
75.34 17.29 8.68
14.07 2.23 68.01
6.45 41.18 46.54
8 57.01 9.68
71.15 23.76 67.52
78.93 19.69 13.79
71.79 34.78 74.34
16.78 30.4 7.75
72.94 78.86 3.01
90.65
35.63 62.48 47.33
66.17 37.65 100
28.41 2.63
73.24 20.01
25.24 56.74
61.29 27.65
69.51
Strength and Weakness is relative to 10 districts with similar demographic structure
How to read the scorecard: All the values are scores on a scale of 0-100. So, higher score represents better performance. For instance, a score of 91 on access to contraceptives will depict high score of the indicator.
OverperformingPerforming within expected range
Underperforming
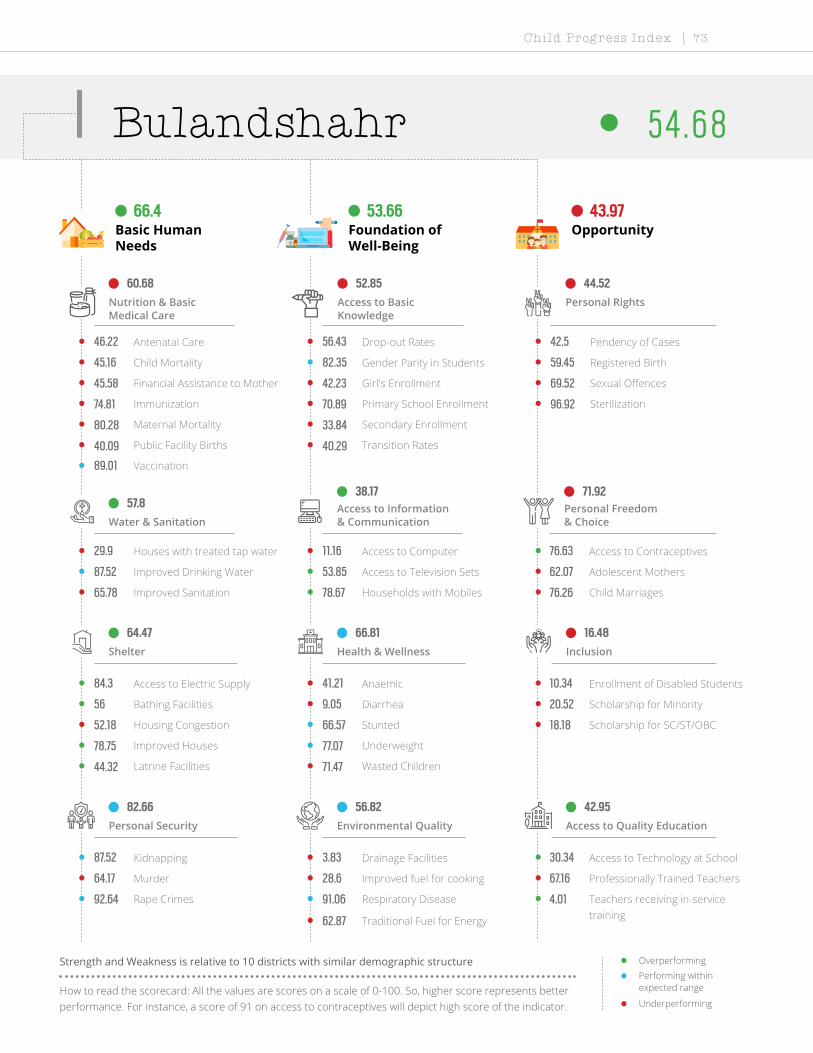
Child Progress Index | 73
Bulandshahr 5 4 . 6 8
Basic Human Needs
Foundation of Well-Being
Opportunity66.4 53.66 43.97
Antenatal Care Drop-out Rates Pendency of Cases
Access to Electric Supply Anaemic Enrollment of Disabled Students
Kidnapping Drainage Facilities Access to Technology at School
Houses with treated tap water Access to Computer Access to Contraceptives
Child Mortality Gender Parity in Students Registered Birth
Bathing Facilities Diarrhea Scholarship for Minority
Murder Improved fuel for cooking Professionally Trained Teachers
Improved Drinking Water Access to Television Sets Adolescent Mothers
Financial Assistance to Mother Girl's Enrollment Sexual Offences
Housing Congestion Stunted Scholarship for SC/ST/OBC
Rape Crimes Respiratory Disease Teachers receiving in-service trainingTraditional Fuel for Energy
Improved Sanitation Households with Mobiles Child Marriages
Immunization Primary School Enrollment Sterilization
Improved Houses Underweight
Maternal Mortality Secondary Enrollment
Latrine Facilities Wasted Children
Public Facility Births Transition Rates
Vaccination
60.68 52.85 44.52
57.838.17 71.92
64.47 66.81 16.48
82.66 56.82 42.95
Nutrition & Basic Medical Care
Access to Basic Knowledge
Personal Rights
Water & SanitationAccess to Information & Communication
Personal Freedom & Choice
Shelter Health & Wellness Inclusion
Personal Security Environmental Quality Access to Quality Education
46.22 56.43 42.5
84.3 41.21 10.34
87.52 3.83 30.34
29.9 11.16 76.63
45.16 82.35 59.45
56 9.05 20.52
64.17 28.6 67.16
87.52 53.85 62.07
45.58 42.23 69.52
52.18 66.57 18.18
92.64 91.06 4.01
62.87
65.78 78.67 76.26
74.81 70.89 96.92
78.75 77.07
80.28 33.84
44.32 71.47
40.09 40.29
89.01
Strength and Weakness is relative to 10 districts with similar demographic structure
How to read the scorecard: All the values are scores on a scale of 0-100. So, higher score represents better performance. For instance, a score of 91 on access to contraceptives will depict high score of the indicator.
OverperformingPerforming within expected range
Underperforming
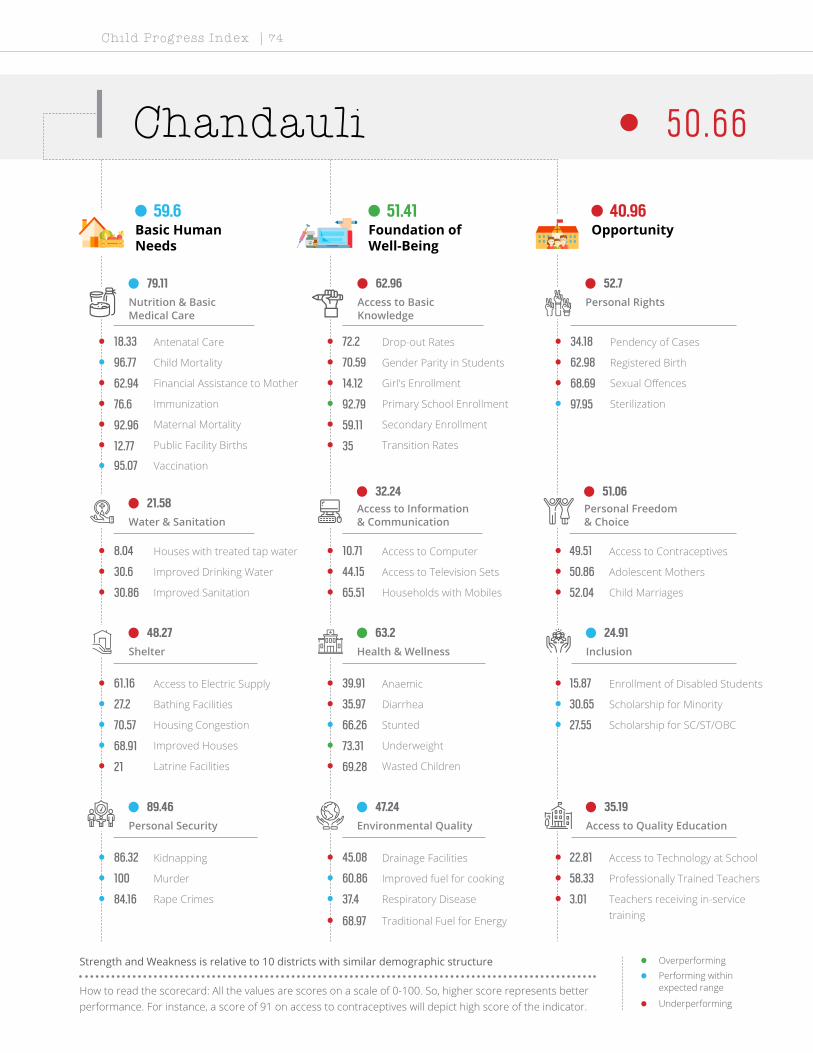
Child Progress Index | 74
Chandauli 5 0 . 6 6
Basic Human Needs
Foundation of Well-Being
Opportunity59.6 51.41 40.96
Antenatal Care Drop-out Rates Pendency of Cases
Access to Electric Supply Anaemic Enrollment of Disabled Students
Kidnapping Drainage Facilities Access to Technology at School
Houses with treated tap water Access to Computer Access to Contraceptives
Child Mortality Gender Parity in Students Registered Birth
Bathing Facilities Diarrhea Scholarship for Minority
Murder Improved fuel for cooking Professionally Trained Teachers
Improved Drinking Water Access to Television Sets Adolescent Mothers
Financial Assistance to Mother Girl's Enrollment Sexual Offences
Housing Congestion Stunted Scholarship for SC/ST/OBC
Rape Crimes Respiratory Disease Teachers receiving in-service trainingTraditional Fuel for Energy
Improved Sanitation Households with Mobiles Child Marriages
Immunization Primary School Enrollment Sterilization
Improved Houses Underweight
Maternal Mortality Secondary Enrollment
Latrine Facilities Wasted Children
Public Facility Births Transition Rates
Vaccination
79.11 62.96 52.7
21.5832.24 51.06
48.27 63.2 24.91
89.46 47.24 35.19
Nutrition & Basic Medical Care
Access to Basic Knowledge
Personal Rights
Water & SanitationAccess to Information & Communication
Personal Freedom & Choice
Shelter Health & Wellness Inclusion
Personal Security Environmental Quality Access to Quality Education
18.33 72.2 34.18
61.16 39.91 15.87
86.32 45.08 22.81
8.04 10.71 49.51
96.77 70.59 62.98
27.2 35.97 30.65
100 60.86 58.33
30.6 44.15 50.86
62.94 14.12 68.69
70.57 66.26 27.55
84.16 37.4 3.01
68.97
30.86 65.51 52.04
76.6 92.79 97.95
68.91 73.31
92.96 59.11
21 69.28
12.77 35
95.07
Strength and Weakness is relative to 10 districts with similar demographic structure
How to read the scorecard: All the values are scores on a scale of 0-100. So, higher score represents better performance. For instance, a score of 91 on access to contraceptives will depict high score of the indicator.
OverperformingPerforming within expected range
Underperforming

Child Progress Index | 75
Chitrakoot 4 1 . 3
Basic Human Needs
Foundation of Well-Being
Opportunity43.26 33.68 46.95
Antenatal Care Drop-out Rates Pendency of Cases
Access to Electric Supply Anaemic Enrollment of Disabled Students
Kidnapping Drainage Facilities Access to Technology at School
Houses with treated tap water Access to Computer Access to Contraceptives
Child Mortality Gender Parity in Students Registered Birth
Bathing Facilities Diarrhea Scholarship for Minority
Murder Improved fuel for cooking Professionally Trained Teachers
Improved Drinking Water Access to Television Sets Adolescent Mothers
Financial Assistance to Mother Girl's Enrollment Sexual Offences
Housing Congestion Stunted Scholarship for SC/ST/OBC
Rape Crimes Respiratory Disease Teachers receiving in-service trainingTraditional Fuel for Energy
Improved Sanitation Households with Mobiles Child Marriages
Immunization Primary School Enrollment Sterilization
Improved Houses Underweight
Maternal Mortality Secondary Enrollment
Latrine Facilities Wasted Children
Public Facility Births Transition Rates
Vaccination
62.61 59.87 75.52
8.0918.99 51.57
45.11 22.67 21.48
57.24 33.18 39.24
Nutrition & Basic Medical Care
Access to Basic Knowledge
Personal Rights
Water & SanitationAccess to Information & Communication
Personal Freedom & Choice
Shelter Health & Wellness Inclusion
Personal Security Environmental Quality Access to Quality Education
2.69 76.35 90.95
56.43 26.68 23.39
68.94 68.38 16.26
9.55 5.8 59.94
45.16 41.18 74.96
5 23.53 19.67
20.49 6.88 58.87
4.7 11.54 33.62
100 2.02 83.44
86.21 43.16 21.38
74.96 85.37 7.62
81.84
9.52 64.6 59.59
90.31 95.87 33.85
87.5 6.77
95.77 61.03
7.51 18.5
10.32 29.71
53.14
Strength and Weakness is relative to 10 districts with similar demographic structure
How to read the scorecard: All the values are scores on a scale of 0-100. So, higher score represents better performance. For instance, a score of 91 on access to contraceptives will depict high score of the indicator.
OverperformingPerforming within expected range
Underperforming

Child Progress Index | 76
Deoria 5 1 . 74
Basic Human Needs
Foundation of Well-Being
Opportunity59.4 51.42 44.4
Antenatal Care Drop-out Rates Pendency of Cases
Access to Electric Supply Anaemic Enrollment of Disabled Students
Kidnapping Drainage Facilities Access to Technology at School
Houses with treated tap water Access to Computer Access to Contraceptives
Child Mortality Gender Parity in Students Registered Birth
Bathing Facilities Diarrhea Scholarship for Minority
Murder Improved fuel for cooking Professionally Trained Teachers
Improved Drinking Water Access to Television Sets Adolescent Mothers
Financial Assistance to Mother Girl's Enrollment Sexual Offences
Housing Congestion Stunted Scholarship for SC/ST/OBC
Rape Crimes Respiratory Disease Teachers receiving in-service trainingTraditional Fuel for Energy
Improved Sanitation Households with Mobiles Child Marriages
Immunization Primary School Enrollment Sterilization
Improved Houses Underweight
Maternal Mortality Secondary Enrollment
Latrine Facilities Wasted Children
Public Facility Births Transition Rates
Vaccination
82.15 60.53 41.18
34.9931.57 70.11
47.16 71.71 31.03
73.3 41.88 35.27
Nutrition & Basic Medical Care
Access to Basic Knowledge
Personal Rights
Water & SanitationAccess to Information & Communication
Personal Freedom & Choice
Shelter Health & Wellness Inclusion
Personal Security Environmental Quality Access to Quality Education
25.18 58.92 0
60.76 35.79 31.58
74.09 44.53 16.33
22.36 9.82 41.17
100 100 84.79
25.4 11.54 44.88
73.36 33.44 72.08
61.61 26.62 88.79
74.96 32.5 52.82
64.14 72.64 19.96
72.44 55.28 1.3
72.22
25.4 94.25 72.8
84.5 65.96 100
74.3 85.34
95.77 47.55
16.96 81.5
47.13 58.53
84.98
Strength and Weakness is relative to 10 districts with similar demographic structure
How to read the scorecard: All the values are scores on a scale of 0-100. So, higher score represents better performance. For instance, a score of 91 on access to contraceptives will depict high score of the indicator.
OverperformingPerforming within expected range
Underperforming

Child Progress Index | 77
Etah 4 3 . 6 9
Basic Human Needs
Foundation of Well-Being
Opportunity36.94 53.22 40.91
Antenatal Care Drop-out Rates Pendency of Cases
Access to Electric Supply Anaemic Enrollment of Disabled Students
Kidnapping Drainage Facilities Access to Technology at School
Houses with treated tap water Access to Computer Access to Contraceptives
Child Mortality Gender Parity in Students Registered Birth
Bathing Facilities Diarrhea Scholarship for Minority
Murder Improved fuel for cooking Professionally Trained Teachers
Improved Drinking Water Access to Television Sets Adolescent Mothers
Financial Assistance to Mother Girl's Enrollment Sexual Offences
Housing Congestion Stunted Scholarship for SC/ST/OBC
Rape Crimes Respiratory Disease Teachers receiving in-service trainingTraditional Fuel for Energy
Improved Sanitation Households with Mobiles Child Marriages
Immunization Primary School Enrollment Sterilization
Improved Houses Underweight
Maternal Mortality Secondary Enrollment
Latrine Facilities Wasted Children
Public Facility Births Transition Rates
Vaccination
44.21 68.73 52.81
28.2628.73 51.95
35.23 79.28 19.74
40.04 36.13 39.12
Nutrition & Basic Medical Care
Access to Basic Knowledge
Personal Rights
Water & SanitationAccess to Information & Communication
Personal Freedom & Choice
Shelter Health & Wellness Inclusion
Personal Security Environmental Quality Access to Quality Education
20.87 67.22 86.18
54.53 96.75 6.3
64.49 51.86 14.23
24.37 9.38 72.04
38.71 52.94 40.86
12.2 100 28.42
15.29 23.76 85.1
39.19 28.62 19.83
19.37 19.43 0
32.87 42.86 23..58
34.92 57.72 1.2
81.44
22.57 77.16 63.52
60.95 100 54.87
72.82 83.08
57.75 58.98
2.5 89.03
12.4 78.82
35.65
Strength and Weakness is relative to 10 districts with similar demographic structure
How to read the scorecard: All the values are scores on a scale of 0-100. So, higher score represents better performance. For instance, a score of 91 on access to contraceptives will depict high score of the indicator.
OverperformingPerforming within expected range
Underperforming
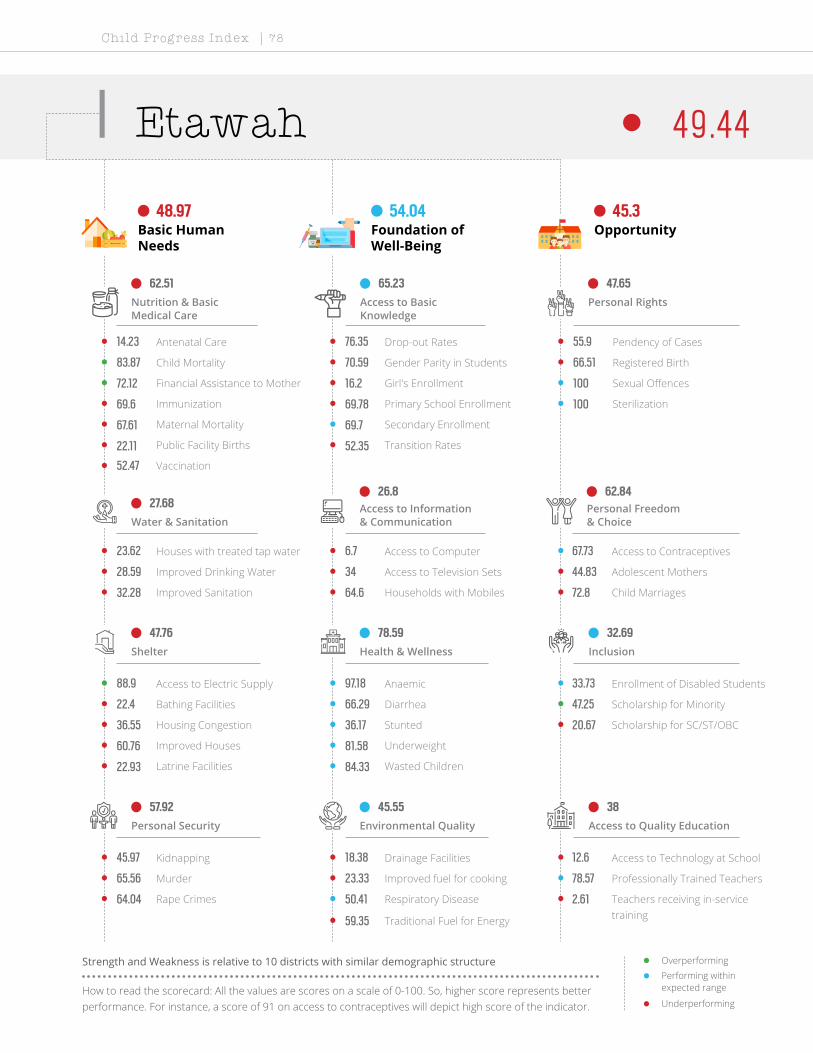
Child Progress Index | 78
Etawah 4 9 .4 4
Basic Human Needs
Foundation of Well-Being
Opportunity48.97 54.04 45.3
Antenatal Care Drop-out Rates Pendency of Cases
Access to Electric Supply Anaemic Enrollment of Disabled Students
Kidnapping Drainage Facilities Access to Technology at School
Houses with treated tap water Access to Computer Access to Contraceptives
Child Mortality Gender Parity in Students Registered Birth
Bathing Facilities Diarrhea Scholarship for Minority
Murder Improved fuel for cooking Professionally Trained Teachers
Improved Drinking Water Access to Television Sets Adolescent Mothers
Financial Assistance to Mother Girl's Enrollment Sexual Offences
Housing Congestion Stunted Scholarship for SC/ST/OBC
Rape Crimes Respiratory Disease Teachers receiving in-service trainingTraditional Fuel for Energy
Improved Sanitation Households with Mobiles Child Marriages
Immunization Primary School Enrollment Sterilization
Improved Houses Underweight
Maternal Mortality Secondary Enrollment
Latrine Facilities Wasted Children
Public Facility Births Transition Rates
Vaccination
62.51 65.23 47.65
27.6826.8 62.84
47.76 78.59 32.69
57.92 45.55 38
Nutrition & Basic Medical Care
Access to Basic Knowledge
Personal Rights
Water & SanitationAccess to Information & Communication
Personal Freedom & Choice
Shelter Health & Wellness Inclusion
Personal Security Environmental Quality Access to Quality Education
14.23 76.35 55.9
88.9 97.18 33.73
45.97 18.38 12.6
23.62 6.7 67.73
83.87 70.59 66.51
22.4 66.29 47.25
65.56 23.33 78.57
28.59 34 44.83
72.12 16.2 100
36.55 36.17 20.67
64.04 50.41 2.61
59.35
32.28 64.6 72.8
69.6 69.78 100
60.76 81.58
67.61 69.7
22.93 84.33
22.11 52.35
52.47
Strength and Weakness is relative to 10 districts with similar demographic structure
How to read the scorecard: All the values are scores on a scale of 0-100. So, higher score represents better performance. For instance, a score of 91 on access to contraceptives will depict high score of the indicator.
OverperformingPerforming within expected range
Underperforming

Child Progress Index | 79
Faizabad 4 8 .1 2
Basic Human Needs
Foundation of Well-Being
Opportunity48.57 44.33 51.46
Antenatal Care Drop-out Rates Pendency of Cases
Access to Electric Supply Anaemic Enrollment of Disabled Students
Kidnapping Drainage Facilities Access to Technology at School
Houses with treated tap water Access to Computer Access to Contraceptives
Child Mortality Gender Parity in Students Registered Birth
Bathing Facilities Diarrhea Scholarship for Minority
Murder Improved fuel for cooking Professionally Trained Teachers
Improved Drinking Water Access to Television Sets Adolescent Mothers
Financial Assistance to Mother Girl's Enrollment Sexual Offences
Housing Congestion Stunted Scholarship for SC/ST/OBC
Rape Crimes Respiratory Disease Teachers receiving in-service trainingTraditional Fuel for Energy
Improved Sanitation Households with Mobiles Child Marriages
Immunization Primary School Enrollment Sterilization
Improved Houses Underweight
Maternal Mortality Secondary Enrollment
Latrine Facilities Wasted Children
Public Facility Births Transition Rates
Vaccination
52.3 59.82 55.79
33.0227.92 69.74
36.8 49.1 26.79
72.18 40.48 53.53
Nutrition & Basic Medical Care
Access to Basic Knowledge
Personal Rights
Water & SanitationAccess to Information & Communication
Personal Freedom & Choice
Shelter Health & Wellness Inclusion
Personal Security Environmental Quality Access to Quality Education
25.23 38.59 53.84
53.86 46.2 24.54
75.64 39.17 28.91
21.36 14.73 57.16
48.39 64.71 90.17
18 40.05 25.11
78.51 20.75 84.24
57.45 23.38 81.9
79.63 24.69 42.7
56.55 46.2 29.84
63.49 64.23 7.41
73.71
24.34 68.53 68.08
61.7 97.17 56.41
48.49 35.34
35.21 59.62
12.72 63.01
23.08 53.53
38.79
Strength and Weakness is relative to 10 districts with similar demographic structure
How to read the scorecard: All the values are scores on a scale of 0-100. So, higher score represents better performance. For instance, a score of 91 on access to contraceptives will depict high score of the indicator.
OverperformingPerforming within expected range
Underperforming

Child Progress Index | 80
Farrukhabad 4 5 . 3 4
Basic Human Needs
Foundation of Well-Being
Opportunity43.64 53.36 39.04
Antenatal Care Drop-out Rates Pendency of Cases
Access to Electric Supply Anaemic Enrollment of Disabled Students
Kidnapping Drainage Facilities Access to Technology at School
Houses with treated tap water Access to Computer Access to Contraceptives
Child Mortality Gender Parity in Students Registered Birth
Bathing Facilities Diarrhea Scholarship for Minority
Murder Improved fuel for cooking Professionally Trained Teachers
Improved Drinking Water Access to Television Sets Adolescent Mothers
Financial Assistance to Mother Girl's Enrollment Sexual Offences
Housing Congestion Stunted Scholarship for SC/ST/OBC
Rape Crimes Respiratory Disease Teachers receiving in-service trainingTraditional Fuel for Energy
Improved Sanitation Households with Mobiles Child Marriages
Immunization Primary School Enrollment Sterilization
Improved Houses Underweight
Maternal Mortality Secondary Enrollment
Latrine Facilities Wasted Children
Public Facility Births Transition Rates
Vaccination
40.93 63.75 37.25
23.7424.3 58.63
37.7 88.17 18.77
72.2 37.2 41.5
Nutrition & Basic Medical Care
Access to Basic Knowledge
Personal Rights
Water & SanitationAccess to Information & Communication
Personal Freedom & Choice
Shelter Health & Wellness Inclusion
Personal Security Environmental Quality Access to Quality Education
17.96 76.35 47.93
50.07 100 20.85
84.36 61.05 29.37
10.05 4.02 59.94
48.39 70.59 53.92
19.6 42.31 18.31
51.54 15.48 77.99
30.87 30.31 39.66
51.09 20.41 83.17
28.05 48.63 17.51
76.43 78.86 0.4
75.61
35.1 64.6 71.23
46.94 98.9 72.31
58 86.09
84.51 49.18
30.83 100
8.36 40.88
22.42
Strength and Weakness is relative to 10 districts with similar demographic structure
How to read the scorecard: All the values are scores on a scale of 0-100. So, higher score represents better performance. For instance, a score of 91 on access to contraceptives will depict high score of the indicator.
OverperformingPerforming within expected range
Underperforming
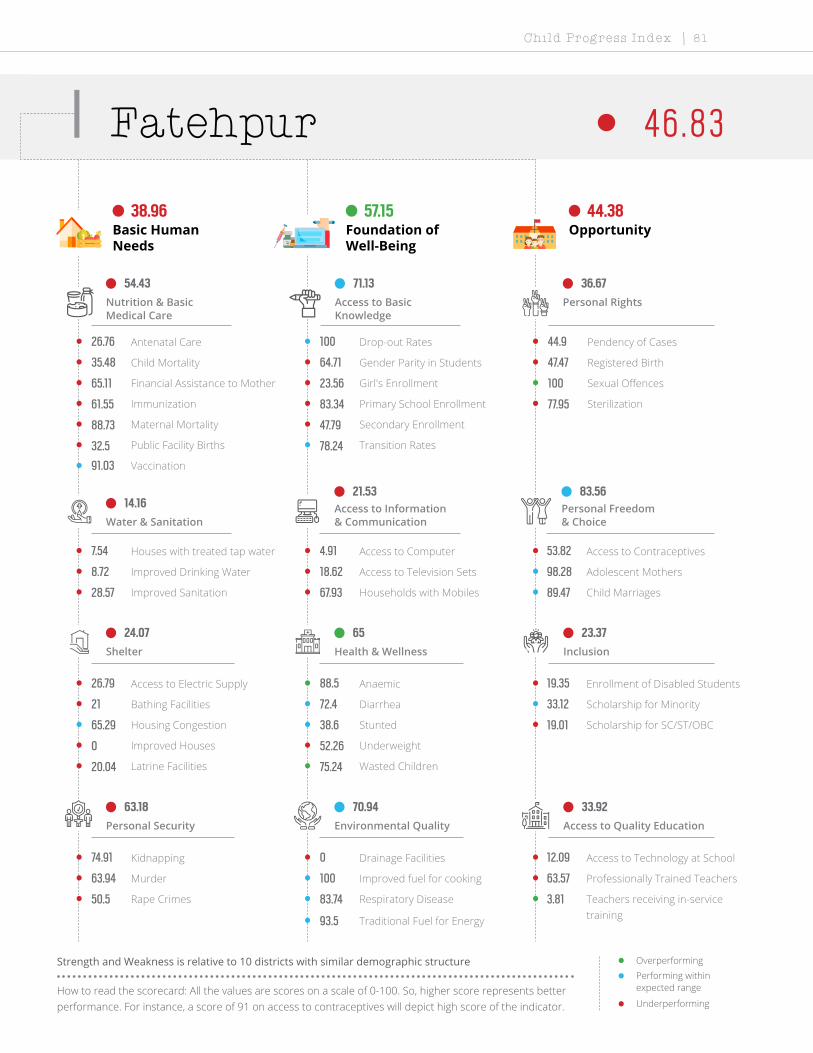
Child Progress Index | 81
Fatehpur 4 6 . 8 3
Basic Human Needs
Foundation of Well-Being
Opportunity38.96 57.15 44.38
Antenatal Care Drop-out Rates Pendency of Cases
Access to Electric Supply Anaemic Enrollment of Disabled Students
Kidnapping Drainage Facilities Access to Technology at School
Houses with treated tap water Access to Computer Access to Contraceptives
Child Mortality Gender Parity in Students Registered Birth
Bathing Facilities Diarrhea Scholarship for Minority
Murder Improved fuel for cooking Professionally Trained Teachers
Improved Drinking Water Access to Television Sets Adolescent Mothers
Financial Assistance to Mother Girl's Enrollment Sexual Offences
Housing Congestion Stunted Scholarship for SC/ST/OBC
Rape Crimes Respiratory Disease Teachers receiving in-service trainingTraditional Fuel for Energy
Improved Sanitation Households with Mobiles Child Marriages
Immunization Primary School Enrollment Sterilization
Improved Houses Underweight
Maternal Mortality Secondary Enrollment
Latrine Facilities Wasted Children
Public Facility Births Transition Rates
Vaccination
54.43 71.13 36.67
14.1621.53 83.56
24.07 65 23.37
63.18 70.94 33.92
Nutrition & Basic Medical Care
Access to Basic Knowledge
Personal Rights
Water & SanitationAccess to Information & Communication
Personal Freedom & Choice
Shelter Health & Wellness Inclusion
Personal Security Environmental Quality Access to Quality Education
26.76 100 44.9
26.79 88.5 19.35
74.91 0 12.09
7.54 4.91 53.82
35.48 64.71 47.47
21 72.4 33.12
63.94 100 63.57
8.72 18.62 98.28
65.11 23.56 100
65.29 38.6 19.01
50.5 83.74 3.81
93.5
28.57 67.93 89.47
61.55 83.34 77.95
0 52.26
88.73 47.79
20.04 75.24
32.5 78.24
91.03
Strength and Weakness is relative to 10 districts with similar demographic structure
How to read the scorecard: All the values are scores on a scale of 0-100. So, higher score represents better performance. For instance, a score of 91 on access to contraceptives will depict high score of the indicator.
OverperformingPerforming within expected range
Underperforming

Child Progress Index | 82
Firozabad 4 8 .1 8
Basic Human Needs
Foundation of Well-Being
Opportunity47.34 52.38 44.83
Antenatal Care Drop-out Rates Pendency of Cases
Access to Electric Supply Anaemic Enrollment of Disabled Students
Kidnapping Drainage Facilities Access to Technology at School
Houses with treated tap water Access to Computer Access to Contraceptives
Child Mortality Gender Parity in Students Registered Birth
Bathing Facilities Diarrhea Scholarship for Minority
Murder Improved fuel for cooking Professionally Trained Teachers
Improved Drinking Water Access to Television Sets Adolescent Mothers
Financial Assistance to Mother Girl's Enrollment Sexual Offences
Housing Congestion Stunted Scholarship for SC/ST/OBC
Rape Crimes Respiratory Disease Teachers receiving in-service trainingTraditional Fuel for Energy
Improved Sanitation Households with Mobiles Child Marriages
Immunization Primary School Enrollment Sterilization
Improved Houses Underweight
Maternal Mortality Secondary Enrollment
Latrine Facilities Wasted Children
Public Facility Births Transition Rates
Vaccination
61.33 51.97 36.97
31.3324.7 66.4
44.37 83.73 24.02
52.34 49.12 51.92
Nutrition & Basic Medical Care
Access to Basic Knowledge
Personal Rights
Water & SanitationAccess to Information & Communication
Personal Freedom & Choice
Shelter Health & Wellness Inclusion
Personal Security Environmental Quality Access to Quality Education
31.57 59.34 44.25
81.06 81.56 19.72
39.29 12.25 21.25
26.38 9.38 62.03
54.84 58.82 41.17
15 45.7 18.03
79.59 33.44 75.74
28.46 50 68.97
63.77 23.88 100
30.11 64.13 31.98
43.7 36.59 10.72
49.73
40.92 19.67 66.98
77.05 60.71 85.64
81.78 99.25
95.77 39.54
6.74 82.45
33.48 57.06
64.8
Strength and Weakness is relative to 10 districts with similar demographic structure
How to read the scorecard: All the values are scores on a scale of 0-100. So, higher score represents better performance. For instance, a score of 91 on access to contraceptives will depict high score of the indicator.
OverperformingPerforming within expected range
Underperforming
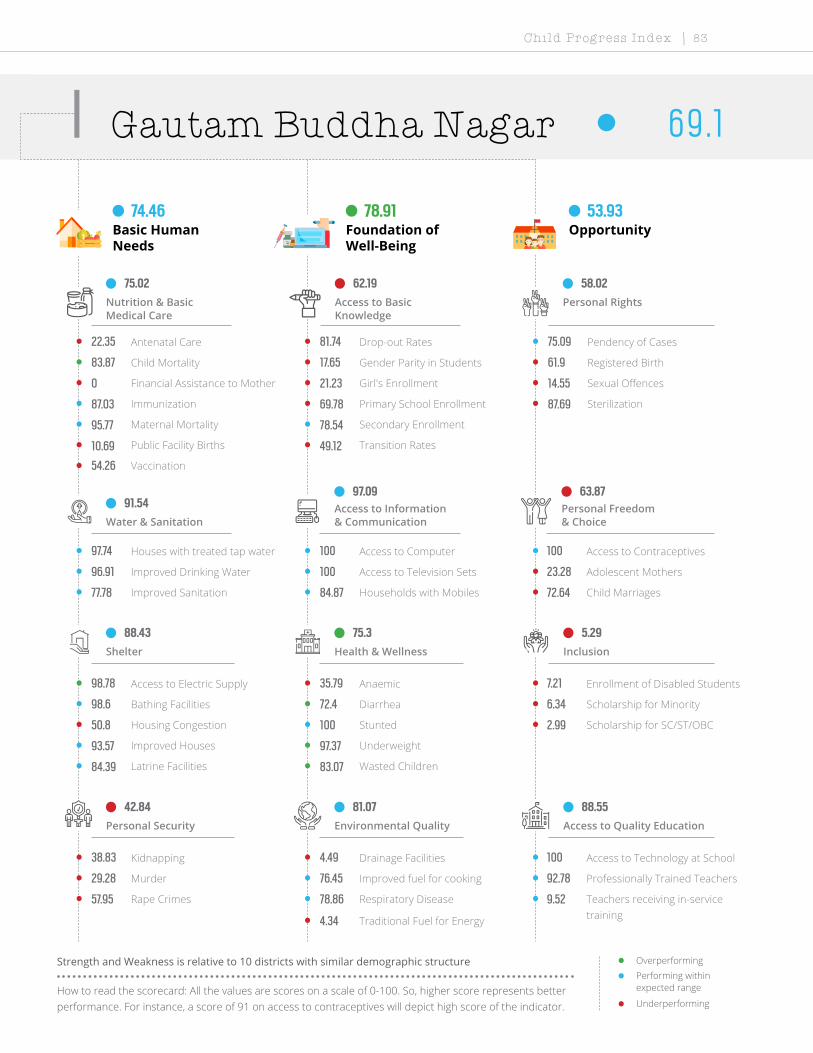
Child Progress Index | 83
Gautam Buddha Nagar 6 9 .1
Basic Human Needs
Foundation of Well-Being
Opportunity74.46 78.91 53.93
Antenatal Care Drop-out Rates Pendency of Cases
Access to Electric Supply Anaemic Enrollment of Disabled Students
Kidnapping Drainage Facilities Access to Technology at School
Houses with treated tap water Access to Computer Access to Contraceptives
Child Mortality Gender Parity in Students Registered Birth
Bathing Facilities Diarrhea Scholarship for Minority
Murder Improved fuel for cooking Professionally Trained Teachers
Improved Drinking Water Access to Television Sets Adolescent Mothers
Financial Assistance to Mother Girl's Enrollment Sexual Offences
Housing Congestion Stunted Scholarship for SC/ST/OBC
Rape Crimes Respiratory Disease Teachers receiving in-service trainingTraditional Fuel for Energy
Improved Sanitation Households with Mobiles Child Marriages
Immunization Primary School Enrollment Sterilization
Improved Houses Underweight
Maternal Mortality Secondary Enrollment
Latrine Facilities Wasted Children
Public Facility Births Transition Rates
Vaccination
75.02 62.19 58.02
91.5497.09 63.87
88.43 75.3 5.29
42.84 81.07 88.55
Nutrition & Basic Medical Care
Access to Basic Knowledge
Personal Rights
Water & SanitationAccess to Information & Communication
Personal Freedom & Choice
Shelter Health & Wellness Inclusion
Personal Security Environmental Quality Access to Quality Education
22.35 81.74 75.09
98.78 35.79 7.21
38.83 4.49 100
97.74 100 100
83.87 17.65 61.9
98.6 72.4 6.34
29.28 76.45 92.78
96.91 100 23.28
0 21.23 14.55
50.8 100 2.99
57.95 78.86 9.52
4.34
77.78 84.87 72.64
87.03 69.78 87.69
93.57 97.37
95.77 78.54
84.39 83.07
10.69 49.12
54.26
Strength and Weakness is relative to 10 districts with similar demographic structure
How to read the scorecard: All the values are scores on a scale of 0-100. So, higher score represents better performance. For instance, a score of 91 on access to contraceptives will depict high score of the indicator.
OverperformingPerforming within expected range
Underperforming
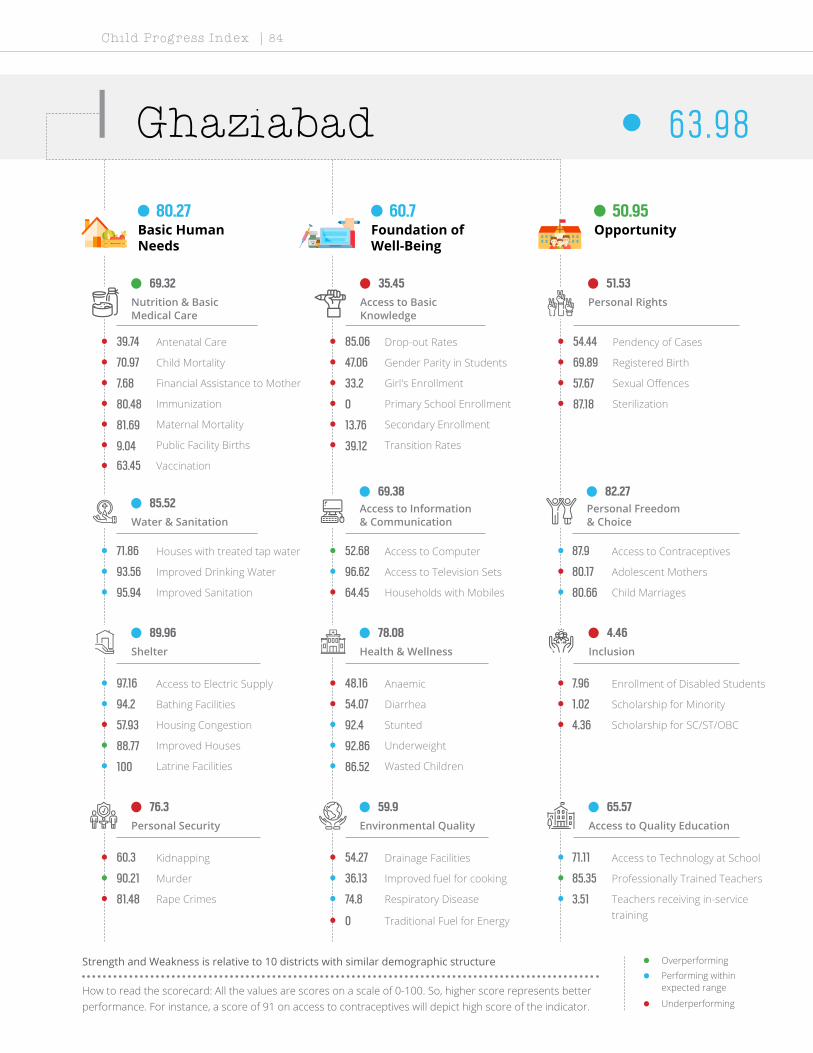
Child Progress Index | 84
Ghaziabad 6 3 . 9 8
Basic Human Needs
Foundation of Well-Being
Opportunity80.27 60.7 50.95
Antenatal Care Drop-out Rates Pendency of Cases
Access to Electric Supply Anaemic Enrollment of Disabled Students
Kidnapping Drainage Facilities Access to Technology at School
Houses with treated tap water Access to Computer Access to Contraceptives
Child Mortality Gender Parity in Students Registered Birth
Bathing Facilities Diarrhea Scholarship for Minority
Murder Improved fuel for cooking Professionally Trained Teachers
Improved Drinking Water Access to Television Sets Adolescent Mothers
Financial Assistance to Mother Girl's Enrollment Sexual Offences
Housing Congestion Stunted Scholarship for SC/ST/OBC
Rape Crimes Respiratory Disease Teachers receiving in-service trainingTraditional Fuel for Energy
Improved Sanitation Households with Mobiles Child Marriages
Immunization Primary School Enrollment Sterilization
Improved Houses Underweight
Maternal Mortality Secondary Enrollment
Latrine Facilities Wasted Children
Public Facility Births Transition Rates
Vaccination
69.32 35.45 51.53
85.5269.38 82.27
89.96 78.08 4.46
76.3 59.9 65.57
Nutrition & Basic Medical Care
Access to Basic Knowledge
Personal Rights
Water & SanitationAccess to Information & Communication
Personal Freedom & Choice
Shelter Health & Wellness Inclusion
Personal Security Environmental Quality Access to Quality Education
39.74 85.06 54.44
97.16 48.16 7.96
60.3 54.27 71.11
71.86 52.68 87.9
70.97 47.06 69.89
94.2 54.07 1.02
90.21 36.13 85.35
93.56 96.62 80.17
7.68 33.2 57.67
57.93 92.4 4.36
81.48 74.8 3.51
0
95.94 64.45 80.66
80.48 0 87.18
88.77 92.86
81.69 13.76
100 86.52
9.04 39.12
63.45
Strength and Weakness is relative to 10 districts with similar demographic structure
How to read the scorecard: All the values are scores on a scale of 0-100. So, higher score represents better performance. For instance, a score of 91 on access to contraceptives will depict high score of the indicator.
OverperformingPerforming within expected range
Underperforming

Child Progress Index | 85
Ghazipur 4 7. 9 8
Basic Human Needs
Foundation of Well-Being
Opportunity49.85 49.85 44.24
Antenatal Care Drop-out Rates Pendency of Cases
Access to Electric Supply Anaemic Enrollment of Disabled Students
Kidnapping Drainage Facilities Access to Technology at School
Houses with treated tap water Access to Computer Access to Contraceptives
Child Mortality Gender Parity in Students Registered Birth
Bathing Facilities Diarrhea Scholarship for Minority
Murder Improved fuel for cooking Professionally Trained Teachers
Improved Drinking Water Access to Television Sets Adolescent Mothers
Financial Assistance to Mother Girl's Enrollment Sexual Offences
Housing Congestion Stunted Scholarship for SC/ST/OBC
Rape Crimes Respiratory Disease Teachers receiving in-service trainingTraditional Fuel for Energy
Improved Sanitation Households with Mobiles Child Marriages
Immunization Primary School Enrollment Sterilization
Improved Houses Underweight
Maternal Mortality Secondary Enrollment
Latrine Facilities Wasted Children
Public Facility Births Transition Rates
Vaccination
57.27 74.27 44.96
17.0525.96 63.43
43.94 65.2 31.43
81.14 33.96 37.14
Nutrition & Basic Medical Care
Access to Basic Knowledge
Personal Rights
Water & SanitationAccess to Information & Communication
Personal Freedom & Choice
Shelter Health & Wellness Inclusion
Personal Security Environmental Quality Access to Quality Education
35.6 76.35 35.89
57.24 35.14 17.65
76.44 47.59 10.08
2.51 9.38 45.76
54.84 88.24 62.06
17.8 42.53 43.35
82.66 14.09 84.7
38.39 27.54 68.97
73.62 51.08 68.1
71.49 72.04 33.03
84.75 64.23 1.1
87.67
15.34 64.6 69.18
49.33 69.78 90.77
62.86 84.96
56.34 81.58
20.62 67.4
43.86 63.53
92.38
Strength and Weakness is relative to 10 districts with similar demographic structure
How to read the scorecard: All the values are scores on a scale of 0-100. So, higher score represents better performance. For instance, a score of 91 on access to contraceptives will depict high score of the indicator.
OverperformingPerforming within expected range
Underperforming

Child Progress Index | 86
Gonda 3 8 . 7
Basic Human Needs
Foundation of Well-Being
Opportunity45.03 44.16 26.91
Antenatal Care Drop-out Rates Pendency of Cases
Access to Electric Supply Anaemic Enrollment of Disabled Students
Kidnapping Drainage Facilities Access to Technology at School
Houses with treated tap water Access to Computer Access to Contraceptives
Child Mortality Gender Parity in Students Registered Birth
Bathing Facilities Diarrhea Scholarship for Minority
Murder Improved fuel for cooking Professionally Trained Teachers
Improved Drinking Water Access to Television Sets Adolescent Mothers
Financial Assistance to Mother Girl's Enrollment Sexual Offences
Housing Congestion Stunted Scholarship for SC/ST/OBC
Rape Crimes Respiratory Disease Teachers receiving in-service trainingTraditional Fuel for Energy
Improved Sanitation Households with Mobiles Child Marriages
Immunization Primary School Enrollment Sterilization
Improved Houses Underweight
Maternal Mortality Secondary Enrollment
Latrine Facilities Wasted Children
Public Facility Births Transition Rates
Vaccination
47.98 62.71 23.59
30.4219.96 36.23
23.95 57.63 13.83
77.76 36.36 33.99
Nutrition & Basic Medical Care
Access to Basic Knowledge
Personal Rights
Water & SanitationAccess to Information & Communication
Personal Freedom & Choice
Shelter Health & Wellness Inclusion
Personal Security Environmental Quality Access to Quality Education
53.78 85.48 28.05
18.94 26.46 23.74
65.95 57 15.83
33.17 16.07 15.44
61.29 70.59 30.88
14.8 52.94 8.38
97.09 45.05 60.05
55.84 9.23 60.34
38.4 45.72 67.27
52.18 24.92 10.27
74.27 39.02 3.71
89.02
1.23 47.96 30.66
44.26 95.21 100
44.29 59.02
97.18 38.3
0 91.22
65.99 35.29
62.56
Strength and Weakness is relative to 10 districts with similar demographic structure
How to read the scorecard: All the values are scores on a scale of 0-100. So, higher score represents better performance. For instance, a score of 91 on access to contraceptives will depict high score of the indicator.
OverperformingPerforming within expected range
Underperforming

Child Progress Index | 87
Gorakhpur 5 3 . 3 7
Basic Human Needs
Foundation of Well-Being
Opportunity59.85 48.94 51.31
Antenatal Care Drop-out Rates Pendency of Cases
Access to Electric Supply Anaemic Enrollment of Disabled Students
Kidnapping Drainage Facilities Access to Technology at School
Houses with treated tap water Access to Computer Access to Contraceptives
Child Mortality Gender Parity in Students Registered Birth
Bathing Facilities Diarrhea Scholarship for Minority
Murder Improved fuel for cooking Professionally Trained Teachers
Improved Drinking Water Access to Television Sets Adolescent Mothers
Financial Assistance to Mother Girl's Enrollment Sexual Offences
Housing Congestion Stunted Scholarship for SC/ST/OBC
Rape Crimes Respiratory Disease Teachers receiving in-service trainingTraditional Fuel for Energy
Improved Sanitation Households with Mobiles Child Marriages
Immunization Primary School Enrollment Sterilization
Improved Houses Underweight
Maternal Mortality Secondary Enrollment
Latrine Facilities Wasted Children
Public Facility Births Transition Rates
Vaccination
73.13 60.16 65.8
46.2137.37 71.6
47.89 63.02 26.09
72.17 35.22 41.74
Nutrition & Basic Medical Care
Access to Basic Knowledge
Personal Rights
Water & SanitationAccess to Information & Communication
Personal Freedom & Choice
Shelter Health & Wellness Inclusion
Personal Security Environmental Quality Access to Quality Education
61.36 64.32 44.68
66.58 54.01 23.14
58.83 74.07 20.55
39.7 25.89 58.83
90.32 100 100
22.6 67.42 32.26
90.27 18.06 84.1
59.06 43.23 88.79
52.59 45.04 51.35
57.93 69.91 23.65
71.22 56.91 1.5
57.45
42.15 55.98 66.51
86.89 85.67 97.95
75.21 71.8
60.56 43.93
20.62 64.26
66.15 28.24
44.17
Strength and Weakness is relative to 10 districts with similar demographic structure
How to read the scorecard: All the values are scores on a scale of 0-100. So, higher score represents better performance. For instance, a score of 91 on access to contraceptives will depict high score of the indicator.
OverperformingPerforming within expected range
Underperforming

Child Progress Index | 88
Hamirpur 5 2 . 5 3
Basic Human Needs
Foundation of Well-Being
Opportunity60.79 45.64 51.15
Antenatal Care Drop-out Rates Pendency of Cases
Access to Electric Supply Anaemic Enrollment of Disabled Students
Kidnapping Drainage Facilities Access to Technology at School
Houses with treated tap water Access to Computer Access to Contraceptives
Child Mortality Gender Parity in Students Registered Birth
Bathing Facilities Diarrhea Scholarship for Minority
Murder Improved fuel for cooking Professionally Trained Teachers
Improved Drinking Water Access to Television Sets Adolescent Mothers
Financial Assistance to Mother Girl's Enrollment Sexual Offences
Housing Congestion Stunted Scholarship for SC/ST/OBC
Rape Crimes Respiratory Disease Teachers receiving in-service trainingTraditional Fuel for Energy
Improved Sanitation Households with Mobiles Child Marriages
Immunization Primary School Enrollment Sterilization
Improved Houses Underweight
Maternal Mortality Secondary Enrollment
Latrine Facilities Wasted Children
Public Facility Births Transition Rates
Vaccination
68.38 63.83 61.49
31.5922.37 68.4
64.62 52.55 31.12
78.55 43.8 43.6
Nutrition & Basic Medical Care
Access to Basic Knowledge
Personal Rights
Water & SanitationAccess to Information & Communication
Personal Freedom & Choice
Shelter Health & Wellness Inclusion
Personal Security Environmental Quality Access to Quality Education
0 100 50.07
100 63.56 6.08
98.87 28.67 26.85
22.86 4.02 56.05
70.97 35.29 79.26
23.4 44 46.5
79.84 15.59 78.81
13.83 22.46 61.21
93.82 2.35 100
100 80.85 38.87
56.61 85.37 2.4
79
61.2 67.93 80.19
57.82 69.78 51.79
78.08 54.51
92.96 67.17
32.95 32.92
8.91 47.65
100
Strength and Weakness is relative to 10 districts with similar demographic structure
How to read the scorecard: All the values are scores on a scale of 0-100. So, higher score represents better performance. For instance, a score of 91 on access to contraceptives will depict high score of the indicator.
OverperformingPerforming within expected range
Underperforming

Child Progress Index | 89
Hardoi 4 1 . 3
Basic Human Needs
Foundation of Well-Being
Opportunity45.31 42.39 36.2
Antenatal Care Drop-out Rates Pendency of Cases
Access to Electric Supply Anaemic Enrollment of Disabled Students
Kidnapping Drainage Facilities Access to Technology at School
Houses with treated tap water Access to Computer Access to Contraceptives
Child Mortality Gender Parity in Students Registered Birth
Bathing Facilities Diarrhea Scholarship for Minority
Murder Improved fuel for cooking Professionally Trained Teachers
Improved Drinking Water Access to Television Sets Adolescent Mothers
Financial Assistance to Mother Girl's Enrollment Sexual Offences
Housing Congestion Stunted Scholarship for SC/ST/OBC
Rape Crimes Respiratory Disease Teachers receiving in-service trainingTraditional Fuel for Energy
Improved Sanitation Households with Mobiles Child Marriages
Immunization Primary School Enrollment Sterilization
Improved Houses Underweight
Maternal Mortality Secondary Enrollment
Latrine Facilities Wasted Children
Public Facility Births Transition Rates
Vaccination
43.19 50.89 36.57
30.815.95 64.85
16.37 65.01 12.93
90.9 37.71 30.46
Nutrition & Basic Medical Care
Access to Basic Knowledge
Personal Rights
Water & SanitationAccess to Information & Communication
Personal Freedom & Choice
Shelter Health & Wellness Inclusion
Personal Security Environmental Quality Access to Quality Education
68.27 68.46 50.97
22.46 87.2 0.97
89.64 28.34 8.73
14.57 5.36 32.96
9.68 41.18 46.85
9 66.29 20.97
92.53 19.35 61.73
51.95 15.69 75.86
72.62 51.76 67.86
15.4 44.38 16.09
90.86 65.85 2.81
95.8
31.57 42.81 74.53
47.69 69.78 92.82
16.82 54.14
80.28 53.38
18.3 71.47
77.86 9.71
88.57
Strength and Weakness is relative to 10 districts with similar demographic structure
How to read the scorecard: All the values are scores on a scale of 0-100. So, higher score represents better performance. For instance, a score of 91 on access to contraceptives will depict high score of the indicator.
OverperformingPerforming within expected range
Underperforming

Child Progress Index | 90
Jalaun 5 0 . 5 7
Basic Human Needs
Foundation of Well-Being
Opportunity64.23 39.39 48.08
Antenatal Care Drop-out Rates Pendency of Cases
Access to Electric Supply Anaemic Enrollment of Disabled Students
Kidnapping Drainage Facilities Access to Technology at School
Houses with treated tap water Access to Computer Access to Contraceptives
Child Mortality Gender Parity in Students Registered Birth
Bathing Facilities Diarrhea Scholarship for Minority
Murder Improved fuel for cooking Professionally Trained Teachers
Improved Drinking Water Access to Television Sets Adolescent Mothers
Financial Assistance to Mother Girl's Enrollment Sexual Offences
Housing Congestion Stunted Scholarship for SC/ST/OBC
Rape Crimes Respiratory Disease Teachers receiving in-service trainingTraditional Fuel for Energy
Improved Sanitation Households with Mobiles Child Marriages
Immunization Primary School Enrollment Sterilization
Improved Houses Underweight
Maternal Mortality Secondary Enrollment
Latrine Facilities Wasted Children
Public Facility Births Transition Rates
Vaccination
75.33 54.51 58.07
37.8126.43 65.19
62.96 20.35 26.1
80.84 56.28 42.96
Nutrition & Basic Medical Care
Access to Basic Knowledge
Personal Rights
Water & SanitationAccess to Information & Communication
Personal Freedom & Choice
Shelter Health & Wellness Inclusion
Personal Security Environmental Quality Access to Quality Education
15.2 65.56 39.57
85.79 0 2.38
99.73 14.99 14.7
19.35 3.57 62.17
100 58.82 70.97
37 44 30.4
38.2 30.22 68.7
34.09 35.23 67.24
76.63 5.67 57.08
93.33 59.27 41.35
95.93 100 8.12
65.85
66.49 68.38 65.41
70.94 66.92 88.21
68.73 19.17
78.87 58.36
39.31 16.93
13.84 34.41
89.01
Strength and Weakness is relative to 10 districts with similar demographic structure
How to read the scorecard: All the values are scores on a scale of 0-100. So, higher score represents better performance. For instance, a score of 91 on access to contraceptives will depict high score of the indicator.
OverperformingPerforming within expected range
Underperforming

Child Progress Index | 91
Jaunpur 4 8 . 3 7
Basic Human Needs
Foundation of Well-Being
Opportunity56.62 41.32 47.18
Antenatal Care Drop-out Rates Pendency of Cases
Access to Electric Supply Anaemic Enrollment of Disabled Students
Kidnapping Drainage Facilities Access to Technology at School
Houses with treated tap water Access to Computer Access to Contraceptives
Child Mortality Gender Parity in Students Registered Birth
Bathing Facilities Diarrhea Scholarship for Minority
Murder Improved fuel for cooking Professionally Trained Teachers
Improved Drinking Water Access to Television Sets Adolescent Mothers
Financial Assistance to Mother Girl's Enrollment Sexual Offences
Housing Congestion Stunted Scholarship for SC/ST/OBC
Rape Crimes Respiratory Disease Teachers receiving in-service trainingTraditional Fuel for Energy
Improved Sanitation Households with Mobiles Child Marriages
Immunization Primary School Enrollment Sterilization
Improved Houses Underweight
Maternal Mortality Secondary Enrollment
Latrine Facilities Wasted Children
Public Facility Births Transition Rates
Vaccination
58.45 66.47 34.74
24.0225.95 74.63
46.33 35.65 27.66
97.69 37.21 51.67
Nutrition & Basic Medical Care
Access to Basic Knowledge
Personal Rights
Water & SanitationAccess to Information & Communication
Personal Freedom & Choice
Shelter Health & Wellness Inclusion
Personal Security Environmental Quality Access to Quality Education
63.16 68.46 24.01
71.31 58.13 6.74
93.62 64.11 62.04
18.34 12.5 49.24
67.74 94.12 38.25
19.8 37.1 36.01
100 17.53 69.67
31.54 35.69 85.34
55.26 52.61 82.32
65.52 51.98 37.59
100 81.3 0.4
77.91
24.16 42.81 80.97
68.55 69.78 95.38
65.73 6.02
59.15 66.91
14.45 36.99
64.31 44.71
41.03
Strength and Weakness is relative to 10 districts with similar demographic structure
How to read the scorecard: All the values are scores on a scale of 0-100. So, higher score represents better performance. For instance, a score of 91 on access to contraceptives will depict high score of the indicator.
OverperformingPerforming within expected range
Underperforming

Child Progress Index | 92
Jhansi 5 4 . 7 0
Basic Human Needs
Foundation of Well-Being
Opportunity62.82 49.75 51.52
Antenatal Care Drop-out Rates Pendency of Cases
Access to Electric Supply Anaemic Enrollment of Disabled Students
Kidnapping Drainage Facilities Access to Technology at School
Houses with treated tap water Access to Computer Access to Contraceptives
Child Mortality Gender Parity in Students Registered Birth
Bathing Facilities Diarrhea Scholarship for Minority
Murder Improved fuel for cooking Professionally Trained Teachers
Improved Drinking Water Access to Television Sets Adolescent Mothers
Financial Assistance to Mother Girl's Enrollment Sexual Offences
Housing Congestion Stunted Scholarship for SC/ST/OBC
Rape Crimes Respiratory Disease Teachers receiving in-service trainingTraditional Fuel for Energy
Improved Sanitation Households with Mobiles Child Marriages
Immunization Primary School Enrollment Sterilization
Improved Houses Underweight
Maternal Mortality Secondary Enrollment
Latrine Facilities Wasted Children
Public Facility Births Transition Rates
Vaccination
76.34 62.5 78.92
44.4335.38 62.25
60.42 45.39 15
70.09 55.75 49.91
Nutrition & Basic Medical Care
Access to Basic Knowledge
Personal Rights
Water & SanitationAccess to Information & Communication
Personal Freedom & Choice
Shelter Health & Wellness Inclusion
Personal Security Environmental Quality Access to Quality Education
9.92 68.46 60.15
85.66 15.18 3.82
70.45 59.08 23.62
38.44 17.41 87.9
83.87 29.41 88.17
33.6 12.67 5.32
69.24 54.95 79.17
34.36 57.23 46.55
82.14 15.64 17.97
83.45 88.15 31.19
70.42 78.86 7.72
45.39
62.61 42.81 59.28
82.86 69.78 47.69
80.91 55.64
94.37 78.34
24.66 36.05
18.75 61.76
88.12
Strength and Weakness is relative to 10 districts with similar demographic structure
How to read the scorecard: All the values are scores on a scale of 0-100. So, higher score represents better performance. For instance, a score of 91 on access to contraceptives will depict high score of the indicator.
OverperformingPerforming within expected range
Underperforming

Child Progress Index | 93
Jyotiba Phule Nagar 5 3 . 3 3
Basic Human Needs
Foundation of Well-Being
Opportunity62.18 46.81 51.02
Antenatal Care Drop-out Rates Pendency of Cases
Access to Electric Supply Anaemic Enrollment of Disabled Students
Kidnapping Drainage Facilities Access to Technology at School
Houses with treated tap water Access to Computer Access to Contraceptives
Child Mortality Gender Parity in Students Registered Birth
Bathing Facilities Diarrhea Scholarship for Minority
Murder Improved fuel for cooking Professionally Trained Teachers
Improved Drinking Water Access to Television Sets Adolescent Mothers
Financial Assistance to Mother Girl's Enrollment Sexual Offences
Housing Congestion Stunted Scholarship for SC/ST/OBC
Rape Crimes Respiratory Disease Teachers receiving in-service trainingTraditional Fuel for Energy
Improved Sanitation Households with Mobiles Child Marriages
Immunization Primary School Enrollment Sterilization
Improved Houses Underweight
Maternal Mortality Secondary Enrollment
Latrine Facilities Wasted Children
Public Facility Births Transition Rates
Vaccination
63.1 65.68 56.25
61.7924.17 77.96
55.47 44.71 22.2
68.35 52.66 47.65
Nutrition & Basic Medical Care
Access to Basic Knowledge
Personal Rights
Water & SanitationAccess to Information & Communication
Personal Freedom & Choice
Shelter Health & Wellness Inclusion
Personal Security Environmental Quality Access to Quality Education
18.08 84.23 100
66.58 20.61 15.34
76.49 16.85 41.24
35.68 4.46 78.86
41.94 94.12 59.91
50.6 5.88 26.03
36.01 28.39 80.06
91.14 36.77 63.79
41.24 21.1 20.01
31.95 62.01 24.63
86.18 95.93 0.8
75.07
67.72 51.74 87.42
100 74.77 93.85
57.73 44.74
57.75 49.96
62.43 47.65
5.69 51.76
89.69
Strength and Weakness is relative to 10 districts with similar demographic structure
How to read the scorecard: All the values are scores on a scale of 0-100. So, higher score represents better performance. For instance, a score of 91 on access to contraceptives will depict high score of the indicator.
OverperformingPerforming within expected range
Underperforming
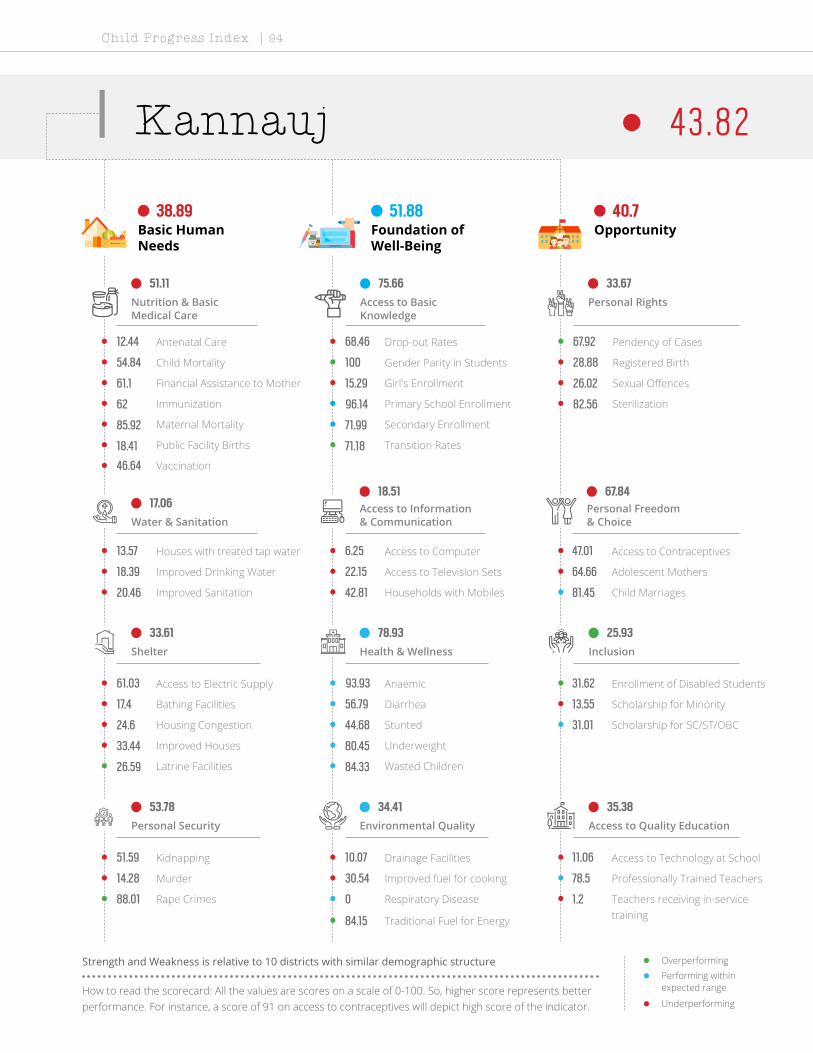
Child Progress Index | 94
Kannauj 4 3 . 8 2
Basic Human Needs
Foundation of Well-Being
Opportunity38.89 51.88 40.7
Antenatal Care Drop-out Rates Pendency of Cases
Access to Electric Supply Anaemic Enrollment of Disabled Students
Kidnapping Drainage Facilities Access to Technology at School
Houses with treated tap water Access to Computer Access to Contraceptives
Child Mortality Gender Parity in Students Registered Birth
Bathing Facilities Diarrhea Scholarship for Minority
Murder Improved fuel for cooking Professionally Trained Teachers
Improved Drinking Water Access to Television Sets Adolescent Mothers
Financial Assistance to Mother Girl's Enrollment Sexual Offences
Housing Congestion Stunted Scholarship for SC/ST/OBC
Rape Crimes Respiratory Disease Teachers receiving in-service trainingTraditional Fuel for Energy
Improved Sanitation Households with Mobiles Child Marriages
Immunization Primary School Enrollment Sterilization
Improved Houses Underweight
Maternal Mortality Secondary Enrollment
Latrine Facilities Wasted Children
Public Facility Births Transition Rates
Vaccination
51.11 75.66 33.67
17.0618.51 67.84
33.61 78.93 25.93
53.78 34.41 35.38
Nutrition & Basic Medical Care
Access to Basic Knowledge
Personal Rights
Water & SanitationAccess to Information & Communication
Personal Freedom & Choice
Shelter Health & Wellness Inclusion
Personal Security Environmental Quality Access to Quality Education
12.44 68.46 67.92
61.03 93.93 31.62
51.59 10.07 11.06
13.57 6.25 47.01
54.84 100 28.88
17.4 56.79 13.55
14.28 30.54 78.5
18.39 22.15 64.66
61.1 15.29 26.02
24.6 44.68 31.01
88.01 0 1.2
84.15
20.46 42.81 81.45
62 96.14 82.56
33.44 80.45
85.92 71.99
26.59 84.33
18.41 71.18
46.64
Strength and Weakness is relative to 10 districts with similar demographic structure
How to read the scorecard: All the values are scores on a scale of 0-100. So, higher score represents better performance. For instance, a score of 91 on access to contraceptives will depict high score of the indicator.
OverperformingPerforming within expected range
Underperforming

Child Progress Index | 95
Kanpur Dehat 4 7.1 8
Basic Human Needs
Foundation of Well-Being
Opportunity51.32 44.09 46.14
Antenatal Care Drop-out Rates Pendency of Cases
Access to Electric Supply Anaemic Enrollment of Disabled Students
Kidnapping Drainage Facilities Access to Technology at School
Houses with treated tap water Access to Computer Access to Contraceptives
Child Mortality Gender Parity in Students Registered Birth
Bathing Facilities Diarrhea Scholarship for Minority
Murder Improved fuel for cooking Professionally Trained Teachers
Improved Drinking Water Access to Television Sets Adolescent Mothers
Financial Assistance to Mother Girl's Enrollment Sexual Offences
Housing Congestion Stunted Scholarship for SC/ST/OBC
Rape Crimes Respiratory Disease Teachers receiving in-service trainingTraditional Fuel for Energy
Improved Sanitation Households with Mobiles Child Marriages
Immunization Primary School Enrollment Sterilization
Improved Houses Underweight
Maternal Mortality Secondary Enrollment
Latrine Facilities Wasted Children
Public Facility Births Transition Rates
Vaccination
67.55 64.48 59.87
20.0216.71 70.59
24.15 64.07 28.22
93.57 31.08 25.89
Nutrition & Basic Medical Care
Access to Basic Knowledge
Personal Rights
Water & SanitationAccess to Information & Communication
Personal Freedom & Choice
Shelter Health & Wellness Inclusion
Personal Security Environmental Quality Access to Quality Education
26.88 88.38 67.28
26.93 41.21 26.06
89.65 70.02 6.12
12.06 5.36 62.59
61.29 88.24 89.25
26 14.93 34.17
100 25.38 46.99
18.52 17.38 63.79
55.09 4.98 100
37.7 58.36 25.34
92.4 60.98 4.21
94.44
32.28 43.87 79.72
81.97 46.82 100
4.6 68.42
97.18 52.4
29.09 74.61
10.04 77.06
100
Strength and Weakness is relative to 10 districts with similar demographic structure
How to read the scorecard: All the values are scores on a scale of 0-100. So, higher score represents better performance. For instance, a score of 91 on access to contraceptives will depict high score of the indicator.
OverperformingPerforming within expected range
Underperforming

Child Progress Index | 96
Kanpur Nagar 5 7. 9 6
Basic Human Needs
Foundation of Well-Being
Opportunity68.95 57.97 46.97
Antenatal Care Drop-out Rates Pendency of Cases
Access to Electric Supply Anaemic Enrollment of Disabled Students
Kidnapping Drainage Facilities Access to Technology at School
Houses with treated tap water Access to Computer Access to Contraceptives
Child Mortality Gender Parity in Students Registered Birth
Bathing Facilities Diarrhea Scholarship for Minority
Murder Improved fuel for cooking Professionally Trained Teachers
Improved Drinking Water Access to Television Sets Adolescent Mothers
Financial Assistance to Mother Girl's Enrollment Sexual Offences
Housing Congestion Stunted Scholarship for SC/ST/OBC
Rape Crimes Respiratory Disease Teachers receiving in-service trainingTraditional Fuel for Energy
Improved Sanitation Households with Mobiles Child Marriages
Immunization Primary School Enrollment Sterilization
Improved Houses Underweight
Maternal Mortality Secondary Enrollment
Latrine Facilities Wasted Children
Public Facility Births Transition Rates
Vaccination
81.11 66.65 45.27
65.9949.68 85.93
52.33 41.41 12.95
76.37 74.13 43.74
Nutrition & Basic Medical Care
Access to Basic Knowledge
Personal Rights
Water & SanitationAccess to Information & Communication
Personal Freedom & Choice
Shelter Health & Wellness Inclusion
Personal Security Environmental Quality Access to Quality Education
67.29 58.09 42.65
81.6 24.3 11.4
72.14 13.13 35.03
54.02 23.21 79.42
80.65 52.94 62.37
33.6 50.9 7.96
83.14 70.54 75.19
51.54 74.77 87.07
66.28 41.21 82.43
51.72 65.35 18.01
75.25 87.8 1.1
29.13
96.65 72.77 88.68
65.28 69.78 33.33
61.57 46.99
100 96.74
30.25 39.18
36.68 45.59
89.01
Strength and Weakness is relative to 10 districts with similar demographic structure
How to read the scorecard: All the values are scores on a scale of 0-100. So, higher score represents better performance. For instance, a score of 91 on access to contraceptives will depict high score of the indicator.
OverperformingPerforming within expected range
Underperforming

Child Progress Index | 97
Kanshiram Nagar 4 3 . 9 3
Basic Human Needs
Foundation of Well-Being
Opportunity42.43 48.95 40.41
Antenatal Care Drop-out Rates Pendency of Cases
Access to Electric Supply Anaemic Enrollment of Disabled Students
Kidnapping Drainage Facilities Access to Technology at School
Houses with treated tap water Access to Computer Access to Contraceptives
Child Mortality Gender Parity in Students Registered Birth
Bathing Facilities Diarrhea Scholarship for Minority
Murder Improved fuel for cooking Professionally Trained Teachers
Improved Drinking Water Access to Television Sets Adolescent Mothers
Financial Assistance to Mother Girl's Enrollment Sexual Offences
Housing Congestion Stunted Scholarship for SC/ST/OBC
Rape Crimes Respiratory Disease Teachers receiving in-service trainingTraditional Fuel for Energy
Improved Sanitation Households with Mobiles Child Marriages
Immunization Primary School Enrollment Sterilization
Improved Houses Underweight
Maternal Mortality Secondary Enrollment
Latrine Facilities Wasted Children
Public Facility Births Transition Rates
Vaccination
36.69 61.56 45.62
38.9618.78 60.57
27.56 79.81 13.78
66.51 35.66 41.65
Nutrition & Basic Medical Care
Access to Basic Knowledge
Personal Rights
Water & SanitationAccess to Information & Communication
Personal Freedom & Choice
Shelter Health & Wellness Inclusion
Personal Security Environmental Quality Access to Quality Education
18.45 75.1 78.81
38.84 95.23 14.11
52.45 8.21 14.72
28.39 3.57 79.69
16.13 52.94 53
7.8 52.71 17.49
86.49 14.52 85.68
73.83 21.85 32.76
46.74 12.26 62.02
14.94 41.34 10.68
64.81 31.71 2.71
85.77
18.34 51.44 69.65
59.76 92.08 100
66.85 80.83
87.32 51.07
6.36 86.21
14.28 49.41
0
Strength and Weakness is relative to 10 districts with similar demographic structure
How to read the scorecard: All the values are scores on a scale of 0-100. So, higher score represents better performance. For instance, a score of 91 on access to contraceptives will depict high score of the indicator.
OverperformingPerforming within expected range
Underperforming

Child Progress Index | 98
Kaushambi 4 0 . 0 3
Basic Human Needs
Foundation of Well-Being
Opportunity38.67 33.87 47.55
Antenatal Care Drop-out Rates Pendency of Cases
Access to Electric Supply Anaemic Enrollment of Disabled Students
Kidnapping Drainage Facilities Access to Technology at School
Houses with treated tap water Access to Computer Access to Contraceptives
Child Mortality Gender Parity in Students Registered Birth
Bathing Facilities Diarrhea Scholarship for Minority
Murder Improved fuel for cooking Professionally Trained Teachers
Improved Drinking Water Access to Television Sets Adolescent Mothers
Financial Assistance to Mother Girl's Enrollment Sexual Offences
Housing Congestion Stunted Scholarship for SC/ST/OBC
Rape Crimes Respiratory Disease Teachers receiving in-service trainingTraditional Fuel for Energy
Improved Sanitation Households with Mobiles Child Marriages
Immunization Primary School Enrollment Sterilization
Improved Houses Underweight
Maternal Mortality Secondary Enrollment
Latrine Facilities Wasted Children
Public Facility Births Transition Rates
Vaccination
45.61 49.33 38.32
4.3617.43 72.38
26.26 28.37 35.43
78.45 40.36 44.07
Nutrition & Basic Medical Care
Access to Basic Knowledge
Personal Rights
Water & SanitationAccess to Information & Communication
Personal Freedom & Choice
Shelter Health & Wellness Inclusion
Personal Security Environmental Quality Access to Quality Education
20.11 48.55 29.25
31.66 37.74 69.89
70.18 56.56 19.71
0 1.34 45.34
6.45 70.59 51.77
11.4 44 19.72
87.8 26.34 81.03
0 16.31 77.59
82.64 12.93 100
78.39 45.59 20.56
79.38 94.31 4.21
93.77
14.64 59.46 83.49
44.71 59.53 63.59
16.03 5.64
85.92 24.08
11.37 32.29
34.72 75.88
68.39
Strength and Weakness is relative to 10 districts with similar demographic structure
How to read the scorecard: All the values are scores on a scale of 0-100. So, higher score represents better performance. For instance, a score of 91 on access to contraceptives will depict high score of the indicator.
OverperformingPerforming within expected range
Underperforming
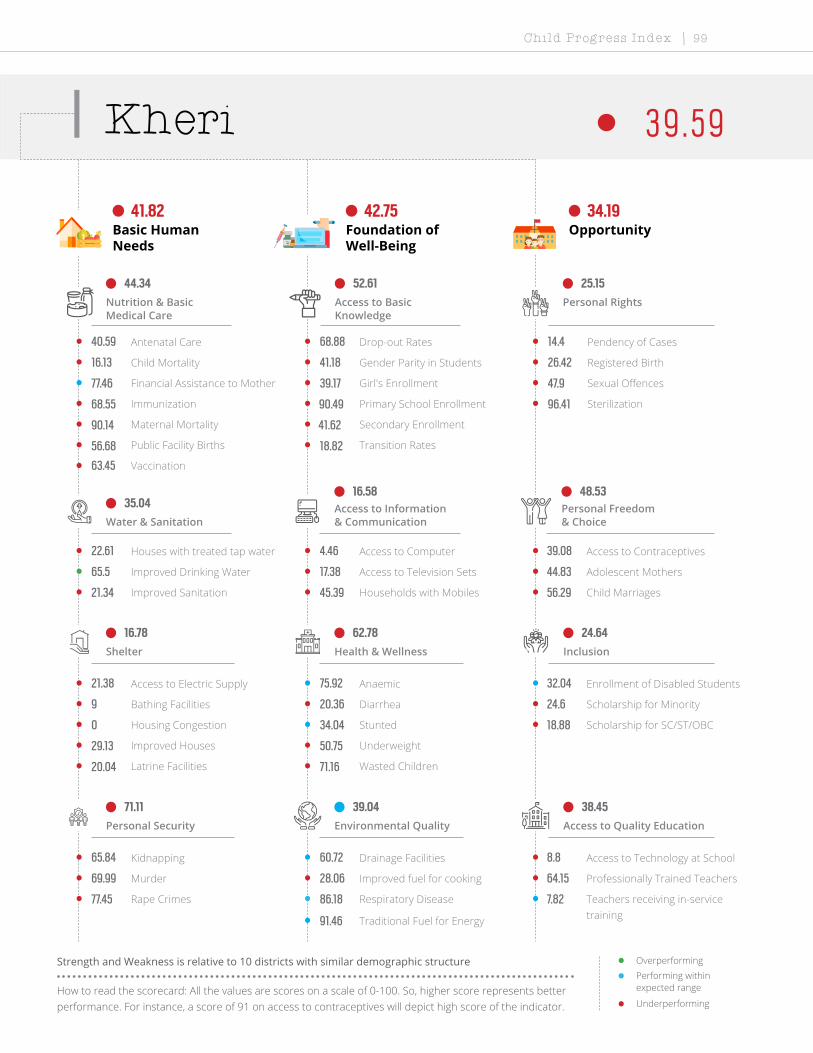
Child Progress Index | 99
Kheri 3 9 . 5 9
Basic Human Needs
Foundation of Well-Being
Opportunity41.82 42.75 34.19
Antenatal Care Drop-out Rates Pendency of Cases
Access to Electric Supply Anaemic Enrollment of Disabled Students
Kidnapping Drainage Facilities Access to Technology at School
Houses with treated tap water Access to Computer Access to Contraceptives
Child Mortality Gender Parity in Students Registered Birth
Bathing Facilities Diarrhea Scholarship for Minority
Murder Improved fuel for cooking Professionally Trained Teachers
Improved Drinking Water Access to Television Sets Adolescent Mothers
Financial Assistance to Mother Girl's Enrollment Sexual Offences
Housing Congestion Stunted Scholarship for SC/ST/OBC
Rape Crimes Respiratory Disease Teachers receiving in-service trainingTraditional Fuel for Energy
Improved Sanitation Households with Mobiles Child Marriages
Immunization Primary School Enrollment Sterilization
Improved Houses Underweight
Maternal Mortality Secondary Enrollment
Latrine Facilities Wasted Children
Public Facility Births Transition Rates
Vaccination
44.34 52.61 25.15
35.0416.58 48.53
16.78 62.78 24.64
71.11 39.04 38.45
Nutrition & Basic Medical Care
Access to Basic Knowledge
Personal Rights
Water & SanitationAccess to Information & Communication
Personal Freedom & Choice
Shelter Health & Wellness Inclusion
Personal Security Environmental Quality Access to Quality Education
40.59 68.88 14.4
21.38 75.92 32.04
65.84 60.72 8.8
22.61 4.46 39.08
16.13 41.18 26.42
9 20.36 24.6
69.99 28.06 64.15
65.5 17.38 44.83
77.46 39.17 47.9
0 34.04 18.88
77.45 86.18 7.82
91.46
21.34 45.39 56.29
68.55 90.49 96.41
29.13 50.75
90.14 41.62
20.04 71.16
56.68 18.82
63.45
Strength and Weakness is relative to 10 districts with similar demographic structure
How to read the scorecard: All the values are scores on a scale of 0-100. So, higher score represents better performance. For instance, a score of 91 on access to contraceptives will depict high score of the indicator.
OverperformingPerforming within expected range
Underperforming

Child Progress Index | 100
Kushinagar 4 5 . 0 9
Basic Human Needs
Foundation of Well-Being
Opportunity50.07 40.51 44.07
Antenatal Care Drop-out Rates Pendency of Cases
Access to Electric Supply Anaemic Enrollment of Disabled Students
Kidnapping Drainage Facilities Access to Technology at School
Houses with treated tap water Access to Computer Access to Contraceptives
Child Mortality Gender Parity in Students Registered Birth
Bathing Facilities Diarrhea Scholarship for Minority
Murder Improved fuel for cooking Professionally Trained Teachers
Improved Drinking Water Access to Television Sets Adolescent Mothers
Financial Assistance to Mother Girl's Enrollment Sexual Offences
Housing Congestion Stunted Scholarship for SC/ST/OBC
Rape Crimes Respiratory Disease Teachers receiving in-service trainingTraditional Fuel for Energy
Improved Sanitation Households with Mobiles Child Marriages
Immunization Primary School Enrollment Sterilization
Improved Houses Underweight
Maternal Mortality Secondary Enrollment
Latrine Facilities Wasted Children
Public Facility Births Transition Rates
Vaccination
59.76 59.55 57.87
33.7712.84 59.15
28.93 68.28 18.31
80.33 21.39 40.95
Nutrition & Basic Medical Care
Access to Basic Knowledge
Personal Rights
Water & SanitationAccess to Information & Communication
Personal Freedom & Choice
Shelter Health & Wellness Inclusion
Personal Security Environmental Quality Access to Quality Education
78.22 89.21 69.93
30.72 56.4 19.43
75.3 66.3 7.79
26.63 6.25 37
38.71 100 66.67
19 31.9 18.88
79.88 20.11 78.81
56.51 15.08 73.28
68.95 67.49 74.25
62.53 61.09 17
85.87 3.25 6.01
84.28
20.63 25.42 61.32
54.55 69.78 93.85
30.53 72.18
83.1 30.3
13.29 75.55
82.03 24.41
87.67
Strength and Weakness is relative to 10 districts with similar demographic structure
How to read the scorecard: All the values are scores on a scale of 0-100. So, higher score represents better performance. For instance, a score of 91 on access to contraceptives will depict high score of the indicator.
OverperformingPerforming within expected range
Underperforming
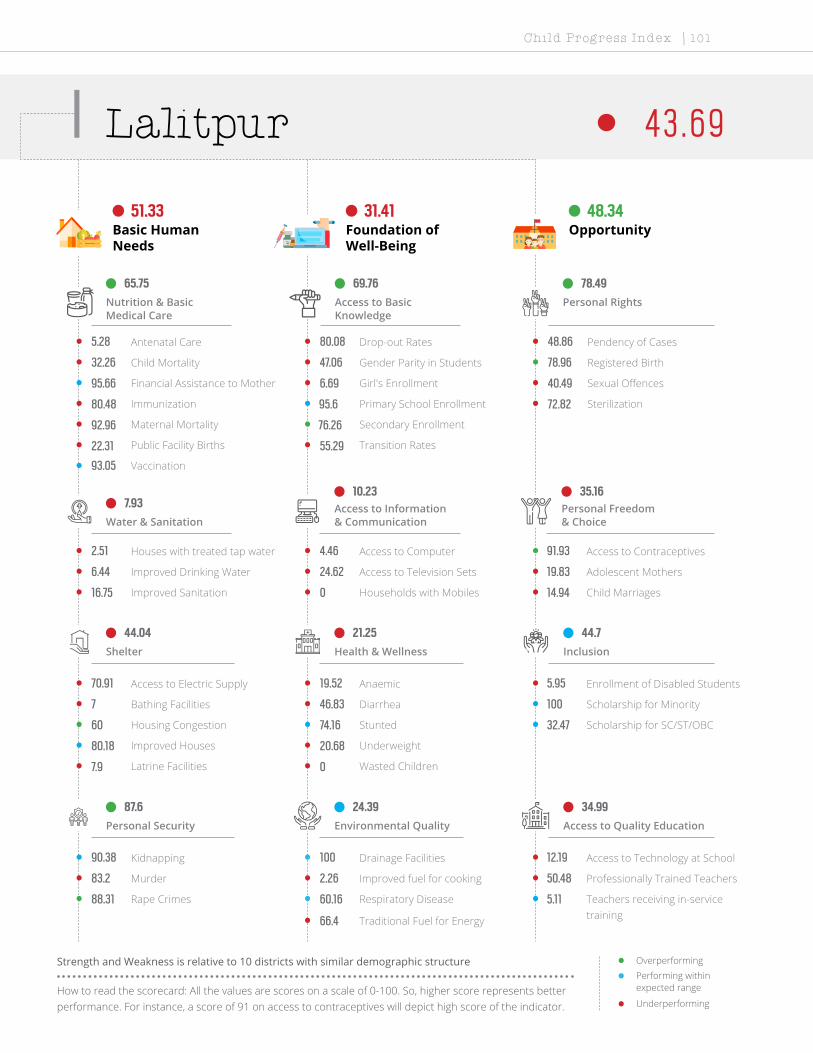
Child Progress Index | 101
Lalitpur 4 3 . 6 9
Basic Human Needs
Foundation of Well-Being
Opportunity51.33 31.41 48.34
Antenatal Care Drop-out Rates Pendency of Cases
Access to Electric Supply Anaemic Enrollment of Disabled Students
Kidnapping Drainage Facilities Access to Technology at School
Houses with treated tap water Access to Computer Access to Contraceptives
Child Mortality Gender Parity in Students Registered Birth
Bathing Facilities Diarrhea Scholarship for Minority
Murder Improved fuel for cooking Professionally Trained Teachers
Improved Drinking Water Access to Television Sets Adolescent Mothers
Financial Assistance to Mother Girl's Enrollment Sexual Offences
Housing Congestion Stunted Scholarship for SC/ST/OBC
Rape Crimes Respiratory Disease Teachers receiving in-service trainingTraditional Fuel for Energy
Improved Sanitation Households with Mobiles Child Marriages
Immunization Primary School Enrollment Sterilization
Improved Houses Underweight
Maternal Mortality Secondary Enrollment
Latrine Facilities Wasted Children
Public Facility Births Transition Rates
Vaccination
65.75 69.76 78.49
7.9310.23 35.16
44.04 21.25 44.7
87.6 24.39 34.99
Nutrition & Basic Medical Care
Access to Basic Knowledge
Personal Rights
Water & SanitationAccess to Information & Communication
Personal Freedom & Choice
Shelter Health & Wellness Inclusion
Personal Security Environmental Quality Access to Quality Education
5.28 80.08 48.86
70.91 19.52 5.95
90.38 100 12.19
2.51 4.46 91.93
32.26 47.06 78.96
7 46.83 100
83.2 2.26 50.48
6.44 24.62 19.83
95.66 6.69 40.49
60 74.16 32.47
88.31 60.16 5.11
66.4
16.75 0 14.94
80.48 95.6 72.82
80.18 20.68
92.96 76.26
7.9 0
22.31 55.29
93.05
Strength and Weakness is relative to 10 districts with similar demographic structure
How to read the scorecard: All the values are scores on a scale of 0-100. So, higher score represents better performance. For instance, a score of 91 on access to contraceptives will depict high score of the indicator.
OverperformingPerforming within expected range
Underperforming
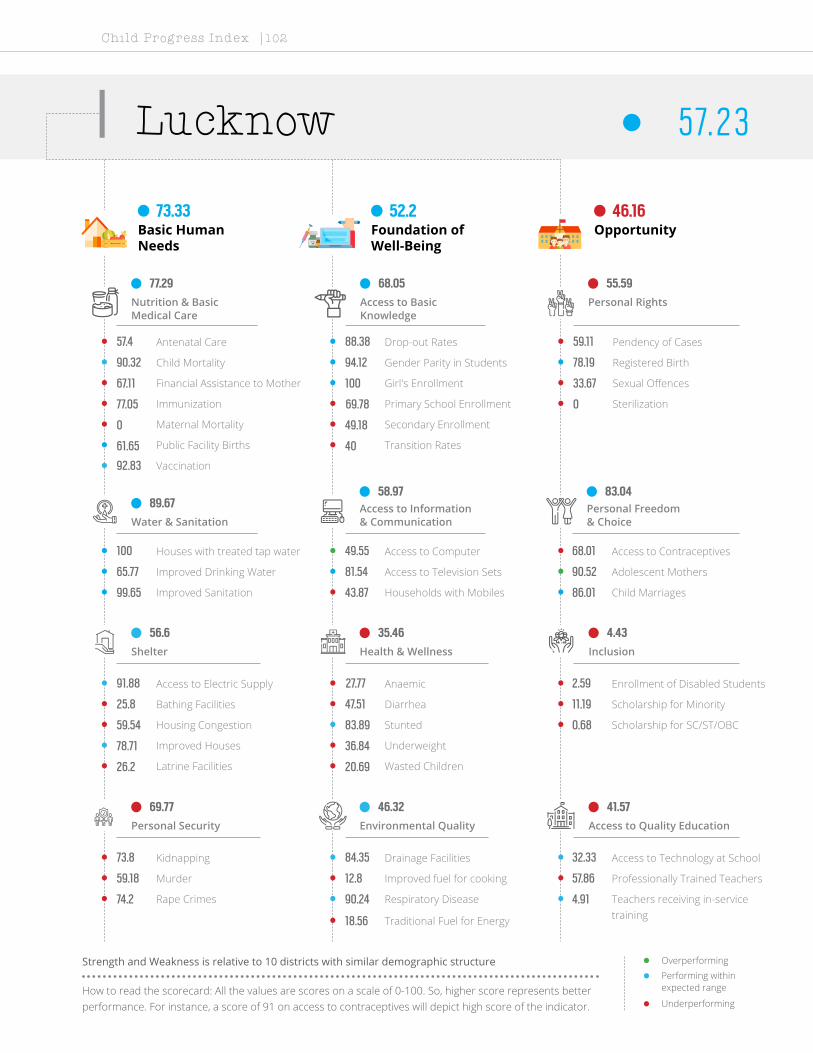
Child Progress Index | 102
Lucknow 5 7. 2 3
Basic Human Needs
Foundation of Well-Being
Opportunity73.33 52.2 46.16
Antenatal Care Drop-out Rates Pendency of Cases
Access to Electric Supply Anaemic Enrollment of Disabled Students
Kidnapping Drainage Facilities Access to Technology at School
Houses with treated tap water Access to Computer Access to Contraceptives
Child Mortality Gender Parity in Students Registered Birth
Bathing Facilities Diarrhea Scholarship for Minority
Murder Improved fuel for cooking Professionally Trained Teachers
Improved Drinking Water Access to Television Sets Adolescent Mothers
Financial Assistance to Mother Girl's Enrollment Sexual Offences
Housing Congestion Stunted Scholarship for SC/ST/OBC
Rape Crimes Respiratory Disease Teachers receiving in-service trainingTraditional Fuel for Energy
Improved Sanitation Households with Mobiles Child Marriages
Immunization Primary School Enrollment Sterilization
Improved Houses Underweight
Maternal Mortality Secondary Enrollment
Latrine Facilities Wasted Children
Public Facility Births Transition Rates
Vaccination
77.29 68.05 55.59
89.6758.97 83.04
56.6 35.46 4.43
69.77 46.32 41.57
Nutrition & Basic Medical Care
Access to Basic Knowledge
Personal Rights
Water & SanitationAccess to Information & Communication
Personal Freedom & Choice
Shelter Health & Wellness Inclusion
Personal Security Environmental Quality Access to Quality Education
57.4 88.38 59.11
91.88 27.77 2.59
73.8 84.35 32.33
100 49.55 68.01
90.32 94.12 78.19
25.8 47.51 11.19
59.18 12.8 57.86
65.77 81.54 90.52
67.11 100 33.67
59.54 83.89 0.68
74.2 90.24 4.91
18.56
99.65 43.87 86.01
77.05 69.78 0
78.71 36.84
0 49.18
26.2 20.69
61.65 40
92.83
Strength and Weakness is relative to 10 districts with similar demographic structure
How to read the scorecard: All the values are scores on a scale of 0-100. So, higher score represents better performance. For instance, a score of 91 on access to contraceptives will depict high score of the indicator.
OverperformingPerforming within expected range
Underperforming

Child Progress Index | 103
Mahamaya Nagar 4 5 . 8 2
Basic Human Needs
Foundation of Well-Being
Opportunity47.73 52.85 36.88
Antenatal Care Drop-out Rates Pendency of Cases
Access to Electric Supply Anaemic Enrollment of Disabled Students
Kidnapping Drainage Facilities Access to Technology at School
Houses with treated tap water Access to Computer Access to Contraceptives
Child Mortality Gender Parity in Students Registered Birth
Bathing Facilities Diarrhea Scholarship for Minority
Murder Improved fuel for cooking Professionally Trained Teachers
Improved Drinking Water Access to Television Sets Adolescent Mothers
Financial Assistance to Mother Girl's Enrollment Sexual Offences
Housing Congestion Stunted Scholarship for SC/ST/OBC
Rape Crimes Respiratory Disease Teachers receiving in-service trainingTraditional Fuel for Energy
Improved Sanitation Households with Mobiles Child Marriages
Immunization Primary School Enrollment Sterilization
Improved Houses Underweight
Maternal Mortality Secondary Enrollment
Latrine Facilities Wasted Children
Public Facility Births Transition Rates
Vaccination
69.34 59.33 46.45
32.4730.18 53.78
54.8 79.95 15.67
34.3 41.96 31.6
Nutrition & Basic Medical Care
Access to Basic Knowledge
Personal Rights
Water & SanitationAccess to Information & Communication
Personal Freedom & Choice
Shelter Health & Wellness Inclusion
Personal Security Environmental Quality Access to Quality Education
12.73 67.63 60.88
82.14 77.87 8.53
73.11 61.05 11.39
20.6 7.14 79.83
77.42 94.12 46.24
31.4 61.31 18.56
14.91 15.48 48.97
45.5 58.77 25
55.09 10.75 35.23
48.51 63.53 19.04
10.07 69.11 0
44.44
35.45 38.73 59.75
80.63 66.99 80
91.2 84.96
100 53.9
16.57 89.34
18.31 40.88
41.7
Strength and Weakness is relative to 10 districts with similar demographic structure
How to read the scorecard: All the values are scores on a scale of 0-100. So, higher score represents better performance. For instance, a score of 91 on access to contraceptives will depict high score of the indicator.
OverperformingPerforming within expected range
Underperforming

Child Progress Index | 104
Mahoba 4 8 . 2 4
Basic Human Needs
Foundation of Well-Being
Opportunity46.14 39.7 58.87
Antenatal Care Drop-out Rates Pendency of Cases
Access to Electric Supply Anaemic Enrollment of Disabled Students
Kidnapping Drainage Facilities Access to Technology at School
Houses with treated tap water Access to Computer Access to Contraceptives
Child Mortality Gender Parity in Students Registered Birth
Bathing Facilities Diarrhea Scholarship for Minority
Murder Improved fuel for cooking Professionally Trained Teachers
Improved Drinking Water Access to Television Sets Adolescent Mothers
Financial Assistance to Mother Girl's Enrollment Sexual Offences
Housing Congestion Stunted Scholarship for SC/ST/OBC
Rape Crimes Respiratory Disease Teachers receiving in-service trainingTraditional Fuel for Energy
Improved Sanitation Households with Mobiles Child Marriages
Immunization Primary School Enrollment Sterilization
Improved Houses Underweight
Maternal Mortality Secondary Enrollment
Latrine Facilities Wasted Children
Public Facility Births Transition Rates
Vaccination
65.77 68.48 67.15
14.0116.98 57.71
51.93 48.08 81.09
52.86 25.24 29.54
Nutrition & Basic Medical Care
Access to Basic Knowledge
Personal Rights
Water & SanitationAccess to Information & Communication
Personal Freedom & Choice
Shelter Health & Wellness Inclusion
Personal Security Environmental Quality Access to Quality Education
13.42 88.38 77.38
72.53 15.62 100
37.21 100 19.15
2.01 4.02 85.26
61.29 58.82 54.38
16.6 19 37.28
87.49 2.26 46.36
0 20.15 73.28
80.8 35.5 100
89.2 62.31 100
40.93 78.86 3.21
79.13
44.27 43.87 31.76
85.54 69.78 87.18
75.65 24.81
100 71.57
19.08 82.45
3.57 55.29
91.93
Strength and Weakness is relative to 10 districts with similar demographic structure
How to read the scorecard: All the values are scores on a scale of 0-100. So, higher score represents better performance. For instance, a score of 91 on access to contraceptives will depict high score of the indicator.
OverperformingPerforming within expected range
Underperforming

Child Progress Index | 105
Mahrajganj 4 7. 3 5
Basic Human Needs
Foundation of Well-Being
Opportunity54.15 43.46 44.44
Antenatal Care Drop-out Rates Pendency of Cases
Access to Electric Supply Anaemic Enrollment of Disabled Students
Kidnapping Drainage Facilities Access to Technology at School
Houses with treated tap water Access to Computer Access to Contraceptives
Child Mortality Gender Parity in Students Registered Birth
Bathing Facilities Diarrhea Scholarship for Minority
Murder Improved fuel for cooking Professionally Trained Teachers
Improved Drinking Water Access to Television Sets Adolescent Mothers
Financial Assistance to Mother Girl's Enrollment Sexual Offences
Housing Congestion Stunted Scholarship for SC/ST/OBC
Rape Crimes Respiratory Disease Teachers receiving in-service trainingTraditional Fuel for Energy
Improved Sanitation Households with Mobiles Child Marriages
Immunization Primary School Enrollment Sterilization
Improved Houses Underweight
Maternal Mortality Secondary Enrollment
Latrine Facilities Wasted Children
Public Facility Births Transition Rates
Vaccination
67.59 67.95 61.88
34.3616.39 58.67
33.81 56.87 13.56
80.82 32.62 43.66
Nutrition & Basic Medical Care
Access to Basic Knowledge
Personal Rights
Water & SanitationAccess to Information & Communication
Personal Freedom & Choice
Shelter Health & Wellness Inclusion
Personal Security Environmental Quality Access to Quality Education
34.57 88.38 53.01
35.32 56.4 13.04
68.12 64.44 16.74
38.69 4.46 34.63
32.26 100 92.01
13.8 12.9 24.61
80.96 33.55 75.94
46.98 17.69 65.52
80.13 0 69.85
51.26 35.87 5.48
93.78 40.65 6.11
85.37
15.87 43.87 66.98
51.56 69.78 95.9
60.18 64.66
77.46 39.05
16.96 51.72
31.54 86.18
95.74
Strength and Weakness is relative to 10 districts with similar demographic structure
How to read the scorecard: All the values are scores on a scale of 0-100. So, higher score represents better performance. For instance, a score of 91 on access to contraceptives will depict high score of the indicator.
OverperformingPerforming within expected range
Underperforming
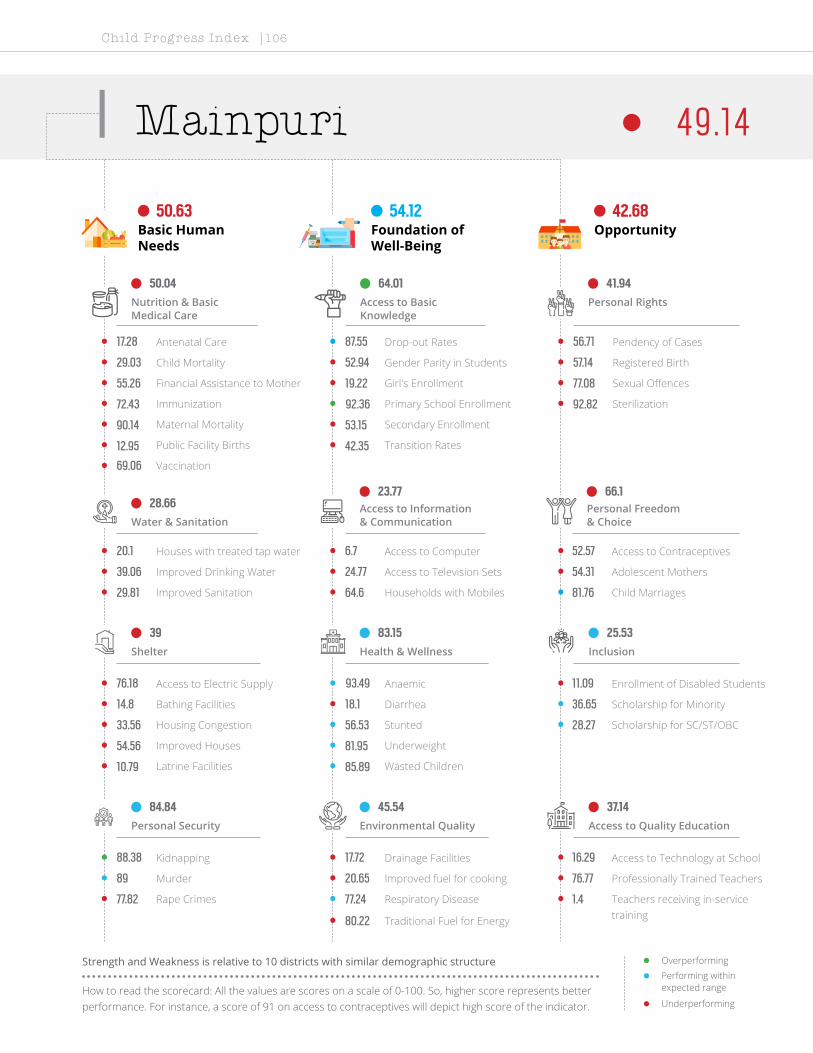
Child Progress Index | 106
Mainpuri 4 9 .1 4
Basic Human Needs
Foundation of Well-Being
Opportunity50.63 54.12 42.68
Antenatal Care Drop-out Rates Pendency of Cases
Access to Electric Supply Anaemic Enrollment of Disabled Students
Kidnapping Drainage Facilities Access to Technology at School
Houses with treated tap water Access to Computer Access to Contraceptives
Child Mortality Gender Parity in Students Registered Birth
Bathing Facilities Diarrhea Scholarship for Minority
Murder Improved fuel for cooking Professionally Trained Teachers
Improved Drinking Water Access to Television Sets Adolescent Mothers
Financial Assistance to Mother Girl's Enrollment Sexual Offences
Housing Congestion Stunted Scholarship for SC/ST/OBC
Rape Crimes Respiratory Disease Teachers receiving in-service trainingTraditional Fuel for Energy
Improved Sanitation Households with Mobiles Child Marriages
Immunization Primary School Enrollment Sterilization
Improved Houses Underweight
Maternal Mortality Secondary Enrollment
Latrine Facilities Wasted Children
Public Facility Births Transition Rates
Vaccination
50.04 64.01 41.94
28.6623.77 66.1
39 83.15 25.53
84.84 45.54 37.14
Nutrition & Basic Medical Care
Access to Basic Knowledge
Personal Rights
Water & SanitationAccess to Information & Communication
Personal Freedom & Choice
Shelter Health & Wellness Inclusion
Personal Security Environmental Quality Access to Quality Education
17.28 87.55 56.71
76.18 93.49 11.09
88.38 17.72 16.29
20.1 6.7 52.57
29.03 52.94 57.14
14.8 18.1 36.65
89 20.65 76.77
39.06 24.77 54.31
55.26 19.22 77.08
33.56 56.53 28.27
77.82 77.24 1.4
80.22
29.81 64.6 81.76
72.43 92.36 92.82
54.56 81.95
90.14 53.15
10.79 85.89
12.95 42.35
69.06
Strength and Weakness is relative to 10 districts with similar demographic structure
How to read the scorecard: All the values are scores on a scale of 0-100. So, higher score represents better performance. For instance, a score of 91 on access to contraceptives will depict high score of the indicator.
OverperformingPerforming within expected range
Underperforming

Child Progress Index | 107
Mathura 5 1 . 9 7
Basic Human Needs
Foundation of Well-Being
Opportunity59.48 59.03 37.4
Antenatal Care Drop-out Rates Pendency of Cases
Access to Electric Supply Anaemic Enrollment of Disabled Students
Kidnapping Drainage Facilities Access to Technology at School
Houses with treated tap water Access to Computer Access to Contraceptives
Child Mortality Gender Parity in Students Registered Birth
Bathing Facilities Diarrhea Scholarship for Minority
Murder Improved fuel for cooking Professionally Trained Teachers
Improved Drinking Water Access to Television Sets Adolescent Mothers
Financial Assistance to Mother Girl's Enrollment Sexual Offences
Housing Congestion Stunted Scholarship for SC/ST/OBC
Rape Crimes Respiratory Disease Teachers receiving in-service trainingTraditional Fuel for Energy
Improved Sanitation Households with Mobiles Child Marriages
Immunization Primary School Enrollment Sterilization
Improved Houses Underweight
Maternal Mortality Secondary Enrollment
Latrine Facilities Wasted Children
Public Facility Births Transition Rates
Vaccination
54.79 58.2 59.51
45.0539.46 44.12
61.45 83.15 11.93
76.63 55.33 34.04
Nutrition & Basic Medical Care
Access to Basic Knowledge
Personal Rights
Water & SanitationAccess to Information & Communication
Personal Freedom & Choice
Shelter Health & Wellness Inclusion
Personal Security Environmental Quality Access to Quality Education
29.3 88.38 78.54
94.72 61.39 10.8
85.04 78.01 23.91
34.42 16.96 75.66
45.16 94.12 51.61
32.8 26.47 14.45
87.59 42.69 63.91
46.98 69.69 0
9.85 38.48 80.18
51.95 73.86 10.87
59.09 88.62 0.4
22.22
57.5 43.87 57.86
66.17 69.78 30.77
100 100
80.28 50.55
22.54 87.77
17.12 0
64.8
Strength and Weakness is relative to 10 districts with similar demographic structure
How to read the scorecard: All the values are scores on a scale of 0-100. So, higher score represents better performance. For instance, a score of 91 on access to contraceptives will depict high score of the indicator.
OverperformingPerforming within expected range
Underperforming

Child Progress Index | 108
Mau 5 0 . 6 5
Basic Human Needs
Foundation of Well-Being
Opportunity55.17 44.56 52.23
Antenatal Care Drop-out Rates Pendency of Cases
Access to Electric Supply Anaemic Enrollment of Disabled Students
Kidnapping Drainage Facilities Access to Technology at School
Houses with treated tap water Access to Computer Access to Contraceptives
Child Mortality Gender Parity in Students Registered Birth
Bathing Facilities Diarrhea Scholarship for Minority
Murder Improved fuel for cooking Professionally Trained Teachers
Improved Drinking Water Access to Television Sets Adolescent Mothers
Financial Assistance to Mother Girl's Enrollment Sexual Offences
Housing Congestion Stunted Scholarship for SC/ST/OBC
Rape Crimes Respiratory Disease Teachers receiving in-service trainingTraditional Fuel for Energy
Improved Sanitation Households with Mobiles Child Marriages
Immunization Primary School Enrollment Sterilization
Improved Houses Underweight
Maternal Mortality Secondary Enrollment
Latrine Facilities Wasted Children
Public Facility Births Transition Rates
Vaccination
61.19 47.27 52.72
29.6325.4 77.68
51.88 61.99 41.63
77.98 43.57 36.91
Nutrition & Basic Medical Care
Access to Basic Knowledge
Personal Rights
Water & SanitationAccess to Information & Communication
Personal Freedom & Choice
Shelter Health & Wellness Inclusion
Personal Security Environmental Quality Access to Quality Education
16.56 29.46 30.02
77.54 50.98 10.95
76.34 37.2 27.41
6.53 2.23 44.65
64.52 100 95.08
19.6 57.24 67.1
77.04 16.67 68.56
61.88 26.15 82.76
45.91 22.87 93.31
79.54 73.56 46.04
80.41 60.16 0.2
51.49
28.57 81.85 92.14
58.57 15.1 100
72.82 72.18
76.06 49.18
18.69 59.87
11.71 74.71
34.98
Strength and Weakness is relative to 10 districts with similar demographic structure
How to read the scorecard: All the values are scores on a scale of 0-100. So, higher score represents better performance. For instance, a score of 91 on access to contraceptives will depict high score of the indicator.
OverperformingPerforming within expected range
Underperforming
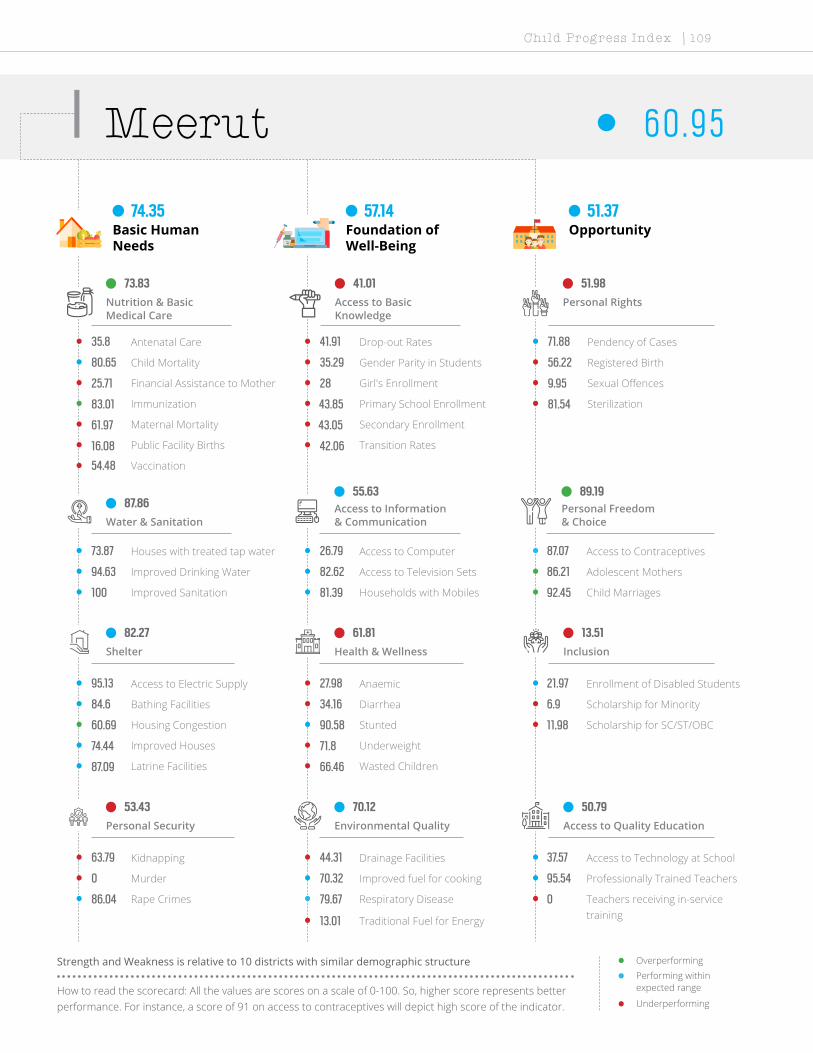
Child Progress Index | 109
Meerut 6 0 . 9 5
Basic Human Needs
Foundation of Well-Being
Opportunity74.35 57.14 51.37
Antenatal Care Drop-out Rates Pendency of Cases
Access to Electric Supply Anaemic Enrollment of Disabled Students
Kidnapping Drainage Facilities Access to Technology at School
Houses with treated tap water Access to Computer Access to Contraceptives
Child Mortality Gender Parity in Students Registered Birth
Bathing Facilities Diarrhea Scholarship for Minority
Murder Improved fuel for cooking Professionally Trained Teachers
Improved Drinking Water Access to Television Sets Adolescent Mothers
Financial Assistance to Mother Girl's Enrollment Sexual Offences
Housing Congestion Stunted Scholarship for SC/ST/OBC
Rape Crimes Respiratory Disease Teachers receiving in-service trainingTraditional Fuel for Energy
Improved Sanitation Households with Mobiles Child Marriages
Immunization Primary School Enrollment Sterilization
Improved Houses Underweight
Maternal Mortality Secondary Enrollment
Latrine Facilities Wasted Children
Public Facility Births Transition Rates
Vaccination
73.83 41.01 51.98
87.8655.63 89.19
82.27 61.81 13.51
53.43 70.12 50.79
Nutrition & Basic Medical Care
Access to Basic Knowledge
Personal Rights
Water & SanitationAccess to Information & Communication
Personal Freedom & Choice
Shelter Health & Wellness Inclusion
Personal Security Environmental Quality Access to Quality Education
35.8 41.91 71.88
95.13 27.98 21.97
63.79 44.31 37.57
73.87 26.79 87.07
80.65 35.29 56.22
84.6 34.16 6.9
0 70.32 95.54
94.63 82.62 86.21
25.71 28 9.95
60.69 90.58 11.98
86.04 79.67 0
13.01
100 81.39 92.45
83.01 43.85 81.54
74.44 71.8
61.97 43.05
87.09 66.46
16.08 42.06
54.48
Strength and Weakness is relative to 10 districts with similar demographic structure
How to read the scorecard: All the values are scores on a scale of 0-100. So, higher score represents better performance. For instance, a score of 91 on access to contraceptives will depict high score of the indicator.
OverperformingPerforming within expected range
Underperforming

Child Progress Index | 110
Mirzapur 4 5 . 5 4
Basic Human Needs
Foundation of Well-Being
Opportunity52.87 41.75 42.01
Antenatal Care Drop-out Rates Pendency of Cases
Access to Electric Supply Anaemic Enrollment of Disabled Students
Kidnapping Drainage Facilities Access to Technology at School
Houses with treated tap water Access to Computer Access to Contraceptives
Child Mortality Gender Parity in Students Registered Birth
Bathing Facilities Diarrhea Scholarship for Minority
Murder Improved fuel for cooking Professionally Trained Teachers
Improved Drinking Water Access to Television Sets Adolescent Mothers
Financial Assistance to Mother Girl's Enrollment Sexual Offences
Housing Congestion Stunted Scholarship for SC/ST/OBC
Rape Crimes Respiratory Disease Teachers receiving in-service trainingTraditional Fuel for Energy
Improved Sanitation Households with Mobiles Child Marriages
Immunization Primary School Enrollment Sterilization
Improved Houses Underweight
Maternal Mortality Secondary Enrollment
Latrine Facilities Wasted Children
Public Facility Births Transition Rates
Vaccination
60.86 51.64 46.88
13.9834.57 60.17
44.42 44.21 21.78
92.21 36.56 39.22
Nutrition & Basic Medical Care
Access to Basic Knowledge
Personal Rights
Water & SanitationAccess to Information & Communication
Personal Freedom & Choice
Shelter Health & Wellness Inclusion
Personal Security Environmental Quality Access to Quality Education
36.08 43.57 46.44
57.78 47.29 17.86
97.16 65.86 22.3
5.03 12.95 63.84
29.03 58.82 23.35
15 67.87 23.32
95.87 13.44 71.62
17.32 40.31 59.48
86.48 20.41 92.25
62.53 48.63 23.66
84.15 70.73 2.51
64.23
22.75 78.67 58.65
58.72 86.79 83.08
73.09 29.32
91.55 58.13
21.77 56.43
46.16 17.65
97.31
Strength and Weakness is relative to 10 districts with similar demographic structure
How to read the scorecard: All the values are scores on a scale of 0-100. So, higher score represents better performance. For instance, a score of 91 on access to contraceptives will depict high score of the indicator.
OverperformingPerforming within expected range
Underperforming
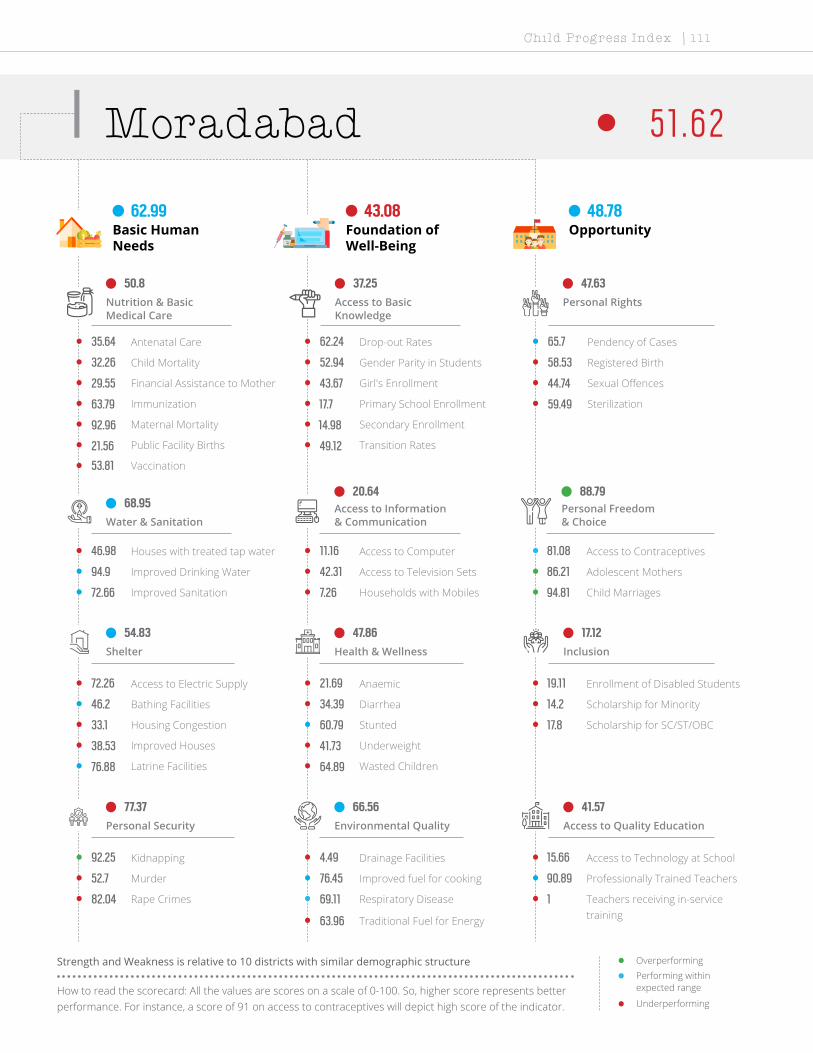
Child Progress Index | 111
Moradabad 5 1 . 6 2
Basic Human Needs
Foundation of Well-Being
Opportunity62.99 43.08 48.78
Antenatal Care Drop-out Rates Pendency of Cases
Access to Electric Supply Anaemic Enrollment of Disabled Students
Kidnapping Drainage Facilities Access to Technology at School
Houses with treated tap water Access to Computer Access to Contraceptives
Child Mortality Gender Parity in Students Registered Birth
Bathing Facilities Diarrhea Scholarship for Minority
Murder Improved fuel for cooking Professionally Trained Teachers
Improved Drinking Water Access to Television Sets Adolescent Mothers
Financial Assistance to Mother Girl's Enrollment Sexual Offences
Housing Congestion Stunted Scholarship for SC/ST/OBC
Rape Crimes Respiratory Disease Teachers receiving in-service trainingTraditional Fuel for Energy
Improved Sanitation Households with Mobiles Child Marriages
Immunization Primary School Enrollment Sterilization
Improved Houses Underweight
Maternal Mortality Secondary Enrollment
Latrine Facilities Wasted Children
Public Facility Births Transition Rates
Vaccination
50.8 37.25 47.63
68.9520.64 88.79
54.83 47.86 17.12
77.37 66.56 41.57
Nutrition & Basic Medical Care
Access to Basic Knowledge
Personal Rights
Water & SanitationAccess to Information & Communication
Personal Freedom & Choice
Shelter Health & Wellness Inclusion
Personal Security Environmental Quality Access to Quality Education
35.64 62.24 65.7
72.26 21.69 19.11
92.25 4.49 15.66
46.98 11.16 81.08
32.26 52.94 58.53
46.2 34.39 14.2
52.7 76.45 90.89
94.9 42.31 86.21
29.55 43.67 44.74
33.1 60.79 17.8
82.04 69.11 1
63.96
72.66 7.26 94.81
63.79 17.7 59.49
38.53 41.73
92.96 14.98
76.88 64.89
21.56 49.12
53.81
Strength and Weakness is relative to 10 districts with similar demographic structure
How to read the scorecard: All the values are scores on a scale of 0-100. So, higher score represents better performance. For instance, a score of 91 on access to contraceptives will depict high score of the indicator.
OverperformingPerforming within expected range
Underperforming

Child Progress Index | 112
Muzaffarnagar 5 3 . 8 8
Basic Human Needs
Foundation of Well-Being
Opportunity70.01 46.07 45.56
Antenatal Care Drop-out Rates Pendency of Cases
Access to Electric Supply Anaemic Enrollment of Disabled Students
Kidnapping Drainage Facilities Access to Technology at School
Houses with treated tap water Access to Computer Access to Contraceptives
Child Mortality Gender Parity in Students Registered Birth
Bathing Facilities Diarrhea Scholarship for Minority
Murder Improved fuel for cooking Professionally Trained Teachers
Improved Drinking Water Access to Television Sets Adolescent Mothers
Financial Assistance to Mother Girl's Enrollment Sexual Offences
Housing Congestion Stunted Scholarship for SC/ST/OBC
Rape Crimes Respiratory Disease Teachers receiving in-service trainingTraditional Fuel for Energy
Improved Sanitation Households with Mobiles Child Marriages
Immunization Primary School Enrollment Sterilization
Improved Houses Underweight
Maternal Mortality Secondary Enrollment
Latrine Facilities Wasted Children
Public Facility Births Transition Rates
Vaccination
65.79 32.06 46.9
62.9538.94 86.24
74.26 51.77 12.18
77.03 61.5 36.9
Nutrition & Basic Medical Care
Access to Basic Knowledge
Personal Rights
Water & SanitationAccess to Information & Communication
Personal Freedom & Choice
Shelter Health & Wellness Inclusion
Personal Security Environmental Quality Access to Quality Education
34.78 50.83 50.33
91.75 13.23 7.66
62.04 3.83 20.9
40.95 9.82 83.17
54.84 41.18 62.67
79 53.29 15
80.09 28.6 72.61
77.85 61.69 73.28
46.74 28.42 58
51.95 73.86 13.55
89.98 91.06 1
40.79
77.78 72.62 97.01
84.35 9.35 96.41
47.6 65.41
91.55 10.03
90.56 60.19
23.72 63.24
50.45
Strength and Weakness is relative to 10 districts with similar demographic structure
How to read the scorecard: All the values are scores on a scale of 0-100. So, higher score represents better performance. For instance, a score of 91 on access to contraceptives will depict high score of the indicator.
OverperformingPerforming within expected range
Underperforming

Child Progress Index | 113
Pilibhit 4 3 . 9 3
Basic Human Needs
Foundation of Well-Being
Opportunity54.42 39.21 38.15
Antenatal Care Drop-out Rates Pendency of Cases
Access to Electric Supply Anaemic Enrollment of Disabled Students
Kidnapping Drainage Facilities Access to Technology at School
Houses with treated tap water Access to Computer Access to Contraceptives
Child Mortality Gender Parity in Students Registered Birth
Bathing Facilities Diarrhea Scholarship for Minority
Murder Improved fuel for cooking Professionally Trained Teachers
Improved Drinking Water Access to Television Sets Adolescent Mothers
Financial Assistance to Mother Girl's Enrollment Sexual Offences
Housing Congestion Stunted Scholarship for SC/ST/OBC
Rape Crimes Respiratory Disease Teachers receiving in-service trainingTraditional Fuel for Energy
Improved Sanitation Households with Mobiles Child Marriages
Immunization Primary School Enrollment Sterilization
Improved Houses Underweight
Maternal Mortality Secondary Enrollment
Latrine Facilities Wasted Children
Public Facility Births Transition Rates
Vaccination
64.6 54.52 48.85
52.2415.01 79.57
37.15 40.99 18.92
63.7 46.34 5.25
Nutrition & Basic Medical Care
Access to Basic Knowledge
Personal Rights
Water & SanitationAccess to Information & Communication
Personal Freedom & Choice
Shelter Health & Wellness Inclusion
Personal Security Environmental Quality Access to Quality Education
17.07 62.24 49.43
35.32 15.84 23.84
71.54 23.09 12.93
24.87 6.25 83.73
25.81 35.29 73.73
21.6 19.91 12.13
55.2 19.57 0
94.5 32.31 68.97
61.1 12.95 19.12
10.57 41.34 20.3
62.51 91.87 0
83.33
46.91 7.26 84.75
95.23 86.61 94.87
61.16 38.35
69.01 56.16
53.18 54.55
15.23 33.82
82.51
Strength and Weakness is relative to 10 districts with similar demographic structure
How to read the scorecard: All the values are scores on a scale of 0-100. So, higher score represents better performance. For instance, a score of 91 on access to contraceptives will depict high score of the indicator.
OverperformingPerforming within expected range
Underperforming

Child Progress Index | 114
Pratapgarh 4 6 . 8
Basic Human Needs
Foundation of Well-Being
Opportunity53.86 44.09 42.45
Antenatal Care Drop-out Rates Pendency of Cases
Access to Electric Supply Anaemic Enrollment of Disabled Students
Kidnapping Drainage Facilities Access to Technology at School
Houses with treated tap water Access to Computer Access to Contraceptives
Child Mortality Gender Parity in Students Registered Birth
Bathing Facilities Diarrhea Scholarship for Minority
Murder Improved fuel for cooking Professionally Trained Teachers
Improved Drinking Water Access to Television Sets Adolescent Mothers
Financial Assistance to Mother Girl's Enrollment Sexual Offences
Housing Congestion Stunted Scholarship for SC/ST/OBC
Rape Crimes Respiratory Disease Teachers receiving in-service trainingTraditional Fuel for Energy
Improved Sanitation Households with Mobiles Child Marriages
Immunization Primary School Enrollment Sterilization
Improved Houses Underweight
Maternal Mortality Secondary Enrollment
Latrine Facilities Wasted Children
Public Facility Births Transition Rates
Vaccination
68.1 66.3 48.04
17.4122.44 82.83
41.61 50.03 17.25
88.33 37.58 21.68
Nutrition & Basic Medical Care
Access to Basic Knowledge
Personal Rights
Water & SanitationAccess to Information & Communication
Personal Freedom & Choice
Shelter Health & Wellness Inclusion
Personal Security Environmental Quality Access to Quality Education
43.24 88.38 37.88
67.25 50.33 9.88
95.81 61.05 4.39
19.35 11.61 49.51
61.29 100 63.59
14.6 44 24.53
90.28 15.48 51.99
22.68 25.69 95.69
67.78 55.56 100
74.25 72.34 17.42
79.04 85.37 0.4
79.67
9.52 43.87 91.98
88.23 69.78 100
54.59 43.98
98.59 49.18
6.55 47.02
42.49 40.88
66.82
Strength and Weakness is relative to 10 districts with similar demographic structure
How to read the scorecard: All the values are scores on a scale of 0-100. So, higher score represents better performance. For instance, a score of 91 on access to contraceptives will depict high score of the indicator.
OverperformingPerforming within expected range
Underperforming

Child Progress Index | 115
Rae Bareli 4 3 . 9 6
Basic Human Needs
Foundation of Well-Being
Opportunity49.89 38 43.99
Antenatal Care Drop-out Rates Pendency of Cases
Access to Electric Supply Anaemic Enrollment of Disabled Students
Kidnapping Drainage Facilities Access to Technology at School
Houses with treated tap water Access to Computer Access to Contraceptives
Child Mortality Gender Parity in Students Registered Birth
Bathing Facilities Diarrhea Scholarship for Minority
Murder Improved fuel for cooking Professionally Trained Teachers
Improved Drinking Water Access to Television Sets Adolescent Mothers
Financial Assistance to Mother Girl's Enrollment Sexual Offences
Housing Congestion Stunted Scholarship for SC/ST/OBC
Rape Crimes Respiratory Disease Teachers receiving in-service trainingTraditional Fuel for Energy
Improved Sanitation Households with Mobiles Child Marriages
Immunization Primary School Enrollment Sterilization
Improved Houses Underweight
Maternal Mortality Secondary Enrollment
Latrine Facilities Wasted Children
Public Facility Births Transition Rates
Vaccination
71.25 31.74 49.05
17.7725.89 75.15
30.66 45.84 26.21
79.88 48.53 25.56
Nutrition & Basic Medical Care
Access to Basic Knowledge
Personal Rights
Water & SanitationAccess to Information & Communication
Personal Freedom & Choice
Shelter Health & Wellness Inclusion
Personal Security Environmental Quality Access to Quality Education
22.4 50.83 49.52
62.25 53.36 14.69
81.35 78.01 6.06
17.84 11.61 34.91
41.94 88.24 73.73
14.8 43.67 38.24
87.52 42.69 57.57
21.34 19.38 84.48
81.3 19.97 56.45
41.15 87.84 25.95
72.17 95.93 1.2
60.84
14.11 72.62 90.57
81.52 24.3 100
24.1 48.87
94.37 18.91
10.6 21.94
38.19 0
97.31
Strength and Weakness is relative to 10 districts with similar demographic structure
How to read the scorecard: All the values are scores on a scale of 0-100. So, higher score represents better performance. For instance, a score of 91 on access to contraceptives will depict high score of the indicator.
OverperformingPerforming within expected range
Underperforming

Child Progress Index | 116
Rampur 5 2 . 3 3
Basic Human Needs
Foundation of Well-Being
Opportunity65.23 41.69 50.07
Antenatal Care Drop-out Rates Pendency of Cases
Access to Electric Supply Anaemic Enrollment of Disabled Students
Kidnapping Drainage Facilities Access to Technology at School
Houses with treated tap water Access to Computer Access to Contraceptives
Child Mortality Gender Parity in Students Registered Birth
Bathing Facilities Diarrhea Scholarship for Minority
Murder Improved fuel for cooking Professionally Trained Teachers
Improved Drinking Water Access to Television Sets Adolescent Mothers
Financial Assistance to Mother Girl's Enrollment Sexual Offences
Housing Congestion Stunted Scholarship for SC/ST/OBC
Rape Crimes Respiratory Disease Teachers receiving in-service trainingTraditional Fuel for Energy
Improved Sanitation Households with Mobiles Child Marriages
Immunization Primary School Enrollment Sterilization
Improved Houses Underweight
Maternal Mortality Secondary Enrollment
Latrine Facilities Wasted Children
Public Facility Births Transition Rates
Vaccination
59.69 52.06 55.1
69.8823.46 87.91
56.48 42.72 10.03
74.87 48.52 47.24
Nutrition & Basic Medical Care
Access to Basic Knowledge
Personal Rights
Water & SanitationAccess to Information & Communication
Personal Freedom & Choice
Shelter Health & Wellness Inclusion
Personal Security Environmental Quality Access to Quality Education
21.89 88.38 67.28
74.7 16.92 11.7
94.31 10.83 19.99
44.22 4.46 83.17
48.39 58.82 75.58
50.8 29.86 2.95
51 28.49 87.34
100 39.23 85.34
38.73 31.56 93.19
21.84 58.05 14.18
74.19 60.98 4.71
68.7
74.43 43.87 92.3
91.21 69.78 100
30.36 37.22
78.87 38.61
93.45 56.43
10.44 9.12
78.92
Strength and Weakness is relative to 10 districts with similar demographic structure
How to read the scorecard: All the values are scores on a scale of 0-100. So, higher score represents better performance. For instance, a score of 91 on access to contraceptives will depict high score of the indicator.
OverperformingPerforming within expected range
Underperforming
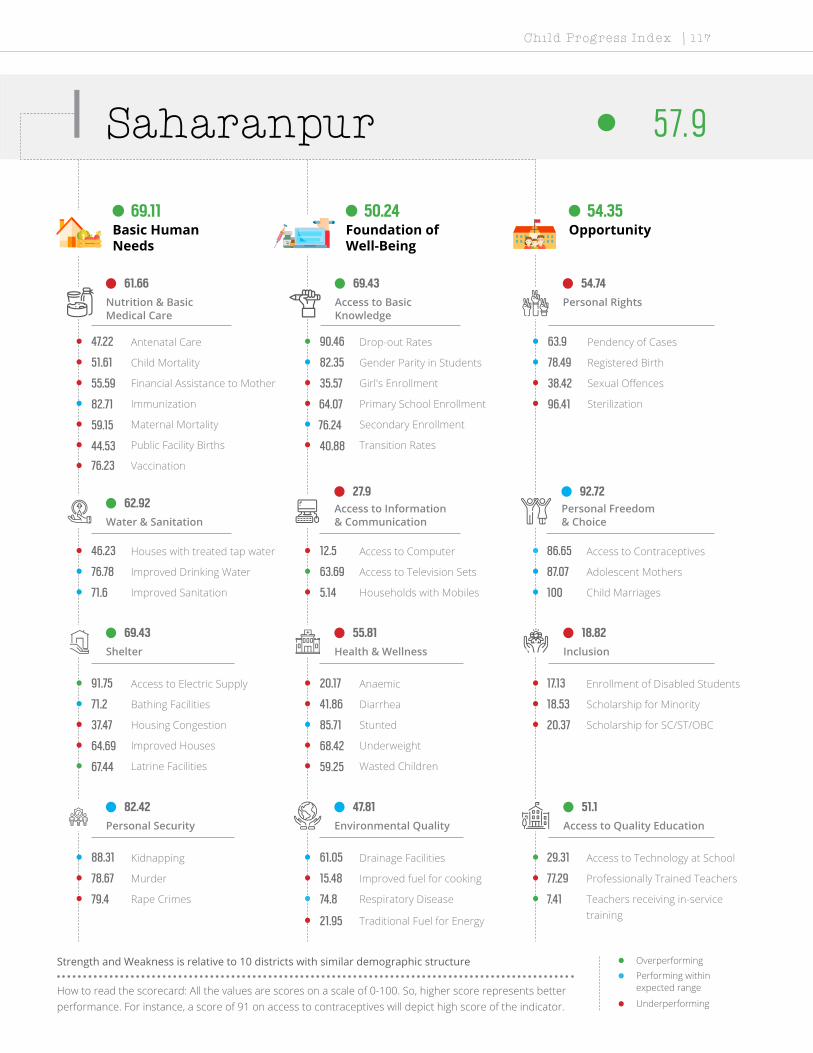
Child Progress Index | 117
Saharanpur 5 7. 9
Basic Human Needs
Foundation of Well-Being
Opportunity69.11 50.24 54.35
Antenatal Care Drop-out Rates Pendency of Cases
Access to Electric Supply Anaemic Enrollment of Disabled Students
Kidnapping Drainage Facilities Access to Technology at School
Houses with treated tap water Access to Computer Access to Contraceptives
Child Mortality Gender Parity in Students Registered Birth
Bathing Facilities Diarrhea Scholarship for Minority
Murder Improved fuel for cooking Professionally Trained Teachers
Improved Drinking Water Access to Television Sets Adolescent Mothers
Financial Assistance to Mother Girl's Enrollment Sexual Offences
Housing Congestion Stunted Scholarship for SC/ST/OBC
Rape Crimes Respiratory Disease Teachers receiving in-service trainingTraditional Fuel for Energy
Improved Sanitation Households with Mobiles Child Marriages
Immunization Primary School Enrollment Sterilization
Improved Houses Underweight
Maternal Mortality Secondary Enrollment
Latrine Facilities Wasted Children
Public Facility Births Transition Rates
Vaccination
61.66 69.43 54.74
62.9227.9 92.72
69.43 55.81 18.82
82.42 47.81 51.1
Nutrition & Basic Medical Care
Access to Basic Knowledge
Personal Rights
Water & SanitationAccess to Information & Communication
Personal Freedom & Choice
Shelter Health & Wellness Inclusion
Personal Security Environmental Quality Access to Quality Education
47.22 90.46 63.9
91.75 20.17 17.13
88.31 61.05 29.31
46.23 12.5 86.65
51.61 82.35 78.49
71.2 41.86 18.53
78.67 15.48 77.29
76.78 63.69 87.07
55.59 35.57 38.42
37.47 85.71 20.37
79.4 74.8 7.41
21.95
71.6 5.14 100
82.71 64.07 96.41
64.69 68.42
59.15 76.24
67.44 59.25
44.53 40.88
76.23
Strength and Weakness is relative to 10 districts with similar demographic structure
How to read the scorecard: All the values are scores on a scale of 0-100. So, higher score represents better performance. For instance, a score of 91 on access to contraceptives will depict high score of the indicator.
OverperformingPerforming within expected range
Underperforming

Child Progress Index | 118
Shahjahanpur 3 8 . 5 6
Basic Human Needs
Foundation of Well-Being
Opportunity44.7 36.5 34.48
Antenatal Care Drop-out Rates Pendency of Cases
Access to Electric Supply Anaemic Enrollment of Disabled Students
Kidnapping Drainage Facilities Access to Technology at School
Houses with treated tap water Access to Computer Access to Contraceptives
Child Mortality Gender Parity in Students Registered Birth
Bathing Facilities Diarrhea Scholarship for Minority
Murder Improved fuel for cooking Professionally Trained Teachers
Improved Drinking Water Access to Television Sets Adolescent Mothers
Financial Assistance to Mother Girl's Enrollment Sexual Offences
Housing Congestion Stunted Scholarship for SC/ST/OBC
Rape Crimes Respiratory Disease Teachers receiving in-service trainingTraditional Fuel for Energy
Improved Sanitation Households with Mobiles Child Marriages
Immunization Primary School Enrollment Sterilization
Improved Houses Underweight
Maternal Mortality Secondary Enrollment
Latrine Facilities Wasted Children
Public Facility Births Transition Rates
Vaccination
52.84 50.76 27.01
48.4721.63 61.32
26.74 27.69 18.34
50.74 45.93 31.24
Nutrition & Basic Medical Care
Access to Basic Knowledge
Personal Rights
Water & SanitationAccess to Information & Communication
Personal Freedom & Choice
Shelter Health & Wellness Inclusion
Personal Security Environmental Quality Access to Quality Education
36.4 87.97 69.78
37.35 17.14 26.02
58.42 21.77 1.58
31.66 4.91 66.62
25.81 29.41 0
14 25.34 16.24
67.14 22.37 72.03
79.06 27.08 60.34
70.95 34.04 15.79
5.98 48.02 13.96
29.57 85.37 2.71
84.55
40.56 54.01 59.12
86.74 69.78 96.92
34.23 0
98.59 45.77
36.8 46.08
36.79 10.59
77.58
Strength and Weakness is relative to 10 districts with similar demographic structure
How to read the scorecard: All the values are scores on a scale of 0-100. So, higher score represents better performance. For instance, a score of 91 on access to contraceptives will depict high score of the indicator.
OverperformingPerforming within expected range
Underperforming
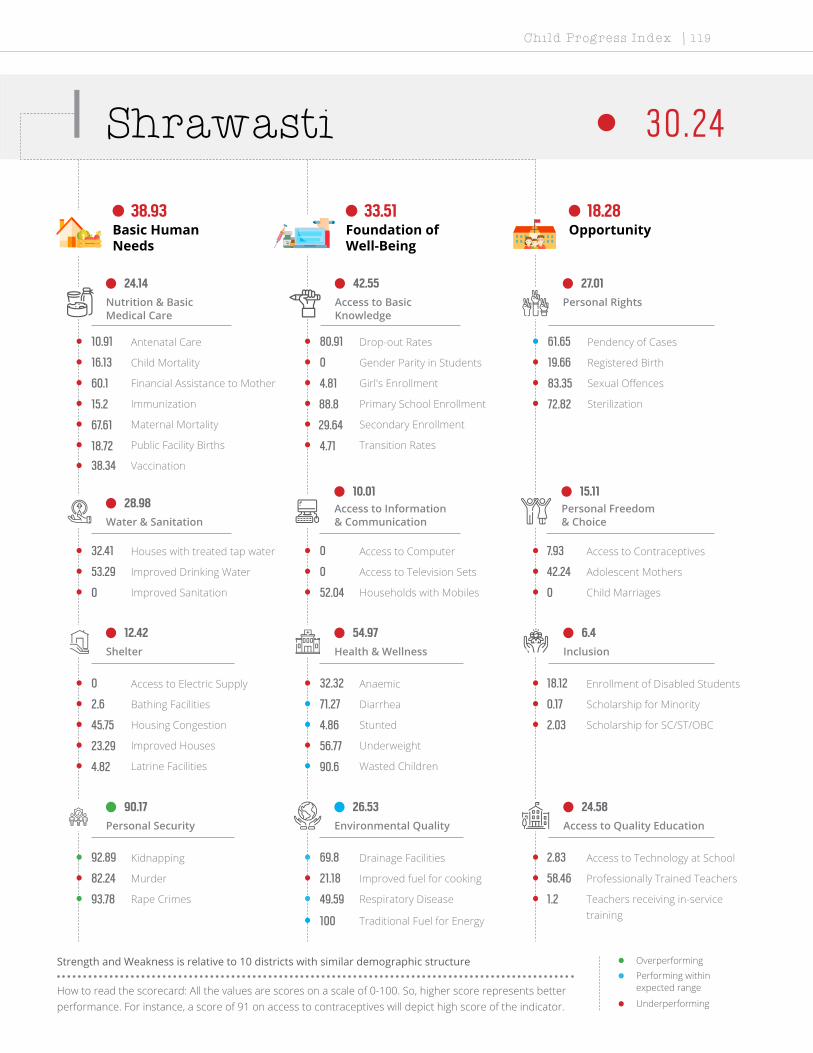
Child Progress Index | 119
Shrawasti 3 0 . 2 4
Basic Human Needs
Foundation of Well-Being
Opportunity38.93 33.51 18.28
Antenatal Care Drop-out Rates Pendency of Cases
Access to Electric Supply Anaemic Enrollment of Disabled Students
Kidnapping Drainage Facilities Access to Technology at School
Houses with treated tap water Access to Computer Access to Contraceptives
Child Mortality Gender Parity in Students Registered Birth
Bathing Facilities Diarrhea Scholarship for Minority
Murder Improved fuel for cooking Professionally Trained Teachers
Improved Drinking Water Access to Television Sets Adolescent Mothers
Financial Assistance to Mother Girl's Enrollment Sexual Offences
Housing Congestion Stunted Scholarship for SC/ST/OBC
Rape Crimes Respiratory Disease Teachers receiving in-service trainingTraditional Fuel for Energy
Improved Sanitation Households with Mobiles Child Marriages
Immunization Primary School Enrollment Sterilization
Improved Houses Underweight
Maternal Mortality Secondary Enrollment
Latrine Facilities Wasted Children
Public Facility Births Transition Rates
Vaccination
24.14 42.55 27.01
28.9810.01 15.11
12.42 54.97 6.4
90.17 26.53 24.58
Nutrition & Basic Medical Care
Access to Basic Knowledge
Personal Rights
Water & SanitationAccess to Information & Communication
Personal Freedom & Choice
Shelter Health & Wellness Inclusion
Personal Security Environmental Quality Access to Quality Education
10.91 80.91 61.65
0 32.32 18.12
92.89 69.8 2.83
32.41 0 7.93
16.13 0 19.66
2.6 71.27 0.17
82.24 21.18 58.46
53.29 0 42.24
60.1 4.81 83.35
45.75 4.86 2.03
93.78 49.59 1.2
100
0 52.04 0
15.2 88.8 72.82
23.29 56.77
67.61 29.64
4.82 90.6
18.72 4.71
38.34
Strength and Weakness is relative to 10 districts with similar demographic structure
How to read the scorecard: All the values are scores on a scale of 0-100. So, higher score represents better performance. For instance, a score of 91 on access to contraceptives will depict high score of the indicator.
OverperformingPerforming within expected range
Underperforming

Child Progress Index | 120
Siddharthnagar 3 8 .1
Basic Human Needs
Foundation of Well-Being
Opportunity48.96 37.43 27.9
Antenatal Care Drop-out Rates Pendency of Cases
Access to Electric Supply Anaemic Enrollment of Disabled Students
Kidnapping Drainage Facilities Access to Technology at School
Houses with treated tap water Access to Computer Access to Contraceptives
Child Mortality Gender Parity in Students Registered Birth
Bathing Facilities Diarrhea Scholarship for Minority
Murder Improved fuel for cooking Professionally Trained Teachers
Improved Drinking Water Access to Television Sets Adolescent Mothers
Financial Assistance to Mother Girl's Enrollment Sexual Offences
Housing Congestion Stunted Scholarship for SC/ST/OBC
Rape Crimes Respiratory Disease Teachers receiving in-service trainingTraditional Fuel for Energy
Improved Sanitation Households with Mobiles Child Marriages
Immunization Primary School Enrollment Sterilization
Improved Houses Underweight
Maternal Mortality Secondary Enrollment
Latrine Facilities Wasted Children
Public Facility Births Transition Rates
Vaccination
38.46 50.44 27.16
31.911.16 44.53
37.98 49.97 17.09
87.5 38.16 22.83
Nutrition & Basic Medical Care
Access to Basic Knowledge
Personal Rights
Water & SanitationAccess to Information & Communication
Personal Freedom & Choice
Shelter Health & Wellness Inclusion
Personal Security Environmental Quality Access to Quality Education
28.35 92.53 31.44
49.12 42.73 45.91
86.11 57.77 0
39.45 3.57 34.91
45.16 100 38.56
10 80.54 5.83
92.59 24.52 58.37
45.64 10 71.55
45.58 28.6 79.94
61.15 21.88 3.22
84.81 73.17 0.8
81.57
7.94 32.07 30.82
42.03 59.39 92.31
74.07 40.6
73.24 21.14
4.82 78.37
40.24 5
51.12
Strength and Weakness is relative to 10 districts with similar demographic structure
How to read the scorecard: All the values are scores on a scale of 0-100. So, higher score represents better performance. For instance, a score of 91 on access to contraceptives will depict high score of the indicator.
OverperformingPerforming within expected range
Underperforming

Child Progress Index | 121
Sitapur 3 5 . 8
Basic Human Needs
Foundation of Well-Being
Opportunity36.31 36.76 34.34
Antenatal Care Drop-out Rates Pendency of Cases
Access to Electric Supply Anaemic Enrollment of Disabled Students
Kidnapping Drainage Facilities Access to Technology at School
Houses with treated tap water Access to Computer Access to Contraceptives
Child Mortality Gender Parity in Students Registered Birth
Bathing Facilities Diarrhea Scholarship for Minority
Murder Improved fuel for cooking Professionally Trained Teachers
Improved Drinking Water Access to Television Sets Adolescent Mothers
Financial Assistance to Mother Girl's Enrollment Sexual Offences
Housing Congestion Stunted Scholarship for SC/ST/OBC
Rape Crimes Respiratory Disease Teachers receiving in-service trainingTraditional Fuel for Energy
Improved Sanitation Households with Mobiles Child Marriages
Immunization Primary School Enrollment Sterilization
Improved Houses Underweight
Maternal Mortality Secondary Enrollment
Latrine Facilities Wasted Children
Public Facility Births Transition Rates
Vaccination
39.44 53.45 31.92
28.516.23 49.94
7.83 50.33 19.01
69.46 27.04 36.5
Nutrition & Basic Medical Care
Access to Basic Knowledge
Personal Rights
Water & SanitationAccess to Information & Communication
Personal Freedom & Choice
Shelter Health & Wellness Inclusion
Personal Security Environmental Quality Access to Quality Education
80.88 87.97 29.51
5.82 69.85 31.85
58.81 78.01 7.4
30.65 4.91 55.77
0 70.59 69.12
8 60.86 14.94
88.74 42.69 52.82
42.95 10.62 37.93
55.26 64.64 37.6
2.07 26.44 12.1
64.79 23.58 100
97.29
11.11 54.01 55.19
56.18 69.78 97.44
14.08 21.43
26.76 37.39
7.71 73.04
100 0
82.51
Strength and Weakness is relative to 10 districts with similar demographic structure
How to read the scorecard: All the values are scores on a scale of 0-100. So, higher score represents better performance. For instance, a score of 91 on access to contraceptives will depict high score of the indicator.
OverperformingPerforming within expected range
Underperforming

Child Progress Index | 122
Sant Kabir Nagar 4 4 .4 8
Basic Human Needs
Foundation of Well-Being
Opportunity53.12 41.86 38.45
Antenatal Care Drop-out Rates Pendency of Cases
Access to Electric Supply Anaemic Enrollment of Disabled Students
Kidnapping Drainage Facilities Access to Technology at School
Houses with treated tap water Access to Computer Access to Contraceptives
Child Mortality Gender Parity in Students Registered Birth
Bathing Facilities Diarrhea Scholarship for Minority
Murder Improved fuel for cooking Professionally Trained Teachers
Improved Drinking Water Access to Television Sets Adolescent Mothers
Financial Assistance to Mother Girl's Enrollment Sexual Offences
Housing Congestion Stunted Scholarship for SC/ST/OBC
Rape Crimes Respiratory Disease Teachers receiving in-service trainingTraditional Fuel for Energy
Improved Sanitation Households with Mobiles Child Marriages
Immunization Primary School Enrollment Sterilization
Improved Houses Underweight
Maternal Mortality Secondary Enrollment
Latrine Facilities Wasted Children
Public Facility Births Transition Rates
Vaccination
57.35 64.06 42.92
33.0324.72 61.57
36.91 62.56 24.84
85.17 16.1 24.47
Nutrition & Basic Medical Care
Access to Basic Knowledge
Personal Rights
Water & SanitationAccess to Information & Communication
Personal Freedom & Choice
Shelter Health & Wellness Inclusion
Personal Security Environmental Quality Access to Quality Education
17.91 61 50.1
50.74 34.06 8.88
90.32 98.47 4.11
37.69 5.36 26.7
74.19 100 65.28
15.6 59.73 25.95
94.24 2.37 56.38
51.28 16.15 93.97
76.79 14.69 61.63
53.33 44.38 36.46
72.53 22.76 1.3
73.44
8.47 87.59 57.86
53.95 85.24 100
61.88 66.92
84.51 43.43
8.48 88.71
27.59 67.94
45.29
Strength and Weakness is relative to 10 districts with similar demographic structure
How to read the scorecard: All the values are scores on a scale of 0-100. So, higher score represents better performance. For instance, a score of 91 on access to contraceptives will depict high score of the indicator.
OverperformingPerforming within expected range
Underperforming

Child Progress Index | 123
Sonbhadra 4 1 . 8 8
Basic Human Needs
Foundation of Well-Being
Opportunity46.17 44.51 34.95
Antenatal Care Drop-out Rates Pendency of Cases
Access to Electric Supply Anaemic Enrollment of Disabled Students
Kidnapping Drainage Facilities Access to Technology at School
Houses with treated tap water Access to Computer Access to Contraceptives
Child Mortality Gender Parity in Students Registered Birth
Bathing Facilities Diarrhea Scholarship for Minority
Murder Improved fuel for cooking Professionally Trained Teachers
Improved Drinking Water Access to Television Sets Adolescent Mothers
Financial Assistance to Mother Girl's Enrollment Sexual Offences
Housing Congestion Stunted Scholarship for SC/ST/OBC
Rape Crimes Respiratory Disease Teachers receiving in-service trainingTraditional Fuel for Energy
Improved Sanitation Households with Mobiles Child Marriages
Immunization Primary School Enrollment Sterilization
Improved Houses Underweight
Maternal Mortality Secondary Enrollment
Latrine Facilities Wasted Children
Public Facility Births Transition Rates
Vaccination
54.42 67.72 52.25
16.3933.2 51.05
35.89 45.88 15.56
78 31.25 20.93
Nutrition & Basic Medical Care
Access to Basic Knowledge
Personal Rights
Water & SanitationAccess to Information & Communication
Personal Freedom & Choice
Shelter Health & Wellness Inclusion
Personal Security Environmental Quality Access to Quality Education
12.69 86.72 46.72
36.27 57.92 4.11
95.32 79.21 11.34
13.57 24.55 58.14
58.06 64.71 45.01
0 63.8 25.74
67.57 16.24 30.99
13.15 24.77 51.72
90.48 15.12 96.62
84.6 58.36 16.69
68.63 61.79 3.41
73.44
23.46 69.14 46.7
34.58 97.65 100
68.68 29.7
77.46 56.88
11.18 49.84
20.12 47.06
91.7
Strength and Weakness is relative to 10 districts with similar demographic structure
How to read the scorecard: All the values are scores on a scale of 0-100. So, higher score represents better performance. For instance, a score of 91 on access to contraceptives will depict high score of the indicator.
OverperformingPerforming within expected range
Underperforming

Child Progress Index | 124
Sant Ravidas Nagar (Bhadohi) 4 6 . 2 9
Basic Human Needs
Foundation of Well-Being
Opportunity51.2 42.7 44.98
Antenatal Care Drop-out Rates Pendency of Cases
Access to Electric Supply Anaemic Enrollment of Disabled Students
Kidnapping Drainage Facilities Access to Technology at School
Houses with treated tap water Access to Computer Access to Contraceptives
Child Mortality Gender Parity in Students Registered Birth
Bathing Facilities Diarrhea Scholarship for Minority
Murder Improved fuel for cooking Professionally Trained Teachers
Improved Drinking Water Access to Television Sets Adolescent Mothers
Financial Assistance to Mother Girl's Enrollment Sexual Offences
Housing Congestion Stunted Scholarship for SC/ST/OBC
Rape Crimes Respiratory Disease Teachers receiving in-service trainingTraditional Fuel for Energy
Improved Sanitation Households with Mobiles Child Marriages
Immunization Primary School Enrollment Sterilization
Improved Houses Underweight
Maternal Mortality Secondary Enrollment
Latrine Facilities Wasted Children
Public Facility Births Transition Rates
Vaccination
60.47 60.02 49.51
15.3933.15 64.62
46.27 38.88 26.44
82.68 38.74 39.36
Nutrition & Basic Medical Care
Access to Basic Knowledge
Personal Rights
Water & SanitationAccess to Information & Communication
Personal Freedom & Choice
Shelter Health & Wellness Inclusion
Personal Security Environmental Quality Access to Quality Education
12.55 98.76 43.08
73.75 48.81 12.49
88.65 61.05 30.54
9.55 9.82 56.05
32.26 70.59 58.37
18.2 97.96 29.5
74.7 15.48 72.49
20.67 37.69 72.41
41.4 8.92 86.82
58.85 41.64 34.99
83 73.17 0
63.28
17.99 83.51 63.84
53.65 60.6 89.74
74.17 19.55
84.51 47
9.06 55.17
17.17 40.88
47.76
Strength and Weakness is relative to 10 districts with similar demographic structure
How to read the scorecard: All the values are scores on a scale of 0-100. So, higher score represents better performance. For instance, a score of 91 on access to contraceptives will depict high score of the indicator.
OverperformingPerforming within expected range
Underperforming

Child Progress Index | 125
Sultanpur 4 7. 8 4
Basic Human Needs
Foundation of Well-Being
Opportunity54.27 45.26 44
Antenatal Care Drop-out Rates Pendency of Cases
Access to Electric Supply Anaemic Enrollment of Disabled Students
Kidnapping Drainage Facilities Access to Technology at School
Houses with treated tap water Access to Computer Access to Contraceptives
Child Mortality Gender Parity in Students Registered Birth
Bathing Facilities Diarrhea Scholarship for Minority
Murder Improved fuel for cooking Professionally Trained Teachers
Improved Drinking Water Access to Television Sets Adolescent Mothers
Financial Assistance to Mother Girl's Enrollment Sexual Offences
Housing Congestion Stunted Scholarship for SC/ST/OBC
Rape Crimes Respiratory Disease Teachers receiving in-service trainingTraditional Fuel for Energy
Improved Sanitation Households with Mobiles Child Marriages
Immunization Primary School Enrollment Sterilization
Improved Houses Underweight
Maternal Mortality Secondary Enrollment
Latrine Facilities Wasted Children
Public Facility Births Transition Rates
Vaccination
63.94 49.57 37.79
22.6635.43 69.81
40.35 54.02 32.15
90.14 42.03 36.24
Nutrition & Basic Medical Care
Access to Basic Knowledge
Personal Rights
Water & SanitationAccess to Information & Communication
Personal Freedom & Choice
Shelter Health & Wellness Inclusion
Personal Security Environmental Quality Access to Quality Education
21.71 89.21 25.19
66.85 38.83 46.32
89.89 47.59 7.84
24.12 20.09 41.17
67.74 82.35 62.52
16.8 33.48 20.03
86.3 14.09 76.74
32.21 20 84.48
62.77 19.34 82.88
65.98 58.36 30.39
93.51 81.3 3.21
64.91
11.11 100 75.16
62.3 13.1 100
48.45 54.51
92.96 26.84
10.02 60.82
43.56 63.53
81.39
Strength and Weakness is relative to 10 districts with similar demographic structure
How to read the scorecard: All the values are scores on a scale of 0-100. So, higher score represents better performance. For instance, a score of 91 on access to contraceptives will depict high score of the indicator.
OverperformingPerforming within expected range
Underperforming
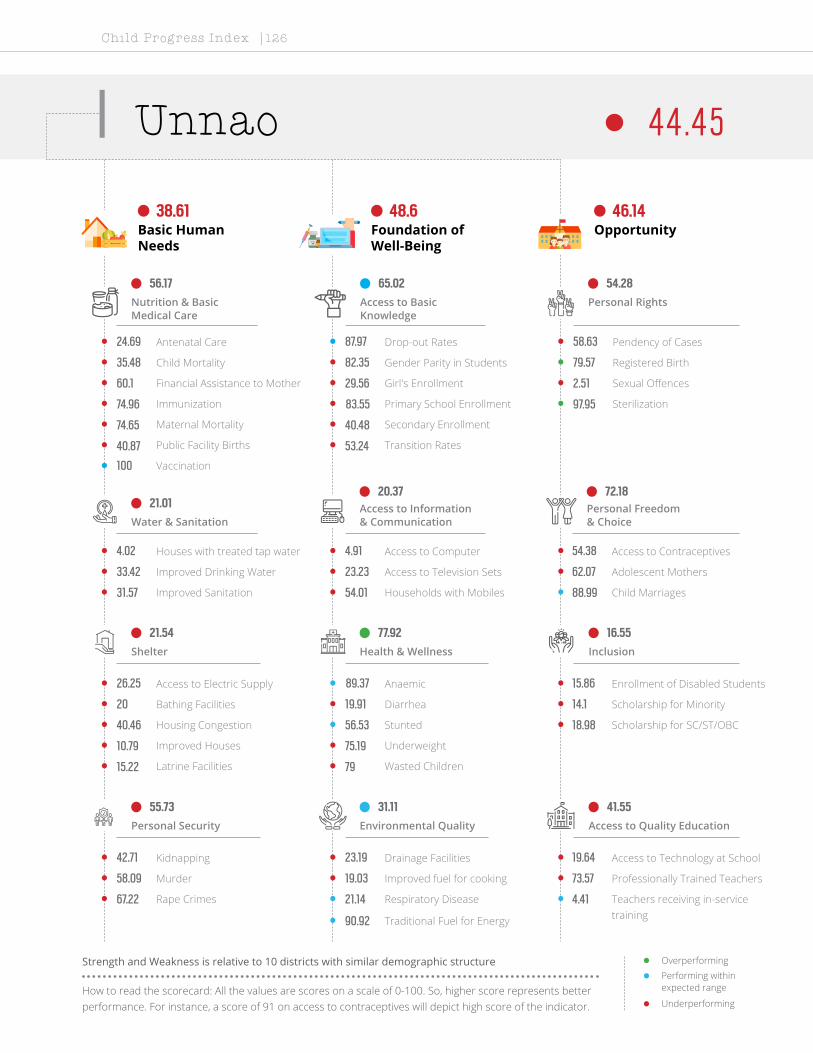
Child Progress Index | 126
Unnao 4 4 .4 5
Basic Human Needs
Foundation of Well-Being
Opportunity38.61 48.6 46.14
Antenatal Care Drop-out Rates Pendency of Cases
Access to Electric Supply Anaemic Enrollment of Disabled Students
Kidnapping Drainage Facilities Access to Technology at School
Houses with treated tap water Access to Computer Access to Contraceptives
Child Mortality Gender Parity in Students Registered Birth
Bathing Facilities Diarrhea Scholarship for Minority
Murder Improved fuel for cooking Professionally Trained Teachers
Improved Drinking Water Access to Television Sets Adolescent Mothers
Financial Assistance to Mother Girl's Enrollment Sexual Offences
Housing Congestion Stunted Scholarship for SC/ST/OBC
Rape Crimes Respiratory Disease Teachers receiving in-service trainingTraditional Fuel for Energy
Improved Sanitation Households with Mobiles Child Marriages
Immunization Primary School Enrollment Sterilization
Improved Houses Underweight
Maternal Mortality Secondary Enrollment
Latrine Facilities Wasted Children
Public Facility Births Transition Rates
Vaccination
56.17 65.02 54.28
21.0120.37 72.18
21.54 77.92 16.55
55.73 31.11 41.55
Nutrition & Basic Medical Care
Access to Basic Knowledge
Personal Rights
Water & SanitationAccess to Information & Communication
Personal Freedom & Choice
Shelter Health & Wellness Inclusion
Personal Security Environmental Quality Access to Quality Education
24.69 87.97 58.63
26.25 89.37 15.86
42.71 23.19 19.64
4.02 4.91 54.38
35.48 82.35 79.57
20 19.91 14.1
58.09 19.03 73.57
33.42 23.23 62.07
60.1 29.56 2.51
40.46 56.53 18.98
67.22 21.14 4.41
90.92
31.57 54.01 88.99
74.96 83.55 97.95
10.79 75.19
74.65 40.48
15.22 79
40.87 53.24
100
Strength and Weakness is relative to 10 districts with similar demographic structure
How to read the scorecard: All the values are scores on a scale of 0-100. So, higher score represents better performance. For instance, a score of 91 on access to contraceptives will depict high score of the indicator.
OverperformingPerforming within expected range
Underperforming

Child Progress Index | 127
Varanasi 5 8 .4 5
Basic Human Needs
Foundation of Well-Being
Opportunity69.48 54.56 51.3
Antenatal Care Drop-out Rates Pendency of Cases
Access to Electric Supply Anaemic Enrollment of Disabled Students
Kidnapping Drainage Facilities Access to Technology at School
Houses with treated tap water Access to Computer Access to Contraceptives
Child Mortality Gender Parity in Students Registered Birth
Bathing Facilities Diarrhea Scholarship for Minority
Murder Improved fuel for cooking Professionally Trained Teachers
Improved Drinking Water Access to Television Sets Adolescent Mothers
Financial Assistance to Mother Girl's Enrollment Sexual Offences
Housing Congestion Stunted Scholarship for SC/ST/OBC
Rape Crimes Respiratory Disease Teachers receiving in-service trainingTraditional Fuel for Energy
Improved Sanitation Households with Mobiles Child Marriages
Immunization Primary School Enrollment Sterilization
Improved Houses Underweight
Maternal Mortality Secondary Enrollment
Latrine Facilities Wasted Children
Public Facility Births Transition Rates
Vaccination
77.75 69.47 54.64
60.5252.39 67.79
60.96 47.14 23.29
78.68 49.24 59.49
Nutrition & Basic Medical Care
Access to Basic Knowledge
Personal Rights
Water & SanitationAccess to Information & Communication
Personal Freedom & Choice
Shelter Health & Wellness Inclusion
Personal Security Environmental Quality Access to Quality Education
29.99 94.65 46.89
84.98 57.05 14.06
84.83 49.56 45.17
61.06 24.55 77.61
74.19 58.82 57.3
29.4 20.81 12.11
72.62 21.08 75.3
52.62 74.77 58.62
59.6 26.87 50.56
67.13 62.01 39.1
77.27 72.36 9.32
31.03
67.72 83.51 68.87
77.35 51.56 90.26
89.02 33.46
83.1 56.88
36.99 42.32
26.43 100
73.54
Strength and Weakness is relative to 10 districts with similar demographic structure
How to read the scorecard: All the values are scores on a scale of 0-100. So, higher score represents better performance. For instance, a score of 91 on access to contraceptives will depict high score of the indicator.
OverperformingPerforming within expected range
Underperforming

Child Progress Index | 128

Child Progress Index | 129
ReferencesAtnic, T. M., & Wright, E. G. (2014). Brookings. Retrieved from Brookings.
Claeson, M., Bos, E. R., Mawji, T., & Pathmanathan, I. (n.d.). Reducing child mortality in India in the new millennium. Bulletin of the World Health Organization.
Cortina, J. M. (1993). What is the co-efficient alpha? An examination of theory and applications. Journal of applied psychology, 78(1),98.
Devercelli, A., & Saavedra, J. (2019, April 10). World Bank Blogs. Retrieved from World Bank Group US: https://blogs.worldbank.org/education/world-bank-s-unwavering-commitment-early-childhood
Gertler, P., Heckman, J., Pinto, R., Zanolini, A., Vermeersch, C., Walker, S., . . . Grantham-McGregor, S. (2014). Labor Market returns to an early childhood stimulation intervention in Jamaica.
H, A., & Williams, L. J. (2010). Principle Component Analysis. Wiley Interdisciplinary reviews: computational statistics, 2(4), 433-459.
Hart, M., Costanza, R., Posner, S., & Talberth, J. (2009). Beyond GDP: The Need for New Measures of Progress. The Pardee Papers.
Kapoor, A., & Duttaa, A. (2019, August Wednesday). India's female literacy has gone up but still 22% points behind world average; Education among young women rising. FirstPost.
Kapoor, M., Kapoor, A., & Krylova, P. (2017). 2017 Social Progress Index. Social Progress Imperative.
Marwaha, P. (2017, January 7). Times of India Blog. Retrieved from Times of India: https://timesofindia.indiatimes.com/blogs/toi-edit-page/bridge-gaps-in-childrens-schemes-with-adequate-financing-they-are-the-future-and-39-of-the-indian-population/
(2018). Progress for Every Child in the SDG Era. UNICEF.
Stern, S., Porter, M. E., & Green, M. (2017). Social Progress Index 2017. Social Progres Imperative.
SyamRoy, B. (2016). India's Journey Towards Sustainable Population. Springer International Publishing.
UNICEF. (2013, July 16). UNICEF. Retrieved from UNICEF: https://www.unicef.org/earlychildhood/index_69851.html
(2018). Youth Progress Imperative. Deloitte.
Fleurbaey, M. and D. Blanchet. Beyond GDP: Measuring Welfare and Assessing Sustainability, Oxford University Press, 2013.
Tavakol, M., & Dennick, R. (2011). Making sense of Cronbach's alpha. International journal of medical education, 2, 53.
Vyas, S., & Kumaranayake, L. (2006). Constructing socio-economic status indices: how to use principal components analysis. Health policy and planning, 21(6), 459-468.
Williams, B., Onsman, A., & Brown, T. (2010). Exploratory factor analysis: A five-step guide for novices. Australasian Journal of Paramedicine, 8(3).
Yong, A. G., & Pearce, S. (2013). A beginner’s guide to factor analysis: Focusing on exploratory factor analysis. Tutorials in quantitative methods for psychology, 9(2), 79-94.

Child Progress Index | 130
Appen
dix
1: D
istr
ict
Wis
e
Sco
res
on C
hil
d P
rogre
ss, i
ts
dim
en
sion
s an
d c
ompon
en
ts
DIS
TRIC
TSN
utri
tion
&
Basi
c M
edi-
cal C
are
Wat
er &
Sa
nita
tion
Shel
ter
Pers
onal
Se
curi
tyBa
sic
Hum
an
Nee
ds
Acce
ss to
Ba
sic
Know
l-ed
ge
Acce
ss to
In
form
atio
n &
Com
mun
i-ca
tion
Hea
lth &
W
elln
ess
Envi
ronm
en-
tal Q
ualit
y
Foun
da-
tions
of
Wel
l-Bei
ng
Pers
onal
fr
eedo
m &
Ch
oice
Pers
on-
al R
ight
sIn
clus
ion
Acce
ss to
Q
ualit
y Ed
ucat
ion
Opp
ortu
nity
Agra
73.3
51.5
58.2
71.4
63.6
3658
.969
.870
.758
.960
.159
.422
30.3
43
Alig
arh
63.6
4955
.638
.351
.737
.242
.661
.159
.850
.262
53.1
10.9
45.7
42.9
Alla
haba
d54
.538
.346
.182
.155
.280
.445
.853
.246
56.4
76.5
32.5
30.5
56.4
49
Ambe
dkar
N
agar
64.9
29.8
39.5
98.4
58.2
66.1
20.9
51.5
35.3
43.5
80.9
51.2
24.6
30.3
46.7
Aura
iya
54.8
29.5
36.8
54.9
4462
.226
.130
.650
.642
.476
.939
.216
33.3
41.4
Azam
garh
68.1
25.3
51.1
90.5
58.8
57.9
3068
.238
.548
.680
.150
.627
.229
.546
.9
Bagh
pat
85.4
52.3
84.5
81.1
75.9
71.1
33.5
62.9
63.9
57.8
92.1
60.8
10.9
4652
.5
Bahr
aich
2026
.711
.474
.533
.139
.719
.841
.421
.830
.727
.221
.70
44.1
23.2
Balli
a66
.731
.745
.280
.356
5726
.174
.834
.848
.266
.643
.547
.726
.346
Balr
ampu
r24
.127
.224
.758
.433
.619
.516
.351
.224
.227
.835
.221
.23.
413
.718
.4
Band
a57
.317
.546
.962
.946
.251
.616
.954
.149
.743
.183
.851
.419
.323
.744
.5
Bara
Ban
ki41
2624
.179
.142
.653
.719
.370
.737
.445
.365
.345
.614
.434
.239
.9
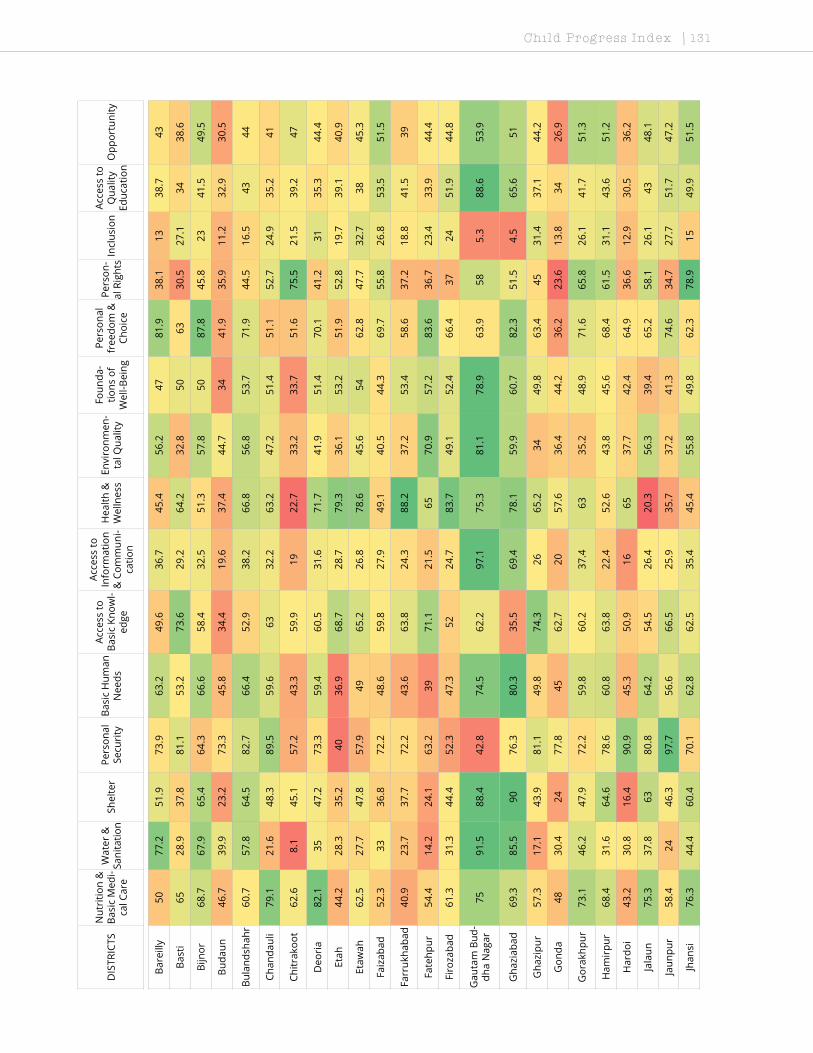
Child Progress Index | 131
Bare
illy
5077
.251
.973
.963
.249
.636
.745
.456
.247
81.9
38.1
1338
.743
Bast
i65
28.9
37.8
81.1
53.2
73.6
29.2
64.2
32.8
5063
30.5
27.1
3438
.6
Bijn
or68
.767
.965
.464
.366
.658
.432
.551
.357
.850
87.8
45.8
2341
.549
.5
Buda
un46
.739
.923
.273
.345
.834
.419
.637
.444
.734
41.9
35.9
11.2
32.9
30.5
Bula
ndsh
ahr
60.7
57.8
64.5
82.7
66.4
52.9
38.2
66.8
56.8
53.7
71.9
44.5
16.5
4344
Chan
daul
i79
.121
.648
.389
.559
.663
32.2
63.2
47.2
51.4
51.1
52.7
24.9
35.2
41
Chitr
akoo
t62
.68.
145
.157
.243
.359
.919
22.7
33.2
33.7
51.6
75.5
21.5
39.2
47
Deo
ria
82.1
3547
.273
.359
.460
.531
.671
.741
.951
.470
.141
.231
35.3
44.4
Etah
44.2
28.3
35.2
4036
.968
.728
.779
.336
.153
.251
.952
.819
.739
.140
.9
Etaw
ah62
.527
.747
.857
.949
65.2
26.8
78.6
45.6
5462
.847
.732
.738
45.3
Faiz
abad
52.3
3336
.872
.248
.659
.827
.949
.140
.544
.369
.755
.826
.853
.551
.5
Farr
ukha
bad
40.9
23.7
37.7
72.2
43.6
63.8
24.3
88.2
37.2
53.4
58.6
37.2
18.8
41.5
39
Fate
hpur
54.4
14.2
24.1
63.2
3971
.121
.565
70.9
57.2
83.6
36.7
23.4
33.9
44.4
Firo
zaba
d61
.331
.344
.452
.347
.352
24.7
83.7
49.1
52.4
66.4
3724
51.9
44.8
Gau
tam
Bud
-dh
a N
agar
7591
.588
.442
.874
.562
.297
.175
.381
.178
.963
.958
5.3
88.6
53.9
Gha
ziab
ad69
.385
.590
76.3
80.3
35.5
69.4
78.1
59.9
60.7
82.3
51.5
4.5
65.6
51
Gha
zipu
r57
.317
.143
.981
.149
.874
.326
65.2
3449
.863
.445
31.4
37.1
44.2
Gon
da48
30.4
2477
.845
62.7
2057
.636
.444
.236
.223
.613
.834
26.9
Gor
akhp
ur73
.146
.247
.972
.259
.860
.237
.463
35.2
48.9
71.6
65.8
26.1
41.7
51.3
Ham
irpu
r68
.431
.664
.678
.660
.863
.822
.452
.643
.845
.668
.461
.531
.143
.651
.2
Har
doi
43.2
30.8
16.4
90.9
45.3
50.9
1665
37.7
42.4
64.9
36.6
12.9
30.5
36.2
Jala
un75
.337
.863
80.8
64.2
54.5
26.4
20.3
56.3
39.4
65.2
58.1
26.1
4348
.1
Jaun
pur
58.4
2446
.397
.756
.666
.525
.935
.737
.241
.374
.634
.727
.751
.747
.2
Jhan
si76
.344
.460
.470
.162
.862
.535
.445
.455
.849
.862
.378
.915
49.9
51.5
DIS
TRIC
TSN
utri
tion
&
Basi
c M
edi-
cal C
are
Wat
er &
Sa
nita
tion
Shel
ter
Pers
onal
Se
curi
tyBa
sic
Hum
an
Nee
ds
Acce
ss to
Ba
sic
Know
l-ed
ge
Acce
ss to
In
form
atio
n &
Com
mun
i-ca
tion
Hea
lth &
W
elln
ess
Envi
ronm
en-
tal Q
ualit
y
Foun
da-
tions
of
Wel
l-Bei
ng
Pers
onal
fr
eedo
m &
Ch
oice
Pers
on-
al R
ight
sIn
clus
ion
Acce
ss to
Q
ualit
y Ed
ucat
ion
Opp
ortu
nity

Child Progress Index | 132
Jyot
iba
Phul
e N
agar
63.1
61.8
55.5
68.4
62.2
65.7
24.2
44.7
52.7
46.8
7856
.322
.247
.751
Kann
auj
51.1
17.1
33.6
53.8
38.9
75.7
18.5
78.9
34.4
51.9
67.8
33.7
25.9
35.4
40.7
Kanp
ur
Deh
at67
.620
24.2
93.6
51.3
64.5
16.7
64.1
31.1
44.1
70.6
59.9
28.2
25.9
46.1
Kanp
ur
Nag
ar81
.166
52.3
76.4
6966
.649
.741
.474
.158
85.9
45.3
1343
.747
Kans
hira
m
Nag
ar36
.739
27.6
66.5
42.4
61.6
18.8
79.8
35.7
4960
.645
.613
.841
.740
.4
Kaus
ham
bi45
.64.
426
.378
.438
.749
.317
.428
.440
.433
.972
.438
.335
.444
.147
.5
Kher
i44
.335
16.8
71.1
41.8
52.6
16.6
62.8
3942
.848
.525
.224
.638
.534
.2
Kush
inag
ar59
.833
.828
.980
.350
.759
.612
.868
.321
.440
.559
.157
.918
.340
.944
.1
Lalit
pur
65.8
7.9
4487
.651
.369
.810
.221
.324
.431
.435
.278
.544
.735
48.3
Luck
now
77.3
89.7
56.6
69.8
73.3
6859
35.5
46.3
52.2
8355
.64.
441
.646
.2
Mah
amay
a N
agar
69.3
32.5
54.8
34.3
47.7
59.3
30.2
8042
52.9
53.8
46.5
15.7
31.6
36.9
Mah
oba
65.8
1451
.952
.946
.168
.517
48.1
25.2
39.7
57.7
67.2
81.1
29.5
58.9
Mah
rajg
anj
67.6
34.4
33.8
80.8
54.1
6816
.456
.932
.643
.558
.761
.913
.643
.744
.4
Mai
npur
i50
28.7
3984
.850
.664
23.8
83.1
45.5
54.1
66.1
41.9
25.5
37.1
42.7
Mat
hura
54.8
45.1
61.5
76.6
59.5
58.2
39.5
83.1
55.3
5944
.159
.511
.934
37.4
Mau
61.2
29.6
51.9
7855
.247
.325
.462
43.6
44.6
77.7
52.7
41.6
36.9
52.2
Mee
rut
73.8
87.9
82.3
53.4
74.3
4155
.661
.870
.157
.189
.252
13.5
50.8
51.4
Mir
zapu
r60
.914
44.4
92.2
52.9
51.6
34.6
44.2
36.6
41.7
60.2
46.9
21.8
39.2
42
Mor
adab
ad50
.868
.954
.877
.463
37.3
20.6
47.9
66.6
43.1
88.8
47.6
17.1
41.6
48.8
Muz
affar
-na
gar
65.8
6374
.377
7032
.138
.951
.861
.546
.186
.246
.912
.236
.945
.6
Pilib
hit
64.6
52.2
37.2
63.7
54.4
54.5
1541
46.3
39.2
79.6
48.8
18.9
5.3
38.1
DIS
TRIC
TSN
utri
tion
&
Basi
c M
edi-
cal C
are
Wat
er &
Sa
nita
tion
Shel
ter
Pers
onal
Se
curi
tyBa
sic
Hum
an
Nee
ds
Acce
ss to
Ba
sic
Know
l-ed
ge
Acce
ss to
In
form
atio
n &
Com
mun
i-ca
tion
Hea
lth &
W
elln
ess
Envi
ronm
en-
tal Q
ualit
y
Foun
da-
tions
of
Wel
l-Bei
ng
Pers
onal
fr
eedo
m &
Ch
oice
Pers
on-
al R
ight
sIn
clus
ion
Acce
ss to
Q
ualit
y Ed
ucat
ion
Opp
ortu
nity

Child Progress Index | 133
Prat
apga
rh68
.117
.441
.688
.353
.966
.322
.450
37.6
44.1
82.8
4817
.321
.742
.4
Rae
Bare
li71
.217
.830
.779
.949
.931
.725
.945
.848
.538
75.2
4926
.225
.644
Ram
pur
59.7
69.9
56.5
74.9
65.2
52.1
23.5
42.7
48.5
41.7
87.9
55.1
1047
.250
.1
Saha
ranp
ur61
.762
.969
.482
.469
.169
.427
.955
.847
.850
.292
.754
.718
.851
.154
.3
Sant
Kab
ir
Nag
ar57
.433
36.9
85.2
53.1
64.1
24.7
62.6
16.1
41.9
61.6
42.9
24.8
24.5
38.5
Sant
Rav
idas
N
agar
60.5
15.4
46.3
82.7
51.2
6033
.138
.938
.742
.764
.649
.526
.439
.445
Shah
jaha
n-pu
r52
.848
.526
.750
.744
.750
.821
.627
.745
.936
.561
.327
18.3
31.2
34.5
Shra
was
ti24
.129
12.4
90.2
38.9
42.5
1055
26.5
33.5
15.1
276.
424
.618
.3
Sidd
hart
h-na
gar
38.5
31.9
3887
.549
50.4
11.2
5038
.237
.444
.527
.217
.122
.827
.9
Sita
pur
39.4
28.5
7.8
69.5
36.3
53.5
16.2
50.3
2736
.849
.931
.919
36.5
34.3
Sonb
hadr
a54
.416
.435
.978
46.2
67.7
33.2
45.9
31.3
44.5
5152
.315
.620
.934
.9
Sulta
npur
63.9
22.7
40.3
90.1
54.3
49.6
35.4
5442
45.3
69.8
37.8
32.1
36.2
44
Unn
ao56
.221
21.5
55.7
38.6
6520
.477
.931
.148
.672
.254
.316
.641
.646
.1
Vara
nasi
77.8
60.5
6178
.769
.569
.552
.447
.149
.254
.667
.854
.623
.359
.551
.3
DIS
TRIC
TSN
utri
tion
&
Basi
c M
edi-
cal C
are
Wat
er &
Sa
nita
tion
Shel
ter
Pers
onal
Se
curi
tyBa
sic
Hum
an
Nee
ds
Acce
ss to
Ba
sic
Know
l-ed
ge
Acce
ss to
In
form
atio
n &
Com
mun
i-ca
tion
Hea
lth &
W
elln
ess
Envi
ronm
en-
tal Q
ualit
y
Foun
da-
tions
of
Wel
l-Bei
ng
Pers
onal
fr
eedo
m &
Ch
oice
Pers
on-
al R
ight
sIn
clus
ion
Acce
ss to
Q
ualit
y Ed
ucat
ion
Opp
ortu
nity


Institute for Competitiveness, India is the Indian knot in the global network of the Institute for Strategy and Competitiveness at Harvard Business School.
Institute for Competitiveness, India is an international initiative centered in India, dedicated to enlarging and purposeful disseminating of the body of
research and knowledge on competition and strategy, as pioneered over the last 25 years by Professor Michael Porter of the Institute for Strategy and
Competitiveness at Harvard Business School. Institute for Competitiveness, India conducts & supports indigenous research; offers academic & executive courses; provides advisory services to the Corporate & the Governments and
organises events. The institute studies competition and its implications for company strategy; the competitiveness of nations, regions & cities and thus generate guidelines for businesses and those in governance; and suggests &
provides solutions for socio-economic problems.
The Institute for CompetitivenessU24/8, U-24 Road, U Block, DLF Phase 3, Sector 24, Gurugram, Haryana 122022
[email protected] | www.competitiveness.in