childhood obesity and asthma in the consolidated … asthma in the consolidated school district of...
TRANSCRIPT

Childhood Obesity and Asthma in the Consolidated School District of New Britain, Connecticut
2014-15
New Britain Health Department

Funding for this study was provided by:
The Connecticut Department of Public Health Preventative Health Block Grant
The data was provided by: Jeff Prokop
Chief Information Officer Consolidated School District of New Britain 860-832-4690 Francine Truglio, MSN, APRN
Nursing Supervisor New Britain Health Department 88 Prospect Street New Britain, Ct 06051 Phone- (860) 826-3466 Fax- (860) 826-2687
The data analyses and report was prepared by: Center for Public Health and Health Policy at UConn Health
Dorothy B. Wakefield, MS, PStat®
Biostatistician [email protected] Erin Havens, MPA, MPH
Planning Specialist Eric Horan, JD, MPA
Research Assistant III
The Center for Public Health and Health Policy, a research and programmatic center founded in 2004, integrates public health knowledge across the University of Connecticut campuses and leads initiatives in public health research, health policy research, health data analysis, health information technology, community engagement, service learning, and selected referral services. UConn Health Center for Public Health and Health Policy 263 Farmington Avenue, MC 6030 Farmington, Connecticut 06030-6030 http://publichealth.uconn.edu © July 2015, University of Connecticut

Table of Contents
Summary of Key Findings ....................................................................................................................1 Background .........................................................................................................................................2 Methods ...............................................................................................................................................2 Analyses ..............................................................................................................................................3 Table 1. Cohorts of Children ........................................................................................................................ 4 Table 2. Number of children in data files by grade and year ....................................................................... 4 Figure 1. 2014/15 Data ................................................................................................................................. 5 Demographics .....................................................................................................................................6 Table 3. Demographics Data for children in the combined databases 2014/2015 ...................................... 6 Table 4. Additional Demographics for Children in PowerSchool Database 2014/2015 .............................. 7 Educational Services, Testing, and Attendance ...................................................................................8 Table 5. School-related data for children in PowerSchool database 2014/2015 ........................................ 8 Body Mass Index and Weight Classifications .......................................................................................8 Figure 2a. Overall Weight Classification of New Britain Children Compared to CDC Guidelines ................... 9 Figure 2b. Percent New Britain Children Overweight/Obese Compared to United States Population ....... 9 Table 6. Demographics by Weight Status 2014/2015 ............................................................................... 10 Weight Classification by Grade .......................................................................................................... 11 Figure 3a. Weight Classification by Grade ................................................................................................ 11 Figure 3b. Percent Overweight and Obese by Grade ............................................................................... 11 Figure 3c. Percent Overweight and Obese by School ............................................................................... 12 Table 7. Weight Classification by School 2014/2015 ................................................................................ 12 Ethnic Differences in Weight Classification ........................................................................................ 13 Figure 4. Weight Classification by Ethnicity ............................................................................................... 13 Weight and School Performance ....................................................................................................... 13 Table 8. School Performance by Weight Status 2014/2015 ...................................................................... 14 Longitudinal Analysis ......................................................................................................................... 14 Cohort Analyses ........................................................................................................................... 14 Table 9. Weight Status Over Time by Cohort ............................................................................................ 15 Table 10. Percent Overweight/Obese by Gender in Cohort F ................................................................... 15 Figure 5. Weight Status over Time by Cohort ........................................................................................... 16 Historical Analyses ............................................................................................................................ 17 Table 11. Historical Weight Status by Grade ............................................................................................. 17 Table 12. Percent Overweight/Obese by Gender and Grade ................................................................... 18 Asthma .............................................................................................................................................. 18 Figure 6. Percent of Children with Asthma by Grade ................................................................................. 18 Figure 7. Lunch Cost Distribution by Asthma ............................................................................................ 19 Table 13. Demographics and School Performance by Asthma 2014/15 ................................................... 19 Asthma by Ethnicity and Gender ................................................................................................. 21 Figure 8. Percent with Asthma by Gender and Ethnicity ......................................................................... 21 Asthma and Weight ...................................................................................................................... 21 Figure 9. Asthma by Weight Classification ................................................................................................ 21 Asthma and School Performance ................................................................................................. 22 Figure 10. Reading, Math and Language RIT Percentiles by Asthma ....................................................... 22 Figure 11. Attendance Status by Asthma ................................................................................................... 22 Conclusions .............................................................................................................................. 23 References ........................................................................................................................................ 24

1
Summary of Key Findings
The Consolidated School District of New Britain extracted 2014/2015 data from the PowerSchool database for 3,973 students in grades Pre-K 3 and 4, kindergarten, and 2nd, 3rd, 6th and 9th grade. New Britain Health Department nurses also extracted health data from Health Assessment Records for 536 children attending 2 large preschools that are not part of the PowerSchool database. Demographic data and weight and asthma status were available for all 4,509 students, while school performance and attendance information was also available for the 3,973 students in the PowerSchool database. Analyses of these data found:
Demographics
▪ 59% of students are Hispanic/Latino ethnicity ▪ English is the primary language for 65% of students ▪ 75% of students are eligible for free/reduced cost lunch ▪ Chronic absentee rate is 21%, but as high as 46% among 9th graders
Obesity
▪ 37% of students are overweight or obese ▪ The percent of obese students increases with age ▪ Percent of overweight/obesity is highest among Hispanic/Latino and White students ▪ Obese children scored significantly lower on standardized test scores for language (Language RIT) than
children in other weight categories ▪ Weight is not related to school attendance ▪ Longitudinal data suggests that the number of obese children is increasing while the number of
overweight children remains high, but fairly constant
Asthma
▪ 26% of New Britain school children have physician-confirmed asthma ▪ Asthma prevalence increases with age and by 6th grade almost 40% of students have asthma ▪ Asthma prevalence is highest among Hispanic/Latino students, and higher among girls than boys ▪ Overweight/obese students are more likely to have asthma ▪ Students with asthma have lower test scores ▪ Fewer children with asthma had “good” attendance, largely because more children with asthma were
“approaching chronic absenteeism” Although both childhood obesity and asthma are national problems, New Britain surpasses national percentages of both. The proportion of obese children in New Britain is almost five times as many as expected according to CDC guidelines, and is highest among Hispanic/Latino children. Asthma prevalence is also very high among New Britain children, and is related to childhood obesity as well as school performance and attendance. Asthma control should be addressed to increase attendance and test performance among children with asthma. Longitudinal data shows that the proportion of obese children appears to be increasing while the proportion of overweight children remains fairly constant. More years of data will be needed to determine if these changes are trends or simply random variation in the groups of children.
2
Background
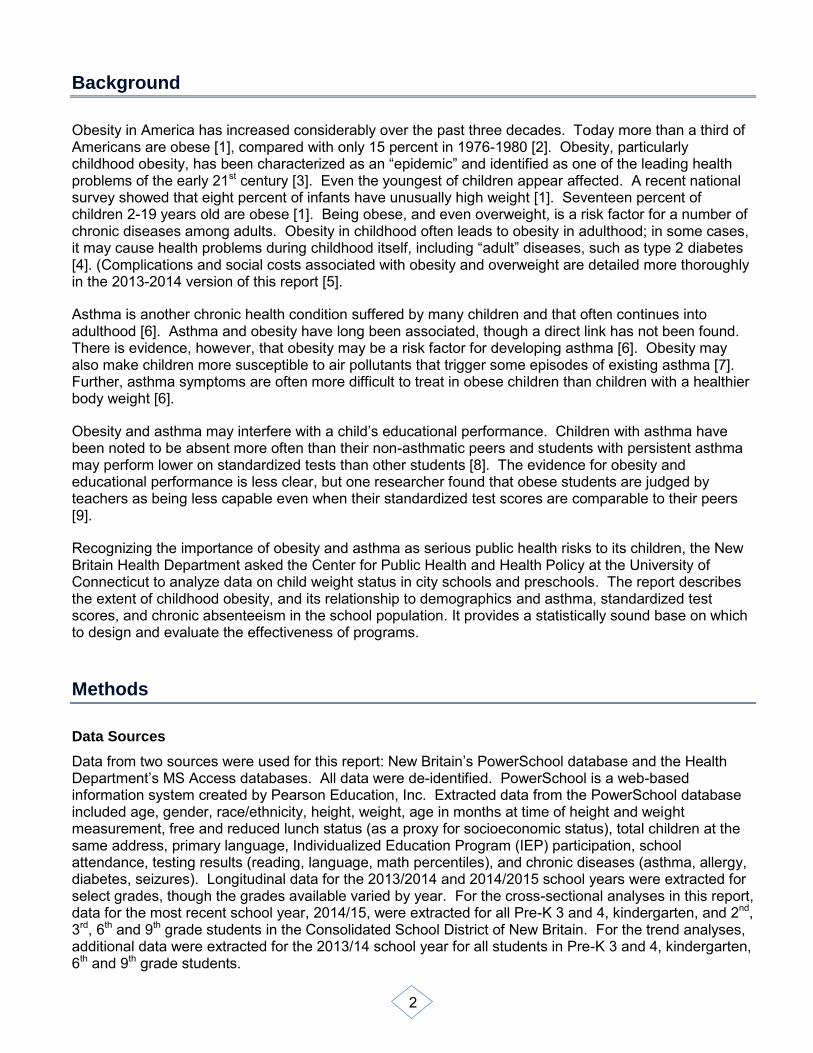
Obesity in America has increased considerably over the past three decades. Today more than a third of Americans are obese [1], compared with only 15 percent in 1976-1980 [2]. Obesity, particularly childhood obesity, has been characterized as an “epidemic” and identified as one of the leading health problems of the early 21st century [3]. Even the youngest of children appear affected. A recent national survey showed that eight percent of infants have unusually high weight [1]. Seventeen percent of children 2-19 years old are obese [1]. Being obese, and even overweight, is a risk factor for a number of chronic diseases among adults. Obesity in childhood often leads to obesity in adulthood; in some cases, it may cause health problems during childhood itself, including “adult” diseases, such as type 2 diabetes [4]. (Complications and social costs associated with obesity and overweight are detailed more thoroughly in the 2013-2014 version of this report [5].
Asthma is another chronic health condition suffered by many children and that often continues into adulthood [6]. Asthma and obesity have long been associated, though a direct link has not been found. There is evidence, however, that obesity may be a risk factor for developing asthma [6]. Obesity may also make children more susceptible to air pollutants that trigger some episodes of existing asthma [7]. Further, asthma symptoms are often more difficult to treat in obese children than children with a healthier body weight [6].
Obesity and asthma may interfere with a child’s educational performance. Children with asthma have been noted to be absent more often than their non-asthmatic peers and students with persistent asthma may perform lower on standardized tests than other students [8]. The evidence for obesity and educational performance is less clear, but one researcher found that obese students are judged by teachers as being less capable even when their standardized test scores are comparable to their peers [9].
Recognizing the importance of obesity and asthma as serious public health risks to its children, the New Britain Health Department asked the Center for Public Health and Health Policy at the University of Connecticut to analyze data on child weight status in city schools and preschools. The report describes the extent of childhood obesity, and its relationship to demographics and asthma, standardized test scores, and chronic absenteeism in the school population. It provides a statistically sound base on which to design and evaluate the effectiveness of programs.
Methods
Data Sources
Data from two sources were used for this report: New Britain’s PowerSchool database and the Health Department’s MS Access databases. All data were de-identified. PowerSchool is a web-based information system created by Pearson Education, Inc. Extracted data from the PowerSchool database included age, gender, race/ethnicity, height, weight, age in months at time of height and weight measurement, free and reduced lunch status (as a proxy for socioeconomic status), total children at the same address, primary language, Individualized Education Program (IEP) participation, school attendance, testing results (reading, language, math percentiles), and chronic diseases (asthma, allergy, diabetes, seizures). Longitudinal data for the 2013/2014 and 2014/2015 school years were extracted for select grades, though the grades available varied by year. For the cross-sectional analyses in this report, data for the most recent school year, 2014/15, were extracted for all Pre-K 3 and 4, kindergarten, and 2nd, 3rd, 6th and 9th grade students in the Consolidated School District of New Britain. For the trend analyses, additional data were extracted for the 2013/14 school year for all students in Pre-K 3 and 4, kindergarten, 6th and 9th grade students.

3
The PowerSchool data was supplemented with the New Britain Health Department’s MS Access databases. For 2013/14 and 2014/15, these Access databases include Health Assessment Records for two large preschools only: the Human Resource Agency’s Head Start and the YWCA’s preschool program, both of which are outside of the Consolidated School District of New Britain. Analyses also included data from the MS Access databases for school year 2011/12 which had data for kindergarten, 6th and 9th grades, and the database for school year 2012/13 which had data for Pre-K 3, Pre-K 4, kindergarten, 6th and 9th grades. The data extracted for this report from the Health Department’s databases included: date of birth, sex, grade, race, ethnicity, health insurance status, dental insurance status, asthma status, diabetes status, height, and weight.
Analyses
Cross-sectional analyses
Using data from the combined sources, the 2014/15 school year demographics, weight status, and chronic conditions, primarily asthma and allergies, were examined. Data is summarized by grade and by weight category. Body mass index (BMI) and BMI percentiles were calculated for each student using SAS programs downloaded from the Centers for Disease Control and Prevention (CDC) website. BMI percentiles are obtained by plotting BMI on the CDC BMI-for-age growth charts. The BMI percentile indicates the relative position of the child's BMI number among children of the same sex and age. Students were classified obese, overweight, healthy weight, or underweight as indicated by the CDC.
The analyses that incorporate 2014/2015 school year data from the PowerSchool database and the Health Department’s MS Access database included a combined sample size of 4,509 children with BMI percentiles. This includes the final analytic sample from PowerSchool consisting of 3,973 children and another 536 preschool children from the 2014/2015 data provided by the Health Department as shown in Figure 1. PowerSchool data for 4,152 children was provided, but 179 were excluded from the analyses (n=3,973). Reasons for exclusion were: missing necessary information for calculation of the BMI percentile (age in months at physical exam, sex, height, weight), ‘Biologically Implausible Values’ as determined by the CDC software, date of the physical exam was prior to 8/1/2013, and for several reasons related to age. Following CDC guidelines, BMI was not calculated for children younger than two years of age. In addition, values were excluded for children whose age was more than a year different from typical age for children in that grade. For example, the typical age for a child in kindergarten is 5 years old, so ages older than 6 or less than 4 were excluded. Analyses of BMI and asthma data used the combined datasets (4,509 children), while all other analyses are based on the 3,973 children from the PowerSchool database. Longitudinal Analyses of Weight Status
In addition to the 2014/15 data used above, data was available from three prior years (2011/12, 2012/13, 2013/14). Data was combined from all databases for a total of 13,138 records and used to examine cohort weight status and historical trends over time. It is important to note that data is de-identified and individual students are not followed over the years. Rather, there are cohorts of children that were followed or there are multiple years of data on weight status of children in select grades. As an example, for the cohorts shown in Table 1, Cohort A consists of all children (for whom there was BMI data) who were in Pre-K 3 in 2012/13. This cohort was examined for the next two consecutive years using the 2013/14 data for Pre-K 4 children and 2014/15 data for children in kindergarten. Because the data are de-identified, it is impossible to know how many children appear in both years of data; however, it is expected that many of the children are in all three. BMI classification was examined for the six cohorts of children with more than a single year of data.

4
A second longitudinal analysis examined historical trends for select grades beginning with the 2011/2012 through the 2014/2015 school year. Data was available for Pre-K 3, Pre-K 4, kindergarten, and 6th and 9th grade. Preschool data was not available for 2011/2012. Analyses included four years of data for kindergarten, 6th and 9th graders (2011/12 – 2014/15) and three years of data for children in Pre-K 3 and 4. Unlike the cohort analysis, different children are in each year of data. Table 2 shows the number of children with available data by grade for historical comparisons.
Table 2. Number of children in data files by grade and year
Year Total # of
children Pre-K 3 Pre-K 4 Kindergarten 2nd
Grade 3rd
Grade 6th
Grade 9th
Grade
2011/12 2,036
827
669 540
2012/13 3,204 523 599 908
589 585
2013/14 3,389 584 818 902
620 465
2014/15 4,509 479 538 800 776 700 573 643
Total 13,138 1,586 1,955 3,437 776 700 2,451 2,233
Table 1. Cohorts of Children
Cohort Year # of Children Grade
A 2012/13 523 P3
2013/14 818 P4
2014/15 800 K
B 2013/14 584 P3
2014/15 538 P4
C 2012/13 599 P4
2013/14 902 K
D 2012/13 908 K
2014/15 776 2
E 2011/12 827 K
2014/15 700 3
F 2011/12 669 6
2014/15 643 9

5
Figure 1. 2014/15 Data
19 Missing Height and/or Weight;
2 other data errors
71 Implausible Data
87 excluded due to age 543
from other Preschools
7 Implausible Data
4,152 from PowerSchool
4,131 with Physical Exam dates
3,973 with a BMI Percentile
4,509 for Analysis
536 with BMI
Percentile

6
Demographics 2014-2015
Age, gender, race and ethnicity of the full sample of 4,509 children overall and by grade are shown in Table 3. Average ages for each grade are as expected given the inclusion criteria stated above. Males and females are fairly evenly split in the sample, overall and within each grade. Hispanic/Latino children account for almost 60% of the children, with similar percentages of White (19.6%) and Black (16.0%) students in the system. The proportion of Hispanic/Latino and White children increased in the grades after preschool. The highest proportion of Black students was in the preschool grades.
Table 3. Demographics Data for children in the combined databases 2014/2015
Overall Pre-K 3 Pre-K 4 Kindergarten
2nd Grade
3rd Grade
6th Grade
9th Grade
Sample Size, n (%) 4,509 479
(10.6) 538
(11.9) 800
(17.7) 776
(17.2) 700
(15.5) 573
(12.7) 643
(14.3)
Age Years, mean (SD) 7.9
(3.6) 3.4
(0.5) 4.5
(0.4) 4.8
(0.5) 7.9
(0.4) 8.9
(0.4) 11.1 (0.5)
14.4 (0.6)
Gender, n (%) Female 2,206
(48.9) 233
(48.6) 248
(46.1) 410
(51.3) 390
(50.3) 335
(47.9) 275
(48.0) 315
(49.0) Male 2303
(51.1) 246
(51.4) 290
(53.9) 390
(48.7) 386
(49.7) 365
(52.1) 298
(52.0) 328
(51.0) Ethnicity, n (%)
Asian/Pacific Islander 158 (3.5)
22 (4.6)
27 (5.0)
21 (2.6)
37 (4.8)
21 (3.0)
14 (2.4)
16 (2.5)
Black, non-Hispanic 719 (16.0)
100 (20.9)
96 (17.8)
133 (16.6)
107 (13.8)
93 (13.3)
79 (13.8)
111 (17.3)
Hispanic/Latino 2,675 (59.3)
253 (52.8)
315 (58.6)
479 (59.9)
460 (59.3)
420 (60.0)
365 (63.7)
383 (59.6)
Other 45 (1.0)
15 (3.1)
10 (1.9)
6 (0.8)
3 (0.4)
5 (0.7)
2 (0.4)
4 (0.6)
White, non-Hispanic 884 (19.6)
85 (17.8)
90 (16.7)
146 (18.3)
169 (21.8)
158 (22.6)
113 (19.7)
123 (19.1)
Missing 28 (0.6)
4 (0.8)
0 (0.0)
15 (1.9)
0 (0.0)
3 (0.4)
0 (0.0)
6 (0.9)
Additional demographics in Table 4 show that most of the 3,973 children in the PowerSchool database speak English as their primary language, and were the only child listed at their address. Three quarters of the students were eligible for free or reduced-cost lunch, indicating that New Britain’s children often live in low-resource households. The PowerSchool data represent between 77% and 92% of all students in the Consolidated School District of New Britain in the grades studied.

7
Table 4. Additional Demographics for Children in PowerSchool Database 2014/2015
Overall Pre-K 3 Pre-K 4 Kindergarten 2nd
Grade 3rd
Grade 6th
Grade 9th
Grade p
Sample Size, n (%) 3,973
190 (4.8)
291 (7.3)
800 (20.1)
776 (19.5)
700 (17.6)
573 (14.4)
643 (16.2)
Percent of Official Enrollment 79.2% 87.9% 89.2% 91.9% 88.8% 91.0% 76.6% Primary Language, n (%) <.0001
English 2,598 (65.4)
113 (59.5)
199 (68.4)
576 (72.0)
578 (74.5)
462 (66.0)
322 (56.2)
348 (54.1)
Spanish 1,000 (25.2)
47 (24.7)
57 (19.6)
152 (19.0)
132 (17.0)
165 (23.6)
200 (20.0)
247 (38.4)
Other 375 (9.4)
30 (15.8)
35 (12.0)
72 (9.0)
66 (8.5)
73 (10.4)
51 (8.9)
48 (7.5)
Lunch
<.0001
Free 3,037 (76.4)
131 (69.0)
196 (67.4)
618 (77.3)
585 (75.4)
542 (77.4)
463 (80.8)
502 (78.1)
Reduced 224 (5.6)
9 (4.7)
12 (4.1)
38 (4.7)
46 (5.9)
49 (7.0)
35 (6.1)
35 (5.4)
Full 712 (17.9)
50 (26.3)
83 (28.5)
144 (18.0)
145 (18.7)
109 (15.6)
75 (13.1)
106 (16.5)
Number of children in school system at address, n (%) <.0001
1 2,122 (53.4)
112 (59.0)
169 (58.1)
468 (58.5)
387 (49.9)
333 (47.6)
272 (47.5)
381 (59.3)
2 - 3 1,544 (38.9)
58 (30.5)
103 (35.4)
274 (34.3)
321 (41.4)
307 (43.9)
253 (44.2)
228 (35.5)
Educational Services, Testing, and Attendance
Table 5 describes the educational services received, test scores, and school attendance data from the PowerSchool database overall and by grade. Of the 3,973 students, 745 kindergarten, and 2nd, 3rd, 6th and 9th grade students (18.7%) received English Language Learner (ELL) services, while 601 students (15%) from all of the grades (including Pre-K) received special education. Standardized reading and math test scores/percentiles were available for children in kindergarten, and 2nd, 3rd, 6th and 9th grade. Language scores were unavailable for kindergarten students, but available for all other grades. Average percentiles for each grade are shown in Table 3. Scores were also classified as above or below the 50th percentile. One would expect half of the students to be above and half below the 50th percentile. However, only 33%, 25%, and 33% of children were above the 50th percentile in the reading, math, and language scores, respectively.

8
Table 5. School-related data for children in PowerSchool database 2014/2015
Overall Pre-K 3 Pre-K 4 Kindergarten 2nd
Grade 3rd
Grade 6th
Grade 9th
Grade p
Sample Size, n (%) 3,973
190 (4.8)
291 (7.3)
800 (20.1)
776 (19.5)
700 (17.6)
573 (14.4)
643 (16.2)
ELL Services
<.0001
Yes 745 (18.7) n/a n/a
120 (15.0)
173 (22.3)
161 (23.0)
125 (21.8)
166 (25.8)
No 3,228 (81.3) n/a n/a
680 (85.0)
603 (77.7)
539 (77.0)
448 (78.2)
477 (74.2)
Special Education <.0001
Yes 601 (15.1)
90 (47.4)
78 (26.8)
94 (11.7)
74 (9.5)
92 (13.1)
85 (14.8)
88 (13.7)
No 3,372 (84.9)
100 (52.6)
213 (73.2)
706 (88.3)
702 (90.5)
608 (86.9)
488 (85.2)
555 (86.3)
Reading RIT Percentile, mean (SD)
37.4 (27.8) n/a n/a
44.1 (28.7)
39.5 (28.0)
36.5 (26.7)
35.4 (26.4)
28.4 (26.6)
Math RIT Percentile, mean (SD)
32.3 (25.7) n/a n/a
42.6 (27.9)
33.4 (24.0)
31.9 (25.0)
25.1 (22.4)
24.4 (24.1)
Language RIT Percentile, mean (SD)
37.1 (28.1) n/a n/a n/a
42.0 (29.3)
40.7 (27.9)
34.6 (26.1)
28.7 (26.7)
Chronic Absenteeism (< = 90% attendance) <.0001
Yes 852 (21.4)
67 (35.3)
116 (39.9)
153 (19.1)
64 (8.2)
58 (8.3)
99 (17.3)
295 (46.0)
No 3,120 (78.6)
123 (64.7)
175 (60.1)
647 (80.9)
712 (91.8)
642 (91.7)
474 (82.7)
347 (54.1)
School attendance of 90% or lower is considered chronic absenteeism. Compared to the statewide chronic absentee rate of 10.7% [10], the rate among New Britain students was 21.4% -- almost double the statewide rate. The lowest rate of absenteeism was among the 2nd and 3rd graders at 8%, while the highest rate was among preschoolers and 9th graders. New Britain 9th graders had a rate of 46% chronic absenteeism, whereas the statewide rate for high school students is 15.4%. Although the chronic absentee rate was markedly lower among New Britain kindergarteners (19%) and 6th graders (17%), they were still higher than the statewide rates of 8.6% and 8.4%, respectively, for those grades.
Body Mass Index and Weight Classifications
BMI percentile indicates the relative position of the child's BMI adjusted for sex and age. The CDC has defined weight categories based on percentiles: Underweight (< 5th percentile), Healthy Weight (5th to < 85th percentile), Overweight (85th to < 95th percentile), and Obese (95th percentile and above). By definition of these categories, one would expect that 5% of children to be Underweight, 80% Healthy Weight, 10% Overweight, and 5% Obese.

9
Figure 2a. Overall Weight Classification of New Britain Children Compared to CDC Guidelines
The weight distribution among New Britain school children is very different compared to the CDC recommendations. In sharp contrast to the 15% expected according to CDC guidelines, 37.4% of New Britain children are overweight or obese (Figure 2a). There are 1.5 times (16% versus 10%) as many overweight and four times (21% versus 5%) as many obese children as CDC guidelines suggest. When compared to US rates of obesity, a higher proportion of New Britain children were overweight/obese at each of the three age groups compared (Figure 2b). Figure 2b. Percent New Britain Children Overweight/Obese Compared to United States Population
5%
80%
10%
5%
15%
CDC Guidelines
UnderweightHealthy WeightOverweightObese
4%
59%
16%
21%
37%
New Britain Overall
UnderweightHealthy WeightOverweightObese
0
10
20
30
40
50
2 - 5 years-old 6 - 11 years-old 12 - 19 years-old
Perc
en
t o
f C
hild
ren
O
verw
eig
ht/
Ob
ese
New Britain 2014-15 US - NHANES 2011-2012 Data

10
Table 6 shows weight status by the demographics of New Britain children. More girls were overweight/obese than boys (39.7% versus 35.2%). Almost half (47.7%) of the children with a documented allergy were overweight/obese compared to 38.6% of those without allergies. More children receiving free/reduced lunch were overweight/obese than those not receiving assistance (40% versus 35%); however, in multivariate regressions models that controlled for ethnicity, weight class was not associated with free/reduced lunch. Table 6. Demographics by Weight Status 2014/2015
Sample Size Underweight
(< 5th
percentile)
Healthy Weight (5th to
< 85th
percentile)
Overweight (85
th to
< 95th
percentile)
Obese (> = 95
th
percentile) p
Overall, n (%) 4509 158 (3.5) 2665 (59.1) 727 (16.1) 959 (21.3)
Grade, n (%) <0.0001
Pre-K 3 479 (10.6) 29 (6.1) 335 (69.9) 64 (13.4) 51 (10.6)
Pre-K 4 538 (11.9) 28 (5.2) 364 (67.7) 65 (12.1) 81 (15.1)
Kindergarten 800 (17.7) 25 (3.1) 461 (57.6) 124 (15.5) 190 (23.8)
2nd Grade 776 (17.2) 22 (2.8) 443 (57.1) 130 (16.8) 181 (23.3)
3rd Grade 700 (15.5) 22 (3.1) 416 (59.4) 108 (15.4) 154 (22)
6th Grade 573 (12.7) 20 (3.5) 293 (51.1) 110 (19.2) 150 (26.2)
9th Grade 643 (14.3) 12 (1.9) 353 (54.9) 126 (19.6) 152 (23.6)
Gender, n (%)
0.02
Female 2,206 (48.9) 69 (3.1) 1,262 (57.2) 399 (18.1) 476 (21.6)
Male 2,303 (51.1) 89 (3.9) 1,403 (60.9) 328 (14.2) 483 (21)
Ethnicity, n (%)* 0.0975
Asian/Pacific Islander 158 (3.5) 18 (11.4) 100 (63.3) 24 (15.2) 16 (10.1)
Black, non-Hispanic 719 (16.1) 30 (4.2) 440 (61.2) 108 (15) 141 (19.6)
Hispanic /Latino 2,675 (59.7) 78 (2.9) 1,547 (57.8) 441 (16.5) 609 (22.8)
Other 45 (1.0) 0 (0) 32 (71.1) 6 (13.3) 7 (15.6)
White, non-Hispanic 884 (19.7) 32 (3.6) 529 (59.8) 142 (16.1) 181 (20.5)
Asthma, n (%) <0.0001
Yes 1,313 (29.1) 37 (2.8) 689 (52.5) 229 (17.4) 358 (27.3)
No 3,195 (70.9) 121 (3.8) 1,975 (61.8) 498 (15.6) 601 (18.8)
Allergy, n (%)^
0.0039
Yes 172 (4.3) 3 (1.7) 87 (50.6) 29 (16.9) 53 (30.8)
No 3,801 (95.7) 129 (3.4) 2,205 (58) 632 (16.6) 835 (22) * 28 children not included due to missing ethnicity
^ Data from PowerSchool database only
11
Weight Classification by Grade and School
Figure 3a. Weight Classification by Grade
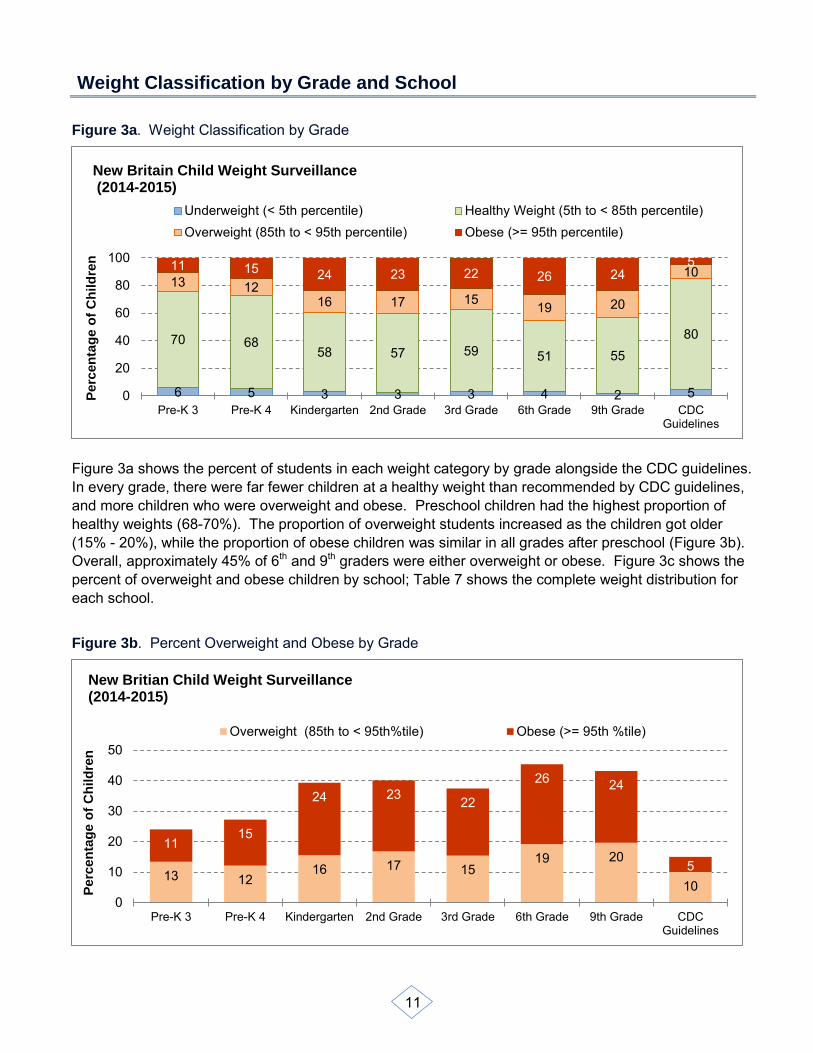
Figure 3a shows the percent of students in each weight category by grade alongside the CDC guidelines. In every grade, there were far fewer children at a healthy weight than recommended by CDC guidelines, and more children who were overweight and obese. Preschool children had the highest proportion of healthy weights (68-70%). The proportion of overweight students increased as the children got older (15% - 20%), while the proportion of obese children was similar in all grades after preschool (Figure 3b). Overall, approximately 45% of 6th and 9th graders were either overweight or obese. Figure 3c shows the percent of overweight and obese children by school; Table 7 shows the complete weight distribution for each school.
Figure 3b. Percent Overweight and Obese by Grade
6 5 3 3 3 4 2 5
70 68 58 57 59 51 55
80
13 12 16 17 15 19 20
10 11 15 24 23 22 26 24 5
0
20
40
60
80
100
Pre-K 3 Pre-K 4 Kindergarten 2nd Grade 3rd Grade 6th Grade 9th Grade CDCGuidelines
Perc
en
tag
e o
f C
hild
ren
New Britain Child Weight Surveillance (2014-2015)
Underweight (< 5th percentile) Healthy Weight (5th to < 85th percentile)Overweight (85th to < 95th percentile) Obese (>= 95th percentile)
13 12 16 17 15
19 20
10
11 15
24 23 22
26 24
5
0
10
20
30
40
50
Pre-K 3 Pre-K 4 Kindergarten 2nd Grade 3rd Grade 6th Grade 9th Grade CDCGuidelines
Perc
en
tag
e o
f C
hild
ren
New Britian Child Weight Surveillance (2014-2015)
Overweight (85th to < 95th%tile) Obese (>= 95th %tile)

12
Figure 3c. Percent Overweight and Obese by School
Table 7. Weight Classification by School 2014/2015
School # of Students Underweight Healthy Overweight Obese
Chamberlain Elementary School 256 4.3% 55.5% 14.8% 25.4%
Frank J. DiLoreto School 378 2.1% 52.9% 17.7% 27.2%
Gaffney Elementary School 359 4.5% 63.8% 14.5% 17.3%
HALS Academy 52 7.7% 53.8% 17.3% 21.2%
Human Resources Agency Head Start 360 4.4% 66.9% 13.9% 14.7%
Holmes Elementary School 231 6.5% 63.2% 12.1% 18.2%
Jefferson Elementary School 197 2% 56.9% 18.3% 22.8%
Lincoln Elementary School 370 3.8% 65.7% 13.2% 17.3%
New Britain High School 624 1.9% 54.3% 19.9% 23.9%
Northend Elementary School 123 4.1% 52.8% 19.5% 23.6%
Pulaski Middle School 208 3.8% 50% 19.7% 26.4%
Slade Middle School 235 2.6% 55.3% 19.6% 22.6%
Smalley Academy 339 3.5% 57.2% 17.7% 21.5%
Smith Elementary School 358 3.4% 59.8% 13.1% 23.7%
Vance Village School 221 2.3% 59.3% 17.6% 20.8%
YWCA 175 5.7% 75.4% 8.6% 10.3%
9%
18%
13%
18%
20%
20%
20%
20%
13%
18%
14%
12%
17%
15%
18%
15%
10%
21%
24%
22%
23%
26%
24%
24%
17%
23%
15%
18%
21%
17%
27%
25%
0% 10% 20% 30% 40% 50%
YWCAVance Village School
Smith Elementary SchoolSmalley Academy
Slade Middle SchoolPulaski Middle School
Northend Elementary SchoolNew Britain High School
Lincoln Elementary SchoolJefferson Elementary School
Human Resources Agency Head StartHolmes Elementary School
HALS AcademyGaffney Elementary School
Frank J. DiLoreto SchoolChamberlain Elementary School
Overweight Obese

13
Ethnic Differences in Weight Classification
Figure 4. Weight Classification by Ethnicity
Significantly fewer Asian/Pacific Islander children (25%) were overweight/obese when compared to Black (34.6%), Hispanic/Latino (39.3%) and White children (36.5%). Hispanic/Latino children were more likely to be overweight/obese than Black, but not White children (Figure 4). Among Hispanic/Latino students, those whose primary language was Spanish were just as likely to be overweight as those whose primary language was English.
Weight and School Performance
Table 8 shows test results by weight category. Reading and math test scores did not differ by weight category. In contrast, average language scores varied significantly by weight category, with obese children (average percentile, 34.7) scoring significantly lower than underweight (average percentile, 42.4), healthy weight (average percentile, 37.4), and overweight (average percentile, 38.6) children. There was no difference in the proportion of children scoring above the 50th percentile in the testing scores by weight. ELL Services, special education programs, and chronic absenteeism were not associated with weight classification.
11
63
15 10
4
61
15 20
3
58
17
23
4
60
16 21
0
10
20
30
40
50
60
70
Underweight Healthy Overweight Obese
Perc
en
t
Asian/Pacific Islander
Black, non-Hispanic
Hispanic/Latino
White, non-Hispanic

14
Table 8. School Performance by Weight Status 2014/2015
Sample Size
Underweight (< 5
th
percentile) Healthy Weight (5th to < 85
th percentile)
Overweight (85th to <
95th
percentile)
Obese (>= 95
th
percentile) p
Reading RIT Percentile, mean (SD) 3,355
41.1 (29.2)
37.5 (28.0)
38.6 (27.2)
35.9 (27.7) 0.1543
Math RIT Percentile, mean (SD) 3,387
34.7 (27.8)
32.6 (25.8)
32.5 (25.5)
31.0 (25.6) 0.354
Language RIT Percentile, mean (SD) 2,580
42.4 (30.0)
37.4 (28.0)
38.6 (28.3)
34.7 (28.0) 0.0379
Reading RIT, Percent above 50th percentile 3,355 38.8 33.6 35.4 31.0 0.1702
Math RIT, Percent above 50th percentile 3,387 27.8 25.9 25.0 23.7 0.1874
Language RIT, Percent above 50th percentile 2,580 37.5 33.0 36.2 29.7 0.1878
Longitudinal Analysis
The combined data from the Health Assessment Records and PowerSchool database provide an opportunity to track weight changes from several cohorts of children measured at 2 or 3 time points during the 2011/12 to 2014/15 school years, and to observe the variation in weight distributions of the different groups of children in a grade during the 2011/12 to 2014/15 school years.
Cohort Analyses
Six cohorts of children were examined to determine whether there are any changes in rates of obesity as students advance through the grades. Table 9 shows weight status over time for six cohorts, A-F. Three cohorts (A-C) show changes during the Preschool and kindergarten years. Cohorts D and E show changes in weight status from kindergarten to grades 2 and 3, respectively. Finally, Cohort F shows weight changes during adolescence, from grade 6 to 9.
15
Table 9. Weight Status Over Time by Cohort
Cohort Year # of Children Grade Underweight Healthy Overweight Obese p
A
2012/13 523 P3 4.2% 65.6% 15.5% 14.7%
0.0003 2013/14 818 P4 4.0% 59.0% 15.6% 21.3%
2014/15 800 K 3.1% 57.6% 15.5% 23.8%
B 2013/14 584 P3 4.1% 62.8% 15.9% 17.1%
0.06 2014/15 538 P4 5.2% 67.7% 12.1% 15.1%
C 2012/13 599 P4 4.7% 62.3% 16.4% 16.7%
0.05
2013/14 902 K 2.9% 60.5% 16.7% 19.8%
D 2012/13 908 K 3.2% 59.1% 17.7% 19.9%
0.14 2014/15 776 2 2.8% 57.1% 16.8% 23.3%
E 2011/12 827 K 3.7% 62.9% 16.0% 17.4%
0.03
2014/15 700 3 3.1% 59.4% 15.4% 22.0%
F 2011/12 669 6 1.5% 51.4% 18.7% 28.4%
0.06 2014/15 643 9 1.9% 54.9% 19.6% 23.6%
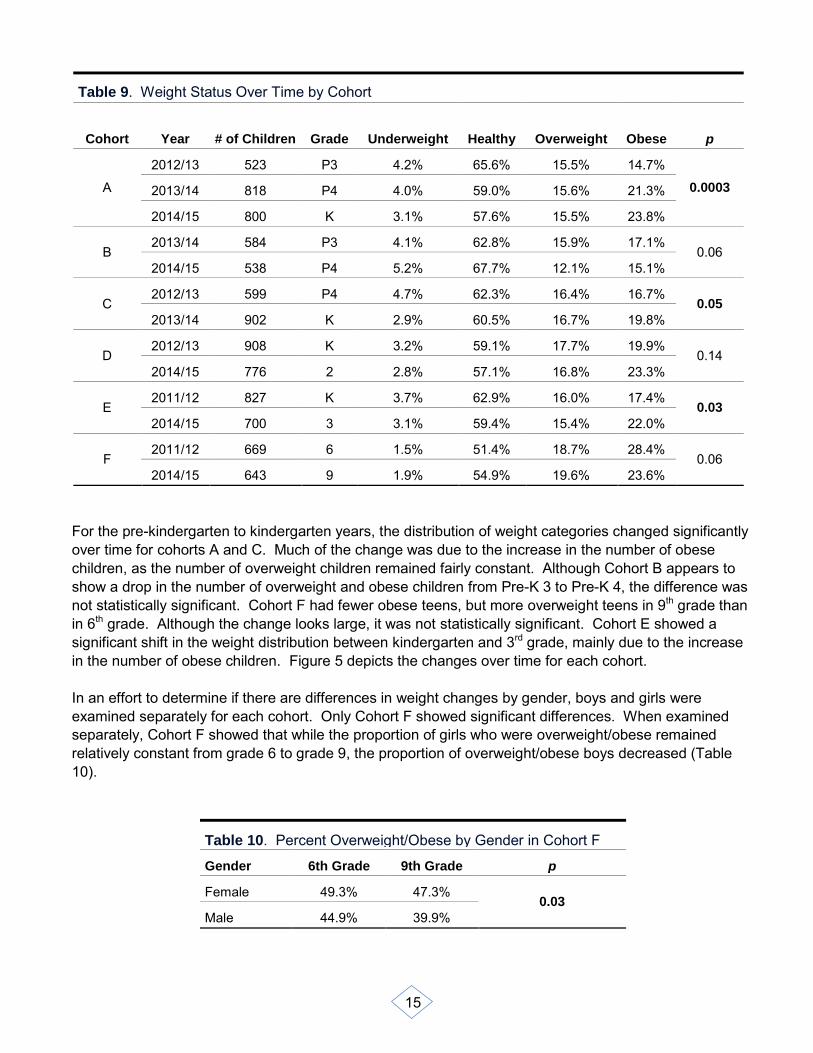
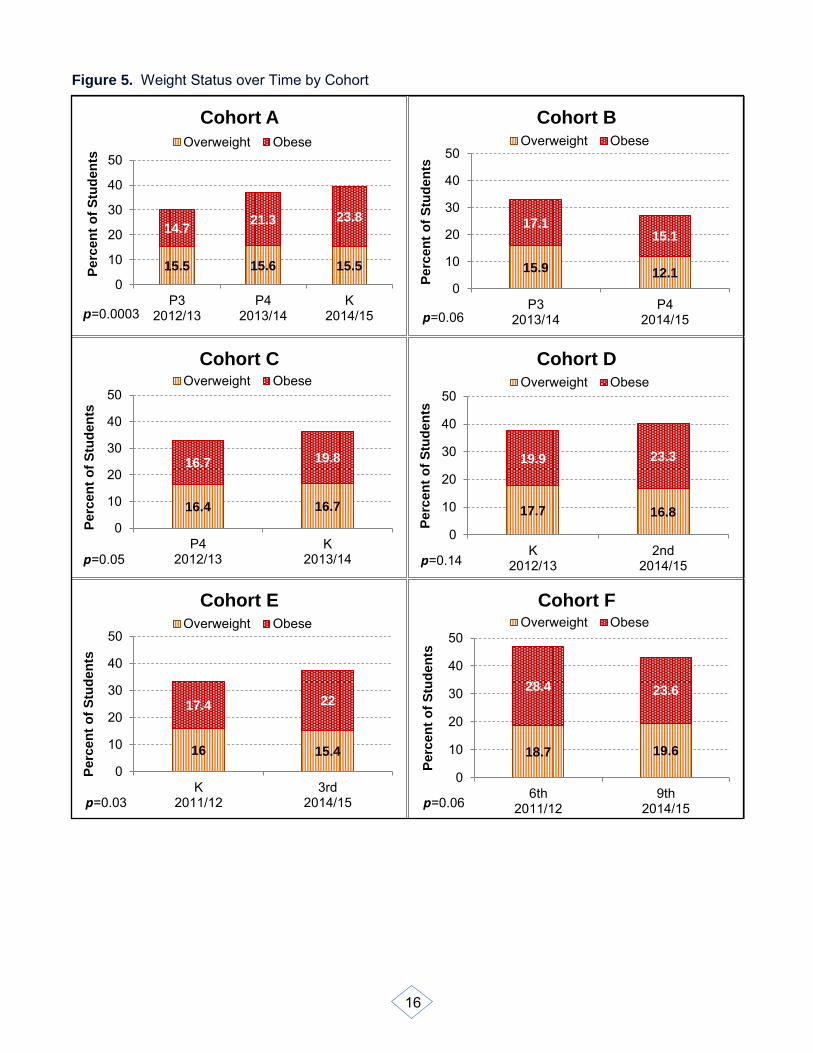
For the pre-kindergarten to kindergarten years, the distribution of weight categories changed significantly over time for cohorts A and C. Much of the change was due to the increase in the number of obese children, as the number of overweight children remained fairly constant. Although Cohort B appears to show a drop in the number of overweight and obese children from Pre-K 3 to Pre-K 4, the difference was not statistically significant. Cohort F had fewer obese teens, but more overweight teens in 9th grade than in 6th grade. Although the change looks large, it was not statistically significant. Cohort E showed a significant shift in the weight distribution between kindergarten and 3rd grade, mainly due to the increase in the number of obese children. Figure 5 depicts the changes over time for each cohort. In an effort to determine if there are differences in weight changes by gender, boys and girls were examined separately for each cohort. Only Cohort F showed significant differences. When examined separately, Cohort F showed that while the proportion of girls who were overweight/obese remained relatively constant from grade 6 to grade 9, the proportion of overweight/obese boys decreased (Table 10).
Table 10. Percent Overweight/Obese by Gender in Cohort F
Gender 6th Grade 9th Grade p
Female 49.3% 47.3% 0.03
Male 44.9% 39.9%
16
Figure 5. Weight Status over Time by Cohort
15.5 15.6 15.5
14.7 21.3 23.8
0
10
20
30
40
50
P32012/13
P42013/14
K2014/15
Perc
en
t o
f S
tud
en
ts
Cohort A
Overweight Obese
p=0.0003
15.9 12.1
17.1 15.1
0
10
20
30
40
50
P32013/14
P42014/15
Perc
en
t o
f S
tud
en
ts
Cohort B Overweight Obese
p=0.06
16.4 16.7
16.7 19.8
0
10
20
30
40
50
P42012/13
K2013/14
Perc
en
t o
f S
tud
en
ts
Cohort C Overweight Obese
p=0.05
17.7 16.8
19.9 23.3
0
10
20
30
40
50
K2012/13
2nd2014/15
Perc
en
t o
f S
tud
en
ts
Cohort D Overweight Obese
p=0.14
16 15.4
17.4 22
0
10
20
30
40
50
K2011/12
3rd2014/15
Perc
en
t o
f S
tud
en
ts
Cohort E Overweight Obese
p=0.03
18.7 19.6
28.4 23.6
0
10
20
30
40
50
6th2011/12
9th2014/15
Perc
en
t o
f S
tud
en
ts
Cohort F Overweight Obese
p=0.06

17
Historical Analyses
In addition to cohort analyses, historical trend analyses were conducted for each of several grades. This provides information on possible changes in obesity rates for particular grades over time. Table 11 shows the proportion of overweight/obese children overall by grade. The data represents different groups of children for each year and shows the year by year fluctuations in weight distributions of the children. The differences are significant for all grades except 9th grade. Kindergarten children seem to show a steady increase in obese children from 2011/2012 to 2013/2014. In contrast, the number of obese preschool children seems to increase in 2013/14 and then decrease in 2014/15. More years of data will be needed to determine if these are trends or simply random variation in the groups of children.
Table 11. Historical Weight Status by Grade
Grade Year # of Children Underweight Healthy Overweight Obese p
Pre-K 3
2012/13 523 4.2% 65.6% 15.5% 14.7%
0.0013 2013/14 584 4.1% 62.8% 15.9% 17.1%
2014/15 479 6.1% 69.9% 13.4% 10.7%
Pre-K 4
2012/13 599 4.7% 62.3% 16.4% 16.7%
0.001 2013/14 818 4.0% 59.0% 15.6% 21.3%
2014/15 538 5.2% 67.7% 12.1% 15.1%
Kindergarten
2011/12 827 3.8% 62.9% 16.0% 17.4%
0.024 2012/13 908 3.2% 59.1% 17.7% 19.9%
2013/14 902 2.9% 60.5% 16.7% 19.8%
2014/15 800 3.1% 57.6% 15.5% 23.8%
6th
2011/12 669 1.5% 51.4% 18.7% 28.4%
0.033 2012/13 589 2.4% 45.2% 20.4% 32.1%
2013/14 620 2.9% 51.9% 17.9% 27.3%
2014/15 573 3.5% 51.1% 19.2% 26.2%
9th
2011/12 540 1.9% 52.0% 20.6% 25.6%
0.7972 2012/13 585 2.1% 53.0% 20.3% 24.6%
2013/14 465 1.5% 56.6% 16.6% 25.4%
2014/15 643 1.9% 54.9% 19.6% 23.6%

18
As shown in Table 12, no significant differences were found when comparing the proportion of overweight/obese boys and girls. Table 12. Percent Overweight/Obese by Gender and Grade
Grade Gender 2011/12 2012/13 2013/14 2014/15 p
Pre-K 3 F 28.5% 32.3% 25.8% 0.76
Pre-K 3 M 32.2% 33.6% 22.4% Pre-K 4 F 31.6% 37.7% 28.2% 0.83
Pre-K 4 M 34.3% 36.1% 26.2% Kindergarten F 33.9% 37.5% 35.6% 43.4% 0.31
Kindergarten M 32.9% 37.8% 37.5% 34.9%
6th Grade F 49.3% 50.3% 46.3% 45.5% 0.73 6th Grade M 44.9% 54.6% 44.3% 45.3%
9th Grade F 44.7% 44.9% 42.8% 47.3% 0.36 9th Grade M 47.5% 45.0% 41.2% 39.3%
Asthma
Physician-confirmed asthma had been diagnosed in 29% of New Britain students in 2014/2015. This is two times as many as the statewide proportion of school-aged children with asthma [11]. Rates of asthma were significantly higher among children who were in Special Education, were eligible for free/reduced lunch (Figure 7), or had allergies (Table 13). In multivariate models that controlled for ethnicity, the rate of asthma was still higher among those receiving free/reduced lunch. Figures 6 - 9 show the distribution of asthma by grade, ethnicity, gender, and weight classification.
Figure 6. Percent of Children with Asthma by Grade
The proportion of children with asthma increased from 21% in Pre-K 3 to a high of 39% in 6th grade. There was a significant drop in asthma prevalence in the 9th grade students. Although the reason for this
21 24
28 28 32
39
30
0
10
20
30
40
50
Pre-K 3 Pre-K 4 Kindergarten 2nd Grade 3rd Grade 6th Grade 9th Grade
Perc
en
t w
ith
Asth
ma

19
is unknown, it is generally consistent with other observations of asthma rates in adolescence [12]. A decrease among 9th grade students was also seen in previous New Britain reports (2011/2012, 2012/2013, 2013/2014). The 2012 National Survey of Children’s Health shows the prevalence of asthma among Connecticut children is not different among 6-11 year olds and 12-17 year olds [11].
Figure 7. Lunch Cost Distribution by Asthma
Table 13. Demographics and School Performance by Asthma 2014/15
Asthma
Yes No P-Value
Overall 1,313 (29.1) 3,196 (70.9) Ethnicity, n (%)*
<0.0001
Asian/Pacific Islander 22 (13.9) 136 (86.1) Black, non-hispanic 195 (27.1) 524 (72.9) Hispanic/Latino 899 (33.6) 1,776 (66.4) Other 14 (31.1) 31 (68.9)
White, non-hispanic 176 (19.9) 708 (80.1)
Gender, n (%) <0.0001 Female 575 (26.1) 1,631 (73.9)
Male 738 (32.1) 1,565 (67.9)
Grade, n (%)
<0.0001 PreK-3 100 (20.9) 379 (79.1) PreK-4 128 (23.8) 410 (76.2) Kindergarten 227 (28.4) 573 (71.6) 2nd Grade 218 (28.1) 558 (71.9) 3rd Grade 223 (31.9) 477 (68.1) 6th Grade 223 (38.9) 350 (61.1)
9th Grade 194 (30.2) 449 (69.8)
84 73
5 6
12 21
0
20
40
60
80
100
Asthma No Asthma
Pe
rce
nt
Free lunch Reduced cost lunch Full cost lunch

20
Table 13. Demographics and School Performance by Asthma 2014/15
Asthma
Yes No P-Value
Primary Language, n (%) <0.0001 English 784 (30.2) 1,814 (69.8) Spanish 339 (33.9) 661 (66.1)
Other 62 (16.5) 313 (83.5) Special Education, n(%) 0.0073 Yes 207 (34.4) 394 (65.6)
No 978 (29.0) 2,394 (71.0) ELL Services
0.3194
Yes 211 (28.3) 534 (71.7)
No 974 (30.2) 2,254 (69.8)
Allergy <0.0001 Yes 84 (48.8) 88 (51.2)
No 1,101 (29.0) 2,700 (71.0) Lunch
<0.0001
Free 992 (32.7) 2,045 (67.3) Reduced 56 (25.0) 168 (75.0)
Full 137 (19.2) 575 (80.8)
Reading RIT Percentile, mean (SD) 33.8 (27.4) 39.1 (27.9) <0.0001
Math RIT Percentile, mean (SD) 29.1 (24.6) 33.7 (26.1) <0.0001
Language RIT Percentile, mean (SD) 33.7 (27.2) 38.7 (28.4) <0.0001
Chronic Absenteeism (<=90% attendance), n (%)
0.1300 Yes 272 (31.9) 580 (68.1)
No 913 (29.3) 2,207 (70.7) Attendance Status
0.0350
Good 492 (27.5) 1,296 (72.5) Approaching Chronic Absenteeism 421 (31.6) 911 (68.4) Chronic Absenteeism 189 (31.5) 412 (68.6)
Severely Chronic Absenteeism 83 (33.1) 168 (66.9)

21
Asthma by Ethnicity and Gender
Figure 8. Percent with Asthma by Gender and Ethnicity
More boys than girls had asthma (32% vs 26%), and the proportion of children with asthma was highest among Hispanic/Latino children (34%) and lowest among Asian/Pacific Island children (14%).
Asthma and Weight
Figure 9. Asthma by Weight Classification
Significantly more children with asthma were obese (27.3% vs. 18.8%) than children without asthma.
14
27
34
20
26
32
0
10
20
30
40
Asian/PacificIslander
Black, non-Hispanic
Hispanic/Latino White, non-Hispanic
Female Male
Perc
en
t w
ith
Asth
ma
3
53
17
27
4
62
16 19
0
10
20
30
40
50
60
70
Underweight Healthy Overweight Obese
Asthma No Asthma

22
Asthma and School Performance
Figures 10 and11 show the impact that asthma has on school performance and attendance.
Figure 10. Reading, Math and Language RIT Percentiles by Asthma
Average test scores for all three subjects (reading, math, language) were significantly lower among children with asthma, with fewer children scoring above the 50th percentiles. In multivariate models which controlled for gender, primary language and ethnicity, children with asthma still scored lower than children without asthma on all three tests.
Figure 11. Attendance Status by Asthma
Children with asthma had similar rates of chronic absenteeism as those with no asthma (23% vs 21%). When attendance status was examined by good, approaching chronic, chronic, and severely chronic absenteeism, there were fewer children with asthma who had good attendance. The difference was largely due to more children with asthma who were approaching chronic absenteeism.
34 29
34 39
34 39
0
10
20
30
40
50
Reading Math Language
Asthma No Asthma
42 36
16
7
47
33
15
6
0
10
20
30
40
50
Good Approaching ChronicAbsenteeism
Chronic Absenteeism Severely ChronicAbsenteeism
Asthma No Asthma

23
Conclusions
Although both childhood obesity and asthma are national problems, New Britain surpasses national percentages of both. The percentage of children aged 6 to 11 years in the United States who were obese was nearly 18% in 2012. Similarly, the percentage of adolescents aged 12 to 19 years who were obese was nearly 21% in 2012 [1] [13]. In 2014/15, rates of childhood obesity among students in the Consolidated School District of New Britain are even higher: 23% for 6 to 11 year olds and 25% among adolescents. These proportions of obese children in New Britain are almost five times as many as the expected 5% according to CDC guidelines. The rate is highest among Hispanic/Latino children. In 2012, 14% of children under the age of 18 years had been diagnosed with asthma [14]. In contrast, the asthma prevalence among New Britain children is twice as high at 29%. Asthma is related to childhood obesity as well as school performance and attendance. Asthma control should be addressed to decrease chronic absenteeism and increase test performance among children with asthma. Longitudinal data shows that the proportion of obese children appears to be increasing while the proportion of overweight children remains fairly constant. More years of data will be needed to determine if these changes are trends or simply random variation in the groups of children. Data used for this report are de-identified and it is not possible to track individuals over time. However, as data continues to be collected in the PowerSchool database, there will be more opportunities to follow individual children as their weight changes over time. This will enable school systems to develop and evaluate the effectiveness of interventions and prevention programs, as well as policy changes.

24
References
1. Ogden CL, Carroll MD, Kit BK, Flegal KM (2014). Prevalence of childhood and adult obesity in the United States, 2011-2012. JAMA, 311(8):806-814.
2. Ogden CL, and Carroll MD (2010). Prevalence of overweight, obesity, and extreme obesity among adults: United States, trends 1960-1962 through 2007-2008. National Center for Health Statistics, Centers for Disease Control and Prevention, Department of Health and Human Services, available at: http://www.cdc.gov/nchs/data/hestat/obesity_adult_07_08/obesity_adult_07_08.htm (accessed July 20, 2015).
3. World Health Organization (no date). Child overweight and obesity, global strategy on diet, physical activity and health, available at: http://www.who.int/dietphysicalactivity/childhood/en/ (accessed July 20, 2015).
4. Hannon TS, Goutham R, Arslanian SA (2005). Childhood obesity and type 2 diabetes mellitus. Pediatrics, 116(2): 473-480.
5. Center for Public Health and Health Policy (2014). Childhood obesity and asthma in the Consolidated School District of New Britain, Connecticut 2013-2014. University of Connecticut. (Prepared for the New Britain Health Department), available at: http://www.coalitionnbc.org/partners--agencies.html (accessed July 20, 2015).
6. Hampton T (2014). Studies probe links between childhood asthma and obesity. JAMA, 311(17): 1718-19.
7. Lu KD, Breysse PN, Diette GB, Curtin-Brosnan J, Aloe C, Williams DL, Peng RD, McCormack MC, Matsui EC (2013). Being overweight increases susceptibility to indoor pollutants among urban children with asthma. Journal of Allergy and Clinical Immunology, 131(4):1017-23.
8. Moonie S, Sterling DA, Figgs LW, Castro M (2008). The relationship between school absence, academic performance, and asthma status. Journal of School Health, 78(3):140-48.
9. Zavodny M (2013). Does weight affect children’s test scores and teacher assessments differently? Economics of Education Review, 34:135-145.
10. Public School Information System, June 2014 Collection, (www.sde.ct.gov/sde/lib/sde/pdf/deps/chronicabsenteeism/learningfromthedata_statepresentation.pdf) (accessed July 21, 2015).
11. National Survey of Children's Health. NSCH 2011/12. Data query from the Child and Adolescent Health Measurement Initiative, Data Resource Center for Child and Adolescent Health website. Retrieved on 7/8/2014 from www.childhealthdata.org.
12. Andersson M, Hedman L, Bjerg A, Forsberg B, Lundback B, Ronmark E (2013). Remission and persistence of asthma followed from 7 to 19 years of age. Pediatrics, 132(2):e435-e442.
13. National Center for Health Statistics. Health, United States, 2011: With Special Features on Socioeconomic Status and Health. Hyattsville, MD; U.S. Department of Health and Human Services; 2012.
14. Summary Health Statistics for US Children: National Health Interview Survey, 2012. U.S. Department of Health and Human Services;2013, Series 10, Number 258.