childhood obesity vicki cunningham march 2015. overview epidemiology health impact identification...
TRANSCRIPT

Childhood ObesityVicki Cunningham
March 2015

Overview
• Epidemiology
• Health impact
• Identification
• Management
• Case studies
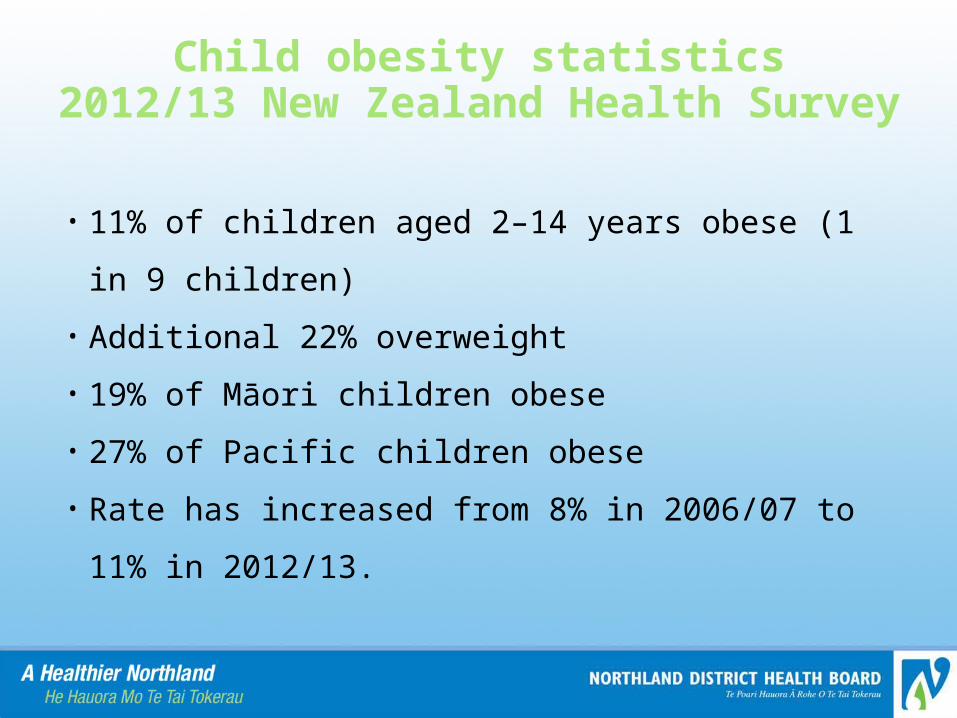
Child obesity statistics2012/13 New Zealand Health
Survey
• 11% of children aged 2–14 years obese (1 in 9 children)
• Additional 22% overweight
• 19% of Māori children obese
• 27% of Pacific children obese
• Rate has increased from 8% in 2006/07 to 11% in
2012/13.
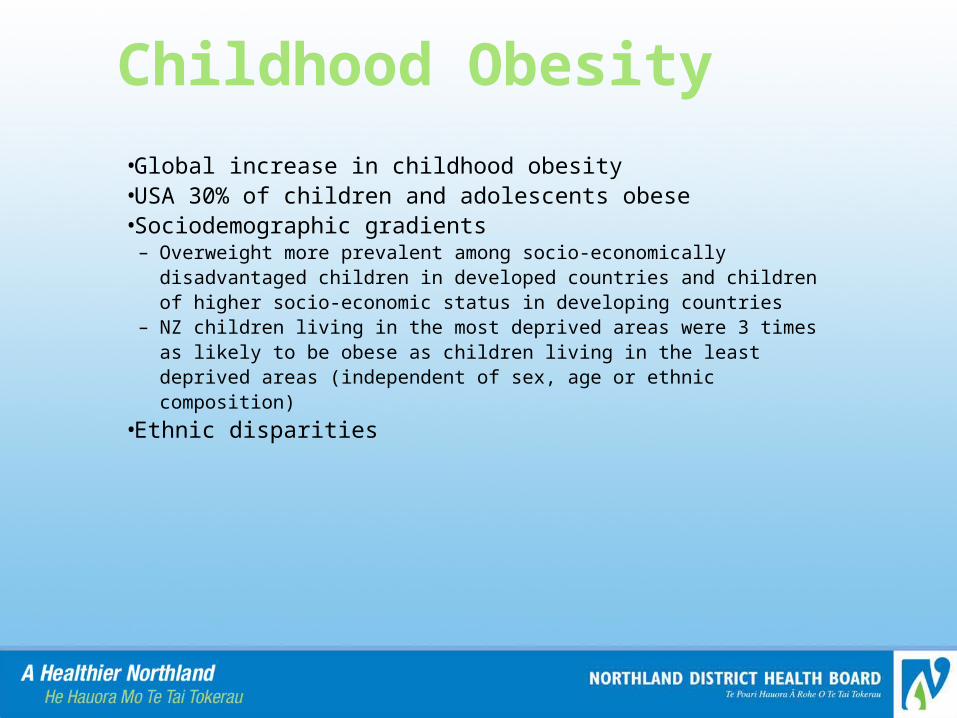
Childhood Obesity
•Global increase in childhood obesity•USA 30% of children and adolescents obese•Sociodemographic gradients
– Overweight more prevalent among socio-economically disadvantaged children in developed countries and children of higher socio-economic status in developing countries
– NZ children living in the most deprived areas were 3 times as likely to be obese as children living in the least deprived areas (independent of sex, age or ethnic composition)
•Ethnic disparities

Genetics of childhood obesity
• Genetic – higher concordance between monozygotic than dizygotic twins – high concordance in body fat in monozygotic twins raised apart
• Genetics do not explain rapid increase in obesity rates • High rates of parental obesity - probably due to genetics
and shared environment

Obesogenic environment• Cooking skills being lost
• Cheap calorie rich food and drink
• Takeaways
• Outside and physical play less
• Fewer natural occurrences for activity, now needs
planning
• Food advertising/marketing
• Screen time

Health Impact

Complications of childhood obesity
• “Puppy fat myth”, overweight is not harmless in children
• Childhood obesity effects both physical and psychosocial health
• Obese children and adolescents become obese adults
• Risks associated with adolescent obesity persist into adulthood (independent of adult BMI)

ComplicationsMetabolic
•Hyperlipidaemia•Hypertension•Insulin resistance and abnormal glucose tolerance •Poor pulmonary function •Asthma•Advanced growth and early maturity•Hepatic steatosis and cholelithiasis, •Low grade systemic inflammation, •Sleep apnoea, •Polycystic ovary disease•Orthopaedic complications eg SUFE, flat feet
Psychosocial
• isolation, • stigmatisation, • bullying• psychological problems eg
depression

Tracking
•Overweight children become overweight adolescents who become overweight adults•1/3 obese preschoolers become obese adults•½ obese school-age children become obese adults •1996 US cohort of adolescents
– 37% of obese (BMI>95th percentile) male and 51% of obese female were severely obese (BMI>40kg/m2) by 30 years of age, compared with <5% of normal-weight teenagers.
Serdula MK, Ivery D, Coates RJ, Freedman DS, Williamson DF, Byers T. Do obese children become obese adults? A review of the literature. Prev Med. 1993;22(2):167-77. The NS, Suchindran C, North KE, Popkin BM, Gordon-Larsen P. Association of adolescent obesity with risk of severe obesity in adulthood. JAMA. 2010;304(18):2042-7.

Georgia add campaign

Identification
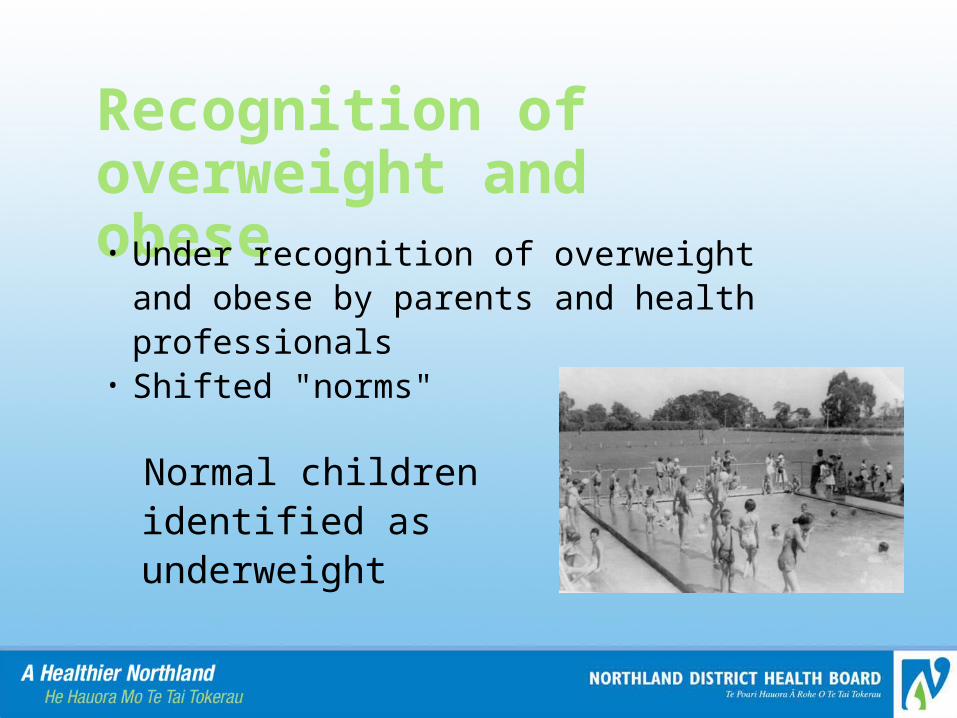
Recognition of overweight and obese• Under recognition of overweight and
obese by parents and health professionals
• Shifted "norms"
Normal children identified as underweight
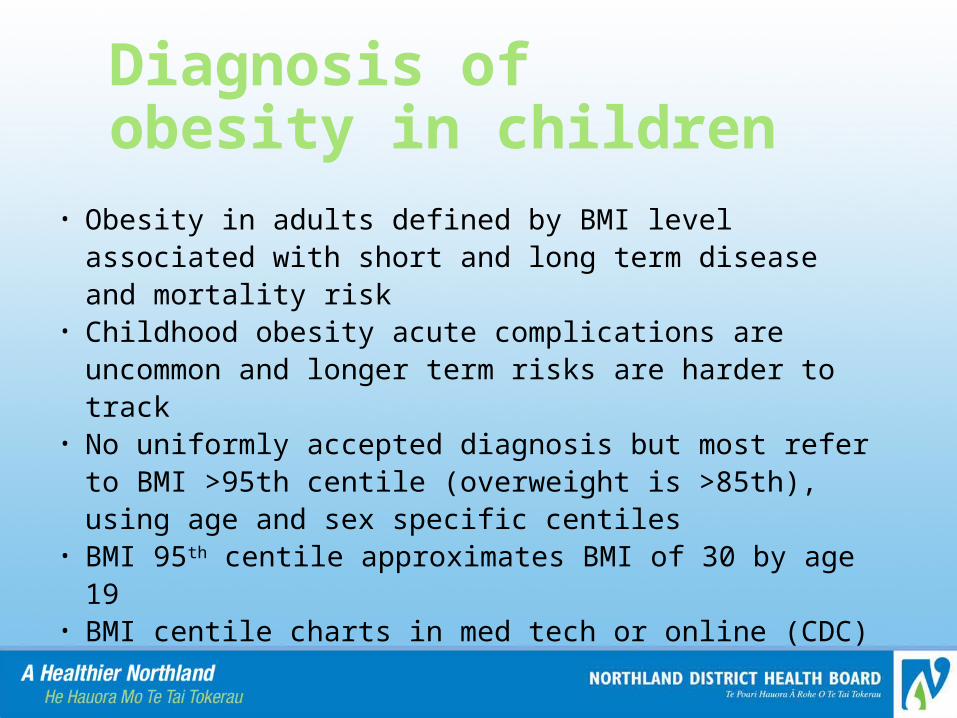
Diagnosis of obesity in children
• Obesity in adults defined by BMI level associated with short and long term disease and mortality risk
• Childhood obesity acute complications are uncommon and longer term risks are harder to track
• No uniformly accepted diagnosis but most refer to BMI >95th centile (overweight is >85th), using age and sex specific centiles
• BMI 95th centile approximates BMI of 30 by age 19 • BMI centile charts in med tech or online (CDC)

www.cdc.gov/growthcharts

Other measure of obesity or adiposity
•BMI SDS– Is the number of standard deviations from the mean– BMI SDS of 2 is equivalent to the 95th centile– Good to track over time
•Waist circumference•Waist to hip ratio•Percentage body fat
– Bioelectrical impedance– Skin fold thickness

Societal view of obesity• Stigma “Obesity is the result of weakness and poor self control”• Need to get away from blame, guilt and shame• Recognise that it’s NOT easy • Lots of factors and outside influences involved (influence of
friends and family, school, supermarkets, shops, TV and advertising, marketing, governmental policy, cost of food, technology use, sedentary lifestyles)
• Message – Some things you can control and some things you cant
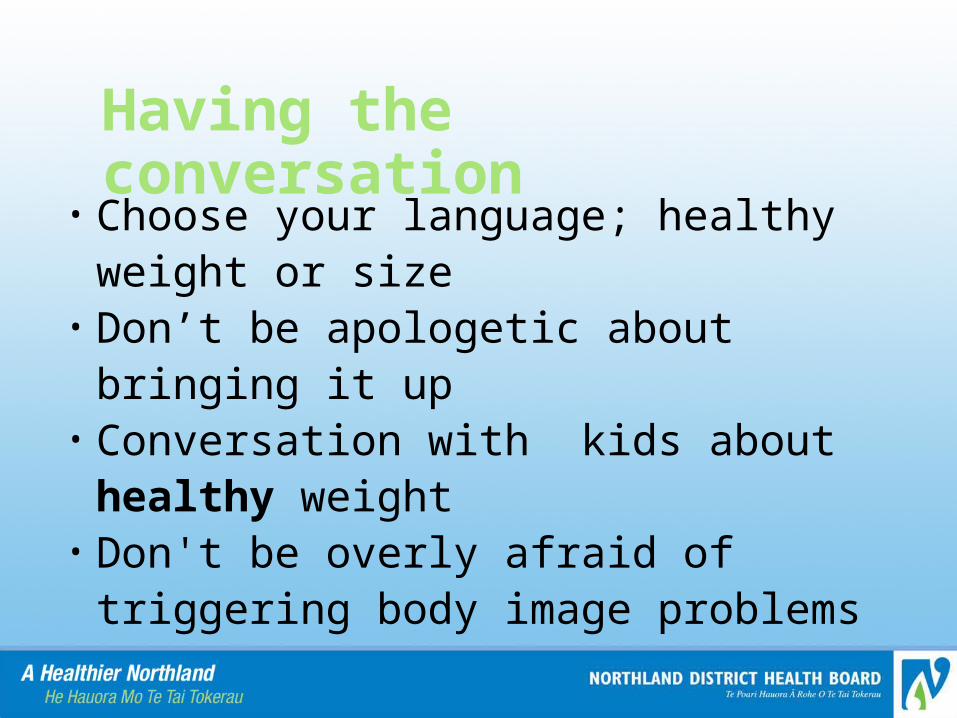
Having the conversation
• Choose your language; healthy weight or size
• Don’t be apologetic about bringing it up• Conversation with kids about healthy
weight • Don't be overly afraid of triggering body
image problems

Having the conversation
•“I’ve plotted weight adjusted for height here on the growth chart…. You can see that it’s above the healthy range for age…. Does that surprise you? …. Would you like to discuss it?
•Be aware of your own experiences/feelings regarding the subject

Management
Clinical Guidelines for Weight Management in New Zealand Children and Young People


FAB
•Food•Activity•Behaviour

FIGURE 2 Meta-analysis of studies comparing lifestyle intervention with no-treatment or wait-list controls.
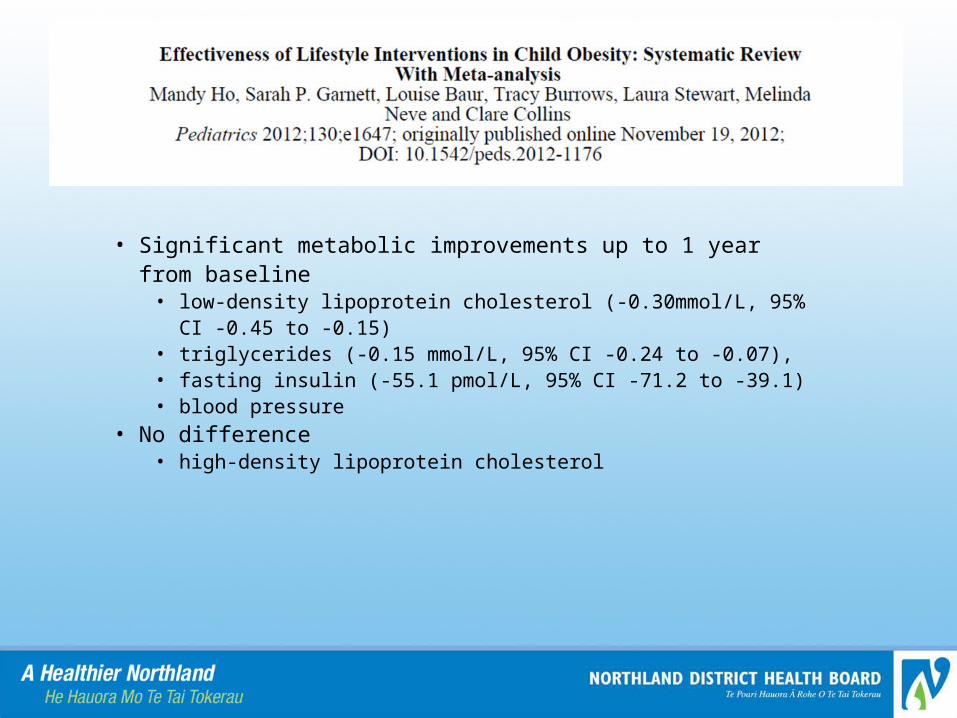
• Significant metabolic improvements up to 1 year from baseline
• low-density lipoprotein cholesterol (-0.30mmol/L, 95% CI -0.45 to -0.15)
• triglycerides (-0.15 mmol/L, 95% CI -0.24 to -0.07), • fasting insulin (-55.1 pmol/L, 95% CI -71.2 to -39.1)• blood pressure
• No difference • high-density lipoprotein cholesterol
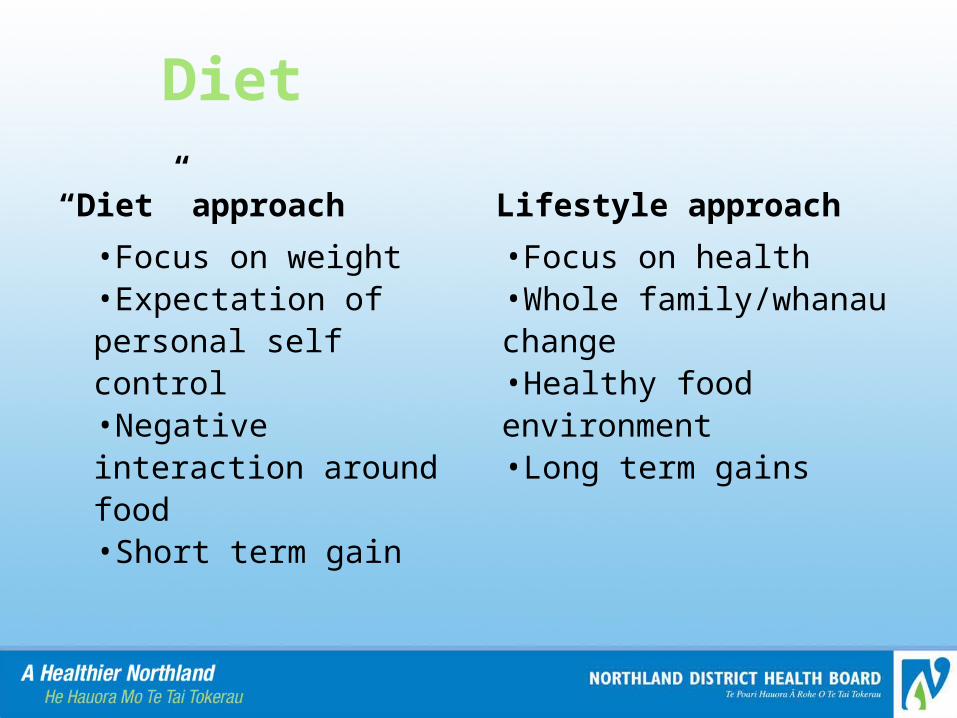
Diet
“Diet” approach
•Focus on weight•Expectation of personal self control•Negative interaction around food•Short term gain
Lifestyle approach
•Focus on health•Whole family/whanau change•Healthy food environment•Long term gains

Medication or surgery
•Metformin•Orlistat•Bariatric surgery

NDHB Healthy Lifestyle Programme

HLP principals & structure
•Family based•Committed families
(contract)•Group sessions•Small Sustainable
Steps•Goal setting (SMART)•Mentoring•Peer support
•Initial assessment•8 weekly group session
– Afternoon tea– Presentations– Group work– Active games
•Follow up– 3,6,9,12 mths
•Optional– Active Families– Health camp

HLP Content
•Food– Eat breakfast– Drink water (or milk)– 5+ a day, colours– Portion sizes– Reduce takeaways– NIP reading– School lunch from
home– Eat as a family – Modelling of a
healthy snack
•Activity– Increase activity– Decrease screen
time– Pedometers
•Behaviour– What influences our
eating– Food advertising– Parental modelling– Barriers to change

Our ‘Super 7’1. Choose water as your main drink
2. Eat breakfast each day
3. Eat together once a day as a family (TV OFF)
4. Be active/play outside for 1 hour every day
5. Limit screen time to less than 2 hours a day
6. Develop a sleep routine
7. Monitor progress

Other common topics
• Food availability - shopping and pantry • Manage "sometimes foods"• Mindful eating• Portion size• Parenting support• Parental role modelling
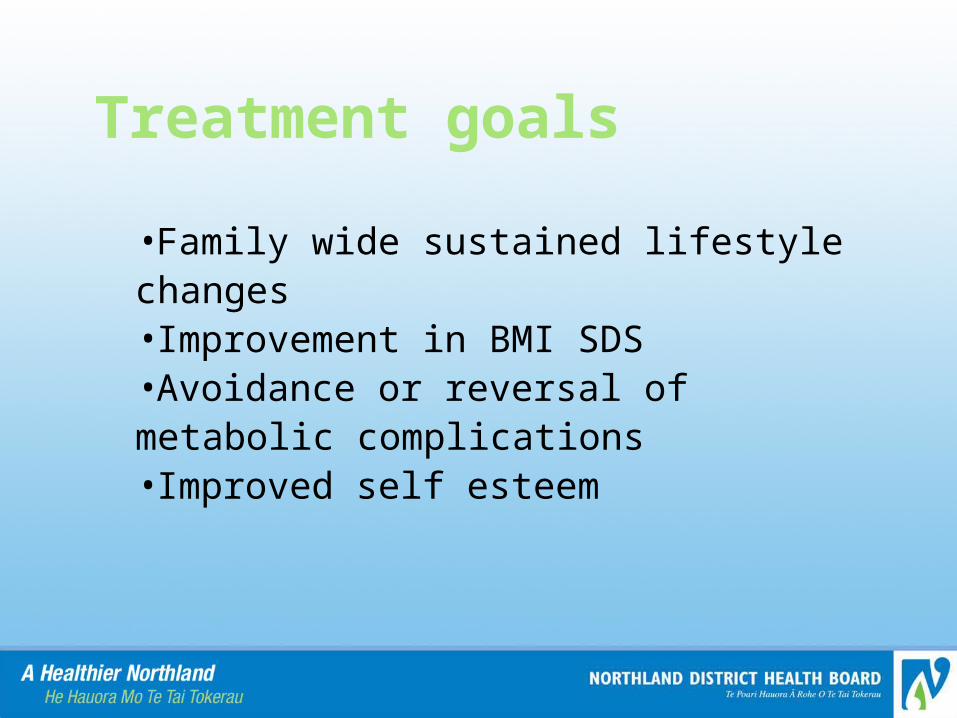
Treatment goals
•Family wide sustained lifestyle changes•Improvement in BMI SDS•Avoidance or reversal of metabolic complications•Improved self esteem
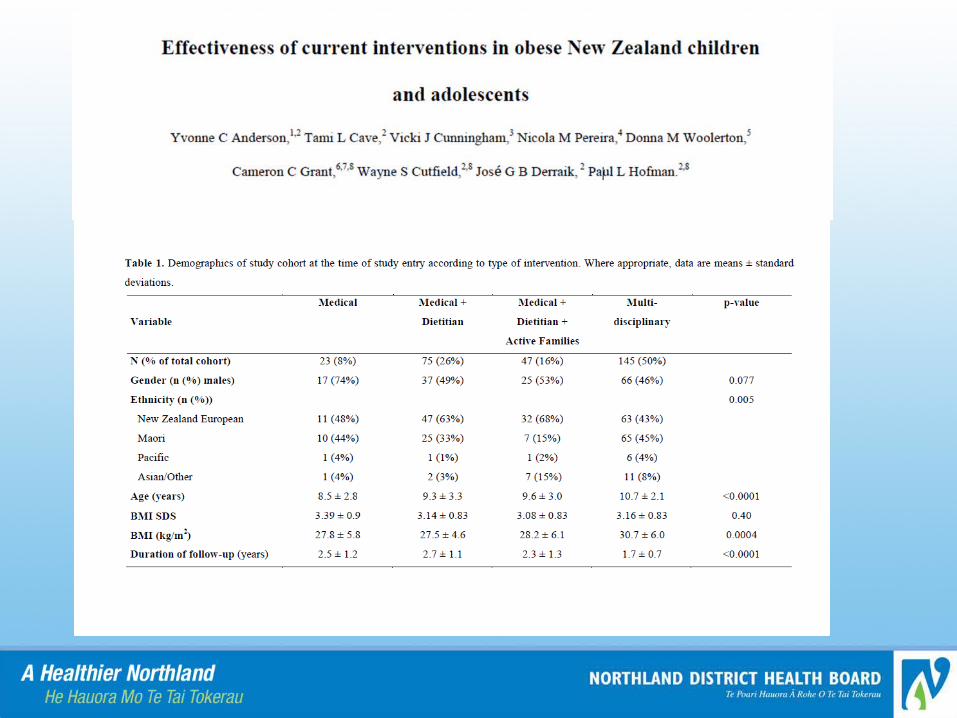


The fact that a multi-disciplinary intervention programme did not outperform medical follow-up may be explained by two factors. Firstly the multi-disciplinary cohort were older, and increasing age was found to lead to a smaller BMI SDS reduction overall. The BMI SDS was greater at entry, which may have also impacted on the degree of BMI SDS reduction. Almost half of the multi-disciplinary cohort was either Maori or Pacific peoples, which may have contributed to outcomes given the known differences in BMI between Maori and NZ European cohorts with increasing age.
It is important to note that the multi-disciplinary intervention programme included in this study was as successful as those seen in recent meta-analyses of intervention programmes.
Case Study
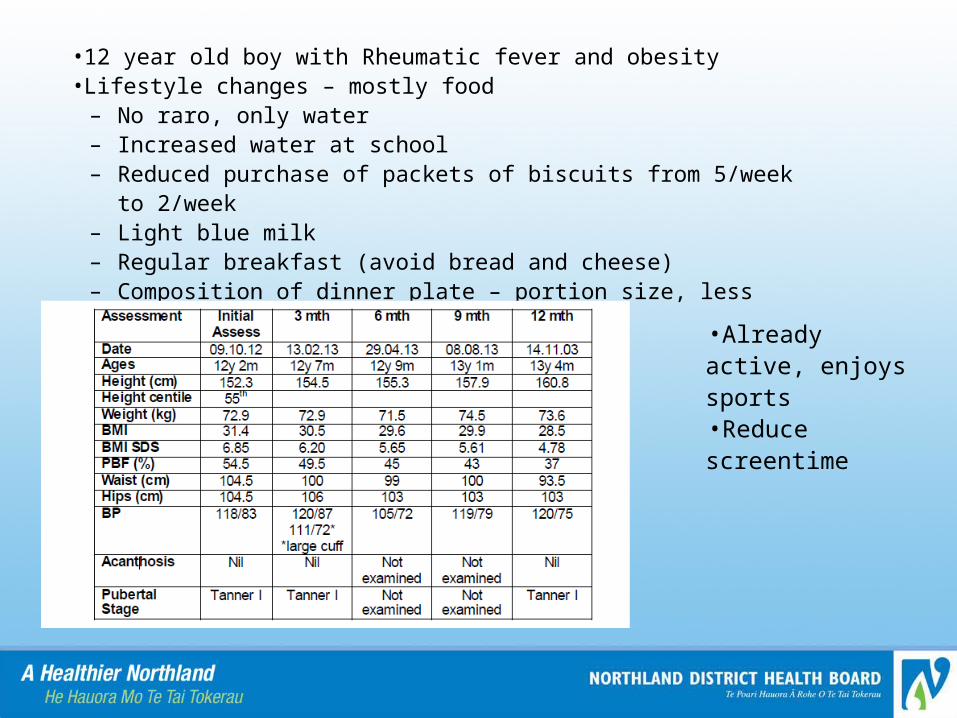
•12 year old boy with Rheumatic fever and obesity•Lifestyle changes – mostly food
– No raro, only water– Increased water at school– Reduced purchase of packets of biscuits from 5/week to 2/week– Light blue milk– Regular breakfast (avoid bread and cheese)– Composition of dinner plate – portion size, less carbs, more veges
•Already active, enjoys sports•Reduce screentime


Summary
•Childhood obesity common, under-recognised and important health issue•Lifestyle (FAB) approach to management