childhood overweight and obesity - alberta health · pdf filechanges in children’s...
TRANSCRIPT

AHS | Population and Public HealthChildhood overweight and obesity: Evidence from the Cost of Obesity in Alberta for
2005 Report
Childhood overweight and obesity Summary of evidence from the
Cost of Obesity in Alberta report
March 2010
— 1 —
AHS | Population and Public HealthChildhood overweight and obesity: Evidence from the Cost of Obesity in Alberta for
2005 Report
Acknowledgements The Cost of Obesity in Alberta Report was conducted by Ronald Colman and Karen Hayward, with Genuine Progress Index (GPI) Atlantic Canada Incorporated. The report was made possible through Alberta Health Services, Population and Public Health, Health Promotion, Disease and Injury Prevention, Physical Activity & Nutrition Unit. We would like to acknowledge the work completed on this report by Ellen Moffatt and Kerry Coupland within Population Health Innovation and Decision Support, Population and Public Health of Alberta Health Services. For further questions, please contact Ellen Moffatt at 2210-2nd Street SW, Calgary AB, T2S3C3. O: 403-476-2527, F: 403-355-3292, E: [email protected] The authors would also like to acknowledge Monica Schwann, Corinne Parker, Ellen Murphy, Lisa Petermann, Lorraine Shack, Cyne Johnston, Graham Petz, Janis Sauve, Jennifer Dotchin, and Tony Mottershead for their assistance with the project.
— 2 —

AHS | Population and Public HealthChildhood overweight and obesity: Evidence from the Cost of Obesity in Alberta for
2005 Report
Table of contents Introduction ......................................................................................................................... 4
Definitions of childhood overweight and obesity ................................................................. 5
Self-reported, parent-reported, and directly-measured prevalence of childhood obesity: Data sources and comparisons........................................................................................... 7
Directly-measured prevalence of childhood obesity: Data sources ...................................................7
Self- or parent-reported prevalence of childhood obesity: Data sources ...........................................8
Comparison of the self- or parent-reported versus the directly-measured prevalence of childhood obesity ................................................................................................................................................8
Childhood obesity prevalence and trends in Canada and Alberta..................................... 11
Canadian trends in childhood obesity ..............................................................................................11
Provincial trends in childhood obesity ..............................................................................................13
Relationships between lifestyle and environmental factors and childhood obesity ........... 15
Childhood obesity and urban versus rural region of residence........................................................15
Childhood obesity and dietary patterns: Fruit and vegetable intake ................................................15
Childhood obesity, physical activity and sedentary behaviour.........................................................16
Childhood obesity, household income and parental education level ...............................................18
The health effects of obesity in children............................................................................ 19
Cardiovascular Disease ...................................................................................................................19
Asthma .............................................................................................................................................20
Type 2 Diabetes ...............................................................................................................................20
Obstructive Sleep Apnea..................................................................................................................21
Summary .......................................................................................................................... 22
References ....................................................................................................................... 23
— 3 —

AHS | Population and Public HealthChildhood overweight and obesity: Evidence from the Cost of Obesity in Alberta for
2005 Report
Introduction In 2008 the Alberta Health Services’ Cancer Prevention Program commissioned a review and estimation of the direct and indirect costs of overweight and obesity among Albertans aged 15 years and older for the year 2005. This review and analysis revealed that 60.9% of Alberta’s adults were overweight or obese and that this excess weight cost the province an estimated $1.27 billion in annual direct and indirect health care expenses. It was not possible to include the costs of obesity among children in this analysis since the associations between obesity and various health conditions in children have not been well quantified. Although the economic costs of childhood obesity remain unclear, the full Cost of Obesity in Alberta report highlighted the prevalence and trends in childhood overweight and obesity in Canada and Alberta, issues in measurement, the associations between obesity and lifestyle factors, and the health effects of obesity in children. ‘Children’ or ‘childhood’, in the context of this report, includes preschool children (aged 2-5 years), school-aged children (aged 6-11 years), and youth (aged 12-17 years). The full technical report can be obtained by contacting the Population Health Innovation and Decision Support (PHIDS) unit within Alberta Health Services, Population and Public Health, Surveillance and Health Status Assessment Division (see contact information on inside cover). A summary of the evidence from the Cost of Obesity in Alberta report related to childhood obesity is provided here. Specifically, this document summarizes:
Definitions of childhood overweight and obesity; Data sources for and comparisons of self-reported and measured rates of childhood
obesity in Canada; Childhood obesity prevalence and trends in Canada and Alberta; The relationships between lifestyle and environmental factors and childhood obesity; and, The health effects of obesity in children.
— 4 —
AHS | Population and Public HealthChildhood overweight and obesity: Evidence from the Cost of Obesity in Alberta for
2005 Report
Definitions of childhood overweight and obesity Classifications of overweight and obesity in children aged 2-17 years are typically based upon the results of an individual’s Body Mass Index (BMI), which is calculated by dividing weight in kilograms by height in metres squared (1,2)
2Height
WeightBMI =
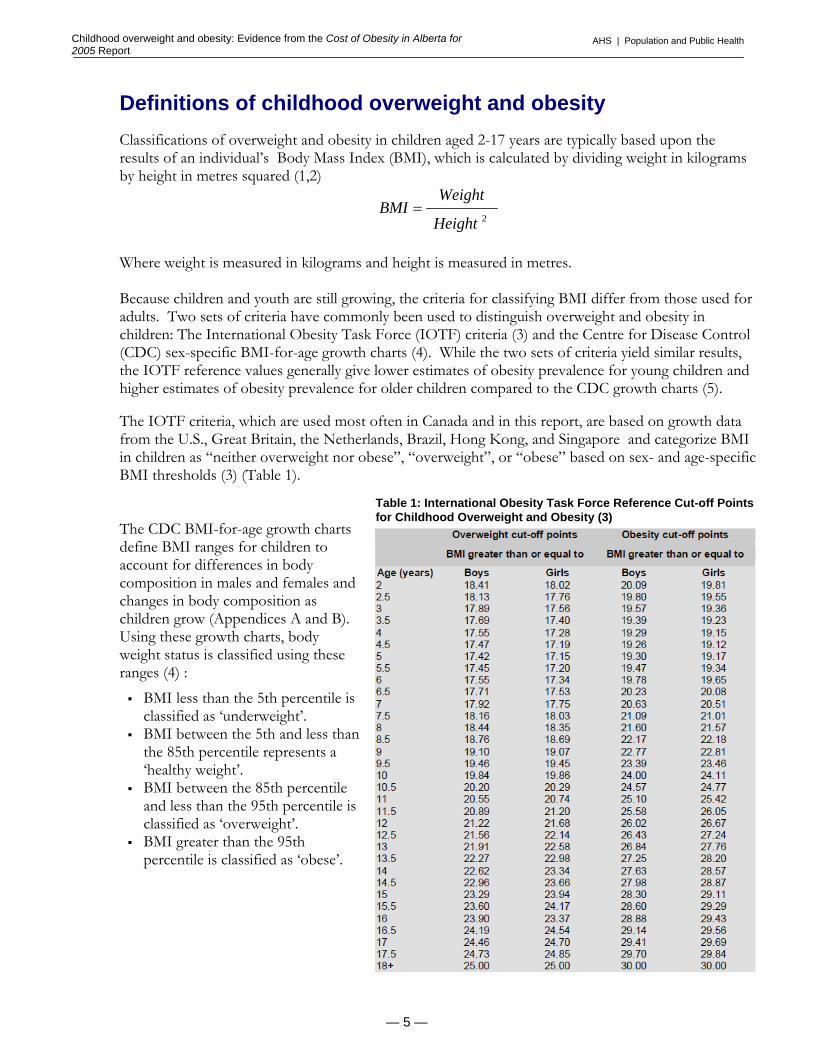
Where weight is measured in kilograms and height is measured in metres. Because children and youth are still growing, the criteria for classifying BMI differ from those used for adults. Two sets of criteria have commonly been used to distinguish overweight and obesity in children: The International Obesity Task Force (IOTF) criteria (3) and the Centre for Disease Control (CDC) sex-specific BMI-for-age growth charts (4). While the two sets of criteria yield similar results, the IOTF reference values generally give lower estimates of obesity prevalence for young children and higher estimates of obesity prevalence for older children compared to the CDC growth charts (5). The IOTF criteria, which are used most often in Canada and in this report, are based on growth data from the U.S., Great Britain, the Netherlands, Brazil, Hong Kong, and Singapore and categorize BMI in children as “neither overweight nor obese”, “overweight”, or “obese” based on sex- and age-specific BMI thresholds (3) (Table 1).
Table 1: International Obesity Task Force Reference Cut-off Points for Childhood Overweight and Obesity (3)
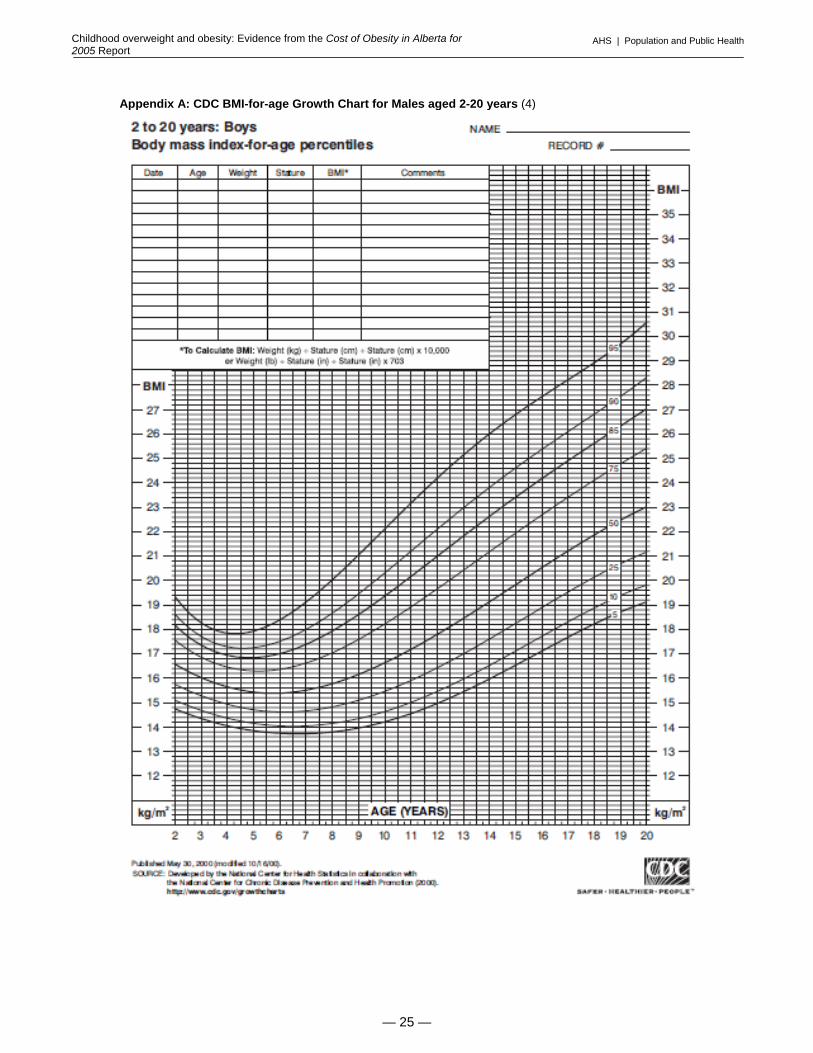
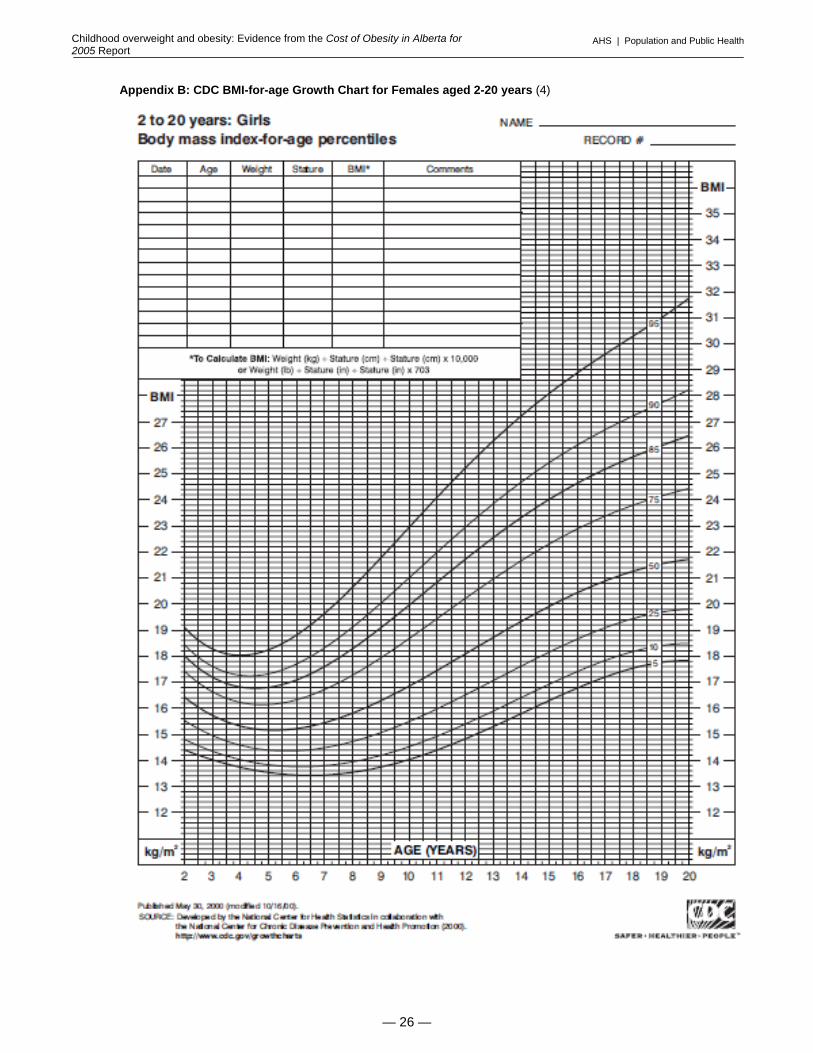
The CDC BMI-for-age growth charts define BMI ranges for children to account for differences in body composition in males and females and changes in body composition as children grow (Appendices A and B). Using these growth charts, body weight status is classified using these ranges (4) :
BMI less than the 5th percentile is classified as ‘underweight’.
BMI between the 5th and less than the 85th percentile represents a ‘healthy weight’.
BMI between the 85th percentile and less than the 95th percentile is classified as ‘overweight’.
BMI greater than the 95th percentile is classified as ‘obese’.
— 5 —

AHS | Population and Public HealthChildhood overweight and obesity: Evidence from the Cost of Obesity in Alberta for
2005 Report
Limitations of the Body Mass Index There are limitations to the BMI in terms of sensitivity and specificity for identifying overweight and obesity. Levels of physical fitness, ethnic origin, frame size, biologic maturation are all factors that may affect the accuracy of the BMI measure in children. BMI is not a perfect indicator of body fatness in children, and its use can falsely classify children with a normal amount of body fat as overweight and children who are overweight as not overweight. Factors which may falsely elevate BMI and classify a child with a healthy weight as overweight include enhanced muscular development (the BMI does not distinguish lean body mass from fat mass), large head size, and a high torso-to-leg ratio (6,7). Additionally, BMI values vary according to degree of sexual maturity, which is not considered in the context of the population-based reference cutoffs presented above (6). The implications of these limitations should be considered throughout this document. At an individual-level, the BMI should be supplemented with other clinical markers of body weight, and weight-related health risk; however, currently at the population-level, the BMI is a widely-available and reasonable measure for comparing body weight statuses.
— 6 —

AHS | Population and Public HealthChildhood overweight and obesity: Evidence from the Cost of Obesity in Alberta for
2005 Report
Self-reported, parent-reported, and directly-measured prevalence of childhood obesity: Data sources and comparisons
Several national and provincial surveys conducted since the 1970’s have assessed the measured and self- or parent-reported prevalence of obesity and overweight among children in Canada. These surveys provide a baseline measurement for examining childhood obesity in the country as well as changes in children’s weight status over time. It is, however, important to differentiate between surveys using self- or parent-reported height and weight data and those using directly measured data because of differences in resultant estimates of the prevalence of overweight and obesity (described below).
Directly-measured prevalence of childhood obesity: Data sources
The following national surveys included direct measurements of children’s heights and weights:
The Nutrition Canada Survey (NCS) (1970-72): The NCS was the first comprehensive national survey to examine the food consumption patterns of all ages and to determine the prevalence of nutritional diseases (8). While the NCS provides the earliest estimate of measured obesity among Canadians, its low response rate (46%) and smaller sample size relative to other national surveys (n=12,795) result in an inability to confidently assess the weight-related trends for specific age groups, and at provincial levels (5).
The Canada Health Survey (CHS) (1978-79): The CHS was conducted to obtain a better
understanding of a wider range of health determinants in Canada, including biological, environmental and lifestyle factors, as well as access to and utilization of the healthcare system (8). Physical measurements, including height and weight, were collected from a third of the CHS sample. Because of its larger sample size (n=31,668) and higher response rate (86%), the CHS provides a baseline for comparing childhood obesity rates over time in Canada (5).
The Canadian Community Health Survey (CCHS), Cycle 2.2 (2004): The CCHS is a
nationally-representative survey conducted annually by Statistics Canada to assess health status, health care utilization and health determinants for the Canadian population (9,10). Before 2007, the CCHS was conducted bi-annually and consisted of two alternating cycles. The first cycle of each survey (2001, 2003, 2005, and 2007) collected data on the general health of over 130,000 respondents aged 12 and over, at the health region level. The second cycle (2002, 2004, and 2006) collected information on specific topics from a smaller sub-sample of 30,000 respondents, and was designed to provide valid data at the national and provincial level, but not at regional levels (11). All of the first cycle CCHS collected self- or parent-reported height and weight data depending on the age of the child. However, only Cycle 2.2 (2004, Nutrition focus) collected directly measured heights and weights from all respondents aged 2 and older (12). In Alberta the sample size for this survey was 3,116 respondents. The overall Canadian sample size was approximately 35,000 (12).
The Canadian Health Measures Survey (CHMS) (2007-2009): The CHMS directly
measured numerous indicators of physical health including BMI, waist circumference, blood pressure, heart rate, lung functioning, and cardiovascular fitness (13). This survey included a sample of approximately 5,000 Canadians aged 6-79 years that was representative of the Canadian population; however, the sample size is inadequate to make province-specific conclusions (n=666 for the Prairie provinces of Alberta, Saskatchewan and Manitoba) (14).
— 7 —
AHS | Population and Public HealthChildhood overweight and obesity: Evidence from the Cost of Obesity in Alberta for
2005 Report
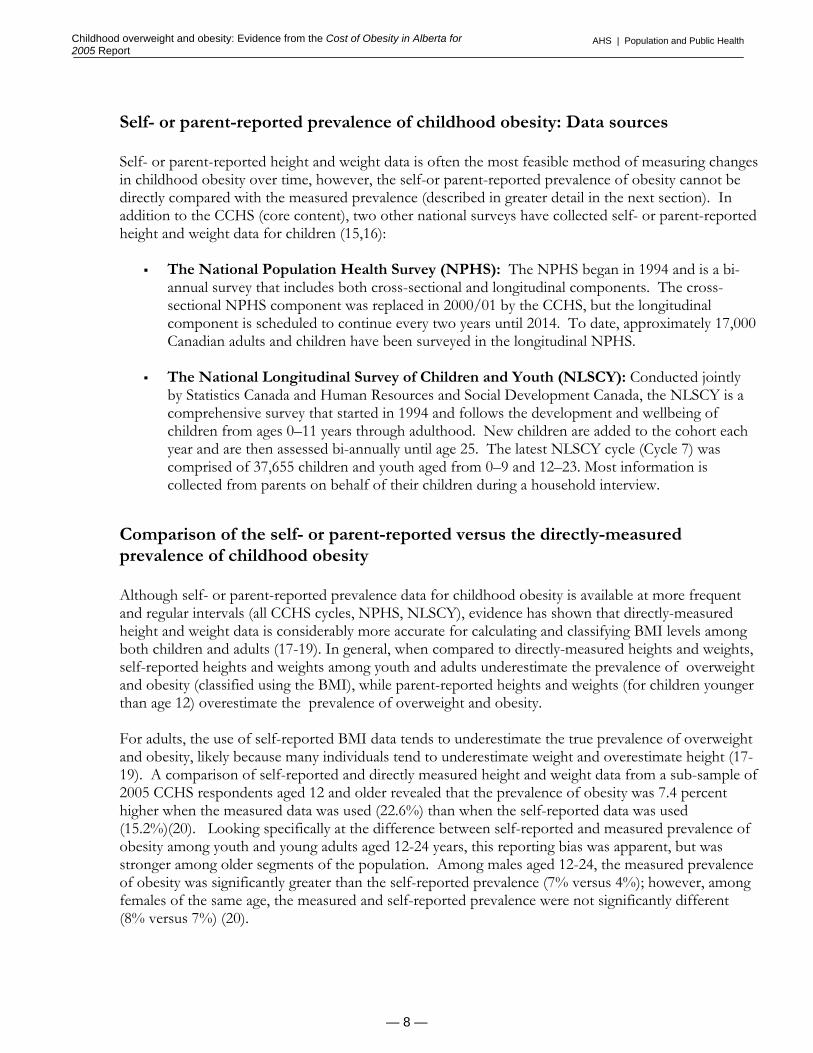
Self- or parent-reported prevalence of childhood obesity: Data sources Self- or parent-reported height and weight data is often the most feasible method of measuring changes in childhood obesity over time, however, the self-or parent-reported prevalence of obesity cannot be directly compared with the measured prevalence (described in greater detail in the next section). In addition to the CCHS (core content), two other national surveys have collected self- or parent-reported height and weight data for children (15,16):
The National Population Health Survey (NPHS): The NPHS began in 1994 and is a bi-annual survey that includes both cross-sectional and longitudinal components. The cross-sectional NPHS component was replaced in 2000/01 by the CCHS, but the longitudinal component is scheduled to continue every two years until 2014. To date, approximately 17,000 Canadian adults and children have been surveyed in the longitudinal NPHS.
The National Longitudinal Survey of Children and Youth (NLSCY): Conducted jointly
by Statistics Canada and Human Resources and Social Development Canada, the NLSCY is a comprehensive survey that started in 1994 and follows the development and wellbeing of children from ages 0–11 years through adulthood. New children are added to the cohort each year and are then assessed bi-annually until age 25. The latest NLSCY cycle (Cycle 7) was comprised of 37,655 children and youth aged from 0–9 and 12–23. Most information is collected from parents on behalf of their children during a household interview.
Comparison of the self- or parent-reported versus the directly-measured prevalence of childhood obesity Although self- or parent-reported prevalence data for childhood obesity is available at more frequent and regular intervals (all CCHS cycles, NPHS, NLSCY), evidence has shown that directly-measured height and weight data is considerably more accurate for calculating and classifying BMI levels among both children and adults (17-19). In general, when compared to directly-measured heights and weights, self-reported heights and weights among youth and adults underestimate the prevalence of overweight and obesity (classified using the BMI), while parent-reported heights and weights (for children younger than age 12) overestimate the prevalence of overweight and obesity. For adults, the use of self-reported BMI data tends to underestimate the true prevalence of overweight and obesity, likely because many individuals tend to underestimate weight and overestimate height (17-19). A comparison of self-reported and directly measured height and weight data from a sub-sample of 2005 CCHS respondents aged 12 and older revealed that the prevalence of obesity was 7.4 percent higher when the measured data was used (22.6%) than when the self-reported data was used (15.2%)(20). Looking specifically at the difference between self-reported and measured prevalence of obesity among youth and young adults aged 12-24 years, this reporting bias was apparent, but was stronger among older segments of the population. Among males aged 12-24, the measured prevalence of obesity was significantly greater than the self-reported prevalence (7% versus 4%); however, among females of the same age, the measured and self-reported prevalence were not significantly different (8% versus 7%) (20).
— 8 —

AHS | Population and Public HealthChildhood overweight and obesity: Evidence from the Cost of Obesity in Alberta for
2005 Report
This same reporting effect is not seen for children aged 2 to 11 years, who typically do no report their own height and weight in population surveys. Within surveys like the CCHS and the NLSCY, parents report height and weight for children aged 11 years and younger. Parents tend to underestimate children’s height (5), and consequently, when parental reports of height and weight are used to calculate children’s BMI statuses, overweight and obesity levels are higher than those based on directly measured data. This is particularly true for younger children who have rapid growth rates. Indeed, when parent-reported BMI data from the 2002/03 NLSCY was compared with directly-measured data from the 2004 CCHS, the percentage of children aged 2 to 5 years who were either overweight or obese was 14.6 percentage points higher in parent reports than in measured BMI results (Table 2). Similarly, the percentage of children aged 6 to 11 years who were either overweight or obese was 6.3 percentage points higher in parent reports than in directly measured results (5). Table 2. Difference in BMI for overweight and obesity in children, aged 2–11, by collection method (5)
*The difference was determined by subtracting the average BMI or prevalence of overweight/obesity based on parent-reported data from the average BMI or prevalence of overweight/obesity based on directly-measured data. A more recent comparison of self-reported and directly-measured BMI among children and youth from the CHMS (2007-2009) revealed similar findings; For children aged 6-11 years, self-reported data (as reported by parents) resulted in higher estimates of the prevalence of overweight and obesity (Figure 1) (21). It appears that this discrepancy is greater for boys than girls. Among youth aged 12-17 years who report their own height and weight, the self-reported and measured prevalence of excess weight were more similar.
— 9 —

AHS | Population and Public HealthChildhood overweight and obesity: Evidence from the Cost of Obesity in Alberta for
2005 Report
Figure 1: Comparison of self-reported and measured prevalence of overweight and obesity in Canada, classified using BMI, ages 6-17 years, 2007-2009 ‡ (21)
26.3
30.9
35.9
25.623.8
28.4
23.2 24.322.1
27.929.3
0
5
10
15
20
25
30
35
40
Both Sexes Boys Girls Both Sexes Boys Girls†
6-11 years 12-17 years
Prev
alen
ce o
f ove
rwei
ght a
nd o
besi
ty (%
) Self-reported
Measured
‡The following prevalence estimates should be used with caution due to their high variability (coefficients of variation from 16.6% to 33.3%): self-reported rate of overweight among girls aged 12-17 years, self-reported obesity rates among 12-17 year olds, and boys aged 6-11 years and 12-17 years, and measured rates of obesity among 12-17 year olds, boys aged 12-17 years, and girls aged 6-11 years and 12-17 years.
†The prevalence estimate for self-reported obesity among girls aged 12-17 years was too unreliable to be published (coefficient of variation greater than 33.3%)
— 10 —

AHS | Population and Public HealthChildhood overweight and obesity: Evidence from the Cost of Obesity in Alberta for
2005 Report
Childhood obesity prevalence and trends in Canada and Alberta
Canadian trends in childhood obesity In 2004, 26% of Canadian children and youth aged 2-17 years were classified as overweight or obese using BMI from measured heights and weights (5). Shields (2006) compared this estimate from the 2004 CCHS (Cycle 2.2) with data from the Canada Health Survey of 1978/79 which also assessed height and weight using objective measurement (5). Between 1978/79 and 2004 the prevalence of overweight among Canadian children and youth increased from 12% to 18% while the prevalence of obesity increased from 3% to 8% (Figure 2). This rate of increase was similar among boys and girls. Data from the more recent CHMS (2007-2009) reveals that the prevalence of childhood overweight and obesity in Canada has remained relatively stable between 2004 and 2007-09 (Figure 2). Figure 2: Prevalence of childhood overweight and obesity in Canada, classified using BMI, by sex, ages 2-17 years†, 1978/79, 2004, and 2007-09 (5,21)
12
18 17.113
18 1712
18 17.2
8 8.69
7 7.110‡
3‡4‡
3‡
0
5
10
15
20
25
30
35
1978-79 2004 2007-09 1978-79 2004 2007-09 1978-79 2004 2007-09
Total Boys Girls
Prev
alen
ce o
f ove
rwei
ght a
nd o
besi
ty (%
)
ObesityOverweight
†The Canada Health Survey and Canadian Community Health Survey included children aged 2-17 years, while the Canadian Health
Measures Survey only included children aged 6-17 years. ‡Estimates should be used with caution (coefficient of variation between 16.6% and 33.3%)
— 11 —
AHS | Population and Public HealthChildhood overweight and obesity: Evidence from the Cost of Obesity in Alberta for
2005 Report
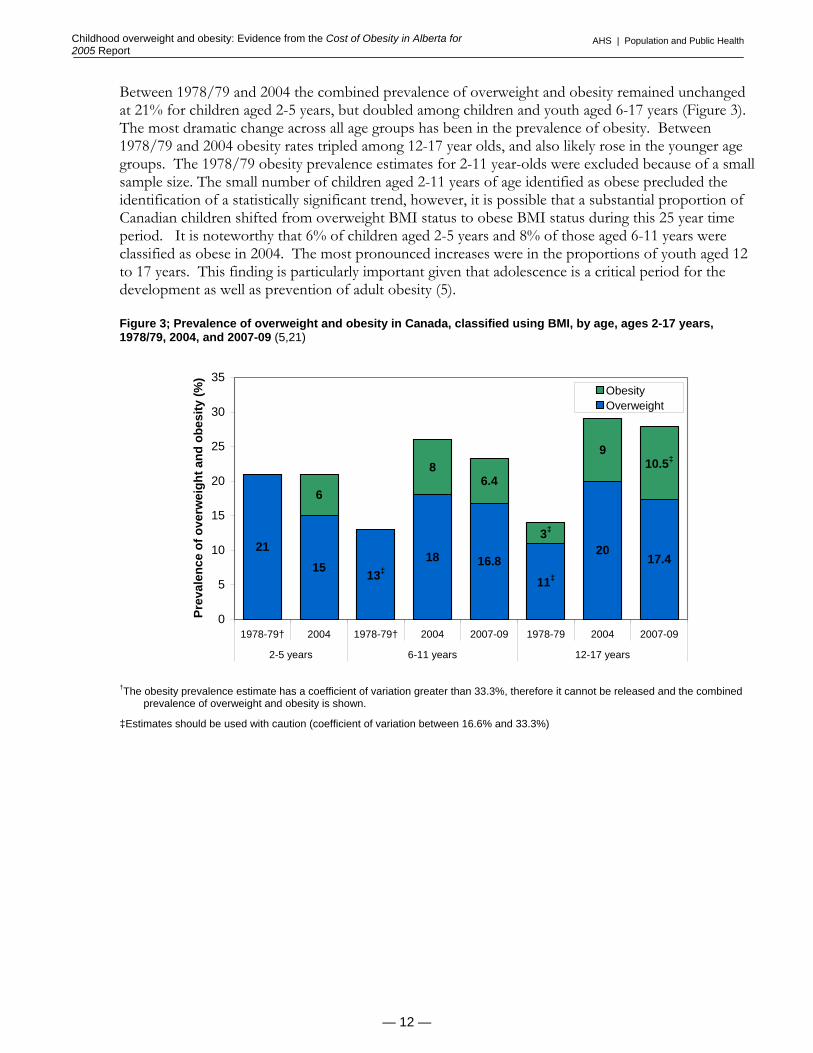
Between 1978/79 and 2004 the combined prevalence of overweight and obesity remained unchanged at 21% for children aged 2-5 years, but doubled among children and youth aged 6-17 years (Figure 3). The most dramatic change across all age groups has been in the prevalence of obesity. Between 1978/79 and 2004 obesity rates tripled among 12-17 year olds, and also likely rose in the younger age groups. The 1978/79 obesity prevalence estimates for 2-11 year-olds were excluded because of a small sample size. The small number of children aged 2-11 years of age identified as obese precluded the identification of a statistically significant trend, however, it is possible that a substantial proportion of Canadian children shifted from overweight BMI status to obese BMI status during this 25 year time period. It is noteworthy that 6% of children aged 2-5 years and 8% of those aged 6-11 years were classified as obese in 2004. The most pronounced increases were in the proportions of youth aged 12 to 17 years. This finding is particularly important given that adolescence is a critical period for the development as well as prevention of adult obesity (5). Figure 3; Prevalence of overweight and obesity in Canada, classified using BMI, by age, ages 2-17 years, 1978/79, 2004, and 2007-09 (5,21)
2115
18 16.820
17.4
6
86.4
9
11‡13‡
3‡
10.5‡
0
5
10
15
20
25
30
35
1978-79† 2004 1978-79† 2004 2007-09 1978-79 2004 2007-09
2-5 years 6-11 years 12-17 years
Prev
alen
ce o
f ove
rwei
ght a
nd o
besi
ty (%
)
ObesityOverweight
†The obesity prevalence estimate has a coefficient of variation greater than 33.3%, therefore it cannot be released and the combined
prevalence of overweight and obesity is shown.
‡Estimates should be used with caution (coefficient of variation between 16.6% and 33.3%)
— 12 —
AHS | Population and Public HealthChildhood overweight and obesity: Evidence from the Cost of Obesity in Alberta for
2005 Report
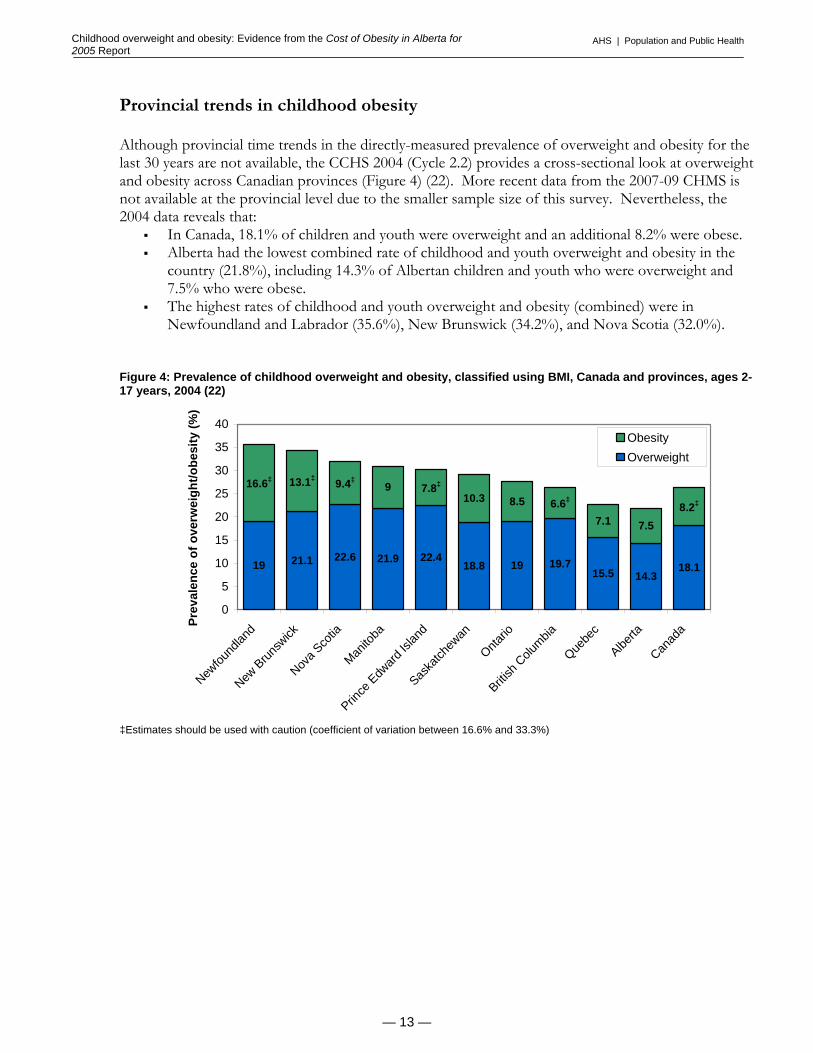
Provincial trends in childhood obesity Although provincial time trends in the directly-measured prevalence of overweight and obesity for the last 30 years are not available, the CCHS 2004 (Cycle 2.2) provides a cross-sectional look at overweight and obesity across Canadian provinces (Figure 4) (22). More recent data from the 2007-09 CHMS is not available at the provincial level due to the smaller sample size of this survey. Nevertheless, the 2004 data reveals that:
In Canada, 18.1% of children and youth were overweight and an additional 8.2% were obese. Alberta had the lowest combined rate of childhood and youth overweight and obesity in the
country (21.8%), including 14.3% of Albertan children and youth who were overweight and 7.5% who were obese.
The highest rates of childhood and youth overweight and obesity (combined) were in Newfoundland and Labrador (35.6%), New Brunswick (34.2%), and Nova Scotia (32.0%).
Figure 4: Prevalence of childhood overweight and obesity, classified using BMI, Canada and provinces, ages 2-17 years, 2004 (22)
21.9 22.418.8 19 19.7
15.5 14.318.1
910.3 8.5
7.1 7.5
22.621.119
8.2‡6.6‡7.8‡9.4‡13.1‡16.6‡
0
5
10
15
20
25
30
35
40
Newfou
ndlan
d
New B
runsw
ick
Nova S
cotia
Manito
ba
Prince
Edw
ard Is
land
Saska
tchew
an
Ontario
British
Colu
mbia
Quebe
c
Alberta
Canad
a
Prev
alen
ce o
f ove
rwei
ght/o
besi
ty (%
)
ObesityOverweight
‡Estimates should be used with caution (coefficient of variation between 16.6% and 33.3%)
— 13 —

AHS | Population and Public HealthChildhood overweight and obesity: Evidence from the Cost of Obesity in Alberta for
2005 Report
The 2004 measured CCHS data showed that 10.3% of Albertan children aged 2-11 years were overweight compared to 16.9% in Canada, a difference which was statistically significant. In this same age group, the prevalence of obesity among Albertan children was also lower than the Canadian average (5.8% compared to 7.4%), though this difference was not statistically significant. The prevalence of both overweight and obesity was similar among Alberta and Canadian youth aged 12-17 years (20.2% versus 19.8% overweight and 10.1 versus 9.4% obese) (Figure 5).
Figure 5: Canadian and Albertan prevalence of overweight and obesity, classified using BMI, ages 2-17 years, 2004 (16)
16.9
7.4
24.3
16.1
29.2
9.4
19.8
5.8‡
10.3‡
30.3
10.1‡
20.2
0
5
10
15
20
25
30
35
Overweight Obesity Overweightand Obesity
Overweight Obesity Overweightand Obesity
2-11 years 12-17 years
Prev
alen
ce o
f ove
rwei
ght a
nd o
besi
ty (%
)
Canada
Alberta
‡Estimates should be used with caution (coefficient of variation between 16.6% and 33.3%)
— 14 —

AHS | Population and Public HealthChildhood overweight and obesity: Evidence from the Cost of Obesity in Alberta for
2005 Report
Relationships between lifestyle and environmental factors and childhood obesity Childhood obesity and urban versus rural region of residence While the prevalence of excess weight among Canadian adults is lower in larger urban centers when compared to smaller towns and rural areas, this same pattern has not been observed among children (23). Using data from the CCHS 2004, Shields and Tjepkema (2006) examined the relationship between overweight/obesity and region of residency in both children and adults (23). The average prevalence of overweight and obesity among Canadian children living in urban or census metropolitan areas (CMAs) was not significantly different from that of children living in non-CMAs (25.8% in CMAs compared to 27.0% in non-CMAs). Interestingly, when this association was examined at the provincial level, Alberta was identified as the only province that had significant differences in the prevalence of excess weight between urban and rural areas. Albertan children and youth were significantly more likely to be overweight or obese if they lived in non-CMAs (26.9%) than in CMAs (18.6%). The prevalence of overweight and obesity (combined) among children in Calgary and Edmonton were 16.0% and 21.4%, respectively (23). The higher rates of both adult and childhood overweight and obesity in more rural areas of the province suggest that these are important regions to target with obesity prevention and reduction initiatives.
Childhood obesity and dietary patterns: Fruit and vegetable intake Not surprisingly, fruit and vegetable intake, which is commonly used as an indicator of overall diet quality, shows robust associations with childhood obesity. Further analysis of CCHS 2004 data illustrates that children consuming fewer than 5 daily servings of fruit and vegetables per day are significantly more likely to be overweight or obese than children consuming 5 or more daily servings of vegetables and fruit (Figure 6). The 59% of Canadians aged 2-17 years who consume fewer than 5 servings of vegetables and fruit per day are significantly more likely to be overweight or obese than those consuming more vegetables and fruits (5).
Figure 6: Prevalence of overweight and obesity, by daily fruit and vegetable consumption, Canada, ages 2-17 years, 2004 (5)
19 19 17
10 96
0
5
10
15
20
25
30
35
less than 3 times(21%)†
3 to 4 times (37%)† 5 or more times (41%)†
Daily Fruit and Vegetables Intake
Prev
alen
ce o
f ove
rwei
ght a
nd o
besi
ty (%
)
Obese (%)Overweight (%)
†Percentage of population aged 2-17 years that falls into this category
— 15 —

AHS | Population and Public HealthChildhood overweight and obesity: Evidence from the Cost of Obesity in Alberta for
2005 Report
Childhood obesity, physical activity and sedentary behaviour
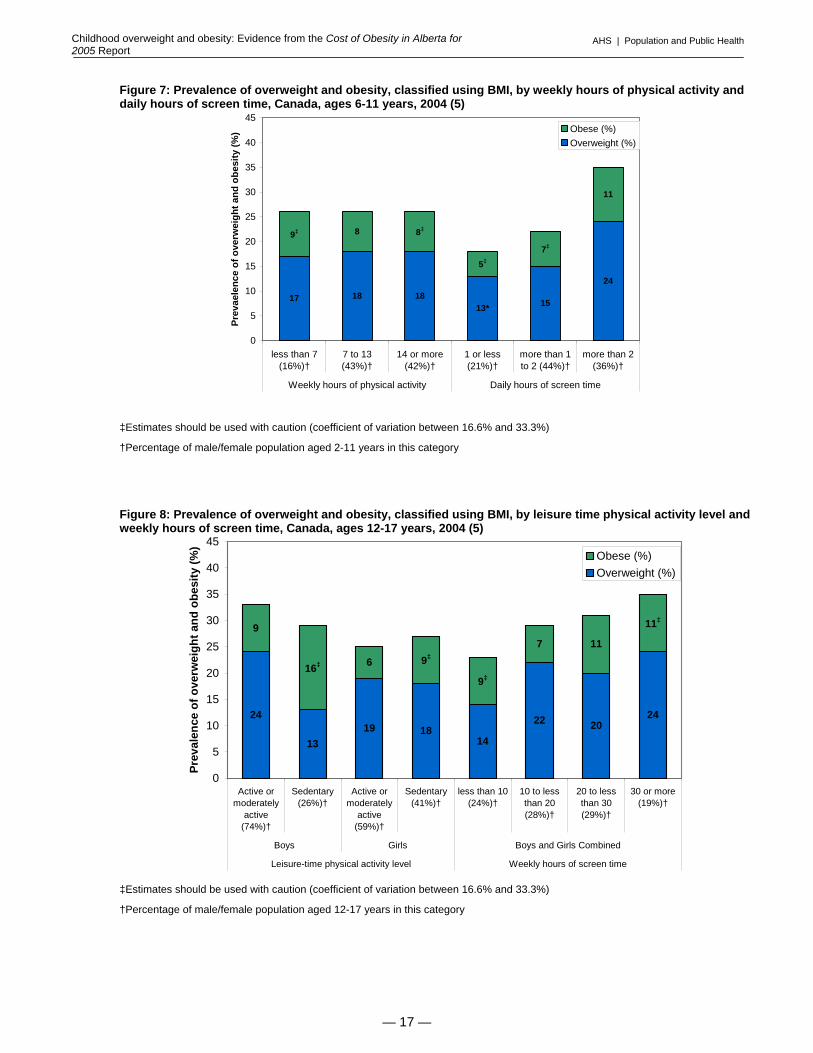
Although Shields (2006) did not find consistent relationships between physical activity level and prevalence of childhood obesity across age and sex groups, screen time (as an indicator of sedentary activity) was associated with higher levels of overweight and obesity (classified using BMI) among children (5). There was no significant association between physical activity levels and overweight or obesity among children aged 6 –11 and girls aged 12–17, as measured in the 2004 CCHS (Figures 7 and 8). Among 12-17 year old boys, the combined rate of overweight/obesity was, surprisingly, higher among active/moderately active boys compared to sedentary boys (33% compared to 29%), though this difference was not statistically significant. The obesity rate among sedentary boys aged 12-17 years was significantly higher than that of active or moderately active boys of the same age (16% versus 9%), while the prevalence of overweight was significantly higher among boys who were active or moderately active compared to those who were sedentary (24% versus 13%)(Figure 8) (5). Limitations of the BMI as an indicator of overweight and obesity may account for this observation. This pubertal male population may actually be experiencing an increase in muscle mass (not fat mass) due to increased testosterone levels and physical activity. Alternative indicators of weight-related health risk, such as waist circumference or percent body fat, may be more appropriate for this population group. Additional research is required to understand the growth patterns in this population group. Screen time, an indicator of sedentary behaviour, includes the amount of time spent watching television, playing video games, and using the computer. There is a strong correlation between amount of screen time and the prevalence of childhood overweight and obesity. Children aged 6–11 years who had more than two hours of daily screen time in 2004 were nearly twice as likely to be overweight or obese as children who had one or less hours of daily screen time (35% versus 18%) (Figure 7) (5). For youth aged 12–17 years, screen time was measured on a weekly basis. Similar to the findings in younger children, the prevalence of overweight and obesity was higher among youth with greater amounts of screen time. Only 23% of youth with less than 10 weekly hours of screen time were overweight or obese, while 35% of youth with 30 or more hours of weekly screen time were overweight or obese (Figure 8) (5).
— 16 —
AHS | Population and Public HealthChildhood overweight and obesity: Evidence from the Cost of Obesity in Alberta for
2005 Report
Figure 7: Prevalence of overweight and obesity, classified using BMI, by weekly hours of physical activity and daily hours of screen time, Canada, ages 6-11 years, 2004 (5)
17 18 1815
24
8
11
13*
7‡
5‡
8‡9‡
0
5
10
15
20
25
30
35
40
45
less than 7(16%)†
7 to 13(43%)†
14 or more(42%)†
1 or less(21%)†
more than 1to 2 (44%)†
more than 2(36%)†
Weekly hours of physical activity Daily hours of screen time
Prev
aele
nce
of o
verw
eigh
t and
obe
sity
(%) Obese (%)
Overweight (%)
‡Estimates should be used with caution (coefficient of variation between 16.6% and 33.3%)
†Percentage of male/female population aged 2-11 years in this category
Figure 8: Prevalence of overweight and obesity, classified using BMI, by leisure time physical activity level and weekly hours of screen time, Canada, ages 12-17 years, 2004 (5)
24
1319 18
14
22 2024
9
6
7 11
11‡
9‡
9‡
16‡
0
5
10
15
20
25
30
35
40
45
Active ormoderately
active(74%)†
Sedentary(26%)†
Active ormoderately
active(59%)†
Sedentary(41%)†
less than 10(24%)†
10 to lessthan 20(28%)†
20 to lessthan 30(29%)†
30 or more(19%)†
Boys Girls Boys and Girls Combined
Leisure-time physical activity level Weekly hours of screen time
Prev
alen
ce o
f ove
rwei
ght a
nd o
besi
ty (%
)
Obese (%)Overweight (%)
‡Estimates should be used with caution (coefficient of variation between 16.6% and 33.3%)
†Percentage of male/female population aged 12-17 years in this category
— 17 —
AHS | Population and Public HealthChildhood overweight and obesity: Evidence from the Cost of Obesity in Alberta for
2005 Report
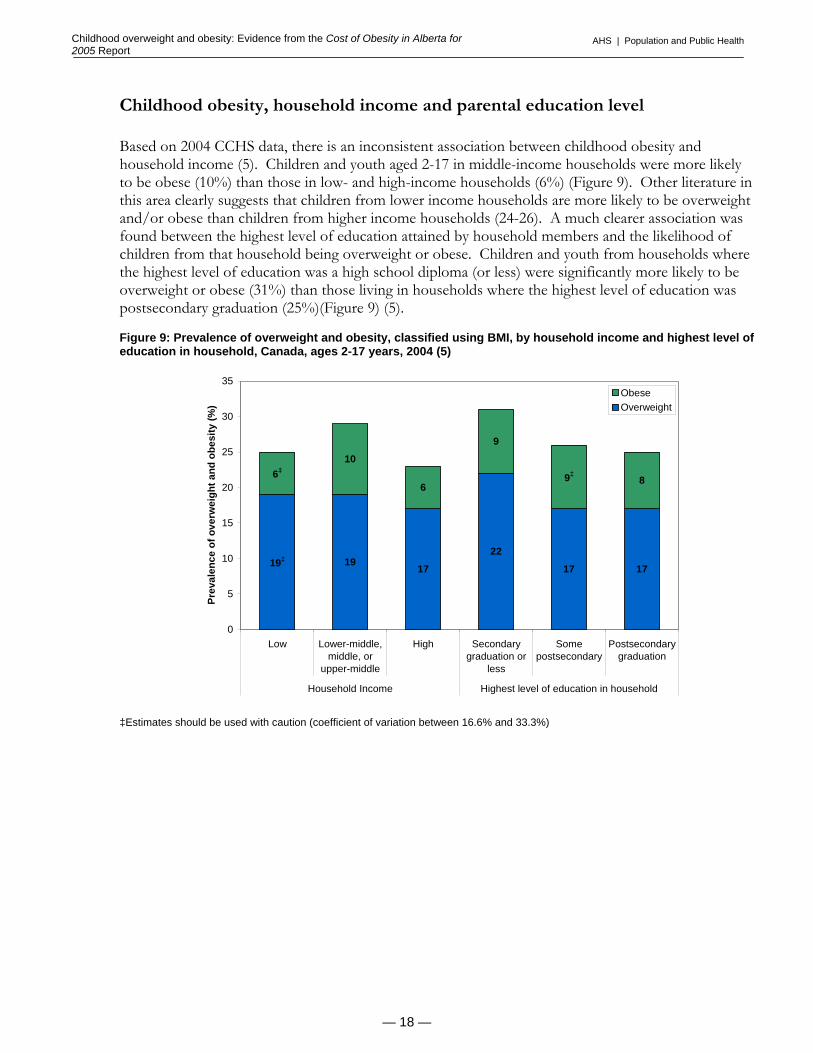
Childhood obesity, household income and parental education level Based on 2004 CCHS data, there is an inconsistent association between childhood obesity and household income (5). Children and youth aged 2-17 in middle-income households were more likely to be obese (10%) than those in low- and high-income households (6%) (Figure 9). Other literature in this area clearly suggests that children from lower income households are more likely to be overweight and/or obese than children from higher income households (24-26). A much clearer association was found between the highest level of education attained by household members and the likelihood of children from that household being overweight or obese. Children and youth from households where the highest level of education was a high school diploma (or less) were significantly more likely to be overweight or obese (31%) than those living in households where the highest level of education was postsecondary graduation (25%)(Figure 9) (5). Figure 9: Prevalence of overweight and obesity, classified using BMI, by household income and highest level of education in household, Canada, ages 2-17 years, 2004 (5)
1917 17 17
6
9
8
2219‡
9‡
106‡
0
5
10
15
20
25
30
35
Low Lower-middle,middle, or
upper-middle
High Secondarygraduation or
less
Somepostsecondary
Postsecondarygraduation
Household Income Highest level of education in household
Prev
alen
ce o
f ove
rwei
ght a
nd o
besi
ty (%
)
ObeseOverweight
‡Estimates should be used with caution (coefficient of variation between 16.6% and 33.3%)
— 18 —

AHS | Population and Public HealthChildhood overweight and obesity: Evidence from the Cost of Obesity in Alberta for
2005 Report
The health effects of obesity in children The immediate impact of overweight and obesity on children’s health and wellbeing and the growing body of evidence demonstrating that overweight and obese children are more likely to become obese adults are cause for alarm (27-29). The effects of excess weight on health status, morbidity and premature mortality in adults are well established but there remain considerable gaps in the evidence base surrounding the relationships between childhood obesity and future adult health outcomes. Specifically, it is not clear which BMI level at any given age during childhood is associated with optimal adult health (30,31). Available data suggests that obese children are more likely to have a number of diseases and health disorders such as bone and joint deformation during growth, asthma, and sleep apnea (32). It is also clear that overweight and obese children have higher blood pressure, more abnormalities in serum lipid levels and higher levels of insulin resistance than children of a normal weight. All of these conditions are hallmarks of early metabolic disease and susceptibility to atherosclerosis and other cardiovascular diseases (32). These conditions occur in addition to the psychological effects associated with the social stigma frequently attached to childhood obesity. Obese children are more likely to be discriminated against by their peers and to have poor self esteem and body image, which affect their emotional development and increase risks for depression (33). This section provides a very brief overview of four obesity-related health conditions that may appear during childhood, including cardiovascular disease, asthma, type 2 diabetes, and obstructive sleep apnea. It should be noted that the largest health impact of childhood obesity actually manifests in adulthood due to the propensity of obese children to carry excess weight in adulthood. The development of weight-related chronic disease occurs gradually, with the greatest burden of obesity in terms of disease incidence, morbidity, human suffering, premature death and economic costs occurring most often in adulthood. Longitudinal research is required to clarify the relationship between excess weight during childhood and the burden of disease in adulthood.
Cardiovascular Disease
Obesity is considered to be the leading cause of hypertension, dislipidemia, abnormalities in left ventricular mass or function, hyperinsulinemia or insulin resistance, and other risk factors for the development of myocardial infarction, stroke, and other cardiovascular-related conditions in children (34,35). Results from the Bogalusa Heart Study (a longitudinal study of CVD risk factors that has been ongoing since 1972) demonstrated that, compared to children of a normal weight, overweight children aged 5–17 years were (36):
2.4 times more likely to have elevated diastolic blood pressure and 4.5 times more likely to have high systolic blood pressure;
3.0 times more likely to have raised LDL-cholesterol, 3.4 times more likely to have low LDL-cholesterol, and 7.1 times more likely to have elevated triglyceride levels; and,
12.1 times more likely to have high fasting insulin concentrations.
It is clear that the adverse effects of obesity on the cardiovascular system which are well-known in adults are also present among children (34). Longitudinal research, mainly from the Bogalusa Heart Study, suggests that significant associations exist between cardiovascular risk profiles associated with obesity during childhood and those observed during adulthood; however, the difference in adult cardiovascular risk between adults who were obese as children and those who were not obese as children has not been clearly distinguished (34)(). This association has been more clearly quantified among youth (aged 14-19 years) in a longitudinal study demonstrating that male and female youth within the highest BMI category had 2.9 and 3.7 times greater risks, respectively, of developing ischemic heart disease as adults when compared to youth in the lowest BMI category (37).
— 19 —

AHS | Population and Public HealthChildhood overweight and obesity: Evidence from the Cost of Obesity in Alberta for
2005 Report
Asthma Asthma is a chronic inflammatory disorder of the airways that can cause wheezing, difficultly breathing and chest pain. It is the most common chronic disease among North American children and evidence suggests that its prevalence is increasing in Canada (38,39). Body weight is one of several risk factors that contribute to the development of asthma. Other risk factors include diet quality, air pollution, environmental tobacco smoke, family history of asthma, and decreased exposure to infectious agents. While the association between body weight and asthma risk has been described as relatively weak in comparison to some of these other risk factors (38), evidence suggests that this may be changing. A systematic review and meta-analysis of research investigating weight status and asthma found that studies published between 1966 and 2000 generally showed a negative association between body weight and asthma, while studies published after 2000 showed a positive association (38). Among children aged 6-19 years, a high body weight (classified using BMI) was associated with a 50% increased risk of developing asthma. This same study estimated that 6.6% of all cases of childhood asthma could be due to overweight. Similarly, an analysis of data from the Third National Health and Nutrition Examination Survey (NHANES III) in the US found that the prevalence of asthma among children aged 4-17 years rose significantly across increasing BMI levels, from 8.7% among children with the lowest BMI (first quartile) to 14.9% among children with the highest BMI (fourth quartile) (40). In Canada, the burden of asthma among children and youth is substantial. Health Canada reports that the prevalence of asthma has increased since 1994 among all children and youth except boys aged 4-7 years (41). Between 1994/95 and 2000/01 the rate of asthma among Canadian children rose by from 11.1% (518,400 children) to 13.4% (586,000) (42). Data from the 2000/01 NLSCY reveals that 15.6% of Canadian children aged 4–11 years have been diagnosed with asthma, and that 8.3% of children aged 12 years and older have been diagnosed with asthma (43). Boys have a higher prevalence of asthma than girls under the age of 12 years, however, after 12 years of age and into adulthood, the prevalence of asthma is higher in females (41). Asthma is also a major cause of hospitalization for young children in Canada accounting for an estimated 10-12% of all hospital admissions in children aged 0-4 years and 8% of all hospital admissions among children aged 5 to 14 years (39,43).
Type 2 Diabetes Type 2 diabetes has previously been referred to as “adult-onset” diabetes, since it normally develops in adults after the age of 35. However, new evidence indicates that type 2 diabetes is being diagnosed at increasing rates among younger age groups and it is strongly linked to obesity (44). It is now estimated that approximately 45% of child diabetes cases in the U.S. are type 2 and over 90% of children who have type 2 diabetes are overweight or obese (30,45). A House of Commons Health Committee report from the United Kingdom notes that children with type 2 diabetes, which is more difficult to control than type 1 diabetes, are at elevated risk for a myriad of chronic health problems throughout their lives (46). More immediate health outcomes observed in youth with type 2 diabetes include diabetic keto-acidosis, hyperglycemia, and malignant hyperthermia-like syndrome with rhabdomyolysis (skeletal muscle breakdown) (47). Similar to the progression of diabetes among adults, diabetes among children and adolescents has been associated with increased risk of a number of chronic conditions, including hypertension, nephropathy, neuropathy, retinopathy, dislipidemia, cardiovascular disease and atherosclerosis(47).
— 20 —

AHS | Population and Public HealthChildhood overweight and obesity: Evidence from the Cost of Obesity in Alberta for
2005 Report
Obstructive Sleep Apnea Obstructive sleep apnea (OSA) in children is characterized by a partial or total upper airway obstruction during sleep that recurs throughout the night (35). Although OSA was recognized in the late 1800s, it has only recently been identified as a public health problem among children and youth (35). While the extent of OSA among Canadian children is unknown, the prevalence of OSA in U.S. children aged 2–8 has been estimated to be approximately 3% (35). Children who are overweight or obese are at increased risk of developing OSA, with some estimates indicating that every 1 unit increase in BMI is associated with a 12% increased risk of having OSA (43,48). Although the prevalence of OSA is lower among children than adults, untreated OSA may compromise physical, behavioural and cognitive development and contribute to excessive daytime sleepiness and hyperactivity in children (49). More severe cases of childhood OSA have been associated with hypertension, failure to thrive, developmental delay, and sudden unexpected death (35). In a study assessing risk factors for sleep disordered breathing (SDB, defined as the occurrence of repetitive episodes of complete or partial obstruction of the upper airway during sleep) among children aged 2-18 years, obese children (defined in this case by a BMI of ≥28kg/m2) were four to five times more likely to have SDB than non-obese children (48). This same study found that for every 1 kg/m2 increase in BMI above the mean BMI for the study sample, the risk of SDB increased by 12% (48). More research is required with larger sample sizes to investigate the obesity-OSA association among children and youth (48).
— 21 —
AHS | Population and Public HealthChildhood overweight and obesity: Evidence from the Cost of Obesity in Alberta for
2005 Report
Summary Over the past 30 years, the prevalence of overweight and obesity among children in Canada increased from 15% to 26%, when data from the 1978/79 Canada Health Survey and the 2007-2009 Canada Health Measures Survey are compared. The most recent estimates for Alberta indicate that approximately 22% of the provinces’ children and youth were overweight or obese, which was the lowest provincial prevalence in all of Canada in 2004. While this is a positive finding for the province, it is largely attributable to the lower prevalence of overweight and obesity among Albertan children aged 2-11 years relative to their Canadian counterparts. In contrast, Albertan youth aged 12-17 years have similar rates of overweight and obesity, classified using BMI, as Canadian youth, illustrating the need for obesity prevention targeting children as they transition into the period of youth and adolescence. Other important target populations for childhood obesity prevention and reduction interventions include children and youth living in the provinces rural regions and those coming from households with lower levels of parental education. When assessing changes in the prevalence of overweight and obesity over time and in the distribution of growth status across various segments of the population, it is ideal to use measured heights and weights for the determination of BMI status. Self-reported heights and weight data collected from youth aged 12-17 years and parent-reported height and weight data collected for children aged 11 years and younger are associated with respective underestimates and overestimates of the true prevalence of excess weight among children in these population groups. As described earlier, BMI is unable to differentiate between lean body mass and body fat, and its accuracy as an indicator of weight-related health risk in children is influenced by levels of physical fitness, ethnicity, frame size, and biological maturation. Possible indicators that might complement BMI in future research may include percent body fat and waist circumference. Children and youth who are overweight or obese are more likely to suffer from a number of health conditions, including hypertension and other cardiovascular disease risk factors, type 2 diabetes, obstructive sleep apnea, and asthma. Because of a lack of evidence on the associations between childhood obesity and the risk of developing various health conditions and chronic diseases later in life, it is not possible to accurately estimate the economic burden of obesity among children and youth. Recognizing that excess weight among children and youth tends to be maintained into adulthood, and that the costs of adult obesity in Alberta for 2005 were estimated at $1.27 billion, it is likely that overweight and obesity in childhood are also associated with, or pave the potential to lead to, substantial costs to the healthcare system. The information presented in this evidence brief provides only an overview of the highly complex issue of childhood obesity; however, it provides enough detail to support the dedication of time and resources towards research, programs, policies and other initiatives that will effectively reduce childhood obesity both through treatment and prevention.
— 22 —
AHS | Population and Public HealthChildhood overweight and obesity: Evidence from the Cost of Obesity in Alberta for
2005 Report
References (1) Lau DCW, Douketis JD, Morrison KM, Hramiak IM, Sharma AM, Ur E. 2006 Canadian clinical practice guidelines on
the management and prevention of obesity in adults and children [summary]. CMAJ 2007 04/10;176(8):S1-S13. (2) World Health Organization. Obesity and Overweight. 2006. (3) Cole TJ, Bellizzi MC, Flegal KM, Dietz WH. Establishing a standard definition for child overweight and obesity
worldwide: international survey. BMJ 2000 May 6;320(7244):1240-1243. (4) Kuczmarski RJ, Ogden CL, Grummer-Strawn LM, Flegal KM, Guo SS, Wei R, et al. CDC growth charts: United States.
Adv.Data 2000 Jun 8(314):1-27. (5) Shields M. Overweight and obesity among children and youth. Health Reports 2006 Aug;17(3):27-42. (6) Gibson RS. Principles of nutritional assessment. : Oxford University Press, USA; 2005. (7) Reilly JJ, Dorosty AR, Emmett PM. Identification of the obese child: adequacy of the body mass index for clinical
practice and epidemiology. Int.J.Obes. 2000;24(12):1623-1627. (8) Kendall O, Lipskie T, MacEachern S. Canadian Health Surveys, 1950-1997. Chronic Diseases in Canada 1997;17(3):27-
42. (9) Béland Y. Canadian community health survey—methodological overview. Health Reports 2002;13(3):9-14. (10) Statistics Canada. Canadian Community Health Survey. 2009; Available at: http://www.statcan.gc.ca/cgi-
bin/imdb/p2SV.pl?Function=getSurvey&SDDS=3226&lang=en&db=imdb&adm=8&dis=2. Accessed January 19, 2010.
(11) Thomas S, Wannell B. Combining cycles of the Canadian Community Health Survey. Health Reports 2009 Mar;20(1):53-58.
(12) Health Canada. Canadian Community Health Survey Cycle 2.2, Nutrition (2004): Guide to Accessing and Interpreting the Data. 2006.
(13) Tremblay MS, Gorber SC. Canadian health measures survey: brief overview. Canadian Journal of Public Health.Revue Canadienne de Sante Publique 2007;98(6):453-456.
(14) Giroux S. Canadian Health Measures Survey: Sampling strategy overview. Health Reports 2007;18. (15) Statistics Canada. National Longitudinal Survey of Children and Youth, 2007. 2007; Available at:
http://www.statcan.ca/cgi-bin/imdb/p2SV.pl?Function=getSurvey&SDDS=4450&lang=en&db=imdb&dbg=f&adm=8&dis=2. Accessed July 15, 2008.
(16) Statistics Canada. Measured Child Body Mass Index (BMI), by Age Group and Sex, Household Population Aged 2 to 17 Excluding Pregnant Females, Canadian Community Health Survey Cycle 2.2, Canada and Provinces, Occasional. 2007;CANSIM Table 105-2002, 2007.
(17) Gorber SC, Tremblay M, Moher D, Gorber B. A comparison of direct vs. self-report measures for assessing height, weight and body mass index: a systematic review. Obesity Reviews 2007;8(4):307-326.
(18) Shields M, Gorber SC, Tremblay MS. Effects of measurement on obesity and morbidity. Health Rep. 2008 Jun;19(2):77-84.
(19) Romero-Corral A, Somers VK, Sierra-Johnson J, Thomas RJ, Collazo-Clavell ML, Korinek J, et al. Accuracy of body mass index in diagnosing obesity in the adult general population. Int.J.Obes. 2008 Jun;32(6):959-966.
(20) Shields M, Gorber SC, Tremblay MS. Estimates of obesity based on self-report versus direct measures. Health Rep. 2008 Jun;19(2):61-76.
(21) Statistics Canada. Canadian Health Measures Survey: Cycle 1 Data Tables, 2007 to 2009. 2010;82-623-X. (22) Shields M. Nutrition: Findings from the Canadian Community Health Survey: Measured Obesity. Overweight
Canadian Children and Adolescents. 2005;82-620-MWE2005001. (23) Shields M, Tjepkema M. Regional differences in obesity. Health Reports 2006 Aug;17(3):61-67. (24) Janssen I, Boyce WF, Simpson K, Pickett W. Influence of individual- and area-level measures of socioeconomic status
on obesity, unhealthy eating, and physical inactivity in Canadian adolescents. Am.J.Clin.Nutr. 2006;83(1):139-145. (25) Phipps SA, Burton PS, Osberg LS, Lethbridge LN. Poverty and the extent of child obesity in Canada, Norway and the
United States. Obesity Reviews 2006;7(1):5. (26) Veugelers PJ, Fitzgerald AL. Prevalence of and risk factors for childhood overweight and obesity. Can.Med.Assoc.J.
2005;173(6):607.
— 23 —

AHS | Population and Public HealthChildhood overweight and obesity: Evidence from the Cost of Obesity in Alberta for
2005 Report
(27) Dietz WH. Health consequences of obesity in youth: childhood predictors of adult disease. Pediatrics 1998 Mar;101(3 Pt 2):518-525.
(28) Venn AJ, Thomson RJ, Schmidt MD, Cleland VJ, Curry BA, Gennat HC, et al. Overweight and obesity from childhood to adulthood: a follow-up of participants in the 1985 Australian Schools Health and Fitness Survey. Med.J.Aust. 2007;186(9):458.
(29) Whitaker RC, Wright JA, Pepe MS, Seidel KD, Dietz WH. Predicting obesity in young adulthood from childhood and parental obesity. N.Engl.J.Med. 1997;337(13):869.
(30) Ogden CL, Yanovski SZ, Carroll MD, Flegal KM. The epidemiology of obesity. Gastroenterology 2007 May;132(6):2087-2102.
(31) Moyer VA, Klein JD, Ockene JK, Teutsch SM, Johnson MS, Allan JD, et al. Screening for overweight in children and adolescents: where is the evidence? a commentary by the childhood obesity working group of the US Preventive Services Task Force. Pediatrics 2005 Jul;116(1):235-238.
(32) Ezzati M, Lopez AD, Rodgers A, Murray CJL editors. Comparative quantification of health risks: global and regional burden of disease attributable to selected major risk factors. Geneva, Switzerland: World Health Organization; 2004.
(33) Raine K. Overweight and Obesity in Canada: a Population Health Perspective. 2004. (34) Reilly JJ, Methven E, Mcdowell ZV, Hacking B, Alexander D, Stewart L, et al. Health consequences of obesity.
Archives of Disease in Childhood 2003;88:748-752. (35) Tauman R, Gozal D. Obesity and obstructive sleep apnea in children. Paediatric Respiratory Reviews 2006
Dec;7(4):247-259. (36) Freedman DS, Dietz WH, Srinivasan SR, Berenson GS. The relation of overweight to cardiovascular risk factors
among children and adolescents: the Bogalusa Heart Study. Pediatrics 1999 Jun;103(6 Pt 1):1175-1182. (37) Bjorge T, Engeland A, Tverdal A, Smith GD. Body mass index in adolescence in relation to cause-specific mortality: a
follow-up of 230,000 Norwegian adolescents. Am.J.Epidemiol. 2008;168(1):30. (38) Flaherman V, Rutherford GW. A meta-analysis of the effect of high weight on asthma. Arch.Dis.Child. 2006
Apr;91(4):334-339. (39) Government of Canada. The Well-Being of Canada's Young Children. 2003. (40) von Mutius E, Schwartz J, Neas LM, Dockery D, Weiss ST. Relation of body mass index to asthma and atopy in
children: the National Health and Nutrition Examination Study III. Thorax 2001 Nov;56(11):835-838. (41) Health Canada. Respiratory Disease in Canada. 2001. (42) Garner R, Kohen D. Changes in the prevalence of asthma among Canadian children. Health Reports 2008
Jun;19(2):45-50. (43) Public Health Agency of Canada. Life and Breath: Respiratory Disease in Canada. 2007. (44) Shaw J. Epidemiology of childhood type 2 diabetes and obesity. Pediatric Diabetes 2007;8:7. (45) Fagot-Campagna A. Emergence of type 2 diabetes mellitus in children: epidemiological evidence. J.Pediatr.Endocrinol.
2000;13(Suppl 6):1395-1402. (46) House of Commons Health Committee (UK). Obesity: Third Report of Session 2003-04, Annex I: The Economic
Costs of Obesity. 2004. (47) Pinhas-Hamiel O, Zeitler P. Acute and chronic complications of type 2 diabetes mellitus in children and adolescents.
The Lancet 2007;369(9575):1823-1831. (48) Redline S, Tishler PV, Schluchter M, Aylor J, Clark K, Graham G. Risk factors for sleep-disordered breathing in
children. Associations with obesity, race, and respiratory problems. American Journal of Respiratory & Critical Care Medicine 1999 May;159(5 Pt 1):1527-1532.
(49) Carter R,3rd, Watenpaugh DE. Obesity and obstructive sleep apnea: Or is it OSA and obesity?. Pathophysiology 2008 Aug;15(2):71-77.
— 24 —
AHS | Population and Public HealthChildhood overweight and obesity: Evidence from the Cost of Obesity in Alberta for
2005 Report
Appendix A: CDC BMI-for-age Growth Chart for Males aged 2-20 years (4)
— 25 —
AHS | Population and Public HealthChildhood overweight and obesity: Evidence from the Cost of Obesity in Alberta for
2005 Report
Appendix B: CDC BMI-for-age Growth Chart for Females aged 2-20 years (4)
— 26 —