children’s views on their lives and well-being in 16...
TRANSCRIPT

Children’s views on their lives and well-being in 16 countries:
A report on the Children’s Worlds survey of children aged
eight years old, 2013-15

Children’s Worlds Report: 8-years-old survey, 2013-15
2
Children’s views on their lives and well-being in 16 countries:
A report on the Children’s Worlds survey of children aged eight
years old, 2013-15
Acknowledgements The project team would like to thank the Jacobs Foundation for their generous funding which
made it possible to conduct this wave of the Children’s Worlds study and for their support
through the process of completing this work.
We would also like to thank the schools and other organisations within each country who
facilitated the survey and, most importantly, the 17,000 children who spent time completing the
survey and providing the views and experiences on which this report is based.
About this report This report has been prepared and edited by Gwyther Rees and Jonathan Bradshaw at the
University of York, UK and Sabine Andresen at Goethe Universität Frankfurt, Germany. It is
the product of a collaborative effort between the international team of researchers working on
this wave of the Children’s Worlds survey listed on the following page.
It can be cited as follows:
Rees, G., Andresen, S. & Bradshaw, J. (eds) (2016) Children’s views on their lives and well-being in
16 countries: A report on the Children’s Worlds survey of children aged eight years old, 2013-15. York,
UK: Children’s Worlds Project (ISCWeB)
Further information Further information about the Children’s Worlds project can be found on the project website at
www.isciweb.org.
If you have any queries about the project, please e-mail: [email protected]

Children’s Worlds Report: 8-years-old survey, 2013-15
3
Children’s Worlds 2013/15: International project team
Project Principal Investigators (Core Group):
Sabine Andresen, Faculty of Educational Science, Goethe University Frankfurt
Asher Ben-Arieh, The Paul Baerwald School of Social Work and Social Welfare, The Hebrew
University of Jerusalem and Haruv Institute
Jonathan Bradshaw, Social Policy Research Unit, University of York
Ferran Casas, EÍDIQV, University of Girona.
Gwyther Rees, Social Policy Research Unit, University of York
Project Co-ordinator:
Tamar Dinisman, International Survey of Children’s Well-Being (ISCWeB)
National Principal Investigators and Researchers:
Algeria: Habib Tillouine, Laboratory of Educational Processes and Social Context (Labo-PECS).
Faculty of Social Sciences, University of Oran
Colombia: Juanita Bernal, Yicel Nairobis Giraldo and Ofelia Roldan, International Centre for
Education and Human Development CINDE
Estonia: Dagmar Kutsar, Institute of Social Studies, University of Tartu
Ethiopia: Yehualashet Mekonen and Negussie Dejene, The African Child Policy Forum
Germany: Sabine Andresen, Johanna Wilmes, Faculty of Educational Science, Goethe University
Frankfurt and Renate Möller, Faculty of Educational Science, Bielefeld University
Israel: Asher Ben-Arieh, The Paul Baerwald School of Social Work and Social Welfare, The
Hebrew University of Jerusalem and Haruv Institute and Avital Kaye-Tzadok, Ruppin
Academic Centre
Malta: Professor Carmel Cefai, Center for Resilience and Socio-Emotional Health, University of
Malta
Nepal: Arbinda Lal Bhomi, Faculty of Education, Tribhuvan University, Kathmandu
Norway: Elisabeth Backe-Hansen, Nova
Poland: Dorota Strózik, Tomasz Strózik and Krzysztof Szwarc, The Poznań University of
Economics.
Romania: Sergiu Bălțătescu and Claudia Oșvat, Department of Sociology and Social Work,
University of Oradea
South Africa: Shazly Savahl, Sabirah Adams, Serena Isaacs, Gaironeesa Hendricks, Arnold
Matzdorff, Cassandra Wagenaar, Lameez Abrahams, Department of Psychology, University of
the Western Cape and Rose September, Department of Women, Children and People with
Disabilities.
South Korea: Bong Joo Lee, Jaejin Ahn, Joan Yoo and Sun Suk Kim, Seoul National University
Spain: Ferran Casas, Mònica González, Sara Malo, Dolors Navarro, Carme Montserrat, Ferran
Viñas, Carles Alsinet, Gemma Crous, Mireia Baena, Mireia Aligué, ERÍDIQV, University of
Girona.
Turkey: Serra Müderrisoğlu, Department of Psychology; Boğaziçi University, Abdullah Karatay,
Department of Social Work Üsküdar University; Pınar Uyan-Semerci, Department of
International Relations, Istanbul Bilgi University and Başak Ekim-Akkan, Social Policy Forum,
Boğaziçi University
United Kingdom: Gwyther Rees, Gill Main, and Jonathan Bradshaw, Social Policy Research
Unit, University of York.

Children’s Worlds Report: 8-years-old survey, 2013-15
4
Contents Introduction .......................................................................................................................................................................... 5
Life as a whole ................................................................................................................................................................... 10
Home and family ............................................................................................................................................................... 15
Money and possessions ................................................................................................................................................... 23
Friends and other relationships ..................................................................................................................................... 30
School................................................................................................................................................................................... 35
Local area ............................................................................................................................................................................ 47
Self ......................................................................................................................................................................................... 53
Time use .............................................................................................................................................................................. 57
Other aspects of life ......................................................................................................................................................... 71
Children’s rights ................................................................................................................................................................. 74
Overview ............................................................................................................................................................................. 78
References .......................................................................................................................................................................... 84

Children’s Worlds Report: 8-years-old survey, 2013-15
5
Chapter 1
Introduction
This is the second research report from the Wave 2 of the Children’s Worlds survey - an
international study about children’s lives and well-being from their own perspectives. The
project, which aims to gather a representative data from a range of countries, fills a significant
gap in evidence about children’s lives in terms of the diversity of countries involved, the broad
range of topics covered and the age groups surveyed.
Wave 2 of the study began in Autumn 2013 and so far has included representative samples of
over 56,000 children aged around 8, 10 and 12 years of age in 16 countries. The first report,
published in May 2015, presented initial findings for the older two age groups in the 15
countries which had completed the survey by that time. This report focuses on the 8-years-old
age group in 16 countries across four continents as shown in the table below. In some countries,
the survey was only conducted in part of the country as shown. The names of these countries
have been marked with an asterisk in all tables and charts.
Table 1: Countries included in this report
Country Coverage
Algeria Western region
Colombia Antioquia state
Estonia Whole country
Ethiopia Whole country
Germany Whole country (but 4 Federal states selected for sample)
Israel Whole country
Malta Whole country
Nepal Whole country (but 6 districts in 2 development regions selected for sample)
Norway Whole country
Poland Wielkopolska region
Romania Whole country
South Africa Western Cape province
South Korea Whole country
Spain Catalonia
Turkey Istanbul
United Kingdom England
The following two sections provide a brief introduction to the project and the survey. Fuller
details are available in the initial report (Rees & Main, 2015) and on the project website:
www.isciweb.org.
The project The Children’s Worlds project was initiated in 2009 at a meeting convened by UNICEF Regional
Office for the CEECIS in response to an identified gap in information about children’s lives and

Children’s Worlds Report: 8-years-old survey, 2013-15
6
well-being around the world. The meeting involved a number of researchers already involved
in research on children’s subjective well-being who subsequently formed a core group to take
the project forward. The initial vision of the project was to create a worldwide survey which
could inform policy makers, professionals, opinion leaders, parents and children themselves in
order to promote improvements to the quality of children’s lives. Conceptually the project is
part of a wider movement to develop positive, child-centred, self-report indicators of child well-
being (Ben-Arieh, 2008).
The first phase of work, which took place between 2009 and 2011, was to develop draft
questionnaires to gather children’s views which built on previous research and were also
appropriate to be used in a range of cultural contexts. Versions of questionnaires were
discussed and piloted with children in nine countries across four continents. Based on the
results of this development work, a questionnaire was finalised and then used in a large-scale
pilot involving over 34,000 children in 14 countries (Dinisman & Rees, 2014). This led to the
current phase of the project, funded by the Jacobs Foundation, which is the basis for this report.
The survey The survey has been developed as a collaborative project between researchers in the
participating countries, co-ordinated by a core group. Each national research team was
responsible for all aspects of conducting the survey in their country – based on a set of
guidelines covering issues such as questionnaire translation, sampling, ethics and practicalities
of administration.
The survey is based on three versions of a self-completion questionnaire for the three different
age groups of children around 8, 10 and 12 years old and was conducted in each country (or
region of a country) with a representative sample of children in mainstream schools. Further
details of the content of the 8-years-old questionnaire are provided at the beginning of each
findings-based chapter of the report.
Data from the survey was input on to computer by each national research team and then
checked and cleaned according to consistent procedures by a central data administrator.
Weightings were also calculated for the final data set in each country to correct for disparities
between the planned and actual samples.
The final sample for the 8-year-old survey in each country after data cleaning is shown in Table
2.

Children’s Worlds Report: 8-years-old survey, 2013-15
7
Table 2: The final 8-years-old sample in each country
Country Final sample
Algeria (Western) 1244
Colombia (Antioquia) 902
Estonia 1076
Ethiopia 953
Germany 1056
Israel 886
Malta 802
Nepal 975
Norway 930
Poland (Wielkopolska) 1021
Romania 1242
South Africa (W Cape) 996
South Korea 2432
Spain (Catalonia) 1032
Turkey (Istanbul) 959
UK (England) 990
Total 17496
Unweighted sample, after data cleaning
The questionnaire The questionnaire consisted of around 70 question items and was divided into sections
covering:
Individual characteristics
Home and people lived with
Money and possessions
Friends and other people
Local area
School
Time use
Life in general
There were four main types of question items:
1. Fact-based items: For example, age and gender.
2. Frequency items: For example, children were asked how often they spent time on certain
activities and response options were on a four-point scale labelled ‘Rarely or never’, ‘Less
than once a week’, ‘Once or twice a week’, ‘Every day or almost every day’. There was also
a ‘Don’t know’ option.
3. Agreement items: These consisted of statements with which children were asked to indicate
the extent of their agreement, using a five-point scale with the following response options: ‘I

Children’s Worlds Report: 8-years-old survey, 2013-15
8
do not agree’, ‘Agree a little bit’, ‘Agree somewhat’, ‘Agree a lot’, ‘Totally agree’. There was
also a ‘Don’t know’ option.
4. Satisfaction items: These asked children how happy they were with various aspects of life
and presented a five-point emoticon scale with tick boxes as shown below. This format was
different to that used in the 10- and 12-years-old surveys where an 11-point scale was used.
This is because it was found during piloting that the 11-point scale was not suitable for use
with the 8-years-old age group in some countries.
How happy do you feel with ...
Your family life
This report The purpose of this report is to provide a primarily descriptive overview of the broad findings
of the survey of 8-year-old children. It:
presents summary statistics for each question asked in the survey both overall and for
each country;
identifies any substantive gender differences;
draws attention to key differences and similarities between the findings for this age
group and the older age groups covered in the initial report;
provides an overview of findings for each topic and country included in the report.
The report does not present complex statistical analysis. There is an ongoing programme of
analysis of the survey data, the results of which will be published in working papers on the
project website and in academic journals.
Following this introductory chapter, the structure of the report consists of ten chapters (2 to 11)
focusing on the different broad topics covered in the survey questionnaire; and a final chapter
providing an overview of children’s satisfaction with different aspects of their lives and
drawing conclusions.
In considering the findings presented in this report, it is important to recognise the very
different contexts of children’s lives in the 16 countries. The diversity of the sample of countries
is a strength of the project but also introduces complexity.
For example, where we find (Chapter 2) that children in some countries have much greater
access to a range of material resources than in other countries, this must be viewed within the
economic context of very different levels of national wealth. Children’s time use (Chapter 11) is
another issue where the observed differences between countries in how children spend their
time need to be understood within the context of children’s lives in each country.
Additionally, there is an ongoing debate in the research literature on subjective well-being about
the cross-cultural comparability of self-report questions on people’s satisfaction with life or
particular aspects of life. There is evidence that people in different cultures respond differently
to such questions and that these differences place limits on the potential for straightforward
international comparisons and league tables of subjective well-being. This is an issue which we

Children’s Worlds Report: 8-years-old survey, 2013-15
9
are exploring as part of the study. We discuss this issue further in the concluding chapter of the
report.
So, while the report presents summary statistics in a way which aids cross-national
comparisons, the reader is advised to bear in mind the varying contexts of children’s lives across
the 16 countries and also the potential that at least some of the differences observed may be the
result of cultural response differences.
All findings presented in this report use weighted data. Weightings were calculated for each
country’s data set taking account of the sampling strategy and outcomes with the aim of
providing estimates which are as representative of the child population as possible.
Additionally, where pooled findings are presented for the whole data set, each country’s data is
weighted equally in generating the statistics.
The statistical comparisons of gender differences discussed in the report are based on t-tests
taking into account the complex sampling design in each country (stratification and clustering).
All differences noted as statistically significant refer to a p-value less than 0.001. This
significance level is used, due to the large number of comparisons being made, in order to
minimise the probability of a Type 1 error (false positive). Differences with higher p-values less
than 0.01 are referred to as marginally significant.
Due to rounding, the percentages in rows of tables and in charts may not add up to exactly
100%.
Children’s Worlds Report: 8-years-old survey, 2013-15
10
Chapter 2
Life as a whole
Overview Three different measures of children’s overall subjective well-being were included in the 8-
years-old survey.
There were two single-item questions asking about happiness with life as whole and happiness
with overall life up to now. These two questions used different response scales. The first item
used the five-point response scale with emoticons discussed in Chapter 1 which was used for
many of the questions in the questionnaire for this age group. The second item used an 11-
point response scale similar to those used in the questionnaires for the older two age groups.
This was the only question in this format and was placed at the end of the questionnaire to
avoid creating confusion. One of the intentions of this was to test the potential to use this
longer type of response scale with this age group.
The questionnaire also contained a set of five items intended to form a scale tapping into overall
life satisfaction with a five-point response scale. These were developed from an original scale
by Huebner (1991) as discussed in Rees & Main (2015).
The exact wording and response options for each item are shown in Box 1.
Box 1: Questions about overall well-being
Cognitive subjective well-being
Single items
How happy are you with your life as a whole?
Responses were on a five-point scale using symbolic faces as described in Chapter 1.
Up to now, are you happy with your overall life?
Responses were on an 11-point scale from ‘Not at all happy’ to ‘Totally happy’. This question
was not asked in Poland.
Multi-item1
Here are five sentences about how you feel about your life as a whole. Please tick a box to say how
much you agree with each of the sentences
My life is going well
My life is just right
I have a good life
I have what I want in life
The things in my life are excellent
Response options were on a 5-point scale from ‘I do not agree’ to ‘Totally agree’
1 This set of questions is derived from the Student Life Satisfaction Scale (Huebner, 1991). The first four items are taken
directly from that scale and the fifth is an additional item being tested for the first time.

Children’s Worlds Report: 8-years-old survey, 2013-15
11
Figures 1 to 3 show the distribution of responses to each of the above three measures. It is well
established in the research literature that most respondents to subjective well-being questions
rate themselves in the more positive half of the continuum (Cummins, 2003); and that the mean
scores for child populations tend to be higher than for adults (e.g. Casas et al., 2008). Such
skewed distributions present challenges for statistical analysis because many statistical
techniques require much more evenly-balanced2 data.
Figure 1: Distribution of responses to question about happiness with life as a whole (five-
point scale)
All countries, equally weighted by country
Figure 2: Distribution of responses to question about happiness with overall life up until
now (11-point scale)
All countries except Poland, equally weighted by country
2 Approximating to a normal distribution
1.8% 1.7%6.0%
16.5%
74.0%
0%
10%
20%
30%
40%
50%
60%
70%
80%
0 1 2 3 4
% o
f ch
ildre
n
Happiness with life as a whole (0 to 4)
0.9% 0.5% 0.5% 0.7% 1.1%5.1% 2.9% 4.4%
7.6%10.9%
65.4%
0%
10%
20%
30%
40%
50%
60%
70%
80%
0 1 2 3 4 5 6 7 8 9 10
% o
f ch
ildre
n
Happiness with overall life up until now (0 to 10)

Children’s Worlds Report: 8-years-old survey, 2013-15
12
Figure 3: Distribution of responses to life satisfaction scale (five items on five-point
agreement scale)
All countries, equally weighted by country
Because the distribution of the multi-item life satisfaction score in Figure 3 is more widely
dispersed than the other two single-item measures we focus on this variable for the remainder
of this chapter. Analysis recently undertaken of the data sets (Casas, 2016) suggests that the life
satisfaction score may be valid and suitable for cross-national comparisons, although the
possibility of cultural response differences needs to be borne in mind.
Table 3 presents a summary of some different comparisons between countries for this life
satisfaction score (which has been converted to a scale from zero to ten to simplify
interpretation).
The first column of figures shows the mean score for each country which varies from
7.5 in Ethiopia to 9.1 in Romania.
The third column of figures shows the percentage of children scoring less than five out
of 10 on the scale, ranging from 2.6% in Colombia to 12.4% in Ethiopia.
The fifth column of figures shows the percentage of children scoring right at the top of
the scale (10 out of 10). Here the highest percentage is in Romania (58.4%) and the
lowest in Nepal (13.3%).
The columns with blue type show the rank scores for each of these three measures and this
highlights some variation in rankings:
Many countries’ rankings are fairly similar for all three measures (e.g. Estonia, Ethiopia,
Germany, Romania and South Korea)
However there is more variability for some countries. In particular Turkey ranked 13th
for low well-being but second for very high well-being; while Nepal ranked 16th for
very high well-being but 10th for low well-being.
These types of variations highlight that it is important to use more than one approach to
comparing children’s well-being across countries. In the remainder of this report we show both
mean scores and percentages scoring below a specified score for all satisfaction variables.
2.4%2.0%
2.5%2.7%
3.7%6.8%
6.1%6.1%
10.1%
10.6%
41.0%
0%
5%
10%
15%
20%
25%
30%
35%
40%
45%
0 1 2 3 4 5 6 7 8 9 10 11 12 13 14 15 16 17 18 19 20
% o
f ch
ildre
n
Life satisfaction score (0 to 20)
6.1%

Children’s Worlds Report: 8-years-old survey, 2013-15
13
Table 3: Summary of statistics for life satisfaction by country
Mean score
(out of 10)
% with low well-being
(<5 out of 10)
% with very high well-being
(10 out of 10)
Mean Rank % Rank % Rank
Algeria* 8.78 6 4.7% 7 42.1% 8
Colombia* 8.93 3 2.6% 1 50.5% 5
Estonia 8.41 10 7.1% 11 35.5% 12
Ethiopia 7.49 16 12.4% 16 22.3% 15
Germany 8.39 12 7.9% 12 35.2% 13
Israel 8.89 4 3.8% 5 53.2% 3
Malta 8.60 8 5.6% 8 47.1% 6
Nepal 7.68 15 7.0% 10 13.3% 16
Norway 8.64 7 6.6% 9 37.1% 11
Poland* 9.00 2 3.9% 6 52.5% 4
Romania 9.08 1 2.7% 2 58.4% 1
S Africa* 8.54 11 3.7% 4 38.8% 10
S Korea 7.91 14 9.2% 15 30.0% 14
Spain* 8.83 5 3.0% 3 44.9% 7
Turkey* 8.59 9 8.2% 13 55.3% 2
UK* 8.39 13 9.1% 14 40.9% 9
All 8.50 6.1% 41.0%
All countries
There was a slight tendency in the pooled sample for girls to have higher life satisfaction (8.56
out of 10) than boys (8.44 out of 10) but this was only marginally statistically significant. There
were no significant gender differences in life satisfaction in individual countries.
Summary and discussion Average levels of satisfaction with life as a whole (as measured by a five-item scale derived
from work by Huebner, 1991) were typically quite high for this age group - with an overall
mean score across the sample as a whole of around 8.5 out of ten and around 6% of children
scoring less than five out of ten (low well-being). However there was evidence of variation
across the 16 countries. Mean scores varied from below eight out of ten in Ethiopia, Nepal and
South Korea to over nine out of ten in Poland and Romania. Looking at the percentage of
children with low well-being creates a slightly different picture, with Ethiopia, South Korea and
the UK being at the bottom of the rankings and Colombia, Romania and Spain at the top.
To the extent that it is valid to make comparisons of raw summary statistics for life satisfaction
between countries, then the above findings raise important questions about the sources of these
variations. A working paper (Bradshaw & Rees, 2016, forthcoming) has begun to explore this
issue in relation to the Children’s Worlds data for 10- and 12-year-olds and has found that the
cross-national variations are not easily explained by macro indicators such as GDP per capita,
which have been found to have some explanatory power in research on adults’ life satisfaction
(Helliwell et al., 2015). On the other hand, differences in social relationships between countries
appear to be salient. More analysis of this kind is needed, ideally with larger samples of
countries, but it seems likely that the factors explaining international variations in children’s

Children’s Worlds Report: 8-years-old survey, 2013-15
14
subjective well-being are different from those explaining variations in adults’ subjective well-
being.

Children’s Worlds Report: 8-years-old survey, 2013-15
15
Chapter 3
Home and family
Overview Children were asked 12 questions about their home life:
Five agreement questions
Four satisfaction questions
Three time use questions (which are discussed in Chapter 9)
The agreement and satisfaction questions are shown in the box below.
Box 2: Home and family: Agreement and satisfaction questions
Agreement questions:
I feel safe at home
I have a quiet place to study at home
My parents (or the people who look after me) listen to me and take what I say into account
We have a good time together in my family
My parents (or the people who look after me) treat me fairly
Answers were given on a five-point, unipolar scale, with responses ranging from ‘I do not agree’
to ‘Totally agree’.
Happiness questions
How happy are you with...
The house or flat where you live
The people who live with you
All the other people in your family
Your family life
Responses were on a five-point scale using symbolic faces as described in Chapter 1.
The third satisfaction item was not asked in Poland.
The overall responses to the agreement questions for the whole sample (equally weighted by
country and age group) are shown in Table 4. The majority of children totally agreed with all
five statements. The highest level of total agreement was for feeling safe at home (68%).

Children’s Worlds Report: 8-years-old survey, 2013-15
16
Table 4: Agreement questions about home and family life
Not at all A little Somewhat A lot Totally
I feel safe at home 4% 4% 6% 17% 68%
I have a quiet place to study at home 11% 8% 10% 20% 51%
My parents listen to me and take what
I say into account. 5% 7% 12% 21% 55%
We have a good time together in my
family 4% 4% 8% 18% 67%
My parents treat me fairly 5% 5% 9% 18% 63%
8 year old survey, all countries, equally weighted by country
Figure 4 shows the mean scores and the percentage of children who scored less than three out
of four for the four happiness items about home and family. Mean scores for the whole data set
(equally weighted by country) were around 3.5 to 3.6 out of 4 for all four items. The
percentages of children with low satisfaction varied more widely than the means, and more
than one in eight scored less than three out of four for satisfaction with people in their family
who they didn’t live with.
Figure 4: Satisfaction questions about home and family life
8 year old survey, all countries, equally weighted by country
Overall there was a tendency for girls to be a little more positive than boys about all nine
questions covered in this chapter. The gender differences were statistically significant at the
level of the whole sample.
Variations by country The charts on the following pages shows the distribution of responses to each of the nine
questions above by country. There were substantial variations between countries for the five
agreement questions. Differences were less marked for mean scores on the four satisfaction
3.58
3.48
3.58
3.63
10%
13%
9%
8%
Family life
Other family
People lived with
House or flat
% not happy (<3 out of 4)
Mean happiness (out of 4)

Children’s Worlds Report: 8-years-old survey, 2013-15
17
questions although there were still evident variations in percentages of children with low levels
of satisfaction.
Figure 5: Level of agreement with ‘I feel safe at home’ by country
All countries
Figure 6: Level of agreement with ‘I have a quiet place to study at home’ by country
All countries
44%
45%
55%
59%
65%
69%
70%
71%
71%
74%
75%
76%
77%
77%
78%
86%
0% 10% 20% 30% 40% 50% 60% 70% 80% 90% 100%
Nepal
Ethiopia
S Korea
Algeria*
Malta
UK*
Germany
Turkey
S Africa*
Norway
Israel
Romania
Estonia
Spain*
Colombia*
Poland*
% of children
Not at all A little Somewhat A lot Totally
24%
30%
38%
39%
41%
47%
50%
51%
52%
55%
57%
57%
60%
60%
70%
86%
0% 10% 20% 30% 40% 50% 60% 70% 80% 90% 100%
Ethiopia
UK*
Malta
Nepal
Germany
Algeria*
Israel
Norway
S Korea
Spain*
Turkey
S Africa*
Colombia*
Estonia
Romania
Poland*
% of children
Not at all A little Somewhat A lot Totally

Children’s Worlds Report: 8-years-old survey, 2013-15
18
Figure 7: Level of agreement with ‘We have a good time together in my family’ by country
All countries
Figure 8: Level of agreement with ‘My parents listen to me and take what I say into account’
by country
All countries
39%
41%
56%
59%
59%
64%
69%
69%
70%
72%
73%
75%
77%
79%
80%
85%
0% 10% 20% 30% 40% 50% 60% 70% 80% 90% 100%
Nepal
Ethiopia
S Korea
Algeria*
Germany
UK*
Romania
Turkey
Malta
Colombia*
Israel
S Africa*
Spain*
Estonia
Norway
Poland*
% of children
Not at all A little Somewhat A lot Totally
36%
39%
45%
51%
52%
52%
55%
56%
56%
58%
59%
60%
60%
61%
64%
70%
0% 10% 20% 30% 40% 50% 60% 70% 80% 90% 100%
Ethiopia
Nepal
S Korea
Turkey
Estonia
UK*
Malta
S Africa*
Germany
Spain*
Algeria*
Norway
Romania
Israel
Poland*
Colombia*
% of children
Not at all A little Somewhat A lot Totally

Children’s Worlds Report: 8-years-old survey, 2013-15
19
Figure 9: Level of agreement with ‘My parents treat me fairly’ by country
All countries
Figure 10: Level of satisfaction with ‘the house or flat where you live’ by country
All countries
43%
51%
54%
58%
58%
59%
62%
63%
65%
65%
66%
68%
68%
75%
78%
79%
0% 10% 20% 30% 40% 50% 60% 70% 80% 90% 100%
Nepal
S Korea
Turkey
Malta
Germany
Ethiopia
S Africa*
UK*
Estonia
Algeria*
Norway
Israel
Spain*
Romania
Poland*
Colombia*
% of children
Not at all A little Somewhat A lot Totally
3.39
3.41
3.53
3.53
3.58
3.59
3.61
3.61
3.64
3.64
3.70
3.72
3.75
3.76
3.76
3.79
14.4%
14.8%
10.4%
10.4%
10.0%
7.3%
8.4%
9.2%
5.9%
6.0%
7.1%
5.8%
4.8%
3.6%
4.2%
3.0%
Nepal
Ethiopia
S Africa*
UK*
Malta
Algeria*
Estonia
Israel
S Korea
Germany
Colombia*
Norway
Spain*
Romania
Poland*
Turkey
% not happy (<3 out of 4)
Mean happiness (out of 4)

Children’s Worlds Report: 8-years-old survey, 2013-15
20
Figure 11: Level of satisfaction with ‘the people who live with you’ by country
All countries
Figure 12: Level of satisfaction with ‘all the other people in your family’ by country
All countries except Poland (where this question was not asked)
3.20
3.25
3.43
3.50
3.51
3.58
3.58
3.63
3.67
3.67
3.68
3.70
3.71
3.71
3.74
3.74
20.2%
19.4%
11.8%
10.9%
12.1%
7.7%
9.0%
8.6%
7.6%
6.4%
6.1%
6.1%
3.8%
6.0%
4.5%
5.2%
Nepal
Ethiopia
S Africa*
Estonia
Israel
Algeria*
Germany
UK*
Malta
S Korea
Colombia*
Poland*
Turkey*
Spain*
Romania
Norway
% not happy (<3 out of 4)
Mean happiness (out of 4)
2.98
3.01
3.13
3.31
3.33
3.46
3.51
3.52
3.56
3.59
3.69
3.73
3.74
3.74
3.78
28.4%
30.6%
23.6%
17.1%
15.1%
12.9%
12.0%
12.3%
9.6%
6.7%
6.4%
5.0%
4.8%
4.8%
3.9%
Estonia
Ethiopia
Nepal
UK*
Turkey*
S Africa*
Israel
Malta
Algeria*
Germany
Colombia*
S Korea
Romania
Spain*
Norway
% not happy (<3 out of 4)
Mean happiness (out of 4)

Children’s Worlds Report: 8-years-old survey, 2013-15
21
Figure 13: Level of satisfaction with ‘your family life’ by country
8 year old survey, all countries
Although a similar gender pattern was observed in most countries as for the pooled sample –
with girls tending to answer a little more positively than boys – the differences were small in
magnitude and generally not statistically significant.
Summary and discussion An overview of rankings3 for the 16 countries for all nine questions considered in this chapter is
shown in Table 5. To aid interpretation, the top five rankings for each question are highlighted
in blue and the lowest five in orange.
It can be seen that Poland scores relatively highly for this aspect of life being ranked in
the top five for all questions asked. Romania is ranked highly for eight of the nine
questions (with the exception of having a good time together with family) and Spain for
seven questions.
Nepal is ranked at the lower end for all questions and Ethiopia for eight of the nine
questions.
There is a fairly uniform picture for most countries across the nine questions in this
theme, but there are exceptions including Turkey (with rankings from first to 14th) and
Israel (with rankings from third to 12th).
It is notable that the countries at the bottom of the rankings (e.g. Nepal, Malta, Ethiopia,
South Africa and the UK in Figure 13) are highly diverse. An important direction for
future comparative research on children’s feelings about family life would be to develop
3 Based on mean scores for satisfaction items and the percentage of children totally agreeing for the agreement items.
3.22
3.23
3.30
3.51
3.53
3.57
3.59
3.63
3.64
3.65
3.66
3.70
3.73
3.73
3.75
3.79
19.6%
22.4%
16.4%
11.8%
11.3%
8.4%
8.7%
8.1%
7.5%
8.1%
6.4%
6.7%
5.0%
5.5%
4.7%
4.6%
Nepal
Malta
Ethiopia
S Africa*
UK*
S Korea
Estonia
Norway
Germany
Israel
Algeria*
Colombia*
Poland*
Turkey*
Romania
Spain*
% not happy (<3 out of 4)
Mean happiness (out of 4)

Children’s Worlds Report: 8-years-old survey, 2013-15
22
an understanding of the reasons for these patterns, considering the context of family life
in each country.
Table 5: Home and Family – Summary of rankings by country for each question
Safe
Place to
study
Parents
listen
Parents
treat
fairly
Have
good
time
House
or flat
People
lived
with
Other
people
in family
Family
life
Algeria* 13 11 6 7 13 11 11 7 6
Colombia* 2 4 1 1 7 6 6 5 5
Estonia 4 3 12 8 3 10 13 15 10
Ethiopia 15 16 16 11 15 15 15 14 14
Germany 10 12 8 12 12 7 10 6 8
Israel 6 10 3 5 6 9 12 9 7
Malta 12 14 10 13 8 12 8 8 15
Nepal 16 13 15 16 16 16 16 13 16
Norway 7 9 5 6 2 5 1 1 9
Poland* 1 1 2 2 1 2 5 4
Romania 5 2 4 3 10 3 2 3 2
S Africa* 8 5 9 10 5 14 14 10 13
S Korea 14 8 14 15 14 8 7 4 11
Spain* 3 7 7 4 4 4 3 2 1
Turkey* 9 6 13 14 9 1 4 11 3
UK* 11 15 11 9 11 13 9 12 12

Children’s Worlds Report: 8-years-old survey, 2013-15
23
Chapter 4
Money and possessions
In this chapter we look at five factual and two evaluative questions about economic
circumstances that were included in the questionnaire for eight-year-olds.
Factual questions Children were asked five questions about the resources to which they had access, as shown
below. These are a sub-set of the questions asked of older children.
Box 3: Fact-based questions about economic circumstances
Which of the following things do or don’t you have?
Clothes in good condition to go to school in
Access to a computer at home
Access to the internet
A family car for transportation
A television at home that you can use
Response options were ‘Yes’, ‘No’ and ‘Don’t know’. ‘Don’t know’ responses were treated as
missing data.
The final item about television was not asked in Estonia, Germany and Poland.
The two questions about technology items were not asked of some sub-groups of children in
Israel.
Table 6 shows the proportion of children who said that they had access to each item in the list
above. The large majority of children in all countries said that they had clothes in good
condition to go to school in although the percentage was somewhat lower in Ethiopia and
Turkey than in other countries. For the other four questions there were some large differences.
In particular a much smaller proportion of children in Ethiopia and Nepal had access to
computers, the internet and a family car than in other countries. Additionally, there were
variations between other countries. For example, less than half of children in Algeria had access
to the internet and less than half of children in Colombia had a family car.

Children’s Worlds Report: 8-years-old survey, 2013-15
24
Table 6: Percentage of children having access to material items by country
Good
clothes Computer Internet Family car TV
Algeria* 97% 55% 46% 61% 93%
Colombia* 97% 74% 68% 45% 97%
Estonia 99% 91% 86% 86% na
Ethiopia 85% 2% 2% 3% 26%
Germany 95% 74% 71% 90% na
Israel 98% 91% 89% 91% 94%
Malta 98% 90% 93% 93% 98%
Nepal 96% 12% 6% 9% 64%
Norway 100% 91% 94% 96% 99%
Poland* 99% 94% 91% 91% na
Romania 99% 85% 76% 65% 96%
S Africa* 99% 67% 58% 78% 95%
S Korea 99% 96% 95% 92% 96%
Spain* 97% 89% 88% 89% 98%
Turkey 89% 75% 64% 61% 97%
UK* 98% 87% 88% 84% 98%
Individual items can be combined to provide a summary of the material well-being of children
across and within the different participating countries. Because some countries did not ask
about access to a television, this item has been omitted from the scale in this international report
(but may be used in individual countries). Using the pooled data, children lacked on average
around 0.9 of the items, with the mean number of items lacked ranging from 0.2 in South Korea
to 3.1 in Ethiopia as shown in Figure 14.
Inequality between children within countries in their access to resources also provides an
interesting source of information on material well-being within and between countries.
Standard deviations in the number of items children lacked ranged from a low (least inequality)
of around 0.5 in in Norway to a high of around 1.1 (most inequality) in Colombia (Figure 15).

Children’s Worlds Report: 8-years-old survey, 2013-15
25
Figure 14: Mean number of items lacked by country
All countries
Figure 15: Inequalities in access to material items by country
All countries
3.08
2.77
1.38
1.14
1.09
0.99
0.73
0.67
0.42
0.38
0.37
0.31
0.25
0.24
0.18
0.17
0 1 2 3 4
Ethiopia
Nepal
Algeria*
Colombia*
Turkey
S Africa*
Romania
Germany
UK*
Estonia
Spain*
Israel
Malta
Poland*
Norway
S Korea
Number of items lacked
1.13
1.10
1.10
1.09
0.98
0.88
0.77
0.74
0.69
0.67
0.66
0.58
0.58
0.51
0.50
0.45
0.0 0.2 0.4 0.6 0.8 1.0 1.2 1.4
Colombia*
Turkey
Algeria*
S Africa*
Romania
Germany
UK*
Estonia
Nepal
Spain*
Israel
Poland*
Malta
Ethiopia
S Korea
Norway
Inequalities in items lacked (standard deviations)

Children’s Worlds Report: 8-years-old survey, 2013-15
26
Evaluative questions Children were asked two evaluative questions about money – one satisfaction question and one
agreement question. These questions were in a section of the questionnaire entitled ‘Money and
things you have’ and followed the set of questions about personal and household possessions
discussed in Chapter 3. Question wordings were as follows.
Box 4: Questions about money and possessions
How happy are you with all the things you have?
Responses were on a five-point scale using symbolic faces as described in Chapter 1.
How often do you worry about how much money your family has?
Responses were on an four-point scale with response options being ‘Never’, ‘Sometimes’, ‘Often’
and ‘Always’
(This question was not asked in the UK as, during piloting, children in that country expressed
the view that the question was too sensitive).
Overall responses for the pooled data are shown in the two charts below. The mean score for
the satisfaction question was quite high and only around one in 12 children across the whole
sample scored less than three out of four.
Figure 16: Satisfaction with ‘the things you have’
All countries, equally weighted by country
However, more than one in three children said that they ‘often’ or ‘always’ worried about their
family’s money situation.
Figure 17: Frequency of worrying about family money
All countries except UK, equally weighted by country
The following charts summarise children’s responses to these two questions by country.
Figure 18 shows the mean scores and percentage with low satisfaction (less than three out of
four) for the satisfaction question. Children in Poland and Spain had the highest mean scores
3.64 8%The things you
have
% not happy (<3 out of 4)
Mean happiness (out of 4)
32% 33%
12%
23%
0%
5%
10%
15%
20%
25%
30%
35%
Never Sometimes Often Always

Children’s Worlds Report: 8-years-old survey, 2013-15
27
and the smallest percentages with low scores. Children in Ethiopia were the least satisfied. It is
notable that the next two lowest scoring countries – Nepal and South Korea – had comparable
scores even though measures of economic prosperity (GDP per capita) in the two countries are
very different.
Figure 18: Satisfaction with ‘the things you have’ by country
All countries
Figure 19 shows the distribution of responses to the question about worrying about family
money in each country. The percentage of children ‘always’ worrying about family money
ranged from 4% in South Korea to 34% in Israel.
2.89
3.43
3.49
3.58
3.62
3.64
3.64
3.70
3.72
3.75
3.78
3.79
3.80
3.80
3.83
3.84
32.5%
12.1%
10.0%
7.5%
7.8%
7.8%
7.2%
4.8%
4.4%
4.8%
3.8%
4.0%
3.3%
4.2%
3.0%
2.5%
Ethiopia
Nepal
S Korea
Estonia
Algeria*
UK*
S Africa*
Norway
Germany
Israel
Turkey*
Colombia*
Romania
Malta
Spain*
Poland*
% not happy (<3 out of 4)
Mean happiness (out of 4)

Children’s Worlds Report: 8-years-old survey, 2013-15
28
Figure 19: Level of worry about ‘how much money your family has’ by country
All countries except UK
There were almost no significant gender variations within countries in relation either to the
satisfaction question or worries about family money. The only exception was in South Korea
where boys were significantly less satisfied than girls with the things they had. It should be
noted that the sample size in South Korea was substantially larger than in other countries and
this will increase the likelihood of statistically significant results for differences of relatively
small magnitude.
Summary and discussion Table 7 shows rankings for a variety of summary statistics for the questions covered in this
chapter as follows:
● Column 1: The mean number of items lacked (out of 4). Higher rankings are for lower
number of items lacked
● Column 2: The standard deviations of mean number of items lacked. Higher rankings
are for lower levels of inequality
● Column 3: The mean satisfaction with money and things. Higher rankings are for
higher mean scores.
● Column 4: The percentage of children with low satisfaction with money and things.
Higher rankings are for lower percentages.
● Column 5: The mean score for worries about family money. Higher rankings are for
lower mean scores (i.e. fewer worries)
34%
32%
30%
30%
29%
29%
28%
27%
25%
25%
19%
17%
15%
9%
4%
0% 10% 20% 30% 40% 50% 60% 70% 80% 90% 100%
Israel
Colombia*
Spain*
Nepal
Turkey
S Africa*
Malta
Estonia
Algeria*
Romania
Poland*
Ethiopia
Norway
Germany
S Korea
% of children
Never Sometimes Often Always

Children’s Worlds Report: 8-years-old survey, 2013-15
29
● Column 6: The percentage of children who ‘always’ worried about family money.
Higher rankings are for lower percentages.
The top five rankings for each statistic are highlighted in blue and the bottom five in orange. It
is informative that only one country ranked consistently high or low across the different
indicators. This was Poland which was in the top five countries for all six indicators.
In contrast, there are some very sharp disparities in the rankings for some countries. South
Korea ranked first for the fewest items lacked, second for equality in items lacked and first for
children having the lowest levels of worries about family money (based on both means and
percentages); but it also ranked 14th out of 16 countries for satisfaction with money and things.
Ethiopia was ranked lowest for satisfaction and mean number of items lacked, but had
relatively low levels of inequality in items lacked and low levels of worry about family money.
Children in Spain were highly satisfied with their own material situations but also had high
levels of worries about family money. Similar observations can be made about a number of the
other countries.
Overall, these patterns suggests that children’s views and experiences of this issue are multi-
faceted and reinforces the importance of looking at this issue from a number of different angles,
both objective and subjective.
Table 7: Money and Possessions– Summary of rankings by country for each question
Mean items
lacked
Inequality in
items lacked
Mean
satisfaction
Low
satisfaction
Mean
worries
High
worries
Algeria* 14 14 12 12 9 6
Colombia* 13 16 5 5 14 14
Estonia 7 9 13 11 12 8
Ethiopia 16 3 16 16 3 4
Germany 9 11 8 7 2 2
Israel 5 6 7 9 11 15
Malta 4 4 3 6 7 9
Nepal 15 8 15 15 13 12
Norway 2 1 9 8 4 3
Poland* 3 5 1 1 5 5
Romania 10 12 4 3 10 7
S Africa* 11 13 10 10 6 10
S Korea 1 2 14 14 1 1
Spain* 6 7 2 2 15 13
Turkey* 12 15 6 4 8 11
UK* 8 10 11 13 na na
All countries, except family money worries question which was not asked in the UK

Children’s Worlds Report: 8-years-old survey, 2013-15
30
Chapter 5
Friends and other relationships
Overview Children were asked seven questions about their friendships and other relationships:
Two agreement questions
Two satisfaction questions
Three time use questions
The agreement and satisfaction questions are shown in the box below. The three questions
about time use are discussed in Chapter 9.
Box 5: Friends and other relationships: Agreement and satisfaction questions
Agreement questions:
My friends are usually nice to me
I have enough friends
Answers were given on a five-point, unipolar scale, with responses ranging from ‘I do not agree’
to ‘Totally agree’.
Satisfaction questions
How happy are you with...
Your friends
Your relationships with people in general
Responses were on a five-point scale using symbolic faces as described in Chapter 1.
The overall responses to the agreement and satisfaction questions are shown in Table 8 and
Figure 20 below. In general, across the whole sample, children were positive about their
friendships with more than half of all the children totally agreeing that their friends were
usually nice to them and that they had enough friends. On the other hand it is notable that
there were some children who did not agree at all with each question. These were a small
proportion of the population but nevertheless would add up to substantial numbers of children
who do not appear to have positive relationships with friends.
Table 8: Agreement questions about friendships
Not at all A little Somewhat A lot Totally
My friends are usually nice to me 4% 6% 11% 22% 57%
I have enough friends 5% 5% 7% 17% 65%
All countries, equally weighted by country

Children’s Worlds Report: 8-years-old survey, 2013-15
31
Levels of satisfaction with friendships were higher than levels of satisfaction with relationships
in general.
Figure 20: Satisfaction questions about friendships and relationships in general
All countries, equally weighted by country
For three of the above four questions (friends being nice and satisfaction with friendships and
relationships in general) girls responded significantly more positively than boys across the
pooled sample, although the differences were not large:
59% of girls totally agreed that their friends were usually nice to them compared to 55%
of boys
Mean satisfaction with friendships was 3.57 for girls and 3.53 for boys
Mean satisfaction with relationships in general was 3.39 for girls and 3.29 for boys
Variations by country The four charts below provide a summary of levels of agreement and satisfaction for the four
questions being considered in this chapter for each country.
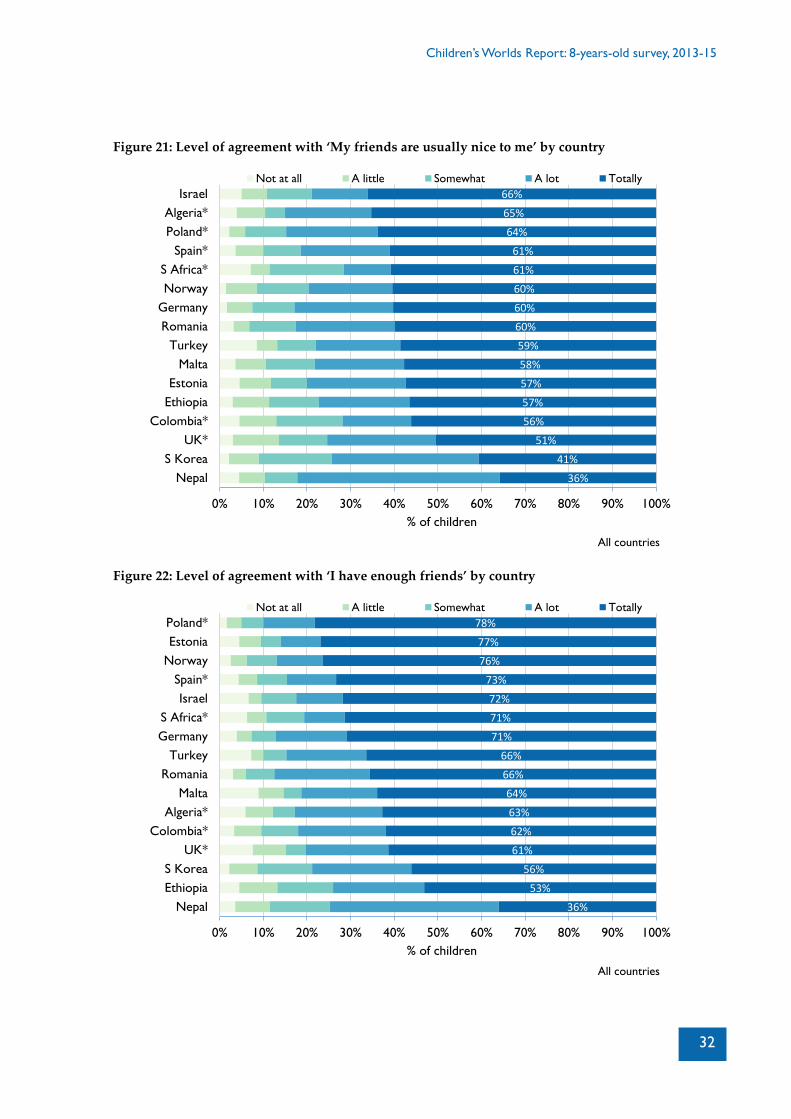
In 14 of the 16 countries the majority of children totally agreed that their friends were
usually nice to them. The exceptions are Nepal and South Korea. The countries with
the highest percentages of children not agreeing at all with this statement were Turkey
(8%) and South Africa (7%).
In all countries except Nepal, most children ‘totally’ agreed that they have enough
friends. The highest percentages of children not agreeing at all with this statement
were in Malta (9%) and the UK (8%).
Satisfaction with friends was relatively high but there was a diverse set of six countries
– Ethiopia, Nepal, South Africa, South Korea, Estonia and the UK - where more than
10% of children scored lower than three out of four for this question.
Mean scores for satisfaction with relationships in general tended to be lower than for
satisfaction with friends and in six countries – South Korea, Malta, Israel, Ethiopia,
Nepal and South Africa – more than one in five children were not happy with this
aspect of their lives.
Differences between girls and boys within countries tended to follow the same pattern as noted
above with girls giving more positive answers than boys although the differences were small
and most were not statistically significant.
3.34
3.55
16%
9%
Relationships in general
Friends
% not happy (<3 out of 4)
Mean happiness (out of 4)
Children’s Worlds Report: 8-years-old survey, 2013-15
32
Figure 21: Level of agreement with ‘My friends are usually nice to me’ by country
All countries
Figure 22: Level of agreement with ‘I have enough friends’ by country
All countries
36%
41%
51%
56%
57%
57%
58%
59%
60%
60%
60%
61%
61%
64%
65%
66%
0% 10% 20% 30% 40% 50% 60% 70% 80% 90% 100%
Nepal
S Korea
UK*
Colombia*
Ethiopia
Estonia
Malta
Turkey
Romania
Germany
Norway
S Africa*
Spain*
Poland*
Algeria*
Israel
% of children
Not at all A little Somewhat A lot Totally
36%
53%
56%
61%
62%
63%
64%
66%
66%
71%
71%
72%
73%
76%
77%
78%
0% 10% 20% 30% 40% 50% 60% 70% 80% 90% 100%
Nepal
Ethiopia
S Korea
UK*
Colombia*
Algeria*
Malta
Romania
Turkey
Germany
S Africa*
Israel
Spain*
Norway
Estonia
Poland*
% of children
Not at all A little Somewhat A lot Totally

Children’s Worlds Report: 8-years-old survey, 2013-15
33
Figure 23: Level of satisfaction with ‘your friends’ by country
All countries
Figure 24: Level of satisfaction with ‘your relationships with people in general’ by country
All countries
3.31
3.41
3.43
3.45
3.52
3.52
3.54
3.55
3.56
3.56
3.61
3.62
3.65
3.67
3.72
3.73
18.0%
12.4%
11.3%
10.6%
9.8%
10.4%
11.2%
7.5%
8.2%
8.6%
7.4%
5.4%
6.2%
7.2%
4.9%
5.2%
Ethiopia
Nepal
S Korea
Estonia
Israel
UK*
S Africa*
Romania
Germany
Colombia*
Norway
Poland*
Algeria*
Malta
Turkey*
Spain*
% not happy (<3 out of 4)
Mean happiness (out of 4)
3.02
3.14
3.14
3.15
3.22
3.22
3.24
3.35
3.36
3.38
3.46
3.51
3.54
3.56
3.56
3.58
27.7%
23.7%
25.5%
24.5%
19.3%
20.1%
20.0%
12.6%
15.0%
15.4%
12.0%
9.8%
11.1%
10.5%
9.3%
6.3%
S Korea
Ethiopia
Malta
Israel
Estonia
Nepal
S Africa*
Germany
UK*
Colombia*
Poland*
Romania
Turkey*
Spain*
Algeria*
Norway
% not happy (<3 out of 4)
Mean happiness (out of 4)

Children’s Worlds Report: 8-years-old survey, 2013-15
34
Summary and discussion Rankings for the scores on each of the four variables considered in this chapter are shown in
Table 9. Spain ranked consistently highly for all four questions while South Korea and Ethiopia
ranked consistently low. However for other countries there were some surprising patterns. For
example, children in Israel were relatively likely to agree that their friends were nice (ranked
first out of 16) and that they had enough friends (ranked fifth) yet were in the lowest five
countries for satisfaction with friends (12th) and relationships in general (13th). The opposite
was the case in Malta which was ranked 10th for the first two questions but third for satisfaction
with friends. Algeria ranked high for satisfaction with friends and agreeing that friends were
nice but relatively low for having enough friends.
Part of the explanation for these patterns may be that there was a relatively low level of
variation in the mean satisfaction scores across countries. This has an added impact when mean
scores are converted rankings. For example Israel was ranked 12th for satisfaction with friends
but the three next highest countries (UK, South Africa and Romania) only had marginally
higher means (see Figure 23). However, this does not entirely explain the picture and
discussions with children would be helpful in particular countries to try to understand the way
children perceive the different questions posed and how this affects their responses.
Table 9: Friends and other relationships – Summary of rankings by country for each question
Friends nice Enough friends Satisfied friends
Satisfied
relationships
Algeria* 2 11 4 2
Colombia* 13 12 7 7
Estonia 11 2 13 12
Ethiopia 12 15 16 15
Germany 7 7 8 9
Israel 1 5 12 13
Malta 10 10 3 14
Nepal 16 16 15 11
Norway 6 3 6 1
Poland* 3 1 5 6
Romania 8 9 9 5
S Africa* 5 6 10 10
S Korea 15 14 14 16
Spain* 4 4 1 3
Turkey* 9 8 2 4
UK* 14 13 11 8
Children’s Worlds Report: 8-years-old survey, 2013-15
35
Chapter 6
School
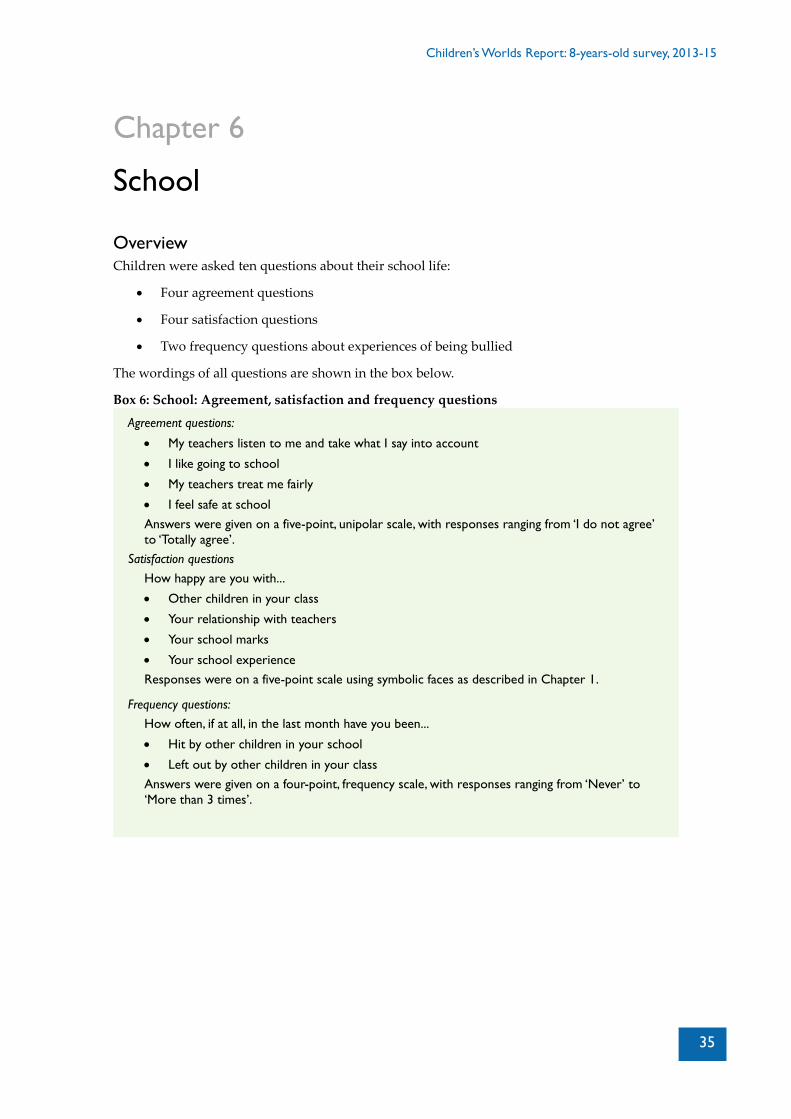
Overview Children were asked ten questions about their school life:
Four agreement questions
Four satisfaction questions
Two frequency questions about experiences of being bullied
The wordings of all questions are shown in the box below.
Box 6: School: Agreement, satisfaction and frequency questions
Agreement questions:
My teachers listen to me and take what I say into account
I like going to school
My teachers treat me fairly
I feel safe at school
Answers were given on a five-point, unipolar scale, with responses ranging from ‘I do not agree’
to ‘Totally agree’.
Satisfaction questions
How happy are you with...
Other children in your class
Your relationship with teachers
Your school marks
Your school experience
Responses were on a five-point scale using symbolic faces as described in Chapter 1.
Frequency questions:
How often, if at all, in the last month have you been...
Hit by other children in your school
Left out by other children in your class
Answers were given on a four-point, frequency scale, with responses ranging from ‘Never’ to
‘More than 3 times’.

Children’s Worlds Report: 8-years-old survey, 2013-15
36
Satisfaction and agreement questions The overall responses to the agreement and satisfaction questions are shown in the two charts
below. The two questions about bullying are discussed in a separate section later in the chapter.
Most children responded positively to the agreement questions about school with over 60%
totally agreeing with each of the four questions. Response patterns to all four satisfaction
questions about school were very similar with means between 3.3 and 3.5 out of 4 (a little lower
than most of the questions about family and friends discussed earlier) and the percentage
scoring less than three out of four was above 10% for each question.
Figure 25: Agreement questions about school
Not at all A little Somewhat A lot Totally
My teachers listen to me and take
what I say into account 4% 5% 9% 21% 61%
My teachers treat me fairly 5% 4% 8% 19% 64%
I feel safe at school 4% 4% 7% 18% 67%
I like going to school 7% 5% 8% 19% 62%
All countries, equally weighted by country
Figure 26: Satisfaction questions about school life
All countries, equally weighted by country
Girls were significantly more positive than boys in response to all eight questions. The largest
gender differences were:
66% of girls totally agreed that they like going to school, compared to 57% of boys;
while 11% of boys did not agree at all with this statement compared to 5% of girls.
Mean scores for satisfaction with teachers were 3.59 out of 4 for girls and 3.38 for boys.
Around 15% of boys scored below three out of four for this question compared to
around 9% of girls.
3.44
3.40
3.48
3.38
13%
14%
12%
14%
School experience
School marks
Teachers
Classmates
% not happy (<3 out of 4)
Mean happiness (out of 4)

Children’s Worlds Report: 8-years-old survey, 2013-15
37
Variations by country
Charts summarising the responses to each question by country are presented on the next few
pages.
As with the findings for the older two age groups in the survey (Rees & Main, 2015), of the
agreement questions, the statement ‘I like going to school’ shows the largest variation between
countries – 86% of children in Algeria totally agree with this statement compared to 36% in
Germany.
There were quite substantial variations for some of the satisfaction questions. For example
mean satisfaction for school marks range from 3.05 out of four in South Korea (with 23% of
children scoring less than three out of four) to 3.59 in Romania (9% of children scoring less than
three out of four).
Figure 27: Level of agreement with ‘My teachers listen to me and take what I say into
account’ by country
All countries
41%
51%
52%
52%
59%
59%
61%
62%
63%
64%
64%
64%
67%
68%
68%
77%
0% 10% 20% 30% 40% 50% 60% 70% 80% 90% 100%
Nepal
Estonia
S Korea
Germany
Ethiopia
UK*
Romania
Poland*
Israel
S Africa*
Spain*
Malta
Colombia*
Turkey*
Norway
Algeria*
% of children
Not at all A little Somewhat A lot Totally

Children’s Worlds Report: 8-years-old survey, 2013-15
38
Figure 28: Level of agreement with ‘My teachers treat me fairly’ by country
All countries
Figure 29: Level of agreement with ‘I feel safe at school’ by country
All countries
43%
52%
55%
60%
60%
62%
63%
66%
66%
66%
67%
71%
72%
73%
73%
78%
0% 10% 20% 30% 40% 50% 60% 70% 80% 90% 100%
Nepal
Germany
S Korea
Turkey*
Ethiopia
S Africa*
UK*
Estonia
Israel
Spain*
Malta
Norway
Algeria*
Poland*
Romania
Colombia*
% of children
Not at all A little Somewhat A lot Totally
45%
50%
55%
57%
67%
67%
68%
71%
72%
72%
73%
73%
75%
75%
78%
79%
0% 10% 20% 30% 40% 50% 60% 70% 80% 90% 100%
Nepal
Ethiopia
Germany
S Korea
Malta
Estonia
Israel
UK*
Spain*
S Africa*
Romania
Norway
Poland*
Turkey*
Algeria*
Colombia*
% of children
Not at all A little Somewhat A lot Totally

Children’s Worlds Report: 8-years-old survey, 2013-15
39
Figure 30: Level of agreement with ‘I like going to school’ by country
All countries
Figure 31: Level of satisfaction with ‘other children in your class’ by country
All countries
36%
46%
47%
51%
52%
57%
57%
57%
58%
59%
74%
74%
76%
76%
78%
86%
0% 10% 20% 30% 40% 50% 60% 70% 80% 90% 100%
Germany
S Korea
UK*
Nepal
Israel
Estonia
Poland*
Spain*
Norway
Malta
S Africa*
Romania
Turkey*
Colombia*
Ethiopia
Algeria*
% of children
Not at all A little Somewhat A lot Totally
3.12
3.15
3.28
3.28
3.29
3.30
3.33
3.34
3.41
3.47
3.47
3.51
3.52
3.52
3.52
3.58
21.7%
19.4%
20.4%
18.3%
15.7%
19.1%
15.3%
14.3%
14.5%
10.5%
12.2%
8.9%
10.7%
10.4%
11.0%
8.4%
Estonia
Germany
Israel
Ethiopia
S Korea
S Africa*
Nepal
UK*
Colombia*
Romania
Malta
Poland*
Turkey*
Algeria*
Spain*
Norway
% not happy (<3 out of 4)
Mean happiness (out of 4)

Children’s Worlds Report: 8-years-old survey, 2013-15
40
Figure 32: Level of satisfaction with ‘your relationship with teachers’ by country
All countries
Figure 33: Level of satisfaction with ‘your school marks’ by country
All countries
3.31
3.34
3.35
3.35
3.36
3.37
3.38
3.40
3.44
3.48
3.55
3.59
3.65
3.69
3.70
3.76
16.3%
16.3%
16.1%
15.0%
17.1%
16.0%
12.4%
14.3%
12.4%
12.6%
10.6%
10.7%
7.2%
5.4%
6.3%
4.9%
S Korea
Ethiopia
UK*
Nepal
Israel
Estonia
Germany
S Africa*
Spain*
Poland*
Colombia*
Malta
Romania
Algeria*
Turkey*
Norway
% not happy (<3 out of 4)
Mean happiness (out of 4)
3.05
3.21
3.23
3.31
3.32
3.35
3.39
3.41
3.47
3.49
3.51
3.51
3.51
3.54
3.55
3.59
22.8%
19.1%
18.7%
17.2%
16.0%
15.2%
17.4%
14.1%
12.2%
11.7%
10.0%
12.6%
8.4%
10.1%
9.0%
8.8%
S Korea
Germany
Ethiopia
UK*
Nepal
Estonia
Malta
S Africa*
Colombia*
Spain*
Algeria*
Israel
Norway
Turkey*
Poland*
Romania
% not happy (<3 out of 4)
Mean happiness (out of 4)

Children’s Worlds Report: 8-years-old survey, 2013-15
41
Figure 34: Level of satisfaction with ‘your school experience’ by country
All countries
There were discernible gender differences in responses to the above questions in most but not
all countries. Where there were statistically significant differences they always related to girls
giving more positive responses than boys. One of the questions where there were the largest
differences at a country level was the statement ‘I like going to school’. Figure 35 shows the
percentage of girls and boys totally agreeing with this statement in each country. Countries are
ranked in decreasing order of gender differences.
The largest differences were in Israel where 60% of girls totally agreed with this
statement compared to 43% of boys. In fact (not shown in chart), 33% of boys in Israel
did not agree with this statement at all compared to 12% of girls.
Other countries where relatively high proportions of boys did not agree with the
statement at all were Germany (20%), Poland (19%), Spain (17%), the UK (16%), Estonia
(14%) and Malta (13%).
There were also differences in total agreement between girls and boys in Norway and
South Korea but relatively few children of either gender did not agree with the
statement at all in these countries.
There were negligible gender differences in several countries, most notably Ethiopia
and Nepal.
These patterns raise interesting questions about why there are such disparities in attitudes to
school between boys and girls in this age group in some countries and not in others.
3.15
3.21
3.27
3.36
3.38
3.40
3.41
3.41
3.45
3.47
3.51
3.52
3.60
3.61
3.63
3.64
21.5%
18.9%
18.9%
15.0%
15.3%
14.2%
14.5%
15.5%
14.4%
13.1%
10.5%
10.5%
7.9%
8.3%
8.0%
8.3%
Ethiopia
Germany
Israel
S Korea
Nepal
Estonia
S Africa*
UK*
Poland*
Malta
Norway
Spain*
Algeria*
Romania
Turkey*
Colombia*
% not happy (<3 out of 4)
Mean happiness (out of 4)

Children’s Worlds Report: 8-years-old survey, 2013-15
42
Figure 35: Percentage of children totally agreeing with ‘I like going to school’ by country and
gender
All countries
Overview of evaluative questions about school
Table 10 shows rankings of each country for the satisfaction and agreement questions covered in
this chapter.
This is an aspect of life for which Algeria scores particularly high - being ranked in the top six
countries for all nine questions. Children in Turkey also responded relatively positively to eight
of these questions, with rankings between second and fourth out of the 16 countries, with a
lower ranking only for the question about being treated fairly at school (18% of children in
Turkey did not agree at all with this statement).
The lowest rankings for this aspects of life are for South Korea which is in the bottom five
countries for all eight questions, followed by Nepal and Germany (ranked in the bottom five for
seven out of eight questions).
A few countries showed substantial variability in rankings. Children in Ethiopia were very
positive about liking going to school, although their rankings for many of the other questions
were low. It would be interesting to explore this further with children to understand what
78%
50%
73%
74%
83%
71%
73%
54%
55%
52%
32%
40%
49%
39%
49%
43%
79%
51%
76%
77%
89%
78%
81%
61%
64%
63%
40%
53%
65%
54%
67%
60%
0% 10% 20% 30% 40% 50% 60% 70% 80% 90% 100%
Ethiopia
Nepal
Romania
Turkey
Algeria*
S Africa*
Colombia*
Spain*
Malta
Norway
Germany
S Korea
Estonia
UK*
Poland*
Israel
% of children totally agreeing
Girl Boy

Children’s Worlds Report: 8-years-old survey, 2013-15
43
aspects of school they felt positive about, as this might inform general understandings of the
components of school well-being. Children in Israel were relatively highly satisfied (fifth) with
their school marks although they were much less highly ranked for liking school (12th) and for
satisfaction with classmates, teachers or their school experience.
Table 10: School – Summary of rankings by country for each question
Agreement questions Satisfaction questions
Teachers
listen
Teachers
fair Safe Like
Class
mates Teachers Marks
School
exp.
Algeria* 1 4 2 1 3 3 6 4
Colombia* 4 1 1 3 8 6 8 1
Estonia 15 9 11 11 16 11 11 11
Ethiopia 12 12 15 2 13 15 14 16
Germany 13 15 14 16 15 10 15 15
Israel 8 8 10 12 14 12 5 14
Malta 5 6 12 7 6 5 10 7
Nepal 16 16 16 13 10 13 12 12
Norway 2 5 5 8 1 1 4 6
Poland* 9 3 4 10 5 7 2 8
Romania 10 2 6 5 7 4 1 3
S Africa* 7 11 7 6 11 9 9 10
S Korea 14 14 13 15 12 16 16 13
Spain* 6 7 8 9 2 8 7 5
Turkey* 3 13 3 4 4 2 3 2
UK* 11 10 9 14 9 14 13 9
All countries
Experiences of being bullied Finally in this chapter we consider the two questions asking about experiences of being bullied
at school.
The chart below shows the overall distribution of responses to the two questions about being
bullied (being hit and being left out by other children) in the pooled sample of all 16 countries
(with each country having an equal weighting).
The percentages are a little higher for experiences of being hit than for experiences of being left
out. Almost half of children said that they had been hit by another child at school in the last

Children’s Worlds Report: 8-years-old survey, 2013-15
44
month and around one in six said that this had happened more than three times. The
frequencies were higher than in the 10- and 12-year-old surveys.
Figure 36: Frequency questions about being bullied at school in the last month
All countries, equally weighted by country
There were significant gender differences in the prevalence and frequency of children being hit
by other children in school. Boys (52%) were more likely to have been hit than girls (43%) and in
particular there was a higher rate of being hit frequently (more than three times) among boys
(21%) than girls (13%).
Figure 37: Frequency of being hit by other children in school in the last month by gender
All countries, equally weighted by country
In contrast, there was no significant gender difference in the percentages of children
experiencing being left out by other children in their class.
The next two charts show the distribution of responses to these questions by country:
The frequency of both forms of behaviour was lowest in South Korea.
There was little difference between many countries in terms of children being
frequently hit by other children.
Romania stands out as having much higher levels of children being frequently (more
than three times) left out by other children, although the UK had the highest percentage
of children who had experienced this behaviour at least once in the past month.
52%
17%13%
17%
58%
15%12%
15%
0%
10%
20%
30%
40%
50%
60%
70%
Never Once 2 to 3 times More than 3 times
Hit Left out
48%
57%
18%
17%
13%
13%
21%
13%
0% 10% 20% 30% 40% 50% 60% 70% 80% 90% 100%
Boys
Girls
% of children
Never Once 2 or 3 times More than 3 times

Children’s Worlds Report: 8-years-old survey, 2013-15
45
Figure 38: Frequency of being hit by other children in school in the last month by country
All countries
Figure 39: Frequency of being left out by other children in school class in the last month by
country
All countries
6%
10%
12%
13%
13%
14%
15%
15%
20%
21%
21%
23%
23%
23%
23%
24%
0% 10% 20% 30% 40% 50% 60% 70% 80% 90% 100%
S Korea
Ethiopia
Algeria*
Norway
Poland*
Romania
Nepal
Colombia*
UK*
Israel
S Africa*
Germany
Spain*
Malta
Turkey
Estonia
% of children
Never Once 2 or 3 times More than 3 times
2%
6%
12%
12%
12%
13%
15%
16%
16%
16%
16%
17%
17%
17%
18%
38%
0% 10% 20% 30% 40% 50% 60% 70% 80% 90% 100%
S Korea
Ethiopia
Germany
Norway
Poland*
S Africa*
Malta
Algeria*
Turkey
Nepal
Spain*
Israel
Estonia
Colombia*
UK*
Romania
% of children
Never Once 2 or 3 times More than 3 times

Children’s Worlds Report: 8-years-old survey, 2013-15
46
In line with the overall findings discussed earlier there were significant gender differences in
relation to being hit by other children in school in many countries. This is shown in Figure 40
where countries are ranked in descending order of the gap between the percentages for girls
and boys. The gender differences here were statistically significant in 11 countries – the
exceptions being Algeria, Ethiopia, Nepal, South Africa and Turkey.
Figure 40: Percentage of children who had been hit by other children in school at least once
in the last month by country and gender
All countries
There were significant gender differences within countries in being left out by other children in
class in five countries. In Norway, Spain and the UK girls were significantly more likely to
experience being left out than boys; while in Colombia and Israel the opposite was true.
56%
56%
51%
42%
61%
58%
39%
61%
58%
32%
44%
60%
48%
66%
47%
54%
54%
53%
46%
36%
54%
50%
31%
53%
49%
22%
34%
49%
36%
53%
34%
38%
0% 10% 20% 30% 40% 50% 60% 70% 80% 90% 100%
Turkey
Nepal
S Africa*
Ethiopia
UK*
Israel
Algeria*
Germany
Malta
S Korea
Colombia*
Spain*
Poland*
Estonia
Romania
Norway
% of children who had been hit
Girl Boy

Children’s Worlds Report: 8-years-old survey, 2013-15
47
Chapter 7
Local area
Overview Children were asked six questions about their local area:
Two agreement questions
Four satisfaction questions
The wording and format of the questions are shown in the box below.
Box 7: Local area: Agreement and satisfaction questions
Agreement questions:
In my area there are enough places to play or to have a good time
I feel safe when I walk around in the area I live in
Answers were given on a five-point, unipolar scale, with responses ranging from ‘I do not agree’
to ‘Totally agree’.
Satisfaction questions
How happy are you with ..
The people who live in your area
How you are dealt with when you go to the doctors
The outdoor areas children can use in your area
The area where you live, in general
Responses were on a five-point scale using symbolic faces as described in Chapter 1.
The table and chart below provide summary statistics for these questions for the whole sample
(weighted equally by age group and country). Some of the scores in this domain are among the
lowest for any aspect of life covered in the survey. Around one in 11 children did not agree at
all that there were enough places to play or have a good time in their local area and a similar
proportion did not agree at all they felt safe walking around in their local area.
Table 11: Agreement questions about local area
Not at all A little Somewhat A lot Totally
In my area there are enough places to
play or to have a good time 9% 7% 10% 17% 57%
I feel safe when I walk around in the
area I live in 9% 7% 11% 19% 53%
All countries, equally weighted by country
The mean satisfaction scores are also generally lower than for the aspects of life considered in
the previous chapters and around one in five children scored less than three out of four for
satisfaction with the doctors, outdoor areas and people in the local area

Children’s Worlds Report: 8-years-old survey, 2013-15
48
Figure 41: Satisfaction questions about local area
All countries, equally weighted by country
There were small but significant gender differences for five of the six questions.
Girls were a little more satisfied than boys with all four aspects of the local area in
Figure 41.
Girls had lower levels of agreement than boys for the question about safety in the local
area.
Variations by country The charts on the following pages provide a summary of responses to each question for each
country.
The two agreement questions are ranked in order of the percentage of children who totally
agreed. However there are some different patterns in the percentage of children who did not
agree at all with each question, suggesting much greater variability of responses in some
countries than others.
Almost one in five (19%) of children in Algeria and Malta and 18% in Romania did not
agree at all there are enough places to play or to have a good time in their local area.
Almost a quarter (24%) of children in South Africa did not agree at all that they felt safe
in their local area, even though South Africa was not ranked at the bottom of the list for
the percentages of children who totally agreed.
In relation to the satisfaction questions:
There was less variation between countries for the satisfaction question about people
who live in the local area than for the other three questions.
Compared to other aspects of life considered in the survey there much lower levels of
satisfaction about the local area in some countries. For example over a quarter of
children in South Africa, Ethiopia and the UK scored less than three out of four for
satisfaction with the outdoor areas in their locality.
3.48
3.24
3.22
3.25
13%
19%
20%
19%
Area in general
People in area
Outdoor areas
Doctors
% not happy (<3 out of 4)
Mean happiness (out of 4)

Children’s Worlds Report: 8-years-old survey, 2013-15
49
Figure 42: Level of agreement with ‘In my area there are enough places to play or to have a
good time’ by country
All countries
Figure 43: Level of agreement with ‘I feel safe when I walk around in the area I live in’ by
country
All countries
38%
40%
45%
46%
49%
55%
55%
57%
58%
62%
65%
66%
67%
68%
71%
73%
0% 10% 20% 30% 40% 50% 60% 70% 80% 90% 100%
Nepal
S Korea
Malta
Romania
Ethiopia
UK*
Algeria*
Turkey
Germany
S Africa*
Spain*
Israel
Colombia*
Norway
Poland*
Estonia
% of children
Not at all A little Somewhat A lot Totally
23%
40%
43%
45%
46%
47%
49%
50%
55%
60%
62%
62%
63%
65%
65%
71%
0% 10% 20% 30% 40% 50% 60% 70% 80% 90% 100%
S Korea
Nepal
Ethiopia
S Africa*
Malta
Germany
UK*
Turkey
Poland*
Romania
Colombia*
Algeria*
Israel
Estonia
Spain*
Norway
% of children
Not at all A little Somewhat A lot Totally

Children’s Worlds Report: 8-years-old survey, 2013-15
50
Figure 44: Level of satisfaction with ‘the people who live in your area’ by country
All countries
Figure 45: Level of satisfaction with ‘how you are dealt with when you go to the doctors’ by
country
All countries except Poland
3.00
3.03
3.06
3.09
3.15
3.17
3.18
3.19
3.24
3.30
3.30
3.37
3.41
3.41
3.42
3.48
28.4%
24.3%
26.0%
24.5%
22.4%
22.5%
22.2%
22.5%
19.4%
17.6%
14.6%
14.8%
13.1%
13.0%
12.8%
10.5%
Malta
Germany
Ethiopia
S Korea
S Africa*
Israel
UK*
Nepal
Estonia
Colombia*
Turkey*
Spain*
Algeria*
Romania
Poland*
Norway
% not happy (<3 out of 4)
Mean happiness (out of 4)
2.76
2.87
2.98
3.01
3.08
3.19
3.21
3.34
3.38
3.39
3.43
3.48
3.50
3.59
3.60
35.2%
31.0%
28.2%
25.2%
25.7%
19.8%
20.7%
15.9%
13.7%
14.0%
12.7%
11.4%
10.7%
8.5%
9.4%
Malta
Nepal
Ethiopia
Estonia
Israel
S Africa*
UK*
Algeria*
Germany
S Korea
Spain*
Turkey*
Norway
Romania
Colombia*
% not happy (<3 out of 4)
Mean happiness (out of 4)

Children’s Worlds Report: 8-years-old survey, 2013-15
51
Figure 46: Level of satisfaction with ‘the outdoor areas children can use in your area’ by
country
All countries
Figure 47: Level of satisfaction with ‘the area you live in general’ by country
All countries
2.89
2.90
3.07
3.08
3.09
3.10
3.15
3.15
3.19
3.22
3.29
3.35
3.42
3.52
3.55
3.58
31.4%
31.4%
26.3%
24.2%
24.4%
25.5%
22.2%
23.7%
19.8%
20.0%
16.0%
17.0%
12.8%
9.8%
8.8%
8.7%
S Africa*
Ethiopia
UK*
Germany
Nepal
Malta
Estonia
Israel
Romania
S Korea
Algeria*
Colombia*
Turkey*
Norway
Poland*
Spain*
% not happy (<3 out of 4)
Mean happiness (out of 4)
3.10
3.11
3.27
3.34
3.36
3.41
3.42
3.46
3.54
3.57
3.64
3.65
3.66
3.68
3.70
3.72
24.1%
24.1%
17.7%
17.9%
18.5%
14.4%
13.9%
12.5%
10.1%
11.0%
8.3%
7.7%
7.6%
5.7%
7.0%
5.6%
Germany
Ethiopia
Nepal
S Africa*
Malta
S Korea
UK*
Algeria*
Estonia
Israel
Colombia*
Spain*
Romania
Poland*
Turkey*
Norway
% not happy (<3 out of 4)
Mean happiness (out of 4)

Children’s Worlds Report: 8-years-old survey, 2013-15
52
Summary Summaries of rankings for these six questions are shown in Table 12:
This is an aspect of life where children in Norway score consistently highly, followed by
Spain and Colombia.
Children in Ethiopia ranked in the lowest five countries for all six questions, while
Malta and Nepal were also in the bottom five countries for all but one of the questions.
Table 12: Local area – Summary of rankings by country for each question
Place to
play Feel safe
Local
people Doctors
Outdoor
areas
Area in
general
Algeria* 10 5 4 8 6 9
Colombia* 4 6 7 1 5 6
Estonia 1 3 8 12 10 8
Ethiopia 12 14 14 13 15 15
Germany 8 11 15 7 13 16
Israel 5 4 11 11 9 7
Malta 14 12 16 15 11 12 Nepal 16 15 9 14 12 14
Norway 3 1 1 3 3 1
Poland* 2 8 2 na 2 3
Romania 13 7 3 2 8 4
S Africa* 7 13 12 10 16 13
S Korea 15 16 13 6 7 11
Spain* 6 2 5 5 1 5
Turkey* 9 9 6 4 4 2
UK* 11 10 10 9 14 10 All countries (except the question about doctors was not asked in Poland)

Children’s Worlds Report: 8-years-old survey, 2013-15
53
Chapter 8
Self
Overview Children in this age group were asked three satisfaction questions relating to how they felt
about themselves:
Box 8: Other satisfaction questions
Satisfaction questions
How happy are you with
Your health
Your body
The way that you look
Responses were on a five-point scale using symbolic faces as described in Chapter 1.
Note: Item 3 was not asked in Poland.
A summary of responses to these six questions is shown in the chart below.
Figure 48: Satisfaction questions about other aspects of life
All countries, except Item 3 in Poland, weighted equally by country
For the whole sample, girls were significantly more satisfied with their health and the way that
they looked than boys although the differences were small. There was no significant gender
difference for the question about satisfaction with one’s body.
Variations by country The charts below show the mean scores and percentages of children with low satisfaction by
country for each of the questions.
3.49
3.56
3.57
12%
10%
10%
Appearance
Body
Health
% not happy (<3 out of 4)
Mean happiness (out of 4)

Children’s Worlds Report: 8-years-old survey, 2013-15
54
Figure 49: Level of satisfaction with ‘your health’ by country
All countries
Figure 50: Level of satisfaction with ‘your body’ by country
All countries
3.24
3.43
3.44
3.46
3.50
3.51
3.52
3.52
3.60
3.64
3.65
3.68
3.69
3.69
3.76
3.79
19.8%
13.1%
14.2%
14.4%
12.0%
11.2%
10.2%
9.8%
9.2%
8.3%
8.5%
5.6%
6.9%
6.6%
4.3%
3.9%
Nepal
Estonia
Ethiopia
S Africa*
Algeria*
Germany
S Korea
Norway
UK*
Malta
Israel
Poland*
Spain*
Turkey*
Romania
Colombia*
% not happy (<3 out of 4)
Mean happiness (out of 4)
3.27
3.28
3.36
3.45
3.46
3.48
3.53
3.55
3.60
3.62
3.66
3.71
3.71
3.73
3.76
3.81
18.4%
18.4%
15.8%
12.2%
13.5%
11.6%
11.6%
8.9%
8.1%
9.1%
8.2%
7.1%
4.9%
5.7%
3.8%
3.3%
Nepal
S Korea
Ethiopia
Estonia
UK*
Germany
Malta
Algeria*
Norway
S Africa*
Turkey*
Israel
Poland*
Spain*
Romania
Colombia*
% not happy (<3 out of 4)
Mean happiness (out of 4)

Children’s Worlds Report: 8-years-old survey, 2013-15
55
Figure 51: Level of satisfaction with ‘the way that you look’ by country
All countries except Poland
There were no significant gender differences in responses to these questions within countries.
This is particularly noteworthy given some of the gender differences found with this aspect of
life for the older two age groups in the survey (Rees & Main , 2015).
Summary The table below summarises the rankings of means for each question for each country.
Three countries – Romania, Colombia and Spain – ranked in the top five for each
question
Three countries – Estonia, Ethiopia and Nepal – ranked in the bottom five for each
question
3.13
3.20
3.32
3.35
3.43
3.43
3.45
3.54
3.55
3.57
3.61
3.62
3.68
3.73
3.75
22.9%
20.4%
17.5%
15.0%
13.1%
14.2%
12.9%
9.7%
11.9%
10.1%
7.1%
8.9%
6.4%
5.7%
4.0%
S Korea
Nepal
UK*
Ethiopia
Estonia
S Africa*
Germany
Norway
Malta
Turkey*
Algeria*
Israel
Spain*
Colombia*
Romania
% not happy (<3 out of 4)
Mean happiness (out of 4)

Children’s Worlds Report: 8-years-old survey, 2013-15
56
Table 13: Self – Summary of rankings by country for each question
Health Appearance Body
Algeria* 12 5 9
Colombia* 1 2 1
Estonia 15 11 13
Ethiopia 14 12 14
Germany 11 9 11
Israel 6 4 5
Malta 7 7 10
Nepal 16 14 16
Norway 9 8 8
Poland* 5 na 4
Romania 2 1 2
S Africa* 13 10 7
S Korea 10 15 15
Spain* 4 3 3
Turkey* 3 6 6
UK* 8 13 12
All countries (question about appearance not asked in Poland)

Children’s Worlds Report: 8-years-old survey, 2013-15
57
Chapter 9
Time use
Overview Children were asked questions about time spent with family and friends and time use in
general in different sections of the questionnaire. The question wordings are shown in Box 9.
Box 9: Questions about time use
Family questions
How often in the past week have you spent time doing the following things with your family?
Talking together
Having fun together
Learning together
Responses were on a four-point frequency scale from ‘Not at all’ to ‘Every day’, plus ‘Don’t
know’
Friends questions
How often in the past week have you spent time doing the following things with your friends
apart from at school?
Talking together
Having fun together
Learning together
Responses were on a four-point frequency scale from ‘Not at all’ to ‘Every day’, plus ‘Don’t
know’
General time use questions
How often do you usually spend time doing the following activities when you are not at school?
Taking classes outside school time on matters different than at school
Reading for fun (not homework)
Helping around the house
Doing homework
Watching TV or listening to music
Playing sports or doing exercise
Using a computer
Responses were on a four-point frequency scale from ‘Rarely or never’ to ‘Every day or almost
every day’, plus ‘Don’t know’
Satisfaction question
How happy are you with what you do in your free time
Responses were on a five-point scale using symbolic faces as described in Chapter 1.
Summaries of responses to these questions for the pooled data set are shown in Tables 14 to 16.
Around half or more of children spent time on each of the family activities everyday (Table 14).
The same applies to spending time talking with and having fun with friends, although there

Children’s Worlds Report: 8-years-old survey, 2013-15
58
was a lower frequency of meeting to study together with friends and over two-fifths of children
rarely or never did this (Table 15). There was a greater amount of variation in frequencies for
the general time use questions. Over three-quarters of children did homework every day or
almost every day, while only a third took classes outside school time everyday or almost every
day. More than a quarter of children rarely or never used a computer outside school.
Table 14: Frequency questions about time with family
Not at all
Once or
twice Most days Every day
Talking together 4% 12% 22% 62%
Having fun together 5% 15% 30% 49%
Learning together 9% 15% 25% 52%
All countries, equally weighted by country
Table 15: Frequency questions about time with friends
Not at all Once or
twice Most days Every day
Talking together 8% 17% 28% 48%
Having fun together 7% 15% 26% 51%
Meeting to study 41% 20% 16% 23%
All countries, equally weighted by country
Table 16: General time use questions
Rarely or
never
Less than
once a week
Once or
twice a
week
Every day or
almost
Taking classes outside school time 29% 10% 28% 33%
Reading for fun 17% 11% 23% 50%
Helping with housework 9% 9% 25% 56%
Doing homework 4% 5% 14% 77%
Watching TV 9% 7% 20% 64%
Playing sports or doing exercise 12% 9% 25% 54%
Using a computer 26% 12% 24% 38%
All countries, equally weighted by country

Children’s Worlds Report: 8-years-old survey, 2013-15
59
A summary of responses to the satisfaction question for the whole data set is shown in the chart
below. Less than one in ten children were not happy with what they did in their free time.
Figure 52: Satisfaction questions about activities in free time
All countries, equally weighted by country
Within the pooled data set there were a number of significant gender differences:
Girls more frequently spent time talking with and having fun with people in their
family than boys did. There was no significant difference for spending time learning
with family.
There were no significant gender differences for the frequency of any of the activities
with friends.
Girls more frequently spent time reading for fun, helping with housework and doing
homework than boys.
Boys more frequently spent time watching television, using a computer and playing
sports or exercising than girls.
There was no significant gender difference in frequency of spending time taking classes
outside school.
There was also no significant gender difference in satisfaction about free time activities.
Variations by country The charts on the following pages, provide country-by-country breakdowns of the responses to
each of the 18 questions considered in this section. There were large variations between
countries in the frequency of time spent on each of these activities.
Following these 18 charts there are summary tables with some accompanying discussion.
3.58 9%What you do in
your free time
% not happy (<3 out of 4)
Mean happiness (out of 4)

Children’s Worlds Report: 8-years-old survey, 2013-15
60
Figure 53: Frequency of ‘Talking together with family’ by country
All countries
Figure 54: Frequency of ‘Having fun together with family’ by country
All countries
42%
46%
47%
50%
50%
58%
63%
64%
65%
68%
68%
69%
70%
72%
73%
80%
0% 10% 20% 30% 40% 50% 60% 70% 80% 90% 100%
S Korea
Ethiopia
Colombia*
Turkey
Nepal
UK*
Israel
Estonia
Poland*
Malta
S Africa*
Algeria*
Spain*
Norway
Germany
Romania
% of children
Not at all Once or twice a week Most days Every day
25%
34%
42%
43%
44%
45%
46%
47%
47%
48%
53%
59%
60%
62%
67%
68%
0% 10% 20% 30% 40% 50% 60% 70% 80% 90% 100%
S Korea
Ethiopia
Nepal
Poland*
Estonia
Norway
UK*
Israel
Germany
Spain*
Colombia*
Romania
Turkey
Algeria*
S Africa*
Malta
% of children
Not at all Once or twice a week Most days Every day

Children’s Worlds Report: 8-years-old survey, 2013-15
61
Figure 55: Frequency of ‘Learning together with family’ by country
All countries
Figure 56: Frequency of ‘Talking together with friends’ by country
All countries
27%
30%
31%
33%
36%
45%
47%
53%
55%
60%
60%
68%
69%
70%
70%
70%
0% 10% 20% 30% 40% 50% 60% 70% 80% 90% 100%
Ethiopia
Germany
S Korea
UK*
Norway
Israel
Nepal
Estonia
Spain*
Colombia*
Malta
Poland*
Turkey
Romania
Algeria*
S Africa*
% of children
Not at all Once or twice a week Most days Every day
34%
35%
41%
42%
42%
42%
44%
44%
44%
48%
49%
56%
57%
58%
61%
67%
0% 10% 20% 30% 40% 50% 60% 70% 80% 90% 100%
Nepal
Ethiopia
Spain*
Estonia
Norway
Turkey
Germany
UK*
Colombia*
S Korea
Malta
Poland*
Romania
Israel
Algeria*
S Africa*
% of children
Not at all Once or twice a week Most days Every day
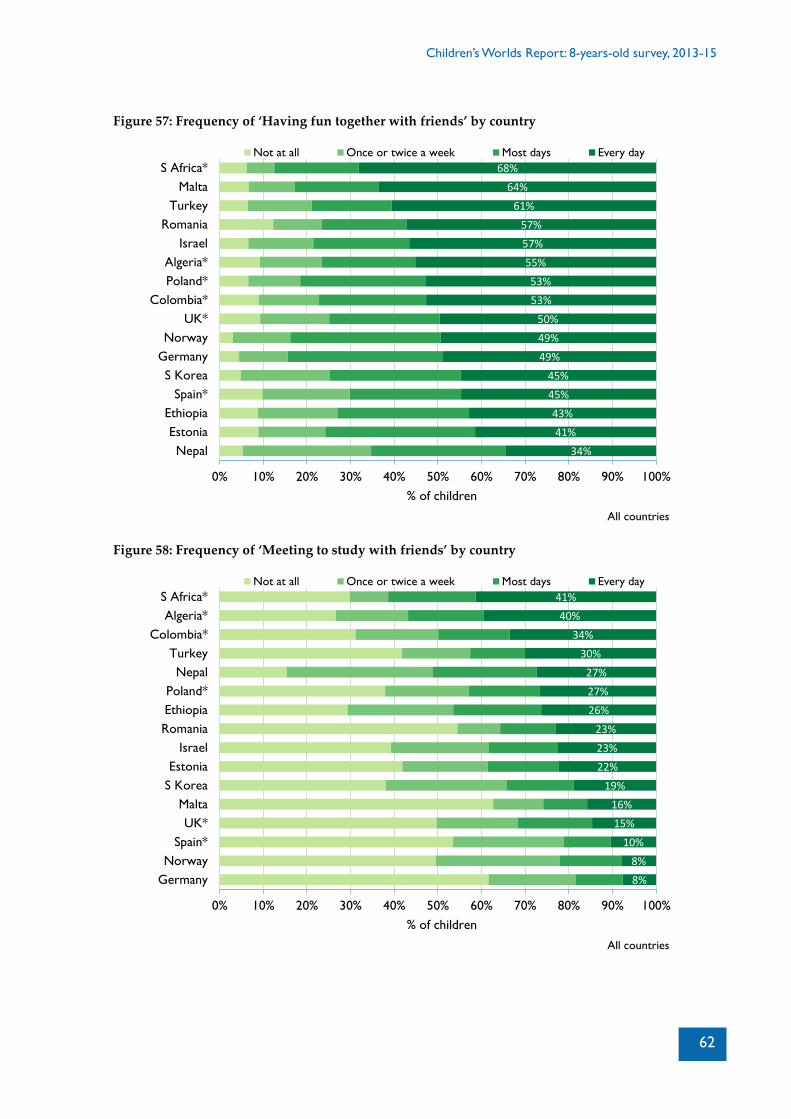
Children’s Worlds Report: 8-years-old survey, 2013-15
62
Figure 57: Frequency of ‘Having fun together with friends’ by country
All countries
Figure 58: Frequency of ‘Meeting to study with friends’ by country
All countries
34%
41%
43%
45%
45%
49%
49%
50%
53%
53%
55%
57%
57%
61%
64%
68%
0% 10% 20% 30% 40% 50% 60% 70% 80% 90% 100%
Nepal
Estonia
Ethiopia
Spain*
S Korea
Germany
Norway
UK*
Colombia*
Poland*
Algeria*
Israel
Romania
Turkey
Malta
S Africa*
% of children
Not at all Once or twice a week Most days Every day
8%
8%
10%
15%
16%
19%
22%
23%
23%
26%
27%
27%
30%
34%
40%
41%
0% 10% 20% 30% 40% 50% 60% 70% 80% 90% 100%
Germany
Norway
Spain*
UK*
Malta
S Korea
Estonia
Israel
Romania
Ethiopia
Poland*
Nepal
Turkey
Colombia*
Algeria*
S Africa*
% of children
Not at all Once or twice a week Most days Every day

Children’s Worlds Report: 8-years-old survey, 2013-15
63
Figure 59: Frequency of ‘Taking classes outside school time’ by country
All countries
Figure 60: Frequency of ‘Reading for fun (not homework)’ by country
All countries
18%
22%
22%
25%
26%
27%
28%
29%
35%
36%
39%
39%
41%
46%
46%
50%
0% 10% 20% 30% 40% 50% 60% 70% 80% 90% 100%
Ethiopia
Nepal
UK*
S Africa*
Israel
Romania
Poland*
Norway
Turkey
Malta
Colombia*
Germany
Spain*
S Korea
Algeria*
Estonia
% of children
Rarely or never Less than once a week Once or twice a week Every day or almost
22%
41%
43%
47%
48%
49%
50%
51%
52%
53%
54%
54%
55%
56%
58%
60%
0% 10% 20% 30% 40% 50% 60% 70% 80% 90% 100%
Ethiopia
Estonia
Norway
S Korea
Israel
Germany
Colombia*
Nepal
Poland*
Spain*
Algeria*
UK*
Turkey
S Africa*
Malta
Romania
% of children
Rarely or never Less than once a week Once or twice a week Every day or almost

Children’s Worlds Report: 8-years-old survey, 2013-15
64
Figure 61: Frequency of ‘Helping around the home’ by country
All countries
Figure 62: Frequency of ‘Doing homework’ by country
All countries
25.6%
34.0%
47.4%
48.4%
49.9%
53.4%
57.6%
60.0%
60.6%
61.6%
61.9%
62.2%
66.9%
67.5%
68.7%
69.6%
0% 10% 20% 30% 40% 50% 60% 70% 80% 90% 100%
S Korea
Germany
UK*
Norway
Turkey
Malta
Estonia
Israel
S Africa*
Spain*
Colombia*
Ethiopia
Nepal
Poland*
Algeria*
Romania
% of children
Rarely or never Less than once a week Once or twice a week Every day or almost
42%
61%
66%
72%
74%
75%
77%
80%
81%
81%
84%
87%
90%
90%
90%
91%
0% 10% 20% 30% 40% 50% 60% 70% 80% 90% 100%
UK*
Ethiopia
Nepal
S Korea
S Africa*
Algeria*
Colombia*
Spain*
Israel
Germany
Turkey
Norway
Romania
Malta
Poland*
Estonia
% of children
Rarely or never Less than once a week Once or twice a week Every day or almost

Children’s Worlds Report: 8-years-old survey, 2013-15
65
Figure 63: Frequency of ‘Watching TV or listening to music’ by country
All countries
Figure 64: Frequency of ‘Playing sports or doing exercise’ by country
All countries
25%
29%
55%
55%
62%
63%
64%
69%
70%
72%
72%
74%
75%
75%
77%
79%
0% 10% 20% 30% 40% 50% 60% 70% 80% 90% 100%
Ethiopia
Nepal
S Korea
Turkey
Germany
S Africa*
Algeria*
Norway
Estonia
UK*
Malta
Israel
Spain*
Poland*
Romania
Colombia*
% of children
Rarely or never Less than once a week Once or twice a week Every day or almost
26%
39%
49%
51%
51%
54%
54%
54%
57%
58%
58%
58%
59%
61%
65%
67%
0% 10% 20% 30% 40% 50% 60% 70% 80% 90% 100%
Ethiopia
Nepal
Malta
Algeria*
S Korea
S Africa*
UK*
Norway
Turkey
Germany
Estonia
Spain*
Israel
Colombia*
Romania
Poland*
% of children
Rarely or never Less than once a week Once or twice a week Every day or almost

Children’s Worlds Report: 8-years-old survey, 2013-15
66
Figure 65: Frequency of ‘Using a computer’ by country
All countries
Figure 66: Level of satisfaction with ‘what you do in your free time’ by country
All countries
3%
7%
15%
28%
32%
35%
37%
37%
40%
41%
44%
44%
47%
57%
60%
62%
0% 10% 20% 30% 40% 50% 60% 70% 80% 90% 100%
Ethiopia
Nepal
S Korea
Germany
Norway
Turkey
Spain*
S Africa*
Algeria*
Poland*
UK*
Estonia
Romania
Colombia*
Israel
Malta
% of children
Rarely or never Less than once a week Once or twice a week Every day or almost
3.14
3.20
3.50
3.51
3.54
3.55
3.59
3.61
3.65
3.69
3.71
3.71
3.72
3.73
3.75
3.75
24.8%
20.1%
10.9%
10.9%
9.6%
9.8%
9.4%
7.7%
8.3%
7.2%
4.2%
5.5%
4.1%
4.6%
3.9%
4.3%
Ethiopia
Nepal
S Korea
Algeria*
S Africa*
UK*
Turkey*
Estonia
Israel
Malta
Colombia*
Poland*
Germany
Norway
Romania
Spain*
% not happy (<3 out of 4)
Mean happiness (out of 4)

Children’s Worlds Report: 8-years-old survey, 2013-15
67
The patterns of time use presented above provide a number of insights into the nature of
children’s daily lives in different countries. There is a wealth of information here and
considerable opportunities for further analysis of the data. Table 17 and Table 18 provide a
summary of each country’s ranking in terms of frequency of each activity. The following list
highlights a selection of interesting patterns but is not meant to represent a comprehensive
summary:
Children in Romania report relatively high frequencies of most activities (family, friends
and general) with the exception of taking classes outside school and studying together
with friends.
Children in South Africa report relatively high frequencies of most activities with
family and friends but lower frequencies of other activities with the exception of
reading for fun. Taken at face value these patterns suggest that children’s lives in South
Africa are particularly focused on their close relationships.
Children in Algeria also report relatively high frequencies of time spent with family and
friends but in contrast to South Africa, they also rank high for taking classes outside
school and for helping around the house (second in both instances).
Children in South Korea ranked relatively low for most activities with the notable
exception of taking classes outside school. However, note that South Korea ranks
relatively low for frequency of doing homework.
While children in Estonia and South Korea spend relatively large amounts of time
taking classes outside school they tend to relatively infrequently read for fun. The
opposite is the case in South Africa, the UK and Romania. This suggests some degree of
trade-off between these two activities in some contexts.
Children’s lives in Ethiopia and Nepal appear to be much more strongly focused than in
other countries on helping around the house as these two countries ranked in the top
five for frequency of this activity but low for most other activities with the exception of
studying together with friends.
Clearly the frequency of time spent watching TV and using a computer needs to be
viewed within the context of the information on access to these items presented in
Chapter 4. Inevitably the two countries with the lowest levels of access to computer
and TV - Ethiopia and Nepal - also ranked lowest for these activities. However it is
interesting to note that South Korea had the lowest mean score for items lacked (in
Chapter 4), including 90% of children having access to computer and TV at home, but
South Korea is ranked 14th for frequency of children watching TV and using a
computer outside school.
Children in Spain were more strongly focused on activities with family than with
friends.
Children in Germany spend a relatively large amount of time talking with family but
relatively rarely spend time learning with family or studying with friends. Germany is,
however, relatively highly ranked for taking classes outside school, which reflects the
fact that in Germany it is generally the case that children in this age group have classes
outside school.

Children’s Worlds Report: 8-years-old survey, 2013-15
68
The rankings do not suggest a clear inverse relationship between frequency of using
electronic media (computer and TV) and frequency of playing sports or exercising. For
example, Colombia, Israel and Romania rank relatively high for all three activities.
Table 17: Rankings of frequencies of activities with family and friends by country
Activities with family Activities with friends
Talking
together
Having fun
together
Learning
together
Talking
together
Having fun
together
Studying
together
Algeria* 5 3 2 2 6 2
Colombia* 14 6 7 8 8 3
Estonia 9 12 9 13 15 10
Ethiopia 15 15 16 15 14 7
Germany 2 8 15 10 11 16
Israel 10 9 11 3 5 9
Malta 7 1 6 6 2 12
Nepal 12 14 10 16 16 5
Norway 3 11 12 12 10 15
Poland* 8 13 5 5 7 6
Romania 1 5 3 4 4 8
S Africa* 6 2 1 1 1 1
S Korea 16 16 14 7 12 11
Spain* 4 7 8 14 13 14
Turkey 13 4 4 11 3 4
UK* 11 10 13 9 9 13
All countries
Table 18: Rankings of frequencies of each general activity by country
Classes
Reading for
fun Help house
Home
work TV
Sports/
Exercise
Using
computer
Algeria* 2 6 2 11 10 13 8
Colombia* 6 10 6 10 1 3 3
Estonia 1 15 10 1 8 6 5
Ethiopia 16 16 5 15 16 16 16
Germany 5 11 15 7 12 7 13
Israel 12 12 9 8 5 4 2
Malta 7 2 11 3 6 14 1
Nepal 15 9 4 14 15 15 15
Norway 9 14 13 5 9 9 12
Poland* 10 8 3 2 3 1 7
Romania 11 1 1 4 2 2 4
S Africa* 13 3 8 12 11 11 9
S Korea 3 13 16 13 14 12 14
Spain* 4 7 7 9 4 5 10
Turkey 8 4 12 6 13 8 11
UK* 14 5 14 16 7 10 6
All countries

Children’s Worlds Report: 8-years-old survey, 2013-15
69
Gender differences in time use within countries The gender differences noted earlier for the pooled sample were not all in evidence when
looking at individual countries.
Within countries there were relatively few significant gender differences in time spent on family
activities. Girls more frequently spent time talking with family than boys in almost all countries
but there were only significant differences in Estonia and England. Similarly, although girls
tended more frequently to spend time having fun with family in most countries, these
differences were only statistically significant in Turkey and South Korea. There were no
significant gender differences within countries in the frequency of children spending time
learning with people in their family.
The only significant within-country gender differences in activities with friends were that girls
in South Korea more frequently spent time than boys talking with and studying with friends.
Looking at the general time use questions, the significant within-country differences are
summarised in Table 19. The gender patterns reported earlier for the pooled sample are
reflected here for some activities in some countries. The greatest number (four) of gender
differences were in Estonia and Poland. There were no significant gender differences in three
countries – Nepal, South Africa and Spain.
Table 19: Gender differences in frequencies of each general activity by country
Key:
No significant gender difference
G > B Girls spend time on this activity significantly more frequently than boys
B > G Boys spend time on this activity significantly more frequently than girls
Classes
Reading for
fun Help house
Home
work TV
Sports/
Exercise
Using
computer
Algeria* G > B G > B B > G
Colombia* B > G
Estonia G > B G > B G > B B > G
Ethiopia B > G
Germany G > B B > G
Israel G > B
Malta G > B
Nepal
Norway G > B
Poland* G > B G > B B > G B > G
Romania B > G
S Africa*
S Korea G > B G > B B > G
Spain*
Turkey B > G
UK* G > B B > G
All countries

Children’s Worlds Report: 8-years-old survey, 2013-15
70
Discussion The material presented in this chapter provides a brief introductory overview of a rich set of
data about how children spend their time in the diverse range of countries included in the
survey. There is considerable potential for further analysis of this data, along with the data
gathered in the 10-years-old and 12-years-old surveys. Future analytical work should attempt
to contextualise the observed patterns taking into account the nature and conditions of
children’s lives in each country. There is also a need for future work to consider other aspects of
time use that may be particularly salient in some countries or groups of countries related, for
example, to differing social, economic and cultural contexts.
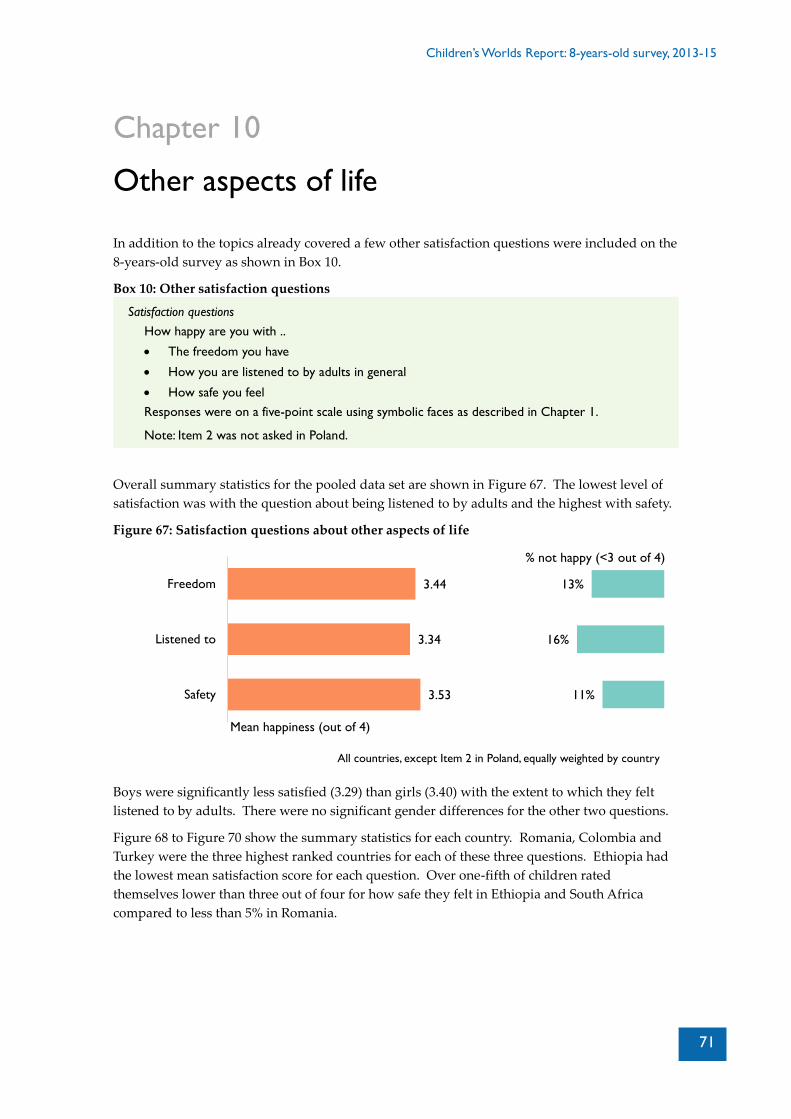
Children’s Worlds Report: 8-years-old survey, 2013-15
71
Chapter 10
Other aspects of life
In addition to the topics already covered a few other satisfaction questions were included on the
8-years-old survey as shown in Box 10.
Box 10: Other satisfaction questions
Satisfaction questions
How happy are you with ..
The freedom you have
How you are listened to by adults in general
How safe you feel
Responses were on a five-point scale using symbolic faces as described in Chapter 1.
Note: Item 2 was not asked in Poland.
Overall summary statistics for the pooled data set are shown in Figure 67. The lowest level of
satisfaction was with the question about being listened to by adults and the highest with safety.
Figure 67: Satisfaction questions about other aspects of life
All countries, except Item 2 in Poland, equally weighted by country
Boys were significantly less satisfied (3.29) than girls (3.40) with the extent to which they felt
listened to by adults. There were no significant gender differences for the other two questions.
Figure 68 to Figure 70 show the summary statistics for each country. Romania, Colombia and
Turkey were the three highest ranked countries for each of these three questions. Ethiopia had
the lowest mean satisfaction score for each question. Over one-fifth of children rated
themselves lower than three out of four for how safe they felt in Ethiopia and South Africa
compared to less than 5% in Romania.
3.53
3.34
3.44
11%
16%
13%
Safety
Listened to
Freedom
% not happy (<3 out of 4)
Mean happiness (out of 4)

Children’s Worlds Report: 8-years-old survey, 2013-15
72
Figure 68: Level of satisfaction with ‘the freedom you have’ by country
All countries
Figure 69: Level of satisfaction with ‘how you are listened to by adults in general’ by country
All countries except Poland
2.95
3.20
3.25
3.26
3.29
3.30
3.43
3.49
3.53
3.56
3.60
3.60
3.61
3.65
3.67
3.70
28.5%
18.6%
17.9%
20.5%
17.8%
19.3%
13.5%
13.6%
8.4%
8.4%
8.2%
10.2%
7.3%
6.9%
7.5%
6.3%
Ethiopia
Estonia
Nepal
Malta
S Korea
UK*
Algeria*
S Africa*
Germany
Poland
Spain*
Israel
Norway
Romania
Colombia*
Turkey*
% not happy (<3 out of 4)
Mean happiness (out of 4)
2.99
3.10
3.25
3.28
3.29
3.31
3.31
3.31
3.33
3.38
3.41
3.48
3.53
3.58
3.59
26.9%
24.6%
18.2%
19.8%
16.1%
16.1%
17.5%
18.5%
16.7%
14.6%
10.4%
11.1%
10.4%
9.6%
8.6%
Ethiopia
Nepal
S Korea
Israel
Estonia
Germany
UK*
S Africa*
Malta
Spain*
Norway
Algeria*
Turkey*
Romania
Colombia*
% not happy (<3 out of 4)
Mean happiness (out of 4)

Children’s Worlds Report: 8-years-old survey, 2013-15
73
Figure 70: Level of satisfaction with ‘how safe you feel’ by country
All countries
2.97
3.23
3.30
3.44
3.53
3.54
3.56
3.57
3.59
3.62
3.65
3.66
3.68
3.68
3.70
3.77
28.7%
21.2%
17.2%
12.9%
9.5%
9.4%
9.5%
10.3%
11.0%
9.9%
7.8%
6.8%
7.2%
7.3%
5.9%
4.7%
Ethiopia
S Africa*
Nepal
S Korea
Germany
Estonia
Algeria*
UK*
Malta
Israel
Norway
Poland
Spain*
Turkey*
Colombia*
Romania
% not happy (<3 out of 4)
Mean happiness (out of 4)

Children’s Worlds Report: 8-years-old survey, 2013-15
74
Chapter 11
Children’s rights
Overview The three questions that children were asked about children’s rights are shown in the box below
Box 11: Questions about children’s rights
Please answer the following questions about children’s rights
I know what rights children have
I know about the children’s rights convention
I think, in my country, adults in general respect children’s rights
Responses were on a three-point scale – ‘No’, ‘Not sure’, ‘Yes’
These questions were not asked in Poland
Responses for the pooled data from 15 countries (excluding Poland where these questions were
not asked of this age group) are shown in the chart below. Slightly less than half of the children
(46%) felt that they knew what rights children have and less than a third (32%) said that they
knew about the children’s rights convention. However, a higher proportion (59%) felt that
adults in their country respected children’s rights.
Figure 71: Questions about children’s rights
All countries except Poland, equally weighted by country
15%
40%
23%
26%
28%
32%
59%
32%
46%
0% 10% 20% 30% 40% 50% 60% 70% 80% 90% 100%
Adults respect children's rights
Know about UN convention
Know what rights children have
No Not sure Yes

Children’s Worlds Report: 8-years-old survey, 2013-15
75
Variations by country The three charts that follow show summaries of responses to each question for each country in
the survey.
This is a topic for which there are particularly large differences between countries.
Knowledge about children’s rights in general varied widely from 73% agreement in
Colombia to below 30% in South Africa and the UK.
Similarly knowledge about the children’s rights convention varied from over 60% in
Colombia and Norway to less than a quarter in six countries - South Africa, South
Korea, Nepal, Germany, Malta and the UK.
There was slightly less dispersion for the question about adults respecting children’s
rights. Levels of agreement were within the range from 58% to 65% in nine countries
and so the rankings of these countries do not indicate large differences. Two countries -
Norway and Turkey scored particularly high on this question and four countries - South
Korea, South Africa, Nepal and Ethiopia - much lower.
Figure 72: Responses to ‘I know what rights children have’ by country
All countries except Poland
21%
29%
35%
36%
40%
44%
44%
45%
46%
47%
54%
56%
57%
58%
73%
0% 20% 40% 60% 80% 100%
S Africa*
UK*
Israel
S Korea
Spain*
Estonia
Nepal
Malta
Algeria*
Germany
Norway
Romania
Ethiopia
Turkey
Colombia*
% of children
No Not sure Yes

Children’s Worlds Report: 8-years-old survey, 2013-15
76
Figure 73: Responses to ‘I know about the children’s rights convention’ by country
All countries except Poland
Figure 74: Responses to ‘I think, in my country, adults in general respect children’s rights’ by
country
All countries except Poland
13%
16%
19%
19%
21%
21%
25%
29%
31%
36%
37%
41%
46%
60%
64%
0% 20% 40% 60% 80% 100%
S Africa*
S Korea
Nepal
Germany
Malta
UK*
Ethiopia
Spain*
Israel
Estonia
Algeria*
Romania
Turkey
Norway
Colombia*
% of children
No Not sure Yes
39%
42%
43%
44%
58%
59%
62%
62%
63%
64%
64%
65%
65%
78%
80%
0% 20% 40% 60% 80% 100%
S Korea
S Africa*
Nepal
Ethiopia
Germany
Estonia
UK*
Algeria*
Malta
Israel
Colombia*
Spain*
Romania
Turkey
Norway
% of children
No Not sure Yes

Children’s Worlds Report: 8-years-old survey, 2013-15
77
Summary and discussion Children’s responses to the three questions considered in this chapter show substantial
variations in knowledge about children’s rights and in opinions about adults’ respect for these
rights between the 15 countries in the survey where these questions were asked. The table
below provides a summary of comparisons based on the rankings of each country on the three
questions.
Colombia, Turkey, Norway and Romania score relatively well on this aspect of children’s
lives, being ranked in the top five countries for all three questions
South Africa and South Korea score relatively low, being ranked in the bottom five for
each question
Spain, Israel and the UK rank much higher for children feeling adults respect children’s
rights than they do for knowledge of rights
The opposite is the case in Ethiopia and Germany
Table 20: Country ranking4 for each of the children’s rights questions
Know about
rights
Know about
UN convention
Adults respect
child rights
Algeria* 7 5 8
Nepal 9 13 13
Estonia 10 6 10
Spain* 11 8 4
Colombia* 1 1 5
Turkey 2 3 2
Ethiopia 3 9 12
S Korea 12 14 15
Germany 6 12 11
UK* 14 10 9
Israel 13 7 6
Romania 4 4 3
Norway 5 2 1
S Africa* 15 15 14
Malta 8 11 7
4 Based on percentage of ‘Yes’ responses

Children’s Worlds Report: 8-years-old survey, 2013-15
78
Chapter 12
Overview
Chapters 2 to 11 took a thematic approach in presenting findings for the overall sample and also
for individual countries to sets of questions asked in the survey about life as a whole and
different aspects of life – home and family, money and possessions, friends and other
relationships, school, the local area, self, time use, other aspects of life and children’s rights.
This type of approach enables the identification of differences between countries on each
question and aspect of life, and there are summaries of this kind at the end of each chapter.
However, as discussed in the introductory chapter, there are challenges to this approach.
Making raw comparisons in this way tends not to take into account the difference in context
between the countries being discussed, and also there is evidence that people in different
cultures and countries may have a tendency to answer subjective well-being questions in
different ways.
If one reads through the summary rankings at the end of each chapter it becomes apparent that
some countries tend to rank highly across all aspects of life, while others tend to rank low. This
is clearly evident in Table 21 which shows how each country ranks on each satisfaction question
presented in Chapters 2 to 11. The top five rankings for each question are highlighted in blue
and the bottom five rankings in orange.
Romania and Spain ranked consistently highly across almost all aspects of life, and
Norway, Poland, Turkey and Colombia tended also to rank highly.
Ethiopia and Nepal ranked consistently low across almost all aspects, while South
Korea, South Africa, Estonia and the UK also were in the bottom half of the rankings for
many questions.
The remaining four countries – Algeria, Malta, Israel and Germany had a greater mixture
of rankings.
There is a relationship between these satisfaction scores and overall life satisfaction as
illustrated in Figure 75 which shows that countries with higher mean satisfaction scores
averaged across all 22 questions covered in Table 21 tended to have higher mean life satisfaction
scores (see Chapter 2).
Even if one rejects the concerns about systematic cultural response biases, the kinds of patterns
discussed here are not particularly illuminating from a practical perspective. One of the main
goals of the Children’s Worlds project is to generate findings which are of practical value to key
stakeholders, including national policymakers. It may be comforting for policy-makers in
Romania and Spain to hear that children in their countries rank high on satisfaction on many
aspects of life compared to other countries but this does not highlight how they might improve
the quality of children’s lives. The same applies to countries that have consistently low
rankings.

Children’s Worlds Report: 8-years-old survey, 2013-15
79
Table 21: Country ranking of mean satisfaction with each aspect of life
Alg
eri
a*
Colo
mbia
*
Est
onia
Eth
iopia
Germ
any
Isra
el
Mal
ta
Nepal
Norw
ay
Pola
nd*
Rom
ania
S A
fric
a*
S K
ore
a
Spai
n*
Turk
ey*
UK
*
The house/flat where you live 11 6 10 15 7 9 12 16 5 2 3 14 8 4 1 13
The people you live with 11 6 13 15 10 12 8 16 1 5 2 14 7 3 4 9
All the other people in family 7 5 15 14 6 9 8 13 1 3 10 4 2 11 12
Your family life 6 5 10 14 8 7 15 16 9 4 2 13 11 1 3 12
All the things you have 12 5 13 16 8 7 3 15 9 1 4 10 14 2 6 11
Your friends 4 7 13 16 8 12 3 15 6 5 9 10 14 1 2 11
Your relationships .. in general 2 7 12 15 9 13 14 11 1 6 5 10 16 3 4 8
How dealt with at doctors 8 1 12 13 7 11 15 14 3 na 2 10 6 5 4 9
Outdoor areas .. in your area 6 5 10 15 13 9 11 12 3 2 8 16 7 1 4 14
The people in your area 4 7 8 14 15 11 16 9 1 2 3 12 13 5 6 10
The area you live in general 9 6 8 15 16 7 12 14 1 3 4 13 11 5 2 10
Other children in your class 3 8 16 13 15 14 6 10 1 5 7 11 12 2 4 9
Your school marks 6 8 11 14 15 5 10 12 4 2 1 9 16 7 3 13
Your school experience 4 1 11 16 15 14 7 12 6 8 3 10 13 5 2 9
Relationship with teachers 3 6 11 15 10 12 5 13 1 7 4 9 16 8 2 14
What do in your free time 13 6 9 16 4 8 7 15 3 5 2 12 14 1 10 11
Your health 12 1 15 14 11 6 7 16 9 5 2 13 10 4 3 8
The way that you look 5 2 11 12 9 4 7 14 8 na 1 10 15 3 6 13
Your own body 9 1 13 14 11 5 10 16 8 4 2 7 15 3 6 12
The freedom you have 10 2 15 16 8 5 13 14 4 7 3 9 12 6 1 11
Listened to by adults .. 4 1 11 15 10 12 7 14 5 na 2 8 13 6 3 9
How safe you feel 10 2 11 16 12 7 8 14 6 5 1 15 13 4 3 9

Children’s Worlds Report: 8-years-old survey, 2013-15
80
Figure 75: Scatterplot of mean life satisfaction scores and mean satisfaction scores across 22
aspects of life by country
In the comparative report on the 10- and 12-years-old surveys (Rees & Main, 2015) we
introduced the idea of relative scores for each aspect of life within countries. The method of
calculation is shown on page 9 of that report. The basic principle is that the relative score
compares the actual mean score for a particular aspect of life for a particular country with an
expected score based on both the average score for the country across all aspects of life and the
average score for the aspect of life across all countries. The characteristics of these scores are:
1. The average relative score for each country across all aspects of life is equal to 1.
2. The average relative score for each aspect of life across all countries is also equal to 1.
3. A relative score above 1 indicates that the country scores better than expected for this
aspect of life. A relative score below 1 indicates that the country scores worse than
expected for this aspect of life. A relative score of exactly 1 indicates that the country
scores exactly as would be expected based on the average score tendencies for the
country and for the aspect of life being considered.
The intention of this approach is to identify relative strengths and weaknesses in each country
while attempting to tackle the issue of cultural response bias.
The relative scores for all 16 countries for the 22 satisfaction questions asked in the 8-years-old
survey are shown in Table 22.
Algeria*
Colombia*
Estonia
Ethiopia
Germany
Israel
Malta
Nepal
Norway
Poland*Romania
S Africa*
S Korea
Spain*
Turkey
UK*
7.00
7.50
8.00
8.50
9.00
9.50
3.10 3.20 3.30 3.40 3.50 3.60 3.70
Mean
life s
atis
fact
ion s
core
(out
of 10)
Mean satisfaction score with aspects of life (out of 4)

Children’s Worlds Report: 8-years-old survey, 2013-15
81
Table 22: Relative scores for each country for each aspect of life
Alg
eri
a*
Colo
mbia
*
Est
onia
Eth
iopia
Germ
any
Isra
el
Mal
ta
Nepal
Norw
ay
Pola
nd*
Rom
ania
S A
fric
a*
S K
ore
a
Spai
n*
Turk
ey*
UK
*
The house/flat where you live 0.97 0.98 1.02 1.03 1.02 1.00 1.00 1.00 0.98 0.99 0.99 1.00 1.03 0.99 1.00 0.99
The people you live with 0.98 0.99 1.01 0.99 1.01 0.98 1.04 0.95 1.00 0.99 0.99 0.98 1.06 0.99 0.99 1.03
All the other people in family 1.01 1.02 0.88 0.95 1.05 1.01 1.02 0.96 1.04 na 1.03 1.02 1.11 1.03 0.92 0.97
Your family life 1.00 0.99 1.03 1.01 1.03 1.02 0.91 0.96 0.97 1.00 1.00 1.00 1.03 1.01 1.00 1.00
All the things you have 0.98 1.00 1.01 0.87 1.04 1.03 1.06 1.01 0.97 1.01 0.99 1.02 0.98 1.01 1.00 1.02
Your friends 1.01 0.96 1.00 1.02 1.02 0.99 1.04 1.02 0.97 0.98 0.95 1.02 0.99 1.00 1.00 1.01
Your relationships .. in general 1.05 0.97 0.99 1.03 1.02 0.94 0.95 1.03 1.03 0.99 1.00 0.99 0.93 1.02 1.02 1.02
How dealt with at doctors 1.01 1.06 0.95 1.00 1.05 0.95 0.86 0.94 1.03 na 1.05 1.00 1.07 1.01 1.03 1.00
Outdoor areas .. in your area 1.00 1.00 1.01 0.98 0.97 0.98 0.97 1.02 1.05 1.05 0.94 0.92 1.03 1.06 1.02 0.97
The people in your area 1.03 0.98 1.03 1.04 0.95 0.98 0.94 1.05 1.03 1.01 1.00 0.99 0.98 1.00 0.98 1.00
The area you live in general 0.98 1.00 1.05 0.98 0.90 1.03 0.98 1.01 1.03 1.01 1.00 0.98 1.01 1.00 1.02 1.00
Other children in your class 1.02 0.97 0.95 1.06 0.94 0.97 1.04 1.05 1.02 0.99 0.98 1.00 1.00 1.00 1.00 1.00
Your school marks 1.01 0.98 1.01 1.04 0.96 1.03 1.01 1.04 0.99 1.00 1.00 1.02 0.92 0.98 1.00 0.99
Your school experience 1.03 1.01 1.02 1.00 0.95 0.95 1.02 1.05 0.98 0.96 1.00 1.01 1.01 0.98 1.01 1.01
Relationship with teachers 1.04 0.98 1.00 1.05 0.98 0.96 1.04 1.03 1.04 0.96 1.00 1.00 0.98 0.95 1.02 0.98
What do in your free time 0.96 0.99 1.04 0.96 1.05 1.02 1.04 0.95 1.00 0.99 1.00 1.01 1.00 1.00 0.96 1.01
Your health 0.96 1.02 0.99 1.05 1.00 1.02 1.03 0.97 0.95 0.99 1.00 0.99 1.01 0.99 0.99 1.03
The way that you look 1.01 1.03 1.01 1.05 1.00 1.04 1.03 0.98 0.97 na 1.02 1.01 0.92 1.01 0.98 0.97
Your own body 0.98 1.03 1.00 1.03 0.99 1.04 1.00 0.98 0.97 1.00 1.00 1.04 0.95 1.00 0.99 0.99
The freedom you have 0.98 1.02 0.96 0.94 1.04 1.05 0.96 1.01 1.01 0.99 1.01 1.03 0.98 1.00 1.03 0.97
Listened to by adults .. 1.02 1.03 1.01 0.98 1.00 0.98 1.01 0.99 0.98 na 1.02 1.01 1.00 0.97 1.01 1.01
How safe you feel 0.99 1.00 1.03 0.92 1.02 1.03 1.03 1.00 0.99 0.99 1.02 0.94 1.00 1.00 1.00 1.03
Note: In the above table, relative scores of 1.03 and above are highlighted in blue, and relative scores below 0.97 highlighted in orange. Because the scores are rounded to the nearest decimal
place, some scores shown as 1.03 are highlighted whereas some are not. The latter are scores below 1.030 which have been rounded upwards but don’t reach the threshold. The same applies
to the scores shown as 0.97 – i.e. only scores of 0.969 or less are highlighted.
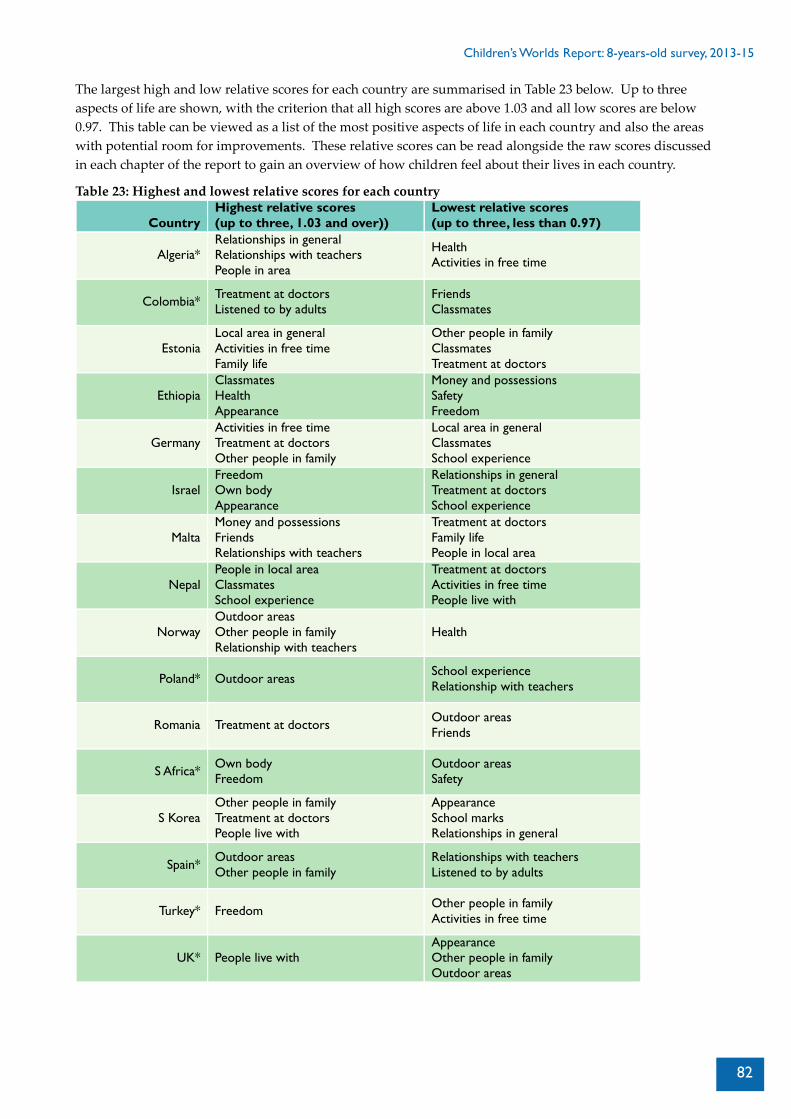
Children’s Worlds Report: 8-years-old survey, 2013-15
82
The largest high and low relative scores for each country are summarised in Table 23 below. Up to three
aspects of life are shown, with the criterion that all high scores are above 1.03 and all low scores are below
0.97. This table can be viewed as a list of the most positive aspects of life in each country and also the areas
with potential room for improvements. These relative scores can be read alongside the raw scores discussed
in each chapter of the report to gain an overview of how children feel about their lives in each country.
Table 23: Highest and lowest relative scores for each country
Country
Highest relative scores
(up to three, 1.03 and over))
Lowest relative scores
(up to three, less than 0.97)
Algeria*
Relationships in general
Relationships with teachers
People in area
Health
Activities in free time
Colombia* Treatment at doctors
Listened to by adults
Friends
Classmates
Estonia
Local area in general
Activities in free time
Family life
Other people in family
Classmates
Treatment at doctors
Ethiopia
Classmates
Health
Appearance
Money and possessions
Safety
Freedom
Germany
Activities in free time
Treatment at doctors
Other people in family
Local area in general
Classmates
School experience
Israel
Freedom
Own body
Appearance
Relationships in general
Treatment at doctors
School experience
Malta
Money and possessions
Friends
Relationships with teachers
Treatment at doctors
Family life
People in local area
Nepal
People in local area
Classmates
School experience
Treatment at doctors
Activities in free time
People live with
Norway
Outdoor areas
Other people in family
Relationship with teachers
Health
Poland* Outdoor areas School experience
Relationship with teachers
Romania Treatment at doctors Outdoor areas
Friends
S Africa* Own body
Freedom
Outdoor areas
Safety
S Korea
Other people in family
Treatment at doctors
People live with
Appearance
School marks
Relationships in general
Spain* Outdoor areas
Other people in family
Relationships with teachers
Listened to by adults
Turkey* Freedom Other people in family
Activities in free time
UK* People live with
Appearance
Other people in family
Outdoor areas

Children’s Worlds Report: 8-years-old survey, 2013-15
83
To conclude, this report has provided a primarily descriptive introduction to the Children’s Worlds Wave 2
8-years-old survey so far undertaken in 16 countries. There is a great deal of potential for more detailed
statistical analysis of the data, as well as comparisons between the findings for this age group and the older
two age groups also covered by the survey. There is an ongoing programme of analysis being undertaken
collaboratively by the researchers in the different countries involved in the research which will be published
on the project website in the form of working papers and in academic journal articles. As part of the
Children’s Worlds project’s open-access policy the Wave 2 data sets will also be made freely available as a
resource to other interested researchers outside the project later in 2016.
Children’s Worlds Report: 8-years-old survey, 2013-15
84
References
Ben-Arieh, A. (2008). The Child Indicators Movement: Past, Present, and Future. Child Indicators Research,
1(1), 3–16. http://doi.org/10.1007/s12187-007-9003-1
Bradshaw, J. & Rees, G. (2016, forthcoming) Exploring national variations in child subjective well-being.
(Children’s Worlds, Working Paper 1). www.isciweb.org
Casas, F., Coenders, G., Cummins, R. A., González, M., Figuer, C., & Malo, S. (2008). Does subjective well-
being show a relationship between parents and their children? Journal of Happiness Studies, 9(2), 197–205.
http://doi.org/10.1007/s10902-007-9044-7
Casas, F. (2016). Analysing the Comparability of 3 Multi-Item Subjective Well-Being Psychometric Scales
Among 15 Countries Using Samples of 10 and 12-Year-Olds. Child Indicators Research.
http://doi.org/10.1007/s12187-015-9360-0
Cummins, R. A. (2003). Normative life satisfaction: Measurement issues and a homeostatic model. Social
Indicators Research, 64(2), 225–256.
Dinisman, T. and Rees, G. (2014) Children’s Worlds: Findings from the first wave of data collection.
http://www.isciweb.org/_Uploads/dbsAttachedFiles/FirstWaveReport_FINAL(2).pdf
Helliwell, J. F., Layard, R., & Sachs, J. (2015). World Happiness Report 2015. New York: Sustainable
Development Solutions Network.
Huebner, E. S. (1991). Initial Development of the Student’s Life Satisfaction Scale. School Psychology
International, 12(3), 231–240. http://doi.org/10.1177/0143034391123010
Rees, G. & Main, G. (eds.) Children’s views on their lives and well-being in 15 countries: A report on the Children’s
Worlds Survey, 2013-14. http://www.isciweb.org/_Uploads/dbsAttachedFiles/ChildrensWorlds2015-
FullReport-Final.pdf