chile dairy and products annual whole and non fat dry milk annual
TRANSCRIPT

THIS REPORT CONTAINS ASSESSMENTS OF COMMODITY AND TRADE ISSUES MADE BY
USDA STAFF AND NOT NECESSARILY STATEMENTS OF OFFICIAL U.S. GOVERNMENT
POLICY
Date:
GAIN Report Number:
Approved By:
Prepared By:
Report Highlights:
Chile’s dairy production is expected to increase again this year, as weather has been favorable for
grass production which is the primary feed for dairy cattle in Chile.
Luis Hennicke, Agricultural Specialist
Rachel Bickford, Agricultural Attache
Whole and Non Fat Dry Milk Annual
Dairy and Products Annual
Chile
CI1227
10/4/2012
Required Report - public distribution
Executive Summary:
Chile’s milk production is expected to increase again in 2012 (Jan-Dec). As a result of good
weather conditions which is an important factor for pasture production. Chile’s dairy cattle are
grass fed so high-quality and abundant grass lead to increased milk production. The industry is
projecting another expansion, the outlook for the next years’ milk production is to increase further
as large producers are expanding their operations and many farmers invest in new technologies
and animal genetics.
Commodities:
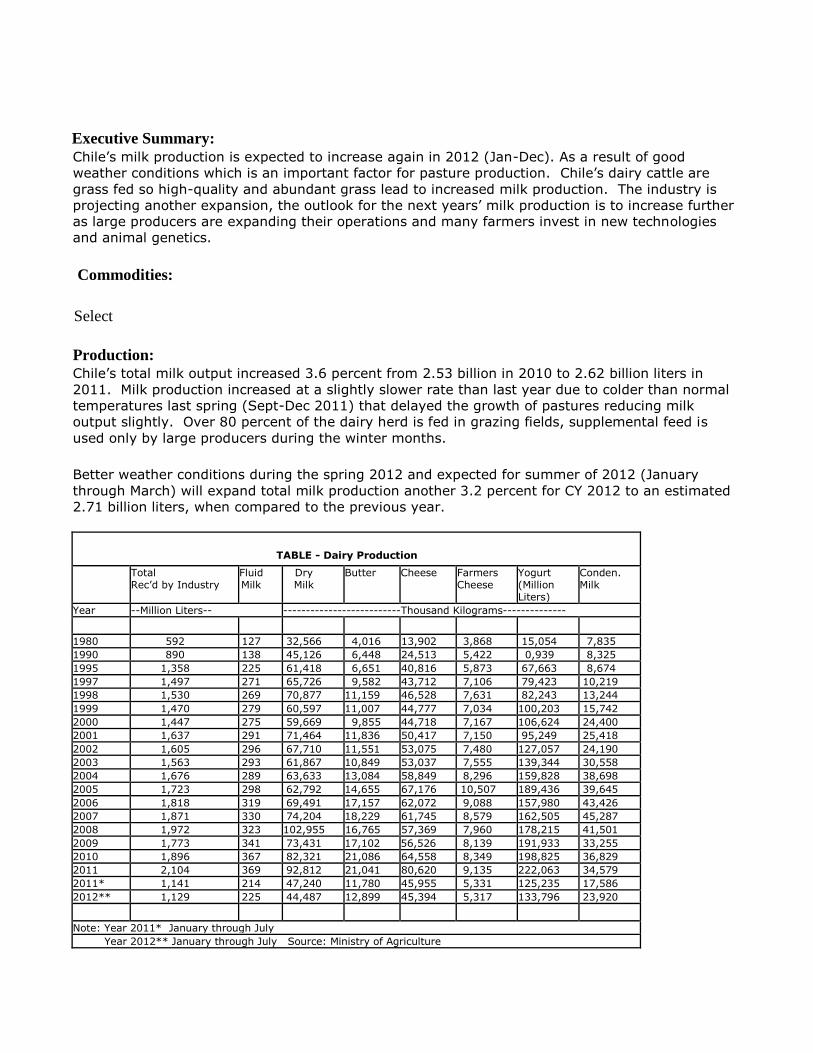
Production: Chile’s total milk output increased 3.6 percent from 2.53 billion in 2010 to 2.62 billion liters in
2011. Milk production increased at a slightly slower rate than last year due to colder than normal
temperatures last spring (Sept-Dec 2011) that delayed the growth of pastures reducing milk
output slightly. Over 80 percent of the dairy herd is fed in grazing fields, supplemental feed is
used only by large producers during the winter months.
Better weather conditions during the spring 2012 and expected for summer of 2012 (January
through March) will expand total milk production another 3.2 percent for CY 2012 to an estimated
2.71 billion liters, when compared to the previous year.
TABLE - Dairy Production Total
Rec’d by Industry Fluid Milk
Dry Milk
Butter Cheese Farmers Cheese
Yogurt (Million Liters)
Conden. Milk
Year --Million Liters-- --------------------------Thousand Kilograms--------------
1980 592 127 32,566 4,016 13,902 3,868 15,054 7,835 1990 890 138 45,126 6,448 24,513 5,422 0,939 8,325 1995 1,358 225 61,418 6,651 40,816 5,873 67,663 8,674 1997 1,497 271 65,726 9,582 43,712 7,106 79,423 10,219 1998 1,530 269 70,877 11,159 46,528 7,631 82,243 13,244 1999 1,470 279 60,597 11,007 44,777 7,034 100,203 15,742 2000 1,447 275 59,669 9,855 44,718 7,167 106,624 24,400 2001 1,637 291 71,464 11,836 50,417 7,150 95,249 25,418 2002 1,605 296 67,710 11,551 53,075 7,480 127,057 24,190 2003 1,563 293 61,867 10,849 53,037 7,555 139,344 30,558 2004 1,676 289 63,633 13,084 58,849 8,296 159,828 38,698 2005 1,723 298 62,792 14,655 67,176 10,507 189,436 39,645 2006 1,818 319 69,491 17,157 62,072 9,088 157,980 43,426 2007 1,871 330 74,204 18,229 61,745 8,579 162,505 45,287 2008 1,972 323 102,955 16,765 57,369 7,960 178,215 41,501 2009 1,773 341 73,431 17,102 56,526 8,139 191,933 33,255 2010 1,896 367 82,321 21,086 64,558 8,349 198,825 36,829 2011 2,104 369 92,812 21,041 80,620 9,135 222,063 34,579 2011* 1,141 214 47,240 11,780 45,955 5,331 125,235 17,586 2012** 1,129 225 44,487 12,899 45,394 5,317 133,796 23,920
Note: Year 2011* January through July Year 2012** January through July Source: Ministry of Agriculture
Select
Chile currently has an estimated 16,000 dairy farmers with approximately 460,000 cows in
production, of which 80 percent are considered small producers and the whole dairy industry
employs directly and indirectly an estimated 35,000 workers.
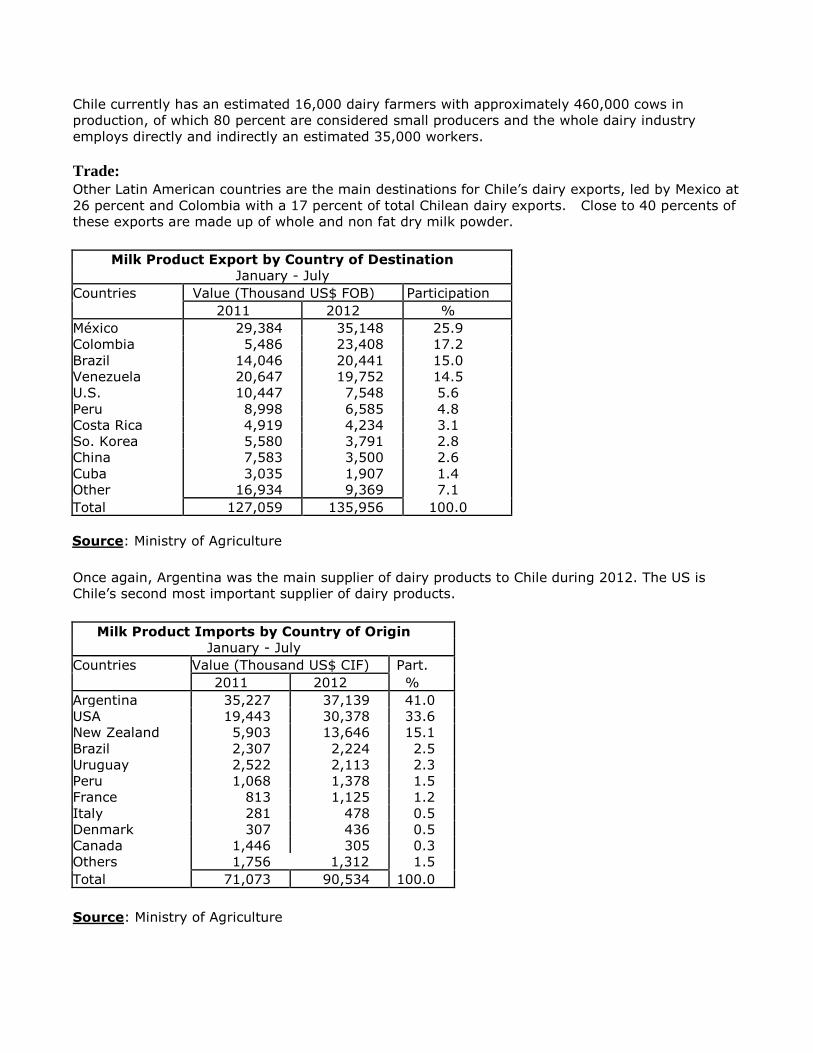
Trade: Other Latin American countries are the main destinations for Chile’s dairy exports, led by Mexico at
26 percent and Colombia with a 17 percent of total Chilean dairy exports. Close to 40 percents of
these exports are made up of whole and non fat dry milk powder.
Milk Product Export by Country of Destination
January - July
Countries Value (Thousand US$ FOB) Participation
2011 2012 %
México 29,384 35,148 25.9
Colombia 5,486 23,408 17.2
Brazil 14,046 20,441 15.0
Venezuela 20,647 19,752 14.5
U.S. 10,447 7,548 5.6
Peru 8,998 6,585 4.8
Costa Rica 4,919 4,234 3.1
So. Korea 5,580 3,791 2.8
China 7,583 3,500 2.6
Cuba 3,035 1,907 1.4
Other 16,934 9,369 7.1
Total 127,059 135,956 100.0
Source: Ministry of Agriculture
Once again, Argentina was the main supplier of dairy products to Chile during 2012. The US is
Chile’s second most important supplier of dairy products.
Milk Product Imports by Country of Origin
January - July
Countries Value (Thousand US$ CIF) Part.
2011 2012 %
Argentina 35,227 37,139 41.0
USA 19,443 30,378 33.6
New Zealand 5,903 13,646 15.1
Brazil 2,307 2,224 2.5
Uruguay 2,522 2,113 2.3
Peru 1,068 1,378 1.5
France 813 1,125 1.2
Italy 281 478 0.5
Denmark 307 436 0.5
Canada 1,446 305 0.3
Others 1,756 1,312 1.5
Total 71,073 90,534 100.0
Source: Ministry of Agriculture

The dairy industry’s export exceeds imports in volume and value. In CY2011 the trade balance
expressed in fluid milk equivalent fell when compared to the previous year.
Trade balance, January - July 2011
Volume (M.T. Thous.Ltrs)
Expressed in fluid milk equivalent (Thous.
Liters)
Item 2009 2010 2011 2012 2009 2010 2011 2011
IMPORTS
UHT
Products 0 0 103 1.191 0 0 103 1,191
NFDM 3,147 818 4,643 5,452 36,159 9,399 53,348 62,643
Whole dry
milk 1,111 125 2,618 3,533 9,332 1,050 21,991 29,677
Cream 1 1 0 1 1 1 0 1
Evaporate
d milk 869 811 636 797 1,999 1,865 1,463 1,833
Condensed
milk 303 273 95 48 818 737 257 130
Yogurt 1,920 1,280 1,672 112 1,920 1,280 1,672 112
Butter 558 982 722 548 558 982 722 548
Cheese 5,305 3,894 5,996 9,461 53,050 38,940 59,960 94,610
Caramel
milk &
others 1,772 1,840 1,417 1,123 3,898 4,048 3,117 2,471
Dairy
drinks 1 13 17 1 1 13 17 1
Total 110,083 60,505 144,367 193,217
EXPORTS
UHT
Products 1,411 269 573 1,212 1,411 269 573 1,212
NFDM 53 1,521 1,616 4,020 609 17,476 18,568 46,190
Whole dry
milk 9,918 6,712 11,287 10,239 83,311 56,381 94,811 86,190
Cream 152 146 117 276 152 146 117 276
Evaporate
d milk 17 13 2 1 39 30 5 2
Condensed
milk
13,52
1
15,95
8 16,057 18,537 36,507 43,087 43,354 50,050
Yogurt 24 24 25 30 24 24 25 30
Butter 519 1,303 1,703 1,761 519 1,303 1,703 1,761
Cheese 5,451 6,454 6,470 5,398 54,510 64,540 64,700 53,980
Caramel
milk &
others 2,156 2,079 1,914 2,289 4,743 4,574 4,211 5,036
Dairy
drinks 35 35 21 2,338 35 35 21 2,338
Total 181,906 187,899 228,092 246,882
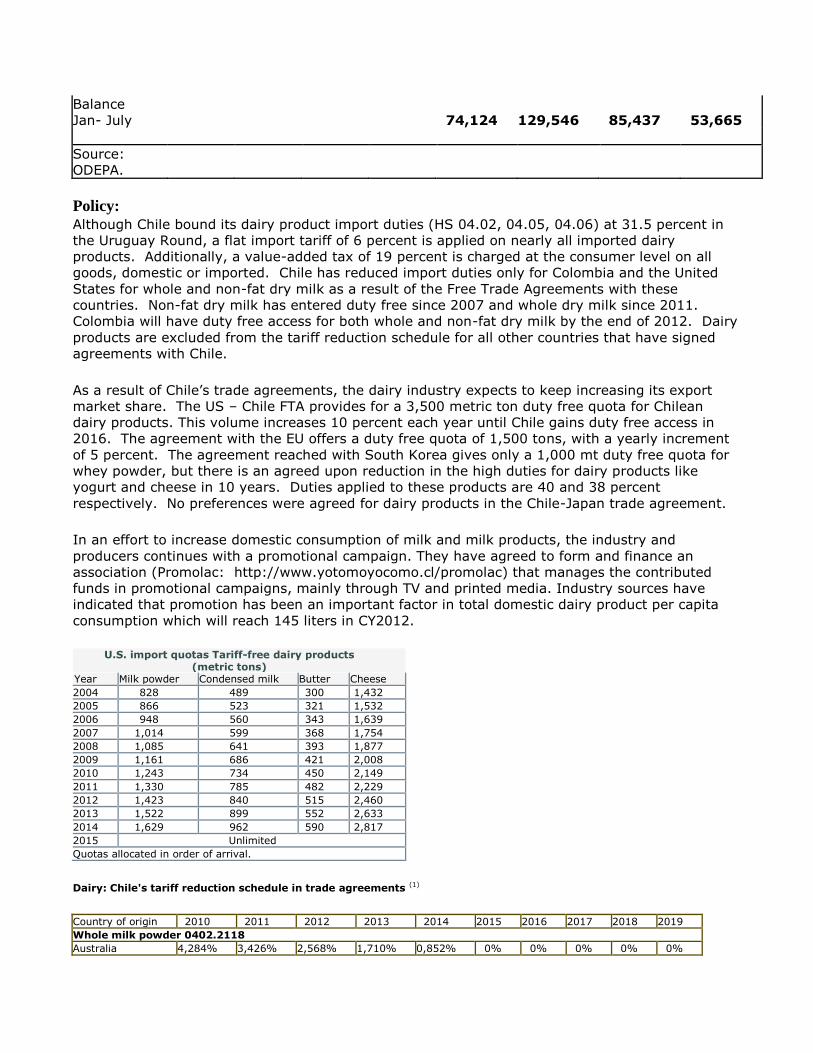
Balance
Jan- July 74,124 129,546 85,437 53,665
Source:
ODEPA.
Policy: Although Chile bound its dairy product import duties (HS 04.02, 04.05, 04.06) at 31.5 percent in
the Uruguay Round, a flat import tariff of 6 percent is applied on nearly all imported dairy
products. Additionally, a value-added tax of 19 percent is charged at the consumer level on all
goods, domestic or imported. Chile has reduced import duties only for Colombia and the United
States for whole and non-fat dry milk as a result of the Free Trade Agreements with these
countries. Non-fat dry milk has entered duty free since 2007 and whole dry milk since 2011.
Colombia will have duty free access for both whole and non-fat dry milk by the end of 2012. Dairy
products are excluded from the tariff reduction schedule for all other countries that have signed
agreements with Chile.
As a result of Chile’s trade agreements, the dairy industry expects to keep increasing its export
market share. The US – Chile FTA provides for a 3,500 metric ton duty free quota for Chilean
dairy products. This volume increases 10 percent each year until Chile gains duty free access in
2016. The agreement with the EU offers a duty free quota of 1,500 tons, with a yearly increment
of 5 percent. The agreement reached with South Korea gives only a 1,000 mt duty free quota for
whey powder, but there is an agreed upon reduction in the high duties for dairy products like
yogurt and cheese in 10 years. Duties applied to these products are 40 and 38 percent
respectively. No preferences were agreed for dairy products in the Chile-Japan trade agreement.
In an effort to increase domestic consumption of milk and milk products, the industry and
producers continues with a promotional campaign. They have agreed to form and finance an
association (Promolac: http://www.yotomoyocomo.cl/promolac) that manages the contributed
funds in promotional campaigns, mainly through TV and printed media. Industry sources have
indicated that promotion has been an important factor in total domestic dairy product per capita
consumption which will reach 145 liters in CY2012.
U.S. import quotas Tariff-free dairy products
(metric tons) Year Milk powder Condensed milk Butter Cheese 2004 828 489 300 1,432 2005 866 523 321 1,532 2006 948 560 343 1,639 2007 1,014 599 368 1,754 2008 1,085 641 393 1,877 2009 1,161 686 421 2,008 2010 1,243 734 450 2,149 2011 1,330 785 482 2,229 2012 1,423 840 515 2,460 2013 1,522 899 552 2,633 2014 1,629 962 590 2,817 2015 Unlimited Quotas allocated in order of arrival.
Dairy: Chile's tariff reduction schedule in trade agreements (1) Country of origin 2010 2011 2012 2013 2014 2015 2016 2017 2018 2019 Whole milk powder 0402.2118 Australia 4,284% 3,426% 2,568% 1,710% 0,852% 0% 0% 0% 0% 0%
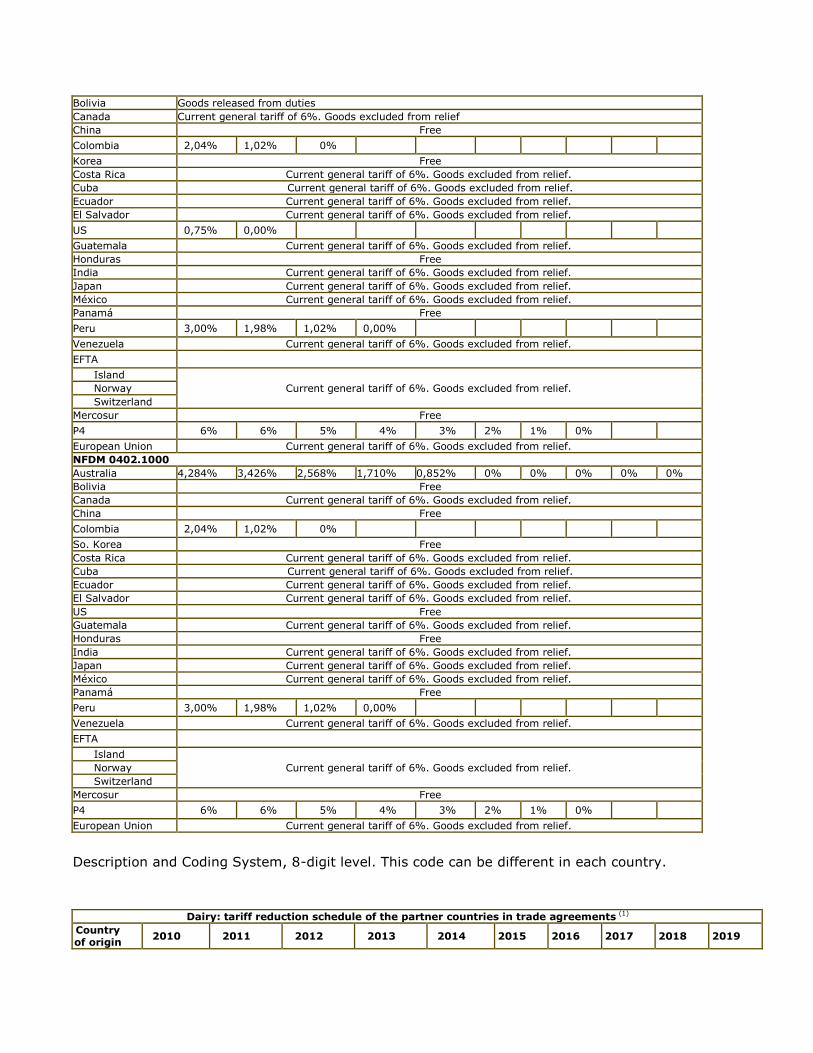
Bolivia Goods released from duties Canada Current general tariff of 6%. Goods excluded from relief China Free Colombia 2,04% 1,02% 0% Korea Free Costa Rica Current general tariff of 6%. Goods excluded from relief. Cuba Current general tariff of 6%. Goods excluded from relief. Ecuador Current general tariff of 6%. Goods excluded from relief. El Salvador Current general tariff of 6%. Goods excluded from relief. US 0,75% 0,00% Guatemala Current general tariff of 6%. Goods excluded from relief. Honduras Free India Current general tariff of 6%. Goods excluded from relief. Japan Current general tariff of 6%. Goods excluded from relief. México Current general tariff of 6%. Goods excluded from relief. Panamá Free Peru 3,00% 1,98% 1,02% 0,00% Venezuela Current general tariff of 6%. Goods excluded from relief. EFTA Island
Current general tariff of 6%. Goods excluded from relief. Norway Switzerland Mercosur Free P4 6% 6% 5% 4% 3% 2% 1% 0% European Union Current general tariff of 6%. Goods excluded from relief. NFDM 0402.1000 Australia 4,284% 3,426% 2,568% 1,710% 0,852% 0% 0% 0% 0% 0% Bolivia Free Canada Current general tariff of 6%. Goods excluded from relief. China Free Colombia 2,04% 1,02% 0% So. Korea Free Costa Rica Current general tariff of 6%. Goods excluded from relief. Cuba Current general tariff of 6%. Goods excluded from relief. Ecuador Current general tariff of 6%. Goods excluded from relief. El Salvador Current general tariff of 6%. Goods excluded from relief. US Free Guatemala Current general tariff of 6%. Goods excluded from relief. Honduras Free India Current general tariff of 6%. Goods excluded from relief. Japan Current general tariff of 6%. Goods excluded from relief. México Current general tariff of 6%. Goods excluded from relief. Panamá Free Peru 3,00% 1,98% 1,02% 0,00% Venezuela Current general tariff of 6%. Goods excluded from relief. EFTA Island
Current general tariff of 6%. Goods excluded from relief. Norway Switzerland Mercosur Free P4 6% 6% 5% 4% 3% 2% 1% 0% European Union Current general tariff of 6%. Goods excluded from relief.
Description and Coding System, 8-digit level. This code can be different in each country.
Dairy: tariff reduction schedule of the partner countries in trade agreements (1)
Country of origin 2010 2011 2012 2013 2014 2015 2016 2017 2018 2019
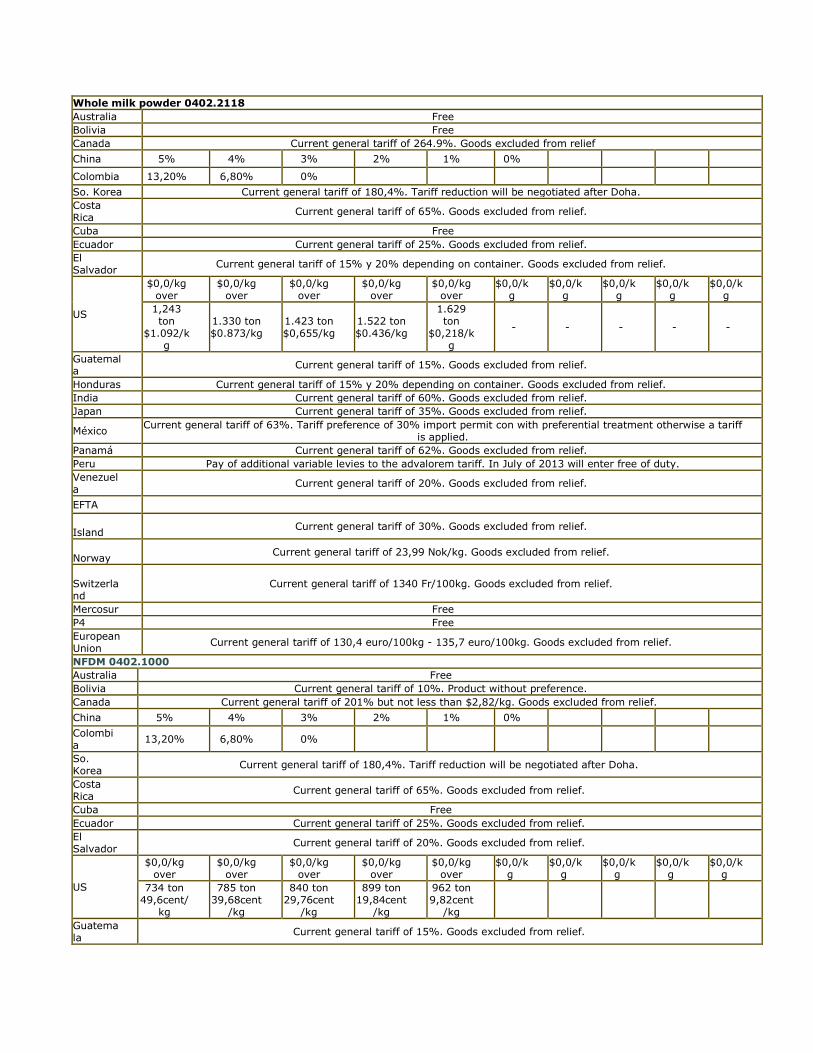
Whole milk powder 0402.2118 Australia Free Bolivia Free Canada Current general tariff of 264.9%. Goods excluded from relief China 5% 4% 3% 2% 1% 0%
Colombia 13,20% 6,80% 0% So. Korea Current general tariff of 180,4%. Tariff reduction will be negotiated after Doha. Costa Rica Current general tariff of 65%. Goods excluded from relief.
Cuba Free Ecuador Current general tariff of 25%. Goods excluded from relief. El Salvador Current general tariff of 15% y 20% depending on container. Goods excluded from relief.
US
$0,0/kg over
$0,0/kg over
$0,0/kg over
$0,0/kg over
$0,0/kg over
$0,0/kg
$0,0/kg
$0,0/kg
$0,0/kg
$0,0/kg
1,243 ton
$1.092/kg
1.330 ton $0.873/kg
1.423 ton $0,655/kg
1.522 ton $0.436/kg
1.629 ton
$0,218/kg
- - - - -
Guatemala Current general tariff of 15%. Goods excluded from relief.
Honduras Current general tariff of 15% y 20% depending on container. Goods excluded from relief. India Current general tariff of 60%. Goods excluded from relief. Japan Current general tariff of 35%. Goods excluded from relief.
México Current general tariff of 63%. Tariff preference of 30% import permit con with preferential treatment otherwise a tariff is applied.
Panamá Current general tariff of 62%. Goods excluded from relief. Peru Pay of additional variable levies to the advalorem tariff. In July of 2013 will enter free of duty. Venezuela Current general tariff of 20%. Goods excluded from relief.
EFTA Island Current general tariff of 30%. Goods excluded from relief.
Norway Current general tariff of 23,99 Nok/kg. Goods excluded from relief.
Switzerland
Current general tariff of 1340 Fr/100kg. Goods excluded from relief.
Mercosur Free P4 Free European Union Current general tariff of 130,4 euro/100kg - 135,7 euro/100kg. Goods excluded from relief.
NFDM 0402.1000 Australia Free Bolivia Current general tariff of 10%. Product without preference. Canada Current general tariff of 201% but not less than $2,82/kg. Goods excluded from relief. China 5% 4% 3% 2% 1% 0% Colombia 13,20% 6,80% 0%
So. Korea Current general tariff of 180,4%. Tariff reduction will be negotiated after Doha.
Costa Rica Current general tariff of 65%. Goods excluded from relief.
Cuba Free Ecuador Current general tariff of 25%. Goods excluded from relief. El Salvador Current general tariff of 20%. Goods excluded from relief.
US
$0,0/kg over
$0,0/kg over
$0,0/kg over
$0,0/kg over
$0,0/kg over
$0,0/kg
$0,0/kg
$0,0/kg
$0,0/kg
$0,0/kg
734 ton 49,6cent/
kg
785 ton 39,68cent
/kg
840 ton 29,76cent
/kg
899 ton 19,84cent
/kg
962 ton 9,82cent
/kg
Guatemala Current general tariff of 15%. Goods excluded from relief.
Honduras Current general tariff of 15%. Goods excluded from relief.
India Current general tariff of 60%. Goods excluded from relief. Japan Current general tariff of 35%. Goods excluded from relief.
México Current general tariff of 63%. Tariff preference of 30% import permit with preferential treatment otherwise a tariff will be applied.
Panamá Current general tariff of 62%. Goods excluded from relief. Peru Pay of additional variable levies to the advalorem tariff. In July of 2013 will enter free of duty. Venezuela Current general tariff of 20%. Goods excluded from relief.
EFTA Island Current general tariff of 30%. Goods excluded from relief.
Norway Current general tariff of 22,87 Nok/kg. Goods excluded from relief.
Switzerland
Current general tariff of 323 Fr/100kg. Goods excluded from relief.
Mercosur Free P4 Free European Union Current general tariff of 118,8 euro/100kg - 125,4 euro/100kg. Goods excluded from relief.
Notes: (1) Based on the Harmonized Commodity Description and Coding System, 8-digit level. This code can be different in each country. (2) Whole powdered milk with fat content below 35%. For products with more than 35% fat is applied tariff of U.S. $ 1,556 per kilo. (C) It applies duty-free quota to 11 year life of the agreement. For amounts exceeding the duty-free quota entitlements would be maintained over years 1 to 7 and will remove tariffs from year 8 in five equal steps and made those goods duty free to count from January 1, 2012
Commodities:
Production: Close to 75 percent of Chile’s production of dry milk is whole milk powder. Production of whole dry
milk is expected to fall in CY2012 when compared to the previous year. For 2013 production of
whole dry milk is expected to stay at similar level in spite of a predicted increase of milk output.
Total milk production will expand as weather has been more favorable for grass production which
is the basic food in most milk production regions.
Consumption: Dry milk is available for sale in all Chilean supermarkets and smaller grocery
stores. Families that do not consume large quantities of milk or lack refrigerators to keep UHT
fresh after opening prefer dry rather than fluid milk. Ultra high heat treated milk (UHT milk) is
very common in Chile because you can store the containers for long time without refrigeration, but
once opened the containers have to be kept in refrigerators. Government food programs also
account for a significant proportion of dry milk consumption. Government tenders for dry milk may
be filled by either domestic or imported product. During the winter months, the industry
reconstitutes fluid milk from dry milk produced during the summer, in order to produce dairy
products that have a constant demand throughout the year.
Trade: Chile’s imports of whole dry milk depend on domestic production and on the exchange rate.
Dairy, Dry Whole Milk Powder
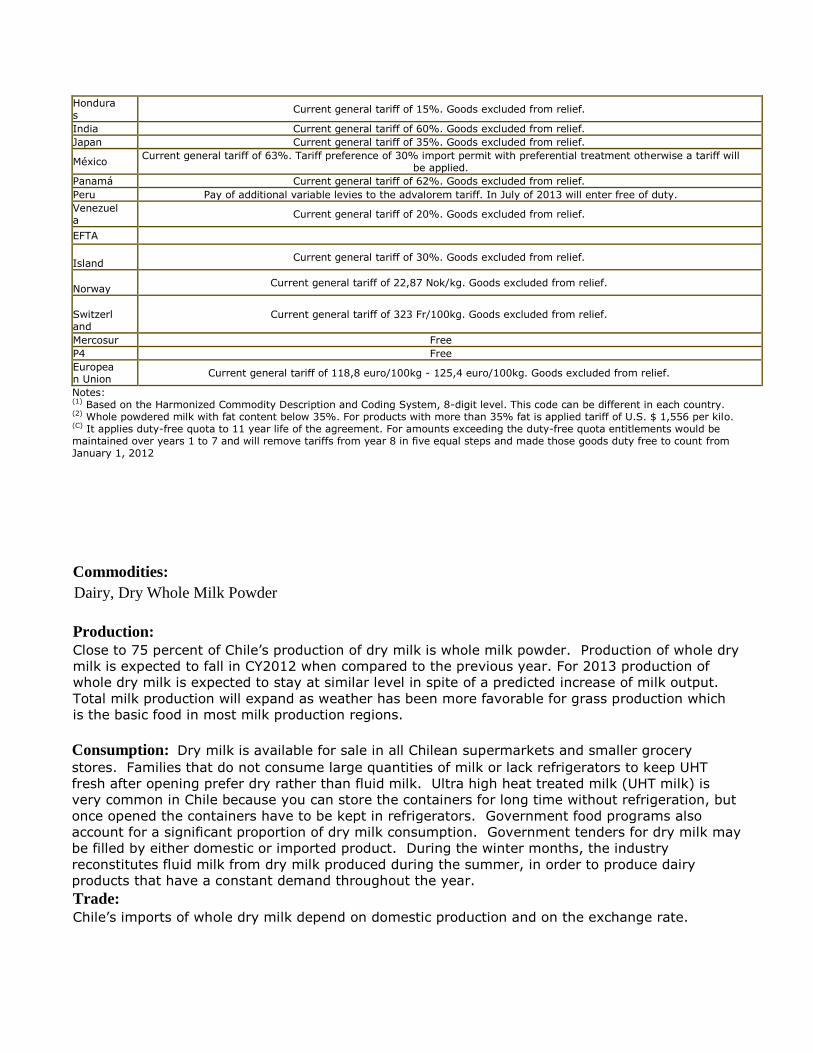
Although, Chile's milk processing industry projects increases in its export markets in the coming
years as the domestic industry becomes more competitive and the price incentive increases,
industry sources indicated that this will depend on the exchange rate with the US dollar. Chile’s
main export markets are in Latin America, particularly Venezuela, Peru, Colombia and Mexico.
Dairy, Dry Whole Milk Powder Chile 2011 2012 2013
Market Year Begin: Jan 2011 Market Year Begin: Jan 2012 Market Year Begin: Jan 2013 USDA Official
Old Post
New Post
USDA Official
Old Post
New Post
USDA Official
Old Post
New Post
Beginning Stocks 14 14 14 10 10 18 18
Production 65 65 73 68 68 69 69
Other Imports 3 3 3 1 1 5 4
Total Imports 3 3 3 1 1 5 4
Total Supply 82 82 90 79 79 92 91
Other Exports 18 18 14 15 15 14 14
Total Exports 18 18 14 15 15 14 14
Human Dom. Consumption 54 54 58 55 55 60 60
Other Use, Losses 0 0 0 0 0 0 0
Total Dom. Consumption 54 54 58 55 55 60 60
Total Use 72 72 72 70 70 74 74
Ending Stocks 10 10 18 9 9 18 17
Total Distribution 82 82 90 79 79 92 91
CY Imp. from U.S. 0 0 0 0 0 0 0
CY. Exp. to U.S. 0 0 0 0 0 0 0
Export Trade Matrix
Country Chile Commodity Dairy, Dry Whole Milk Powder
Time Period Jan-Dec Units: M.T.
Imports for: 2010 2011 2011 (Jan-Aug) 2012 (Jan-Aug)
U.S. 582 U.S. 428 U.S. 428 U.S. 0
Others Others Others Others
Brazil 2675 Brazil 2800 Brazil 2800 Colombia 3863
China 1350 Venezuela 2577 Venezuela 2577 Brazil 2250
Venezuela 1023 Colombia 2475 China 2000 Venezuela 1920
Cuba 825 China 2200 Algeria 1125 China 1000
Algeria 750 Algeria 1125 Colombia 1075 Japan 200
Dominican Rep 500 Cuba 700 Cuba 700 Peru 61
Peru 326 Peru 577 Peru 527 Algeria 21
Russia 225 Syria 175 Syria 175 U A Emirates 18
Colombia 150 Guatemala 157 U A Emirates 150 South Korea 4
Turkey 100 U A Emirates 150 Guatemala 144
Total for Others 7924 12936 11273 9337
Others not Listed 276 604 464 1594
Grand Total 8782 13968 12165 10931
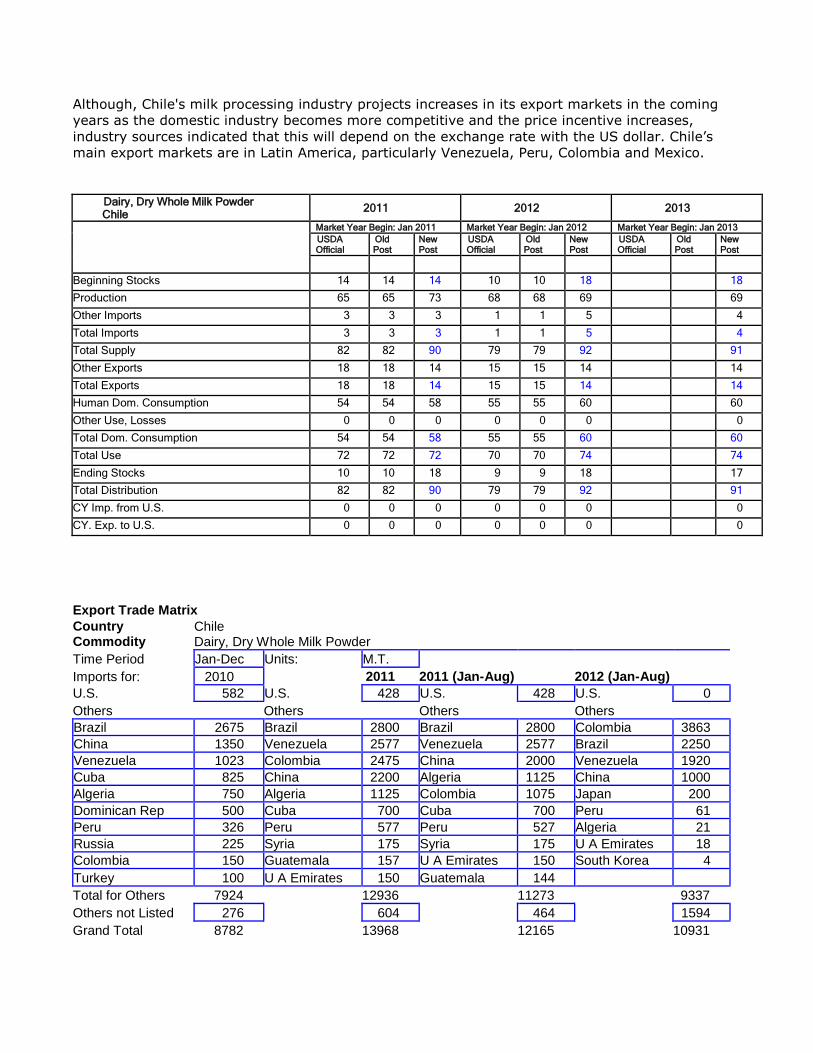
Import Trade Matrix
Country Chile Commodity Dairy, Dry Whole Milk Powder
Time Period Jan-Dec Units: M.T.
Imports for: 2010 2011 2011(Jan-Aug) 2012 (Jan-Aug)
U.S. 0 U.S. 0 U.S. 0 U.S. 0
Others Others Others Others
Argentina 1073 Argentina 2580 Argentina 2355 Argentina 2975
Uruguay 102 Uruguay 200 Uruguay 150 Colombia 816
France 63 New Zealand 54 New Zealand 35 Uruguay 200
New Zealand 17 France 26 France 26 New Zealand 149
Netherlands 1
Total for Others 1255 2860 2566 4141
Others not Listed 2 246 226 457
Grand Total 1257 3106 2792 4598
Commodities:
Production: Chile’s NFDM production rose in 2011, as milk output increased. Production in 2012
is expected to increase slightly as total milk production will increase as was indicated by the
industry, together with an increase in the domestic demand for NFDM.
Consumption: Chile’s food industry determines to a great degree the consumption level of NFDM
in Chile. Leading products made from NFDM are chocolate, ice cream and yogurt. The
consumption rate of these products is in line with Chile’s economic growth. In the outer years,
utilization is expected to continue to increase, but at a slower rate.
Trade: The US has become again an important supplier of NFDM (non fat dry milk) for Chile.
Competitive US prices for NFDM is the main reason for US milk imports, according to industry
sources.
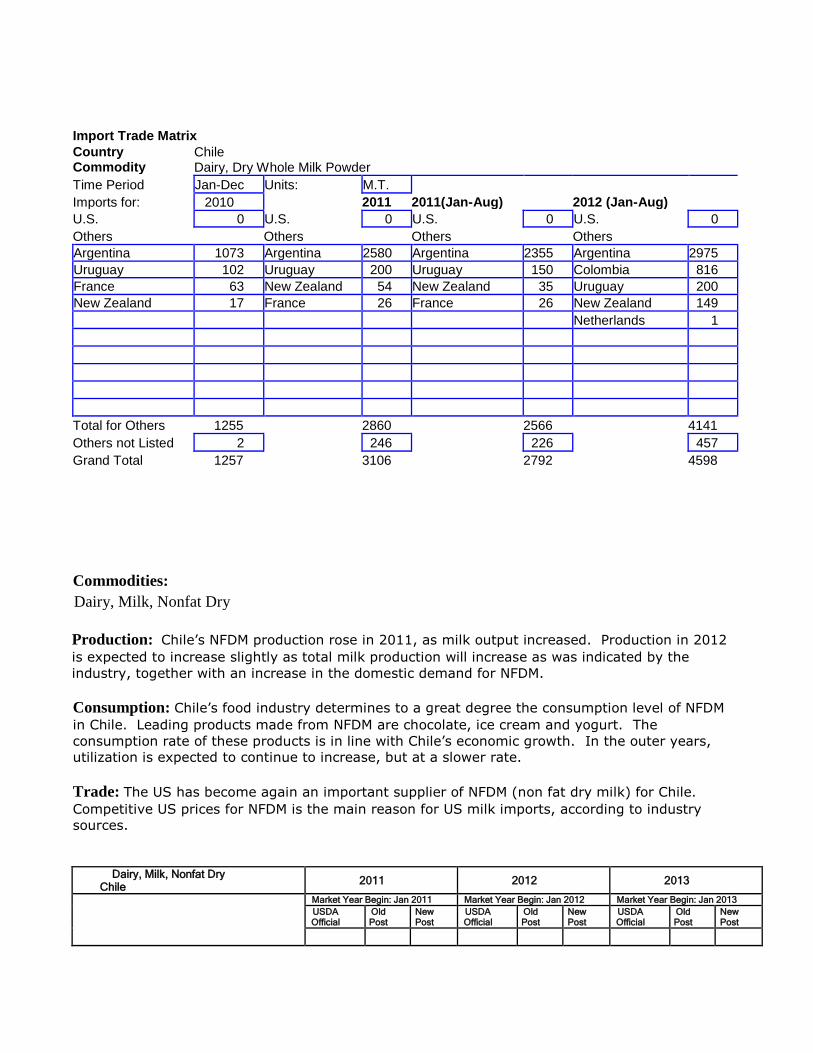
Dairy, Milk, Nonfat Dry Chile 2011 2012 2013
Market Year Begin: Jan 2011 Market Year Begin: Jan 2012 Market Year Begin: Jan 2013 USDA Official
Old Post
New Post
USDA Official
Old Post
New Post
USDA Official
Old Post
New Post
Dairy, Milk, Nonfat Dry
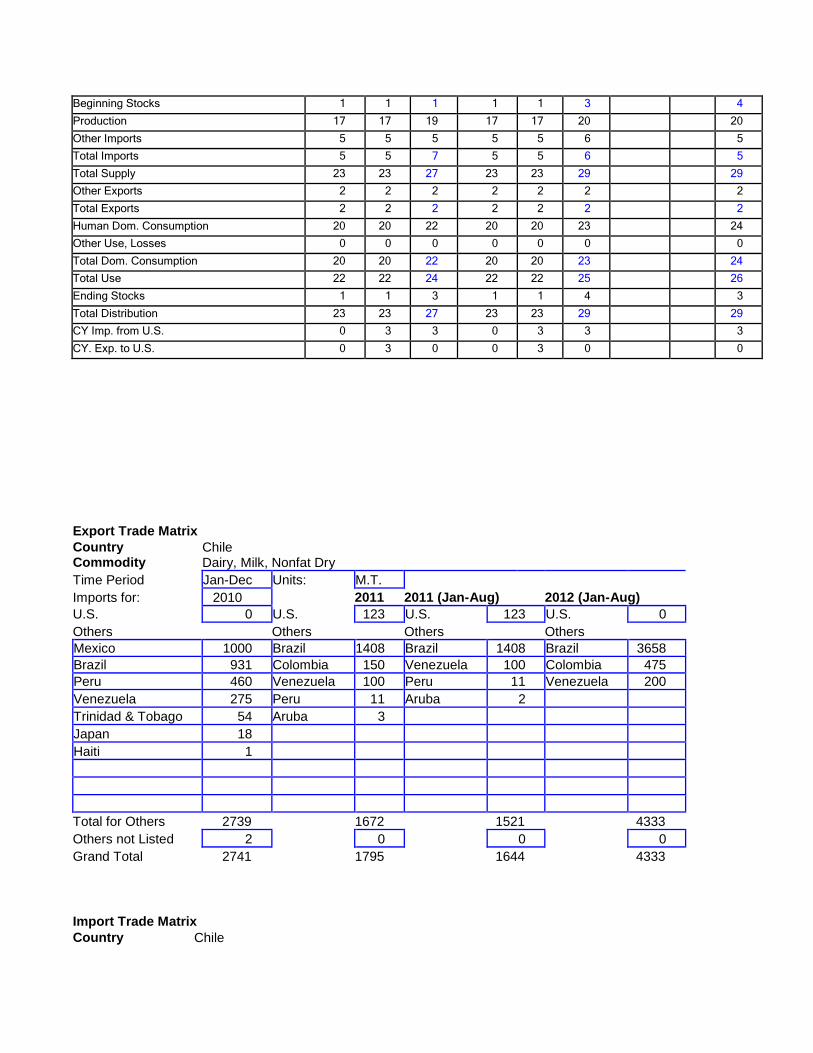
Beginning Stocks 1 1 1 1 1 3 4
Production 17 17 19 17 17 20 20
Other Imports 5 5 5 5 5 6 5
Total Imports 5 5 7 5 5 6 5
Total Supply 23 23 27 23 23 29 29
Other Exports 2 2 2 2 2 2 2
Total Exports 2 2 2 2 2 2 2
Human Dom. Consumption 20 20 22 20 20 23 24
Other Use, Losses 0 0 0 0 0 0 0
Total Dom. Consumption 20 20 22 20 20 23 24
Total Use 22 22 24 22 22 25 26
Ending Stocks 1 1 3 1 1 4 3
Total Distribution 23 23 27 23 23 29 29
CY Imp. from U.S. 0 3 3 0 3 3 3
CY. Exp. to U.S. 0 3 0 0 3 0 0
Export Trade Matrix
Country Chile Commodity Dairy, Milk, Nonfat Dry
Time Period Jan-Dec Units: M.T.
Imports for: 2010 2011 2011 (Jan-Aug) 2012 (Jan-Aug)
U.S. 0 U.S. 123 U.S. 123 U.S. 0
Others Others Others Others
Mexico 1000 Brazil 1408 Brazil 1408 Brazil 3658
Brazil 931 Colombia 150 Venezuela 100 Colombia 475
Peru 460 Venezuela 100 Peru 11 Venezuela 200
Venezuela 275 Peru 11 Aruba 2
Trinidad & Tobago 54 Aruba 3
Japan 18
Haiti 1
Total for Others 2739 1672 1521 4333
Others not Listed 2 0 0 0
Grand Total 2741 1795 1644 4333
Import Trade Matrix
Country Chile
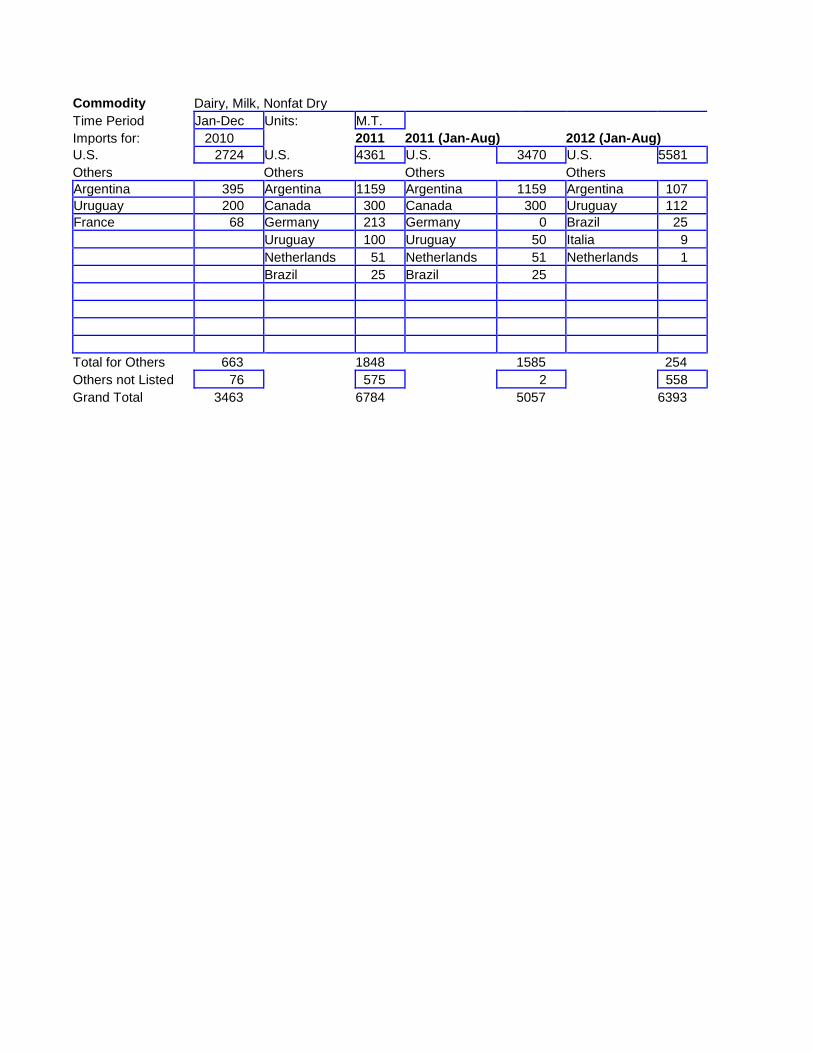
Commodity Dairy, Milk, Nonfat Dry
Time Period Jan-Dec Units: M.T.
Imports for: 2010 2011 2011 (Jan-Aug) 2012 (Jan-Aug)
U.S. 2724 U.S. 4361 U.S. 3470 U.S. 5581
Others Others Others Others
Argentina 395 Argentina 1159 Argentina 1159 Argentina 107
Uruguay 200 Canada 300 Canada 300 Uruguay 112
France 68 Germany 213 Germany 0 Brazil 25
Uruguay 100 Uruguay 50 Italia 9
Netherlands 51 Netherlands 51 Netherlands 1
Brazil 25 Brazil 25
Total for Others 663 1848 1585 254
Others not Listed 76 575 2 558
Grand Total 3463 6784 5057 6393