china bank 2010 annual report
TRANSCRIPT

15 April 2011 MS. JANET A. ENCARNACION Head, Disclosure Department PHILIPPINE STOCK EXCHANGE Disclosure Department Listing & Disclosure Group 4th Floor PSE Center, Exchange Road Ortigas Center, Pasig City Dear Ms. Encarnacion: We are pleased to furnish your good office with a copy of our SEC Form 17-A (Annual
Report pursuant to Section 17 of the Securities Regulation Code and Section 141 of the
Corporation Code of the Philippines) filed with the Securities and Exchange Commission
(SEC).
For your information and guidance.
Very truly yours,
ALEXANDER C. ESCUCHA First Vice President & Corporate Information Officer

COVER SHEET
4 4 3 SEC Registration Number
C H I N A B A N K I N G C O R P O R A T I O N
(Company’s Full Name) 1 1 F C H I N A B A N K B L D G 8 7 4 5 P A S E O D E R O X A S C O R V I L L A R S T M A K A T I
(Business Address: No., Street City/ Town / Province)
ATTY. LEILANI B. ELARMO 885-5145 Contact Person Company Telephone Number
0 4 1 5 1 7 - A* 0 5 0 6 Month Day FORM TYPE Month Day
Annual Meeting
Secondary License Type, If Applicable
C F D Dept. Requiring this Doc. Amended Articles Number / Section Total Amount of Borrowings
2,050 Total No. of Stockholders Domestic Foreign
To be accomplished by SEC Personnel concerned
File Number LCU
Document ID Cashier S T A M P S *with BIR-Stamped AFS and diskette copy Remarks: Please use BLACK ink for scanning purposes
8745 Paseo de Roxas cor. Villar St., 1226 Makati City


1
SECURITIES AND EXCHANGE COMMISSION SEC FORM 17-A
ANNUAL REPORT PURSUANT TO SECTION 17
OF THE SECURITIES REGULATION CODE AND SECTION 141 OF THE CORPORATION CODE OF THE PHILIPPINES
1. For the fiscal year ended December 31, 2010
2. SEC Identification Number: 443 (Exempt Securities)
3. BIR Tax Identification Code: 320-000-444-210
4. Name of issuer as specified in its charter: China Banking Corporation
5. Province, country or other jurisdiction of incorporation or organization: Philippines
6. Industry Classification Code: (SEC use only)
7. Address of principal office: China Bank Building, 8745 Paseo de Roxas Postal Code: 1226
corner Villar Street, Makati City
8. Issuer’s telephone number, including area code: (632) 885-5555
9. Securities registered pursuant to Sections 8 and 12 of the SRC or Sections 4 and 8 of the RSA:
Title of Each Class Number of Shares Outstanding Amount of Debt Outstanding Short Term : P211,450,346,776.00
Common 107,260,617 Long Term : P 6,862,086,782.00
10. Are any or all of these securities listed in a Stock Exchange? Yes [?] No [ ]
The above common shares are listed in the Philippine Stock Exchange. 11. Check whether the issuer:
(a) has filed all reports required to be filed by Section 17 of the SRC and SRC Rule 17.1 thereunder or Section 11 of the RSA and RSA Rule 11 (a) - 1 thereunder, and Sections 26 and 141 of The Corporation Code of the Philippines during the preceding twelve (12) months (or for such shorter period that the registrant was required to file such reports):
Yes [?] No [ ]
(b) has been subject to such filing requirements for the past 90 days: Yes [?] No [ ] 12. Aggregate market value of the voting stock held by non-affiliates: P26.95 Billion (as of December 31, 2010) 13. Portions of the Bank’s 2010 Annual Report to Stockholders are incorporated by reference in Parts I & II of
this report.

2
TABLE OF CONTENTS
PART I - BUSINESS AND GENERAL INFORMATION
Item 1 Business Item 2 Properties Item 3 Legal Proceedings Item 4 Submission of Matters to a Vote of Security Holders
PART II - OPERATIONAL AND FINANCIAL INFORMATION
Item 5 Market for Registrant’s Equity and Related Stockholders Matters Item 6 Management Discussion and Analysis or Plan of Operation Item 7 Financial Statements Item 8
Changes and Disagreements with Accountants on Accounting and Financial Disclosures
PART III - CONTROL AND COMPENSATION INFORMATION
Item 9 Directors and Executive Officers of the Registrant Item 10 Executive Compensation
Item 11 Security Ownership of Certain Record and Beneficial Owners and Management
Item 12 Certain Relationships and Related Transactions PART IV - CORPORATE GOVERNANCE
Item 13 Corporate Governance PART V - EXHIBITS AND SCHEDULES
Item 14
Exhibits and Reports (a) Exhibits (b) Reports on SEC Form 17-C (Current Report)
SIGNATURES EXHIBITS AND ANNEXES
3
PART I - BUSINESS AND GENERAL INFORMATION Item 1. Business (a) Form and Year of Organization China Banking Corporation (CHIB, China Bank) was incorporated on July 20, 1920 and commenced business on August 16 of the same year as the first privately owned local commercial bank in the Philippines. It resumed operations after World War II on July 23, 1945 and played a key role in the post-war reconstruction and economic recovery by providing financial support to businesses and entrepreneurs. CHIB was listed on the local stock exchange in 1947 and acquired its universal banking license in 1991. The Bank started by mainly catering to the Chinese-Filipino commercial sector, but has since expanded its market scope to include the retail and consumer segments. Its core banking franchise stems mainly from its 90-year history in the Philippines, a factor that has enabled it to become deeply entrenched within the socioeconomic fabric of the Chinese-Filipino community. The Bank’s market comprises the corporate, commercial, middle and retail markets. It provides a wide range of domestic and international banking services, and is one of the largest commercial banks in the country in terms of assets and capital. Key milestones of China Bank (CHIB) history include:
a. 1920 - CHIB was established as the first privately owned local commercial bank in the Philippines b. 1947 - CHIB was listed on the local stock exchange in 1947 c. 1969 - CHIB became the first bank in Southeast Asia to process deposit accounts on-line d. 1988 - CHIB was the first Philippine bank to offer telephone banking; joined seven other banks in setting
up BancNet, the country’s largest ATM network
e. 1991 - CHIB acquired its universal banking license f. 1996 - CHIB accessed offshore capital markets by issuing USD50MN FRCD g. 2005 - CHIB launched China Bank Online e-banking portal for retail and corporate customers h. 2006 - CHIB completed its first international secondary share offering i. 2007 - CHIB acquired Manila Bank with 75 branch licenses
- CHIB’s bancassurance joint venture with Manulife Phils. through a 5% equity stake in Manulife China Bank Life Assurance Corp. (MCB Life)
j. 2008 - CHIB issued its maiden offering of 5-year long-term negotiable certificate of deposits (LTNCD); former Manila Banking Corporation main office in Ayala Avenue was relaunched as the ChinaBank Savings headquarters; branch network exceeded the 200-mark
k. 2009 - CHIB is cited as one of the 11 Philippine companies and one of two Phil. banks which outperformed their peers of Top 100 publicly-listed Asean companies in creating wealth for shareholders, based on the study by Stern Stewart & Co.
l. 2010 - CHIB was included in the 30-stock PSE index (PSEi) starting May 12; Silver awardee on corporate governance, one of the top-scoring Publicly Listed Company by the Institute of Corporate Directors (ICD); celebrated its 90th anniversary
CHIB’s main business include corporate and SME lending, retail loans including mortgage and auto loans, treasury and foreign exchange trading, trust and investment management, wealth management, cash management, insurance products through China Bank Insurance Brokers, Inc. & MCBLife, internet banking and mobile banking services and inward remittances through tie-ups with remittance companies and exchange houses in the Middle East, Asia and major US cities. On its 90th year, CHIB posted a net income of P5.0 billion or 22% increase. CHIB is ranked no. 8 in total assets and no. 4 in terms of market value. CHIB was the most active among the major banks in terms of network expansion, opening a total of 22 branches, 253 for the main bank and 16 for China Bank Savings Inc, bringing our total network to 269 by year-end 2010.

4
The Bank has the following subsidiaries and affiliates:
Effective Percentages of Ownership
Subsidiary 2010 2009 Country of
Incorporation Principal Activities CBC Properties and Computer Center, Inc. 100.00% 100.00% Philippines Computer services CBC Forex Corporation 100.00% 100.00% Philippines Foreign exchange Chinabank Insurance Brokers, Inc. 100.00% 100.00% Philippines Insurance brokerage China Bank Savings, Inc 95.08% 95.06% Philippines Retail and consumer banking Manulife China Bank Life Assurance Corp 5.00% 5.00% Canada Insurance products (b) Bankruptcy, receivership or similar proceedings The Bank is not subject to any bankruptcy, receivership or similar proceedings. (c) Material Reclassification Merger, Consolidation or Purchase or Sale of Assets The Board of Directors on June 21, 2007 authorized the Bank to enter into a Memorandum of Agreement with the shareholders of The Manila Banking Corporation (TMBC) for the purchase of 87.52% of the total subscribed capital stock thereof. The Board approved on October 3, 2007 the use, appropriation and registration of the names “China Bank Savings, Inc.” as TMBC’s corporate name and “ChinaBank Savings” as its business or tradename, as well as all other proprietary rights and privileges appurtenant thereto, subject to conditions, and subject further to the approval by the regulatory offices. On July 16, 2008, the Bangko Sentral ng PIlipinas (BSP) and the Securities and Exchange Commission (SEC) approved the change in name. As of December 31, 2010, the Bank’s ownership of China Bank Savings totaled 95.08%. (d) Business of Issuer – Description of the Business and its Significant Subsidiaries
(i) Principal Products and Services CHIB’s main businesses include deposit taking, corporate and middle market lending, retail loans including mortgage and auto loans, insurance products through its subsidiaries, treasury and foreign exchange trading, trust and investment management, wealth management, cash management, internet banking and mobile banking services, inward remittances through tie-ups with remittance companies and exchange houses in the Middle East, Asia and major US cities. The income from these products/services is divided into two categories, namely (1) interest income from the Bank’s deposit taking and lending/investment activities which accounts for 74% of revenues and (2) other income (includes service charges, fees & commissions, trading gain, foreign exchange gain, trust fees, income from sale of acquired assets and other miscellaneous income) which account for 26% of revenues. DEPOSITS AND RELATED SERVICES Peso Deposits: Checking, Savings Time, Foreign Currency Deposits: (US Dollar & Euro) Savings, Time, Manager’s Check/Gift Checks, Safety Deposit Box, SSS Pension Accounts, Payroll Servicing Facility, Direct Deposit Facility for US Pensioner, Night Depository Services, Armored Car Deposit Pick-up Services, Domestic Collections REMITTANCE SERVICES Foreign and Domestic Remittances, China Bank On-time Remittance, China Bank Smart Money Card, Western Union Money Transfer Services, Philippine Retirement Authority Remittances and Deposits LOANS AND CREDIT FACILITIES Agriculture, Commercial and Industrial Financing, Special Lending Programs: Countryside Loan Funds; BSP Rediscounting; Industrial Guarantee Loan Fund; Environmental Development Program; Sustainable Logistics Development;, Industrial and Large Projects, Guarantee Programs, Consumer Loans: HomePlus Real Estate Loans; Contract to Sell Financing; AutoPlus Vehicle Loans; Personal Loans, Foreign Currency Loans (US Dollar, Euro and Japanese Yen)

5
INTERNATIONAL BANKING PRODUCTS & SERVICES Import and Export Financing, Foreign and Domestic Commercial Letters of Credit, Standby Letters of Credit, Collection of Clean and Documentary Bills, Bank Guaranty (Shipside Bond), Purchase and Sale of Foreign Exchange, Travel Funds, Servicing of Foreign Loans and Investments, Trade Inquiry, Trust Receipt Facility, Correspondent Banking Services TREASURY SERVICES Peso-Denominated Instruments: Government and Corporate Bond Issues, Foreign Currency Denominated Instruments: Government and Corporate Bond Issues, Foreign Exchange: Spot, Forward; Swaps TRUST SERVICES Corporate and Institutional Trust: Fund Management; Employee Benefit Planning; Retirement Plan; Provident/Savings Plan; Escrow Services; Collateral/Mortgage Trust; Loan Agency Services, Wealth Management: Estate Planning - Living Trust, Life Insurance Trust; Investment Management Arrangement - Investment Advisory, Investment Agency, Unit Investment Trust Funds: China Bank Money Market Fund; China Bank Dollar Fund; China Bank GS Fund; China Bank Balanced Fund PAYMENT AND SETTLEMENT SERVICES Electronic Banking Channels: China Bank Automated Teller Machine (ATM); China Bank TellerPhone; China Bank Online (Internet & Mobile Banking; Cashless Shopping (POS), Cash Management Services: (1) Collections: Check Depot Post-Dated Check Warehousing Service, Sure Collect Check Deposit Pick-up Services, Bills Pay Plus Multi-Channel Bills Payment Services, BancNet Payment System, Provincial Cash Deposit Pick Up Services, Automatic Credit Arrangement; (2) Disbursements: Check Write Plus (Corporate and Manager’s Check Writing System), Upload Pro File Delivery System, BIR eFPS Online Tax Payments, Comprehensive Payroll Offering (Crediting and Outsourcing), SSSNet Loan Repayment and Employee Contribution Facility, Automatic Debit Arrangement, Stockholders’ Dividend Credit Facility; (3) Liquidity Management: China Bank Online (Corporate), Sure Sweep (Account Sweeping/Pooling), Customized Bank Statement Generation System, Bills Payments/Donations: BIR, PhilHealth, SSS, Credit Cards, Loans, Internet & Telecommunications, Utility and Cable TV Companies, Insurance/Pre-need, Schools, Charitable Institutions, Others INSURANCE PRODUCTS Bancassurance: Income Protection, Critical Illness, Retirement, Savings & Education, Investment with Protection Individual Life Insurance: Mortgage Redemption Insurance; Term Insurance, Group Life Insurance, Non-Life Insurance: Fire Insurance: Residential; Commercial; Trust Receipts, Motor Car Insurance, Aviation Insurance, Marine Insurance: Hull/Vessel; Cargo, Electronic Equipment Insurance, Liability Insurance: Comprehensive General Liability (C.G.L.); Product Directors and Officers Liability Insurance, Accident and Health: Medical Insurance – HMO; Personal Accident – Individual/Group; Travel Insurance, Casualty: Money Insurance; Fidelity Guarantee; Property Floater, All Risks Insurance: Contractor’s All Risk (CAR); Insurance/Erector’s All Risk; Insurance Bonds (Judicial/Performance/Fidelity/Surety, etc), Specialized Insurance Programs
(ii) Distribution Methods of Products and Services:
China Bank’s products and services are made available across multiple distribution and delivery channels: 269 branch network (of which 253 are China Bank branches and 16 ChinaBank Savings branches); 431 ATM network (269 in-branch and 162 off-site ATMs nationwide; founding member of the BancNet consortium, (access to almost 4,000 ATMs nationwide of both the BancNet, Megalink and Expressnet networks; online banking (through the Bank’s e-portal www.chinabank.ph); mobile banking (available to subscribers of all three major telecommunication companies); China Bank EZPay Kiosk (tax payment); and TellerPhone (phone banking). Its head office is located at 8745, Paseo de Roxas corner Villar Streets, Makati City. METRO MANILA BRANCHES 1. MAKATI MAIN BRANCH (HO) – CBC Bldg., 8745 Paseo de Roxas cor. Villar Sts., Makati City 2. BINONDO BUSINESS CENTER –CBC Bldg., Dasmariñas cor. Juan Luna Sts. Binondo, Manila 3. ANTIPOLO CITY BRANCH – G/F Budget Lane Arcade, No. 6, Provincial Road, Bgy. San Jose, Antipolo City, Rizal 4. ARANETA AVE. BRANCH – Philippine Whithasco Bldg., 420 Araneta Avenue, cor. Bayani St., Quezon City 5. ARRANQUE BRANCH – Don Felipe Building, 675 Tomas Mapua St., Sta. Cruz, Manila 6. ASUNCION BRANCH – Units G6 & G7 Chinatown Steel Towers, Asuncion St., San Nicolas, Manila 7. AYALA-ALABANG BRANCH – G/F, CBC-Building Acacia Ave., Madrigal Business Park, Ayala Alabang, Muntinlupa City 8. AYALA-COLUMNS BRANCH – G/F The Columns Tower 3, Ayala Avenue, Makati City

6
9. BALINTAWAK-BONIFACIO BR. – 657 A. Bonifacio Avenue, Balintawak, Quezon City 10. BALUT BRANCH – North Bay Shopping Center, Honorio Lopez Boulevard, Balut, Tondo, Manila 11. BANAWE BRANCH – CBC Building, 680 Banawe Avenue, Sta. Mesa Heights, District I, Quezon City 12. BANAWE-MA. CLARA BRANCH – G.F Property Bldg., Banawe, Quezon City 13. BETTER LIVING SUBD. BRANCH – 128 Doña Soledad Ave., Parañaque City 14. BF HOMES BRANCH – Aguirre cor. El Grande Aves., United BF Homes, Parañaque City 15. BF HOMES-AGUIRRE BRANCH – Margarita Centre, Aguirre Ave. cor. Elsie Gaches Street, BF Homes, Parañaque City 16. BF RESORT VILLAGE BRANCH – BF Resort Drive cor. Gloria Diaz St., BF Resort Village Talon Dos, Las Piñas City 17. BEL-AIR BRANCH – 48 Avant Bldg. Jupiter cor. Mars Sts. Bel Air Village, Makati City 18. BLUMENTRITT BRANCH – 1777-1781 Cavite corner Leonor Rivera St., Blumentritt, Sta. Cruz, Manila 19. BO. KAPITOLYO BRANCH – G/F P&E Building, 12 United corner First Sts. Bo. Kapitolyo, Pasig City 20. BONI-SERRANO BRANCH – G/F, Greenhills Garden, Garden Square No. 297 Col Bonny Serrano Ave., Quezon City 21. CAINTA BRANCH – CBC Bldg (Beside Sta. Lucia East Mall), Felix Ave. (Imelda Ave.), Cainta, Rizal 22. CAPITOL HILLS BRANCH – G/F Design Pro Building Capitol Hills, Old Balara, Quezon City 23. COMMONWEALTH AVENUE BRANCH – LGF Ever Gotesco Mall, Commonwealth Center Commonwealth Ave cor. Don Antonio
Road, Quezon City 24. CONGRESSIONAL AVENUE BRANCH – G/F Unit C The Arete Square, Congressional Ave., Project 8, Quezon City 25. CORINTHIAN HILLS BRANCH – G/F The Clubhouse, Corinthian Hills, Temple Drive Bgy. Ugong Norte, Quezon City 26. CUBAO-ARANETA BRANCH – Unit 16, New Frontier Cinema Theater Arcade, Gen. Roxas Ave., Araneta Shopping Ctr, Cubao,
Quezon City 27. CUBAO-AURORA BRANCH – 911 Aurora Boulevard Extension corner Miami Street, Cubao, Quezon City 28. D. TUAZON BRANCH – 174 A-B D. Tuazon St., Bgy. Maharlika, Sta. Mesa Heights, Quezon City 29. DASMARIÑAS VILLAGE BRANCH – 2283 Pasong Tamo Ext. corner Lumbang Street Makati City 30. DON ANTONIO BRANCH – G/F Royale Place, Don Antonio Ave., Bgy. Old Balara, Quezon City 31. DEL MONTE AVENUE BRANCH – G. Araneta Avenue corner Del Monte Avenue, Quezon City 32. DEL MONTE – MATUTUM BRANCH – No. 202 Del Monte Avenue cor. Matutum St., Brgy. St. Peter, Quezon City 33. DIVISORIA-STA. ELENA BRANCH – Unit G-22 New Divisoria Condominium Ctr Sta. Elena St. near cor Tabora St. Binondo 34. EDSA-KALOOKAN BRANCH – No. 531 (Lot 5 Block 30) EDSA near corner Biglang Awa Street, Kalookan City 35. E. RODRIGUEZ SR. BLVD. BRANCH – CBC Bldg., #286 E. Rodriguez Sr. Blvd., Brgy. Damayang Lagi, Quezon City 36. E. RODRIGUEZ-HILLCREST BRANCH – No. 402 E. Rodriguez Sr. Blvd., Cubao, Quezon City 37. ELCANO BRANCH – G/F Elcano Tower, Elcano Street, San Nicolas, Manila 38. ERMITA BRANCH – Ground Floor A, Ma. Natividad Bldg., #470 T. M. Kalaw cor. Cortada Sts., Ermita, Manila 39. ESPAÑA BRANCH – España cor. Valencia Sts., Sampaloc, Manila 40. EVANGELISTA BRANCH – Evangelista corner Gen Estrella St., Makati City 41. EXAMINER BRANCH – No. 1525 Quezon Ave. cor. Examiner St., West Triangle, Quezon City 42. FAIRVIEW BRANCH – G/F Angelenix House, Fairview Ave. corner Camaro St., Quezon City 43. FILINVEST CORPORATE CITY BRANCH – G/F Wilcon Depot, Alabang- Zapote road cor. Bridgeway Ave. Filinvest Corporate City,
Alabang, Muntinlupa City 44. FORT BONIFACIO GLOBAL CITY BRANCH – G/F Marajo Tower 26th St., Fort Bonifacio Global City, Taguig City 45. GIL PUYAT AVENUE BRANCH – G/F HPL Bldg., No. 60 Sen. Gil Puyat Ave., Makati City 46. GREENBELT 1 BRANCH – G/F Greenbelt 1, Legaspi St. near corner Paseo de Roxas, Makati City 47. GREENHILLS BRANCH – G/F Gift Gate Bldg, Greenhills Shopping Center, San Juan, Metro Manila 48. GREENHILLS-ORTIGAS BRANCH – CBC-Building, 14 Ortigas Avenue Greenhills, San Juan, Metro Manila 49. HEROES HILLS BRANCH – Quezon Ave. cor. J. Abad Santos St., Heroes Hills, Quezon City 50. ILAYA BRANCH – #947 APL-YSL Bldg., Ilaya, Tondo, Manila 51. INTRAMUROS BRANCH – No. 409 A. Soriano Ave, Intramuros Manila 52. J. ABAD SANTOS AVENUE BRANCH – 2159 J. Abad Santos Ave., cor. Batangas St., Tondo, Manila 53. JUAN LUNA BRANCH – G/F Aclem Bldg., 501 Juan Luna St., Binondo, Manila 54. KALOOKAN BRANCH – CBC Bldg., 167 Rizal Avenue Extension, Grace Park, Kalookan City 55. KALAYAAN AVE. BRANCH – G/F PPS Building, Kalayaan Avenue, Quezon City 56. KALOOKAN-CAMARIN BRANCH – Annex Bldg., Sapce No. 3, Zabarte Town Center, No. 588 Camarin road cor. Zabarte Road,
Kalookan City 57. KALOOKAN-MONUMENTO BRANCH – 779 Mc Arthur Highway, Kalookan City 58. KAMIAS BRANCH – G/F CRM Bldg., 116 Kamias Road cor. Kasing-Kasing St., Quezon City 59. KARUHATAN BRANCH – No. 248 McArthur Highway, Karuhatan, Valenzuela City

7
60. KATIPUNAN AVE.-ST. IGNATIUS BRANCH – CBC Building, No. 121 Katipunan Ave., Brgy. St. Ignatius, Quezon City 61. LAS PIÑAS BRANCH – CBC- Bldg., Alabang-Zapote Road cor. Aries St., Pamplona Park Subd., Las Piñas City 62. LAS PIÑAS-MANUELA BRANCH – Alabang-Zapote Road cor.Philamlife Ave., Pamplona Dos, Las Piñas City 63. LEGASPI VILLAGE-AIM BRANCH – G/F Cacho-Gonzales Bldg, 101 Aguirre cor. Trasierra Streets, Legaspi Village, Makati City 64. LEGASPI VILLAGE-C. PALANCA BRANCH – Suite A, Basic Petroleum Bldg 104 C. Palanca Jr. St., Legaspi Village, Makati City 65. LEGASPI VILLAGAE-PEREA BRANCH – G/F, Greenbelt Mansion, 106 Perea St., Legaspi Vill., Makati City 66. LEGASPI VILLAGE-SALCEDO BRANCH – G/F Fedman Suites, 199 Salcedo Street Legaspi Village, Makati City 67. LIBIS BRANCH – Blue Bldg, 188 E. Rodriguez Jr. Avenue Libis, Quezon City 68. MAGALLANES VILLAGE BRANCH – G/F, DHI Bldg, # Lapu-Lapu St., cor EDSA, Magallanes Vill, Makati City 69. MAKATI AVENUE BRANCH – G/F CBC Building, Makati Ave. cor. Hercules St. Makati City 70. MALABON-CONCEPCION BRANCH – Gen. Luna corner Paez Streets, Concepcion, Malabon 71. MALABON-GOV. PASCUAL BRANCH – CBC Building, Gov. Pascual Avenue, Malabon City 72. MALABON-POTRERO BRANCH – CBC Bldg., McArthur Highway, Potrero, Malabon 73. MALANDAY BRANCH – Km 614 McArthur Highway, Malanday Valenzuela City 74. MALINTA BRANCH – AGT Building, 425 Gen. Luis Street Paso de Blas, Malinta, Valenzuela City 75. MANDALUYONG-BONI AVE. BR. – G/F VOS Bldg. Boni Avenue corner San Rafael Street Mandaluyong City 76. MANDALUYONG-PIONEER BR. – UG-05 Globe Telecom Plaza Tower I Pioneer Street, Mandaluyong City 77. MARIKINA BRANCH – 308 J.P. Rizal Street, Sta. Elena, Marikina City 78. MARIKINA-CONCEPCION UNO BRANCH – G/F E&L Patricio Building, No. 809 J.P. Rizal Ave., Concepcion Uno, Marikina City 79. MARIKINA-SSS VILLAGE BRANCH – Lilac cor. Rainbow Sts. SSS Village, Concepcion Dos, Marikina City 80. MASANGKAY BRANCH – 959-961 G. Masangkay Street, Binondo, Manila 81. MASANGKAY-LUZON BRANCH – 1192 G. Masangkay St., Sta. Cruz, Manila 82. MAYON BRANCH – 561-B, Mayon St., Bgy N.S. Amoranto, Quezon City 83. MEZZA RESIDENCES BRANCH – G/F Mezza Residences, Aurora Blvd. cor. Araneta Avenue, Brgy. Doña Imelda, QC 84. N. DOMINGO BRANCH – G/F The Main Place, No.1 Pinaglabanan cor. N. Domingo Sts., San Juan City 85. NAVOTAS BRANCH – CBC Building, 551 M. Naval Street, Bangkulasi, Navotas, Metro Manila 86. NOVALICHES BRANCH – 954 Quirino Highway, Novaliches Proper, Novaliches, Quezon City 87. NOVALICHES-SANGANDAAN BRANCH – CBC Building, Quirino Highway cor. Tandang Sora Ave., Brgy. Sangandaan,
Novaliches, Quezon City 88. NOVALICHES-TALIPAPA BRANCH – 528 Copengco Bldg., Quirino Highway, Talipapa, Novaliches, Quezon City 89. NOVALICHES-ZABARTE – G/F C.I. Bldg 1151 Quirino Highway cor. Zabarte Road, Brgy. Kaligayahan, Novaliches, QC 90. NUEVA BRANCH – Unit Nos 557 & 559 G/F, Ayson Bldg, Yuchengco St., Binondo, Manila 91. ONGPIN BRANCH – G/F Se Jo Tong Building, 808 Ongpin Street, Sta. Cruz, Manila 92. ORTIGAS-ADB AVE. BRANCH – LGF City & Land Mega Plaza ADB Ave. cor. Garnet Rd. Ortigas Ctr. Pasig City 93. ORTIGAS-AVE. EXT.-RIVERSIDE BRANCH – Unit 2-3 Riverside arcade Ortigas Avenue Extension cor. Riverside Drive, Brgy. Sta.
Lucia, Pasig City 94. ORTIGAS CENTER BRANCH – Unit 101 Parc Chateau Condominium Onyx corner Sapphire Streets, Ortigas Center, Pasig City 95. ORTIGAS COMPLEX BRANCH – G/F Padilla Building, Emerald Avenue cor. Ruby Road, Ortigas Center, Pasig City 96. ORTIGAS-JADE DRIVE BRANCH – Unit G-03, Antel Global Corporate Center Jade Drive, Ortigas Center, Pasig 97. PACO BRANCH – Gen. Luna corner Escoda Street, Paco, Manila 98. PACO-OTIS BRANCH – G/F Union Motor Corporation Bldg., 1760 Dra. Paz Guanzon St., Paco, Manila 99. PADRE FAURA BRANCH – G/F, Regal Shopping Center, A. Mabini cor Padre Faura Sts., Ermita Manila
100. PARAÑAQUE-DR. A. SANTOS AVE. BRANCH – Unit 1 & 2 Kingsland Bldg, Dr. A. Santos Avenue, Sucat, Parañaque City 101. PARAÑAQUE-SUCAT BRANCH – MTF Building, Dr. A. Santos Ave. corner Kabesang Segundo St., Parañaque City 102. PASAY-LIBERTAD BRANCH – CBC-Building, 184 Libertad Street, Antonio Arnaiz Ave., Pasay City 103. PASAY-ROXAS BLVD. BRANCH – GF Unit G-01 Antel Seaview Towers 2626 Roxas Blvd., Pasay City 104. PASIG-C. RAYMUNDO BRANCH – G/F MicMar Apartments No. 6353 C. Raymundo Avenue, Brgy. Rosario, Pasig City 105. PASIG- MERCEDES BRANCH – Commercial Motors Corp. Compound Mercedes Ave., Pasig City 106. PASIG-SANTOLAN BRANCH – G/F Felmarc Business Center, Amang Rodriguez Avenue, Santolan, Pasig City 107. PASIG-SM SUPERCENTER BRANCH – SM Supercenter Pasig, Frontera Drive, C-5 Pasig City 108. PASO DE BLAS BRANCH – G/F CYT Bldg, No 178 Paseo de Blas, Valenzuela City 109. PASONG TAMO-CITYLAND BRANCH – Units UG30-UG32 Cityland Pasong Tamo Tower 2210 Pasong Tamo St., Makati City 110. PASONG TAMO-BAGTIKAN BRANCH – G/F Trans-Phil House 1177 Chino Roces Ave. cor. Bagtikan St., Makati City 111. PHILAM BRANCH – #8 East Lawin Drive, Philam Homes, Quezon City 112. QUEZON AVE. BRANCH – No. 18 GND Bldg., Quezon Ave. cor. D. Tuazon St., Quezon City

8
113. QUIAPO BRANCH – 216-220 Villalobos St., Quiapo, Manila 114. ROOSEVELT AVE. BRANCH – CBC Bldg., #293 Roosevelt Ave., San Francisco Del Monte, Quezon City 115. SALCEDO VILLAGE-TORDESILLAS BRANCH – G/F Prince Tower Condo 14 Tordesillas St., Salcedo Vill, Makati City 116. SALCEDO VILLAGE-VALERO BRANCH – G/F Valero Tower, 122 Valero Street Salcedo Village, Makati City 117. SALES-RAON BRANCH – 611 Sales St., Quiapo, Manila 118. SAN JUAN BRANCH – 17 (new) F. Blumentritt St., San Juan, Metro Manila 119. SHAW-HAIG BRANCH – G/F, First of Shaw Bldg, Shaw Blvd, cor Haig St, Mandaluyong City 120. SHAW-PASIG BRANCH – G/F RCC Center, No. 104 Shaw Boulevard, Pasig City 121. SHAW-SUMMIT ONE BRANCH – Unit 102 Summit One Office Tower 530 Shaw Boulevard Mandaluyong City 122. SM CITY BICUTAN BRANCH – LGF, Bldg. B, SM City Bicutan Doña Soledad Ave. cor. West Service Rd., Parañaque City 123. SM CITY MARIKINA BRANCH – G/F SM City Marikina, Marcos Highway, Bgy Calumpang, Marikina City 124. SM CITY NORTH EDSA ANNEX BRANCH – UGF, SM City North EDSA, New Annex Bldg, EDSA, Quezon City 125. SM CITY SAN LAZARO BRANCH – 2/F SM City San Lazaro, Felix Huertas St. cor. A.H. Lacson Ext., Sta. Cruz, Manila 126. SM CITY TAYTAY – Unit 147 Bldg. B, SM City Taytay, Manila East Road, Bgy. Dolores, Taytay, Rizal 127. SM FAIRVIEW BRANCH – LGF, SM City Fairview Quirino Avenue corner Regalado Avenue Fairview, Quezon City 128. SM MALL OF ASIA – G/F Main Mall Arcade, SM Mall of Asia, Bay Blvd., Pasay City 129. SM MEGAMALL BRANCH – LGF Building A, SM Megamall, E. delos Santos Ave cor J. Vargas St., Mandaluyong City 130. SM NORTH EDSA BRANCH – Cyberzone Carpark Bldg., SM City North Ave cor EDSA, Quezon City 131. SM SOUTHMALL BRANCH – SM Southmall, Alabang-Zapote Road Talon-Almanza, Las Piñas City 132. SOLER-168 BRANCH – G/F R&S Bldg., Soler St., Manila 133. STO. CRISTO BRANCH – 711-715 Sto. Cristo cor. Commercio Sts. Binondo, Manila 134. TAFT AVE.-QUIRINO BRANCH – 2178 Taft Avenue near cor. Quirino Avenue, Malate, Manila 135. T. ALONZO BRANCH – Abeleda Business Center 908 T. Alonzo corner Espeleta Streets, Sta. Cruz, Manila 136. TIMOG AVE. BRANCH – G/F Prince Jun Condominium, 42 Timog Ave., Quezon City 137. TOMAS MORATO BRANCH – 229 T. Morato Ave cor Sct. Borromeo St. Bgy. South Triangle, Quezon City 138. TRINOMA BRANCH – Unit P002, Level P1, Triangle North of Manila, North Avenue corner EDSA, Quezon City 139. TUTUBAN CENTER BRANCH – Cluster Bldg. 1, Tutuban Center, C.M. Recto Ave. cor. Dagupan Street, Manila 140. TUTUBAN PRIME BLOCK BR – Rivera Shophouse, Podium Area, Tutuban Ctr Prime Block, C.M. Recto Ave. cor. Rivera St, Manila 141. UP TECHNO BRANCH – UP Ayala Land Techno Hub, Commonwealth Ave, Quezon City 142. VALENZUELA BRANCH – CBC-Bldg., Mc Arthur Highway cor. V. Cordero St., Marulas, Valenzuela City 143. VISAYAS AVE. BRANCH – CBC-Building, Visayas Avenue corner Congressional Ave. Ext., Quezon City 144. WEST AVE. BRANCH – 82 West Avenue, Quezon City 145. XAVIERVILLE BRANCH – 65 Xavierville Ave., Loyola Heights, Quezon City
PROVINCIAL BRANCHES 1. ANGELES CITY BRANCH – CBC-Building, 949 Henson St., Angeles City 2. ANGELES CITY-MARQUEE MALL BRANCH – G/F Marquee Mall, Angeles City, Pampanga 3. ANGELES- MIRANDA EXT. BRANCH* – Miranda Ext. Cor. Asuncion St.,San Nicolas Angeles City 4. ANTIQUE- SAN JOSE BRANCH – Felrosa Building, Gen. Fullon St. corner Cerdena St., San Jose, Antique 5. APALIT BRANCH – CBC Building, McArthur Highway, San Vicente, Apalit, Pampanga 6. BACOLOD-ARANETA BRANCH –CBC-Building, Araneta corner San Sebastian Streets, Bacolod City 7. BACOLOD-NORTH DRIVE BRANCH – Anesa Bldg., B.S. Aquino Drive, Bacolod City 8. BAGUIO CITY BRANCH – G/F Juniper Bldg., A. Bonifacio Rd., Baguio City 9. BAGUIO CITY-ABANAO BRANCH – G/F Paladin Hotel, No. 136 Abanao Ext. cor. Cariño St., Baguio City
10. BALANGA CITY BRANCH – G/F Dilig Building, Don Manuel Banzon Street, Balanga City, Bataan 11. BALIWAG BRANCH – Km 51, Doña Trinidad (DRT) Highway, Baliwag Bulacan 12. BATANGAS CITY BRANCH – P. Burgos Street, Batangas City 13. BAYBAY CITY-LEYTE BRANCH – Magsaysay Ave, Baybay City, Leyte 14. BORONGAN BRANCH – Balud II, Poblacion Borongan, Eastern Samar 15. BUTUAN CITY BRANCH – T. Calo corner San Francisco Streets, Leon Kilat, Butuan City 16. CABANATUAN CITY – Melencio cor. Sanciangco Sts. Cabanatuan City 17. CABANATUAN-MAHARLIKA BRANCH – CBC-Building, Maharlika Highway Cabanatuan City 18. CAGAYAN DE ORO-BORJA BRANCH – J. R. Borja Street, Cagayan de Oro City 19. CAGAYAN DE ORO-CARMEN BRANCH – G/F GT Realty Bldg, Max Suniel St. cor Yakal St., Carmen, Cgy de Oro City 20. CAGAYAN DE ORO- DIVISORIA BRANCH – RN Abejuela St., South Divisoria, Cagayan de Oro City

9
21. CAGAYAN DE ORO-LAPASAN BRANCH – CBC Bldg, Claro M. Recto Avenue, Lapasan, Cagayan de Oro City 22. CALAPAN BRANCH – J.P. Rizal St., Calapan City, Mindoro 23. CARMONA BRANCH – CBC Bldg, Paseo de Carmona, Bgy Maduya, Carmona, Cavite 24. CATARMAN BRANCH – Cor Rizal & Quirino Sts, Catarman, Northern Samar 25. CATBALOGAN BRANCH – CBC Bldg. Del Rosario St. cor. Taft Avenue, Catbalogan City, Samar 26. CAUAYAN CITY BRANCH – G/F Prince Christopher Bldg. Maharlika Highway, Cauayan City, Isabela 27. CAVITE-DASMARIÑAS BRANCH – G/F CBC Bldg., Gen. E. Aguinaldo Highway, Dasmarinas, Cavite 28. CAVITE-IMUS BRANCH – G/F CBC Bldg., Nueno Avenue Tanzang Luma, Imus, Cavite 29. CAVITE-ROSARIO BRANCH – G/F CBC Building, Gen Trias Drive, Rosario, Cavite 30. CAVITE- SM CITY BACOOR BRANCH – LGF SM City Bacoor Tirona Highway corner Aguinaldo Highway Bacoor, Cavite 31. CEBU-BANILAD BRANCH – CBC Bldg., AS Fortuna St., Banilad, Cebu City 32. CEBU-BUSINESS PARK BRANCH-CBC Bldg., Samar Loop cor. Panay Rd., Cebu Business Park, Cebu City 33. CEBU-CARCAR BRANCH – Dr. Jose Rizal St, Barrio Poblacion, Carcar, Cebu City 34. CEBU-CONSOLACION BRANCH – Foods Saversmart Corp, Bgy Poblacion Oriental National Highway, Consolacion, Cebu 35. CEBU-F. RAMOS BRANCH – F. Ramos Street, Cebu City 36. CEBU-GUADALUPE BRANCH – CBC Building, M. Velez Street, cor. V. Rama Ave., Guadalupe, Cebu City 37. CEBU-LAHUG BRANCH – JY Square Mall, No. 1 Salinas Dr., Lahug, Cebu City 38. CEBU-LAPU LAPU BRANCH – Gaisano Mactan Mall, Pajo, Lapu-Lapu City 39. CEBU-MAGALLANES BRANCH (MAIN) – CBC Bldg., Magallanes corner Jakosalem Sts., Cebu City 40. CEBU-MANDAUE BRANCH – SV Cabahug Building 155-B SB Cabahug Street, Bgy. Centro, Mandaue City, Cebu 41. CEBU-MANDAUE NORTH ROAD BRANCH – 447 North Road, Tabok, Mandaue City, Cebu 42. CEBU MANDAUE CABANCALAN BRANCH – M.L. Quezon St., Cabancalan, Mandaue City, Cebu 43. CEBU-SM CITY BRANCH – Upper G/F, SM City Cebu, Juan Luna cor. A. Soriano Avenue, Cebu City 44. CEBU- SUBANGDAKU BRANCH – G/F Mandaue Friendship Building I, Subangdaku, Mandaue City, Cebu 45. CEBU-TALISAY BRANCH – CBC Bldg., 1055 Cebu South National Road Bulacao, Talisay City, Cebu 46. COTABATO CITY BRANCH – No. 76 S.K. Pendatun Avenue, Cotabato City, Maguindanao 47. DAGUPAN CITY BRANCH – 209 Perez Boulevard, Dagupan City 48. DAGUPAN-M.H. DEL PILAR BRANCH – Carried Realty Bldg., No. 28 M.H. del Pilar St., Dagupan City 49. DAVAO-BAJADA BRANCH – Km. 3, J.P. Laurel Ave., Bajada, Davao City 50. DAVAO-BUHANGIN BRANCH – Buhangin Road, Davao City 51. DAVAO-LANANG BRANCH – Insular Village I, Km. 8, Lanang, Davao City 52. DAVAO-MATINA BRANCH – McArthur Highway, Matina, Davao City 53. DAVAO-RECTO BRANCH – CBC Bldg., C.M. Recto Ave. cor. J. Rizal St. Davao City 54. DAVAO-STA. ANA BRANCH – R. Magsaysay Avenue corner F. Bangoy Street, Sta. Ana District, Davao City 55. DAVAO-TAGUM BRANCH – 153 Pioneer Avenue, Tagum, Davao del Nort 56. DIPOLOG CITY BRANCH – CBC Building, Gen Luna corner Gonzales Streets Dipolog City 57. DUMAGUETE CITY BRANCH – Du An Sim Bldg., Legaspi St., Dumaguete City, Negros Or. 58. GAPAN BRANCH – Walterman Ctr, Gapan, Maharlika Highway, Bgy Bayanihan, Gapan, Nueva Ecija 59. GEN. SANTOS CITY BRANCH – CBC Bldg., I. Santiago Blvd., Gen. Santos City South Cotabato 60. ILIGAN CITY BRANCH – Lai Building, Quezon Avenue Extension Pala-o, Iligan City 61. ILOILO-IZNART BRANCH – G/F John A. Tan Bldg., Iznart St., Iloilo City 62. ILOILO-MABINI BRANCH – A. Mabini Street, Iloilo City 63. ILOILO-RIZAL BRANCH – CBC Building, Rizal cor. Gomez Streets, Bgy. Ortiz, Iloilo City 64. KALIBO BRANCH – Waldorf Garcia Bldg, Osmeña Ave., Kalibo Aklan 65. KIDAPAWAN CITY BRANCH – G/F EVA Building, Quezon Blvd. cor. Tomas Claudio St., National Highway, Kidapawan City 66. LA TRINIDAD BRANCH – G/F, Mt Resources Trade Center, Km 4, La Trinidad, Benguet 67. LA UNION BRANCH – Quezon Avenue, National Highway, San Fernando, La Union 68. LAGUNA-CALAMBA BRANCH – CBC-Building, National Highway, Crossing, Calamba, Laguna 69. LAOAG CITY BRANCH – Liberato Abadilla Street, Bgy 17 San Francisco Laoag City 70. LEGAZPI CITY BRANCH – G/F Emma Chan Bldg., F. Imperial St., Legazpi City 71. LUCENA CITY BRANCH – 233 Quezon Avenue, Lucena City 72. MABALACAT-DAU BRANCH – R.D. Policarpio Bldg., McArthur Highway, Dau, Mabalacat, Pampanga 73. MARILAO BRANCH – G/F, SM City Marilao Km. 21, Bgy. Ibayo, Marilao, Bulacan 74. MASBATE BRANCH – Domingo cor. Zurbito Sts., Masbate, Masbate 75. NAGA CITY BRANCH – Penafrancia corner Panganiban Streets Naga City

10
76. ORMOC CITY BRANCH – Hotel Don Felipe Building A. Bonifacio Street, 6541 Ormoc City, Leyte 77. OZAMIZ CITY BRANCH – Gomez corner Burgos Streets, Ozamiz City 78. PAGADIAN CITY BRANCH – Marasigan Building, F.S. Pajares Avenue, Pagadian City 79. PANGASINAN-ALAMINOS CITY BRANCH – Marcos Avenue, Brgy, Palamis, Alaminos City 80. PANGASINAN-URDANETA BRANCH – The Sanctuary Commercial Building Nat’l Highway, Urdaneta, Pangasinan 81. PASEO DE STA. ROSA BRANCH – Unit 3, Paseo 5, Paseo de Sta. Rosa, Sta. Rosa City, Laguna 82. PUERTO PRINCESA CITY BRANCH – Malvar Street near corner Valencia Street Puerto Princesa City, Palawan 83. ROXAS CITY BRANCH – 1063 Roxas Ave. cor. Bayot Drive, Roxas City, Capiz 84. SAN FERNANDO BRANCH – CBC Bldg., V. Tiomico Street City of San Fernando, Pampanga 85. SAN FERNANDO-DOLORES BRANCH – CBC Bldg., McArthur Highway, Dolores, City of San Fernando, Pampanga 86. SAN JOSE CITY BRANCH – Maharlika Highway, Bgy. Malasin, San Jose City 87. SAN PABLO CITY BRANCH – M. Paulino Street, San Pablo City 88. SANTIAGO CITY – Navarro Bldg., Maharlika Highway near corner Bayaua St., Santiago City, Isabela 89. SILAY CITY BRANCH – Rizal St., Silay City, Negros Occidental 90. SM CITY CLARK BRANCH – G/F (Units 172-173) SM City Clark, M. Roxas St., CSEZ, Angeles City, Pampanga 91. SM CITY LIPA BRANCH – G/F (Units 1111-1113) SM City Lipa, Ayala Highway, Bgy. Maraouy, Lipa City, Batangas 92. SM CITY PAMPANGA – Unit AX3 102, Building 4, SM City Pampanga, Mexico, Pampanga 93. SM CITY STA. ROSA BRANCH – G/F SM City Sta. Rosa, Bo. Tagapo, Sta. Rosa, Laguna 94. SM CITY SAN PABLO BRANCH – G/F SM City San Pablo National Highway, Brgy. San Rafael, San Pablo City, Laguna 95. SM CITY NAGA BRANCH – SM City Naga, CBD II, Brgy. Triangulo Naga City 96. SOLANO BRANCH – National Highway, Bgy Quirino, Solano, Nueva Vizcaya 97. SORSOGON BRANCH – CBC Bldg., Ramon Magsaysay Ave., Sorsogon City, Sorsogon 98. SUBIC BAY FREEPORT ZONE BRANCH – CBC Bldg, Subic Bay Gateway Park, Subic Bay Freeport Zone, Subic, Zambales 99. TABACO CITY BRANCH – Ziga Ave. corner Berces Street, Tabaco City, Albay
100. TACLOBAN CITY BRANCH – Carlos Chan Building P. Zamora Street, Tacloban City 101. TAGBILARAN CITY BRANCH – G/F Melrose Bldg. Carlos P. Garcia Avenue, Tagbilaran City, Bohol 102. TAGAYTAY CITY BRANCH – Olivarez Plaza Tagaytay, E. Aguinaldo Highway, Silang Corssing, Tagaytay City, Cavite 103. TARLAC BRANCH – CBC Building, Panganiban near corner F. Tanedo Street, Tarlac City, Tarlac 104. TUGUEGARAO CITY BRANCH – A. Bonifacio Street, Tuguegarao, Cagayan 105. VALENCIA BRANCH – A. Mabini Street, Valencia, Bukidnon 106. VIGAN CITY BRANCH – Burgos Street near corner Rizal Street, Vigan City, Ilocos Sur 107. ZAMBOANGA CITY BRANCH – CBC-Building, Gov. Lim Avenue corner Nuñez Street, Zamboanga City 108. ZAMBOANGA-GUIWAN BRANCH – G/F Yang’s Tower, M.C. Lobregat National Highway, Guiwan, Zamboanga City
CHINA BANK SAVINGS, INC. 1. AYALA BRANCH – Manila Bank Bldg., Ayala Avenue, Makati City 2. ALABANG HILLS BRANCH – G/F Alabang Commercial CitiArcade, Lot 116 Block 2 Don Jesus Blvd., Alabang Hills, Cupang,
Muntinlupa City 3. CEBU CITY BRANCH – G/F Skyrise 3 IT Building, Brgy, Apas, Cebu City 4. GREENHILLS-WILSON BRANCH – No.219 Wilson St., Greenhills, San Juan 5. KALOOKAN BRANCH – A.L. Guanzon Building, Rizal Avenue, Grace Park, Kalookan City 6. QUEZON AVENUE BRANCH – G/F GJ Bldg., No. 385 Quezon Avenue, Quezon City 7. MARIKINA BRANCH – 33 Bayan-Bayanan Ave., Brgy. Concepcion Uno, Marikina 8. PATEROS BRANCH – 500 Elisco Road, Sto. Rosario, Pateros 9. LAS PINAS BRANCH – G/F Parco Supermarket, J. Aguilar Ave. (formerly CAA Road), Las Pinas
10. SAN FERNANDO BRANCH – KHY Trading Building, San Fernando-Gapan Road, San Fernando City, Pampanga 11. MCKINLEY HILL BRANCH – U-B Commerce & Industry Plaza, McKinley Towncenter, Fort Bonifacio, Taguig 12. BACOLOD BRANCH – SKT Saturn Building, Lacson St corner Rizal St, Bacolod 13. LIPA BRANCH – G/F Tibayan Building, 1705 CM Recto Ave., corner Rizal St, Lipa 14. CAGAYAN DE ORO BRANCH – Sergio Osmena St., Cogon District, Cagayan de Oro 15. DAGUPAN BRANCH – G/F Lyceum-Northwestern University, Tapuac District, Dagupan City 16. DAVAO BRANCH – G/F 8990 Corporate Center, Quirino Ave., Davao

11
OFF BRANCH ATM DIRECTORY Metro Manila 1. 168 MALL – 3/F Food Court, 168 Shopping Mall, Sta. Elena St., Binondo Manila 2. 168 MALL 2 – 2/F 168 Shopping Mall, Sta. Elena Street Binondo Manila 3. ALABANG TOWN CENTER – Alabang Town Center, Alabang-Zapote Road, Muntinlupa City 4. ALI MALL – ATM Booth #1, Upper G/F Ali Mall, P. Tuazon Blvd., Araneta Center, Cubao Quezon City 5. ALI MALL 2 – Times Square Entrance, P. Tuazon Blvd., Araneta Center, Quezon City 6. ATENEO DE MANILA UNIVERSITY – Ateneo de Manila Univ., G/F Kostka Hall, Katipunan Ave., Loyola Heights, QC 7. CASH AND CARRY – 2/F Cash and Carry Mall, bet. South Super Highway and Filmore near corner Buendia, Makati City 8. CHERRY FOODARAMA – Cherry Foodarama, Shaw Boulevard Mandaluyong City 9. CHIANG KAI SHEK – Chiang Kai Shek College, 1274 P. Algue, Manila
10. CHINA BANK ONLINE CENTER – Starbucks, China Bank Building, 8745 Paseo de Roxas cor. Villar St., Makati City 11. DASMARIÑAS VILLAGE ASSOCIATION OFFICE – 1417 Campanilla St., Dasmariñas Village, Makati City 12. E. ROD COMPLEX – E Rodriguez Complex, Victoria Ave. cor. E. Rodriguez Ave., Brgy. Marianas, Quezon City 13. EASTWOOD-CYBERMALL- 2/F Eastwood CyberMall, Eastwood Avenue, Eastwood City Cyberpark, Bagumbayan, QC 14. FARMER'S MARKET – ATM Booth #4, Farmer's Market, Araneta Center, Quezon City 15. GATEWAY MALL – Booth 4, Level 2 Gateway Mall, Cubao, Quezon City 16. GLORIETTA 4 – Between Tequilla Joe’s and Banana Leaf, Glorietta 4, Makati City 17. GLORIETTA 4 BASEMENT 1– Basement 1, Glorietta 4, Makati City 18. GLORIETTA 5 – G/F, near National Bookstore, Glorietta 5, Makati City 19. GREENBELT 3 – Greenbelt 3, Makati Avenue Drop-Off Area, Makati City 20. GREENHILLS THEATRE MALL – Main Entrance, Greenhills Theatre Mall, San Juan, Metro Manila 21. JACKMAN EMPORIUM – G/F Jackman Emporium Department Store Building (beside LRT Station and Gotesco Grand Central) Grace
Park, Caloocan City 22. JGC PHILS ALABANG – JGC PHILS. Building, Prime St., Madrigal Business Park-Phase III, Ayala Alabang, Muntinlupa City 23. LANDMARK-TRINOMA – ATM Slot #4, 3rd Flr Landmark Trinoma, EDSA cor. Mindanao Ave. Extension, Pagasa, QC 24. MALABON CITY SQUARE – G/F ATM 4, C4 Road cor. Dagat-dagatan Ave., Malabon City 25. MARKET! MARKET! 1 – Market! Market!, Bonifacio Global City, Taguig, Metro Manila 26. MARKET! MARKET! 2 – 2/F Market! Market! Bonifacio Global City, Taguig, Metro Manila 27. MARKET! MARKET! 3 – G/F ATM Center, Fiesta Market, Market! Market! Bonifacio Global City, Taguig, Metro Manila 28. MEDICAL CITY – Medical City, Ortigas Ave., Pasig City 29. METRO POINT MALL – 3/F Metro Point Mall, EDSA cor. Taft Ave., Pasay City 30. METROWALK – ATM 1 Building C, G/F Metrowalk Commercial Complex, Meralco Ave., Pasig City 31. MRT-BONI STATION – EDSA, Mandaluyong City 32. MRT-CUBAO STATION – EDSA, Quezon City 33. MRT-NORTH AVENUE STATION – EDSA, Quezon City 34. MRT-SHAW BOULEVARD STATION – EDSA, Mandaluyong City 35. NOVA SQUARE – G/F Nova Square, 689 Quirino Highway cor. P. Dela Cruz, Brgy. San Bartolome, Novaliches, QC 36. ONE E-COMMERCE – SM Mall of Asia, Palm Coast Ave. facing Esplanade, Pasay City 37. PEOPLE SUPPORT CENTER – G/F People Support Center, Ayala Ave., cor. Sen. Gil Puyat Ave., Makati City 38. PUREGOLD – E-RODRIGUEZ – ATM # 1, Cosco Building, E. Rodriguez Ave., corner G. Araneta Ave., Quezon City 39. ROBINSON'S GALLERIA 1 – Level 1-181, Robinson's Galleria, EDSA cor. Ortigas Ave., Pasig City 40. ROBINSON'S GALLERIA 2 – Level 1-181, Robinson's Galleria, EDSA cor. Ortigas Ave., Pasig City 41. ROBINSON'S PLACE-MANILA – G/F Padre Faura Wing Entrance, Pedro Gil cor. Adriatico St., Ermita, Manila 42. ROCKWELL P1 (Concourse) – Stall No. 060, Ground Level, Power Plant Mall, Makati City 43. SAVERS CENTER – G/F, Right Side of Main Entrance, along EDSA near cor. Taft Ave., Pasay City 44. SHOP AND RIDE – #248 Gen. Luis St., Novaliches, Quezon City 45. SM CITY FAIRVIEW OFFSITE – SM City Fairview, Quirino Ave. cor. Regalado Ave., Fairview, Quezon City 46. SM CUBAO – G/F SM Cubao, Times Square Ave., Camp Murphy & University Subdivision, Quezon City 47. SM HYPERMARKET – G/F, SM Hypermarket, SM Mall of Asia, Pasay City 48. SM MALL OF ASIA-FOODCOURT – 2/F Main Mall, SM Mall of Asia, (bet. Timex & Dave's Fun House) Bay Blvd., Pasay City 49. SM MALL OF ASIA-SOUTH PARKING – G/F South Parking, SM Mall of Asia (bet. Gonuts Donuts & Rudy Project), Bay Blvd., Pasay
City 50. SM MANILA – ATM #3, Upper Ground Floor Main Entrance, Arroceros Side, SM City Manila 51. SM MEGAMALL BLDG. B – Level 2, Building B, SM Megamall, EDSA cor. Julia Vargas St., Mandaluyong City

12
52. SM SOUTHMALL OFFSITE- Alabang-Zapote Road, Bo. Almanza, Las Piñas City 53. SM SUPERCENTER MUNTINLUPA – Grd Flr, ATM 2 beside rear entrance Bgy Tunasan, National Road, Muntinlupa City 54. SOUTHGATE MALL – Southgate Mall, EDSA cor. Pasong Tamo Extension, Makati City 55. ST. JUDE COLLEGE – Dimasalang St. cor. Don Quijote St., Sampaloc Manila 56. ST. LUKE’S – THE FORT 1 – Basement, St. Luke's Medical Center, 5th Ave., The Fort, Taguig City 57. TAFT-U.N – G/F Times Plaza, T.M. Kalaw cor. Gen. Luna St., Manila 58. THE A VENUE – G/F Valdez Site, The A Venue, 7829 Makati Ave., Makati City 59. THE FORT – G/F Bonifacio Technology Center, 31st Str. cor. 2nd Ave., Bonifacio Global City, Taguig City 60. TIENDESITAS – People’s Village (beside Mail and More), Frontera Verde, Ortigas Ave. corner C-5, Pasig City 61. TRINOMA-MCDO – Level 1 near concierge facing Bench store, North Ave., cor. EDSA, Quezon City 62. TRINOMA OFF 1 – Level 1 near Landmark and Chowking, North Ave cor. EDSA, Quezon City 63. TRINOMA OFF 2 (X BOUTIQUE) – Level 1 near X Boutique, North Ave cor. EDSA, Quezon City 64. VICTORY CENTRAL MALL – G/F, ATM 2, below escalator, #717 Old Victory Compound, Rizal Ave., Monumento, Caloocan City 65. WACK-WACK GOLF AND COUNTRY CLUB – Wack-Wack Golf and Country Club, Shaw Blvd., Mandaluyong City 66. WALTERMART-MAKATI – G/F Waltermart Makati (near Mercury Drug), 790 Chino Roces Ave. cor. Antonio Arnaiz Ave., Makati City 67. WALTERMART MAKATI 2 – 3/F, Walter Mart Center Makati, 790 Chino Roces cor.. Antonio Arnaiz Ave., Makati City 68. WALTERMART N. EDSA – Walter Mart Bldg., EDSA, Quezon City 69. DIAMOND ARCADE – G/F Diamond Arcade, Aurora Blvd. corner St. Mary’s St., Cubao, QC 70. EASTWOOD CITY WALK 2 – G/F Eastwood City Walk, Phase II, Eastwood City Cyberpark, 188 E. Rodriguez Ave., QC 71. EASTWOOD MALL – Level 1 ATM 2 Phase 2, Eastwood Mall, E. Rodriguez Ave., C-5 Bagumbayan, QC 72. PUREGOLD-BLUMENTRITT – 286 Bulemtritt Street, Sta Curz, Manila 73. SM-HYPERMART-MANDALUYONG – 121 Shaw Blvd., cor. E. Magalona St., Mandaluyong City 74. SM NORTH EDSA – Pedestrian Walk – Jeepney Terminal, SM City North EDSA, SM City Complex, Pag-asa 1 75. ST FRANCIS SQUARE – Basement 1, Dona Julia Vargas Ave. cor Bank Drive, Ortigas Center, Mandaluyong City 76. UST HOSPITAL – UST Hospital, Espana, Street, Manila 77. ZABARTE TOWN CENTER – 588 Camarin Road cor Zabarte Road, North Caloocan City Luzon 1. 268 MALL – CK Building, Plaridel Extension, Sto. Rosario, Angeles City 2. ADVENTIST UNIVERSITY OF THE PHILIPPINES – Adventist Univ. of the Phils., Puting Kahoy, Silang, Sta. Rosa, Cavite 3. A G & P – Atlantic, Gulf, and Pacific Company of Manila, Inc., San Roque, Bauan, Batangas 4. CALTEX-SLEX 1 – South Luzon Expressway – Northbound, Brgy. San Antonio, San Pedro, Laguna 5. DLSU DASMARIÑAS – College of Engineering, De La Salle University, Dasmariñas, Cavite City 6. DLSU-HEALTH SCIENCE CAMPUS – DLSU Health Campus, Inc., Congressional Road, Dasmariñas, Cavite 7. GOOD SAMARITAN HOSPITAL – Good Samaritan Compound, Burgos Ave., Cabanatuan City 8. HOLY ANGEL UNIVERSITY 2 – G/F Holy Angel University Student’s Center, Sto Rosario St., Angeles City 9. JENRA MALL – Jenra Grand Mall, Angeles City, Pampanga
10. LORMA HOSPITAL – Lorma Hospital, City of San Fernando, La Union 11. MAGIC MALL – G/F, ITTI Shoes (Entrance B), Alexander St., Poblacion, Urdaneta, Pangasinan 12. MAGIC STARMALL – UG/F, Magic Star Mall, Romulo Blvd., Brgy. Cut-Cut 1, Tarlac City 13. MAGIC STARMALL 2 – UG/F, Magic Star Mall, Romulo Blvd., Brgy. Cut-Cut 1, Tarlac City 14. MARITON GROCERY – Buntun, Tuguegarao City, Cagayan Valley 15. MARQUEE MALL 1 (Activity Center) – G/F Activity Center Marquee Mall, Don Bonifacio Road, Angeles City, Pampanga 16. MARQUEE MALL 2 (TGIF) – G/F near Alfresco Dining & TGIF, Marquee Mall, Don Bonifacio Road, Angeles City, Pampanga 17. MARQUEE MALL 3 (Outdoor Dining) – 2/F Marquee Mall, Don Bonifacio Road, Angeles City, Pampanga 18. NEPO MALL-ANGELES – Dona Teresa Ave. cor. St. Joseph St., Nepo Mart Complex, Angeles City 19. OUR LADY OF PILLAR – G/F near Emergency Room, Tamsui Ave, Bayan Luma, Imus Cavite 20. ORCHARD GOLD & COUNTRY CLUB – Gate 2, The Orchard Golf and Country Club Inc., Aguinaldo Highway, Dasmariñas, Cavite 21. PACIFIC MALL – Landco Business Park, F. Imperial St. cor. Circumferential Road, Legaspi City 22. PAVILLION MALL – G/F Building A, Pavillion Mall, San Antonio, Biñan, Laguna 23. PETRON SLEX – Petron Express Center (PEC) 3, SLEX, San Pedro, Laguna 24. SM CITY BACOOR – SM City Bacoor (near Main Entrance along Aguinaldo Highway), Tirona Highway cor Aguinaldo Highway,
Bacoor, Cavite 25. SM CITY BAGUIO – SM City Baguio, Luneta Hill, Upper Session Road cor. Governor Park Road, Baguio City 26. SM CITY BALIWAG – ATM2, SM City Baliwag, DRT Highway, Brgy. Pagala, Baliwag, Bulacan

13
27. SM CITY BATANGAS – ATM-1, SM City Batangas, Pallocan West, Batangas City 28. SM CITY CLARK OFF-BRANCH – ATM #1, SM City Clark (Fronting Transport Terminal), M. Roxas St., CSEZ, Angeles City,
Pampanga 29. SM CITY DASMARINAS – Offsite ATM 2, SM City Dasmariñas, Cavite City 30. SM CITY LIPA OFF-BRANCH – ATM 2 (Near Transport Terminal), SM City Lipa, Ayala Highway, Lipa City 31. SM CITY MARILAO OFF-BRANCH – ATM# 1, SM City Marilao, Marilao, Bulacan 32. SM CITY PAMPANGA – ATM 2, Main Entrance beside Covered Walk, SM City Pampanga, Brgy. San Jose, San Fernando,
Pampanga 33. SM CITY TAYTAY OFF-BRANCH – Unit 147, Bldg. B, SM City Taytay, Manila East Road, Brgy. Dolores, Taytay, Rizal 34. SM SUPERCENTER MOLINO – G/F SM Supercenter Molino, SCMC, Brgy. Molino 4, Molino Road, Bacoor, Cavite 35. TARGET MALL 1 – G/F near Star Search, Sta. Rosa Commercial Complex, Brgy. Balibago, Sta. Rosa, Laguna 36. TARGET MALL 2 – ATM 4, Canopy Area, Sta. Rosa Commercial Complex, Brgy. Balibago, Sta. Rosa, Laguna 37. UNION CHRISTIAN COLLEGE – Union Christian College, Widdoes St., Brgy. II, San Fernando, La Union 38. WALTERMART STA. ROSA – UG/F Waltermart Sta. Rosa Nat’l Highway Mall Entrance, San Lorenzo Village, Balibago Road, Sta.
Rosa Laguna 39. WALTERMART STA. ROSA 2 – UG/F Waltermart Sta. Rosa (between Goldilocks and Mall Exit), San Lorenzo Village, Balibago Road,
Sta. Rosa, Laguna 40. WESLEYAN UNIVERSITY – Wesleyan University of the Philippines, Mabini Extension, Cabanatuan City 41. ANGELES UNIVERSITY FOUNDATION – McArthur Highway corner San Pablo St., Angeles City 42. DAGUPAN-NEPO MALL – G/F. Arellano St., Dagupan City 43. LCC PENARANDA – LCC Supermarket, Penaranda, cor Rizal St., Legazpi City 44. LOTUS CENTRAL MALL – G/F Central Mall, Nuevo Avenue, Imus Cavite 45. NOTRE DAME HOSPITAL – Notre Dame de Chartes Hospital, No. 25 Gen Luna Road, Baguio City 46. ROYAL DUTY FREE – Subic Bay, Freeport Zone, Zambales City 47. SAVEMORE-BALIWAG – D & E Bldg., A. Luna St., Baliwag, Bulacan 48. SAVEMORE-SOLANO – National Road, Poblacion North, Solano, Nueva Vizcaya 49. SM CALAMBA 1- G/F – Ground Floor, National Road, Brgy. Real, Calamba City Laguna 50. SM ROSALES – G/F SM Rosales, Bgy. Carmen East, Rosales, Pangasinan 51. SM TARLAC – G/F McArthur Highway, San Roque, Tarlac City 52. WALTERMART – CALAMBA – Real St., Brgy. Real, Calamba, Laguna 53. WALTERMART – DASMA – G/F, Barrio Burol Aguinaldo Highway, Dasmariñas, Cavite 54. WALTERMART – TANAUAN – J.P. Laurel National highway, Brgy. Darasa, Tanauan, Batangas Visayas 1. CEBU DOCTOR’S HOSPITAL – Osmena Blvd.., Cebu City 2. CEBU DOCTOR’S UNIVERSITY – #1 Potenciano Larrazabal Ave., North Reclamation Area, Mandaue City 3. GAISANO TALISAY CEBU – G/F Gaisano Fiesta Mall, Tabunok, Talisay, Cebu City 4. LA NUEVA SUPERMART – La Nueva Supermart, Inc., G.Y. Dela Serna St., Lapu-Lapu, Cebu City 5. LAPU-LAPU CITY – Gaisano Mactan Mall, Pusok, Lapu-Lapu City, Cebu 6. LEE SUPER PLAZA – G/F Lee Super Plaza, M. Perdices cor. San Jose St., Dumaguete City 7. LOPUE EAST CENTER – Burgos St. cor. Carlos Hilado Highway, Bacolod City 8. MACTAN MARINA MALL – G/F, Mactan Marina Mall, MEPZ 1, Lapu-lapu City 9. ORMOC OFFSITE – Hotel Don Felipe Bldg., A. Bonifacio St., 6541, Ormoc City, Leyte
10. SKYRISE REALTY – G/F Skyrise IT Bldg., Gorordo Ave., cor. N. Escario St., Cebu City 11. SM BACOLOD – G/F Building A, ATM # 3, SM City Bacolod Reclamation Area, Bacolod City 12. SM DELGADO – SM Delgado (beside SM Supermarket), Delgado cor. Valeria St., Iloilo City 13. UNIVERSITY OF BOHOL – Along Ma. Clara St., Tagbilaran City 14. UNIVERSITY OF SAN CARLOS – University of San Carlos, Main University Building, P. Del Rosario St., Cebu City 15. LE NUEVA-MINGLANILLA – La Nueva Supermart, Poblacion, Minglanilla, Cebu 16. LEE HYPERMART – G/F Lee Hypermarket, Valencia Road, Bagacay, Dumaguete City, Negros Oriental Mindanao 1. CDO MEDICAL CENTER – CDO Medical Center Bldg. 2, Tiano cor. Nacalaban St., Cagayan de Oro City 2. CORPUS CHRISTI – Corpus Christi School, Tomas Saco St., Macasandig, Cagayan de Oro City 3. DIPOLOG CENTER MALL – Dipolog Center Mall, 138 Rizal Ave., Dipolog City
14
4. GAISANO-ILIGAN – G/F, Gaisano Citi Super Mall, Iligan City 5. GAISANO MALL-BAJADA DAVAO – G/F (fronting Hang Ten) Gaisano Mall of Davao, J.P. Laurel Ave., Bajada, Davao City 6. GAISANO MALL-CAGAYAN DE ORO – Unit # 3, 2nd Level Atrium Gaisano Mall, Corrales Ext, cor. CM Recto Ave., Cagayan de
Oro 7. KCC MALL-GENSAN – G/F KCC Mall GenSan, J. Catolico Sr. Ave., General Santos City, South Cotabato 8. LB SUPERMARKET – ZAMBOANGA – Veteran's Avenue Extension, Zamboanga City 9. LIM KET KAI MALL – M4-193 B, LimKetKai Mall, Cagayan de Oro City
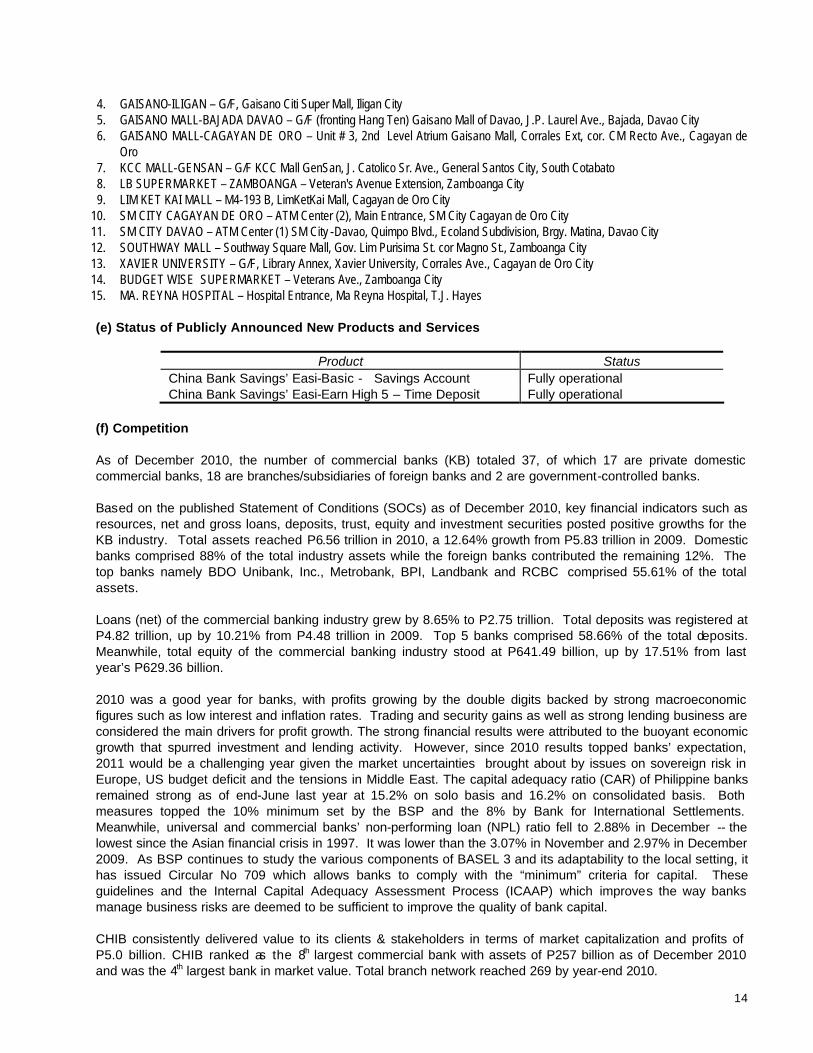
10. SM CITY CAGAYAN DE ORO – ATM Center (2), Main Entrance, SM City Cagayan de Oro City 11. SM CITY DAVAO – ATM Center (1) SM City -Davao, Quimpo Blvd., Ecoland Subdivision, Brgy. Matina, Davao City 12. SOUTHWAY MALL – Southway Square Mall, Gov. Lim Purisima St. cor Magno St., Zamboanga City 13. XAVIER UNIVERSITY – G/F, Library Annex, Xavier University, Corrales Ave., Cagayan de Oro City 14. BUDGET WISE SUPERMARKET – Veterans Ave., Zamboanga City 15. MA. REYNA HOSPITAL – Hospital Entrance, Ma Reyna Hospital, T.J. Hayes (e) Status of Publicly Announced New Products and Services
Product Status China Bank Savings’ Easi-Basic - Savings Account Fully operational China Bank Savings’ Easi-Earn High 5 – Time Deposit Fully operational
(f) Competition
As of December 2010, the number of commercial banks (KB) totaled 37, of which 17 are private domestic commercial banks, 18 are branches/subsidiaries of foreign banks and 2 are government-controlled banks. Based on the published Statement of Conditions (SOCs) as of December 2010, key financial indicators such as resources, net and gross loans, deposits, trust, equity and investment securities posted positive growths for the KB industry. Total assets reached P6.56 trillion in 2010, a 12.64% growth from P5.83 trillion in 2009. Domestic banks comprised 88% of the total industry assets while the foreign banks contributed the remaining 12%. The top banks namely BDO Unibank, Inc., Metrobank, BPI, Landbank and RCBC comprised 55.61% of the total assets. Loans (net) of the commercial banking industry grew by 8.65% to P2.75 trillion. Total deposits was registered at P4.82 trillion, up by 10.21% from P4.48 trillion in 2009. Top 5 banks comprised 58.66% of the total deposits. Meanwhile, total equity of the commercial banking industry stood at P641.49 billion, up by 17.51% from last year’s P629.36 billion. 2010 was a good year for banks, with profits growing by the double digits backed by strong macroeconomic figures such as low interest and inflation rates. Trading and security gains as well as strong lending business are considered the main drivers for profit growth. The strong financial results were attributed to the buoyant economic growth that spurred investment and lending activity. However, since 2010 results topped banks’ expectation, 2011 would be a challenging year given the market uncertainties brought about by issues on sovereign risk in Europe, US budget deficit and the tensions in Middle East. The capital adequacy ratio (CAR) of Philippine banks remained strong as of end-June last year at 15.2% on solo basis and 16.2% on consolidated basis. Both measures topped the 10% minimum set by the BSP and the 8% by Bank for International Settlements. Meanwhile, universal and commercial banks’ non-performing loan (NPL) ratio fell to 2.88% in December -- the lowest since the Asian financial crisis in 1997. It was lower than the 3.07% in November and 2.97% in December 2009. As BSP continues to study the various components of BASEL 3 and its adaptability to the local setting, it has issued Circular No 709 which allows banks to comply with the “minimum” criteria for capital. These guidelines and the Internal Capital Adequacy Assessment Process (ICAAP) which improves the way banks manage business risks are deemed to be sufficient to improve the quality of bank capital. CHIB consistently delivered value to its clients & stakeholders in terms of market capitalization and profits of P5.0 billion. CHIB ranked as the 8th largest commercial bank with assets of P257 billion as of December 2010 and was the 4th largest bank in market value. Total branch network reached 269 by year-end 2010.
15
(g) Transactions with and/or dependence on related parties In the ordinary course of business, the Bank has loans and other transactions with its subsidiaries and affiliates, and with certain directors, officers, stockholders and related interest (DOSRI). These loans and other transactions are made on the same terms as with other individuals and businesses of comparable risks and in compliance with all regulatory requirements. Other related party transactions conducted in the normal course of business include the availment of computer and general banking services of an affiliate to meet the Bank’s reporting requirements. (h) Trademarks, Licenses, Franchises, etc. China Bank is operating under a universal banking license obtained in 1991 (i) Sources and Availability of raw materials and the names of principal suppliers. Not applicable. (j) Disclose how dependent the business is upon a single customer or a few customers. Not applicable.
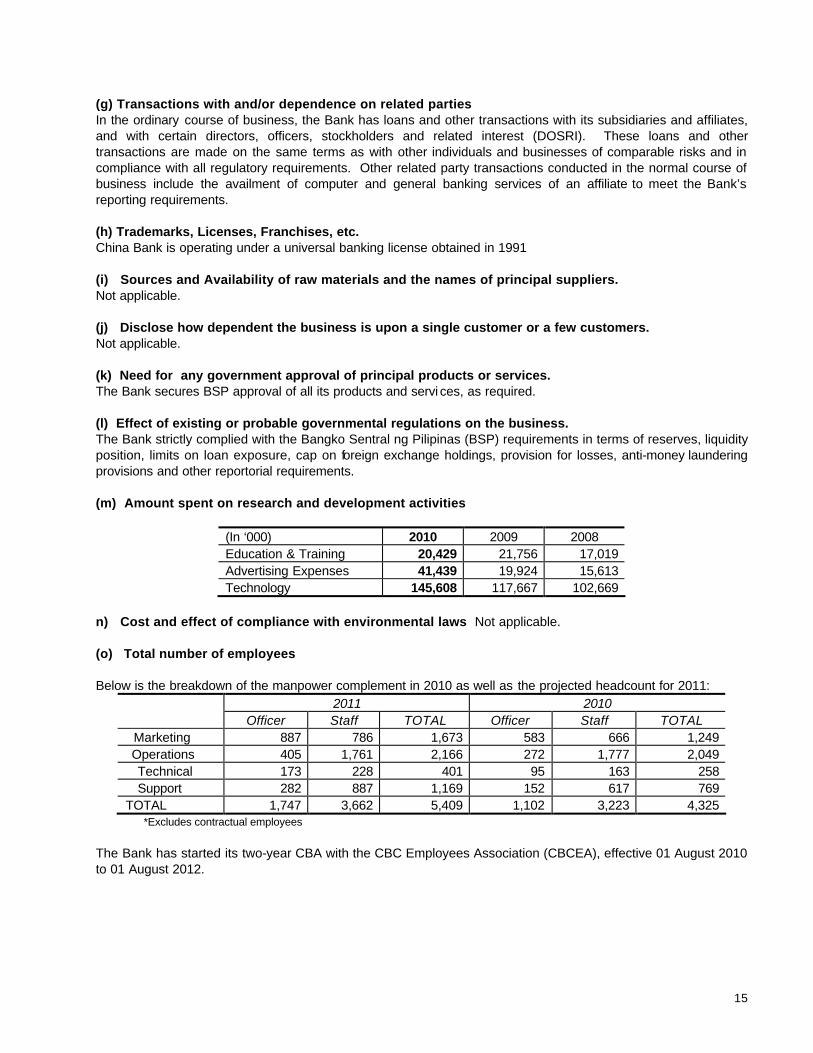
(k) Need for any government approval of principal products or services. The Bank secures BSP approval of all its products and servi ces, as required. (l) Effect of existing or probable governmental regulations on the business. The Bank strictly complied with the Bangko Sentral ng Pilipinas (BSP) requirements in terms of reserves, liquidity position, limits on loan exposure, cap on foreign exchange holdings, provision for losses, anti-money laundering provisions and other reportorial requirements. (m) Amount spent on research and development activities
(In ‘000) 2010 2009 2008 Education & Training 20,429 21,756 17,019 Advertising Expenses 41,439 19,924 15,613 Technology 145,608 117,667 102,669
n) Cost and effect of compliance with environmental laws Not applicable. (o) Total number of employees Below is the breakdown of the manpower complement in 2010 as well as the projected headcount for 2011:
2011 2010 Officer Staff TOTAL Officer Staff TOTAL Marketing 887 786 1,673 583 666 1,249 Operations 405 1,761 2,166 272 1,777 2,049
Technical 173 228 401 95 163 258 Support 282 887 1,169 152 617 769 TOTAL 1,747 3,662 5,409 1,102 3,223 4,325
*Excludes contractual employees The Bank has started its two-year CBA with the CBC Employees Association (CBCEA), effective 01 August 2010 to 01 August 2012.

16
(p) Risk Management A key pillar to China Bank’s sustainability is effective risk management underpinned by our ability to identify, measure, assess, and manage the different types of risks we face. We have a prudent and disciplined approach to risk taking that is anchored on upholding tested risk management policies, processes and limits; employing professional and qualified people with the appropriate skills; investing in technology and training; and actively promoting a culture of sound risk management across the Bank.
The Board sets the overall risk parameters within which we conduct our business. The Risk Management Committee (RMC), in particular, focuses on risk oversight and management, and internal control. RMC periodically reviews our overall risk profile and significant risk exposures, and provi des a forum for the review and approval of new products, risk measurement methodologies, and risk control processes. Our internal auditors test and regularly evaluate the effectiveness of our risk management program and communicate the results to the Board and the Audit Committee.
The day-to-day monitoring, assessment, and mitigant-formulation for identified risks fall on the Risk Management Group (RMG). RMG collaborates with each business unit to assess the impact of actual and inherent risks and assists in the formulation of risk-mitigant products and processes. RMG endeavors to measure accurately and completely such risks in a timely manner using enhanced and updated management reporting systems. It monitors the implementation of specific risk control procedures and enforces compliance to these procedures. The risk management initiatives are facilitated through a set of independent functions, reporting directly to the Chief Risk Officer, Rabboni Francis B. Arjonillo. Apart from RMG, each business unit in the Bank has various process controls in place to ensure that all their external and internal transactions and dealings are in compliance with their respective risk management parameters. The year saw the hiring of key officers to head the Market & Liquidity Risk Division, Credit Risk Division, and Operational Risk Division. With the new leadership, major initiatives to strengthen our risk management program were undertaken. On the organizational structure front, the Credit Review and Control Department was integrated into the RMG, the Technology Risk and BCP Department was formed – integrating the relevant functions from the Information Security Office (ISO), and an Analytics and Strategic Support function was created with the added focus on ICAAP coordination for all business units in the Bank. Rationalizing the Risk Management function and laying the groundwork for sound internal risk management practices resulted in roadmaps for the main risk divisions. Other significant initiatives for 2010 included enforcement of a Product Approval Process for treasury products, establishment of Past Due Triggers for obligors, inclusion of silo and integrated stress tests and scenario analyses, production of a daily summary of risk news disseminated to all senior officers, setting up Market Liquidity Triggers for offshore sovereign bonds holdings, updating of Rate Reasonability parameters to comprehensively cover treasury products, delineating Credit Review and Audit Review Scope, establishing a process flow for monitoring, reviewing and validating credit classification and loan loss provisioning, expanding the coverage of the Internal Credit Risk Review System, increasing the internal single borrowers limit, enhancing the quality of risk reporting with the addition of other vital reports, appointing Risk Coordinators for all units, updating the Risk and Control Self Assessment. RMG further enhanced risk awareness in the Bank by conducting a series of market, credit, operational risk, and business continuity management trainings and seminars. In 2010, RMG completed the Credit Review Exercise Cycle covering all required lending units. It also actively participated in the evaluation of an Asset Liability Management (ALM) System up to the point of choice of supplier and scoping. The new ALM solution, which will be rolled-out in 2011, will be a vital tool in managing interest rate risk, performing liquidity analysis, and complying with regulatory requirements, including IAS 39 and Basel II. The Group also spearheaded the completion of China Bank’s Internal Capital Adequacy Assessment Process, including conducting an integrative balance sheet stress test, coordination of the various segments for completion, and the final presentation to the BSP where it received positive assessment. Other stress tests were also done to gauge the impact of the projected loan growth on our capital adequacy ratio (CAR), including default of 100% of exposure to certain borrowers, i.e. corporations, housing loans, other loans to individuals. Our dynamic risk management program calls for the continuing assessment of risks and controls and the timely reporting of these risks to the Board thru the RMC. In 2011, further investment, primarily in risk management technology and in business continuity, will be made in line with the acquisition of the core banking system.
17
(q) Additional requirements as to certain issues or issuers. Not Applicable (i) Debt Issues (ii) Investment Company Securities
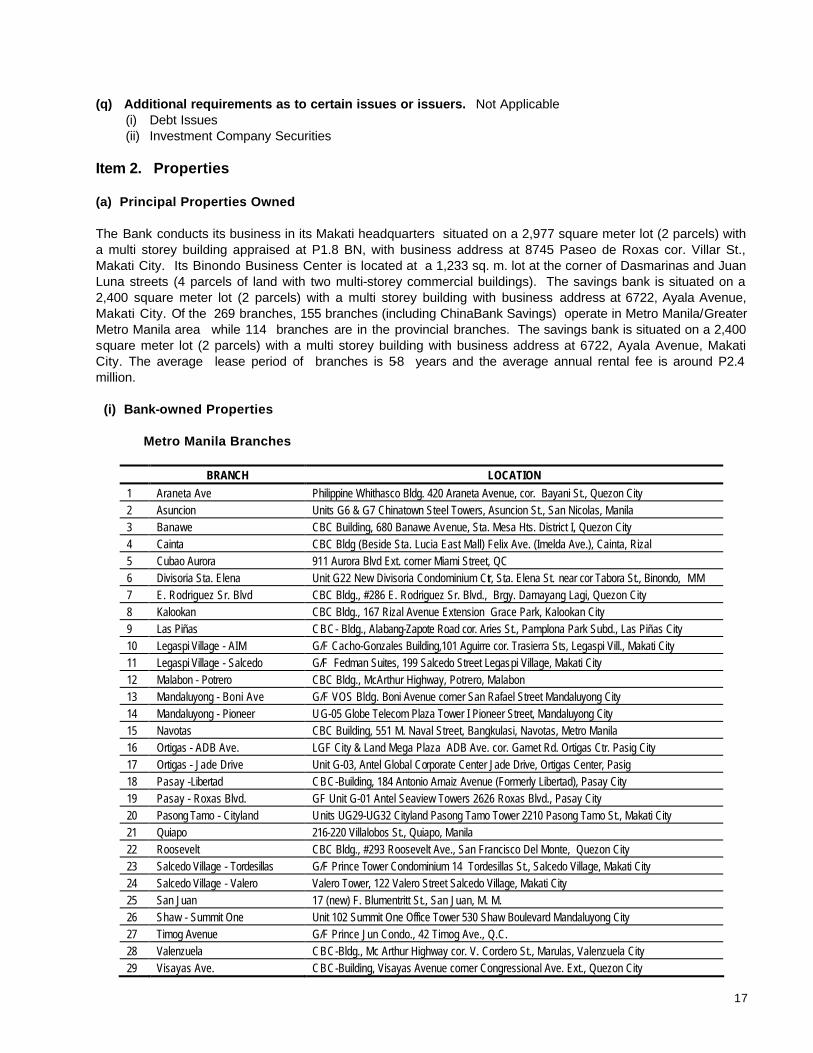
Item 2. Properties (a) Principal Properties Owned The Bank conducts its business in its Makati headquarters situated on a 2,977 square meter lot (2 parcels) with a multi storey building appraised at P1.8 BN, with business address at 8745 Paseo de Roxas cor. Villar St., Makati City. Its Binondo Business Center is located at a 1,233 sq. m. lot at the corner of Dasmarinas and Juan Luna streets (4 parcels of land with two multi-storey commercial buildings). The savings bank is situated on a 2,400 square meter lot (2 parcels) with a multi storey building with business address at 6722, Ayala Avenue, Makati City. Of the 269 branches, 155 branches (including ChinaBank Savings) operate in Metro Manila/Greater Metro Manila area while 114 branches are in the provincial branches. The savings bank is situated on a 2,400 square meter lot (2 parcels) with a multi storey building with business address at 6722, Ayala Avenue, Makati City. The average lease period of branches is 5-8 years and the average annual rental fee is around P2.4 million. (i) Bank-owned Properties
Metro Manila Branches
BRANCH LOCATION 1 Araneta Ave Philippine Whithasco Bldg. 420 Araneta Avenue, cor. Bayani St., Quezon City 2 Asuncion Units G6 & G7 Chinatown Steel Towers, Asuncion St., San Nicolas, Manila 3 Banawe CBC Building, 680 Banawe Avenue, Sta. Mesa Hts. District I, Quezon City 4 Cainta CBC Bldg (Beside Sta. Lucia East Mall) Felix Ave. (Imelda Ave.), Cainta, Rizal 5 Cubao Aurora 911 Aurora Blvd Ext. corner Miami Street, QC 6 Divisoria Sta. Elena Unit G22 New Divisoria Condominium Ctr, Sta. Elena St. near cor Tabora St., Binondo, MM 7 E. Rodriguez Sr. Blvd CBC Bldg., #286 E. Rodriguez Sr. Blvd., Brgy. Damayang Lagi, Quezon City 8 Kalookan CBC Bldg., 167 Rizal Avenue Extension Grace Park, Kalookan City 9 Las Piñas CBC- Bldg., Alabang-Zapote Road cor. Aries St., Pamplona Park Subd., Las Piñas City 10 Legaspi Village - AIM G/F Cacho-Gonzales Building,101 Aguirre cor. Trasierra Sts, Legaspi Vill., Makati City 11 Legaspi Village - Salcedo G/F Fedman Suites, 199 Salcedo Street Legaspi Village, Makati City 12 Malabon - Potrero CBC Bldg., McArthur Highway, Potrero, Malabon 13 Mandaluyong - Boni Ave G/F VOS Bldg. Boni Avenue corner San Rafael Street Mandaluyong City 14 Mandaluyong - Pioneer UG-05 Globe Telecom Plaza Tower I Pioneer Street, Mandaluyong City 15 Navotas CBC Building, 551 M. Naval Street, Bangkulasi, Navotas, Metro Manila 16 Ortigas - ADB Ave. LGF City & Land Mega Plaza ADB Ave. cor. Garnet Rd. Ortigas Ctr. Pasig City 17 Ortigas - Jade Drive Unit G-03, Antel Global Corporate Center Jade Drive, Ortigas Center, Pasig 18 Pasay -Libertad CBC-Building, 184 Antonio Arnaiz Avenue (Formerly Libertad), Pasay City 19 Pasay - Roxas Blvd. GF Unit G-01 Antel Seaview Towers 2626 Roxas Blvd., Pasay City 20 Pasong Tamo - Cityland Units UG29-UG32 Cityland Pasong Tamo Tower 2210 Pasong Tamo St., Makati City 21 Quiapo 216-220 Villalobos St., Quiapo, Manila 22 Roosevelt CBC Bldg., #293 Roosevelt Ave., San Francisco Del Monte, Quezon City 23 Salcedo Village - Tordesillas G/F Prince Tower Condominium 14 Tordesillas St., Salcedo Village, Makati City 24 Salcedo Village - Valero Valero Tower, 122 Valero Street Salcedo Village, Makati City 25 San Juan 17 (new) F. Blumentritt St., San Juan, M. M. 26 Shaw - Summit One Unit 102 Summit One Office Tower 530 Shaw Boulevard Mandaluyong City 27 Timog Avenue G/F Prince Jun Condo., 42 Timog Ave., Q.C. 28 Valenzuela CBC-Bldg., Mc Arthur Highway cor. V. Cordero St., Marulas, Valenzuela City 29 Visayas Ave. CBC-Building, Visayas Avenue corner Congressional Ave. Ext., Quezon City

18
BRANCH LOCATION 30 West Ave. 82 West Avenue, Quezon City 31 Malabon - Gov. Pascual Ave. Gov. Pascual Ave., Malabon City 32 Shaw - Haig G/F First of Shaw Bldg, Shaw Blvd. corner Haig St., Mandaluyong City 33 Katipunan-St. Ignatius Branch CBC Bldg., No. 121 Katipunan Ave. Brgy. St. Ignatius, Quezon City
Provincial Branches
BRANCH LOCATION 1 Angeles City CBC-Building, 949 Henson St., Angeles City 2 Bacolod - Araneta CBC-Building, Araneta corner San Sebastian Streets, Bacolod City 3 Butuan CBC-Building J.C. Aquino Ave. Butuan City 4 Cabanatuan - Maharlika CBC-Building, Maharlika Highway Cabanatuan City 5 Cagayan De Oro - Lapasan CBC Building, Claro M. Recto Avenue, Lapasan, Cagayan de Oro City 6 Cavite - Dasmariñas CBC-Building, Gen. E. Aguinaldo Highway, Dasmarinas, Cavite 7 Cavite - Imus CBC-Building, Nueno Avenue Tanzang Luma, Imus, Cavite 8 Cavite - Rosario CBC-Building, Gen Trias Drive, Rosario, Cavite 9 Catbalogan CBC-Building Del Rosario St. cor. Taft Ave., Catbalogan City 10 Cebu - Banilad CBC-Building AS Fortuna St. Banilad Cebu City 11 Cebu Business Center CBC-Building, Samar Loop corner Panay Road, Cebu Business Park, Cebu City 12 Cebu - Guadalupe CBC Building, M. Velez Street, cor. V. Rama Ave., Guadalupe, Cebu City 13 Cebu - Magallanes CBC-Building, Magallanes corner Jakosalem Sts., Cebu City 14 Cebu - Talisay CBC-Building., 1055 Cebu South National Road Bulacao, Talisay City, Cebu 15 Davao - Recto CBC-Building, C.M. Recto Ave. cor. J. Rizal St. Davao City 16 Dipolog City CBC Building, Gen Luna corner Gonzales Streets, Dipolog City 17 Dumaguete City CBC-Building Real St., Dumaguete City 18 San Fernando - Dolores CBC-Building, McArthur Highway, Dolores, City of San Fernando, Pampanga 19 Gen. Santos City CBC-Building, I. Santiago Blvd., Gen. Santos City, South Cotabato 20 Iloilo - Rizal CBC-Building Rizal cor. Gomez Sts., Brgy. Ortiz, Iloilo City 21 Ormoc City CBC-Building, Real cor. L. Jaena Sts., Ormoc City 22 San Fernando CBC-Building, V. Tiomico Street San Fernando, Pampanga 23 Sorsogon CBC Building, Ramon Magsaysay Avenue Sorsogon City, Sorsogon 24 Tarlac CBC Building, Panganiban near corner F. Tanedo Street, Tarlac City, Tarlac 25 Zamboanga City CBC-Building, Gov. Lim Avenue corner Nunez Street, Zamboanga City
(ii) Leased Properties
Metro Manila Branches
BRANCH LEASE
COMMENCEMENT DATE
LEASE EXPIRATION DATE
MONTHLY RENT (AS OF DEC 2010)
1 ANTIPOLO CITY January 1, 2007 December 31, 2014 87,885.47 2 ARRANQUE August 1, 2010 July 31, 2013 133,100.00 3 AYALA-ALABANG January 1, 2010 December 31, 2014 214,500.00 4 AYALA-COLUMNS September 16, 2008 September 30, 2013 77,246.40 5 BALINTAWAK-BONIFACIO May 1, 2002 April 30, 2012 59,098.22 6 BALUT October 1, 2007 September 30, 2012 110,000.00 7 BANAWE MA. CLARA April 16, 2008 April 15, 2016 110,250.00 8 BEL-AIR January 1, 2007 December 31, 2016 62,139.56 9 BETTER LIVING SUBD. May 1, 2009 April 30, 2019 75,892.00 10 BF HOMES January 16, 2005 January 15, 2015 82,958.30

19
BRANCH LEASE
COMMENCEMENT DATE
LEASE EXPIRATION DATE
MONTHLY RENT (AS OF DEC 2010)
11 BF HOMES AGUIRRE February 1, 2009 January 31, 2019 105,000.00 12 BF RESORT VILLAGE December 1, 2007 November 30, 2012 113,447.25 13 BLUMENTRITT January 6, 2007 January 5, 2017 46,305.00 14 BO. KAPITOLYO August 1, 2008 July 31, 2013 78,947.37 15 BONNY SERRANO July 5, 2008 July 4, 2016 64,661.63 16 CAPITOL HILLS November 1, 2008 October 31, 2013 76,288.39
17 COMMONWEALTH AVE December 1, 1993 November 30, 2013 19,965.75
4,791,780.00 Leasehold Right
18 CONGRESSIONAL AVE January 1, 2010 December 31, 2019 40,831.00 19 CORINTHIAN HILLS May 1, 2006 April 30, 2016 87,846.00 20 CUBAO-ARANETA April 1, 2008 September 30, 2012 133,670.62 21 DASMARIÑAS VILLAGE May 16, 2006 May 15, 2015 109,380.00 22 DEL MONTE AVE November 16, 2004 November 14, 2014 68,060.98 23 DEL MONTE- MATUTUM March 16, 2009 March 15, 2017 89,250.00 24 DON ANTONIO October 23, 2003 October 22, 2013 73,466.40
25 D. TUAZON November 9, 2004 November 9, 2009 107,179.38
month-to-month 26 E. RODRIGUEZ- HILLCREST December 1, 2009 November 30, 2019 40,000.00 27 EDSA- KALOOKAN September 9, 2010 September 8, 2020 70,000.00 28 ELCANO May 1, 2009 April 30, 2014 40,635.00 29 ERMITA April 14, 2010 April 15, 2011 248,747.13 30 ESPAÑA December 1, 2007 November 30, 2012 77,364.08 31 EVANGELISTA December 1, 2008 November 30, 2016 103,359.38 32 EXAMINER August 16, 2005 August 15, 2011 109,122.07 33 FAIRVIEW November 16, 2006 November 15, 2011 103,318.03 34 FILINVEST CORPORATE CITY August 16, 2007 August 15, 2012 151,534.73 35 FORT BONIFACIO GLOBAL CITY October 16, 2008 October 15, 2016 173,092.50 36 GIL PUYAT AVENUE December 1, 2005 November 30, 2013 82,958.30 37 GREENBELT 1 September 15, 2009 December 31, 2012 158,350.00 38 GREENHILLS January 1, 2008 December 31, 2010 346,843.20 39 GREENHILLS-ORTIGAS April 1, 1998 March 31, 2013 313,842.84 40 HEROES HILLS January 6, 2009 January 5, 2016 126,000.00 41 ILAYA BRANCH March 15, 2010 March 14, 2013 70,000.00 42 INTRAMUROS October 1, 2008 September 30, 2016 212,152.50 43 J. ABAD SANTOS AVENUE September 16, 2007 September 15, 2013 94,600.00 44 JUAN LUNA December 16, 2007 December 15, 2012 127,118.75 45 KALAYAAN AVE. August 1, 2009 July 31, 2017 60,000.00 46 KALOOKAN- CAMARIN December 16, 2010 December 15, 2015 65,100.00 47 KALOOKAN-MONUMENTO December 1, 2007 November 30, 2012 125,023.50 48 KAMIAS January 1, 2008 December 31, 2015 93,271.50 49 KARUHATAN June 1, 2007 May 31, 2012 73,502.58 50 LAS PIÑAS - MANUELA December 1, 2007 November 30, 2012 98,831.08 51 LEGASPI VILL. -C. PALANCA November 1, 2009 October 31, 2014 126,472.50 52 LEGASPI VILLAGE-PEREA January 16, 2008 January 15, 2016 137,261.25 53 LIBIS April 1, 2008 March 31, 2016 151,218.90 54 MAGALLANES VILLAGE December 1, 2008 November 30, 2016 53,818.75

20
BRANCH LEASE
COMMENCEMENT DATE
LEASE EXPIRATION DATE
MONTHLY RENT (AS OF DEC 2010)
55 MAKATI AVENUE December 1, 2009 November 30, 2017 288,750.00 56 MALABON-CONCEPCION February 16, 2004 February 14, 2014 71,995.00 57 MALANDAY BRANCH June 1, 2010 May 31, 2011 70,000.00 58 MARIKINA BRANCH February 1, 1992 January 31, 2012 58,948.69 59 MARIKINA – CONCEPCION UNO October 1, 2008 September 30, 2016 58,873.50 60 MARIKINA-SSS VILLAGE June 1, 2006 May 31, 2016 66,150.00 61 MASANGKAY January 1, 2007 December 31, 2016 185,452.57 62 MASANGKAY-LUZON January 1, 2010 December 31, 2019 45,000.00 63 MAYON December 21, 2007 December 20, 2015 49,612.50 64 MEZZA RESIDENCES March 1, 2009 April 30, 2011 119,018.90 65 N. DOMINGO September 1, 2009 August 31, 2017 63,000.00 66 NOVALICHES March 1, 2008 February 28, 2011 81,648.00 67 NOVALICHES-TALIPAPA July 15, 2008 November 14, 2017 142,254.81 68 NOVALICHES- SANGANDAAN October 16, 2009 October 15, 2024 68,250.00 69 NOVALICHES- ZABARTE September 7, 2009 September 6, 2019 57,750.00 70 NUEVA August 16, 2008 August 15, 2016 95,000.00 71 ONGPIN September 1, 2010 August 31, 2016 231,000.00 72 ORTIGAS AVE. EXT. - RIVERSIDE April 21, 2009 April 20, 2016 77,978.88 73 ORTIGAS CENTER January 1, 2011 December 31, 2015 172,434.85 74 ORTIGAS COMPLEX December 1, 2007 November 30, 2012 155,022.19 75 PACO July 16, 2010 July 15, 2020 77,175.00 76 PACO-OTIS February 16, 2009 February 15, 2017 59,157.00 77 PADRE FAURA May 1, 2008 April 30, 2016 184,393.13 78 PARANAQUE-A.SANTOS AVE. February 1, 2007 January 31, 2012 100,045.34 79 PARANAQUE-SUCAT January 1, 2011 June 30, 2011 98,398.13 80 PASIG- C. RAYMUNDO August 1, 2009 July 31, 2017 26,315.79 81 PASIG-MERCEDES June 1, 2006 May 31, 2016 47,231.10 82 PASIG-SANTOLAN March 1, 2006 February 29, 2012 89,445.38 83 PASIG - SM SUPERCENTER May 1, 2010 April 30, 2011 97,526.70 84 PASO DE BLAS August 1, 2007 July 31, 2012 46,511.72 85 PASONG TAMO - BAGTIKAN January 1, 2010 December 31, 2010 67,857.14 86 PHILAM December 1, 2007 November 30, 2102 71,367.58 87 QUEZON AVE. January 21, 2008 January 20, 2015 107,909.85 88 SALES-RAON January 1, 2010 December 31, 2019 77,140.00 89 SHAW-PASIG December 1, 2006 November 30, 2011 133,705.69 90 SM CITY BICUTAN November 1, 2009 October 31, 2011 152,693.50 91 SM CITY MARIKINA November 1, 2010 October 31, 2012 130,329.00 92 SM CITY SAN LAZARO November 1, 2010 October 31, 2011 187,956.00 93 SM CITY TAYTAY November 1, 2009 October 31, 2011 88,767.70 94 SM FAIRVIEW November 1, 2009 October 31, 2011 174,034.00 95 SM MALL OF ASIA May 1, 2010 April 30, 2012 197,650.50 96 SM MEGAMALL November 1, 2009 October 31, 2011 354,078.25 97 SM NORTH EDSA August 16, 2009 July 31, 2011 212,912.50 98 SM NORTH EDSA - ANNEX November 1, 2010 October 31, 2012 170,548.00 99 SM SOUTHMALL November 1, 2010 January 31, 2011 303,773.50

21
BRANCH LEASE
COMMENCEMENT DATE
LEASE EXPIRATION DATE
MONTHLY RENT (AS OF DEC 2010)
100 SOLER-168 January 1, 2010 December 31, 2014 80,000.00 101 STO. CRISTO July 1, 2009 June 30, 2014 220,500.00 102 TAFT AVE. - QUIRINO May 1, 2009 April 30, 2017 107,619.75 103 T. ALONZO December 1, 2004 November 30, 2009 97,240.50 104 TOMAS MORATO May 1, 2008 April 30, 2018 70,875.00 105 TRINOMA May 1, 2010 April 30, 2011 266,708.58
106 TUTUBAN CENTER September 30, 1993 August 20, 2014 17,683,001.73
Leasehold Right
107 TUTUBAN PRIME BLOCK November 20, 1997 August 22, 2014 6,752,460.00
Leasehold Right 108 UP TECHNO HUB September 1, 2010 August 31, 2011 104,347.95 109 VALENZUELA - GEN. LUIS January 1, 2008 December 31, 2010 42,000.00 110 XAVIERVILLE June 1, 2005 May 31, 2020 88,179.84
Provincial Branches
BRANCH LEASE
COMMENCEMENT DATE
LEASE EXPIRATION DATE
MONTHLY RENT (AS OF DEC 2010)
1 ANGELES CITY- MARQUEE MALL May 1, 2009 April 30, 2011 90,699.18 2 ANGELES-MCARTHUR HIGHWAY September 1, 2009 August 31, 2024 68,250.00 3 ANTIQUE- SAN JOSE June 1, 2010 May 31, 2020 28,000.00 4 APALIT BRANCH (new branch) January 1, 2011 December 31, 2030 32,000.00 5 BACOLOD-NORTH DRIVE June 1, 2010 May 31, 2020 50,000.00 6 BAGUIO CITY January 1, 1994 December 31, 2013 197,583.80 7 BAGUIO CITY-ABANAO March 1, 2009 March 1, 2019 55,125.00 8 BALANGA CITY January 1, 2007 December 31, 2011 94,925.25 9 BALIWAG January 1, 2008 December 31, 2018 49,612.50 10 BATANGAS CITY November 1, 1992 October 31, 2012 103,581.26 11 BAYBAY July 16, 2008 July 15, 2018 33,468.75 12 BORONGAN January 28, 2009 January 27, 2019 27,631.58 13 CABANATUAN CITY June 16, 2006 June 15, 2016 75,969.14 14 CAGAYAN DE ORO-BORJA February 1, 2010 January 31, 2015 55,000.00 15 CAGAYAN DE ORO-CARMEN December 1, 2007 November 30, 2017 54,118.97 16 CAGAYAN DE ORO - DIVISORIA December 1, 2007 November 30, 2012 85,015.98 17 CALAPAN CITY April 17, 2008 April 16, 2016 88,200.00 18 CARMONA March 20, 2008 March 19, 2018 50,100.00 19 CATARMAN October 3, 2007 October 2, 2017 26,785.71 20 CAUAYAN CITY October 21, 2006 July 31, 2011 63,974.01 21 CAVITE- SM CITY BACOOR August 1, 2010 July 31, 2012 188,097.00 22 CEBU- CARCAR September 1, 2007 August 31, 2017 44,100.00 23 CEBU- CONSOLACION December 1, 2007 November 30, 2012 86,243.06 24 CEBU-F. RAMOS August 1, 2005 July 31, 2011 82,280.00 25 CEBU-LAHUG March 28, 2003 March 27, 2013 94,097.59 26 CEBU-LAPU LAPU May 15, 2010 May 14, 2020 71,050.00 27 CEBU-MANDAUE November 1, 2007 November 30, 2015 85,298.68 28 CEBU-MANDAUE CABANCALAN November 1, 2009 October 31, 2019 58,275.00 29 CEBU-MANDAUE NORTH ROAD February 1, 2008 January 31, 2016 71,772.75

22
BRANCH LEASE
COMMENCEMENT DATE
LEASE EXPIRATION DATE
MONTHLY RENT (AS OF DEC 2010)
30 CEBU-SM CITY May 1, 2009 April 30, 2011 234,209.00 31 CEBU-SUBANGDAKU October 1, 2006 September 30, 2016 54,017.86 32 COTABATO CITY April 1, 2007 March 31, 2012 51,679.69 33 DAGUPAN- PEREZ May 1, 2009 April 30, 2017 115,500.00 34 DAGUPAN-M.H. DEL PILAR September 1, 2009 August 31, 2019 73,500.00 35 DAVAO-BAJADA May 16, 2005 May 15, 2015 51,545.13 36 DAVAO- BUHANGIN July 1, 2007 June 30, 2017 34,375.00 37 DAVAO- LANANG September 1, 2007 August 31, 2017 38,500.00 38 DAVAO-MATINA November 16, 2007 November 15, 2017 60,637.50 39 DAVAO-STA. ANA October 1, 2006 September 30, 2011 146,155.71 40 DAVAO-TAGUM November 2, 1997 November 1, 2012 25,616.25 41 GAPAN March 2, 2008 March 1, 2013 44,865.14 42 ILIGAN CITY July 1, 2002 June 30, 2012 70,738.43 43 ILOILO-IZNART October 1, 2009 September 30, 2014 44,023.00 44 ILOILO-MABINI June 1, 2009 May 31, 2015 57,706.59 45 KALIBO October 1, 2007 September 30, 2022 39,359.25 46 KIDAPAWAN CITY November 16, 2006 November 15, 2011 61,938.37 47 LA TRINIDAD August 19, 2007 August 18, 2012 55,320.89 48 LA UNION December 1, 2009 November 30, 2019 80,000.00 49 LAGUNA - CALAMBA July 1, 1998 June 30, 2020 94,152.85 50 LAOAG CITY December 1, 2006 November 30, 2016 103,500.00 51 LEGAZPI CITY April 1, 2005 March 31, 2013 70,195.49 52 LUCENA CITY January 16, 2007 January 15, 2012 63,669.38 53 MABALACAT- DAU September 5, 2010 September 4, 2020 110,000.00 54 MARILAO November 1, 2010 October 31, 2012 145,464.00 55 MASBATE September 1, 2007 August 31, 2012 63,669.38 56 NAGA CITY September 1, 2009 August 31, 2014 90,000.00 57 OZAMIZ CITY August 1, 1996 July 31, 2016 64,843.56 58 PAGADIAN CITY September 1, 2007 August 31, 2012 50,000.00 59 PASEO DE STA. ROSA October 1, 2010 September 30, 2013 102,138.00 60 PANGASINAN-ALAMINOS CITY June 1, 2008 May 31, 2018 54,337.50 61 PANGASINAN-URDANETA April 1, 2010 March 31, 2020 84,210.53 62 PUERTO PRINCESA CITY November 16, 2016 November 15, 2012 43,214.29 63 ROXAS CITY April 1, 2010 March 31, 2015 33,000.00 64 SAN JOSE CITY December 1, 2006 November 30, 2011 48,837.30 65 SAN PABLO CITY November 16, 2009 November 15, 2014 95,000.00 66 SANTIAGO CITY November 15, 2008 November 14, 2013 87,150.00 67 SILAY CITY September 1, 2010 August 31, 2020 33,000.00 68 SM CITY CLARK August 1, 2010 July 31, 2011 148,233.55 69 SM CITY LIPA November 1, 2010 October 31, 2012 142,497.00 70 SM CITY NAGA January 15, 2010 January 31, 2012 75,760.00 71 SM CITY PAMPANGA November 1, 2010 October 31, 2012 106,236.00 72 SM CITY SAN PABLO October 1, 2010 September 30, 2015 103,344.00 73 SM CITY STA. ROSA May 1, 2008 April 30, 2011 103,419.00 74 SOLANO December 16, 2008 December 15, 2018 44,100.00 75 SUBIC BAY FREEPORT ZONE June 25, 2008 June 24, 2059 46,756.16 76 TABACO CITY March 1, 2007 February 28, 2015 54,140.62 77 TACLOBAN CITY July 1, 2010 June 30, 2020 72,400.00 78 TAGBILARAN CITY August 16, 2007 August 15, 2012 64,599.61

23
BRANCH LEASE
COMMENCEMENT DATE
LEASE EXPIRATION DATE
MONTHLY RENT (AS OF DEC 2010)
79 TAGAYTAY CITY (new branch) January 16, 2011 January 15, 2016 51,200.00 80 TUGUEGARAO CITY March 16, 2010 March 15, 2013 70,000.00 81 VIGAN CITY February 1, 2011 January 31, 2019 80,000.00 82 VALENCIA February 1, 1994 January 31, 2019 20,507.81 83 ZAMBOANGA-GUIWAN March 7, 2007 March 6, 2017 40,250.00
China Bank Savings Branches
BRANCH LEASE
COMMENCEMENT DATE
LEASE EXPIRATION DATE
AVE MONTHLY RENT
1 QUEZON AVENUE November 1, 2008 October 31, 2018 146,037.52 2 CEBU - LAHUG June 1, 2009 May 31, 2017 131,842.36 3 ALABANG HILLS August 16, 2009 August 15, 2017 70,480.06 4 KALOOKAN August 16, 2009 August 15, 2017 125,733.12 5 GREENHILLS - WILSON October 16, 2009 October 15, 2017 141,174.03 6 MARIKINA June 1, 2010 May 31, 2020 84,523.44 7 PATEROS July 1, 2010 June 30, 2020 101,023.14 8 LAS PIÑAS July 1, 2010 June 30, 2020 131,011.34 9 SAN FERNANDO July 16, 2010 July 15, 2020 154,959.64 10 MCKINLEY HILL July 1, 2010 June 30, 2015 214,684.54 11 BACOLOD August 1, 2010 July 31, 2020 74,376.26 12 LIPA Nov ember 19, 2010 November 18, 2020 112,697.92 13 CAGAYAN DE ORO 12 November 1, 2010 October 31, 2022 135,169.87 14 DAVAO Jan 1, 2011 December 31, 2020 88,599.82 15 DAGUPAN January 1, 2011 December 31, 2021 121,227.77 16 CABANATUAN April 6, 2011 April 5, 2021 90,545.01
The head office and other branches of China Bank are well maintained for the benefit of its employees and clients. The Bank now has set a standard look for its branches particularly their facade and layout. (b) Limitations on Properties All bank-owned properties are free from any lien or encumbrances except for Kalookan and Malabon-Potrero. However, lien or encumbrances on bank-owned properties are already subject for cancellation. (c) Description of Property the Bank intends to acquire in the next 12 months The Bank has future plans to acquire properties but no description/location of properties yet at this time. Item 3. Legal Proceedings There are pending cases filed for and against the Bank arising from the ordinary conduct of its business. In the opinion of management and legal counsel, there are no pending material legal proceedings to which the Bank or any of its subsidiaries or affiliates is a party or of which any of their property is the subject. Item 4. Submission of Matters to a Vote of Security Holders Except for the matters taken up during the Annual Stockholders’ Meeting on May 6, 2010, there was no other matter submitted to a vote of security holders during the fiscal year covered by this report.

24
PART II - OPERATIONAL AND FINANCIAL INFORMATION Item 5. Market for Issuer’s Common Equity and Related Stockholder Matters (a) Market Information The Bank’s common shares are listed with and traded at the Philippine Stock Exchange. The high and low sales prices for each quarter within the last two fiscal years are shown below:
The Bank’s common shares were valued at P434.00 per share as of December 30, 2010 (last trading day), and at P420.00 per share as of March 23, 2011 (latest practicable trading date). (b) Holders The Bank has an authorized capital stock of P20.0 Billion divided into 200 Million shares at a par value of P100.00 per share. As of December 31, 2010, there are approximately 2,046 holders of the 107,260,617 issued shares, and the following are the top 20 holders of common shares of the Bank:
Name of Stockholder Shares Percentage 1 PCD Nominee Corporation (Non-Filipino) 23,996,557 22.372% 2 SM Investments Corporation 17,751,773 16.550% 3 Sysmart Corporation 15,861,941 14.788% 4 PCD Nominee Corporation (Filipino) 10,676,492 9.954% 5 Shoemart, Inc. 3,500,730 3.264% 6 CBC Employees Retirement Plan 2,422,142 2.258% 7 Joaquin Dee &/or Family 2,357,613 2.198% 8 JJACCIS Development Corporation 2,121,127 1.978% 9 Henry Sy, Sr. 2,077,497 1.937%
10 GDSK Development Corporation 1,641,837 1.531% 11 SM Development Corporation 704,601 0.657% 12 Domingo T. Dee 665,984 0.621%
Actual Prices: 2010 HIGH LOW CLOSE
Jan – Mar 375.00 345.00 367.50 Apr – Jun 477.50 362.50 455.00 Jul – Sept 467.50 393.00 442.00 Oct – Dec 475.00 425.00 434.00
Adjusted Prices (for 10% stock dividend):
2010 HIGH LOW CLOSE Jan - Mar 340.91 313.64 334.09 Apr - Jun 434.09 329.55 413.64 Jul - Sept 453.00 393.00 442.00 Oct - Dec 475.00 425.00 434.00
2009 HIGH LOW CLOSE Jan - Mar 395.00 295.00 325.00 Apr - Jun 380.00 317.50 330.00 Jul - Sept 425.00 330.00 370.00 Oct - Dec 380.00 350.00 370.00

25
Name of Stockholder Shares Percentage 13 Gilbert U. Dee 570,739 0.532% 14 Hydee Management & Resource Corp. 566,267 0.528% 15 Estate of Allen Cham 501,204 0.467% 16 Robert Y. Dee, Jr. 455,589 0.425% 17 Regina Y. Dee 373,729 0.348% 18 The First Resources Mgt. & Sec. Corp. 329,320 0.307% 19 Reliance Commodities, Inc. 312,712 0.292% 20 Kuan Yan Tan's Charity (Phil.), Inc. 294,736 0.275%
TOTAL 87,182,590 81.281% (c) Dividends
The following are the dividends declared on the Bank’s common shares for the five most recent fiscal years:
2010 2009 2008 2007 2006 Stock Dividend 10% 10% 15% 25% 25% Cash Dividend 12% 12% 20% 25% 30%
In accordance with Article VIII, Section 2 of the Bank’s Amended By-Laws, dividends declared by the Bank are payable in cash, property or stock. The payment of the dividends in the future will depend upon the earnings and financial condition of the Bank and other factors. There are no restrictions that limit the Bank’s ability to pay dividends, other than those imposed by the Corporation Code. However, any dividends declared by the Bank are subject to the approval primarily of the Bangko Sentral ng Pilipinas, Securities and Exchange Commission, and Philippine Stock Exchange, Inc.
(d) Unregistered Securities
There were no unregistered securities sold by the Bank for the past three (3) years. However, there were new securities issued resulting from the declaration of 10% stock dividend coming from the Bank’s unissued shares, which securities distribution was exempt from registration requirement under Sec 10.1 (d) of the Securities Regulation Code. (e) Free Float Level Based on the Public Ownership Report of the Bank as of December 31, 2010, 57.896% of the total outstanding shares are owned by the public.

26
Item 6. Management Discussion and Analysis or Plan of Operation (Last Three Years 2010, 2009, 2008)
(a) Management Discussion and Analysis Balance Sheet
In Million Pesos 2010 2009 2008* Assets 257,379 233,865 208,377 Investments 75,548 72,472 56,065 Loan Portfolio (Net) 117,186 110,219 110,687 Total Deposits 213,042 193,290 173,779 Capital 35,453 30,198 25,706
* Inclusive of prior period adjustments made by CBSI that resulted in a net decrease of P162.12 million to the surplus balance as of January 1, 2008. Details can be found in the accompanying notes to Financial Statements (Note 33)
Balance Sheet – 2010 vs. 2009 Total assets expanded by 10.05% from P233.87 billion to P257.38 billion mainly from higher loans and short term placements supported by growth in low cost deposits.
Cash and other cash items (COCI) increased by 11.06% to P6.44 billion from P5.80 billion in 2009 due to higher year-end cash requirements and increase in the number of branches. Excess funds were invested in BSP placements via its Special Deposit Account (SDA) facility boosting Due from BSP by 219.46% to P37.12 billion in 2010 from P 11.62 billion in 2009. Meanwhile, Due from Other Banks fell by 12.57% to P 5.92 billion from P6.77 billion in 2009 from lower placements with foreign banks. Interbank loans receivable was down by 95.48% to P542 million from P11.98 billion primarily from the lower overnight term placements of the Bank with the BSP.
The decline in bond yields offered opportunities to unlock bond profits and accumulate GS portfolio at very attractive rates. Consequently, Financial Assets at Fair Value through Profit & Loss (FAVPL) increased by 20.23% to P5.94 billion from P4.94 billion and Available For Sale Financial Assets (AFS) increased by 12.29% from P45.47 billion to P51.06 billion. Held to Maturity Assets were down by 15.92% or P3.51 billion from P22.06 billion to P18.55 billion from disposal of dollar denominated government bond holdings. Total investment in debt and equity securities comprised 29.35% of total assets down from 30.99% share in 2009, from the bank’s on-going asset reallocation to manage market and interest rate risks.
There was much progress in our drive to diversify core businesses, led by the 10.53% year-on-year growth in loans to corporate, commercial and branch-based accounts, which boosted credit portfolio from customers to P113.65 billion. This thrust for loan expansion was balanced by a corresponding improvement in portfolio quality - as measured by better borrower risk ratings and a broader spectrum of clients from the small & medium enterprises, energy, food production and project financing sectors. Net loan portfolio (inclusive of UDSCL) grew by 6.32% to P117.19 billion from P110.22 billion in Dec 2009. Non-performing loans (NPL) ratio was registered at 4.30% as intensive monitoring of accounts at the Management and Board level continued. Accrued interest receivables which include accruals of interest income from AFS and HTM, declined by 9.30% from P2.12 billion to P1.92 billion following the decline in HTM volume and yields. Investments in Associates was up by 22.08% to P20.73 million from P16.98 million due to the Bank’s additional investment in MCBLife (P3.71 million) to meet the BSP required minimum 5% ownership. Bank premises & FFE slightly grew by 1.02% from P4.79 billion to P4.84 billion. Investment properties, which consist entirely of real estate properties acquired in settlement of loans and receivables, fell by 13.67% to P3.33 billion from P3.85 billion as the Bank continued to sell off its foreclosed properties. Deferred tax assets were also down by 0.16% from P913.89 million to P912.42

27
million. Other assets increased by 11.22% from P2.61 billion to P2.91 billion mainly from increase in accounts receivables, prepaid expenses and sales contract receivables. On the liabilities side, total deposits grew by 10.22% from P193.29 billion in 2009 to P213.04 billion in 2010 as both demand and savings deposits expanded. Our low cost deposit (CASA) levels were up by 22% or P13 billion to reach an unprecedented level of P71.82 billion by year-end 2010. The sustained branch marketing efforts and expansion of the branch network resulted in improved ratio of CASA to total peso deposits at 44.82% from 41.29% last year. During the last five years, the branch banking group has opened branches in metropolitan hubs, secondary cities and provincial trading centers to geographically expand our franchise. Time deposits were down by 4.87% from P55.23 billion in 2009 to P52.54 billion in 2010 from maturing long-term deposits such as Money Lift. Bills payable also declined by 47.14% in 2010 to P3.06 billion from P5.79 billion in 2009 as the Bank’s rediscounting line from BSP fell to P73.33 million from P3.57 billion in 2009. Manager’s Checks dropped by 24.97% to P340.52 million from P453.82 million due to lower demand for this product. Income tax payable grew 39.19% to P13.52 million from P9.71 million mainly from minimum corporate income tax (MCIT) liability. Accrued Interest, Taxes and Other Expenses grew by 5.93% from P1.86 billion to P1.97 billion. The loss in mark to market valuation of the Bank’s forward contracts led to higher Derivative Liability by 255.62% to P1.20 billion from P338.81 million. Other liabilities grew by 19.09% to P2.29 billion in 2010 due to growth from outstanding acceptances and sundry credits.
Total capital funds reached P35.45 billion, 17.40% higher than 2009, primarily from this year’s profits and the recovery in net unrealized gains on available-for-sale financial assets. Capital stock rose by P975.18 million or 10% mainly from the 10% stock dividend distributed in 2010. The Surplus account grew by 14.96% to P21.61 billion driven by the retained net income for the year net of cash dividend payout of P 12/share, totaling P1.17 billion. Net unrealized gains on available for sale financial assets grew by 334.60% or P1.43 billion from the revaluation gains on AFS portfolio. The change in functional currency (exchange differences arising on translation are taken directly to the statement of comprehensive income under ‘Cumulative Translation adjustment’) resulted in the recognition of cumulative translation adjustment loss of (P62.27) million in 2010 from (P53.89) million in 2009. Balance Sheet – 2009 vs. 2008 Total assets expanded by 12.23% from P208.38 billion to P233.87 billion mainly from higher liquid assets supported by growth in deposits. Total liquid assets increased by 31.71%, while deposits expanded by 11.23%, driven by another year of record growth in low cost deposits.
Cash and other cash (COCI) items increased by 42.20% to P5.80 billion from P4.08 billion in 2008 due to higher year-end cash requirements and increase in the number of branches. This in turn reduced our reserve requirement under Due from BSP (DFBSP) by 15.23% to P11.62 billion in 2009 from P 13.71 billion in 2008. Due from Other Banks (DFOB) grew by 59.80% to P6.77 billion from P4.24 billion in 2008 from higher placements with foreign banks. Excess liquidity funds were placed in overnight lending/placements with BSP expanding Interbank Loans to P11.98 billion, 172.34% higher than 2008.
Financial Assets at Fair Value through Profit and Loss (FVPL) grew by 82.03% or P2.23 billion to P4.94 billion from P 2.71 billion as the improved market condition provided opportunities for generating trading gain. In addition, Available-for-Sale Financial Assets (AFS) increased by 53.59% from P29.60 billion to P45.47 billion in 2009 as funds were channeled to higher-yielding dollar and peso securities, capitalizing on the declining interest rate environment. Held-to-Maturity Financial Assets (HTM) fell by 7.10% or P1.69 billion from P23.75 billion to P22.06 billion in 2009 from maturity of government bond holdings.
Because of the highly fluid credit environment, the Bank prioritized quality over expansion of portfolio as seen in the moderate loans growth of 10% on an average daily balance basis – mainly from robust demand in the corporate and consumer sectors. Year-on-year, Loans and Receivables (net, inclusive of unquoted debt securities) dropped by 0.42% to P110.22 billion from P110.69 billion in 2008 as the Bank vigorously pursued collection of past due accounts, improved collateral positions and re-evaluated existing credit lines towards the end of 2009. The uptrend in corporate bond issuances also tempered growth in traditional wholesale lending so

28
the Bank ramped up its participation in the underwriting of bonds issued by triple A corporations such as San Miguel Corporation, Petron and JG Summit Holdings Inc. Despite the slight decrease in loan portfolio, non-performing loans (NPL) ratio improved to 4.16% as NPL volume declined by almost P 1.5 billion. The Bank booked P792 million for provision for impairment and credit losses as a buffer against normal lending risks and in the process, boosting the total loan loss reserves to P 7.54 billion and loan loss coverage ratio to 119.54%
Bank premises, furnitures and equipment increased by 6.37% to P4.79 billion from P4.50 billion as the Bank continued to invest in fixed assets to complement its business and branch expansion plans. The 17.26% rise in equity investments from P14.48 million in 2008 to P16.98 million in 2008 was due to the Bank’s acquisition of additional minority shares in the Manila Banking Corp. (now known as ChinaBank Savings, Inc.) which it acquired in late 2007. Investment properties fell to P3.85 billion from P3.99 billion in 2008 from the recent sale of foreclosed properties. Other assets declined by 13.83% to P2.61 billion from P3.03 billion mainly from lower escrow deposits and sales contract receivables.
On the liabilities side, total customer deposits grew by 11.23% from P173.78 billion in 2008 to P193.29 billion in 2009 as both demand and time deposits expanded. Our low cost deposit (CASA) levels were up by 27% or P12.43 billion, P 9.51 billion of which was due to higher volume of demand deposits. The sustained branch marketing efforts and expansion of the branch network resulted in improved ratio of CASA to total peso deposits at 41.29% from 34.36% last year. Time deposits grew by 21.67% from P 45.39 billion to P 55.23 billion from higher volume of dollar denominated short-term deposits. Bills payable went up by 48.14% in 2009 from P3.91 billion in 2008 to P5.79 billion due to the increase in BSP rediscounting line. The higher number of branches also resulted in the growth of manager’s checks to P453.82 million from P350.05 million in 2008. Income tax payable reached P9.71 million, mainly from minimum corporate income tax (MCIT) liability. The strengthening of the peso against the dollar led to the decrease in Derivative Liability (currency forwards) by 13.73% Other liabilities declined by 14.82% to P1.93 billion from P2.26 billion mainly from lower payable due to former shareholders of ChinaBank Savings in relation to the Manila Bank acquisition. Total capital funds reached P30.20 billion, 17.47% higher than 2008, primarily from this year’s profits and the recovery in net unrealized gains (losses) on available-for-sale financial assets. Capital stock rose by P 886 million or 10% mainly from the 10% stock dividend distributed in 2009. The Surplus account grew by P 3.38 billion to P18.80 billion driven by the retained net income for the year net of cash dividend payout of P 12/share, totaling P1.06 billion. The improvement in market conditions and declining interest rates reversed the mark-to-market losses on available-for-sale securities in 2008 by P 1.64 billion which led to a net unrealized gain on AFS of P427 million by year-end 2009. For financial reporting purposes the foreign currency-denominated monetary assets and liabilities of the Bank are translated in Philippine pesos based on the Philippine Dealing System (PDS) closing rate prevailing at end of the year, and foreign currency-denominated income and expenses, at the PDS weighted average rate (PDSWAR) for the year. Exchange differences arising on translation are taken directly to the statement of comprehensive income under ‘Cumulative Translation adjustment’. The change in functional currency resulted in the recognition of cumulative translation adjustment loss of (P 53.89) million in 2009.
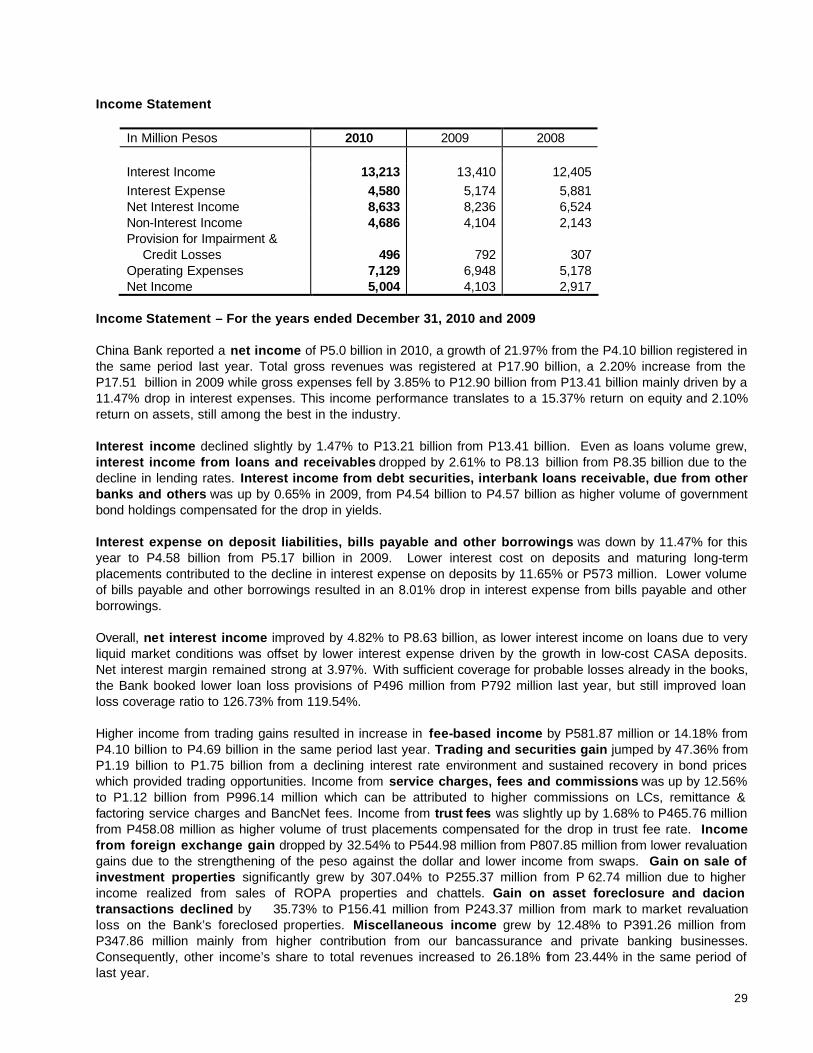
29
Income Statement
In Million Pesos 2010 2009 2008 Interest Income 13,213 13,410 12,405 Interest Expense 4,580 5,174 5,881 Net Interest Income 8,633 8,236 6,524 Non-Interest Income 4,686 4,104 2,143 Provision for Impairment & Credit Losses
496
792
307
Operating Expenses 7,129 6,948 5,178 Net Income 5,004 4,103 2,917
Income Statement – For the years ended December 31, 2010 and 2009 China Bank reported a net income of P5.0 billion in 2010, a growth of 21.97% from the P4.10 billion registered in the same period last year. Total gross revenues was registered at P17.90 billion, a 2.20% increase from the P17.51 billion in 2009 while gross expenses fell by 3.85% to P12.90 billion from P13.41 billion mainly driven by a 11.47% drop in interest expenses. This income performance translates to a 15.37% return on equity and 2.10% return on assets, still among the best in the industry. Interest income declined slightly by 1.47% to P13.21 billion from P13.41 billion. Even as loans volume grew, interest income from loans and receivables dropped by 2.61% to P8.13 billion from P8.35 billion due to the decline in lending rates. Interest income from debt securities, interbank loans receivable, due from other banks and others was up by 0.65% in 2009, from P4.54 billion to P4.57 billion as higher volume of government bond holdings compensated for the drop in yields. Interest expense on deposit liabilities, bills payable and other borrowings was down by 11.47% for this year to P4.58 billion from P5.17 billion in 2009. Lower interest cost on deposits and maturing long-term placements contributed to the decline in interest expense on deposits by 11.65% or P573 million. Lower volume of bills payable and other borrowings resulted in an 8.01% drop in interest expense from bills payable and other borrowings. Overall, net interest income improved by 4.82% to P8.63 billion, as lower interest income on loans due to very liquid market conditions was offset by lower interest expense driven by the growth in low-cost CASA deposits. Net interest margin remained strong at 3.97%. With sufficient coverage for probable losses already in the books, the Bank booked lower loan loss provisions of P496 million from P792 million last year, but still improved loan loss coverage ratio to 126.73% from 119.54%. Higher income from trading gains resulted in increase in fee-based income by P581.87 million or 14.18% from P4.10 billion to P4.69 billion in the same period last year. Trading and securities gain jumped by 47.36% from P1.19 billion to P1.75 billion from a declining interest rate environment and sustained recovery in bond prices which provided trading opportunities. Income from service charges, fees and commissions was up by 12.56% to P1.12 billion from P996.14 million which can be attributed to higher commissions on LCs, remittance & factoring service charges and BancNet fees. Income from trust fees was slightly up by 1.68% to P465.76 million from P458.08 million as higher volume of trust placements compensated for the drop in trust fee rate. Income from foreign exchange gain dropped by 32.54% to P544.98 million from P807.85 million from lower revaluation gains due to the strengthening of the peso against the dollar and lower income from swaps. Gain on sale of investment properties significantly grew by 307.04% to P255.37 million from P 62.74 million due to higher income realized from sales of ROPA properties and chattels. Gain on asset foreclosure and dacion transactions declined by 35.73% to P156.41 million from P243.37 million from mark to market revaluation loss on the Bank’s foreclosed properties. Miscellaneous income grew by 12.48% to P391.26 million from P347.86 million mainly from higher contribution from our bancassurance and private banking businesses. Consequently, other income’s share to total revenues increased to 26.18% from 23.44% in the same period of last year.

30
Lower provision for losses led to the drop in total operating expenses by 1.49% or P115.68 million from 2009. Excluding provisions, operating expense growth was also managed tightly to P7.13 billion, a growth of 2.60% from P6.95 billion in 2009, translating to an improved cost efficiency ratio of 53.52% (vs 56.30% in 2009) that ranks among the best in the industry. Compensation and fringe benefits increased by 5.47% to P2.62 billion from P2.49 billion mainly from the CBA-related salary adjustments and hiring of additional manpower. Occupancy costs which include power, light, rental, security service, messengerial and janitorial costs increased by 15.04% to P829.35 million from P720.89 million from the on-going branch expansion and various renovations. Taxes & licenses declined by 2.63% to P721.78 million from P741.28 million. Depreciation and amortization cost also dropped by 3.17% to P 646.79 million from P667.97 million. Stationery, supplies and postage increased by 3.94% to P467.84 million from P450.10 million. Insurance costs slightly grew by 4.55% to P456.88 million from P436.98 million. Repairs and maintenance dropped by 39.16% to P222.70 million from P366.04 million due to reclassification of technology-related service fees to miscellaneous expenses done in 2010. Transportation and traveling expenses dropped by 15.53% to P244.49 million from P289.43 million in 2010 due to lower training-related and branch-related traveling expenses. Entertainment, amusement and recreation expenses increased by 2.71% from P252.12 million to P258.96 million due to higher marketing and selling-related costs. Professional fees, marketing and other related services dropped by 12.39% from P222.62 million to P195.04 million from lower management & professional fees. The transfer of technology-related service fees led to the increase in miscellaneous expenses by 47.47% to P460.72 million from P312.43 million. Income Statement – For the years ended December 31, 2009 and 2008 China Bank’s net income reached P 4.10 billion, a 40.64% improvement from last year’s P 2.92 billion profits as higher revenues offset the increase in operating expenses and provision for impairment and credit losses.
Gross interest income climbed by 8.10% from 2008 from the combined increase in interest income from loans and trading and investments securities that more than compensated for the 4.25% drop in interest income from BSP and other banks. Higher average loan volume from the corporate and consumer lending side led to the growth in interest income from loans & receivables by 4.55% to P8.35 billion. Likewise, despite the drop in yields, interest income from trading and investment securities also grew by 17.15% spurred by higher volume of government bonds.
Gross interest expense fell by 12.02% to P5.17 billion in 2009. The declining peso and dollar borrowing rates, maturities of long-term placements such as Money Lift product and better funding mix contributed to the 14.05% decline in interest expense in deposit liabilities. Higher utilization of our BSP rediscounting line lifted interest expense on bills payable and other borrowings by 62.31% or P97.33 million to P 253.54 million. Consequently, net interest income grew by 26.24% from P6.52 billion in 2008 to P8.24 billion in 2009. This led to an improvement in the Bank’s net interest margins (NIM) by 34 bps to 4.16%, one of the best in the industry. In line with the Bank’s prudent approach to the management of business risks, the Bank booked additional provision for impairment and credit losses (included in the operating expenses) of P792.38 million, up by 158.35% from 2008. Non-interest income increased by P1.96 billion or by 91.54% from 2008. The declining interest rate environment and sustained bond market recovery presented trading opportunities and resulted in a turnaround in mark-to-market valuation. As a result, trading and securities gain grew by P1.29 billion, a considerable improvement from the trading loss of P101 million reported last year. Higher margins from currency trading and income from swaps resulted in a 307.39% or P609.55 million foreign exchange gain. Income from gain on sale of investment properties contracted by 51.85% to P62.74 million from P130.29 million from lower income from properties sold. Income from gain on asset foreclosure and dacion transactions grew by 72.61% to P243.37 million from P140.99 million which arose from the difference between the fair value of properties upon foreclosure and carrying value of the related loan. Total miscellaneous income rose by 16.67 % from 2008 to P347.86 million brought about by the income contribution from bancassurance, private banking and participation fees from bonds underwriting.

31
Operating expenses (excluding provision for losses) grew by 34.18% or P1.77 billion from 2008. The hiring of additional manpower due to the Bank’s on-going expansion, salary and benefits increases, and higher provision for profit sharing escalated compensation and fringe benefits by 34.42% or from P1.85 billion to P2.49 billion this year. Higher revenues translated to higher gross receipt tax (GRT) increasing taxes and licenses by 24.89% to P741.28 million. With the on-going branch expansion, occupancy costs rose by 17.76%. Depreciation and amortization cost also grew by 41.82% from 2008 to P667.97 million which can be attributed to acquisition of property and equipment for additional branches put up by the Bank, relocation and renovation of some existing branches and head office units as well as various technology upgrades and maintenance. Insurance costs also escalated by 25.25% from 2008 to P436.98 million mainly due to higher PDIC insurance cost brought about by higher deposits. Repairs and maintenance which includes annual software support and maintenance fees went up by 67.38% to P366.04 million from P218.69 million from major repairs and renovations made in 2009. The on-going branch expansion, various technology upgrades and training-related traveling expenses also led to the increase in Transportation and Traveling expenses by 61.36% from P179.36 million in 2008 to P289.43 million in 2009. Entertainment, amusement and recreation increased by P90.87 million or 56.35% due to higher marketing and selling-related costs. Professional fees, marketing and other related services also rose by 119.82% from P101.27 million in 2008 to P222.62 million from higher payment of banking fees and advertising cost relative to the Bank’s corporate advertising campaign launched during the last quarter of 2009. Miscellaneous expenses, composed of litigation expense, freight charges, donations and other trading-related expenses, went up by 47.47% to P312.43 million from P211.86 million last year. As the Bank did not set up deferred tax assets for 2009, provision for income tax went up by 87.57% to P497.51 million from higher final tax withheld. (b) Key Performance Indicators Definition of Ratios Return on Average Equity – Net Income After Income Tax Average Total Equity Return on Average Assets – Net Income after Income Tax Average Total Assets Cost to Income Ratio – Operating Expenses Less Provision for Impairment and Credit Losses Net Interest Income + Other Income Net Interest Margin – Net Interest Income Average Interest Earning Assets Liquid to Total Assets – Total Liquid Assets Total Assets Loans to Deposit Ratio – Loans (Net) Deposit Liabilities Non-Performing Loan (NPL Ratio) – Non-Performing Loans (net of NPLs Classified as Loss)
Gross Loans + interbank loans receivables (net of NPLs Classified as Loss, unquoted debt securities)
Non-Performing Loan (NPL) Cover – Allowance for Probable Losses Loans (net of NPLs Classified as Loans) Non-Performing Loans (net of NPLs Classified as Loans) Capital to risk assets ratio – BSP prescribed formula: Total Qualifying Capital Total Risk Weighted Exposures

32
In Percent 2010 2009 2008 PROFITABILITY Return on Assets 2.10 1.90 1.53 Return on Equity 15.37 14.49 11.98 Net Interest Margin 3.97 4.16 3.82 Cost to Income Ratio 53.52 56.30 59.74 LIQUIDITY Liquid Assets to Total Assets 48.79 46.46 39.59 Loans (net) to Deposit Ratio 55.01 57.02 63.69 ASSET QUALITY Non-Performing Loans Ratio 4.30 4.16 5.14 Non-performing Loan (NPL) Cover 126.73 119.54 88.06 CAPITALIZATION Capital Adequacy Ratio Tier 1 15.68 11.92 12.62 Total CAR 16.56 12.80 13.49 PROFITABILITY CHIB’s 2010 net income of P5.0 billion resulted in ROE of 15.37% and ROA of 2.10% that reflects industry-best performance. Cost to income ratio stood at 53.52% vs 56.30% in 2009 and 59.74% in 2008, still industry-best in terms of cost efficiency as higher revenues more than covered the additional cost of branch expansion, hiring and capital investments. Despite the drop in yields, net interest margin was registered at 3.97% (vs. 4.16% in 2009 and 3.82% in 2008) from the growth in low cost deposits and maturities of long-term deposits. LIQUIDITY The Bank’s liquidity ratio (the ratio of liquid assets to total assets) was registered at 48.79% from 46.46% in Dec-end 2009 and 39.59% in 2008 as funds were invested in cash/interbank assets/BSP placements and government bonds. Loans-net to deposit ratio decreased to 55.01% in 2010 from 57.02% in 2009 and 63.69% in 2008 as the Bank’s unquoted debt securities classified as loans (UDSCL) declined by P3.81 billion to P11.81 billion from P15.62 billion. ASSET QUALITY NPL ratio was registered at 4.30% in 2010 from 4.16% in 2009 and 5.14% in 2008. Loan loss coverage ratio was at 126.73% in 2010 from 119.54% in 2009 and from 88.06% in 2008, as the bank continued to provide a buffer against lending risks. CAPITALIZATION China Bank’s financial position remains strong with Tier 1 CAR ratio of 15.68% and total CAR of 16.56%. The Bank’s capital is largely comprised of Tier 1 (core) capital, the increase in which was mainly due to current year profits. The Bank’s sustained profitability contributed to the strength in capital and enabled it to pay regular dividends to shareholders.

33
(c) Past Financial Conditions and Results of Operations The Philippines was firmly in expansion mode last year, with GDP rising by 7.3% - its top performance in three decades. The credible and decisive outcome of the national elections, fiscal discipline and accommodative monetary policy paved the way for an upgrade in the outlook for Philippine sovereign bonds, which came initially from Standard & Poors’ then from Moody’s. This cut the credit default premium on the country’s dollar-denominated debt (ROPs) which effectively brought down the cost of borrowing abroad.
2010 was an exceptional year for the banking industry, particularly for their treasury-based business, as the combination of low policy rates, mild inflation and a massive overhang in liquidity brought interest rates down to their historic lows. This steady plunge in yields offered banks an opportunity to generate substantial trading gains. However, loans margins came under pressure with the heightened competition in the borrowers’ and capital markets. With the dearth of investment options, fund placements with the BSP climbed to P 1.5 trillion, as liquidity sought better yields at much lower risk. Banks not only maintained capital levels in excess of the Basle II requirement but built up their Pillar II equity buffer in anticipation of the January 31, 2011 deadline for implementing the internal capital adequacy assessment process. China Bank (stock symbol: CHIB) once again reported a record performance, with profits rising by 21.97% year-on-year to P 5.0 billion, mainly from higher operating revenues from trading operations, bond investments and loans to customers. By focusing our efforts on revenue diversification, network expansion, broadening customer relationships and strengthening our organization, China Bank was even better positioned to take advantage of the market opportunities arising during the year and to deliver superior results to its shareholders & customers - the best in its 90-year history. The Bank’s resilience and capital strength as measured by its return on equity and assets of 15.37% and 2.10%, respectively, ranks among the best in the industry. CHIB declared cash dividends of P 12 per share plus 10% stock dividends, which when combined with the appreciation in share price gave our stockholders one of the best yields in the banking industry. To enhance market reach and accessibility to customers, we grew the combined universal and thrift banking network by 22 branches for a total of 269 by year end. The branches still serve as our primary platform for interacting with clients, servicing their needs and cross-selling products & services, with off-site and off-hour transactions handled by our online, mobile and ATM banking channels. Total assets grew by 10.05% to P257.38 billion as gross loan portfolio expanded by 10.53% to P113.65 billion from higher corporate, commercial and branch-based borrowings. Low cost funding improved by 22.5% as checking and savings accounts (CASA) deposits continued to build up in 2010, reaching an unprecedented level of P71.82 billion. China Bank’s financial position remains solid with total capital funds of P35.45 billion which translates to a capital adequacy ratio of 16.56%, still one of the strongest in the industry. 2010 was strong year for our treasury dealership operations, as gains from government securities trading grew 47.36% to P 1.75 billion. Bancassurance was another success story for the year, raising fee-based profits by P104 million. CBC’s active market presence helped us meet the rising investment management needs of our private banking clients, whose business grew by 17% year-on-year. Other fee-based businesses such as cash management and remittances also contributed to the earnings growth. The uptrend in current and savings accounts as well as reliance on cost effective channels kept our net interest margins at 3.97%, despite the considerable drop in asset yields. In line with the Bank’s goal of becoming a customer-centric organization, it has redefined roles and functions of each unit and categorized them into 4 clusters: relationship banking, product management, operations and corporate services support. The move towards total relationship management called for closer interface and teamwork among the marketing & support units for client acquisition, account servicing, retention and cross-selling activities. Our people represent the Bank’s first line of contact with its customers, and embody its corporate values, memory and aspirations - which is to be our clients’ leading partner towards their success. As part of its continuing effort to keep compensation competitive with the banking industry, CHIB also peacefully

34
concluded its new two-year collective bargaining agreement with the CBC Employees Association, effective 01 August 2010 to 01 August 2012. On our 90th year, rating agencies Fitch (individual rating of C/D) and Capital Intelligence (Financial Strength BBB-) affirmed our credit ratings. Our National rating of AA- is one notch below the top bank rating in the country. The Bank was again recognized by the Bureau of Treasury as one of the “Top Ten Best Performing Government Securities Eligible dealers (GSED) in the Primary Market for 2010”. In 2010, based on the 2009 results of the scorecard, China Bank was a silver awardee in corporate governance by the Institute of Corporate Directors, recognizing its performance in protecting the rights and equitable treatment of its shareholders, role of stakeholders, disclosure and transparency, and Board responsibilities. CHIB shares were included in the 30-stock Philippine Stock Exchange Index last May 2010 after meeting their criteria on free market float, daily share turnover and period of trading. (d) Future Prospects 2011 would be a challenging year due to uncertainties surrounding the US recovery and the direction of oil prices. The bleak economic prospects in Europe, Middle East and the US could affect the flow of trade investments and remittances. On the domestic front, the government sees continued positive developments in the economy despite uncertainties in the global front. The country is entering 2011 from a position of strength after proving its resiliency in the recent global economic and financial crunch. The government’s medium-term fiscal consolidation plan aims to reduce the overall fiscal deficit to 2 percent of GDP by 2013. GDP is expected to hit its 7-8% growth target for 2011. The consolidation on the expenditure side would be complemented by a measured tightening in monetary policy as BSP rates align with emerging market levels. Inflation rate is expected to remain moderate this year despite the impending increase of oil and food prices brought about by the Middle East crisis. BSP was looking at an 8-percent remittance growth in 2011 that would bring the volume past the $20-billion mark. With greater investor confidence in the country, the government predicts that more investments would generate jobs and reinvigorate the economy. The Public-Private Partnership (PPP) programs had attracted some 600 potential investors. China Bank’s core strategies are to continue to expand and diversify its revenue sources, broaden its distribution channels, maximize total customer relationships and strengthen the organization for better competitiveness.
The role of fee-based business in revenue diversification has become more critical, as contributions from bancassurance, private banking, remittances, trade finance, cash management and foreign exchange transactions are expected to grow. New products & services will be introduced to high-end networth clients by the private banking unit. The remittance business will be further enhanced through new products for the OFWs and new foreign and domestic tie-ups. The Bank plans to focus on total customer relationship management for each major market segment – corporate, middle market, and retail/consumer – to acquire larger “share of wallet” towards becoming the primary banker for its customers. The Bank’s objective is to offer clients a highly personalized and professional banking experience, improve client retention rates and deepen the scope and scale of account relationships. The Bank will mainly pursue its branch expansion program organically but is actively exploring acquisition opportunities. CHIB will continue to offer products and services that will meet customers’ needs and expectations. The Bank will pursue its extensive technological upgrade involving not just its core banking platform but the implementation of business intelligence & customer relationship management, asset-liability management, manpower planning and capital adequacy & management solutions, among others. Our goal is not simply to automate and rationalize business processes but to ensure that decisions involving our customers are driven from the perspective of total relationship management. In the pipeline are new products such as savings accounts catering to overseas workers, etc.

35
The Bank will continue to hire the right people, develop skills of existing teams, and identify, train, and retain the Bank’s talents to ensure adequate & competent staffing to drive the Bank’s business & growth strategies. (e) Material Changes (i) Events that will trigger direct or contingent financial obligation that is material to the company, including any default or acceleration of an obligation There were no events that will trigger direct or contingent financial obligation that is material to the company, including any default or acceleration of an obligation (ii) All material off-balance sheet transactions, arrangements, obligations (including contingent obligations), and other relationships of the company with unconsolidated entities or other persons created during the reporting period In the normal course of the CHIB’s operations, there are various outstanding commitments and contingent liabilities which are not reflected in the accompanying financial statements. Management does not anticipate any material losses as a result of these transactions. The following is a summary of contingencies and commitments of the Bank with their equivalent peso contractual amounts:
2010 2009 Trust department accounts 100,598,864,502 70,304,881,018 Unused commercial letters of credit 11,340,867,273 8,385,049,125 Outstanding guarantees issued 1,451,217,830 2,100,822,691 Deficiency claims receivable 289,815,905 423,539,684 Late deposits/payments received 312,509,340 409,049,268 Inward bills for collection 193,161,090 163,040,467 Outward bills for collection 49,504,645 130,693,963 Others 1,538,518,745 1,377,065,475
(iii) Any Material Commitments for Capital Expenditure and Expected Funds Branch expansion plan and technology-related capital investments will account for the bulk of the Bank’s capital expenditures for 2011. Capital expenditures will be funded from internal sources. (iv) Any know trends, events, or uncertainties (material impact on sales) Not applicable. (v) Causes for any material changes from period to period of Financial Statements Please refer to Item 6 of the SEC Form 17-A of the Bank. (vi) Seasonal aspects that has material effect on the Financial Statements Not applicable.

36
Item 7. Financial Statements Please refer to the attached Audited Financial Statements for the years 2010 and 2009. Sycip Gorres Velayo & Co. (SGV & Co.) Ernst & Young has been the Bank's independent accountant for more than 20 years and is again recommended for appointment at the scheduled annual stockholders' meeting. None of the Bank's external auditors have resigned for the past many years, much less, for the past 2 years. In compliance with SEC Memorandum Circular No. 8, Series of 2003, and SRC Rule 68 (3) b (iv) on the rotation of the external auditors or signing partners of a firm every after five (5) years, Ms. Josephine Adrienne A. Abarca was assigned in 2007 as SGV & Co. Ernst & Young's partner-in-charge for the Bank. Representatives of SGV & Co. Ernst & Young are expected to be present at the annual stockholders’ meeting to respond to any matter that may be pertinently raised during the meeting. Their representative will be given the opportunity to make a statement if they so desire.
Fiscal Year Audit Fees and Other-related Fees Tax Fees 2010 P1,600,000.00 --- 2009 P1,500,000.00 ---
The above audit fees are inclusive of the following: (a) Other assurance and related services by the External Auditor that are reasonably related to the performance of the audit or review of the Bank's financial statements and (b) All Other Fees. The Bank's Audit Committee which is composed of Messrs. Alberto S. Yao (Chairman), Joaquin T. Dee, and Robert F. Kuan, approves the audit fees and fees for non-audit services, if any, of external auditors, as emphasized in Article IV, paragraph G of the Committee's Charter. The matter of the 2010 Audit fees was taken up and approved by the Audit Committee at its regular meeting on February 16, 2011.
Per SGV & Co. Ernst & Young's representation during the Audit Committee meeting on February 16, 2011, they confirm that they are independent certified public accountants with respect to the Bank and its subsidiaries within the meaning of the applicable published rules and regulations of the Professional Regulations Commission, Board of Accountancy, and Securities and Exchange Commission, and they have not encountered any disagreement or difficulties in dealing with Management when performing the audit. Item 8. Changes and Disagreements with Accountants on Accounting and Financial
Disclosures The financial statements of the Bank for the year ending 31 December 2010 and 31 December 2009 have been audited by Sycip Gorres Velayo & Co. in accordance with Philippine Financial Reporting Standards. There were no changes and disagreements with accountants and financial disclosures.

37
PART III - CONTROL AND COMPENSATION INFORMATION Item 9. Directors and Executive Officers of the Issuer (a) Incumbent Directors and Advisors: Gilbert U. Dee, 75, Chairman of the Board, holds a Bachelor of Science degree in Banking from the De La Salle University. He obtained his MBA in Finance from the University of Southern California in 1959. He has been a Director since 1969, and became Chairman of the Board in 1989. He was formerly a director of the Philippine Pacific Capital Corporation, Philex Mining Corporation and CBC Finance Corporation, and President of GAB Investment Corporation. He is currently the Chairman of CBC Properties & Computer Center, Inc. (CBC-PCCI), a Bank subsidiary, Chairman of Union Motor Corporation, and Director of Super Industrial Corporation. Henry Sy, Sr., 86, Honorary Chairman of, and Advisor to, the Board, holds an Associate in Commercial Science degree from the Far Eastern University. He was conferred the degree of Doctor in Business Management (Honoris Causa) by De La Salle University in 1999. He is presently the Chairman of a number of corporations, including First Asia Realty Development Corporation, Sysmart Corporation, SM Land, Inc. (formerly Shoemart, Inc.), Highlands Prime, Inc., and SM Investments Corporation. He is also the Chairman Emeritus of Banco de Oro Universal Bank. Hans T. Sy, 55, Vice Chairman of the Board and Chairman of the Executive Committee (ExCom) since 1989, holds a Bachelor of Science degree in Mechanical Engineering from the De La Salle University. A Director since 1986, he was formerly the Chairman and President of North Edsa Marketing, Inc. and Wonderfoods, Inc. He currently holds directorships in various companies, a few of which are SM Prime Holdings, Inc., wherein he also serves as President, SM Land, Inc. (formerly Shoemart, Inc.) and Highlands Prime, Inc. Peter S. Dee, 69, Director since 1977 and President & Chief Executive Officer (CEO) since 1985, holds a Bachelor of Science degree in Commerce from the De La Salle University/University of the East. He took a Special Banking course from the American Institute of Banking in 1966. He has had over 40 years of banking experience, having worked with Rizal Commercial Banking Corporation as Assistant Vice President from 1963 to 1971, then with China Bank as Vice President from 1972 to 1977. He holds directorships in affiliates/subsidiaries and other corporations, some of which are CBC-PCCI, CBC Forex Corp. (CBC Forex), Chinabank Insurance Brokers, Inc. (CBC-IBI), Cityland Development Corp., Hydee Management & Resources Corp., Sinclair (Phils.), Inc., Can Lacquer, Inc. and GDSK Development Corp. He is also an Independent Director of Cityland, Inc., and City and Land Developers, Inc. Joaquin T. Dee, 75, Director, holds a Bachelor of Science degree in Commerce from the Letran College. He was elected Director of the Bank in 1984. He was the Vice-President for Sales and Administration of Wellington Flour Mills from 1964 to 1994. He is presently a Director of JJACCIS Development Corporation, Enterprise Realty Corporation, and Suntree Holdings Corporation. Dy Tiong, 81, Independent Director, holds a Bachelor of Science degree in Business Administration from the National Jean Kuan College. He has been a Director since 1985. He was formerly the Chairman of Universal Realty & Development Corporation, Director and President of CBC Finance, Inc. from 1980 to 2001, and President of Panelon Development Corporation from 1990 to 1994. Presently, he is the Chairman of Panelon Philippines, Inc., Honorary Chairman of Chiang Kai Shek College, and Chairman Emeritus of the Dr. Sun Yat Sen Society. Herbert T. Sy, 54, Director, holds a Bachelor of Science degree in Management from the De La Salle University. He has been a Director since 1993. He has been a director and officer for more than five (5) years in companies engaged in banking, food retailing, rubber manufacturing, investment, car service and car accessories, real estate development and mall operations. He presently holds the following positions: President of Supervalue, Inc., Syper Holdings, Inc. and Sondrik, Inc., and a Director of SM Prime Holdings, Inc. and SM Land, Inc. (formerly Shoemart, Inc.).

38
Harley T. Sy, 51, Director, holds a Bachelor of Science degree in Commerce, Major in Finance, from the De La Salle University. He became a Director in May 2001. He was a Director of Banco de Oro from 1989 to 1998. He is the President of SM Investments Corp. and Treasurer of SM Land, Inc. (formerly Shoemart, Inc.). His present directorships include the following corporations: SM Synergy Properties Holdings Corp., Ace Hardware Philippines, Inc., Sybase Equity Investments Corp., and Supervalue, Inc. Alberto S. Yao, 64, Independent Director, holds a Bachelor of Science degree in Business Administration from the Mapua Institute of Technology. He became a Director in July 2004. He was the Vice-President for Merchandising of Zenco Sales, Inc. from 1968 to 1975. His present officerships in other corporations include Richwell Trading Corp., Richwell Phils., Inc., Europlay Distributor Co., Inc., Richphil House, Inc., and Megarich Property Ventures Corp. He is an Independent Director of ChinaBank Savings, Inc. Roberto F. Kuan, 62, Independent Director, holds a Bachelor of Science degree in Business Administration from the University of the Philippines. He obtained his Masters in Business Management from the Asian Institute of Management (AIM) in 1975 and attended the Top Management Program conducted by AIM in Bali, Indonesia in 1993. He became a Director of the Bank in 2005. He has been the Chairman of the Board of Trustees of St. Luke’s Medical Center since 1996, member of the Board of Trustees of St. Luke’s College of Medicine since 1996, Director of Far Eastern University since 2004, member of the Board of Trustees of Brent International School, Inc. since 2009, and Director of Seaoil Phils., Inc. since 2008. He is the founder of Chowking Food Corporation and served as its President from 1985 until 2000. He is concurrently an Independent Director of China Bank Savings, Inc. Jose T. Sio, 71, Director, holds a Bachelor of Science degree in Commerce, Major in Accounting, from the University of San Agustin and Master’s degree in Business Administration from New York University. He has been a Director of the Bank since 2007. He was a Partner at Sycip Gorres Velayo & Co. (SGV) from 1977 to 1990, and Director of BDO Capital Investment Corp. He is presently the Executive Vice President and Chief Financial Officer of SM Investments Corporation, President of Rappel Holdings, Inc., Advisor of Banco De Oro Unibank, Inc., and Director of the following corporations: SM Keppel Land, Inc., Consolidated Prime Development Corporation, and Asia Pacific College. Ricardo R. Chua, 59, Director and Executive Vice President (EVP) and Chief Operating Officer (COO), holds a Bachelor of Science Degree in Business Administration, Major in Accounting, from the University of the East. He obtained his Master in Business Management degree from AIM in 1975. He became a Director of the Bank in May 2008 and has been the Bank’s EVP & COO since 1995. He joined the Bank in 1975 after a stint with SGV. He has been a Director of the following Bank affiliates/subsidiaries, namely, CBC Forex since 1997, and CBC-PCCI since 1990. He is also the Chairman of China Bank Savings, Inc. and BancNet, Inc. and Director of other corporations, some of which are Philippine Clearing House Corporation and CAVACON Corporation. Pilar N. Liao, 80, Advisor to the Board of the Bank, holds a Bachelor’s degree in Home Economics from the College of the Holy Spirit. She has been a Director of the Bank from 1985-1986, 1999-2000, 2001-2002, and 2003-2008, and Advisor to the Board in 2000-2001, 2002-2003 and 2008-present. She is the Chairman of Speed Office Systems and held directorships in Security Mutual Fund Corporation from 1954 to 2003 and in Occidental Data Corporation from 1988 to 2000. Note: Messrs. Gilbert U. Dee and Peter S. Dee are related within the fifth civil degree of consanguinity. Messrs. Hans T. Sy, Herbert T. Sy and Harley T. Sy are related within the second civil degree of consanguinity; Mr. Henry Sy, Sr. is their father.

39
The incumbent directors attended/participated in more than 50% of all the meetings of the Board for the period January to December 2010, as follows:
Director Present Absent
Gilbert U. Dee 10 3
Peter S. Dee 12 1
Hans T. Sy 11 2
Joaquin T. Dee 13 0
Dy Tiong* 13 0
Herbert T. Sy 9 4
Harley T. Sy 12 1
Alberto S. Yao* 13 0
Robert F. Kuan* 13 0
Jose T. Sio 12 1
Ricardo R. Chua 13 0 *Independent Directors
(b) Executive Officers: Nancy D. Yang, 71, Senior Vice President since 1995, is the Head of the Branch Banking Group and Binondo Business Center. She holds a Bachelor of Arts degree from the Philippine Women’s University and a post graduate scholarship grant in Human Development & Child Psychology from Merrill Palmer Institute in Detroit, Michigan, USA in 1961. She has attended the Allen Management Program in 1990, Environmental Risk Management Program for Bankers conducted by the Bank of America in 1997, BAI Retail Delivery Conference in Miami Beach, Florida, USA in 1999, and BAI Retail Delivery Conference in Orlando, Florida, USA in 2008. She is a Director of CBC-IBI and Vice-Chairman of the Board of China Bank Savings, Inc. (CBSI). Ms. Yang is related within the second civil degree of consanguinity to Mr. Peter S. Dee, President & CEO. Samuel L. Chiong, 61, Senior Vice President since 2004, is the Deputy Group Head of Branch Banking Group. He has been with the Bank since 1984. He obtained a Bachelor of Arts degree in Economics from the Ateneo de Manila University and took the Advanced Bank Management Program from AIM in 1989. He attended the BAI Retail Delivery Conference in Las Vegas, Nevada, USA in 2006. Prior to joining the Bank, he was connected with The Consolidated Bank & Trust Corporation and State Investment House, Inc. He is presently a Director and Treasurer of CBC-PCCI and CBC-IBI. He is also the Director and President of CBSI. Antonio S. Espedido, Jr., 55, Senior Vice President since 2004, is the Head of Treasury Group. He holds a Bachelor of Science in Business Administration degree from the University of San Francisco. He has had trainings on fund transfer pricing conducted by The Asian Banker, project management by Euromoney, and portfolio management by Wardley Investment (HK). He was connected with the Bank of the Philippine Islands (BPI) from 1984 to 1993, Citytrust/BPI from 1995 to 2004, and ACI Phils. (Forex) as Director from 1996 to 1997. He is currently a Director of CBC Forex and Director and Treasurer of CBSI. Ramon R. Zamora, 62, Senior Vice President since 2004, is the Group Head for Centralized Operations Group, the Head for Remittance Business Division, and concurrent Head of Correspondent Banking. He obtained his Bachelor of Arts degree in Economics from the Ateneo de Manila University. He joined the Bank in 1997, after 25 years of banking experience in Citibank N.A., where he held various senior executive positions, such as a Vice President of the Operations Group, Senior Relationship Manager and Credit Officer of the Marketing Group, and Vice President of the Regional Corporate Audit Group as the Global Transaction Banking Specialist covering South Asia Citibank N.A. branches. He was also a lecturer for the Ateneo - Bankers Association of the Philippines Institute of Banking. He is a Director of CBC Forex, CBC-PCCI, and CBSI.

40
Rhodora Z. Canto, 61, Senior Vice President since 2008, is the Head of Credit Management Group. A certified public accountant, she obtained her Bachelor of Science degree in Business Administration, Major in Accounting, from the University of the Philippines and her Master in Business Management degree from AIM in 1975. She was the Bank’s consultant from 2001 to 2004. Prior to joining the Bank, she spent many years in lending and investment banking and managed major transactions in the capital markets. She was Vice President and Corporate Finance Head of Citicorp Investment Phils., Vice President & Chief Operating Officer of CityTrust Investment Phils., Director and President of BPI Securities Corporation, and Director of Philippine Business Bank. She is a Director of CBSI. Margarita L. San Juan, 57, Senior Vice President since 2008, is the Head of Account Management Group. She holds a Bachelor of Science degree in Business Administration, Major in Financial Management, from the University of the Philippines. She took the Advance Bank Management Program from AIM in 1992. She has been with the Bank for 30 years. She started with the Bank as an Account Officer (Manager I) in 1980, was promoted to Senior Account Officer (Manager II) in 1981, Senior Manager in 1983, Assistant Vice President in 1985, Vice President I in 1988, Vice President II in 1992, First Vice President I in 1997, and First Vice President II in 2006. She was previously connected with Ayala Investment and Development Corporation and with Commercial Bank and Trust Co. She is a Director of CBSI, and a member of its Trust Committee and Risk Management Committee. Rabboni Francis B. Arjonillo, 52, Senior Vice President since 2010, is the Chief Risk Officer and Head of Risk Management Group. He obtained a Bachelor of Arts (Accelerated Program) degree in Economics from the De La Salle University in 1980 and Masters in Business Management from the AIM in 1983. He has more than 27 years of banking experience - 18 years with Citibank, N.A., 6 years with Bank of the Philippine Islands and a year in United Coconut Planters Bank. A part-time lecturer of De La Salle University (1980-1989) and TCP-lecturer of the Bankers Association of the Philippines, he also founded and became the first president of the Junior Philippine Economics Society (1979-1980). He was also a former Director and President of the Money Market Association of the Philippines (2003) and Director and Vice President of ACI Phils. (Forex). Prior to joining the Bank, he was Consumer Bank Treasurer of Citibank Australia and before that, Country Treasurer and FICC (Fixed Income, Currencies & Commodities) Head of Citibank Vietnam, where he also founded and became the first chairman of the Vietnam Bond Market Association. Rene J. Sarmiento, 57, First Vice President II, is the Head of the Trust Group. He was appointed as the Vice President of the Trust Group in 1994. He obtained his Bachelor of Science degree in Commerce, Major in Accounting, magna cum laude, from the De La Salle University and his Master’s degree in Business Management from AIM in 1978. Before joining the Bank, he occupied several positions in Ayala Investment and Development Corporation, Far East Bank & Trust Company and Security Bank Corporation. He is a Director of CBSI. Alexander C. Escucha, 54, First Vice President II, is the Head of Corporate Planning Division and the Bank’s Investor Relations Officer. He joined the Bank as Vice President in 1994. He holds a Bachelor of Arts degree in Economics cum laude from the University of the Philippines. Prior to joining the Bank, he was Vice President of the International Corporate Bank. He was President of the Corporate Planning Society of the Philippines (CPSP) in 1989, and President of the Bank Marketing Association of the Philippines (BMAP) from 1998 to 1999. In 2005, he was President of the Philippine Economic Society (PES) and concurrently Chairman of the Federation of ASEAN Economic Associations (FAEA). He is an international resource person at The Asian Banker and Chairman of its IT Implementation Award Committee. He is currently a Director of CBSI. Philip S.L. Tsai, 60, First Vice President since 2006, is the Region Head for the Bank’s Metro Manila South and Southern Luzon Branches. He has been with the Bank since 1978. He holds a Bachelor of Science degree in Business Administration from the University of the Philippines and obtained his MBA from Roosevelt University in Chicago, Illinois, USA. He has also attended the International Management Training conducted by Chemical Bank in New York in 1973, and the BAI Retail Delivery Conference in Las Vegas, Nevada, USA in 2006.
41
Roberto C. Uyquiengco, 62, First Vice President since 2006, is the Region Head for the Bank’s Metro Manila North and Northern Luzon Branches. He holds a Bachelor of Science degree in Commerce, Major in Accounting cum laude from the La Salle College-Bacolod and Bachelor of Laws from the University of Negros Occidental Recoletos. He has been with the Bank since 1984. He attended the Advanced Bank Management Program conducted by AIM in 1993, and the BAI Retail Delivery Conference in Las Vegas, Nevada, USA in 2007. Prior to joining the Bank, he was connected with SGV & Co., Allied Bank and State Investment House. He is an active member of the Philippine Institute of Certified Public Accountants (PICPA) and Integrated Bar of the Philippines. Alberto Emilio V. Ramos, 51, First Vice President II, is the Head of Private Banking Group. He obtained a Bachelor of Arts degree in Political Science and a Bachelor of Science degree in Marketing Management from the De La Salle University in 1981. He obtained his Master’s degree in Business Management from AIM in 1986. Prior to joining the Bank in 2006, he was the President of Philam Asset Management Inc. He also held several positions in Bank of the Philippine Islands, Citytrust Banking Corporation, Western State Bank, Tokai Bank of California, Urban Development Bank and Filinvest Credit Corporation. He is a recipient of the Treasury Professional Certificate from the Banker’s Association of the Philippines. He has also attended trainings on credit and financial analysis, performance appraisal and asset-liability management, Treasury products, and strategic marketing planning. Rosemarie C. Gan, 53, First Vice President, is the Center Head of Binondo Business Center (BBC) – the strong foothold of the Bank at Chinatown. She graduated magna cum laude, with a Bachelor of Science Degree in Business Administration, Major in Management, from the University of Santo Tomas and recipient of the Rector’s Award and the Philippine Association of Collegiate Schools of Business Excellence Award. She started her banking career in 1978 with Corporate Planning Department, moved to Branch Banking in 1990 as Manager and subsequently as Area Head supervising the Chinatown branches, and eventually promoted to Vice President in 2003 to head the BBC. She had extensive exposure in marketing and training in financial analysis, credit portfolio management, strategic planning and corporate governance. Note: All the foregoing officers have been involved in the banking industry for more than five (5) years. Corazon I. Morando, Vice President and Corporate Secretary. She is a Bachelor of Laws graduate of the University of the Philippines and took up graduate studies under the MBA-Senior Executive Program in the Ateneo de Manila University. She was formerly the Director of the Corporate and Legal Department of the Securities and Exchange Commission of the Philippines. She holds various positions in the SM Group of Companies, such as Senior Vice President, Corporate Legal Affairs and Compliance Officer in SM Investments Corporation, SM Prime Holdings, Inc. and SM Development Corporation. She is also the Corporate Secretary and Compliance Officer of Highlands Prime, Inc. and Pico de Loro Beach and Country Club.

42
(c) Nominees for election as Directors and Independent Directors:
Nominee as Director Person who Nominated Nominee as Independent Director
Person who Nominated and Relationship with Nominee
Gilbert U. Dee Linda Susan T. Mendoza
Dy Tiong Johnny Cheng T.K., Jr., Son-in-Law
Hans T. Sy Sysmart Corporation Alberto S. Yao Lucky Securities, Inc., No Relation
Peter S. Dee Nancy D. Yang Robert F. Kuan Regina Capital Development. Corp., No Relation
Joaquin T. Dee Christopher T. Dee
Herbert T. Sy Sysmart Corporation
Harley T. Sy SM Investments Corporation
Jose T. Sio SM Investments Corporation
Ricardo R. Chua Zenaida C. Milan
Upon initial determination, based on the Nomination Forms and attachments submitted to the Nominations and Corporate Governance Committees, the nominees for directors and independent directors were found to possess all the qualifications and none of the disqualifications of a director or independent director, as the case may be. (d) Involvement in Legal Proceedings To the best of the company’s knowledge, the Bank, its affiliates, subsidiaries, Directors and Officers have not been involved for the past five (5) years in any legal proceeding affecting their ability or integrity and/or involving a material or substantial portion of their property before any court of law or administrative body in the Philippines or elsewhere, save in the usual routine cases of the Bank arising from the ordinary conduct of its business. (e) Significant Employees The Bank values its human resources. It expects each employee to do his share in achieving the Bank’s set goals. (f) Family Relationships Messrs. Hans T. Sy, Herbert T. Sy and Harley T. Sy, all Directors of the Bank, are brothers; Mr. Henry Sy, Sr., is their father. Ms. Nancy D. Yang, Senior Vice President & Head of Branch Banking Group, is the sister of Mr. Peter S. Dee, President & CEO.

43
Item 10. Executive Compensation
Name Year Salary Bonuses & Other Compensation
TOTAL
Total for the 5 most highly compensated executive officers*
2011 (estimates) 2010 (actual) 2009 (actual)
P35,519,066.00 33,040,992.00 31,304,880.00
P39,336,302.00 33,600,877.00 25,352,834.00
P74,855,368.00 66,641,869.00 56,657,714.00
Total for all officers and directors
2011 (estimates) 2010 (actual) 2009 (actual)
553,760,595.00 519,963,000.00 476,025,456.00
355,815,103.00 310,846,328.00 220,217,349.00
909,575,698.00 830,809,328.00 696,242,805.00
* Messrs. Gilbert U. Dee, Peter S. Dee, Ricardo R. Chua, Antonio S. Espedido, Jr. and Ms. Nancy D. Yang.
There are no actions to be taken as regards any bonus, profit sharing, pension or retirement plan, granting of extension of any option warrant or right to purchase any securities between the Bank and its directors and officers. In accordance with Article IV, Section 11, and Article VIII, Section 1(a) of the Bank’s Amended By-Laws, the members of the Board of Directors are entitled to a per diem of P500.00 for attendance at each meeting of the Board or of any committees and to 4% of the Bank’s net earnings. Item 11. Security Ownership of Certain Record and Beneficial Owners and Management as of
December 31, 2010 (a) Record and beneficial owners holding 5% or more of voting securities:
Title of Class
Name, Address Of Record Owner & Relationship with Issuer
Name of Beneficial Owner & Relationship
with Record Owner Citizenship
No. of Shares
Held Percentage
Common
Sysmart Corporation 10th Floor L.V. Locsin Bldg., 6752 Ayala Avenue, Makati City Stockholder
Henry Sy, Sr. (99.98% ownership) Stockholder
Filipino 15,861,941 14.788%
Common
SM Investments Corporation 10th Floor L.V. Locsin Bldg., 6752 Ayala Avenue, Makati City Stockholder
Henry Sy, Sr. (14.57% ownership) Stockholder
Filipino 17,751,773 16.550%
Common
PCD Nominee Corporation 37th Floor, Tower I, The Enterprise Center, 6766 Ayala Ave. corner Paseo de Roxas, Makati City Stockholder
Various stockholders/clients Non-Filipino 23,996,557 22.372%
Common
PCD Nominee Corporation 37th Floor, Tower I, The Enterprise Center, 6766 Ayala Ave. corner Paseo de Roxas, Makati City Stockholder
Various stockholders /clients Filipino 10,676,492 9.954%

44
Mr. Henry Sy, Sr. is the record and beneficial owner of the following common shares:
No. of Shares Held Percentage
Direct Holdings: 1,995,741 1.861%
Indirect Holdings:
Holdings from various brokers 185,329 0.173%
14.57% ownership in SM Investments Corporation 2,702,932 2.520%
16.71% ownership in Shoemart, Incorporated 797,146 0.743%
99.98% ownership in Sysmart Corporation 15,877,396 14.803%
Total 21,558,544 20.10%
Mr. Henry Sy, Sr.’s family is known to have substantial holdings in Shoemart, Inc., SM Investments Corporation and Sysmart Corporation and, as such, could direct the voting or disposition of the shares of said companies. Except as stated above, the Bank has no knowledge of any person holding more than 5% of the Bank’s outstanding shares under a voting trust or similar agreement. The Bank is likewise not aware of any arrangement which may result in a change in control of the Bank, or of any additional shares which the above-listed beneficial or record owners have the right to acquire within thirty (30) days, from options, warrants, rights, conversion privilege or similar obligation, or otherwise. (b) Directors and Management:
Title of Class Name Position
Amount & Nature of Beneficial/Record
Ownership Citizenship Percent
(i) Directors
Common Gilbert U. Dee Chairman of the Board 570,739 "r" Filipino 0.532%
Common Hans T. Sy Vice-Chairman 127,759 "r" Filipino 0.119%
Common Peter S. Dee President & CEO 218,830 "r" Filipino 0.204%
Common Joaquin T. Dee Director 2,357,613 "r" Filipino 2.198%
Common Dy Tiong Independent Director 9,884 "r" Filipino 0.009%
Common Herbert T. Sy Director 20,399 "r" Filipino 0.019%
Common Harley T. Sy Director 4,649 "r" Filipino 0.004%
Common Alberto S. Yao Independent Director 354 "r" Filipino 0.000%
Common Roberto F. Kuan Independent Director 513 "r" Filipino 0.000%
Common Jose T. Sio Director 140 "r" Filipino 0.000%
Common Ricardo R. Chua Director, EVP & COO 5,820 "r" Filipino 0.005%
Total 3,316,700 3.090%
(ii) Executive Officers (in addition to Messrs. Gilbert U. Dee, Peter S. Dee and Ricardo R. Chua)
Common Nancy D. Yang Sr. Vice-President 117,890 “r” Filipino 0.110%
Common Samuel L. Chiong Sr. Vice-President 2,115 “r” Filipino 0.002%
Common Margarita L. San Juan Sr. Vice-President 3,804 “r” Filipino 0.004%
Common Rene J. Sarmiento First Vice-President 1,058 “r” Filipino 0.001%
Common Roberto C. Uyquiengco First Vice-President 659 “r” Filipino 0.000%
Common Rosemarie C. Gan First Vice-President 1,274 “r” Filipino 0.001%
Total 126,800 0.118%
TOTAL (for Directors & Executive Officers as a group) 3,443,500 3.208%

45
(c) Other officers, supervisors and staff:
Name Position Total Outstanding Shares
1 Alameda, Evelyn R. Tumacder Officer 213 2 Alano, Ma. Hildelita P. Officer 213 3 Alvarez, Alejandro Jr. I. Officer 41 4 Ang, Patrick Yu Officer 110 5 Antonio, Ma. Cristina G. Officer 275 6 Belardo-Briones, Anessa P. Officer 55 7 Bernabe, Virginia T. Officer 370 8 Bognot, Renito R. Officer 1,274 9 Capacio, Victoria G. Officer 41
10 Cariño, Lilibeth R. Officer 106 11 Chan, Irene C. Officer 140 12 Chua, Victoria L. Officer 659 13 Cootauco-Sy, Clara Officer 10,538 14 Dee-Cruz, Angela Ty Officer 65,516 15 Dee, Gerard T. Officer 313 16 Del Rosario, Reylenita M. Officer 47 17 Deladia, Gemma B. Officer 55 18 Deleña, Evelyn E. Officer 211 19 Desengaño, Juliana U. Officer 47 20 Elarmo, Leilani B. Officer 19 21 Elayda, Ma. Luisa E. Staff 55 22 Encinas-Tiu, Mary Ann Habalo Officer 118 23 Evangelista, Adela A. Officer 380 24 Faigao, Eleanor Q. Officer 110 25 Galang, Hyacinth M. Officer 140 26 Go, Patrick U. Officer 2,698 27 Lao, Caroline Cua Staff 25 28 Lazaro-Manuel, Gina T. Officer 118 29 Liamson, Estela A. Officer 41 30 Lopez, Jeanett J. Officer 82 31 Lucero, Mary Luz S. Staff 36 32 Marcelo, Florina L. Officer 440 33 Mariano, Joanna Malen R. Officer 55 34 Marquez, Delia Officer 801 35 Mendoza, Linda Susan T. Staff 1,714 36 Meniado, Maribel S. Officer 1,815 37 Milan, Zenaida Officer 181 38 Millo, Haydee Grace M. Staff 22 39 Morando, Corazon I. Officer 220 40 Ochoco-Soriano, Anita C. Officer 55 41 Ong, Hermenegildo P. Officer 118 42 Paglinawan, Marisse Yvette S. Officer 110 43 Pajarillo, Maria Vida G. Staff 41 44 Punsalan, Mary Ann A. Staff 165 45 Purificacion, Noreen Officer 41 46 Quintanilla, Alvin A. Officer 41 47 San Diego, Nycette O. Officer 41

46
Name Position Total Outstanding Shares
48 Santos-Cuevas, Charmaine V. Officer 41 49 Santos, Estefania A. Officer 181 50 Sia, Henry D. Officer 213 51 Silva, Anna Carissa G. Staff 17 52 Sy, Teresita Gabaldon Officer 97 53 Tan, Anna Liza M. Officer 255 54 Tan, Belenette C. Officer 200 55 Tan, Shirley T. Officer 637 56 Te, Manuel M. Officer 57 57 Torralba, Edna A. Officer 622 58 Torres, Ruben M. Officer 338 59 Trinidad, Salina E. Staff 21 60 Ty, Jasmin Ongchan Officer 634 61 Uy, Johnny L. Officer 97 62 Uy, Virginia Y. Officer 936 63 Villasanta, Marivi Maniquis Staff 27 64 Yabut, Rosario D. Officer 634 65 Yandoc, Carina L. Officer 963 66 Yap, George C. Officer 41 67 Yap, Manuel O. Officer 41 68 Yong, Vivian L. Officer 338 69 Yu, James Ericson Officer 255 70 Yuchenkang, Marilyn Officer 934
Item 12. Certain Relationships and Related Transactions There is no transaction with or involving the Bank or any of its subsidiaries in which a director, executive officer, or stockholder owning ten (10%) percent or more of total outstanding shares and members of their immediate family had or is to have a direct or indirect material interest. In the ordinary course of business, the Bank has had loans and other transactions with its directors, officers, stockholders, and related interests (DOSRI), which were made substantially on terms not less favorable to the Bank than those offered to others. Full disclosures for these transactions were made through reports with the appropriate regulatory agency. The Bank retains Sycip Gorres Velayo & Co. Ernst & Young as its external auditor and the following law firms for the handling of some of the cases filed for and against the Bank:
? Abello Concepcion Regala & Cruz Law Offices ? Cruz Durian Alday & Cruz Matters ? Lim Vigilia Alcala Dumlao Alameda & Casiding

47
PART IV - CORPORATE GOVERNANCE Item 13. Corporate Governance China Bank believes that its good reputation, character, integrity, fairness and transparency have continuously driven the Bank to move towards better performance in corporate governance, surpassing mere compliance with best practices in strengthening its long-term growth and profitability. Silver Awardee on Corporate Governance In 2010, based on the 2009 results of the scorecard, China Bank was recognized as a top-scoring Publicly Listed Company by the Institute of Corporate Directors, recognizing its performance in protecting the rights and equitable treatment of its shareholders, role of stakeholders, disclosure and transparency, and Board responsibilities. China Bank was among the Silver Awardees. Board Commitment and Composition Our Board of Directors is collectively responsible for the governance of the Bank. It has control of and makes decisions on matters relating to the Bank’s affairs, including annual plans and performance targets, specified senior appointments, acquisitions and disposals above predetermined thresholds, and any significant change in balance sheet management policy. China Bank’s Board is comprised of eleven directors and two advisors to the Board, three of whom are executive directors and the rest are non-executives. China Bank recognizes the crucial role of Independent Directors in the Board that is why there are three independent non-executive directors who are there to create a strong element of independence and to protect the interest of the shareholders, exercise independent judgment on issues or matters presented to the board. They also ensure efficient and transparent management especially on areas of related party transactions. Evaluation System Our Board of Directors conducts an annual self-assessment of its collective performance in accordance with international best practices and as mandated by the Securities and Exchange Commission (SEC). There are also self-assessments for the individual directors, the President, various Board Committees, such as Audit, Compensation or Remuneration, Corporate Governance, and Risk Management Committees, and Compliance Office. The results of the evaluation are summarized by the Chief Compliance Officer (CCO), discussed by the Corporate Governance Committee and reported to the Board. Based on the results of the annual evaluation, there are no significant deviations and in general, the Bank has complied with the provisions and requirements of its Corporate Governance Manual. The Bank has generally complied with the principles on good corporate governance. On January 18, 2011, the Bank’s 2010 Certification of Compliance on Good Corporate Governance was submitted to the SEC and the Philippine Stock Exchange (PSE).

48
Manual on Corporate Governance The Corporate Governance Manual of China Bank was revised and approved by the Board on October 7, 2009. It is the Bank’s CCO who monitors compliance with the provisions of the Manual on Corporate Governance. Any violation thereof shall be reported to the Chairman with appropriate enforcement action as approved by the Board. The CCO also identifies, monitors, and controls compliance risk. The revised Manual is available in the Bank’s website under Investor Relations. To enjoin bankwide compliance, a copy of the Manual is available in the Compliance Office Public Folder for easy access of all employees of the Bank. Code of Ethics and Policy on Conflict of Interest Our Code of Ethics was approved by the Board of Directors in 1996. The management believes that its Code of Ethics has withstood the test of time, and no revision or update is necessary. Embedded in it are Bank’s values and principles. It is our Human Resources Division (HRD) that ensures its dissemination to all employees who join the Bank. HRD also sees to it that our people carry out their duties and responsibilities in accordance with this Code. Employees are also required to sign the acknowledgement receipt that they have a copy of the Code and that they will comply with its provisions. Embodied in the Bank’s Code of Ethics is the principle of ensuring that Bank’s interest is superior to personal interest of directors and officers. The directors and officers should not obtain personal gain or profit by reason of their position in the Bank. Information The Directors have full and timely access to all relevant information about the Bank so that they can effectively discharge their duties and responsibilities. China Bank highly recognizes the right of stockholders to information. The Board is committed to protect this right by ensuring that at all times, all material information about the Bank are disclosed in a timely manner to the SEC and PSE, particularly information that could affect share price. Governance structure The Board of Directors is at the core of our corporate governance structure. The Board guides our overall philosophy and direction, and sets the pace for our current operations and future developments. Governance by the Board also includes continuous review of our internal structure to ensure that there are clear lines of accountability for management throughout the Bank. The Board also oversees our risk management and remuneration systems. The roles of Chairman of the Board and Chief Executive Officer (CEO) are segregated, with a clear division of duties and responsibilities. Our Chairman of the Board is responsible for the leadership and effective running of the Board; on the other hand, the CEO is primarily responsible for the achievement of agreed objectives and execution of strategy as established by the Board of Directors, and leading the senior executive team in the day-to-day running of the business. We have a Corporate Governance Committee that is responsible in reviewing and evaluating the qualifications of those who are nominated to the Board, as well as those nominated to other positions requiring appointment by the Board of Directors. It is also responsible for ensuring the Board’s effectiveness and due observance of Corporate Governance principles and guidelines as well as oversee the periodic performance evaluation of the Board and its Committees and Executive Management. The Committee meets on a monthly basis.

49
PART V - EXHIBITS AND SCHEDULES Item 14. Exhibits and Reports (a) Exhibits Subsidiaries and Investments (i) CBC Properties and Computer Center, Inc. – incorporated on April 14, 1982 to render general services of
computer and other computer-related products and services solely to the Bank. It is 100% owned by the Bank, with one (1) share each assigned to Messrs. Gilbert U. Dee, Peter S. Dee, Ricardo R. Chua, Samuel L. Chiong, and Ramon R. Zamora, all officers of the Bank.
Board of Directors/Officers
(ii) CBC Forex Corporation – incorporated on February 18, 1997, with the primary purpose of engaging in the business of dealing and brokering in all currencies, entering into spot and forward foreign exchange contracts with local or foreign individuals and other entities, acting as brokers for the purpose of bringing together sellers and buyers of foreign exchange. On May 7, 2009, the Board of Directors and stockholders of the Bank approved, confirmed and ratified the amendment of the Articles of Incorporation of the company to shorten its corporate term to until December 31, 2009, in accordance with Section 20 of The Corporation Code. Board of Directors/Officers
Peter S. Dee - Chairman of the Board Ricardo R. Chua - Director Ramon R. Zamora - Director Antonio S. Espedido, Jr. - Director Minda A. Lim - Director/President Belenette Ching Tan - Corporate Secretary No. of Employees - 1
(iii) China Bank Insurance Brokers, Inc. – incorporated on November 3, 1998, with the primary purpose to act
as a broker in soliciting, procuring, negotiating, receiving, managing and forwarding applications for fire, casualty, plate glass, automobiles, trucks and other motor vehicles accident, health, burglary, rent, marine, credit, disability, life insurance, and all other kinds of insurance, including reinsurance contracts, or in any other manner aiding in taking out insurance, collecting payments of premiums due on such policies, and doing such other business as may be delegated to brokers or such companies in the conduct of a general insurance brokerage business. It is 100% owned by the Bank.
Gilbert U. Dee - Chairman of the Board/Director Peter S. Dee - President/Director Ricardo R. Chua - General Manager/Director Samuel L. Chiong - Treasurer/Director Ramon R. Zamora - Director Phillip Tan - Vice President Editha N. Young - Vice President Augusto P. Samonte - Vice President Leilani B. Elarmo - Corporate Secretary No. of Employees - 94
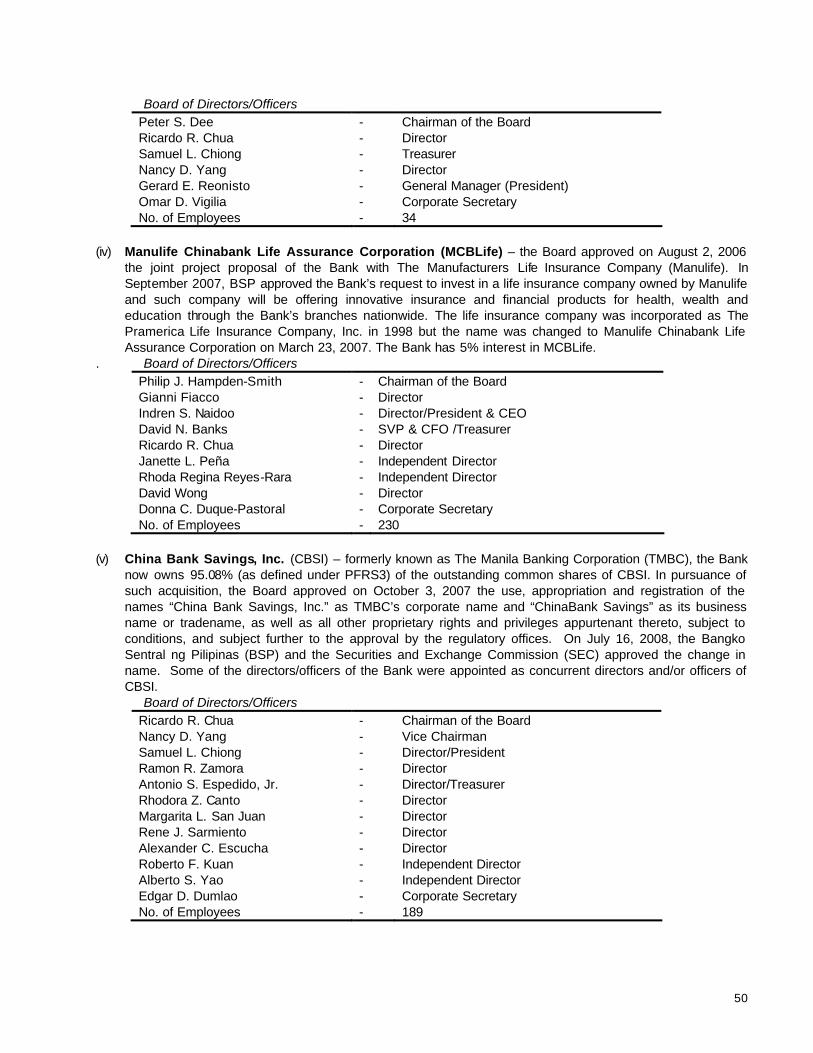
50
Board of Directors/Officers Peter S. Dee - Chairman of the Board Ricardo R. Chua - Director Samuel L. Chiong - Treasurer Nancy D. Yang - Director Gerard E. Reonisto - General Manager (President) Omar D. Vigilia - Corporate Secretary No. of Employees - 34
(iv) Manulife Chinabank Life Assurance Corporation (MCBLife) – the Board approved on August 2, 2006
the joint project proposal of the Bank with The Manufacturers Life Insurance Company (Manulife). In September 2007, BSP approved the Bank’s request to invest in a life insurance company owned by Manulife and such company will be offering innovative insurance and financial products for health, wealth and education through the Bank’s branches nationwide. The life insurance company was incorporated as The Pramerica Life Insurance Company, Inc. in 1998 but the name was changed to Manulife Chinabank Life Assurance Corporation on March 23, 2007. The Bank has 5% interest in MCBLife.
. Board of Directors/Officers Philip J. Hampden-Smith - Chairman of the Board Gianni Fiacco - Director Indren S. Naidoo - Director/President & CEO David N. Banks - SVP & CFO /Treasurer Ricardo R. Chua - Director Janette L. Peña - Independent Director Rhoda Regina Reyes-Rara - Independent Director David Wong - Director Donna C. Duque-Pastoral - Corporate Secretary No. of Employees - 230
(v) China Bank Savings, Inc. (CBSI) – formerly known as The Manila Banking Corporation (TMBC), the Bank
now owns 95.08% (as defined under PFRS3) of the outstanding common shares of CBSI. In pursuance of such acquisition, the Board approved on October 3, 2007 the use, appropriation and registration of the names “China Bank Savings, Inc.” as TMBC’s corporate name and “ChinaBank Savings” as its business name or tradename, as well as all other proprietary rights and privileges appurtenant thereto, subject to conditions, and subject further to the approval by the regulatory offices. On July 16, 2008, the Bangko Sentral ng Pilipinas (BSP) and the Securities and Exchange Commission (SEC) approved the change in name. Some of the directors/officers of the Bank were appointed as concurrent directors and/or officers of CBSI. Board of Directors/Officers
Ricardo R. Chua - Chairman of the Board Nancy D. Yang - Vice Chairman Samuel L. Chiong - Director/President Ramon R. Zamora - Director Antonio S. Espedido, Jr. - Director/Treasurer Rhodora Z. Canto - Director Margarita L. San Juan - Director Rene J. Sarmiento - Director Alexander C. Escucha - Director Roberto F. Kuan - Independent Director Alberto S. Yao - Independent Director Edgar D. Dumlao - Corporate Secretary No. of Employees - 189

51
(b) Reports on SEC Form 17-C The following reports have been submitted by the Bank during the year 2010 through official disclosure letters:
R E P O R T DATE REPORTED
Executive Committee’s approval of the re-hiring on contractual basis of Mr. Samuel L. Chiong, Senior Vice President and Deputy Group Head, Branch Banking Group, who is due for retirement on January 31, 2010
January 7, 2010
Corporate Secretary’s Sworn Certification concerning the attendance of the Bank Directors in their Board Meetings for the year 2009
January 7, 2010
Approval of the appointment of Mr. Rabboni Francis B. Arjonillo as Chief Risk Officer and Head of Risk Management Unit with the rank of Senior Vice President effective February 1, 2010 by the Risk Management, Corporate Governance and Executive Committees
January 21, 2010
Board of Directors’ approval of (a) the Rules Governing the Nomination and Election of Directors, and (b) the deadline for nomination on March 4, 2010
February 4, 2010
Board of Director’s approval (a) on the authority to further acquire eighty (80) common shares of China Bank Savings, Inc. (formerly the Manila Banking Corporation), (b) of the reorganization of the Management Committee to include Mr. Rabboni Francis B. Arjonillo, Senior Vice President, Risk Management Unit, as one of its members, and (c) of the appointment of Ms. Yasmin I. Biticon, as Risk Officer of China Bank Savings, Inc., concurrently with her position as Deputy Senior Manager, Risk Management Unit of China Banking Corporation effective February 1, 2010
February 4, 2010
Executive Committee’s approval of the promotion of Ms. Rosemarie C. Gan, from Vice President II to First Vice President I, Binondo Business Center, effective March 1, 2010
February 25, 2010
Board of Directors’ approval of the setting of the (a) record date for the determination of stockholders entitled to notice of and to vote at the Annual Stockholders’ Meeting on May 6, 2010 on the close of business of March 24, 2010, and (b) closing of the Bank’s transfer books on April 21, 2010 to May 6, 2010 for the foregoing purpose
March 4, 2010
Board of Directors’ approval of the declaration of the 12% or P12.00 per share cash dividend and 10% stock dividend to come from the Bank’s unissued shares with any fractional share resulting therefrom to be rounded-off to one (1) share
May 6, 2010
Report on the (a) election by the stockholders of the members of the Board of Directors, (b) approval, confirmation and ratification by the stockholders of the dividend declaration, and (c) results of the organizational meeting of the Board
May 7, 2010
Certifications of Messrs. Dy Tiong, Alberto S. Yao and Roberto F. Kuan that they possess all the qualifications and none of the disqualifications as independent directors
May 11, 2010
Board of Directors’ approval, confirmation and ratification of the appointment of Atty. Omar D. Vigilia as Corporate Secretary of China Bank Insurance Brokers, Inc., concurrently with his position as Vice President and Head of Legal and Collection Division of China Banking Corporation
June 3, 2010

52
R E P O R T DATE REPORTED
Information regarding the approval of the 12% cash dividend and 10% cash dividend by the Bangko Sentral ng Pilipinas per its letter dated June 23, 2010, declared by the Board of Directors on May 5, 2010 and approved by the stockholders on May 6, 2010
June 29, 2010
Board of Directors’ approval to set (a) July 22, 2010 as the record date for determining stockholders entitled to dividends, (b) August 17, 2010 as the payment and issuance dates of the dividends, and (c) July 23, 2010 to August 6, 2010 as the closing of the transfer books for the foregoing purpose
July 8, 2010
Executive Committee’s approval of the re-hiring on contractual basis of Mr. Philip S.L. Tsai, First Vice President and Region Head, Branch Banking Group, who is due for retirement on August 31, 2010
July 29, 2010
Board of Directors’ approval of the appointment of Mr. Gian Carlo D.P. Lacambra as Assistant Head of Acquired Assets Department of China Bank Savings, Inc., concurrently with his position as Manager, Acquired Assets Department of China Banking Corporation
August 5, 2010
Payment of listing fee with the SEC for the Bank’s additional 9,751,845 common shares to cover the 10% stock dividend declared on May 5, 2010, approved by the stockholders on May 6, 2010, by the Bangko Sentral ng Pilipinas on June 22, 2010, and by the Philippine Stock Exchange, Inc. on August 12, 2010
August 13, 2010
Information regarding the passing away of Mr. Shew Kou Y. Lee, Vice President and Head of the Bank’s Audit Division on November 23, 2010 November 25, 2010


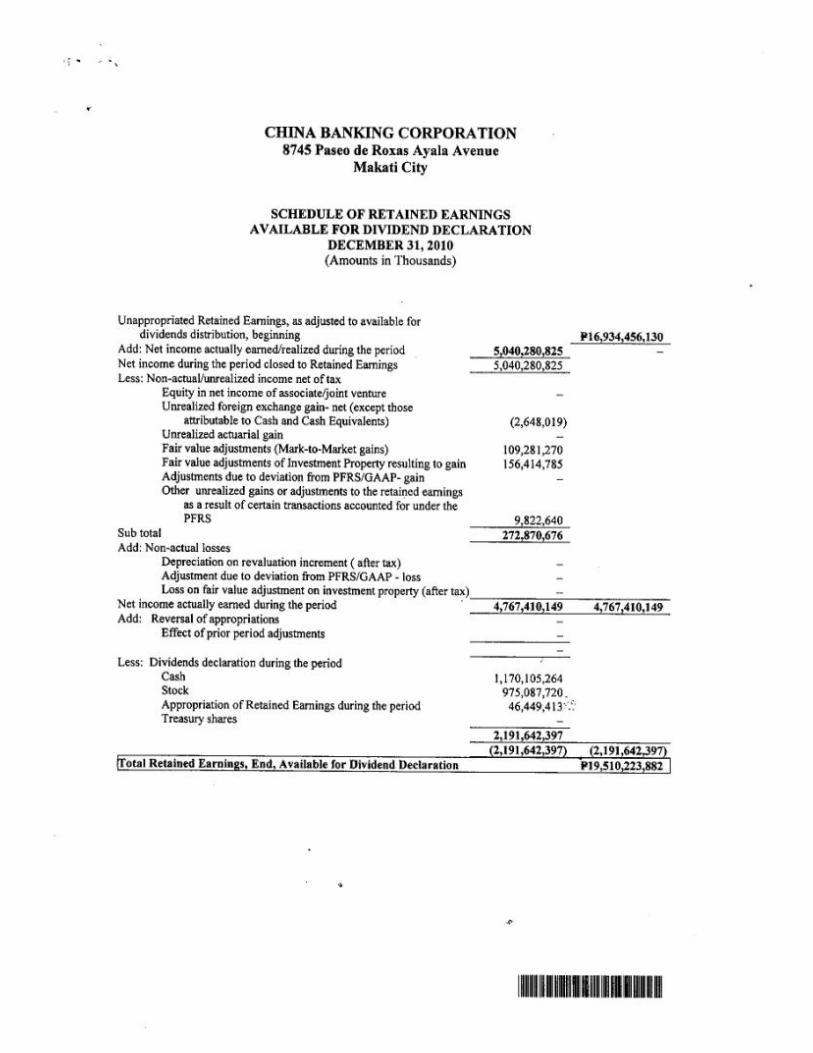


*SGVMC114803*
CHINA BANKING CORPORATION AND SUBSIDIARIES NOTES TO FINANCIAL STATEMENTS 1. Corporate Information
China Banking Corporation (the Parent Company) is a publicly listed commercial bank incorporated in the Philippines. The Parent Company acquired its universal banking license in 1991. It provides expanded commercial banking products and services such as deposit products, loans and trade finance, domestic and foreign fund transfers, treasury products, trust products, foreign exchange, corporate finance and other investment banking services through a network of 253 local branches.
The Parent Company has the following subsidiaries:
Subsidiary
Effective Percentages of Ownership Country of
Incorporation Principal Activities 2010 2009 Chinabank Insurance Brokers, Inc. 100.00% 100.00% Philippines Insurance brokerage CBC Properties and Computer Center, Inc. 100.00% 100.00% Philippines Computer services CBC Forex Corporation 100.00% 100.00% Philippines Foreign exchange China Bank Savings, Inc. (CBSI) 95.08% 95.06% Philippines Retail and consumer
banking
The Parent Company’s principal place of business is at 8745 Paseo de Roxas corner Villar Streets, Makati City.
The accompanying consolidated and parent company financial statements were authorized for issue by the Parent Company’s Board of Directors (BOD) on March 2, 2011.
2. Summary of Significant Accounting Policies
Basis of Preparation The accompanying consolidated financial statements include the financial statements of the Parent Company and its subsidiaries (collectively referred to as “the Group”).
The accompanying financial statements have been prepared on a historical cost basis except for financial assets at fair value through profit or loss (FVPL), available-for-sale (AFS) financial assets, and derivative financial instruments that have been measured at fair value. The financial statements are presented in Philippine pesos, and all values are rounded to the nearest peso except when otherwise indicated.
The financial statements of the Parent Company reflect the accounts maintained in the Regular Banking Unit (RBU) and Foreign Currency Deposit Unit (FCDU). The financial statements of these units are combined after eliminating inter-unit accounts.
Statement of Compliance The financial statements of the Group and the Parent Company have been prepared in compliance with Philippine Financial Reporting Standards (PFRS).
Basis of Consolidation and Investments in Subsidiaries The consolidated financial statements of the Group are prepared for the same reporting year as the Parent Company, using consistent accounting policies.

- 2 -
*SGVMC114803*
Subsidiaries are all entities over which the Parent Company has the power to govern the financial and operating policies generally accompanying a shareholding of more than one half of the voting rights. The existence and effect of potential voting rights that are currently exercisable or convertible are considered when assessing whether the Parent Company controls another entity.
All significant intra-group balances, transactions, income and expenses and profits and losses resulting from intra-group transactions are eliminated in full.
Subsidiaries are consolidated from the date on which control is transferred to the Parent Company. Control is achieved when the Parent Company has the power to govern the financial and operating policies of an entity so as to obtain benefits from its activities. Consolidation of subsidiaries ceases when control is transferred out of the Group.
The results of subsidiaries acquired or disposed of during the year are included in the consolidated statement of income from the date of acquisition up to the date of disposal, as appropriate.
When a change in ownership interest in a subsidiary occur which result in loss of control over the subsidiary, the Parent Company:
• Derecognizes the assets (including goodwill) and liabilities of the subsidiary • Derecognizes the carrying amount of any non-controlling interest • Derecognizes the related other comprehensive income recorded in equity and recycle the
same to profit or loss or retained earnings • Recognizes the fair value of the consideration received • Recognizes the fair value of any investment retained • Recognizes any surplus or deficit in profit or loss
In the separate or parent company financial statements, investments in subsidiaries are carried at cost, less accumulated impairment in value. Dividends earned on these investments are recognized in the Parent Company’s statement of income as declared by the respective BOD of the investees.
Non-Controlling Interest Non-controlling interest represents the portion of profit or loss and net assets not owned, directly or indirectly, by the Parent Company.
Non-controlling interests are presented separately in the consolidated statement of income, statement of comprehensive income, and within equity in the consolidated balance sheet, separately from parent shareholders' equity. Any losses applicable to the non-controlling interests are allocated against the interests of the non-controlling interest even if this results in the non-controlling interest having a deficit balance. Acquisitions of non-controlling interests that does not result in a loss of control are accounted for as equity transaction, whereby the difference between the consideration and the fair value of the share of the net assets acquired is recognized as an equity transaction and attributed to the owners of the Parent Company.

- 3 -
*SGVMC114803*
Changes in Accounting Policies and Disclosures The accounting policies adopted are consistent with those of the previous financial year except for the following new and amended PFRS and Philippine Interpretations which were adopted as of January 1, 2010:
New Standards and Interpretations
PFRS 3, Business Combinations (Revised) and PAS 27, Consolidated and Separate Financial Statements (Amended) PFRS 3 (Revised) introduces significant changes in the accounting for business combinations occurring after this becoming effective. Changes affect the valuation of non-controlling interest, the accounting for transaction costs, the initial recognition and subsequent measurement of a contingent consideration and business combinations achieved in stages. These changes will impact the amount of goodwill recognized, the reported results in the period that an acquisition occurs and future reported results.
PAS 27 (Amended) requires that a change in the ownership interest of a subsidiary (without loss of control) is accounted for as a transaction with owners in their capacity as owners. Therefore, such transactions will no longer give rise to goodwill, nor will it give rise to a gain or loss. Furthermore, the amended standard changes the accounting for losses incurred by the subsidiary as well as the loss of control of a subsidiary. The changes by PFRS 3 (Revised) and PAS 27 (Amended) affect acquisitions or loss of control of subsidiaries and transactions with non-controlling interests after January 1, 2010.
Philippine Interpretation IFRIC - 17, Distributions of Non-Cash Assets to Owners This interpretation provides guidance on accounting for arrangements whereby an entity distributes non-cash assets to shareholders either as a distribution of reserves or as dividends. The interpretation has no effect on either, the financial position or performance of the Group.
The change in accounting policy was applied prospectively and had no material impact on earnings per share.
The omnibus amendments to PFRSs issued in May 2008 and April 2009 were issued primarily with a view of removing inconsistencies and clarifying wording. There are separate transitional provisions for each standard. The adoption of the following amendments resulted in changes to accounting policies but did not have any impact on the financial position or performance of the Group.
Improvements to PFRSs PFRS 8, Operating Segments, clarifies that segment assets and liabilities need only be reported when those assets and liabilities are included in measures that are used by the chief operating decision maker. As the Group’s chief operating decision maker does review segment assets and liabilities, the Group has continued to disclose this information in Note 29.
PAS 7, Statement of Cash Flows, states that only expenditure that results in recognizing an asset can be classified as a cash flow from investing activities.
PAS 36, Impairment of Assets, amendment clarifies that the largest unit permitted for allocating goodwill, acquired in a business combination, is the operating segment as defined in PFRS 8 before aggregation for reporting purposes.

- 4 -
*SGVMC114803*
The following amendments and improvements to existing PFRS and Interpretations, which became effective in January 1, 2010, did not have a significant impact on the accounting policies, financial position or performance of the Group.
Amendments to Standards
• PFRS 2, Share-based Payment (Amendment) - Group Cash-settled Share-based Payment Transactions
• PAS 39, Financial Instruments: Recognition and Measurement (Amendment) - Eligible Hedged Items
Improvement to PFRS 2008
• PFRS 5, Non-current Assets Held for Sale and Discontinued Operations
Improvements to PFRS 2009 • PFRS 2, Share-based Payment • PFRS 5, Non-current Assets Held for Sale and Discontinued Operations • PAS 1, Presentation of Financial Statements • PAS 17, Leases • PAS 38, Intangible Assets • PAS 39, Financial Instruments: Recognition and Measurement • Philippine Interpretation IFRIC-9, Reassessment of Embedded Derivatives • Philippine Interpretation IFRIC-16, Hedge of a Net Investment in a Foreign Operation
Foreign Currency Translation The consolidated financial statements are presented in Philippine pesos, which is the Parent Company’s functional currency. Each entity in the Group determines its own functional currency and items included in the financial statements of each entity are measured using that functional currency. The functional currency of the Parent Company’s subsidiaries is the Philippine pesos.
Transactions and balances The books of accounts of the RBU are maintained in Philippine pesos, while those of the FCDU are maintained in United States (US) dollars. For financial reporting purposes the foreign currency-denominated monetary assets and liabilities in the RBU are translated in Philippine pesos based on the Philippine Dealing System (PDS) closing rate prevailing at end of the year, and foreign currency-denominated income and expenses, at the PDS weighted average rate (PDSWAR) for the year. Foreign exchange differences arising from restatements of foreign currency-denominated assets and liabilities are credited to or charged against operations in the period in which the rates change.
FCDU As at the reporting date, the assets and liabilities of the FCDU are translated into the Parent Company’s presentation currency (the Philippine Peso) at the PDS closing rate prevailing at the balance sheet date, and its income and expenses are translated at the PDSWAR for the year. Exchange differences arising on translation are taken directly to the statement of comprehensive income under ‘Cumulative translation adjustment’. Translation adjustment amounted to translation losses of P=62.27 million and P=53.89 million as of December 31, 2010 and December 31, 2009, respectively.

- 5 -
*SGVMC114803*
Cash and Cash Equivalents For purposes of reporting cash flows, cash and cash equivalents include cash and other cash items, due from Bangko Sentral ng Pilipinas (BSP) and other banks, and interbank loans receivable and securities purchased under resale agreements (SPURA) with original maturities of three months or less from dates of placements and that are subject to insignificant risk of changes in value.
Financial Instruments - Initial Recognition and Subsequent Measurement Date of recognition Purchases or sales of financial assets that require delivery of assets within the time frame established by regulation or convention in the marketplace are recognized on the trade date (i.e., the date that the Group commits to purchase or sell the asset). Derivatives are also recognized on a trade date basis. Deposits, amounts due to banks and customers and loans are recognized when cash is received by the Group or advanced to the borrowers. Securities transactions and related commission income and expense are recorded on a trade date basis.
Initial recognition of financial instruments All financial assets, including trading and investment securities and loans and receivables, are initially recognized at fair value. Except for financial assets at FVPL, the initial measurement of financial instruments includes transaction costs. The Group classifies its financial assets in the following categories: financial assets at FVPL, HTM financial assets, AFS financial assets, and loans and receivables while financial liabilities are classified as financial liabilities at FVPL and financial liabilities carried at amortized cost. The classification depends on the purpose for which the investments were acquired and whether they are quoted in an active market. Management determines the classification of its investments at initial recognition and, where allowed and appropriate, re-evaluates such designation at every reporting date.
Determination of fair value The fair value for financial instruments traded in active markets at the balance sheet date is based on their quoted market price or dealer price quotations (bid price for long positions and asking price for short positions), without any deduction for transaction costs. When current bid and asking prices are not available, the price of the most recent transaction is used since it provides evidence of the current fair value as long as there has not been a significant change in economic circumstances since the time of the transaction.
For all other financial instruments not listed in an active market, the fair value is determined by using appropriate valuation techniques. Valuation techniques include net present value techniques, comparison to similar instruments for which market observable prices exist, options pricing models, and other relevant valuation models.
‘Day 1’ profit Where the transaction price in a non-active market is different from the fair value from other observable current market transactions in the same instrument or based on a valuation technique whose variables include only data from observable market, the Group immediately recognizes the difference between the transaction price and fair value (a ‘Day 1’ profit) in the statement of income unless it qualifies for recognition as some other type of asset. In cases where the transaction price used is made of data which is not observable, the difference between the transaction price and model value is only recognized in the statement of income when the inputs become observable or when the instrument is derecognized. For each transaction, the Group determines the appropriate method of recognizing the ‘Day 1’ profit amount.

- 6 -
*SGVMC114803*
Financial assets and financial liabilities at fair value through profit or loss Financial assets and financial liabilities at FVPL include financial assets and liabilities held for trading purposes, financial assets and financial liabilities designated upon initial recognition as at FVPL, and derivative instruments.
Financial assets and financial liabilities are classified as held for trading (HFT) if they are acquired for the purpose of selling and repurchasing in the near term. Included in this classification are debt and equity securities which have been acquired principally for trading purposes.
Financial assets and financial liabilities are designated as at FVPL by management on initial recognition when any of the following criteria are met:
• The designation eliminates or significantly reduces the inconsistent treatment that would
otherwise arise from measuring the assets or liabilities or recognizing gains or losses on them on a different basis; or
• The assets and liabilities are part of a group of financial assets, financial liabilities or both which are managed and their performance evaluated on a fair value basis, in accordance with a documented risk management or investment strategy; or
• The financial instrument contains an embedded derivative, unless the embedded derivative does not significantly modify the cash flows or it is clear, with little or no analysis, that it would not be separately recorded.
The Parent Company designated its investments in Interest-Linked Structured Products (ISP) as financial assets at FVPL so as not to bifurcate the derivatives embedded in these instruments (see Note 8).
Financial assets and financial liabilities at FVPL are recorded in the balance sheet at fair value. Changes in fair value are recognized in ‘Trading and securities gain/(loss)’ in the statement of income. Interest earned or incurred is recorded in ‘Interest income’ or ‘Interest expense’, respectively, while dividend income is recorded in ‘Miscellaneous income’ when the right to receive payment has been established.
Derivatives recorded at fair value through profit or loss The Parent Company is a party to derivative instruments, particularly, forward exchange contracts. These contracts are entered into as a service to customers and as a means of reducing and managing the Parent Company’s foreign exchange risk, as well as for trading purposes, but are not designated as hedges. Such derivative financial instruments are stated at fair value through profit or loss.
Embedded derivatives that are bifurcated from the host financial and non-financial contracts are also accounted for at FVPL.
An embedded derivative is separated from the host contract and accounted for as a derivative if all of the following conditions are met: a) the economic characteristics and risks of the embedded derivative are not closely related to the economic characteristic of the host contract; b) a separate instrument with the same terms as the embedded derivative would meet the definition of a derivative; and c) the hybrid or combined instrument is not recognized at fair value through profit or loss. The Group assesses whether embedded derivatives are required to be separated from the host contracts when the Group first becomes a party to the contract. Reassessment of embedded derivatives is only done when there are changes in the contract that significantly modifies the contractual cash flows that would otherwise be required.
- 7 -
*SGVMC114803*
Held-to-maturity financial assets HTM financial assets are quoted non-derivative financial assets with fixed or determinable payments and fixed maturities for which the Group’s management has the positive intention and ability to hold to maturity. Where the Group would sell other than an insignificant amount of HTM financial assets, the entire category would be tainted and reclassified as AFS financial assets.
After initial measurement, these investments are subsequently measured at amortized cost using the effective interest rate (EIR) method, less any impairment in value. Amortized cost is calculated by taking into account any discount or premium on acquisition and fees that are an integral part of the EIR. The amortization is included in ‘Interest income’ in the statement of income. Gains and losses are recognized in income when the HTM financial assets are derecognized and impaired, as well as through the amortization process. The losses arising from impairment of such investments are recognized in the statement of income under ‘Provision for impairment and credit losses’. The effects of translation of foreign currency-denominated HTM financial assets are recognized in the statement of income.
Loans and receivable This accounting policy relates to the balance sheet captions ‘Due from BSP’, ‘Due from other banks’, ‘Interbank loans receivable and SPURA’, ‘Loans and receivables’, and ‘Accrued Interest Receivable’. These are financial assets with fixed or determinable payments that are not quoted in an active market. They are not entered into with the intention of immediate or short-term resale and are not classified as FVPL or as AFS financial assets.
After initial measurement, these are subsequently measured at amortized cost using the EIR method, less allowance for impairment. Amortized cost is calculated by taking into account any discount or premium on acquisition and fees and costs that are an integral part of the EIR. The amortization is included under ‘Interest income’ in the statement of income. The losses arising from impairment are recognized under ‘Provision for impairment and credit losses’ in the statement of income.
Available-for-sale financial assets AFS financial assets are those which are designated as such or do not qualify to be classified as financial assets at FVPL, HTM financial assets, or loans and receivables. They are purchased and held indefinitely, and may be sold in response to liquidity requirements or changes in market conditions. They include equity investments, money market papers and other debt instruments.
After initial measurement, AFS financial assets are subsequently measured at fair value. The effective yield component of AFS debt securities, as well as the impact of translation of foreign currency-denominated AFS debt securities, is reported in the statement of income. The unrealized gains and losses arising from the fair valuation of AFS financial assets are excluded, net of tax, from reported earnings and are reported as ‘Net unrealized gain/(loss) on AFS financial assets’ under other comprehensive income (OCI).
When the security is disposed of, the cumulative gain or loss previously recognized in other comprehensive income is recognized as ‘Trading and securities gain/(loss) - net’ in the statement of income. Interest earned on holding AFS debt securities are reported as ‘Interest income’ using the EIR. Dividends earned on holding AFS equity instruments are recognized in the statement of income as ‘Miscellaneous income’ when the right to the payment has been established. The losses arising from impairment of such investments are recognized as ‘Provision for impairment and credit losses’ in the statement of income.

- 8 -
*SGVMC114803*
Reclassification of Financial Assets Effective from July 1, 2008, the Group may reclassify, in certain circumstances, non-derivative financial assets out of the HFT investments category and into the AFS investments, Loans and Receivables or HTM investments categories. From this date it may also reclassify, in certain circumstances, financial instruments out of the AFS investment to Loans and Receivables category. Reclassifications are recorded at fair value at the date of reclassification, which becomes the new amortized cost.
The Group may reclassify a non-derivative trading asset out of HFT investments and into the Loans and Receivable category if it meets the definition of loans and receivables and the Group has the intention and ability to hold the financial assets for the foreseeable future or until maturity. If a financial asset is reclassified, and if the Group subsequently increases its estimates of future cash receipts as a result of increased recoverability of those cash receipts, the effect of that increase is recognized as an adjustment to the EIR from the date of the change in estimate.
For a financial asset reclassified out of the AFS investments category, any previous gain or loss on that asset that has been recognized in other comprehensive income is amortized to profit or loss over the remaining life of the investment using the EIR method. Any difference between the new amortized cost and the expected cash flows is also amortized over the remaining life of the asset using the EIR method. If the asset is subsequently determined to be impaired then the amount recorded in other comprehensive income is recycled to the statement of income. Reclassification is at the election of management, and is determined on an instrument by instrument basis. The Group does not reclassify any financial instrument into the FVPL category after initial recognition.
Other financial liabilities Issued financial instruments or their components, which are not designated as at FVPL, are classified as liabilities under ‘Deposit liabilities’, ‘Bills payables’ or other appropriate financial liability accounts, where the substance of the contractual arrangement results in the Group having an obligation either to deliver cash or another financial asset to the holder, or to satisfy the obligation other than by the exchange of a fixed amount of cash or another financial asset for a fixed number of its own equity shares. The components of issued financial instruments that contain both liability and equity elements are accounted for separately, with the equity component being assigned the residual amount after deducting from the instrument as a whole the amount separately determined as the fair value of the liability component on the date of issue.
After initial measurement, other financial liabilities not qualified and not designated as at FVPL are subsequently measured at amortized cost using the EIR method. Amortized cost is calculated by taking into account any discount or premium on the issue and fees that are an integral part of the EIR.
This accounting policy relates to the balance sheet captions ‘Deposit liabilities’, ‘Bills payable’, ‘Manager’s checks’, ‘Accrued interest and other expenses’ and ‘Other liabilities’.
Derecognition of Financial Assets and Liabilities Financial assets A financial asset (or, where applicable a part of a financial asset or part of a group of financial assets) is derecognized when:
• the rights to receive cash flows from the asset have expired; or

- 9 -
*SGVMC114803*
• the Group retains the right to receive cash flows from the asset, but has assumed an obligation
to pay them in full without material delay to a third party under a “pass-through” arrangement; or
• the Group has transferred its rights to receive cash flows from the asset and either (a) has transferred substantially all the risks and rewards of the asset, or (b) has neither transferred nor retained the risk and rewards of the asset but has transferred control of the asset.
Where the Group has transferred its rights to receive cash flows from an asset or has entered into a pass-through arrangement, and has neither transferred nor retained substantially all the risks and rewards of the asset nor transferred control of the asset, the asset is recognized to the extent of the Group’s continuing involvement in the asset. Continuing involvement that takes the form of a guarantee over the transferred asset is measured at the lower of the original carrying amount of the asset and the maximum amount of consideration that the Group could be required to repay.
Financial liabilities A financial liability is derecognized when the obligation under the liability is discharged, cancelled or has expired. Where an existing financial liability is replaced by another from the same lender on substantially different terms, or the terms of an existing liability are substantially modified, such an exchange or modification is treated as a derecognition of the original liability and the recognition of a new liability, and the difference in the respective carrying amounts is recognized in the statement of income.
Repurchase and Reverse Repurchase Agreements Securities sold under agreements to repurchase at a specified future date (‘repos’) are not derecognized from the balance sheet. The corresponding cash received, including accrued interest, is recognized in the balance sheet as a loan to the Group, reflecting the economic substance of such transaction. The Group has no repurchase agreements as of December 31, 2010 and 2009.
Conversely, securities purchased under agreements to resell at a specified future date (‘reverse repos’) are not recognized in the balance sheet. The corresponding cash paid, including accrued interest, is recognized in the balance sheet as SPURA, and is considered a loan to the counterparty. The difference between the purchase price and resale price is treated as interest income and is accrued over the life of the agreement using the EIR method.
Impairment of Financial Assets
The Group assesses at each balance sheet date whether there is objective evidence that a financial asset or group of financial assets is impaired. A financial asset or a group of financial assets is deemed to be impaired if, and only if, there is objective evidence of impairment as a result of one or more events that has occurred after the initial recognition of the asset (an incurred ‘loss event’) and that loss event (or events) has an impact on the estimated future cash flows of the financial asset or the group of financial assets that can be reliably estimated. Evidence of impairment may include indications that the borrower or a group of borrowers is experiencing significant financial difficulty, default or delinquency in interest or principal payments, the probability that they will enter bankruptcy or other financial reorganization and where observable data indicate that there is measurable decrease in the estimated future cash flows, such as changes in arrears or economic conditions that correlate with defaults.
Financial assets carried at amortized cost For financial assets carried at amortized cost, the Group first assesses whether objective evidence of impairment exists individually for financial assets that are individually significant, or collectively for financial assets that are not individually significant.

- 10 -
*SGVMC114803*
If there is objective evidence that an impairment loss has been incurred, the amount of loss is measured as the difference between the asset’s carrying amount and the present value of the estimated future cash flows (excluding future credit losses that have not been incurred). The carrying amount of the asset is reduced through use of an allowance account and the amount of loss is charged to the statement of income. Interest income continues to be recognized based on the original EIR of the asset. The financial assets, together with the associated allowance accounts, are written off when there is no realistic prospect of future recovery and all collateral has been realized.
If the Group determines that no objective evidence of impairment exists for individually assessed
financial asset, whether significant or not, it includes the asset in a group of financial assets with similar credit risk characteristics and collectively assesses for impairment. Those characteristics are relevant to the estimation of future cash flows for groups of such assets by being indicative of the debtors’ ability to pay all amounts due according to the contractual terms of the assets being evaluated. Assets that are individually assessed for impairment and for which an impairment loss is, or continues to be, recognized are not included in a collective assessment for impairment.
If, in a subsequent year, the amount of the estimated impairment loss decreases because of an event occurring after the impairment was recognized, the previously recognized impairment loss is reduced by adjusting the allowance account. If a future write-off is later recovered, any amounts formerly charged are credited to ‘Provision for impairment and credit losses’.
The present value of the estimated future cash flows is discounted at the financial asset’s original EIR. If a loan has a variable interest rate, the discount rate for measuring any impairment loss is the current EIR, adjusted for the original credit risk premium. The calculation of the present value of the estimated future cash flows of a collateralized financial asset reflects the cash flows that may result from foreclosure less costs for obtaining and selling the collateral, whether or not foreclosure is probable.
For the purpose of a collective evaluation of impairment, financial assets are grouped on the basis of such credit risk characteristics as industry, collateral type and past-due status.
Future cash flows in a group of financial assets that are collectively evaluated for impairment are estimated on the basis of historical loss experience for assets with credit risk characteristics similar to those in the group. Historical loss experience is adjusted on the basis of current observable data to reflect the effects of current conditions that did not affect the period on which the historical loss experience is based and to remove the effects of conditions in the historical period that do not exist currently. Estimates of changes in future cash flows reflect, and are directionally consistent with changes in related observable data from period to period (such as changes in unemployment rates, property prices, commodity prices, payment status, or other factors that are indicative of incurred losses in the Group and their magnitude). The methodology and assumptions used for estimating future cash flows are reviewed regularly by the Group to reduce any differences between loss estimates and actual loss experience.
Financial assets carried at cost If there is objective evidence that an impairment loss on an unquoted equity instrument that is not carried at fair value because its fair value cannot be reliably measured, or on a derivative asset that is linked to and must be settled by delivery of such an unquoted equity instrument has been incurred, the amount of loss is measured as the difference between the asset’s carrying amount and the present value of estimated future cash flows discounted at the current market rate of return for a similar financial asset.

- 11 -
*SGVMC114803*
Available-for-sale financial assets For AFS financial assets, the Group assesses at each balance sheet date whether there is objective evidence that a financial asset or group of financial assets is impaired.
In the case of equity investments classified as AFS financial assets, this would include a significant or prolonged decline in the fair value of the investments below its cost. Where there is evidence of impairment, the cumulative loss - measured as the difference between the acquisition cost and the current fair value, less any impairment loss on that financial asset previously recognized in the statement of income - is removed from other comprehensive income and recognized in the statement of income. Impairment losses on equity investments are not reversed through the statement of income. Increases in fair value after impairment are recognized directly in the other comprehensive income.
In the case of debt instruments classified as AFS financial assets, impairment is assessed based on the same criteria as financial assets carried at amortized cost. Future interest income is based on the reduced carrying amount and is accrued based on the rate of interest used to discount future cash flows for the purpose of measuring impairment loss. Such accrual is recorded as part of ‘Interest income’ in the statement of income. If, in subsequent year, the fair value of a debt instrument increased and the increase can be objectively related to an event occurring after the impairment loss was recognized in the statement of income, the impairment loss is reversed through the statement of income.
Restructured loans Where possible, the Group seeks to restructure loans rather than to take possession of collateral. This may involve extending the payment arrangements and the agreement of new loan conditions. Once the terms have been renegotiated, the loan is no longer considered past due. Management continuously reviews restructured loans to ensure that all criteria are met and that future payments are likely to occur. The loans continue to be subject to an individual or collective impairment assessment, calculated using the loan’s original EIR. The difference between the recorded value of the original loan and the present value of the restructured cash flows, discounted at the original EIR, is recognized in ‘Provision for impairment and credit losses’ in the statement of income.
Offsetting Financial Instruments Financial assets and financial liabilities are offset and the net amount reported in the balance sheet if, and only if, there is a currently enforceable legal right to offset the recognized amounts and there is an intention to settle on a net basis, or to realize the asset and settle the liability simultaneously. This is not generally the case with master netting agreements, and the related assets and liabilities are presented gross in the balance sheet.
Investments in Associates Associates pertain to all entities over which the Group has significant influence but not control, generally accompanying a shareholding of between 20.00% and 50.00% of the voting rights. In the consolidated financial statements, investments in associates are accounted for under the equity method of accounting.
Under the equity method, an investment in an associate is carried in the balance sheet at cost plus post-acquisition changes in the Group’s share of the net assets of the associate. Goodwill relating to an associate is included in the carrying value of the investments and is not amortized. The statement of income reflects the share of the results of operations of the associate. Where there has been a change recognized directly in the equity of the associate, the Group recognizes its share of any changes and discloses this, when applicable, in the statement of changes in equity.

- 12 -
*SGVMC114803*
When the Group’s share of losses in an associate equals or exceeds its interest in the associate, including any other unsecured receivables, the Group does not recognize further losses, unless it has incurred obligations or made payments on behalf of the associate. Profits or losses resulting from transactions between the Group and an associate are eliminated to the extent of the interest in the associate.
The financial statements of the associate are prepared for the same reporting period as the Parent Company. Where necessary, adjustments are made to bring the accounting policies in line with those of the Group.
In the separate or parent company financial statements, investments in associates are carried at cost, less accumulated impairment in value. Dividends earned on these investments are recognized in the Parent Company’s statement of income as declared by the respective BOD of the investees.
Revenue Recognition Revenue is recognized to the extent that it is probable that the economic benefits will flow to the Group and the revenue can be reliably measured, regardless of when the payment is being made. Revenue is measured at the fair value of the consideration received or receivable, taking into account contractually defined terms of payment and excluding taxes or duty. The Group assesses its revenue arrangements against specific criteria in order to determine if it is acting as principal or agent. The Group has concluded that it is acting as a principal in all of its revenue arrangements. The following specific recognition criteria must also be met before revenue is recognized:
Interest income For all financial instruments measured at amortized cost and interest-bearing financial instruments classified as FVPL and AFS financial assets, interest income is recorded at the EIR, which is the rate that exactly discounts estimated future cash payments or receipts through the expected life of the financial instrument or a shorter period, where appropriate, to the net carrying amount of the financial asset or financial liability. The calculation takes into account all contractual terms of the financial instrument (for example, prepayment options), includes any fees or incremental costs that are directly attributable to the instrument and are an integral part of the EIR, as applicable, but not future credit losses. The adjusted carrying amount is calculated based on the original EIR. The change in carrying amount is recorded as ‘Interest income’.
Once the recorded value of a financial asset or group of similar financial assets has been reduced due to an impairment loss, interest income continues to be recognized using the original EIR applied to the new carrying amount.
Loan fees and service charges Loan commitment fees are recognized as earned over the terms of the credit lines granted to each borrower. Loan syndication fees are recognized upon completion of all syndication activities and where the Group does not have further obligations to perform under the syndication agreement.
Service charges and penalties are recognized only upon collection or accrued where there is a reasonable degree of certainty as to their collectibility.
Dividend income Dividend income is recognized when the Group’s right to receive payment is established.
- 13 -
*SGVMC114803*
Trading and securities gains This represent results arising from trading activities including all gains and losses from changes in fair value of financial assets held for trading and designated at FVPL. It also includes gains and losses realized from sale of AFS financial assets.
Rental income Rental income arising on leased properties is accounted for on a straight-line basis over the lease terms on ongoing leases and is recorded in the statement of income under Miscellaneous income.
Bank Premises, Furniture, Fixtures and Equipment Land is stated at cost less any impairment in value and depreciable properties including buildings, leasehold improvements, and furniture, fixture and equipment are stated at cost less accumulated depreciation and amortization, and any impairment in value. Such cost includes the cost of replacing part of the bank premises, furniture, fixtures and equipment when that cost is incurred and if the recognition criteria are met, but excluding repairs and maintenance costs.
Depreciation and amortization is calculated on the straight-line method over the estimated useful life (EUL) of the depreciable assets as follows:
EUL Buildings 50 years Furniture, fixtures and equipment 3 to 5 years Leasehold improvements Shorter of 6 years or the
related lease terms
The depreciation and amortization method and useful life are reviewed periodically to ensure that the method and period of depreciation and amortization are consistent with the expected pattern of economic benefits from items of bank premises, furniture, fixtures and equipment.
An item of bank premises, furniture, fixtures and equipment is derecognized upon disposal or when no future economic benefits are expected from its use or disposal. Any gain or loss arising on derecognition of the asset (calculated as the difference between the net disposal proceeds and the carrying amount of the asset) is included in the statement of income in the year the asset is derecognized.
Revaluation Increment This account pertains to the balance of the adjustment on land which the Group elected to carry at deemed cost when the Group transitioned to PFRS as of January 1, 2005. The Group decided to close this account which had a balance of P=1.28 billion as of January 1, 2008 to surplus to better reflect the equity accounts of the Group. The adjustment to surplus has no effect on profit or loss and earnings per share for the three years ended in the period ended Decmber 31, 2010.
Investment Properties Initially, investment properties are measured at cost including certain transaction costs. Investment properties acquired through a nonmonetary asset exchange is measured initially at fair value unless (a) the exchange lacks commercial substance or (b) the fair value of neither the asset received nor the asset given up is reliably measurable. Subsequent to initial recognition, investment properties are stated at cost less accumulated depreciation and any accumulated impairment in value.

- 14 -
*SGVMC114803*
Investment properties are derecognized when they have either been disposed of or when the investment properties are permanently withdrawn from use and no future benefit is expected from their disposal. Any gain or loss on the derecognition of an investment property is recognized as ‘Gain on sale of investment properties’ in the statement of income in the year of derecognition.
Expenditures incurred after the investment properties have been put into operation, such as repairs and maintenance costs, are normally charged to income in the period in which the costs are incurred.
Depreciation is calculated on a straight-line basis using the EUL of the building and improvement components of investment properties which ranged from 10 to 20 years from the time of acquisition of the investment properties.
Transfers are made to investment properties when, and only when, there is a change in use evidenced by ending of owner occupation, commencement of an operating lease to another party or ending of construction or development. Transfers are made from investment properties when, and only when, there is a change in use evidenced by commencement of owner occupation or commencement of development with a view to sale.
Business Combinations and Goodwill Business combinations are accounted for using the acquisition method. The cost of an acquisition is measured as the aggregate of the consideration transferred, measured at acquisition date fair value and the amount of any non-controlling interest in the acquiree. For each business combination, the acquirer measures the non-controlling interest in the acquiree either at fair value or at the proportionate share of the acquiree’s identifiable net assets. Acquisition costs incurred are expensed and included in administrative expenses.
When the Group acquires a business, it assesses the financial assets and liabilities assumed for appropriate classification and designation in accordance with the contractual terms, economic circumstances and pertinent conditions as at the acquisition date. This includes the separation of embedded derivatives in host contracts by the acquiree.
If the business combination is achieved in stages, the acquisition date fair value of the acquirer’s previously held equity interest in the acquiree is remeasured to fair value at the acquisition date through profit or loss.
Any contingent consideration to be transferred by the acquirer will be recognized at fair value at the acquisition date. Subsequent changes to the fair value of the contingent consideration which is deemed to be an asset or liability, will be recognized in accordance with IAS 39 either in profit or loss or as a change to other comprehensive income. If the contingent consideration is classified as equity, it should not be remeasured until it is finally settled within equity.
Goodwill is initially measured at cost being the excess of the aggregate of fair value of the consideration transferred and the amount recognized for non-controlling interest over the net identifiable assets acquired and liabilities assumed. If this consideration is lower than the fair value of the net assets of the subsidiary acquired, the difference is recognized in profit or loss.
After initial recognition, goodwill is measured at cost less any accumulated impairment losses. For the purpose of impairment testing, goodwill acquired in a business combination is, from the acquisition date, allocated to each of the Group’s cash-generating units that are expected to benefit from the combination, irrespective of whether other assets or liabilities of the acquiree are assigned to those units.

- 15 -
*SGVMC114803*
Business combinations prior to 1 January 2010 In comparison to the above-mentioned requirements, the following differences applied:
Business combinations were accounted for using the purchase method. Transaction costs directly attributable to the acquisition formed part of the acquisition costs. The non-controlling interest (formerly known as minority interest) was measured at the proportionate share of the acquiree’s identifiable net assets.
Business combinations achieved in stages were accounted for as separate steps. Any additional acquired share of interest did not affect previously recognized goodwill.
When the Group acquired a business, embedded derivatives separated from the host contract by the acquiree were not reassessed on acquisition unless the business combination resulted in a change in the terms of the contract that significantly modified the cash flows that otherwise would have been required under the contract.
Contingent consideration was recognized if, and only if, the Group had a present obligation, the economic outflow was more likely than not and a reliable estimate was determinable. Subsequent adjustments to the contingent consideration were recognized as part of goodwill.
Impairment of Goodwill For the purpose of impairment testing, goodwill acquired in a business combination is, from the date of acquisition, allocated to each of the Group’s cash-generating units, or groups of cash-generating units, that are expected to benefit from the synergies of the combination, irrespective of whether other assets or liabilities of the acquiree are assigned to those units or group of units. Each unit or group of units to which the goodwill is allocated:
• represents the lowest level within the Group at which the goodwill is monitored for internal
management purposes; and • is not larger than a segment determined in accordance with PFRS 8, Segment Reporting.
Where goodwill forms part of a cash-generating unit (or group of cash-generating units) and part of the operation within that unit is disposed of, the goodwill associated with the operation disposed of is included in the carrying amount of the operation when determining the gain or loss on disposal of the operation. Goodwill disposed of in this circumstance is measured based on the relative values of the operation disposed of and the portion of the cash-generating unit retained.
When subsidiaries are disposed of, the difference between the selling price and the net assets plus related OCI (excluding revaluation increment) and unamortized goodwill is recognized in the statement of income.
Intangible Assets Intangible assets include branch licenses resulting from the Parent Company’s acquisition of CBSI (see Note 4).
The branch licenses are initially measured at fair value as of the date of acquisition and are deemed to have an indefinite useful life as there is no foreseeable limit to the period over which they are expected to generate net cash inflows for the Group.

- 16 -
*SGVMC114803*
Intangible assets with indefinite useful life are tested for impairment annually either individually or at the cash generating unit level. Impairment is determined by assessing the recoverable amount of each cash-generating unit (or group of cash-generating units) to which the intangible asset relates. Recoverable amount is higher of the cash-generating unit’s fair value less costs to sell and its value in use. Where the recoverable amount of the cash-generating units is less than its carrying amount, an impairment loss is recognized.
Such intangibles are not amortized. Gains and losses arising from derecognition of an intangible asset are measured as the difference between the net disposal proceeds and the carrying amount of the asset and are recognized in earnings when the asset is derecognized.
Impairment of Nonfinancial Assets At each reporting date, the Group assesses whether there is any indication that its nonfinancial assets (e.g., investment properties and bank premises, furniture, fixtures and equipment, intangible assets) may be impaired. When an indicator of impairment exists or when an annual impairment testing for an asset is required, the Group makes a formal estimate of recoverable amount. Recoverable amount is the higher of an asset’s (or cash-generating unit’s) fair value less costs to sell and its value in use and is determined for an individual asset, unless the asset does not generate cash inflows that are largely independent of those from other assets or groups of assets, in which case the recoverable amount is assessed as part of the cash generating unit to which it belongs. Where the carrying amount of an asset (or cash generating unit) exceeds its recoverable amount, the asset (or cash generating unit) is considered impaired and is written down to its recoverable amount. In assessing value in use, the estimated future cash flows are discounted to their present value using a pre-tax discount rate that reflects current market assessments of the time value of money and the risks specific to the asset (or cash generating unit).
An impairment loss is charged to operations in the year in which it arises.
For nonfinancial assets, excluding goodwill and branch licenses, an assessment is made at each reporting date as to whether there is any indication that previously recognized impairment losses may no longer exist or may have decreased. If such indication exists, the recoverable amount is estimated. A previously recognized impairment loss is reversed only if there has been a change in the estimates used to determine the asset’s recoverable amount since the last impairment loss was recognized. If that is the case, the carrying amount of the asset is increased to its recoverable amount. That increased amount cannot exceed the carrying amount that would have been determined, net of depreciation, had no impairment loss been recognized for the asset in prior years. Such reversal is recognized in the statement of income. After such a reversal, the depreciation expense is adjusted in future years to allocate the asset’s revised carrying amount, less any residual value, on a systematic basis over its remaining life.
Leases The determination of whether an arrangement is, or contains a lease is based on the substance of the arrangement and requires an assessment of whether the fulfillment of the arrangement is dependent on the use of a specific asset or assets and the arrangement conveys a right to use the asset. A reassessment is made after inception of the lease only if one of the following applies:
(a) There is a change in contractual terms, other than a renewal or extension of the arrangement; (b) A renewal option is exercised or extension granted, unless that term of the renewal or
extension was initially included in the lease term; (c) There is a change in the determination of whether fulfillment is dependent on a specified
asset; or (d) There is a substantial change to the asset.

- 17 -
*SGVMC114803*
Where a reassessment is made, lease accounting shall commence or cease from the date when the change in circumstances gave rise to the reassessment for scenarios (a), (c) or (d) above, and at the date of renewal or extension period for scenario (b).
Group as lessee Leases where the lessor retains substantially all the risks and benefits of ownership of the asset are classified as operating leases. Operating lease payments are recognized as an expense in the statement of income on a straight-line basis over the lease term.
Group as lessor Leases where the Group does not transfer substantially all the risk and benefits of ownership of the assets are classified as operating leases. Initial direct costs incurred in negotiating operating leases are added to the carrying amount of the leased asset and recognized over the lease term on the same basis as the rental income. Contingent rents are recognized as revenue in the period in which they are earned.
Pension Benefits The Group has a noncontributory defined benefit retirement plan.
The retirement cost of the Parent Company and its subsidiaries is determined using the projected unit credit method. Under this method, the current service cost is the present value of retirement benefits payable in the future with respect to services rendered in the current period.
The asset recognized in the balance sheet in respect of defined benefit pension plans is the fair value of plan assets at the balance sheet date less present value of the defined benefit obligation, together with adjustments for unrecognized actuarial gains or losses and past service costs. The defined benefit obligation is calculated annually by an independent actuary using the projected unit credit method. The present value of the defined benefit obligation is determined by discounting the estimated future cash outflows using interest rate on government bonds that have terms to maturity approximating the terms of the related retirement liability.
Actuarial gains and losses arising from experience adjustments and changes in actuarial assumptions are credited to or charged against income when the net cumulative unrecognized actuarial gains and losses at the end of the previous period exceeded 10% of the higher of the defined benefit obligation or the fair value of plan assets at that date. These excess gains or losses are recognized over the expected average remaining working lives of the employees participating in the plan.
Past-service costs, if any, are recognized immediately in income, unless the changes to the pension plan are conditional on the employees remaining in service for a specified period of time (the vesting period). In this case, the past-service costs are amortized on a straight-line basis over the vesting period.
The defined benefit asset or liability comprises the present value of the defined benefit obligation less past service costs not yet recognized and less the fair value of plan assets out of which the obligations are to be settled directly. Plan assets are assets that are held by a long-term employee benefit fund or qualifying insurance policies. Plan assets are not available to the creditors of the Group nor can they be paid directly to the Group. Fair value is based on market price information and in the case of quoted securities it is the published bid price. The value of any plan asset recognized is restricted to the sum of any past service costs not yet recognized and the present value of any economic benefits available in the form of refunds from the plan or reductions in the future contributions to the plan.
- 18 -
*SGVMC114803*
Provisions and Contingencies Provisions are recognized when the Group has a present obligation (legal or constructive) as a result of a past event and it is probable that an outflow of resources embodying economic benefits will be required to settle the obligation and a reliable estimate can be made of the amount of the obligation. Where the Group expects some or all of a provision to be reimbursed, for example, under an insurance contract, the reimbursement is recognized as a separate asset but only when the reimbursement is virtually certain. The expense relating to any provision is presented in the statement of income, net of any reimbursement. If the effect of the time value of money is material, provisions are determined by discounting the expected future cash flows at a pre-tax rate that reflects current market assessments of the time value of money and, where appropriate, the risks specific to the liability. Where discounting is used, the increase in the provision due to the passage of time is recognized as an interest expense.
Contingent liabilities are not recognized in the financial statements but are disclosed unless the possibility of an outflow of resources embodying economic benefits is remote. Contingent assets are not recognized but are disclosed in the financial statements when an inflow of economic benefits is probable.
Income Taxes Current Tax Current tax assets and liabilities for the current and prior periods are measured at the amount expected to be recovered from or paid to the taxation authorities. The tax rates and tax laws used to compute the amount are those that are enacted or substantively enacted as of the balance sheet date.
Deferred Tax Deferred tax is provided, using the balance sheet liability method, on all temporary differences at the balance sheet date between the tax bases of assets and liabilities and their carrying amounts for financial reporting purposes.
Deferred tax liabilities are recognized for all taxable temporary differences, including asset revaluations. Deferred tax assets are recognized for all deductible temporary differences, carry forward of unused tax credits from the excess of minimum corporate income tax (MCIT) over the regular corporate income tax (RCIT), and unused net operating loss carryover (NOLCO), to the extent that it is probable that sufficient taxable profit will be available against which the deductible temporary differences and carry forward of unused tax credits from MCIT and unused NOLCO can be utilized. Deferred tax, however, is not recognized on temporary differences that arise from the initial recognition of an asset or liability in a transaction that is not a business combination and, at the time of the transaction, affects neither the accounting income nor taxable income.
Deferred tax liabilities are not provided on non-taxable temporary differences associated with investments in domestic subsidiaries and associates.
The carrying amount of deferred tax assets is reviewed at each balance sheet date and reduced to the extent that it is no longer probable that sufficient taxable profit will be available to allow all or part of the deferred tax asset to be utilized. Unrecognized deferred tax assets are reassessed at each balance sheet date and are recognized to the extent that it has become probable that future taxable profit will allow the deferred tax asset to be recovered.

- 19 -
*SGVMC114803*
Deferred tax assets and liabilities are measured at the tax rates that are applicable to the period when the asset is realized or the liability is settled, based on tax rates (and tax laws) that have been enacted or substantively enacted at the balance sheet date.
Current tax and deferred tax relating to items recognized directly in equity is also recognized in equity and not in the statement of income.
Deferred tax assets and deferred tax liabilities are offset if a legally enforceable right exists to set off current tax assets against current tax liabilities and deferred taxes related to the same taxable entity and the same taxation authority.
Earnings per Share Basic earnings per share (EPS) is computed by dividing net income for the year by the weighted average number of common shares outstanding during the year after giving retroactive effect to stock dividends declared and stock rights exercised during the year, if any.
The Parent Company has no outstanding dilutive potential common shares.
Dividends on Common Shares Dividends on common shares are recognized as a liability and deducted from equity when approved by the respective shareholders of the Parent Company and its subsidiaries. Dividends declared during the year that are approved after the balance sheet date are dealt with as an event after the balance sheet date.
Subsequent Events Any post-year-end event that provides additional information about the Group’s position at the balance sheet date (adjusting event) is reflected in the financial statements. Post-year-end events that are not adjusting events, if any, are disclosed when material to the financial statements.
Segment Reporting The Group’s operating businesses are organized and managed separately according to the nature of the products and services provided, with each segment representing a strategic business unit that offers different products and serves different markets. Financial information on business segments is presented in Note 29. The Group’s revenue producing assets are located in the Philippines (i.e., one geographical location). Therefore, geographical segment information is no longer presented.
Fiduciary Activities Assets and income arising from fiduciary activities together with related undertakings to return such assets to customers are excluded from the financial statements where the Parent Company acts in a fiduciary capacity such as nominee, trustee or agent.
Standards Issued but not yet Effective Standards issued but not yet effective up to the date of issuance of the Group’s financial statements are listed below. This listing is of standards and interpretations issued, which the Group reasonably expects to be applicable at a future date. The Group intends to adopt those standards when they become effective. Except as otherwise indicated, the Group does not expect the adoption of these amended PFRS and Philippine Interpretation to have significant impact on its financial statements.
- 20 -
*SGVMC114803*
PFRS 7, Financial Instruments: Disclosures (Amendments) - Disclosures - Transfers of Financial Assets The amendments of PFRS 7 are effective for annual periods beginning on or after July 1, 2011. The amendments will allow users of financial statements to improve their understanding of transfer transactions of financial assets (for example, securitizations), including understanding the possible effects of any risks that may remain with the entity that transferred the assets. The amendments also require additional disclosures if a disproportionate amount of transfer transactions are undertaken around the end of a reporting period.
PFRS 9, Financial Instruments: Classification and Measurement PFRS 9, as issued in 2010, reflects the first phase of the work on the replacement of PAS 39 and applies to classification and measurement of financial assets and financial liabilities as defined in PAS 39. The standard is effective for annual periods beginning on or after January 1, 2013. In subsequent phases impairment, hedge accounting and derecognition will be addressed. The completion of this project is expected in middle of 2011. The adoption of the first phase of PFRS 9 will have an effect on the classification and measurement of the Group’s financial assets. The Group will quantify the effect in conjunction with the other phases, when issued, to present a comprehensive picture of impact of adoption on the financial position or performance of the Group.
PAS 12, Income Taxes (Amendment) - Deferred Tax: Recovery of Underlying Assets The amended standard is effective for annual periods beginning on or after January 1, 2012. The amendment provides a practical solution to the problem of assessing whether recovery of an asset will be through use or sale. It introduces a presumption that recovery of the carrying amount of an asset will, normally, be through sale.
PAS 24 (Amended), Related Party Disclosures The amended standard is effective for annual periods beginning on or after January 1, 2011. It clarified the definition of a related party to simplify the identification of such relationships and to eliminate inconsistencies in its application. The revised standard introduces a partial exemption of disclosure requirements for government-related entities. Early adoption is permitted for either the partial exemption for government-related entities or for the entire standard.
PAS 32, Financial Instruments: Presentation (Amendment) - Classification of Rights Issues The amendment to PAS 32 is effective for annual periods beginning on or after February 1, 2010 and amended the definition of a financial liability in order to classify rights issues (and certain options or warrants) as equity instruments in cases where such rights are given pro rata to all of the existing owners of the same class of an entity’s non-derivative equity instruments, or to acquire a fixed number of the entity’s own equity instruments for a fixed amount in any currency.
Philippine Interpretation IFRIC-14 (Amendment) - Prepayments of a Minimum Funding Requirement The amendment to Philippine Interpretation IFRIC-14 is effective for annual periods beginning on or after January 1, 2011, with retrospective application. The amendment provides guidance on assessing the recoverable amount of a net pension asset. The amendment permits an entity to treat the prepayment of a minimum funding requirement as an asset.
Philippine Interpretation IFRIC - 15, Agreement for Construction of Real Estate This Interpretation, effective for annual periods beginning on or after January 1, 2012, covers accounting for revenue and associated expenses by entities that undertake the construction of real estate directly or through subcontractors. The Interpretation requires that revenue on construction of real estate be recognized only upon completion, except when such contract qualifies as

- 21 -
*SGVMC114803*
construction contract to be accounted for under PAS 11, Construction Contracts, or involves rendering of services in which case revenue is recognized based on stage of completion. Contracts involving provision of services with the construction materials and where the risks and reward of ownership are transferred to the buyer on a continuous basis will also be accounted for based on stage of completion.
Philippine Interpretation IFRIC-19, Extinguishing Financial Liabilities with Equity Instruments This Interpretation is effective for annual periods beginning on or after July 1, 2010. The interpretation clarifies that equity instruments issued to a creditor to extinguish a financial liability qualify as consideration paid. The equity instruments issued are measured at their fair value. In case that this cannot be reliably measured, the instruments are measured at the fair value of the liability extinguished. Any gain or loss is recognized immediately in profit or loss.
Improvements to PFRSs 2010 Improvements to IFRSs are an omnibus of amendments to PFRSs. The amendments have not been adopted as they become effective for annual periods on or after either July 1, 2010 or January 1, 2011. The Group, however, expects no impact from the adoption of the following amendments on its financial position or performance:
• PFRS 3, Business Combinations • PFRS 7, Financial Instruments: Disclosures • PAS 1, Presentation of Financial Statements • PAS 27, Consolidated and Separate Financial Statements • Philippine Interpretation IFRIC-13, Customer Loyalty Programmes
The Group will assess impact of these amendments on financial position/performance when they become effective.
3. Significant Accounting Judgments and Estimates
The preparation of the financial statements in accordance with PFRS requires the Group to make judgments and estimates that affect the reported amounts of assets, liabilities, income and expenses and disclosure of contingent assets and contingent liabilities. Future events may occur which will cause the judgments and assumptions used in arriving at the estimates to change. The effects of any change in judgments and estimates are reflected in the financial statements as they become reasonably determinable.
Judgments and estimates are continually evaluated and are based on historical experience and other factors, including expectations of future events that are believed to be reasonable under the circumstances.
Judgments Operating leases The Group has entered into commercial property leases on its investment property portfolio. The Group has determined based on the evaluation of the terms and conditions of the arrangements (i.e., the lease does not transfer the ownership of the asset to the lessee by the end of the lease term, the lessee has no option to purchase the asset at a price that is expected to be sufficiently lower than the fair value at the date the option is exercisable and the lease term is not for the major part of the asset’s economic life), that it retains all the significant risks and rewards of ownership of these properties which are leased out as operating leases.

- 22 -
*SGVMC114803*
The Group has entered into leases on premises it uses for its operations. The Group has determined, based on the evaluation of the lease agreement, that all significant risks and rewards of ownership of the properties it leases are not transferrable to the Group.
Fair value of financial instruments Where the fair values of financial assets and financial liabilities recorded on the balance sheet or disclosed in the notes cannot be derived from active markets, they are determined using a variety of valuation techniques acceptable to the market as alternative valuation approaches that include the use of mathematical models. The inputs to these models are taken from observable markets where possible, but where this is not feasible, a degree of judgment is required in establishing fair values. The judgments include considerations of liquidity and model inputs such as correlation and volatility for longer dated derivatives.
HTM financial assets The classification to HTM financial assets requires significant judgment. In making this judgment, the Group evaluates its intention and ability to hold such investments to maturity. If the Group fails to keep these investments to maturity other than in certain specific circumstances - for example, selling an insignificant amount close to maturity - it will be required to reclassify the entire portfolio as part of AFS financial assets. The investments would therefore be measured at fair value and not at amortized cost.
Financial assets not quoted in an active market The Group classifies financial assets by evaluating, among others, whether the asset is quoted or not in an active market. Included in the evaluation on whether a financial asset is quoted in an active market is the determination of whether quoted prices are readily and regularly available, and whether those prices represent actual and regularly occurring market transactions conducted on an arm’s length basis.
Functional currency PAS 21 requires management to use its judgment to determine the entity’s functional currency such that it most faithfully represents the economic effects of the underlying transactions, events and conditions that are relevant to the entity. In making this judgment, the Group considers the following:
a) the currency that mainly influences sales prices for financial instruments and services (this
will often be the currency in which sales prices for its financial instruments and services are denominated and settled);
b) the currency in which funds from financing activities are generated; and c) the currency in which receipts from operating activities are usually retained.
Estimates Impairment losses on loans and receivables The Group reviews its loans and receivables at each reporting date to assess whether an allowance for impairment should be recorded in the balance sheet and any changes thereto in the statement of income. In particular, judgment by management is required in the estimation of the amount and timing of future cash flows when determining the level of allowance required. Such estimates are based on assumptions about a number of factors. Actual results may also differ, resulting in future changes to the allowance.

- 23 -
*SGVMC114803*
In addition to specific allowance against individually significant loans and receivables, the Group also makes a collective impairment assessment on exposures which, although not specifically identified as requiring a specific allowance, have a greater risk of default than when originally granted. The resulting collective allowance is based on any deterioration in the internal rating of the loan or investment since it was granted or acquired. These internal ratings take into consideration factors such as any deterioration in country risk, industry, and technological obsolescence, as well as identified structural weaknesses or deterioration in cash flows.
As of December 31, 2010 and 2009, the allowance for impairment and credit losses on loans and receivables of the Group amounted to P=7.76 billion and P=7.54 billion, respectively (see Notes 9 and 14). Loans and receivables of the Group are carried at P=117.19 billion and P=110.22 billion as of December 31, 2010 and 2009, respectively (see Note 9). As of December 31, 2010 and 2009, the allowance for impairment and credit losses on loans and receivables of the Parent Company amounted to P=7.58 billion and P=7.37 billion, respectively (see Notes 9 and 14). Loans and receivables of the Parent Company are carried at P=116.20 billion and P=109.51 billion as of December 31, 2010 and 2009, respectively (see Notes 9 and 14).
Fair value of financial instruments The fair values of financial instruments that are not quoted in active markets are determined by using valuation techniques. Where valuation techniques (e.g., financial models) are used to determine fair values, they are validated and periodically reviewed by qualified personnel independent of the area that created them. All financial models are certified before they are used and are calibrated to ensure that outputs reflect actual data and comparative market prices. To the extent practical, the financial models use only observable data, however, areas such as credit risk (both own and counterparty), volatilities and correlations require management to make estimates.
Changes in assumptions about these factors could affect reported fair value of financial instruments (see Note 6).
Impairment of AFS equity investments The Group treats AFS equity investments as impaired when there has been a significant or prolonged decline in their fair values below their costs or where other objective evidence of impairment exists. The determination of what is ‘significant’ or ‘prolonged’ requires judgment. The Group treats ‘significant’ generally as 20.00% or more of the original cost of investment, and ‘prolonged’ as being greater than 12 months. In addition, the Group evaluates other factors, including normal volatility in share price for quoted equities and future cash flows and discount factors for unquoted equities.
As of December 31, 2010 and 2009, allowance for impairment losses on AFS equity securities amounted to P=3.25 million and P=150.19 million, respectively, for the Group and P=2.15 million and P=44.46 million, respectively, for the Parent Company (see Note 14). As of December 31, 2010 and 2009, the carrying value of AFS equity securities (included under AFS financial assets) amounted to P=170.03 million and P=218.96 million, respectively, for the Group and P=170.03 million and P=193.31 million, respectively, for the Parent Company (see Note 8).
Recognition of deferred income taxes Deferred tax assets are recognized for all unused tax losses to the extent that it is probable that taxable profit will be available against which the losses can be utilized. Management discretion is required to determine the amount of deferred tax assets that can be recognized, based on the forecasted level of future taxable profits and the related future tax planning strategies.

- 24 -
*SGVMC114803*
The Group believes it will be able to generate sufficient taxable income in the future to utilize its recorded DTA. Taxable income is sourced mainly from interest income from lending activities and earnings from service charge, fees, commissions and trust activities.
As discussed in Note 25, the Group recognized net deferred tax assets as of December 31, 2010 and 2009 amounting to P=912.42 million and P=913.89 million, respectively. The Parent Company’s net deferred tax assets as of December 31, 2010 and 2009 amounted to P=904.40 million and P=907.98 million, respectively. The Group did not set up deferred tax assets on deductible temporary differences amounting to P=5.53 billion and P=3.77 billion as of December 31, 2010 and 2009, respectively (see Note 25). No deferred tax assets have been set up by the Parent Company on deductible temporary differences amounting to P=5.60 billion and P=3.63 billion as of December 31, 2010 and 2009, respectively (see Note 25).
Net plan assets and retirement expense The determination of the Group’s net plan assets and annual retirement expense is dependent on the selection of certain assumptions used in calculating such amounts. Those assumptions include, among others, discount rates, expected returns on plan assets, salary increase rates and price and projected plan asset yields (see Note 22).
In accordance with PFRS, actual results that differ from the Group’s assumptions, subject to the 10.00% corridor test, are accumulated and amortized over future periods and therefore, generally affect the recognized expense and recorded net plan assets in such future periods. While the Group believes that the assumptions are reasonable and appropriate, significant differences between actual experiences and assumptions may materially affect the Group’s net plan assets and annual retirement expense.
As of December 31, 2010 and 2009, the Group has net plan assets amounting to P=245.09 million and P=245.63 million, respectively. As of December 31, 2010 and 2009, the Parent Company has net plan assets amounting to P=246.45 million (see Notes 13 and 22).
Impairment on investment in subsidiaries and associates and other nonfinancial assets The Parent Company assesses impairment on its investments in subsidiaries and associate whenever events or changes in circumstances indicate that the carrying amount of an asset may not be recoverable. Among others, the factors that the Parent Company considers important which could trigger an impairment review on its investments in subsidiaries and associate include the following:
• Deteriorating or poor financial condition; • Recurring net losses; and • Significant changes with an adverse effect on the subsidiary or associate have taken place
during the period, or will take place in the near future, the technological, market, economic, or legal environment in which the subsidiary operates.
The Group also assesses impairment on its nonfinancial assets (e.g., investment properties and bank premises, furniture, fixtures and equipment) and considers the following impairment indicators:
• Significant underperformance relative to expected historical or projected future operating
results; • Significant changes in the manner of use of the acquired assets or the strategy for overall
business; and

- 25 -
*SGVMC114803*
• Significant negative industry or economic trends.
An impairment loss is recognized whenever the carrying amount of an asset exceeds its recoverable amount. The recoverable amount is determined based on the asset’s value in use computation which considers the present value of estimated future cash flows expected to be generated from the continued use of the asset.
The Group’s impairment test for goodwill and branch licenses with indefinite useful lives is based on value in use calculations that use a discounted cash flow model. The cash flows are derived from the budget for the next five years and do not include restructuring activities that the Group is not yet committed to or significant future investments that will enhance the asset base of the cash generating unit being tested. The recoverable amount is most sensitive to the discount rate used for the discounted cash flow model as well as the expected future cash-inflows and the growth rate used for extrapolation purposes (see Note 13).
The Group is required to make estimates and assumptions that can materially affect the carrying amount of the asset being assessed.
The carrying values of the Group and Parent Company’s nonfinancial assets as of December 31, 2010 and 2009 follow:
Consolidated Parent Company 2010 2009 2010 2009 Bank premises, furniture, fixtures and
equipment (Note 11) P=4,837,579,580 P=4,788,969,092 P=4,107,606,504 P=4,123,193,855 Investment properties (Note 12) 3,325,072,088 3,851,634,344 3,182,078,166 3,698,256,363 Branch license (Notes 4 and 13) 477,600,000 477,600,000 450,501,931 450,501,931 Goodwill (Notes 4 and 13) 222,841,201 222,841,201 222,841,201 222,841,201
As of December 31, 2010 and 2009, the total carrying values of the Parent Company’s investment in subsidiaries and associate amounted to P=1.19 billion (see Note 10). No impairment loss was recognized in 2010, 2009 and 2008.
Estimated useful lives of bank premises, furniture, fixture and equipment and investment properties The Group reviews on an annual basis the estimated useful lives of bank premises, furniture, fixtures and equipment and depreciable investment properties based on expected asset utilization as anchored on business plans and strategies that also consider expected future technological developments and market behavior. It is possible that future results of operations could be materially affected by changes in these estimates brought about by changes in the factors mentioned. A reduction in the estimated useful lives of bank premises, furniture, fixtures and equipment and depreciable investment properties would decrease their respective balances and increase the recorded depreciation and amortization expense.
As of December 31, the carrying values of bank premises, furniture, fixtures and equipment and investment properties follow:
Consolidated Parent Company 2010 2009 2010 2009 Bank premises, furniture, fixtures and
equipment (Note 11) P=4,837,579,580 P=4,788,969,092 P=4,107,606,504 P=4,123,193,855 Investment properties (Note 12) 3,325,072,088 3,851,634,344 3,182,078,166 3,698,256,363

- 26 -
*SGVMC114803*
Goodwill The Group conducts an annual review for any impairment in value of the goodwill. Goodwill is written down for impairment where the net present value of the forecasted future cash flows from the business is insufficient to support its carrying value. The Group estimated the discount rate used for the computation of the net present value by reference to industry cost of capital. Future cash flows from the business are estimated based on the theoretical annual income of the cash generating units. Average growth rate was derived from the average increase in annual income during the last 5 years. The recoverable amount of the CGU has been determined based on a value-in-use calculation using cash flow projections from financial budgets approved by senior management covering a five-year period. The pre-tax discount rate applied to cash flow projections is 14.38%. Key assumptions in value-in-use calculation of CGUs are most sensitive to discount rates and growth rates used to project cash flows.
Goodwill amounted to P=222.84 million for the Group and Parent Company as of December 31, 2010 and 2009 (see Notes 4 and 13).
Contingencies The Group is currently involved in various legal proceedings. The estimate of the probable costs for the resolution of these claims has been developed in consultation with outside legal counsels handling the underlying legal cases and is based on thorough analyses of the potential results by the business units involved and top management. The Group currently does not believe that these proceedings will have a material adverse effect on its financial position. It is possible, however, that future results of operations could be materially affected by changes in the estimates or in the effectiveness of the strategies relating to these proceedings (see Note 28).
4. Business Combination
Merger Information On June 21, 2007, the Parent Company and the majority shareholders of CBSI entered into a Memorandum of Agreement (MOA) whereby the former agreed to buy and the latter agreed to sell 87.52% of their equity interest in China Bank Savings for P=1.65 billion.
Under the MOA, the parties agree to place in escrow with the Parent Company the entire amount of the purchase price and all the original certificates of 7,688,252 shares immediately upon the execution of the MOA. CBSI’s majority shareholders shall be allowed to draw from the escrow account the sum equivalent to 20.00% of the purchase price upon execution of the Deed of Assignment of shares. The balance of the purchase price shall be released from escrow in favor of the selling parties upon completion of the due diligence and reconciliation of adjustments except for provisioned amounts. On the other hand, the corresponding CBSI shares shall be released from escrow in favor of the Parent Company.
The Parent Company shall be given two years from the execution of the Deed of Assignment of shares to restore any provisioned amounts to current status or to collect any outstanding loans and other receivables. After the two year period, any agreed provisioning on accounts not restored nor collected shall be deducted from the purchase price and shall be released from escrow in favor of the Parent Company.

- 27 -
*SGVMC114803*
On September 3, 2007, the Parent Company's officers were appointed as members of CBSI's BOD. As of this date, the Parent Company effectively obtained control of CBSI. Subsequent thereto, a tender offer was made to all remaining shareholders of CBSI at the price of P=214.65 per share. A total of 4.30% of CBSI's common shares were subsequently acquired through a tender offer, which expired on January 15, 2008.
Subsequently on February 6, 2008, the BOD of the Parent Company authorized the Bank to acquire remaining CSBI shares from shareholders that were unable to tender their shares within the tender offer period. Additional 0.03% (P=0.47 million) and 0.73% (P=0.64 million) of CBSI common shares were consequently acquired in 2010 and 2009, respectively, bringing the Parent Company’s interest as defined under PFRS 3 to 95.08% and 95.06% as of December 31, 2010 and 2009, respectively.
The acquisition resulted in recognition of goodwill determined as follows:
Total cost of acquisition: Cost to acquire 87.52% P=1,650,283,292 Cost to acquire 4.30% 84,689,943 1,734,973,235 Less: Fair value of net assets acquired 1,512,132,034 Goodwill P=222,841,201
The goodwill recognized by the Parent Company can be attributed to factors such as increase in geographical presence and customer base due to branches acquired.
Cash flow on acquisition follows:
Cash and cash equivalents acquired from CBSI* P=923,858,346 Cash paid (1,174,960,789) Net cash outflow (P=251,102,443)
* Includes Cash and other cash items, Due from BSP and Due from other banks.
Other costs incurred from the acquisition such as legal, audit and other professional fees are not material to the financial statements.
Change in Corporate Name On October 3, 2007, the BOD of the Parent Company granted approval to use, appropriate and register the name CBSI. as the corporate name and CBSI as the business name/trade name of The Manila Banking Corporation (TMBC). The move is subject to the retention of ownership by the Parent Company of the majority equity of CBSI or its successor-in-interest and to the approval of the regulators. On July 16, 2008, the BSP and the Securities and Exchange Commission (SEC) approved the change in names.

- 28 -
*SGVMC114803*
5. Financial Instrument Categories
The following table presents the total carrying amount of the Group’s and Parent Company’s financial instruments per category:
Consolidated Parent Company 2010 2009 2010 2009 Financial assets Cash and other cash items P=6,436,427,163 P=5,795,456,440 P=6,362,296,658 P=5,756,920,133 Financial assets at FVPL 5,940,893,137 4,941,094,347 5,940,893,137 4,941,094,347 AFS financial assets 51,056,967,596 45,469,945,900 50,470,093,918 44,720,167,378 HTM financial assets 18,549,752,774 22,061,384,803 18,466,572,774 21,978,204,803 Loans and receivables: Due from BSP 37,124,917,961 11,621,324,385 37,053,152,975 11,553,930,023 Due from other banks 5,918,907,525 6,770,243,850 5,970,000,543 6,761,701,623 Interbank loans receivable and SPURA 542,000,000 11,983,000,000 50,000,000 11,848,000,000 Loans and receivables - net 117,185,910,049 110,219,455,248 116,201,862,888 109,514,922,954 Accrued interest receivable 1,921,776,073 2,118,893,167 1,905,920,746 2,091,795,107 Other assets* 2,291,150,374 2,026,038,719 2,065,684,300 1,839,786,173 164,984,661,982 144,738,955,369 163,246,621,452 143,610,135,880 Total financial assets P=246,968,702,652 P=223,006,836,859 P=244,486,477,939 P=221,006,522,541
Consolidated Parent Company 2010 2009 2010 2009 Financial liabilities Other financial liabilities: Deposit liabilities P=213,041,609,453 P=193,290,039,246 P=210,986,504,512 P=191,799,345,371 Bills payable 3,058,243,162 5,785,671,652 3,058,243,162 5,785,671,652 Manager’s checks 340,516,064 453,821,513 304,438,108 433,396,469 Accrued interest and other expenses 1,973,594,528 1,863,118,162 1,946,895,772 1,834,724,666 Other liabilities 2,293,664,901 1,925,945,933 2,180,979,932 1,816,069,096 220,707,628,108 203,318,596,506 218,477,061,486 201,669,207,254 Financial liabilities at FVPL:
Derivative Liabilities 1,204,881,662 338,810,138 1,204,881,662 338,810,138 Total financial liabilities P=221,912,509,770 P=203,657,406,644 P=219,681,943,148 P=202,008,017,392 * Other assets excludes Net plan assets and Creditable withholding taxes (see Note 13).
6. Fair Value Measurement
The table below presents a comparison of carrying amounts and estimated fair values of all of the Group’s and Parent Company’s financial instruments as of December 31:
Consolidated 2010 2009 Carrying Value Fair Value Carrying Value Fair Value Financial Assets Cash and other cash items P=6,436,427,163 P=6,436,427,163 P=5,795,456,440 P=5,795,456,440 Due from BSP 37,124,917,961 37,124,917,961 11,621,324,385 11,621,324,385 Due from other banks 5,918,907,525 5,918,907,525 6,770,243,850 6,770,243,850 Interbank loans receivable and SPURA 542,000,000 542,000,000 11,983,000,000 11,983,000,000 Financial assets at FVPL Held-for-trading Treasury notes 2,473,765,465 2,473,765,465 1,208,687,841 1,208,687,841 Government bonds 2,405,612,065 2,405,612,065 1,005,379,293 1,005,379,293 Treasury bills 359,705,660 359,705,660 1,149,294,187 1,149,294,187 Private bonds and commercial papers 344,478,918 344,478,918 637,134,653 637,134,653 Derivative assets 357,331,029 357,331,029 710,776,473 710,776,473 Designated at FVPL – – 229,821,900 229,821,900
(Forward)

- 29 -
*SGVMC114803*
Consolidated 2010 2009 Carrying Value Fair Value Carrying Value Fair Value AFS financial assets Quoted: Government bonds P=44,585,806,199 P=44,585,806,199 P=40,013,927,214 P=40,013,927,214 Private bonds 680,326,166 680,326,166 532,481,391 532,481,391 Equities 150,615,066 150,615,066 173,898,977 173,898,977 Unquoted:
Credit-linked notes (host) 4,416,367,876 4,416,367,876 4,604,553,996 4,604,553,996 Private bonds and commercial papers 1,204,439,584 1,204,439,584 100,019,655 100,019,655 Equities 19,412,705 19,412,705 45,064,667 45,064,667 HTM financial assets Government bonds 18,128,972,171 21,280,151,473 21,707,922,526 24,401,207,474 Private bonds 420,780,603 490,381,790 353,462,277 394,616,334 Loans and receivables Loans and discounts Corporate lending - net 93,951,276,444 92,801,531,182 87,392,694,889 87,528,485,933 Consumer lending - net 12,933,120,737 12,804,534,343 13,854,403,474 13,504,824,970 Others - net 124,909,822 123,673,127 147,873,107 141,682,427
Customers’ liabilities under letters of credit or trust receipt 8,635,295,994 8,635,295,995 6,499,574,787 6,499,574,787
Bills purchased 1,541,307,052 1,541,307,052 2,324,908,991 2,324,908,991 Accrued interest receivable 1,921,776,073 1,921,776,073 2,118,893,167 2,118,893,167 Other assets* 2,291,150,374 2,168,811,645 2,026,038,719 1,908,808,219 Total financial assets P=246,968,702,652 P=248,787,576,062 P=223,006,836,859 P=225,404,067,224 Financial Liabilities Deposit liabilities P=213,041,609,453 P=213,641,130,042 P=193,290,039,246 P=193,663,936,136 Bills payable 3,058,243,162 2,960,372,680 5,785,671,652 5,769,140,064 Manager’s checks 340,516,064 340,516,064 453,821,513 453,821,513 Accrued interest and other expenses 1,973,594,528 1,973,594,528 1,863,118,162 1,863,118,162 Derivative liabilities 1,204,881,662 1,204,881,662 338,810,138 338,810,138 Other liabilities 2,293,664,901 2,293,423,964 1,925,945,933 1,925,945,933 Total financial liabilities P=221,912,509,770 P=222,413,918,940 P=203,657,406,644 P=204,014,771,946
* Other assets excludes Net plan assets and Creditable withholding tax (see Note 13).
Parent Company 2010 2009 Carrying Value Fair Value Carrying Value Fair Value Financial Assets Cash and other cash items P=6,362,296,658 P=6,362,296,658 P=5,756,920,133 P=5,756,920,133 Due from BSP 37,053,152,975 37,053,152,975 11,553,930,023 11,553,930,023 Due from other banks 5,970,000,543 5,970,000,543 6,761,701,623 6,761,701,623 Interbank loans receivable and SPURA 50,000,000 50,000,000 11,848,000,000 11,848,000,000 Financial assets at FVPL Held-for-trading Treasury notes 2,473,765,465 2,473,765,465 1,208,687,841 1,208,687,841 Government bonds 2,405,612,065 2,405,612,065 1,005,379,293 1,005,379,293 Treasury bills 359,705,660 359,705,660 1,149,294,187 1,149,294,187 Private bonds and commercial papers 344,478,918 344,478,918 637,134,653 637,134,653 Derivative assets 357,331,029 357,331,029 710,776,473 710,776,473 Designated at FVPL – – 229,821,900 229,821,900 AFS financial assets Quoted: Government bonds 43,998,932,521 43,998,932,521 39,289,800,654 39,289,800,654 Private bonds 680,326,166 680,326,166 532,481,391 532,481,391 Equities 150,615,066 150,615,066 173,898,977 173,898,977 Unquoted:
Credit-linked notes (host) 4,416,367,876 4,416,367,876 4,604,553,996 4,604,553,996 Private bonds and commercial papers 1,204,439,584 1,204,439,584 100,019,655 100,019,655 Equities 19,412,705 19,412,705 19,412,705 19,412,705 HTM financial assets Government bonds 18,128,972,171 21,280,151,473 21,624,742,526 24,316,890,919 Private bonds 337,600,603 404,862,856 353,462,277 394,616,334
(Forward)

- 30 -
*SGVMC114803*
Parent Company 2010 2009 Carrying Value Fair Value Carrying Value Fair Value Loans and receivables Loans and discounts Corporate Lending – net P=93,462,858,239 P=92,313,112,978 P=86,979,050,038 P=86,963,004,773 Consumer Lending – net 12,442,732,198 12,314,145,804 13,588,814,176 13,239,672 Others – net 119,669,405 118,432,711 122,574,962 116,384,282 Customers’ liabilities under letters of
credit or trust receipt 8,635,295,994 8,635,295,995 6,499,574,787 6,499,574,787 Bills purchased 1,541,307,052 1,541,307,052 2,324,908,991 2,324,908,991 Accrued interest receivable 1,905,920,746 1,905,920,746 2,091,795,107 2,091,795,107 Other assets * 2,065,684,300 2,013,395,853 1,839,786,173 1,747,796,864 Total financial assets P=244,486,477,939 P=246,373,062,699 P=221,006,522,541 P=210,050,025,233 Financial Liabilities Deposit liabilities P=210,986,504,512 P=211,586,025,101 P=191,799,345,371 P=192,173,242,262 Bills payable 3,058,243,162 2,960,372,680 5,785,671,652 5,769,140,064 Manager’s checks 304,438,108 304,438,108 433,396,469 433,396,469 Accrued interest and other expenses 1,946,895,772 1,946,895,772 1,834,724,666 1,834,724,666 Derivative liabilities 1,204,881,662 1,204,881,662 338,810,138 338,810,138 Other liabilities 2,180,979,932 2,180,979,932 1,816,069,096 1,816,069,096 Total financial liabilities P=219,681,943,148 P=220,183,593,255 P=202,008,017,392 P=202,365,382,695
* Other assets excludes Net plan assets and Creditable withholding tax (see Note 13). The methods and assumptions used by the Group and Parent Company in estimating the fair
values of the financial instruments follow:
Cash and other cash items, due from BSP and other banks, interbank loans receivable and securities purchased under agreements to resell and accrued interest receivable - The carrying amounts approximate their fair values in view of the relatively short-term maturities of these instruments.
Debt securities - Fair values are generally based on quoted market prices. If the market prices are not readily available, fair values are estimated using either values obtained from independent parties offering pricing services or adjusted quoted market prices of comparable investments or using the discounted cash flow methodology.
Equity securities - For publicly traded equity securities, fair values are based on quoted prices published in the Philippine equity markets. For unquoted equity securities for which no reliable basis for fair value measurement is available, these are carried at cost net of impairment, if any.
Loans and receivables - Fair values of loans and receivables are estimated using the discounted cash flow methodology, using the Group’s current incremental lending rates for similar types of loans and receivables.
Accounts receivable and RCOCI included in other assets - Quoted market prices are not readily available for these assets. These are reported at cost and are not significant in relation to the Group’s total portfolio of securities.
Sales contracts receivable included in other assets - Fair values of sales contracts receivables are estimated using the discounted cash flow methodology, using the Group’s current incremental lending rates for similar types of receivables.
Derivative instruments (included under FVPL) - Fair values are estimated based on quoted market prices provided by independent parties or accepted valuation models (either based on discounted cash flow techniques or option pricing models, as applicable).

- 31 -
*SGVMC114803*
Bifurcated embedded derivatives (included under Derivative Assets) - Fair values are estimated based on a valuation model from Bloomberg using inputs provided by counterparty banks.
Deposit liabilities (time, demand and savings deposits) - Fair values of time deposits are estimated using the discounted cash flow methodology, using the Group’s current incremental borrowing rates for similar borrowings with maturities consistent with those remaining for the liability being valued. For demand and savings deposits, carrying amounts approximate fair values considering that these are currently due and demandable.
Bills payable - Fair values are estimated using the discounted cash flow methodology using the current incremental borrowing rates for similar borrowings with maturities consistent with those remaining for the liability being valued.
Manager’s checks, Accrued interest and other expenses - Carrying amounts approximate fair values due to the short-term nature of the accounts.
Fair Value Hierarchy
The Group uses the following hierarchy for determining and disclosing the fair value of financial instruments by valuation technique:
Level 1: quoted prices in active markets for identical assets or liabilities; Level 2: inputs other than quoted prices included in Level 1 that are observable for the asset or
liability, either directly (as prices) or indirectly (derived from prices); and Level 3: inputs that are not based on observable market data or unobservable inputs.
As of December 31, 2010 and 2009, the fair value hierarchy of the Group’s and Parent Company’s financial instruments measured at fair values are presented below:
Consolidated 2010 Level 1 Level 2 Level 3 Total Financial assets at FVPL Held-for-trading: Treasury notes P=2,473,765,465 P=– P=– P=2,473,765,465 Government bonds 2,405,612,065 – – 2,405,612,065 Treasury bills 359,705,660 – – 359,705,660 Private bonds and commercial papers 344,478,918 – – 344,478,918 Derivative assets – 357,331,029 – 357,331,029 AFS financial assets Government bonds 44,585,806,199 – – 44,585,806,199 Quoted equity shares 150,615,066 – – 150,615,066 Credit-linked notes (host) – 4,416,367,876 – 4,416,367,876 Private bonds and commercial
papers – net 1,810,079,510 74,686,240 – 1,884,765,750 Financial liabilities at FVPL Derivative liabilities – 1,204,881,662 – 1,204,881,662 P=52,130,062,883 P=6,053,266,807 P=– P=58,183,329,690

- 32 -
*SGVMC114803*
Consolidated 2009 Level 1 Level 2 Level 3 Total Financial assets at FVPL Held-for-trading: Treasury notes P=1,208,687,841 P=– P=– P=1,208,687,841 Treasury bills 1,149,294,187 – – 1,149,294,187 Government bonds 1,005,379,293 – – 1,005,379,293 Private bonds and commercial papers 637,134,653 – – 637,134,653 Derivative assets – 710,776,473 – 710,776,473 Designated at FVPL – 229,821,900 – 229,821,900 AFS financial assets Government bonds 40,013,927,214 – – 40,013,927,214 Quoted equity shares 173,898,977 – – 173,898,977 Credit-linked Notes (host) – 4,604,553,996 – 4,604,553,996 Private bonds and commercial
papers - net 532,481,391 100,019,655 – 632,501,046 Financial liabilities at FVPL Derivative liabilities – 338,810,138 – 338,810,138 P=44,720,803,556 P=5,983,982,162 P=– P=50,704,785,718
Parent Company 2010 Level 1 Level 2 Level 3 Total Financial assets at FVPL Held-for-trading: Treasury notes P=2,473,765,465 P=– P=– P=2,473,765,465 Government bonds 2,405,612,065 – – 2,405,612,065 Treasury bills 359,705,660 – – 359,705,660 Private bonds and commercial papers 344,478,918 – – 344,478,918 Derivative assets – 357,331,029 – 357,331,029 AFS financial assets Government bonds 43,998,932,521 – – 43,998,932,521 Quoted equity shares 150,615,066 – – 150,615,066 Credit-linked Notes (host) – 4,416,367,876 – 4,416,367,876 Private bonds and commercial
papers - net 1,810,079,510 74,686,240 – 1,884,765,750 Financial liabilities at FVPL Derivative liabilities – 1,204,881,662 – 1,204,881,662 P=51,543,189,205 P=6,053,266,807 P=– P=57,596,456,012
Parent Company 2009 Level 1 Level 2 Level 3 Total Financial assets at FVPL Held-for-trading: Treasury notes P=1,208,687,841 P=– P=– P=1,208,687,841 Treasury bills 1,149,294,187 – – 1,149,294,187 Government bonds 1,005,379,293 – – 1,005,379,293 Private bonds and commercial papers 637,134,653 – – 637,134,653 Derivative assets – 710,776,473 – 710,776,473 Designated at FVPL – 229,821,900 – 229,821,900 AFS financial assets Government bonds 39,289,800,654 – – 39,289,800,654 Quoted equity shares 173,898,977 – – 173,898,977 Credit-Linked Notes (host) – 4,604,553,996 – 4,604,553,996 Private bonds and commercial
papers - net 532,481,391 100,019,655 – 632,501,046 Financial liabilities at FVPL Derivative liabilities – 338,810,138 – 338,810,138 P=43,996,676,996 P=5,983,982,162 P=– P=49,980,659,158

- 33 -
*SGVMC114803*
There were no transfers between Level 1 and Level 2 fair value measurements and no transfers into and out of Level 3 fair value measurements in 2010 and 2009.
7. Financial Risk Management Objectives and Policies
The Group’s activities are principally related to the profitable use of financial instruments. Risks are inherent in these activities but are managed by the Group through a rigorous, comprehensive and continuous process of identification, measurement, monitoring and mitigation of these risks, partly through the effective use of risk and authority limits, process controls and monitoring, and independent controls. As reflected in its corporate actions and organizational improvements, the Group has placed due importance to expanding and strengthening its risk management process and considers it as a vital component to the Group’s continuing profitability and financial stability. Central to the Group’s risk management process is its adoption of a risk management program intended to avoid unnecessary risks, manage and mitigate unavoidable risks and maximize returns from taking acceptable risks necessary to sustain its business viability and good financial position in the market.
The key financial risks that the Group faces are: credit risk, market risk (i.e. interest rate risk, foreign currency risk and equity price risk) and liquidity risk. The Group’s risk management objective is primarily focused on controlling and mitigating these risks. The Parent Company and its subsidiaries manage their respective financial risks separately. The subsidiaries, particularly CBSI, have their own risk management processes but are structured similar to that of the Parent Company. To a certain extent, the respective risk management programs and objectives are the same across the Group. The gravity of the risks, the magnitude of the financial instruments involved, and regulatory requirements are primary considerations to the scope and extent of the risk management processes put in place for the subsidiaries.
Risk Management Structure
The BOD of the Parent Company is ultimately responsible for the oversight of the Parent Company’s risk management process. On the other hand, the risk management processes of the subsidiaries are the separate responsibilities of their respective BOD. The BOD created a separate board-level independent committee with explicit authority and responsibility for managing and monitoring risks.
The BOD has delegated to the Risk Management Committee (RMC) the implementation of the
risk management process which includes, among others, the development of various risk strategies and principles, control guidelines policies and procedures, implementation of risk measurement tools, monitoring of key risk indicators, and the imposition and monitoring of risk limits. The RMC is composed of five members of the BOD.
The Risk Management Group (RMG) is the direct support of the RMC in the day-to-day risk
management and the implementation of the risk management strategies approved by the RMC. The implementation cuts across all departments of the Parent Company and involves all of the Parent Company’s financial instruments, whether “on-books” or “off books.” The RMG is likewise responsible for monitoring the implementation of specific risk control procedures and enforcing compliance thereto. The RMG is also directly involved in the day-to-day risk measurement and monitoring to make sure that the Parent Company, in its transactions and dealings, engages only in acceptable and manageable financial risks. The RMG also ensures that risk measurements are accurately and completely captured on a timely basis in the management reporting system of the Parent Company. The RMG regularly reports the results of the risk measurements to the RMC. The RMG is headed by the Chief Risk Officer (CRO).

- 34 -
*SGVMC114803*
Apart from RMG, each business unit has created and put in place various process controls which
ensure that all the external and internal transactions and dealings of the unit are in compliance with the unit’s risk management objectives.
The Internal Audit Division also plays a crucial role in risk management primarily because it is independent of the business units and reports exclusively to the Audit Committee which in turn is comprised of independent directors. The Internal Audit Division focuses not on the implementation of controls but on ensuring that adequate controls are in place and on monitoring compliance to controls. The regular audit covers all processes and controls, including those under the risk management framework handled by the RMG. The audit of these processes and controls is undertaken at least annually. The audit results and exceptions, including recommendations for their resolution or improvement, are discussed initially with the business units concerned before these are presented to the Audit Committee.
Risk Management Reporting The CRO and other members of the RMG report to the RMC and to the Management Committee
(ManCom) on a monthly and a weekly basis, respectively. The CRO reports on key risk indicators and specific risk management issues that would need resolution from top management. This is undertaken after the risk issues and key risk indicators have been discussed with the business units concerned.
The key risk indicators were formulated on the basis of the financial risks faced by the Parent
Company. The key risk indicators contain information from all business units that provide measurements on the level of the risks taken by the Parent Company with its transactions, products and financial structure. Among others, the report on key risk indicators includes information on the Parent Company’s aggregate credit exposure, credit metric forecasts, hold limit exceptions, VaR analysis, utilization of market and credit limits, liquidity ratios, overall loan loss provisioning and risk profile changes. Loan loss provisioning and credit limit utilization are however discussed in more detail in the Credit Committee. On a monthly basis, detailed reporting of industry, customer and geographic risks is included in the discussion with the RMC and ManCom. A comprehensive risk report is submitted to the BOD every quarter for an overall assessment of the level of risks taken by the Parent Company.
The Parent Company has acquired a new treasury operations system which will greatly improve
its risk measurement and reporting particularly those related to treasury products. To date, the Parent Company is still in the process of conversion to the new treasury system.
On the other hand, the Chief Internal Auditor reports to the Audit Committee on a monthly basis
on the results of branch or business unit audits and for the resolution of pending but important internal audit issues.
Risk Mitigation The Parent Company uses derivatives, structured products and other financial instruments to
manage exposures resulting from changes in interest rates, foreign currencies, equity risks, credit risks, and exposures arising from forecast transactions. However, the nature and extent of use of these financial instruments to mitigate risks are limited to those allowed by the BSP for the Parent Company and its subsidiaries.
To further mitigate risks throughout its different business units, the Parent Company created new risk management policies and made vast improvements to existing policies (e.g., The Risk Management Manual, Operational Risk Management Policy Manual, and Product Approval Process Manual). These policies further serve as the framework and set of guidelines in the

- 35 -
*SGVMC114803*
creation or revisions of operating policies and manuals for each business unit. In the process design and implementation, process controls are preferred over detection controls. Clear delineation of responsibilities and separation of incompatible duties among officers and staff as well as among business units are reiterated in these policies. To the extent possible, reporting and accounting responsibilities are segregated from units directly involved in operations and front line activities (i.e., players must not be scorers). This is to improve the credibility and accuracy of management information. Any inconsistencies in the operating policies and manuals with the risk framework established by risk management policies created by the RMG are taken up and resolved in the RMC and ManCom.
Based on the approved Operational Risk Assessment Program, RMG spearheaded the bank wide (all Head Office units and branches) risk identification and self-assessment process. This would enable determination of priority risk areas, assessment of mitigating controls in place, and institutionalization of additional measures to ensure a controlled operating environment.
RMG was also mandated to maintain and update the Bank’s Centralized Loss Database wherein
all reported incidents of losses shall be encoded to enable assessment of weaknesses in the processes and come up with viable improvements to avoid recurrence.
Monitoring and controlling risks are primarily performed based on various limits established by the top management covering the Group’s transactions and dealings. These limits reflect the Group’s business strategies and market environment as well as the levels of risks that the Group is willing to tolerate, with additional emphasis on selected industries. In addition, the Parent Company monitors and measures the overall risk bearing capacity in relation to the aggregate risk exposure across all risk types and activities.
The Group’s Management identified the need for an asset-liability management (ALM)
application to strategically manage risks arising from mismatches between the bank’s assets and liabilities, particularly in the area of interest rate and liquidity risk. An ALM would support high level decisions with regards to funds pricing and resource allocation.
In 2009, the Parent Company’s Technology Steering Committee approved Management’s
recommendation to convene an ALM Task Force to determine the Bank’s requirements and selection criteria as well as evaluate proposals from software providers. The ALM project is still in its initial stages: requests for proposal were sent out to our three short listed solutions providers and this will be followed by an assessment of their submitted proof of concept.
BSP issued Circular 639 dated January 15, 2009 which mandated the use of the Internal Capital
Adequacy Assessment Process (ICAAP) by all universal and commercials banks to determine their minimum required capital relative to their business risk exposures. In this regard, the Board approved the engagement of the services of a consultant to assist in the Bank-wide implementation and embedding of the ICAAP, as provided for under Pillar 2 of Basel II and BSP Circular 639.
As of December 31, 2009, the Parent Company has completed its top-down risk prioritization and
has finalized the top risks of the Bank based on the results of the Risk Self-assessment Survey and the voting conducted among selected members of the BOD and Senior Management. In addition, ICAAP Technical Committees have been designated per risk area and have been regularly meeting since October 2009.

- 36 -
*SGVMC114803*
Excessive Risk Concentration Concentrations arise when a number of counterparties are engaged in similar business activities,
or activities in the same geographic region, or have similar economic features that would cause their ability to meet contractual obligations to be similarly affected by changes in economic, political or other conditions. Concentrations indicate the relative sensitivity of the Parent Company's performance to developments affecting a particular industry or geographical location.
In order to avoid excessive concentrations of risk, the Parent Company's policies and procedures
include specific guidelines focusing on maintaining a diversified portfolio. Identified concentrations of credit risks are controlled and managed accordingly.
Credit Risk
Credit Risk and Concentration of Assets and Liabilities and Off-Balance Sheet Items Credit risk is the risk of financial loss due to one party to a financial product failing to discharge
an obligation. The Group faces potential credit risks every time it extends funds to borrowers, commits funds to counterparties, guarantees the paying performance of its clients, invests funds to issuers (i.e., investment securities issued by either sovereign or corporate entities) or enters into either market-traded or over-the-counter derivatives, through implied or actual contractual agreements (i.e., on or off-balance sheet exposures). The Group manages its credit risk at various levels (i.e., strategic level, portfolio level down to individual credit or transaction).
The Group has risk limits setting for purposes of monitoring and managing credit risk from individual counterparties and groups of counterparties. It also conducts periodical assessment of the creditworthiness of its counterparties. In addition, the Group obtains collateral where appropriate, enters into master netting agreements and collateral arrangements with counterparties, and limits the duration of exposures.
In compliance with BSP requirements, the Group established in March 2005 an internal Credit
Risk Rating System (CRRS) for the purpose of measuring credit risk for corporate borrowers in a consistent manner, as accurately as possible, and thereafter uses the risk information for business and financial decision making. The CRRS covers corporate borrowers with asset size of above P=15.00 million, requiring financial statements from 2005 onwards to be audited by SEC-accredited auditing firms.
The CRRS was designed within the technical requirements defined under BSP Circular No. 439. The System has two components, namely: a) Borrower Risk Rating (BRR) which provides an assessment of the creditworthiness of the borrower, without considering the proposed facility and security arrangements, and b) Loan Exposure Rating (LER) which provides an assessment of the proposed facilities as mitigated or enhanced by security arrangements. The CRRS rating scale consists of ten grades, six of which fall under unclassified accounts, with the remaining four falling under classified accounts in accordance with regulatory provisioning guidelines. To date, the Parent Company is in the process of developing an internal credit system in preparation for the Advanced Measurement Approach for credit risk under Basel II.
Credit risk in respect of derivative financial products is limited to those with positive fair values,
which are included under Financial Assets at FVPL (see Note 8). As a result, the maximum credit risk, without taking into account the fair value of any collateral and netting agreements, is limited to the amounts on the balance sheet plus commitments to customers such as unused commercial letters of credit, outstanding guarantees and others as disclosed in Note 28 to the financial statements.

- 37 -
*SGVMC114803*
The distribution of the Group’s and Parent Company’s assets, liabilities, and credit commitment
items (see Note 28) by geographic region as of December 31, 2010 and 2009 (in millions) follows:
Consolidated 2010 2009
Assets Liabilities Credit
Commitments Assets Liabilities Credit
Commitments Geographic Region:
Philippines P=223,972 P=220,482 P=10,160 P=205,216 P=202,588 P=8,382 Asia 3,788 396 3,790 1,513 367 2,070 Europe 258 150 354 413 196 815 United States 12,494 885 15 10,069 506 596 Others 20 – 12 – – –
P=240,532 P=221,913 P=14,331 P=217,211 P=203,657 P=11,863
Parent Company 2010 2009
Assets Liabilities Credit
Commitments Assets Liabilities Credit
Commitments Geographic Region:
Philippines P=221,569 P=218,251 P=10,160 P=203,383 P=201,067 P=8,382 Asia 3,788 396 3,790 1,513 367 2,070 Europe 258 150 354 413 196 815 United States 12,489 885 15 9,941 378 596 Others 20 – 12 – – –
P=238,124 P=219,682 P=14,331 P=215,250 P=202,008 P=11,863
Information on credit concentration as to industry of loans and receivables is presented in Note 9
to the financial statements.
Maximum exposure to credit risk The table below shows the gross maximum exposure to on- and off-balance sheet credit risk
exposures (including derivatives) of the Group and Parent Company, without considering the effects of collateral, credit enhancements and other credit risk mitigation techniques:
Consolidated Parent Company 2010 2009 2010 2009 Financial Assets Due from BSP P=37,124,917,961 P=11,621,324,385 P=37,053,152,975 P=11,553,930,023 Due from other banks 5,918,907,525 6,770,243,850 5,970,000,543 6,761,701,623 Interbank loans receivable and SPURA 542,000,000 11,983,000,000 50,000,000 11,848,000,000 Financial assets at FVPL Held-for-trading Treasury notes 2,473,765,465 1,208,687,841 2,473,765,465 1,208,687,841 Government bonds 2,405,612,065 1,005,379,293 2,405,612,065 1,005,379,293 Treasury bills 359,705,660 1,149,294,187 359,705,660 1,149,294,187 Private bonds and commercial papers 344,478,918 637,134,653 344,478,918 637,134,653 Derivative assets 357,331,029 710,776,473 357,331,029 710,776,473 Designated at FVPL – 229,821,900 – 229,821,900 AFS financial assets Quoted: Government bonds 44,585,806,199 40,013,927,214 43,998,932,521 39,289,800,654 Private bonds 680,326,166 532,481,391 680,326,166 532,481,391 Equities 150,615,066 173,898,977 150,615,066 173,898,977 Unquoted:
Credit Linked Notes (host) 4,416,367,876 4,604,553,996 4,416,367,876 4,604,553,996 Private bonds and commercial papers 1,204,439,584 100,019,655 1,204,439,584 100,019,655 Equities 19,412,705 45,064,667 19,412,705 19,412,705
(Forward)
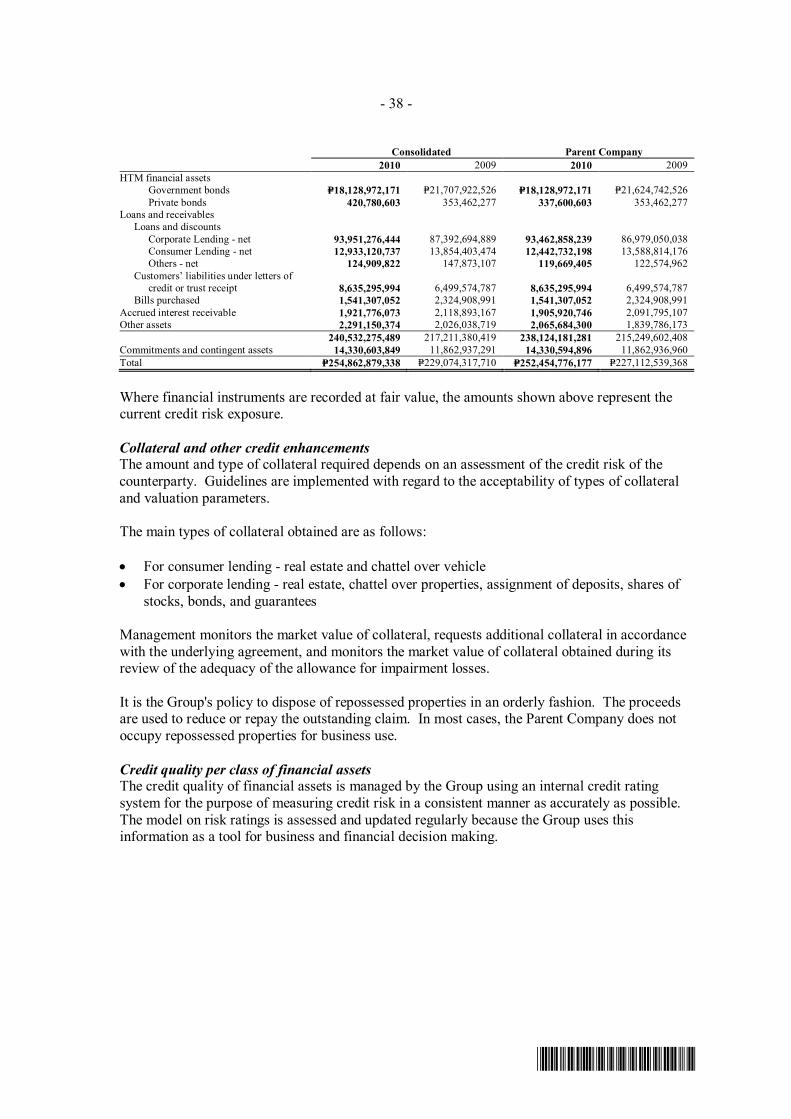
- 38 -
*SGVMC114803*
Consolidated Parent Company 2010 2009 2010 2009 HTM financial assets Government bonds P=18,128,972,171 P=21,707,922,526 P=18,128,972,171 P=21,624,742,526 Private bonds 420,780,603 353,462,277 337,600,603 353,462,277 Loans and receivables Loans and discounts Corporate Lending - net 93,951,276,444 87,392,694,889 93,462,858,239 86,979,050,038 Consumer Lending - net 12,933,120,737 13,854,403,474 12,442,732,198 13,588,814,176 Others - net 124,909,822 147,873,107 119,669,405 122,574,962 Customers’ liabilities under letters of
credit or trust receipt 8,635,295,994 6,499,574,787 8,635,295,994 6,499,574,787 Bills purchased 1,541,307,052 2,324,908,991 1,541,307,052 2,324,908,991 Accrued interest receivable 1,921,776,073 2,118,893,167 1,905,920,746 2,091,795,107 Other assets 2,291,150,374 2,026,038,719 2,065,684,300 1,839,786,173 240,532,275,489 217,211,380,419 238,124,181,281 215,249,602,408 Commitments and contingent assets 14,330,603,849 11,862,937,291 14,330,594,896 11,862,936,960 Total P=254,862,879,338 P=229,074,317,710 P=252,454,776,177 P=227,112,539,368
Where financial instruments are recorded at fair value, the amounts shown above represent the
current credit risk exposure.
Collateral and other credit enhancements The amount and type of collateral required depends on an assessment of the credit risk of the counterparty. Guidelines are implemented with regard to the acceptability of types of collateral and valuation parameters.
The main types of collateral obtained are as follows:
• For consumer lending - real estate and chattel over vehicle • For corporate lending - real estate, chattel over properties, assignment of deposits, shares of
stocks, bonds, and guarantees
Management monitors the market value of collateral, requests additional collateral in accordance with the underlying agreement, and monitors the market value of collateral obtained during its review of the adequacy of the allowance for impairment losses.
It is the Group's policy to dispose of repossessed properties in an orderly fashion. The proceeds
are used to reduce or repay the outstanding claim. In most cases, the Parent Company does not occupy repossessed properties for business use.
Credit quality per class of financial assets
The credit quality of financial assets is managed by the Group using an internal credit rating system for the purpose of measuring credit risk in a consistent manner as accurately as possible. The model on risk ratings is assessed and updated regularly because the Group uses this information as a tool for business and financial decision making.

- 39 -
*SGVMC114803*
The table below shows the credit quality by class of financial assets as of December 31, 2010 and 2009, excluding other receivables (gross of allowance for credit losses).
Consolidated 2010 Neither Past Due nor Impaired Past Due or
High Grade Standard
Grade Sub-Standard
Grade Individually
Impaired Total Due from BSP P=37,124,917,961 P=– P=– P=– P=37,124,917,961 Due from other banks 5,918,907,525 – – – 5,918,907,525 Interbank loans receivable and SPURA 542,000,000 – – – 542,000,000 Financial assets at FVPL Held-for-trading 5,583,562,108 – – – 5,583,562,108 Derivative assets 357,331,029 – – – 357,331,029 AFS financial assets
Quoted: Government bonds 44,585,806,199 – – – 44,585,806,199 Private bonds 680,326,166 680,326,166 Equities 150,615,066 – – – 150,615,066
Unquoted: Credit-Linked Notes – 4,416,367,876 – – 4,416,367,876 Private bonds and commercial papers – 1,204,439,584 – 1,204,439,584 Equities – 19,412,705 – 3,248,501 22,661,206
HTM financial assets Government bonds 18,128,972,171 – – – 18,128,972,171 Private bonds 420,780,603 – – – 420,780,603
Loans and receivables Loans and discounts Corporate lending 95,124,441,909 1,342,230,655 1,630,304,165 3,665,433,041 101,762,409,770 Consumer lending 4,937,946,812 7,203,426,783 579,183,165 1,066,335,678 13,786,892,438 Others 126,118,604 – – – 126,118,604 Customers’ liabilities under letters
of credit or trust receipt 7,928,854,772 – – 706,441,222 8,635,295,994 Bills purchased 1,541,307,052 – – – 1,541,307,052 Accrued interest receivable 1,771,221,885 59,885,743 21,737,273 68,931,173 1,921,776,074 Total P=224,923,109,862 P=14,245,763,346 P=2,231,224,603 P=5,510,389,615 P=246,910,487,426
Consolidated 2009 Neither Past Due nor Impaired Past Due or
High Grade Standard
Grade Sub-Standard
Grade Individually
Impaired Total Due from BSP P=11,621,324,385 P=– P=– P=– P=11,621,324,385 Due from other banks 6,770,243,850 – – – 6,770,243,850 Interbank loans receivable and
securities purchased under agreement to resell 11,983,000,000 – – – 11,983,000,000
Financial assets at FVPL Held-for-trading 4,000,495,974 – – – 4,000,495,974 Derivative assets 710,776,473 – – – 710,776,473 Designated at FVPL 229,821,900 – – – 229,821,900 AFS financial assets
Quoted: Government and private bonds 40,546,408,605 – – – 40,546,408,605 Equities 173,898,977 – – – 173,898,977
Unquoted: Credit Linked Notes 4,604,553,996 – – – 4,604,553,996 Bonds and commercial papers – 100,019,655 – 150,192,685 250,212,340 Equities – 45,064,667 – – 45,064,667
HTM financial assets Government bonds 21,707,922,526 – – – 21,707,922,526 Private bonds 353,462,277 – – – 353,462,277
(Forward)

- 40 -
*SGVMC114803*
Consolidated 2009 Neither Past Due nor Impaired Past Due or
High Grade Standard
Grade Sub-Standard
Grade Individually
Impaired Total Loans and receivables Loans and discounts Corporate lending P=83,011,449,240 P=462,429,151 P=4,536,572,189 P=6,851,120,527 P=94,861,571,107 Consumer lending 6,097,463,102 8,224,793,803 156,987,209 471,230,127 14,950,474,241 Others 158,736,056 – – – 158,736,056 Customers’ liabilities under letters
of credit or trust receipt 5,825,790,567 – – 673,784,220 6,499,574,787 Bills purchased 2,324,908,991 – – – 2,324,908,991 Accrued interest receivable 1,968,249,039 53,041,125 28,651,844 68,951,159 2,118,893,167 Total P=202,088,505,958 P=8,885,348,401 P=4,722,211,242 P=8,215,278,718 P=223,911,344,319
Parent Company 2010 Neither Past Due nor Impaired Past Due or
High Grade Standard
Grade Sub-Standard
Grade individually
Impaired Total Due from BSP P=37,053,152,975 P=– P=– P=– P=37,053,152,975 Due from other banks 5,970,000,543 – – – 5,970,000,543 Interbank loans receivable and
securities purchased under resale agreement 50,000,000 – – – 50,000,000
Financial assets at FVPL Held-for-trading 5,583,562,108 – – – 5,583,562,108 Derivative assets 357,331,029 – – – 357,331,029 AFS financial assets
Quoted: Government and private bonds 44,679,258,687 – – – 44,679,258,687 Equities 150,615,066 – – – 150,615,066 Unquoted:
Credit Linked Notes – 4,416,367,876 – – 4,416,367,876 Bonds and commercial papers – 1,204,439,584 – 2,149,001 1,206,588,585 Equities – 19,412,705 – – 19,412,705
HTM financial assets Government bonds 18,128,972,171 – – – 18,128,972,171 Private bonds 337,600,603 – – – 337,600,603 Loans and receivables Loans and discounts Corporate lending 95,158,943,234 1,342,230,655 1,608,336,321 3,074,456,221 101,183,966,431 Consumer lending 5,005,458,012 7,185,123,453 551,794,973 514,963,999 13,257,340,437 Others 120,878,187 – – – 120,878,187 Customers’ liabilities under letters
of credit or trust receipt 7,928,854,772 – – 706,441,222 8,635,295,994 Bills purchased 1,541,307,052 – – – 1,541,307,052 Accrued interest receivable 1,765,178,376 57,464,650 14,556,824 68,707,896 1,905,907,746 Total P=223,831,112,815 P=14,225,038,923 P=2,174,688,118 P=4,366,718,339 P=244,597,558,195

- 41 -
*SGVMC114803*
Parent Company 2009 Neither Past Due nor Impaired Past Due or
High Grade Standard
Grade Sub-Standard
Grade individually
Impaired Total Due from BSP P=11,553,930,023 P=– P=– P=– P=11,553,930,023 Due from other banks 6,761,701,623 – – – 6,761,701,623 Interbank loans receivable and
securities purchased under resale agreement 11,848,000,000 – – – 11,848,000,000
Financial assets at FVPL Held-for-trading 4,000,495,974 – – – 4,000,495,974 Derivative assets 710,776,473 – – – 710,776,473 Designated at FVPL 229,821,900 – – – 229,821,900 AFS financial assets
Quoted: Government and private bonds 39,822,282,045 – – – 39,822,282,045 Equities 173,898,977 – – – 173,898,977 Unquoted:
Credit Linked Notes – 4,604,553,996 – – 4,604,553,996 Bonds and commercial papers – 100,019,655 – 44,457,141 144,476,796 Equities – 19,412,705 – – 19,412,705
HTM financial assets Government bonds 21,624,742,526 – – – 21,624,742,526 Private bonds 353,462,277 – – – 353,462,277 Loans and receivables Loans and discounts Corporate lending 82,444,905,410 462,429,151 4,536,572,189 6,828,082,985 94,271,989,735 Consumer lending 5,870,849,477 8,224,793,803 156,106,430 421,816,097 14,673,565,807 Others 132,359,729 – – – 132,359,729 Customers’ liabilities under letters
of credit or trust receipt 5,825,790,567 – – 673,784,220 6,499,574,787 Bills purchased 2,324,908,991 – – – 2,324,908,991 Accrued interest receivable 1,941,150,979 53,041,125 28,651,844 68,951,159 2,091,795,107 Total P=195,619,076,971 P=13,464,250,435 P=4,721,330,463 P=8,037,091,602 P=221,841,749,471
It is the Parent Company’s policy to maintain accurate and consistent risk ratings across the credit
portfolio. This facilitates focused management of the applicable risks and the comparison of credit exposures across all lines of business, geographic regions and products. The rating system is supported by a variety of financial analytics, combined with processed market information to provide the main inputs for the measurement of counterparty risk. All internal risk ratings are tailored to the various categories and are derived in accordance with the Parent Company’s rating policy. The attributable risk ratings are assessed and updated regularly. The standard credit rating equivalent grades are relevant only for certain of the exposures in each risk rating class.
The following table shows the description of the internal CRRS grade:
CRRS Grade Description 1 Excellent 2 Strong 3 Good 4 Satisfactory 5 Acceptable 6 Watchlist 7 Special Mention 8 Substandard 9 Doubtful 10 Loss

- 42 -
*SGVMC114803*
The credit grades are defined as follows:
Excellent and Strong – This category applies to a borrower with a very low probability of going
into default in the coming year. The borrower has a high degree of stability, substance and diversity. It has access to raise substantial amounts of funds through the public markets at any time. The borrower has a strong market and financial position with a history of successful performance. The critical balance sheet ratios are conservative. The borrower has a very strong debt service capacity and a conservative use of balance sheet leverage. The track record in profit terms is very good. The borrower is of highest quality under virtually all economic conditions. This is considered a high grade rating.
Good – This category covers the smaller corporations with limited access to public capital
markets or access to alternative financial markets. This access is however limited to favorable economic and/or market conditions. Typical for this type of borrower is the combination of comfortable asset protection and acceptable balance sheet structure. The debt service capacity as measured based on cash flows is strong. This is also considered as a high grade rating.
Satisfactory – This category represents those borrowers where clear risk elements exist and the
probability of default is somewhat greater. This probability is reflected in volatility of earnings and overall performance. Borrowers in this category normally have limited access to public financial markets. Borrowers should be able to withstand normal business cycles, but any prolonged unfavorable economic period would create deterioration beyond acceptable levels. Typical for this kind of borrower is the combination of reasonably sound asset and cash flow protection. The debt service capacity as measured by cash flow is deemed adequate. The borrower has reported profits for the past fiscal year and is expected to report a profit in the current year. This is considered a standard grade rating.
Acceptable – The risk elements for the Parent Company are sufficiently pronounced, although
borrowers should still be able to withstand normal business cycles. Any prolonged unfavorable economic and/or market period would create an immediate deterioration beyond acceptable levels. This is considered a standard grade rating. However, in the next assessment period, closer attention is warranted as a downgrade may be possible.
Watchlist – This represents borrowers for which unfavorable industry or company-specific risk
factors represent a concern. Operating performance and financial strength may be marginal and it is uncertain whether the borrower can attract alternative sources of financing. The borrower will find it very hard to cope with any significant economic downturn and a default in such a case is more than a possibility. This category includes those borrowers where the credit exposure is not a risk of loss at the moment, but the performance of the borrower has weakened, and unless present trends are reversed, could lead to losses. Depending on the nature of the account weakness and whether the adverse condition is merely temporary or prolonged, this is normally considered as a substandard grade rating.
Special Mention – In this category, the borrowers are characterized by a reasonable probability of
default, manifested by some or all the following: (a) evidence of weakness in the borrower’s financial condition or creditworthiness; (b) the borrower has reached a point where there is a real risk that the borrower’s ability to pay the interest and repay the principal timely could be jeopardized; (c) the borrower is expected to have financial difficulties and exposure may be at risk. Closer account management attention is warranted. Concerted efforts should be made to improve lender’s position (e.g., demanding additional collateral or reduction of account exposure). These potential weaknesses, if left uncorrected or unmitigated, would affect the

- 43 -
*SGVMC114803*
repayment of the loan and thus increase credit risk to the Parent Company. Depending on the reason for the classification, this grade is considered as a substandard grade rating or an impaired account.
Substandard – Under this category, the collection of principal or interest becomes questionable
regardless of scheduled payment date, by reason of adverse developments on the account of a financial, managerial, economic, or political nature, or by important weaknesses in cover. The probability of default is assessed at up to 50%. Substandard loans are loans or portions thereof that appear to involve a substantial and unreasonable degree of risk to the Parent Company because of unfavorable record or unsatisfactory characteristics. There exists in such loans the possibility of future loss to the Parent Company unless given closer supervision. Depending on the reason for the classification, this grade is considered as a substandard grade rating or an impaired account.
Doubtful – This category includes all borrowers with “non-performing loan” status or an account
with any portion of interest and/or principal payment that has become in arrears for more than ninety (90) days. The borrower is unable or unwilling to service debt over an extended period of time. Future prospects of orderly debt service are considered doubtful. Existing facts or conditions make collection or liquidation in full highly improbable and thus substantial loss is probable.
Loss – This category represents borrowers whose prospect for re-establishment of
creditworthiness and debt service is remote. This category also applies where the Parent Company will take or has taken title to the assets of the borrower and is preparing a foreclosure and/or liquidation of the borrower’s business. The loans are considered uncollectible or worthless and of such little value.
Due from BSP, due from other banks, and interbank loans receivable are classified as high grade since these are deposited in/or transacted with reputable banks which has low probability of insolvency. Quoted bonds and equities which are either issued by the Philippine government or reputable companies are classified as High grade. Unquoted bonds and equities are classified as standard grade based on the reputation of the counterparty and lack of marketability as compared with quoted investments.
The table below shows the aging analysis of gross past due but not impaired loans and receivables that the Group and Parent Company held as of December 31, 2010 and December 31, 2009. Under PFRS 7, a financial asset is past due when a counterparty has failed to make a payment when contractually due.
Consolidated
December 31, 2010 Less than
30 days 31 to 60 days 61 to 90 days More than
91 days Total Loans and receivables Corporate lending P=34,434,762 P=232,000 P=1,940,000 P=19,867,540 P=56,474,302 Consumer lending 6,114,098 4,161,222 – – 10,275,320 Others – – – – – Total P=40,548,860 P=4,393,222 P=1,940,000 P=19,867,540 P=66,749,622
Consolidated
December 31, 2009 Less than
30 days 31 to 60 days 61 to 90 days More than
91 days Total Loans and receivables Corporate lending P=15,432,848 P=9,589,040 P=– P=1,112,284,465 P=1,137,306,353 Consumer lending 28,770,790 8,657,305 27,550,484 267,999,441 332,978,020 Others 2,921 8,942 – 212,540 224,403 Total P=44,206,559 P=18,255,287 P=27,550,484 P=1,380,496,446 P=1,470,508,776

- 44 -
*SGVMC114803*
Parent Company
December 31, 2010 Less than
30 days 31 to 60 days 61 to 90 days More than
91 days Total Loans and receivables Corporate lending P=34,434,762 P=232,000 P=1,940,000 P=19,867,540 P=56,474,302 Consumer lending 6,114,098 4,161,222 – – 10,275,320 Others – – – – – Total P=40,548,860 P=4,393,222 P=1,940,000 P=19,867,540 P=66,749,622
Parent Company
December 31, 2009 Less than
30 days 31 to 60 days 61 to 90 days More than
91 days Total Loans and receivables Corporate lending P=43,396,863 P=4,168,664 P=5,732,133 P=3,428,346 P=56,726,006 Consumer lending 8,493,044 5,782,250 – – 14,275,294 Others – – – – – Total P=51,889,907 P=9,950,914 P=5,732,133 P=3,428,346 P=71,001,300
The aggregate fair value of collaterals held by the Parent Company pertaining to the aggregate amount of gross past due but not impaired loans and receivables as of December 31, 2010 and 2009 amounted to P=92.42 million and P=98.31 million, respectively.
See discussions under the ‘Collateral and other credit enhancements’ section for the details of types of collateral held.
See Note 14 for more detailed information with respect to the allowance for impairment and credit
losses on loans and receivables. The following table presents the carrying amount of financial assets of the Group and Parent
Company as of December 31, 2010 and 2009 that would have been considered past due or impaired if not renegotiated:
Consolidated Parent Company 2010 2009 2010 2009 Loans and advances to customers: Corporate lending P=1,917,879,269 P=1,417,047,073 P=1,900,269,413 P=1,394,009,531 Consumer lending 70,294,654 72,996,325 53,551,349 23,582,295 Total renegotiated financial assets P=1,988,173,923 P=1,490,043,398 P=1,953,820,762 P= 1,417,591,826
Impairment assessment
The main considerations for the loan impairment assessment include whether any payments of principal or interest are overdue by more than 90 days or there are any known difficulties in the cash flows of counterparties, credit rating downgrades, or infringement of the original terms of the contract. The Group addresses impairment assessment in two areas: individually assessed allowances and collectively assessed allowances.
Individually assessed allowances
The Group determines the allowances appropriate for each individually significant loan or advance on an individual basis. Items considered when determining allowance amounts include the sustainability of the counterparty’s business plan, its ability to improve performance once a financial difficulty has arisen, projected receipts and the expected dividend payout should bankruptcy ensue, the availability of other financial support and the realizable value of collateral, and the timing of the expected cash flows. The impairment losses are evaluated at each reporting date, unless unforeseen circumstances require more careful attention.

- 45 -
*SGVMC114803*
Collectively assessed allowances Allowances are assessed collectively for losses on loans and advances that are not individually
significant (including residential mortgages and unsecured consumer lending) and for individually significant loans and advances where there is not yet objective evidence of individual impairment. Allowances are evaluated on each reporting date with each portfolio receiving a separate review.
The collective assessment takes account of impairment that is likely to be present in the portfolio
even though there is not yet objective evidence of the impairment in an individual assessment. Impairment losses are estimated by taking into consideration the following information: historical losses on the portfolio, current economic conditions, the approximate delay between the time a loss is likely to have been incurred and the time it will be identified as requiring an individually assessed impairment allowance, and expected receipts and recoveries once impaired. Management is responsible for deciding the length of this period which can extend for as long as one year. The impairment allowance is then reviewed by credit management to ensure alignment with the Group’s overall policy.
Market Risk Market risk is the risk of loss that may result from changes in the price of a financial product. The value of a financial product may change as a result of changes in interest rates, foreign exchange rates, commodity prices, equity prices and other market changes. The Parent Company’s market risk originates from its holdings of foreign exchange instruments and debt securities.
The RMG of the Parent Company is responsible for assisting the RMC with its responsibility for identifying, measuring, managing and controlling market risk. Market risk management is implemented under the Value-at-Risk (VaR) method, a procedure for estimating the probability of portfolio losses exceeding some specified proportion based on a statistical analysis of historical market price trends, correlations and volatilities. Specifically, the Bank uses the Parametric/Variance-Covariance VaR measurement. VaR estimates the potential decline in the value of a portfolio, under normal market conditions, for a given “confidence level” over a specified holding period.
Objectives and limitations of the VaR Methodology The Parent Company uses simulation models to assess possible changes in the market value of the
trading portfolio based on historical data from the past 260 trading days. The VaR models are designed to measure market risk in a normal market environment. The models assume that any changes occurring in the risk factors affecting the normal market environment will follow a normal distribution. The distribution is calculated by using exponentially weighted historical data. The use of VaR has limitations because it is based on historical correlations and volatilities in market prices and assumes that future price movements will follow a statistical distribution. Due to the fact that VaR relies heavily on historical data to provide information and may not clearly predict the future changes and modifications of the risk factors, the probability of large market moves may be underestimated if changes in risk factors fail to align with the normal distribution assumption. VaR may also be under- or over-estimated due to the assumptions placed on risk factors and the relationship between such factors for specific instruments. Even though positions may change throughout the day, the VaR only represents the risk of the portfolios at the close of each business day, and it does not account for any losses that may occur beyond the 99.00% confidence level.

- 46 -
*SGVMC114803*
In practice the actual trading results will differ from the VaR calculation and, in particular, the calculation does not provide a meaningful indication of profits and losses in stressed market conditions. To determine the reliability of the VaR models, actual outcomes are monitored regularly to test the validity of the assumptions and the parameters used in the VaR calculation. Market risk positions are also subject to regular stress tests to ensure that the Bank would withstand an extreme market event.
VaR assumptions The VaR that the Parent Company measures is an estimate, using a confidence level of 99%, of
the potential loss that is not expected to be exceeded if the current market risk positions were to be held unchanged for one day. The use of a 99.00% confidence level means that, within a one day horizon, losses exceeding the VaR figure should occur, on average, not more than once every hundred days.
In July 2005, the Parent Company commenced the bankwide computation of its VaR in certain trading activities, using a 99.00% confidence level and a 10-day holding period for interest rate risk and a 99.00% confidence level and 1-day holding period for foreign exchange risk and equity risk. This means that, statistically, the Parent Company’s losses on interest rate risks arising from trading operations will exceed the VaR figure on 1 fortnightly period (with no change in the portfolio during the holding period) out of 100 fortnightly periods. The validity of the VaR model is verified through back testing, which examines how frequently actual daily losses exceeds daily VaR. The Parent Company measures and monitors the VaR and profit and loss on a daily basis.
Since VaR is an integral part of the Parent Company’s market risk management, VaR limits have been established for all trading operations and exposures are reviewed daily against the limits by management.
A summary of the VaR position of the trading portfolio of the Parent Company is as follows:
Interest Rate Foreign
Exchange Equity Total (In Millions) 2010 31 December 41.96 2.45 2.25 46.66 Average daily 30.98 11.33 3.56 45.87 Highest 74.99 25.25 4.99 105.23 Lowest 15.46 1.88 2.25 19.59 2009 31 December 24.68 16.12 2.60 43.40 Average daily 34.51 11.80 2.79 49.10 Highest 52.83 27.92 3.06 83.81 Lowest 15.79 3.51 2.39 21.69
In 2010, there were 2 times in the year that daily losses were greater than the VaR (average loss of those instances was P=13.63 million, with an average VaR of P=11.33 million).
In 2009, there were 5 times in the year that daily equity losses were greater than the equity VaR (average loss of those instances was P=3.56 million, with an average VaR of P=2.82 million).
Interest Rate Risk The Group’s interest rate risk originates from its holdings of interest rate sensitive assets and interest rate sensitive liabilities. The Parent Company follows prudent policies in managing its exposures to interest rate fluctuations, and constantly monitors its assets and liabilities.
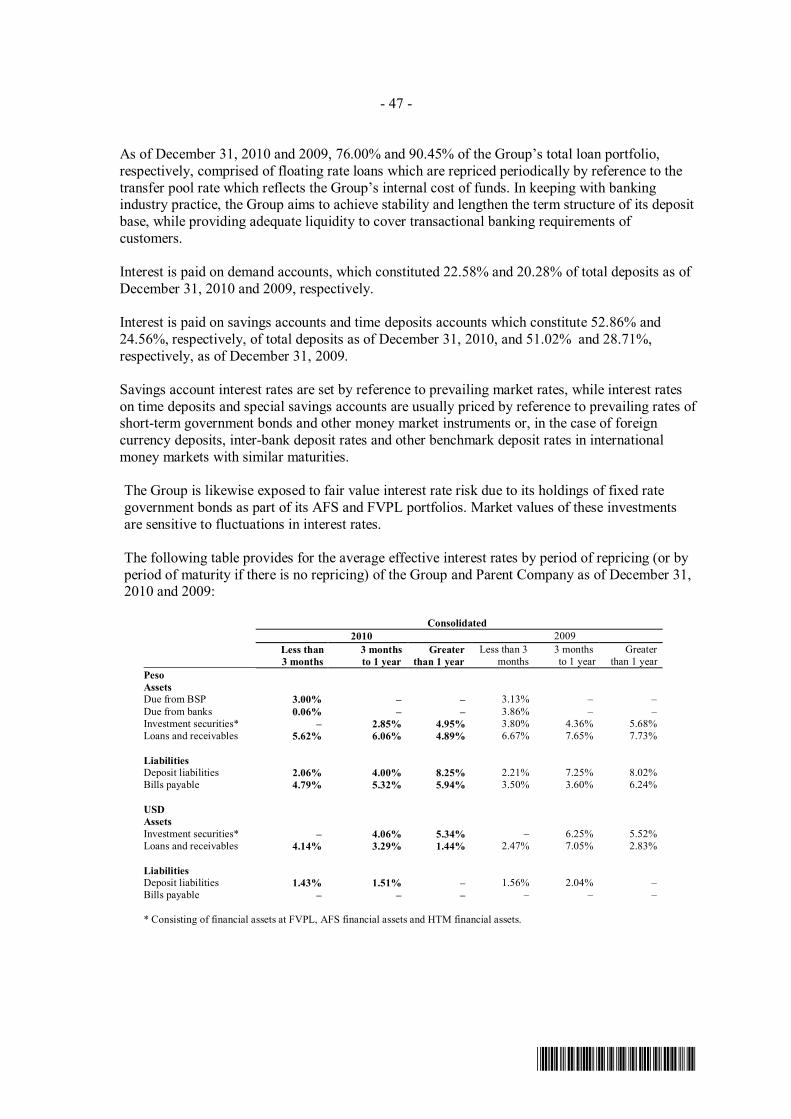
- 47 -
*SGVMC114803*
As of December 31, 2010 and 2009, 76.00% and 90.45% of the Group’s total loan portfolio, respectively, comprised of floating rate loans which are repriced periodically by reference to the transfer pool rate which reflects the Group’s internal cost of funds. In keeping with banking industry practice, the Group aims to achieve stability and lengthen the term structure of its deposit base, while providing adequate liquidity to cover transactional banking requirements of customers.
Interest is paid on demand accounts, which constituted 22.58% and 20.28% of total deposits as of December 31, 2010 and 2009, respectively.
Interest is paid on savings accounts and time deposits accounts which constitute 52.86% and 24.56%, respectively, of total deposits as of December 31, 2010, and 51.02% and 28.71%, respectively, as of December 31, 2009.
Savings account interest rates are set by reference to prevailing market rates, while interest rates on time deposits and special savings accounts are usually priced by reference to prevailing rates of short-term government bonds and other money market instruments or, in the case of foreign currency deposits, inter-bank deposit rates and other benchmark deposit rates in international money markets with similar maturities.
The Group is likewise exposed to fair value interest rate risk due to its holdings of fixed rate government bonds as part of its AFS and FVPL portfolios. Market values of these investments are sensitive to fluctuations in interest rates.
The following table provides for the average effective interest rates by period of repricing (or by period of maturity if there is no repricing) of the Group and Parent Company as of December 31, 2010 and 2009:
Consolidated 2010 2009
Less than 3 months
3 months to 1 year
Greater than 1 year
Less than 3 months
3 months to 1 year
Greater than 1 year
Peso Assets Due from BSP 3.00% – – 3.13% – – Due from banks 0.06% – – 3.86% – – Investment securities* – 2.85% 4.95% 3.80% 4.36% 5.68% Loans and receivables 5.62% 6.06% 4.89% 6.67% 7.65% 7.73% Liabilities Deposit liabilities 2.06% 4.00% 8.25% 2.21% 7.25% 8.02% Bills payable 4.79% 5.32% 5.94% 3.50% 3.60% 6.24% USD Assets Investment securities* – 4.06% 5.34% – 6.25% 5.52% Loans and receivables 4.14% 3.29% 1.44% 2.47% 7.05% 2.83% Liabilities Deposit liabilities 1.43% 1.51% – 1.56% 2.04% – Bills payable – – – – – –
* Consisting of financial assets at FVPL, AFS financial assets and HTM financial assets.

- 48 -
*SGVMC114803*
Parent Company 2010 2009
Less than 3 months
3 months to 1 year
Greater than 1 year
Less than 3 months
3 months to 1 year
Greater than 1 year
Peso Assets Due from BSP 3.00% – – 3.12% – – Due from banks 0.06% – – 3.89% – – Investment securities* – 2.85% 4.95% 3.80% 4.44% 5.69% Loans and receivables 5.62% 6.06% 4.88% 6.66% 7.63% 7.69% Liabilities Deposit liabilities 2.06% 4.00% 8.25% 2.20% 7.25% 8.02% Bills payable 4.79% 5.32% 5.94% 3.50% 3.60% 6.24% USD Assets Investment securities* – 4.06% 5.34% – 6.25% 5.52% Loans and receivables 4.14% 3.29% 1.44% 2.47% 7.05% 2.83% Liabilities Deposit liabilities 1.43% 1.51% – 1.56% 2.04% – Bills payable – – – – – –
* Consisting of financial assets at FVPL, AFS financial assets and HTM financial assets.
The method by which the Group measures the sensitivity of its assets and liabilities to interest rate fluctuations is by way of asset-liability gap analysis. This analysis provides the Group with a measure of the Group’s susceptibility to changes in interest rates. The repricing gap is calculated by first distributing the assets and liabilities contained in the Group’s balance sheet into tenor buckets according to the time remaining to the next repricing date (or the time remaining to maturity if there is no repricing), and then obtaining the difference between the total of the repricing (interest rate sensitive) assets and repricing (interest rate sensitive) liabilities.
A gap is considered negative when the amount of interest rate sensitive liabilities exceeds the amount of interest rate sensitive assets. A gap is considered positive when the amount of interest rate sensitive assets exceeds the amount of interest rate sensitive liabilities.
Accordingly, during a period of rising interest rates, a bank with a positive gap would be in a position to invest in higher yielding assets earlier than it would need to refinance its interest rate sensitive liabilities. During a period of falling interest rates, a bank with a positive gap would tend to see its interest rate sensitive assets repricing earlier than its interest rate sensitive liabilities, which may restrain the growth of its net income or result in a decline in net interest income.
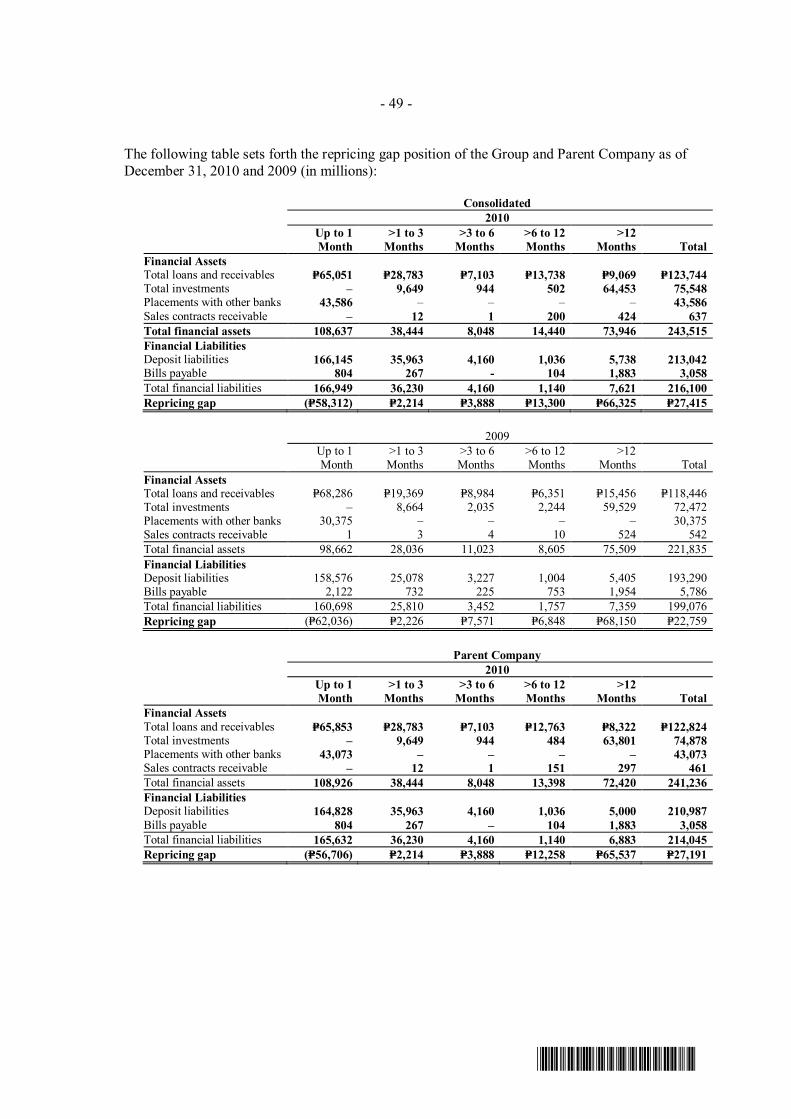
- 49 -
*SGVMC114803*
The following table sets forth the repricing gap position of the Group and Parent Company as of December 31, 2010 and 2009 (in millions):
Consolidated 2010
Up to 1 Month
>1 to 3 Months
>3 to 6 Months
>6 to 12 Months
>12 Months Total
Financial Assets Total loans and receivables P=65,051 P=28,783 P=7,103 P=13,738 P=9,069 P=123,744 Total investments – 9,649 944 502 64,453 75,548 Placements with other banks 43,586 – – – – 43,586 Sales contracts receivable – 12 1 200 424 637 Total financial assets 108,637 38,444 8,048 14,440 73,946 243,515 Financial Liabilities Deposit liabilities 166,145 35,963 4,160 1,036 5,738 213,042 Bills payable 804 267 - 104 1,883 3,058 Total financial liabilities 166,949 36,230 4,160 1,140 7,621 216,100 Repricing gap (P=58,312) P=2,214 P=3,888 P=13,300 P=66,325 P=27,415
2009
Up to 1 Month
>1 to 3 Months
>3 to 6 Months
>6 to 12 Months
>12 Months Total
Financial Assets Total loans and receivables P=68,286 P=19,369 P=8,984 P=6,351 P=15,456 P=118,446 Total investments – 8,664 2,035 2,244 59,529 72,472 Placements with other banks 30,375 – – – – 30,375 Sales contracts receivable 1 3 4 10 524 542 Total financial assets 98,662 28,036 11,023 8,605 75,509 221,835 Financial Liabilities Deposit liabilities 158,576 25,078 3,227 1,004 5,405 193,290 Bills payable 2,122 732 225 753 1,954 5,786 Total financial liabilities 160,698 25,810 3,452 1,757 7,359 199,076 Repricing gap (P=62,036) P=2,226 P=7,571 P=6,848 P=68,150 P=22,759
Parent Company 2010
Up to 1 Month
>1 to 3 Months
>3 to 6 Months
>6 to 12 Months
>12 Months Total
Financial Assets Total loans and receivables P=65,853 P=28,783 P=7,103 P=12,763 P=8,322 P=122,824 Total investments – 9,649 944 484 63,801 74,878 Placements with other banks 43,073 – – – – 43,073 Sales contracts receivable – 12 1 151 297 461 Total financial assets 108,926 38,444 8,048 13,398 72,420 241,236 Financial Liabilities Deposit liabilities 164,828 35,963 4,160 1,036 5,000 210,987 Bills payable 804 267 – 104 1,883 3,058 Total financial liabilities 165,632 36,230 4,160 1,140 6,883 214,045 Repricing gap (P=56,706) P=2,214 P=3,888 P=12,258 P=65,537 P=27,191
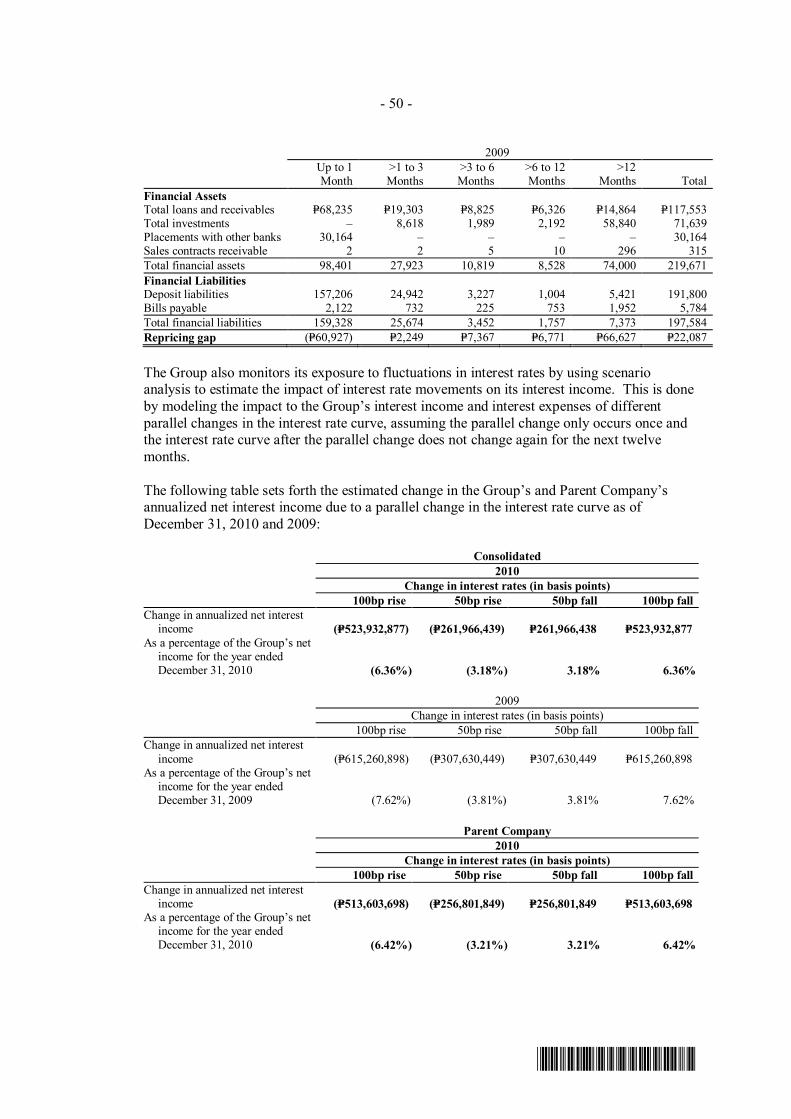
- 50 -
*SGVMC114803*
2009
Up to 1 Month
>1 to 3 Months
>3 to 6 Months
>6 to 12 Months
>12 Months Total
Financial Assets Total loans and receivables P=68,235 P=19,303 P=8,825 P=6,326 P=14,864 P=117,553 Total investments – 8,618 1,989 2,192 58,840 71,639 Placements with other banks 30,164 – – – – 30,164 Sales contracts receivable 2 2 5 10 296 315 Total financial assets 98,401 27,923 10,819 8,528 74,000 219,671 Financial Liabilities Deposit liabilities 157,206 24,942 3,227 1,004 5,421 191,800 Bills payable 2,122 732 225 753 1,952 5,784 Total financial liabilities 159,328 25,674 3,452 1,757 7,373 197,584 Repricing gap (P=60,927) P=2,249 P=7,367 P=6,771 P=66,627 P=22,087
The Group also monitors its exposure to fluctuations in interest rates by using scenario
analysis to estimate the impact of interest rate movements on its interest income. This is done by modeling the impact to the Group’s interest income and interest expenses of different parallel changes in the interest rate curve, assuming the parallel change only occurs once and the interest rate curve after the parallel change does not change again for the next twelve months.
The following table sets forth the estimated change in the Group’s and Parent Company’s
annualized net interest income due to a parallel change in the interest rate curve as of December 31, 2010 and 2009:
Consolidated 2010 Change in interest rates (in basis points) 100bp rise 50bp rise 50bp fall 100bp fall Change in annualized net interest
income (P=523,932,877) (P=261,966,439) P=261,966,438 P=523,932,877 As a percentage of the Group’s net
income for the year ended December 31, 2010 (6.36%) (3.18%) 3.18% 6.36%
2009 Change in interest rates (in basis points) 100bp rise 50bp rise 50bp fall 100bp fall Change in annualized net interest
income (P=615,260,898) (P=307,630,449) P=307,630,449 P=615,260,898 As a percentage of the Group’s net
income for the year ended December 31, 2009 (7.62%) (3.81%) 3.81% 7.62%
Parent Company 2010 Change in interest rates (in basis points) 100bp rise 50bp rise 50bp fall 100bp fall Change in annualized net interest
income (P=513,603,698) (P=256,801,849) P=256,801,849 P=513,603,698 As a percentage of the Group’s net
income for the year ended December 31, 2010 (6.42%) (3.21%) 3.21% 6.42%
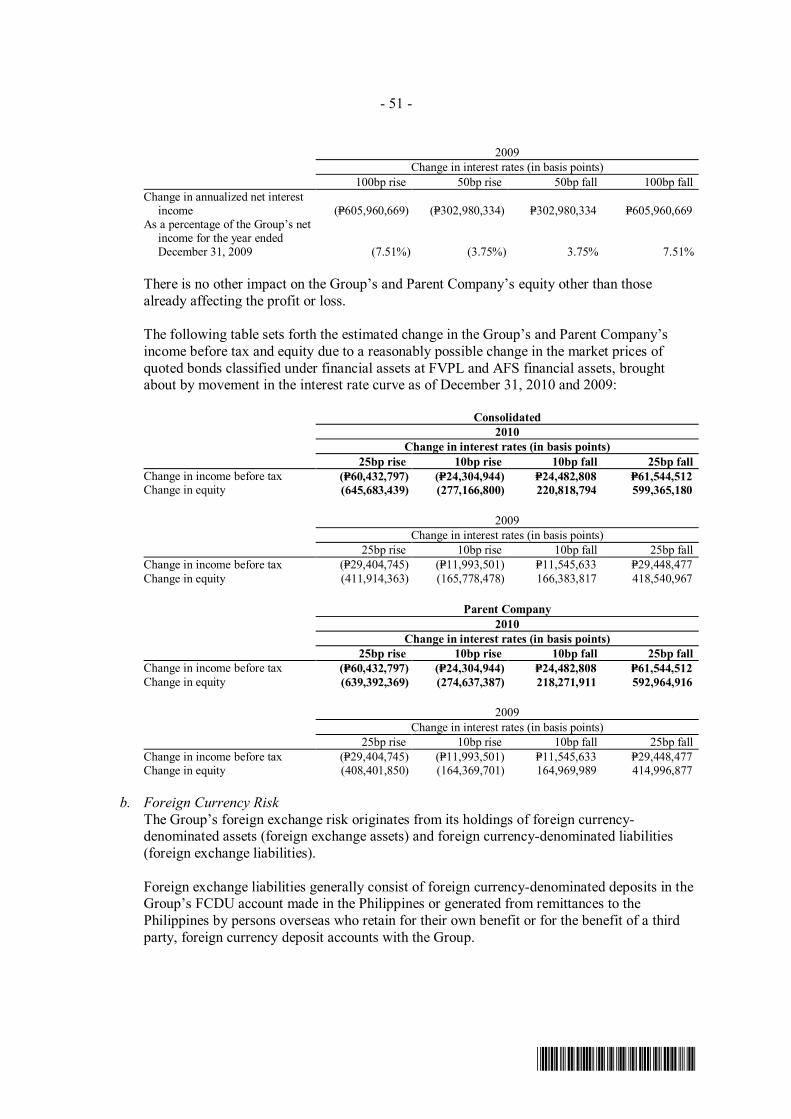
- 51 -
*SGVMC114803*
2009 Change in interest rates (in basis points) 100bp rise 50bp rise 50bp fall 100bp fall Change in annualized net interest
income (P=605,960,669) (P=302,980,334) P=302,980,334 P=605,960,669 As a percentage of the Group’s net
income for the year ended December 31, 2009 (7.51%) (3.75%) 3.75% 7.51%
There is no other impact on the Group’s and Parent Company’s equity other than those
already affecting the profit or loss.
The following table sets forth the estimated change in the Group’s and Parent Company’s income before tax and equity due to a reasonably possible change in the market prices of quoted bonds classified under financial assets at FVPL and AFS financial assets, brought about by movement in the interest rate curve as of December 31, 2010 and 2009:
Consolidated 2010 Change in interest rates (in basis points) 25bp rise 10bp rise 10bp fall 25bp fall Change in income before tax (P=60,432,797) (P=24,304,944) P=24,482,808 P=61,544,512 Change in equity (645,683,439) (277,166,800) 220,818,794 599,365,180
2009 Change in interest rates (in basis points) 25bp rise 10bp rise 10bp fall 25bp fall Change in income before tax (P=29,404,745) (P=11,993,501) P=11,545,633 P=29,448,477 Change in equity (411,914,363) (165,778,478) 166,383,817 418,540,967
Parent Company 2010 Change in interest rates (in basis points) 25bp rise 10bp rise 10bp fall 25bp fall Change in income before tax (P=60,432,797) (P=24,304,944) P=24,482,808 P=61,544,512 Change in equity (639,392,369) (274,637,387) 218,271,911 592,964,916
2009 Change in interest rates (in basis points) 25bp rise 10bp rise 10bp fall 25bp fall Change in income before tax (P=29,404,745) (P=11,993,501) P=11,545,633 P=29,448,477 Change in equity (408,401,850) (164,369,701) 164,969,989 414,996,877
b. Foreign Currency Risk
The Group’s foreign exchange risk originates from its holdings of foreign currency-denominated assets (foreign exchange assets) and foreign currency-denominated liabilities (foreign exchange liabilities).
Foreign exchange liabilities generally consist of foreign currency-denominated deposits in the
Group’s FCDU account made in the Philippines or generated from remittances to the Philippines by persons overseas who retain for their own benefit or for the benefit of a third party, foreign currency deposit accounts with the Group.

- 52 -
*SGVMC114803*
Foreign currency liabilities are generally used to fund the Group’s foreign exchange assets
which generally consist of foreign currency-denominated loans and investments in the FCDU. Banks are required by the BSP to match the foreign currency-denominated assets with liabilities held in the FCDU that are denominated in the same foreign currency. In addition, the BSP requires a 30% liquidity reserve on all foreign currency-denominated liabilities held in the FCDU.
The Group’s policy is to maintain foreign currency exposure within existing regulations, and
within acceptable risk limits. The Group believes in ensuring its foreign currency is at all times within limits prescribed for financial institutions who are engaged in the same types of businesses in which the Group and its subsidiaries are engaged.
The table below summarizes the Group’s and Parent Company’s exposure to foreign exchange risk. Included in the table are the Group’s and Parent Company’s assets and liabilities at carrying amounts (stated in US Dollars), categorized by currency (in thousands):
Consolidated 2010 2009
USD Other
Currencies Total PHP USDOther
Currencies Total PHP Assets Cash and other cash items $13,411 $987 $14,398 P=631,208 $4,008 $– $4,008 P=185,170 Due from other banks 117,928 7,017 124,945 5,477,589 132,039 6,514 138,553 6,401,149 Interbank loans receivables 1,240 – 1,240 54,362 – – – – Financial assets at FVPL 25,582 1,978 27,560 1,208,230 22,711 242 22,953 1,060,429 AFS financial assets 595,771 – 595,771 26,118,601 429,346 – 429,346 19,835,785 HTM financial assets 517,356 – 517,356 22,680,887 567,038 3,546 570,584 26,360,981 Loans and receivables 279,672 – 279,672 12,260,820 340,836 296 341,132 15,760,298 Accrued interest receivable 22,261 266 22,527 987,584 24,314 202 24,516 1,132,639 Other assets 34,744 24 34,768 1,524,229 6,030 – 6,030 278,586 $1,607,965 $10,272 $1,618,237 P=70,943,510 $1,526,322 $10,800 $1,537,122 P=71,015,037 Liabilities Deposit liabilities $1,196,327 $12,157 $1,208,484 P=52,979,939 $1,128,110 $7,978 $1,136,088 P=52,487,266 Bills payables 10,000 – 10,000 438,400 – – – – Accrued interest and other
expenses 2,379 15 2,394 104,953 3,861 11 3,872 178,886 Other liabilities 38,896 20 38,916 1,706,077 6,097 144 6,241 288,334 $1,247,602 $12,192 $1,259,794 P=55,229,369 $1,138,068 $8,133 $1,146,201 P=52,954,486 Currency spot 42,500 – 42,500 1,863,200 (11,000) – (11,000) (508,200) Currency forwards (393,764) (186) (393,950) (17,270,768) (414,615) – (414,615) (19,155,213) Net Exposure $9,099 ($2,106) $6,993 P=306,573 ($37,361) $2,667 ($34,694) (P=1,602,862)
Parent Company 2010 2009
USD Other
Currencies Total PHP USDOther
Currencies Total PHP Assets Cash and other cash items $13,300 $987 $14,287 P=626,342 $4,008 $– $4,008 P=185,170 Due from other banks 116,598 7,017 123,615 5,419,282 129,280 6,514 135,794 6,273,683 Interbank loans receivables 1,240 – 1,240 54,362 – – – – Financial assets at FVPL 25,582 1,978 27,560 1,208,230 22,711 242 22,953 1,060,420 AFS financial assets 594,601 – 594,601 26,067,308 429,346 – 429,346 19,835,785 HTM financial assets 517,356 – 517,356 22,680,887 567,038 3,546 570,584 26,360,981 Loans and receivables 279,672 – 279,672 12,260,820 340,836 296 341,132 15,760,298 Accrued interest receivable 22,221 266 22,487 985,830 24,313 202 24,515 1,132,593 Other assets 34,743 24 34,767 1,524,185 6,030 – 6,030 278,586 $1,605,313 $10,272 $1,615,585 P=70,827,246 $1,523,562 $10,800 $1,534,362 P=70,887,516 Liabilities Deposit liabilities $1,193,768 $12,157 $1,205,925 P=52,867,752 $1,125,390 $7,978 $1,133,368 P=52,361,602 Bills payables 10,000 – 10,000 438,400 – – – – Accrued interest and other
expenses 2,378 15 2,393 104,909 3,858 11 3,869 178,748 Other liabilities 38,893 20 38,913 1,705,946 6,090 144 6,234 288,011 $1,245,039 $12,192 $1,257,231 P=55,117,007 $1,135,338 $8,133 $1,143,471 P=52,828,361 Currency spot $42,500 $– $42,500 P=1,863,200 ($11,000) $– ($11,000) (P=508,200) Currency forwards (393,764) (186) (393,950) (17,270,768) (414,615) – (414,615) (19,155,213) Net Exposure $9,010 ($2,106) $6,904 P=302,671 ($37,391) $2,667 ($34,724) (P=1,604,258)

- 53 -
*SGVMC114803*
The following table sets forth, for the period indicated, the impact of the range of reasonably
possible changes in the US$ exchange rate and other currencies per Philippine peso on the pre-tax income and equity (in millions).
Consolidated
Change in foreign exchange rate
Sensitivity of pretax income
Sensitivity of equity
2010 USD 2% P=21 P=543 Other 1% 1 1 USD (2%) (21) (543) Other (1%) (1) (1)
Consolidated Change in foreign
exchange rate Sensitivity of
pretax income Sensitivity of
equity 2009 USD 2% P=17 P=421 Other 1% 1 1 USD (2%) (17) (421) Other (1%) (1) (1)
Parent Company
Change in foreign exchange rate
Sensitivity of pretax income
Sensitivity of equity
2010 USD 2% P=21 P=542 Other 1% 1 1 USD (2%) (21) (542) Other (1%) (1) (1) 2009 USD 2% P=17 P=421 Other 1% 1 1 USD (2%) (17) (421) Other (1%) (1) (1)
The impact in equity is due to the effect of FCDU’s behaviour to Philippine peso (see Note 2).
c. Equity Price Risk Equity price risk is the risk that the fair values of equities decrease as the result of changes in
the level of equity indices and the value of individual stocks. The non-trading equity price risk exposure arises from the Group’s investment portfolio.
The effect on the Group and Parent Company’s equity (as a result of a change in the fair value
of equity instruments held as available-for-sale due to a reasonably possible change in equity indices, with all other variables held constant, is as follows (in millions):
Consolidated
Change in equity price
Effect on Equity
2010 +10% P=15 -10% (10) 2009 +10% P=10 -10% (3)

- 54 -
*SGVMC114803*
Parent Company
Change in equity price
Effect on equity
2010 +10% P=15 -10% (10) 2009 +10% P=10 -10% (3)
Liquidity Risk and Funding Management Liquidity risk is generally defined as the current and prospective risk to earnings or capital arising from the Parent Company’s inability to meet its obligations when they become due without incurring unacceptable losses or costs.
The Parent Company’s liquidity management involves maintaining funding capacity to accommodate fluctuations in asset and liability levels due to changes in the Parent Company’s business operations or unanticipated events created by customer behavior or capital market conditions. The Parent Company seeks to ensure liquidity through a combination of active management of liabilities, a liquid asset portfolio composed substantially of deposits in primary and secondary reserves, and the securing of money market lines and the maintenance of repurchase facilities to address any unexpected liquidity situations.
Liquidity risk is monitored and controlled primarily by a gap analysis of maturities of relevant assets and liabilities reflected in the maximum cumulative outflow (MCO) report, as well as an analysis of available liquid assets. Furthermore, an internal liquidity ratio has been set to determine sufficiency of liquid assets over deposit liabilities.
Liquidity is managed by the Parent and subsidiaries on a daily basis, while scenario stress tests are conducted periodically. The table below shows the maturity profile of the Parent Company’s assets and liabilities, based on its internal methodology that manages liquidity based on contractual undiscounted cash flows:
December 31, 2010
On demand Less than
1 year 1 to 2 years 2 to 3 years 3 to 5 years Total (In Millions) Financial Assets Cash and other cash items P=6,362 P=– P=– P=– P=– P=6,362 Due from BSP 37,053 – – – – 37,053 Due from other banks 5,970 – – – – 5,970 Interbank loans receivable and
securities purchased under resale agreement 50 – – – – 50
Financial assets at FVPL – 5,584 357 – – 5,941 AFS financial assets – 1,082 1,911 4,674 42,803 50,470 49,435 6,666 2,268 4,674 42,803 105,846 Financial Liabilities Deposit liabilities 47,642 – – – – 47,642 Demand 31,607 79,925 – – – 111,532 Savings – 44,951 – 6,862 – 51,813 Time Bills payable BSP rediscounting – 73 – – – 73 Government lending program – 42 73 449 1,677 2,241 Others – 744 – – – 744 Manager’s checks – 304 – – – 304 Accrued interest and other expenses – 1,947 – – – 1,947 Derivative liabilities – 1,205 – – – 1,205

- 55 -
*SGVMC114803*
December 31, 2010
On demand Less than
1 year 1 to 2 years 2 to 3 years 3 to 5 years Total Other liabilities: Accounts payable P=– P=931 P=– P=– P=– P=931 Acceptances payable – 290 – – – 290 Due to PDIC – 201 – – – 201 Due to BSP – – – – – – Margin deposits – 6 – – – 6 Miscellaneous – 754 – – – 754 Total liabilities 79,249 131,373 73 7,311 1,677 219,683 Net Position (P=29,814) (P=124,707) P=2,195 (P=2,637) P=41,126 (P=113,837)
December 31, 2009
On demand Less than
1 year 1 to 2 years 2 to 3 years 3 to 5 years Total (In Millions) Financial Assets Cash and other cash items P=5,757 P=– P=– P=– P=– P=5,757 Due from BSP 11,554 – – – – 11,554 Due from other banks 6,762 – – – – 6,762 Interbank loans receivable and
securities purchased under resale agreement 11,848 – – – – 11,848
Financial assets at FVPL – 4,231 710 – – 4,941 AFS financial assets – 2,274 6,340 3,850 32,256 44,720 35,921 6,505 7,050 3,850 32,256 85,582 Financial Liabilities Deposit liabilities Demand 38,889 – – – – 38,889 Savings 27,029 70,821 – – – 97,850 Time – 45,236 1,904 2,920 5,000 55,060 Bills payable BSP rediscounting – 3,566 – – – 3,566 Government lending program – 37 132 16 2,035 2,220 Others – – – – – – Manager’s checks – 433 – – – 433 Accrued interest and other expenses – 1,835 – – – 1,835 Derivative liabilities – 339 – – – 339 Other liabilities: Accounts payable – 889 – – – 889 Other payables – 195 – – – 195 Acceptances payable – 190 – – – 190 Due to PDIC – 181 – – – 181 Due to BSP – – – – – – Margin deposits – 38 – – – 38 Miscellaneous – 324 – – – 324 Total liabilities 65,918 124,084 2,036 2,936 7,035 202,009 Net Position (P=29,997) (P=117,579) P=5,014 P=914 P=25,221 (P=116,427)
8. Debt and Equity Securities Classified as Financial Assets
Financial assets at FVPL consist of:
Consolidated Parent Company 2010 2009 2010 2009 Held-for-trading: Treasury notes P=2,473,765,465 P=1,208,687,841 P=2,473,765,465 P=1,208,687,841 Government bonds 2,405,612,065 1,005,379,293 2,405,612,065 1,005,379,293 BSP Treasury bills 359,705,660 1,149,294,187 359,705,660 1,149,294,187 Private bonds and commercial papers 344,478,918 637,134,653 344,478,918 637,134,653 5,583,562,108 4,000,495,974 5,583,562,108 4,000,495,974 Derivative assets (Note 23) 357,331,029 710,776,473 357,331,029 710,776,473 Designated at FVPL – 229,821,900 – 229,821,900 P=5,940,893,137 P=4,941,094,347 P=5,940,893,137 P=4,941,094,347

- 56 -
*SGVMC114803*
As of December 31, 2010 and 2009, HFT securities include fair value gain of P=138.73 million and P=134.37 million, respectively.
Designated at FVPL pertains to the Parent Company’s investment in Interest-linked structured products which will mature in 2011. In 2010, the Parent Company sold this investment at P=230.75 million for a realized loss of P=1.29 million. As of December 31, 2009, the carrying amount of designated at FVPL investments includes unrealized gain of P=32.28 million.
Both realized and unrealized gains and losses on HFT and designated at FVPL investments are included under Trading and securities gain/ (loss) - net in the statements of income (see Note 19).
AFS financial assets consist of:
Consolidated Parent Company 2010 2009 2010 2009 Quoted: Government bonds P=44,585,806,199 P=40,013,927,214 P=43,998,932,521 P=39,289,800,654 Private bonds 680,326,166 532,481,391 680,326,166 532,481,391 Equities 150,615,066 173,898,977 150,615,066 173,898,977 45,416,747,431 40,720,307,582 44,829,873,753 39,996,181,022 Unquoted: Credit-linked notes (host) 4,416,367,876 4,604,553,996 4,416,367,876 4,604,553,996 Private bonds and commercial
papers - net 1,204,439,584 100,019,655 1,204,439,584 100,019,655 Equities - net * 19,412,705 45,064,667 19,412,705 19,412,705 5,640,220,165 4,749,638,318 5,640,220,165 4,723,986,356 Total P=51,056,967,596 P=45,469,945,900 P=50,470,093,918 P=44,720,167,378 * Includes fully impaired equity investments with acquisition cost of P=3.25million for the Group and P=2.15 million for the Parent Company
On August 6, 2008, the BOD authorized the Parent Company to invest in Credit-linked notes (CLNs). Thereafter, the Parent Company invested US$100,000,000, in five separate agreements of US$20,000,000 each, in CLNs with a tenor of five years. The CLNs are linked to the performance of a specific ROP bond, the underlying bond collateral, and LIBOR. In the event of a credit event or a default event on the specific ROP bond or the bond collateral, the investment will unwind and the Parent Company will receive the deliverable obligation as defined under the contract. If no credit event or default event occurs, the Parent Company will receive the maturity value of the CLNs, which is the face amount. The CLNs bear floating interest based on 6 month USD LIBOR plus an agreed spread, payable semi-annually, and will mature in 2013.
The embedded credit derivatives on the above CLNs have been bifurcated (see Note 23) and the host contracts were classified under AFS financial assets.
Unquoted equity securities of the Group pertain to stocks of private corporations. These are classified as AFS financial assets and are carried at cost since fair value cannot be reliably estimated due to lack of reliable estimates of future cash flows and discount rates necessary to calculate the fair value. There is currently no market for these investments and the Group intends to hold them for the long term.
As of December 31, 2010 and 2009, AFS financial assets include fair value gain of P=1.86 billion and P=0.43 billion, respectively, for the Group and P=1.86 billion and P=0.42 billion, respectively, for the Parent Company. The fair value gains are recognized under other comprehensive income. No impairment loss was recognized in 2010, 2009 and 2008.

- 57 -
*SGVMC114803*
The movements in net unrealized gains (losses) on AFS financial assets follow:
Consolidated Parent Company 2010 2009 2010 2009 Balance at beginning of year P=427,495,719 (P=1,208,049,246) P=424,156,407 (P=1,201,540,145) Fair value gain for the year 2,832,461,940 2,043,834,437 2,799,775,800 2,033,986,024 Gains taken to profit or loss (Note 19) (1,402,058,073) (408,289,472) (1,365,653,205) (408,289,472) 1,430,403,867 1,635,544,965 1,434,122,595 1,625,696,552 Balance at end of year P=1,857,899,586 P=427,495,719 P=1,858,279,002 P=424,156,407
HTM financial assets consist of the following:
Consolidated Parent Company 2010 2009 2010 2009 Government bonds P=17,827,262,136 P=21,222,450,023 P=17,827,262,136 P=21,222,450,023 Private bonds 437,626,400 456,707,000 354,446,400 373,527,000 18,264,888,536 21,679,157,023 18,181,708,536 21,595,977,023 Unamortized premium - net 284,864,238 382,227,780 284,864,238 382,227,780 P=18,549,752,774 P=22,061,384,803 P=18,466,572,774 P=21,978,204,803
Reclassification of Financial Assets In 2008, the Parent Company identified assets for which it had a clear change of intent to hold the investments to maturity rather than to exit or trade these investments in the foreseeable future and reclassified those investments from AFS financial assets to HTM financial assets.
On December 3, 2008, the Parent Company’s BOD confirmed and ratified the resolution by the Audit and Risk Management Committees on November 19, 2008, to approve the reclassification of certain financial assets from AFS financial assets to HTM financial assets in the financial and regulatory reporting books of the Parent Company effective October 2, 2008.
As of October 2, 2008, the total carrying value of AFS financial assets reclassified to HTM financial assets amounted to P=9.04 billion, with unrealized losses of P=47.44 million deferred under ‘Net unrealized gains (losses) on AFS financial assets’ under other comprehensive income.
HTM financial assets reclassified from AFS financial assets with total face amount of P=1.41 billion and P=1.47 billion matured in 2010 and 2008, respectively.
The HTM financial assets reclassified from AFS financial assets have the following balances as of December 31, 2010 and 2009:
Face Value Original
Cost Carrying
Value Fair
Value
Unamortized Net Unrealized Loss Deferred
in Equity Amortization (In Thousands) 2010 Government bonds P=4,678,891 P=5,199,704 P=4,930,524 P=5,450,703 P=14,067 P=37,441 Private bonds 352,474 352,456 335,951 395,885 (16,509) 4,622 P=5,031,365 P=5,552,160 P=5,266,475 P=5,846,588 (P=2,442) P=42,063 2009 Government bonds P=6,429,569 P=7,049,473 P=6,795,385 P=7,196,507 (P=221) P=25,524 Private bonds 371,448 371,430 351,764 371,281 (19,668) 2,601 P=6,801,017 P=7,420,903 P=7,147,149 P=7,567,788 (P=19,889) P=28,125
Had these securities not been reclassified to HTM financial assets, additional mark-to-market gain that would have been credited to the statement of comprehensive income amounted to P=584.52 million, P=713.04 million and P=189.24 million in 2010, 2009 and 2008, respectively.

- 58 -
*SGVMC114803*
Effective interest rates on the reclassified securities range from 3.29% to 8.06%. The Parent Company expects to recover 100.00% of the principal and interest due on the reclassified investments totaling P=6.70 billion and P=9.05 billion, as of December 31, 2010 and 2009, respectively. No impairment loss was recognized on these securities in 2010, 2009 and 2008.
Interest Income on Debt Securities Interest income on trading and investment securities consists of:
Consolidated Parent Company 2010 2009 2008 2010 2009 2008 Financial assets at FVPL P=656,100,256 P=670,498,072 P=674,987,849 P=656,100,256 P=670,498,072 P=674,987,849 AFS financial assets 2,288,554,677 1,879,350,655 1,890,991,373 2,241,899,370 1,833,107,770 1,852,187,766 HTM financial assets 1,624,380,353 1,989,628,244 1,309,027,472 1,624,380,353 1,989,628,244 1,309,027,472 P=4,569,035,286 P=4,539,476,971 P=3,875,006,694 P=4,522,379,979 P=4,493,234,086 P=3,836,203,087
9. Loans and Receivables This account consists of:
Consolidated Parent Company 2010 2009 2010 2009 Loans and discounts Corporate lending P=101,914,246,079 P=94,861,571,107 P=101,183,966,431 P=94,271,989,735 Consumer lending 13,786,892,438 14,950,474,241 13,257,340,437 14,673,565,807 Others 126,118,604 158,736,056 120,878,187 132,359,729 115,827,257,121 109,970,781,404 114,562,185,055 109,077,915,271 Unearned discounts (1,053,956,330) (1,037,367,820) (957,159,185) (1,017,800,431) 114,773,300,791 108,933,413,584 113,605,025,870 108,060,114,840 Customers’ liabilities under letters of credit or
trust receipts 8,635,295,994 6,499,574,787 8,635,295,994 6,499,574,787 Bills purchased 1,541,307,052 2,324,908,991 1,541,307,052 2,324,908,991 124,949,903,837 117,757,897,362 123,781,628,916 116,884,598,618 Allowance for impairment and credit losses
(Note 14) (7,763,993,788) (7,538,442,114) (7,579,766,028) (7,369,675,664) P=117,185,910,049 P=110,219,455,248 P=116,201,862,888 P=109,514,922,954
The Group’s and Parent Company’s loans and discounts under corporate lending include unquoted debt securities amounting to P=11.81 billion and P=11.62 billion as of December 31, 2010, respectively and P=15.62 billion and P=15.27 billion as of December 31, 2009, respectively.
BSP Reporting
Information on the amounts of secured and unsecured loans and receivables (gross of unearned discounts and allowance for impairment and credit losses) of the Group and Parent Company are as follows:
Consolidated Parent Company 2010 2009 2010 2009 Amounts % Amounts % Amounts % Amounts % Loans secured by: Real estate P=22,396,398,247 17.78 P=22,250,081,594 18.73 P=21,902,571,620 17.56 P=21,467,299,523 18.20 Deposit hold out 1,526,758,521 1.21 7,441,806,851 6.26 1,515,893,141 1.22 7,441,806,851 6.31 Chattel mortgage 3,151,288,151 2.50 1,836,668,381 1.55 2,587,465,253 2.07 1,744,423,222 1.48
Shares of stock of other banks – – 1,599,530,300 1.35 – – 1,599,530,300 1.36 Others 23,565,689,499 18.70 23,868,823,033 20.09 23,565,689,499 18.89 23,868,323,033 20.20 50,640,134,418 40.19 56,996,910,159 47.98 49,571,619,513 39.74 56,121,382,929 47.60 Unsecured loans 75,363,725,749 59.81 61,798,355,023 52.02 75,167,168,588 60.26 61,781,016,120 52.40
P=126,003,860,167 100.00 P=118,795,265,182 100.00 P=124,738,788,101 100.00 P=117,902,399,049 100.00

- 59 -
*SGVMC114803*
Loans and receivables of the Group amounting to P=0.07 billion and P=3.57 billion as of December 31, 2010 and 2009, respectively, are pledged to secure certain bills payable to the BSP under the Parent Company’s rediscounting privileges (see Note 16).
Information on the concentration of credit as to industry of the Group and Parent Company follows:
Consolidated 2010 2009 Amounts % Amounts % Real estate, renting and business services P=27,292,478,462 21.66 P=25,723,596,196 21.65 Agriculture 19,744,403,240 15.67 18,942,575,433 15.95 Transportation, storage and communication 19,084,206,524 15.15 13,431,161,777 11.31 Manufacturing 16,068,273,071 12.75 15,222,691,861 12.81 Wholesale and retail trade 14,306,240,328 11.35 11,703,614,214 9.85 Electricity, gas and water 6,562,114,419 5.21 10,635,081,815 8.95 Financial intermediaries 2,858,556,063 2.27 11,129,678,290 9.37 Construction 1,792,546,132 1.42 1,170,690,998 0.99 Mining and quarrying 692,591,458 0.55 53,713,843 0.04 Others 17,602,450,470 13.97 10,782,460,755 9.08 P=126,003,860,167 100.00 P=118,795,265,182 100.00
Parent Company 2010 2009 % Amounts % Real estate, renting and business services P=27,036,606,798 21.67 P=25,214,433,180 21.39 Agriculture 19,636,003,240 15.74 18,824,014,129 15.97 Transportation, storage and communication 19,062,723,319 15.28 13,423,075,270 11.38 Manufacturing 16,057,308,442 12.87 15,214,769,762 12.90 Wholesale and retail trade 14,278,579,551 11.45 11,677,057,892 9.90 Electricity, gas and water 6,562,114,419 5.26 10,635,081,815 9.02 Financial intermediaries 2,706,719,754 2.18 11,129,678,290 9.44 Construction 1,763,798,728 1.41 1,143,430,465 0.97 Mining and quarrying 692,591,458 0.56 53,713,843 0.05 Others 16,942,342,392 13.58 10,587,144,403 8.98 P=124,738,788,101 100.00 P=117,902,399,049 100.00
The BSP considers that loan concentration exists when total loan exposure to a particular industry
or economic sector exceeds 30.00% of total loan portfolio. As of December 31, 2010 and 2009, the Group does not have credit concentration in any particular industry.
BSP Circular No. 351 allows banks to exclude from nonperforming classification receivables
classified as “Loss” in the latest examination of the BSP which are fully covered by allowance for credit losses, provided that interest on said receivables shall not be accrued and that such receivables shall be deducted from the total receivable portfolio for purposes of computing non-performing loans. As of December 31, 2010 and 2009, nonperforming loans (NPLs) of the Group and Parent Company not fully covered by allowance for impairment and credit losses follow:
Consolidated Parent Company 2010 2009 2010 2009 Total NPLs P=6,119,322,019 P=6,124,439,202 P=6,085,317,834 P=6,054,786,533 Less NPLs fully covered by allowance for impairment and credit losses 1,305,938,361 1,454,143,903 1,303,474,594 1,453,611,496 P=4,813,383,658 P=4,670,295,299 P=4,781,843,240 P=4,601,175,037

- 60 -
*SGVMC114803*
As of December 31, 2010 and 2009, secured and unsecured NPLs of the Group and Parent Company follow:
Consolidated Parent Company 2010 2009 2010 2009 Secured P=3,737,158,440 P=4,392,299,173 P=3,703,686,663 P=4,322,646,504 Unsecured 2,382,163,579 1,732,140,029 2,381,631,171 1,732,140,029 P=6,119,322,019 P=6,124,439,202 P=6,085,317,834 P=6,054,786,533
The estimated aggregate fair value of collaterals held by the Parent Company pertaining to the
NPLs as of December 31, 2010 and 2009 amounted to P=6.15 billion and P=6.07 billion, respectively.
10. Equity Investments
The Parent Company’s investments consist of:
Effective Percentages
of Ownership 2010 2009 2010 2009 Subsidiaries: CBSI 95.08% 95.06% P=1,123,299,690 P=1,122,827,030 CBC Forex Corporation 100.00% 100.00% 50,000,000 50,000,000 CBC Properties and Computer Center, Inc.
(CBC-PCCI) 100.00% 100.00% 2,439,000 2,439,000 Chinabank Insurance Brokers, Inc. 100.00% 100.00% 1,500,000 1,500,000 1,177,238,690 1,176,766,030 Associate: Manulife China Bank Life Assurance Corporation
(MCB Life) 5.00% 5.00% 17,495,838 13,745,839 P=1,194,734,528 P=1,190,511,869
The foregoing balances represent the acquisition cost of the Parent Company’s subsidiaries and associate.
CBSI As discussed in Note 4, the Parent Company acquired 91.82% of CBSI’s equity interest for P=1.73 billion. Subsequently, on November 21, 2007, the BOD approved the transfer of certain assets and liabilities (including certain branches) of CBSI to the Parent Company. As the economic value of goodwill arising from the CBSI acquisition can be attributed to the branches transferred, such goodwill was transferred to the books of the Parent Company. The branch licenses pertaining to the branches transferred were also transferred to the Parent Company. The transfers resulted to a reduction of the investment account of the Parent Company by P=0.66 billion as of December 31, 2007.
CBC Forex
On May 5, 2009 the BOD approved to dissolve the operations of the Company by shortening its corporate life until December 31, 2009. The Company is still in the process of liquidation and awaiting clearance from regulatory bodies to effect dissolution.

- 61 -
*SGVMC114803*
Investment in associates Investment in associates in the consolidated financial statements pertain to the Parent Company’s investment in MCB Life and CBC-PCCI’s investment in Urban Shelters amounting to P=3.24 million (accounted for by CBC-PCCI as an investment in associate). The equity in net earnings of these investments is not significant.
MCB Life On August 2, 2006, the BOD approved the joint project proposal of the Parent Company with Manufacturers Life Insurance Company (Manulife). Under the proposal, the Parent Company will invest in a life insurance company owned by Manulife, and such company will be offering innovative insurance and financial products for health, wealth and education through the Parent Company’s branches nationwide. The life insurance company was incorporated as The Pramerica Life Insurance Company Inc. in 1998 but the name was changed to Manulife China Bank Life Assurance Corporation on March 23, 2007. The Parent Company acquired 5.00% interest of MCB Life on August 8, 2007. This investment is accounted for as an investment in associate by virtue of the Bancassurance Alliance Agreement which provides the Parent Company to be represented in MCB Life’s BOD and thus exercise significant influence over the latter.
The Parent Company contributed P=3.75 million and P=2.50 million in 2010 and 2009, respectively, to maintain the minimum 5.00% ownership required by the BSP in order for MCB Life to be allowed to continue distributing its insurance products through the Parent Company’s branches.
Commission income earned by the Parent Company from its bancassurance agreement amounting to P=82.19 million, P=18.91 million and nil in 2010, 2009 and 2008, respectively is included under ‘Miscellaneous income’ in the statements of income.
11. Bank Premises, Furniture, Fixtures and Equipment
The composition of and movements in this account follow:
Consolidated
Land
Furniture, Fixtures and
Equipment Buildings Leasehold
Improvements Construction-in-
Progress 2010
Total Cost Balance at beginning of year P=2,808,186,258 P=3,495,561,273 P=1,102,845,786 P=535,158,854 P=– P=7,941,752,171 Additions 7,689,092 407,170,122 50,614,003 117,586,284 972,134 584,031,635 Disposals – (62,554,026) – – – (62,554,026) Balance at end of year 2,815,875,350 3,840,177,369 1,153,459,789 652,745,138 972,134 8,463,229,780 Accumulated Depreciation
and Amortization Balance at beginning of year – 2,542,000,682 365,931,432 244,850,965 – 3,152,783,079 Depreciation and amortization – 409,546,689 39,640,133 66,437,896 – 515,624,718 Disposals – (42,757,597) – – – (42,757,597) Balance at end of year – 2,908,789,774 405,571,565 311,288,861 – 3,625,650,200 Net book value at end of year P=2,815,875,350 P=931,387,595 P=747,888,224 P=341,456,277 P=972,134 P=4,837,579,580
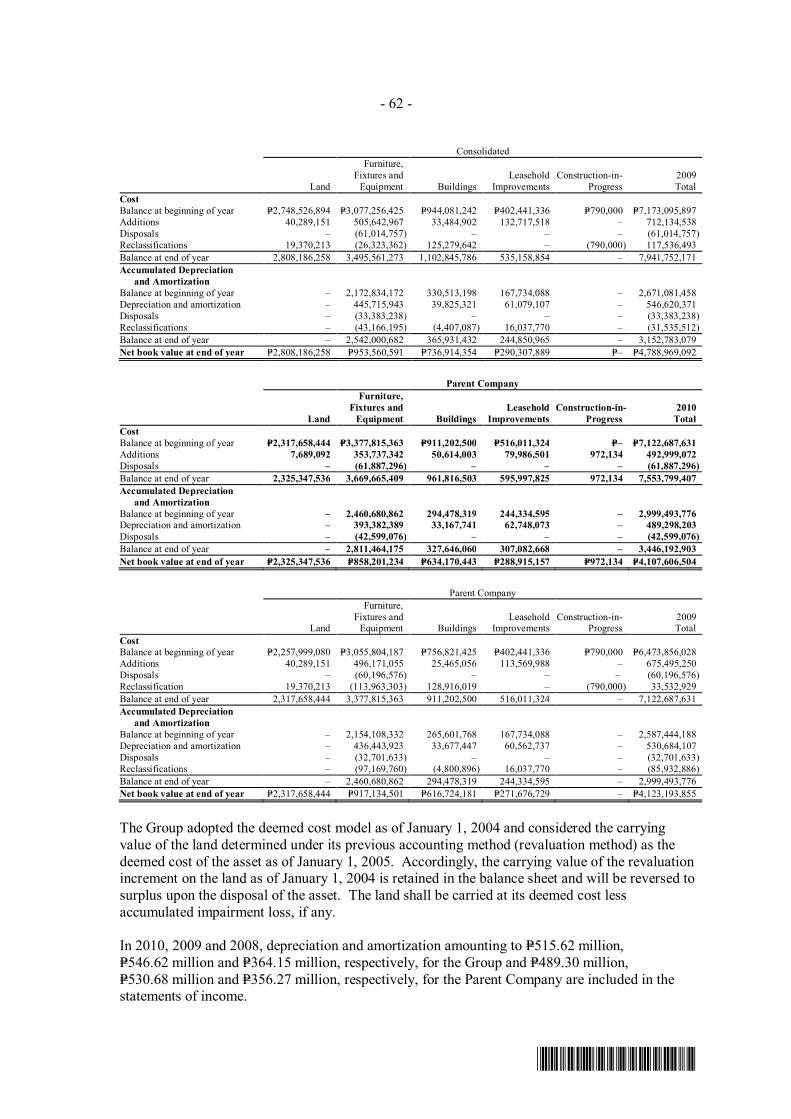
- 62 -
*SGVMC114803*
Consolidated
Land
Furniture, Fixtures and
Equipment Buildings Leasehold
Improvements Construction-in-
Progress 2009 Total
Cost Balance at beginning of year P=2,748,526,894 P=3,077,256,425 P=944,081,242 P=402,441,336 P=790,000 P=7,173,095,897 Additions 40,289,151 505,642,967 33,484,902 132,717,518 – 712,134,538 Disposals – (61,014,757) – – – (61,014,757) Reclassifications 19,370,213 (26,323,362) 125,279,642 – (790,000) 117,536,493 Balance at end of year 2,808,186,258 3,495,561,273 1,102,845,786 535,158,854 – 7,941,752,171 Accumulated Depreciation
and Amortization Balance at beginning of year – 2,172,834,172 330,513,198 167,734,088 – 2,671,081,458 Depreciation and amortization – 445,715,943 39,825,321 61,079,107 – 546,620,371 Disposals – (33,383,238) – – – (33,383,238) Reclassifications – (43,166,195) (4,407,087) 16,037,770 – (31,535,512) Balance at end of year – 2,542,000,682 365,931,432 244,850,965 – 3,152,783,079 Net book value at end of year P=2,808,186,258 P=953,560,591 P=736,914,354 P=290,307,889 P=– P=4,788,969,092
Parent Company
Land
Furniture, Fixtures and
Equipment Buildings Leasehold
Improvements Construction-in-
Progress 2010
Total Cost Balance at beginning of year P=2,317,658,444 P=3,377,815,363 P=911,202,500 P=516,011,324 P=– P=7,122,687,631 Additions 7,689,092 353,737,342 50,614,003 79,986,501 972,134 492,999,072 Disposals – (61,887,296) – – – (61,887,296) Balance at end of year 2,325,347,536 3,669,665,409 961,816,503 595,997,825 972,134 7,553,799,407 Accumulated Depreciation
and Amortization Balance at beginning of year – 2,460,680,862 294,478,319 244,334,595 – 2,999,493,776 Depreciation and amortization – 393,382,389 33,167,741 62,748,073 – 489,298,203 Disposals – (42,599,076) – – – (42,599,076) Balance at end of year – 2,811,464,175 327,646,060 307,082,668 – 3,446,192,903 Net book value at end of year P=2,325,347,536 P=858,201,234 P=634,170,443 P=288,915,157 P=972,134 P=4,107,606,504
Parent Company
Land
Furniture, Fixtures and
Equipment Buildings Leasehold
Improvements Construction-in-
Progress 2009 Total
Cost Balance at beginning of year P=2,257,999,080 P=3,055,804,187 P=756,821,425 P=402,441,336 P=790,000 P=6,473,856,028 Additions 40,289,151 496,171,055 25,465,056 113,569,988 – 675,495,250 Disposals – (60,196,576) – – – (60,196,576) Reclassification 19,370,213 (113,963,303) 128,916,019 – (790,000) 33,532,929 Balance at end of year 2,317,658,444 3,377,815,363 911,202,500 516,011,324 – 7,122,687,631 Accumulated Depreciation
and Amortization Balance at beginning of year – 2,154,108,332 265,601,768 167,734,088 – 2,587,444,188 Depreciation and amortization – 436,443,923 33,677,447 60,562,737 – 530,684,107 Disposals – (32,701,633) – – – (32,701,633) Reclassifications – (97,169,760) (4,800,896) 16,037,770 – (85,932,886) Balance at end of year – 2,460,680,862 294,478,319 244,334,595 – 2,999,493,776 Net book value at end of year P=2,317,658,444 P=917,134,501 P=616,724,181 P=271,676,729 – P=4,123,193,855
The Group adopted the deemed cost model as of January 1, 2004 and considered the carrying value of the land determined under its previous accounting method (revaluation method) as the deemed cost of the asset as of January 1, 2005. Accordingly, the carrying value of the revaluation increment on the land as of January 1, 2004 is retained in the balance sheet and will be reversed to surplus upon the disposal of the asset. The land shall be carried at its deemed cost less accumulated impairment loss, if any.
In 2010, 2009 and 2008, depreciation and amortization amounting to P=515.62 million, P=546.62 million and P=364.15 million, respectively, for the Group and P=489.30 million, P=530.68 million and P=356.27 million, respectively, for the Parent Company are included in the statements of income.

- 63 -
*SGVMC114803*
As of December 31, 2010 and 2009, the carrying value of fully depreciated property and equipment still in use amounted to P=0.25 million and P=0.07 million, respectively, for the Group and P=0.25 million and P=0.07 million, respectively, for the Parent Company.
12. Investment Properties
The composition of and movements in the Group’s and the Parent Company’s investment properties follow:
Consolidated
Land Buildings and
Improvements 2010
Total Cost Balance at beginning of year P=4,275,417,023 P=1,220,580,297 P=5,495,997,320 Additions 152,203,603 346,910,884 499,114,487 Disposals (746,237,886) (136,442,044) (882,679,930) Reclassification 21,539,164 50,651,877 72,191,041 Balance at end of year 3,702,921,904 1,481,701,014 5,184,622,918 Accumulated Depreciation and Amortization Balance at beginning of year – 507,717,565 507,717,565 Depreciation and amortization – 131,168,520 131,168,520 Disposals – (90,983,127) (90,983,127) Reclassification – (32,811,348) (32,811,348) Balance at end of year – 515,091,610 515,091,610 Accumulated Impairment Loss (Notes 14 and 33) Balance at beginning of year 1,068,777,067 67,868,344 1,136,645,411 Provisions 105,600,535 90,088,147 195,688,682 Reclassification 12,125,127 – 12,125,127 Balance at end of year 1,186,502,729 157,956,491 1,344,459,220 Net book value at end of year P=2,516,419,175 P=808,652,913 P=3,325,072,088
Consolidated
Land Buildings and Improvements
2009 Total
Cost Balance at beginning of year P=4,249,835,713 P= 1,111,405,025 P= 5,361,240,738 Additions 503,779,731 255,347,937 759,127,668 Disposals (423,720,574) (129,897,490) (553,618,064) Reclassification (54,477,847) (16,275,175) (70,753,022) Balance at end of year 4,275,417,023 1,220,580,297 5,495,997,320 Accumulated Depreciation and Amortization Balance at beginning of year – 471,257,483 471,257,483 Depreciation and amortization – 121,350,350 121,350,350 Disposals – (74,786,353) (74,786,353) Reclassification – (10,103,915) (10,103,915) Balance at end of year – 507,717,565 507,717,565 Accumulated Impairment Loss (Notes 14 and 33) Balance at beginning of year 720,321,350 176,522,385 896,843,735 Provisions 239,801,676 – 239,801,676 Reclassification 108,654,041 (108,654,041) – Balance at end of year 1,068,777,067 67,868,344 1,136,645,411 Net book value at end of year P=3,206,639,956 P=644,994,388 P=3,851,634,344

- 64 -
*SGVMC114803*
Parent Company
Land Buildings and
Improvements 2010
Total Cost Balance at beginning of year P=4,188,018,643 P=1,133,191,184 P=5,321,209,827 Additions 142,918,917 334,367,986 477,286,903 Disposals (720,277,504) (134,738,486) (855,015,990) Reclassifications 13,524,526 52,777,301 66,301,827 Balance at end of year 3,624,184,582 1,385,597,985 5,009,782,567 Accumulated Depreciation and Amortization Balance at beginning of year – 498,036,272 498,036,272 Depreciation and amortization – 124,363,470 124,363,470 Disposals – (90,615,371) (90,615,371) Reclassifications – (24,685,844) (24,685,844) Balance at end of year – 507,098,527 507,098,527 Accumulated Impairment Loss (Note 14) Balance at beginning of year 1,068,777,067 56,140,125 1,124,917,192 Provisions 117,725,662 77,963,020 195,688,682 Balance at end of year 1,186,502,729 134,103,145 1,320,605,874 Net book value at end of year P=2,437,681,853 P=744,396,313 P=3,182,078,166
Parent Company
Land Buildings and Improvements
2009 Total
Cost Balance at beginning of year P=4,199,153,440 P=1,042,626,958 P=5,241,780,398 Additions 442,065,127 249,501,969 691,567,096 Disposals (398,722,078) (146,702,730) (545,424,808) Reclassifications (54,477,846) (12,235,013) (66,712,859) Balance at end of year 4,188,018,643 1,133,191,184 5,321,209,827 Accumulated Depreciation and Amortization Balance at beginning of year – 468,329,954 468,329,954 Depreciation and amortization – 114,748,671 114,748,671 Disposals – (74,786,353) (74,786,353) Reclassifications – (10,256,000) (10,256,000) Balance at end of year – 498,036,272 498,036,272 Accumulated Impairment Loss (Note 14) Balance at beginning of year 720,321,350 164,794,166 885,115,516 Provisions 239,801,676 – 239,801,676 Reclassifications 108,654,041 (108,654,041) – Balance at end of year 1,068,777,067 56,140,125 1,124,917,192 Net book value at end of year P=3,119,241,576 P=579,014,787 P=3,698,256,363
The Group’s investment properties consist entirely of real estate properties acquired in settlement of loans and receivables (previously classified as ROPA). The difference between the fair value of the asset upon foreclosure and the carrying value of the loan is recognized under ‘Gain on asset foreclosure and dacion transactions’ in the statements of income.
The aggregate fair value of the investment properties as of December 31, 2010 and 2009 amounted to P=7.00 billion and P=6.62 billion, respectively, for the Group and P=6.70 billion and P=6.35 billion, respectively, for the Parent Company. The fair values of the Group’s and Parent Company’s investment properties have been determined by the appraisal method by independent

- 65 -
*SGVMC114803*
external and in-house appraisers on the basis of recent sales of similar properties in the same areas as the investment properties and taking into account the economic conditions prevailing at the time the valuations were made.
In 2010, 2009 and 2008, depreciation and amortization amounting to P=131.17 million, P=121.35 million and P=106.84 million, respectively, for the Group and P=124.36 million, P=114.75 million and P=105.95 million, respectively, for the Parent Company, are included in the statements of income under ‘Depreciation and amortization’ account.
Details of rent income and direct operating expenses on investment properties of the Parent follow:
2010 2009 2008
Rent income on investment properties P=29,068,291 P=18,132,880 P=15,093,784 Direct operating expenses on investment properties
generating rent income 2,966,028 2,790,751 4,238,329 Direct operating expenses on investment properties
not generating rent income 25,918,581 38,426,761 40,003,614
Rent income earned from leasing investment properties is included under ‘Miscellaneous income’ in the statements of income.
13. Branch Licenses, Goodwill and Other Assets
Branch Licenses and Goodwill Branch licenses and goodwill arise from the Parent Company’s acquisition of CBSI (see Note 4).
Goodwill represents the excess of the acquisition cost over the fair value of the identifiable assets and liabilities of CBSI. Such goodwill can be attributed to factors such as increase in geographical presence and customer base due to branches acquired. As such, the Parent Company’s Branch Banking Group (BBG) has been identified as the cash generating unit (CGU) for impairment testing of the goodwill. The BBG has also been identified as the CGU for impairment testing of the Branch licenses.
The recoverable amount of the CGU has been determined based on a value-in-use calculation using cash flow projections from financial budgets approved by senior management covering a five-year period. The discount rate applied to cash flow projections is 14.38% in 2010 and 11.63% in 2009 and cash flows beyond the five year-period are extrapolated using a steady growth rate of 3.00% in 2010 and in 2009, which does not exceed the long-term average growth rate for the industry.
The calculation of the value-in-use of the CGU is most sensitive to the following assumptions:
• Interest margin • Discount rates • Market share during the budget period • Steady growth rate used to extrapolate cash flows beyond the budget period • Local inflation rates

- 66 -
*SGVMC114803*
With regard to the assessment of value-in-use of the CGU, management believes that no reasonably possible change in any of the above key assumptions would cause the carrying value of the goodwill and branch licenses to materially exceed its recoverable amount.
Other Assets This account consists of:
Consolidated Parent Company 2010 2009 2010 2009 Accounts receivable P=1,122,004,884 P=694,165,763 P=1,022,329,591 P=634,403,872 Sales contracts receivable (SCR) 637,050,866 541,592,162 460,596,948 314,860,013 Creditable withholding taxes (CWT) 369,273,717 340,686,891 243,376,816 218,569,289 Returned checks and other cash items in
process of collection (RCOCI) 247,868,553 360,104,596 247,517,014 360,104,596 Net plan assets (Note 22) 245,092,771 245,632,087 246,452,025 246,452,025 Escrow deposits – 194,583,829 – 194,583,829 Due from affiliate (Note 27) – – 99,600,589 108,231,847 Miscellaneous 718,884,716 623,140,656 654,166,997 597,963,647 3,340,175,507 2,999,905,984 2,974,039,980 2,675,169,118 Allowance for impairment and credit
losses (Note 14) (434,658,645) (387,548,287) (418,526,839) (370,361,631) P=2,905,516,862 P=2,612,357,697 P=2,555,513,141 P=2,304,807,487
Accounts receivable pertains mainly to advances to officers and employees. These are short-term noninterest bearing receivables.
Miscellaneous assets consist mainly of prepaid expenses, documentary stamps, unissued stationary and supplies, inter-office float items, security deposits and deposits for various services, and downpayment for purchase of real properties.
The following tables present the reconciliation of the movement of the allowance for impairment and credit losses for Other assets:
Consolidated
Accounts
Receivable SCR Miscellaneous Total At January 1, 2010 (Note 33) P=135,922,176 P=28,222,891 P=223,403,220 P=387,548,287 Provisions during the year (Note 14) 6,111 – 48,885,189 48,891,300 Transfers/others (545,691) – (1,235,251) (1,780,942) At December 31, 2010 P=135,382,596 P=28,222,891 P=271,053,158 P=434,658,645 At January 1, 2009 (Note 33) P=135,799,629 P=28,132,690 P= 178,145,236 P= 342,077,555 Provisions during the year (Note 14) 1,384,805 – 49,884,788 51,269,593 Transfers/others (1,262,258) 90,201 (4,626,804) (5,798,861) At December 31, 2009 P=135,922,176 P=28,222,891 P=223,403,220 P=387,548,287
Parent Company
Accounts
receivable SCR Miscellaneous Total At January 1, 2010 P=135,922,176 P=28,222,891 P=206,216,564 P=370,361,631 Provisions during the year 6,111 – 48,885,189 48,891,300 Transfers/others (726,092) – – (726,092) At December 31, 2010 P=135,202,195 P=28,222,891 P=255,101,753 P=418,526,839 At January 1, 2009 P=135,799,629 P=28,132,690 P=174,844,841 P=338,777,160 Provisions during the year 1,384,805 – 49,884,788 51,269,593 Transfers/others (1,262,258) 90,201 (18,513,065) (19,685,122) At December 31, 2009 P=135,922,176 P=28,222,891 P=206,216,564 P=370,361,631

- 67 -
*SGVMC114803*
14. Allowance for Impairment and Credit Losses
Changes in the allowance for impairment and credit losses are as follows:
Consolidated Parent Company 2010 2009 2010 2009 Balances at beginning of year: (Note 33) Loans and receivables P=7,538,442,114 P=7,434,794,840 P=7,369,675,664 P=7,275,113,083 Investment properties 1,136,645,411 896,843,735 1,124,917,192 885,115,516 AFS financial assets 150,192,685 150,192,685 44,457,141 44,457,141 Other assets 387,548,287 342,077,555 370,361,631 338,777,160 9,212,828,497 8,823,908,815 8,909,411,628 8,543,462,900 Provisions charged to operations
(Notes 12 and 13) 495,830,652 792,384,146 495,830,652 792,384,146 Accounts charged off and others (162,298,995) (403,464,464) (84,194,538) (426,435,418) 333,531,657 388,919,682 411,636,114 365,948,728 Balances at end of year: Loans and receivables 7,763,993,788 7,538,442,114 7,579,766,028 7,369,675,664 Investment properties 1,344,459,220 1,136,645,411 1,320,605,874 1,124,917,192 AFS financial assets 3,248,501 150,192,685 2,149,001 44,457,141 Other assets 434,658,645 387,548,287 418,526,839 370,361,631 P=9,546,360,154 P=9,212,828,497 P=9,321,047,742 P=8,909,411,628
At the current level of allowance for impairment and credit losses, management believes that the Group has sufficient allowance to cover any losses that may be incurred from the non-collection or non-realization of its loans and receivables and other risk assets.
A reconciliation of the allowance for credit losses for receivables from customers and AFS financial assets is as follows:
Consolidated 2010
Loans and Receivables AFS Financial
Assets
Corporate
Lending Consumer
Lending Others Total Unquoted Securities
At January 1, 2010 (Note 33) P=6,999,137,051 P=455,096,479 P=84,208,584 P=7,538,442,114 P=150,192,685 Provisions during the year 222,603,292 70,955,518 – 293,558,810 (42,308,140) Transfers/others 180,673,021 (165,680,355) (82,999,802) (68,007,136) (104,636,044) At December 31, 2010 P=7,402,413,364 P=360,371,642 P=1,208,782 P=7,763,993,788 P=3,248,501 Individual impairment P=5,109,719,354 P=271,183,208 P=1,208,782 P=5,382,111,344 P=3,248,501 Collective impairment 2,292,694,010 89,188,434 – 2,381,882,444 – P=7,402,413,364 P=360,371,642 P=1,208,782 P=7,763,993,788 P=3,248,501
Consolidated 2009
Loans and Receivables AFS Financial
Assets
Corporate
Lending Consumer
Lending Others Total Unquoted Securities
At January 1, 2009 (Note 33) P=6,531,363,845 P=443,790,821 P=459,640,174 P=7,434,794,840 P=150,192,685 Provisions during the year 462,739,127 32,557,348 6,016,402 501,312,877 – Accounts charged off (350,451,947) – – (350,451,947) – Transfers/others 355,486,026 (21,251,690) (381,447,992) (47,213,656) – At December 31, 2009 P=6,999,137,051 P=455,096,479 P=84,208,584 P=7,538,442,114 P=150,192,685 Individual impairment P=5,133,222,204 P=276,058,867 P=84,208,584 P=5,493,489,655 P=150,192,685 Collective impairment 1,865,914,847 179,037,612 – 2,044,952,459 – P=6,999,137,051 P=455,096,479 P=84,208,584 P=7,538,442,114 P=150,192,685

- 68 -
*SGVMC114803*
Parent Company 2010
Loans and Receivables AFS Financial
Assets
Corporate
Lending Consumer
Lending Others Total Unquoted Securities
At January 1, 2010 P=6,831,006,867 P=454,651,876 P=84,016,921 P=7,369,675,664 P=44,457,141 Provisions during the year 222,603,292 70,955,518 – 293,558,810 (42,308,140) Transfers/others 165,020,048 (165,680,355) (82,808,139) (83,468,446) – At December 31, 2010 P=7,218,630,207 P=359,927,039 P=1,208,782 P=7,579,766,028 P=2,149,001 Individual impairment P=4,957,883,046 P=271,183,207 1,208,782 P=5,230,275,035 P=2,149,001 Collective impairment 2,260,747,161 88,743,832 – 2,349,490,993 – P=7,218,630,207 P=359,927,039 P=1,208,782 P=7,579,766,028 P=2,149,001
Parent Company 2009
Loans and Receivables AFS Financial
Assets
Corporate
Lending Consumer
Lending Others Total Unquoted Securities
At January 1, 2009 P=6,372,318,354 P=443,346,218 P=459,448,511 P=7,275,113,083 P= 44,457,141 Provisions during the year 462,739,127 32,557,348 6,016,402 501,312,877 – Accounts charged off (350,451,947) – – (350,451,947) – Transfers/others 346,401,333 (21,251,690) (381,447,992) (56,298,349) – At December 31, 2009 P=6,831,006,867 P=454,651,876 P=84,016,921 P=7,369,675,664 P= 44,457,141 Individual impairment P=4,981,385,895 P=276,058,867 P=84,016,921 P=5,341,461,683 P= 44,457,141 Collective impairment 1,849,620,972 178,593,009 – 2,028,213,981 – P=6,831,006,867 P=454,651,876 P=84,016,921 P=7,369,675,664 P= 44,457,141
The gross amount of the loans and receivables that were individually determined to be impaired as of December 31, 2010 and 2009 amounted to P=7.57 billion and P=7.98 billion, respectively, for the Group and P=7.54 billion and P=7.87 billion, respectively, for the Parent Company.
Accretion of individually impaired loans and receivables of the Parent Company included as part of interest income amounted to P=49.52 million, P=55.01 million and P=140.49 million in 2010, 2009 and 2008, respectively.
15. Deposit Liabilities
As of December 31, 2010 and 2009, 59.90% and 62.84%, respectively, of the total deposit liabilities of the Group are subject to periodic interest repricing. The remaining deposit liabilities earn annual fixed interest rates ranging from 0.38% to 8.25% in 2010 and 2009.
On April 2, 2008, the Parent Company's BOD authorized the issuance of Long-Term Negotiable Certificates of Deposit (LTNCDs) to expand its asset base. On August 8, 2008, the Parent Company issued at par 5-year LTNCDs with aggregate principal amount of P=5.0 billion maturing on August 9, 2013. The LTNCDs are included under the ‘Time deposit liabilities’ account. The LTNCDs bear a coupon rate of 8.25% per annum, payable quarterly at the end of each 3-month period. The statutory reserve for LTNCD is 2.00%. It is not subject to liquidity reserve based on the MORBs under the section on Deposit Substitutes.
Under existing BSP regulations, non-FCDU deposit liabilities of the Group are subject to liquidity reserve equivalent to 11% and statutory reserve equivalent to 8.0%. As of December 31, 2010 and 2009, the Group is in compliance with such regulations.

- 69 -
*SGVMC114803*
Available reserves of the Group per latest report submitted to the BSP are as follows:
2010 2009 Cash and other cash items P=6,534,315,165 P=5,932,819,170 Due from BSP 6,337,007,013 5,121,868,112 Loans and receivables 16,924,705,824 14,852,348,075 P=29,796,028,002 P=25,907,035,357
16. Bills Payable
The Group’s and the Parent Company’s bills payable consist of:
2010 2009 Government lending programs P=2,241,135,483 P=2,219,764,540 BSP - rediscounting (Note 9) 73,333,289 3,565,907,112 Others 743,774,390 – P=3,058,243,162 P=5,785,671,652
Details of the government lending programs follow:
Counterparty Average term Rates 2010 2009
Development Bank of the Philippines 7 years 5.50% to 9.70% P=1,627,574,940 P=1,810,637,748 Land Bank of the Philippines 7 years 5.89% to 6.66% 612,916,667 407,976,925 Social Security Services 15 years 12% 643,876 1,149,867 P=2,241,135,483 P=2,219,764,540
17. Accrued Interest and Other Expenses This account consists of:
Consolidated Parent Company 2010 2009 2010 2009 Accrued other expenses payable P=1,464,828,847 P=1,336,032,581 P=1,438,130,091 P=1,309,510,201 Accrued interest payable 508,765,681 527,085,581 508,765,681 525,214,465 P=1,973,594,528 P=1,863,118,162 P=1,946,895,772 P=1,834,724,666
As of December 31, 2010 and 2009 , the accrued other expenses payable includes the Group’s accrual for various operating expenses such as vacation leave credits of employees, utilities and rental expenses.

- 70 -
*SGVMC114803*
18. Other Liabilities
This account consists of:
Consolidated Parent Company 2010 2009 2010 2009 Accounts payable (Note 27) P=1,013,305,589 P=976,336,346 P=931,157,343 P=889,325,606 Acceptances payable 289,603,819 189,854,859 289,603,819 189,854,859 Due to PDIC* 200,551,936 181,036,256 200,551,936 181,036,256 Margin deposits 5,765,386 37,660,145 5,765,386 37,660,145 Due to BSP 21,500 16,861 21,500 16,861 Other payables – 194,583,829 – 194,583,829 Miscellaneous 784,416,671 346,457,637 753,879,948 323,591,540 P=2,293,664,901 P=1,925,945,933 P=2,180,979,932 P=1,816,069,096
*Philippine Deposit Insurance Corporation Accounts payable includes payables to suppliers and service providers, and loan payments and
other charges received from customers in advance.
Other payables pertain to the Parent Company’s payable to the former shareholders of CBSI in relation to the acquisition in September 2007 (see Note 4). The Parent Company settled such payable in 2010.
Miscellaneous liabilities mainly include capitalized interest on restructured loans and cash letters
of credits. 19. Trading and Securities Gain (Loss)
This account consists of:
Consolidated Parent Company 2010 2009 2008 2010 2009 2008Financial assets at FVPL: Held-for-trading P=304,524,740 P=319,030,522 (P=86,260,132) P=304,524,740 P=318,588,974 (P=86,260,132) Designated at FVPL (1,288,640) 64,842,275 (40,974,746) (1,288,639) 65,283,823 (40,974,746)
Embedded credit derivatives (Note 23) 45,997,975 396,293,395 (265,268,834) 45,997,975 396,293,395 (265,268,834)
AFS financial assets 1,402,058,073 408,289,472 291,553,633 1,365,653,205 408,289,472 291,553,633 P=1,751,292,148 P=1,188,455,664 (P=100,950,079) P=1,714,887,281 P=1,188,455,664 (P=100,950,079)

- 71 -
*SGVMC114803*
20. Maturity Analysis of Assets and Liabilities The following tables present both the Group’s and Parent Company’s assets and liabilities as of
December 31, 2010 and 2009 analyzed according to when they are expected to be recovered or settled within one year and beyond one year from the balance sheets date:
Consolidated 2010 2009
Less than
Twelve Months Over
Twelve Months Total Less than
Twelve Months Over
Twelve Months Total Financial assets Cash and other cash items P=6,436,427,163 P=– P=6,436,427,163 P=5,795,456,440 P=– P=5,795,456,440 Due from BSP 37,124,917,961 – 37,124,917,961 11,621,324,385 – 11,621,324,385 Due from other banks 5,918,907,525 – 5,918,907,525 6,770,243,850 – 6,770,243,850 Interbank loans receivable and
SPURA 542,000,000 – 542,000,000 11,983,000,000 – 11,983,000,000 Financial assets at FVPL 5,583,562,108 357,331,029 5,940,893,137 4,000,495,974 940,598,373 4,941,094,347 AFS financial assets – gross 1,081,928,149 49,978,287,948 51,060,216,097 1,929,702,164 43,690,436,421 45,620,138,585 HTM financial assets 5,593,496,044 12,956,256,730 18,549,752,774 3,138,549,663 18,922,835,140 22,061,384,803 Loans and receivables – gross 55,972,321,103 70,031,539,064 126,003,860,167 56,774,529,179 62,020,736,003 118,795,265,182 Accrued interest receivable 1,921,776,073 – 1,921,776,073 2,118,893,167 – 2,118,893,167 Other assets - gross: Accounts receivable 1,122,004,884 – 1,122,004,884 694,165,763 – 694,165,763 SCR 637,050,866 – 637,050,866 541,592,162 – 541,592,162 RCOCI 247,868,553 – 247,868,553 360,104,596 – 360,104,596 Miscellaneous 718,884,716 – 718,884,716 817,724,485 – 817,724,485 122,901,145,145 133,323,414,771 256,224,559,916 106,545,781,828 125,574,605,337 232,120,387,765 Nonfinancial assets Bank premises, furniture,
fixtures and equipment – 4,837,579,580 4,837,579,580 – 4,788,969,092 4,788,969,092 Investment properties – gross – 4,669,531,308 4,669,531,308 – 4,988,279,755 4,988,279,755 Deferred tax assets – 912,421,115 912,421,115 – 913,889,002 913,889,002 Equity investments – 20,730,869 20,730,869 – 16,980,869 16,980,869 Other assets – gross Net plan assets – 245,092,771 245,092,771 – 245,632,087 245,632,087 CWT 369,273,717 – 369,273,717 340,686,891 – 340,686,891 Branch License – 477,600,000 477,600,000 – 477,600,000 477,600,000 Goodwill – 222,841,201 222,841,201 – 222,841,201 222,841,201 369,273,717 11,385,796,844 11,755,070,561 340,686,891 11,654,192,006 11,994,878,897 Less: Allowances for impairment and
credit losses (Note 14) – 9,546,360,154 9,546,360,154 – 9,212,828,497 9,212,828,497
Unearned interest and discounts – 1,053,956,330 1,053,956,330 – 1,037,367,820 1,037,367,820 – 10,600,316,484 10,600,316,484 – 10,250,196,317 10,250,196,317 P=123,270,418,812 P=134,108,895,131 P=257,379,313,993 P=106,886,468,719 P=126,978,601,626 P=233,865,070,345
Consolidated 2010 2009
Less than
Twelve Months Over
Twelve Months Total Less than
Twelve Months Over
Twelve Months Total Financial liabilities Deposit Liabilities P=205,622,196,102 P=7,419,413,351 P=213,041,609,453 P=183,296,718,869 P=9,993,320,377 P=193,290,039,246 Bills payable 859,361,949 2,198,881,213 3,058,243,162 3,601,397,707 2,184,273,945 5,785,671,652 Manager’s checks 340,516,064 – 340,516,064 453,821,513 – 453,821,513 Accrued interest and other
expenses 1,973,594,528 1,973,594,528 1,863,118,162 1,863,118,162 Derivative liabilities 1,204,881,662 – 1,204,881,662 338,810,138 – 338,810,138 Other liabilities: – Accounts payable 1,013,305,589 – 1,013,305,589 976,336,346 – 976,336,346 Other payables – – – 194,583,829 – 194,583,829 Acceptances payable 289,603,819 – 289,603,819 189,854,859 – 189,854,859 Due to PDIC 200,551,936 200,551,936 181,036,256 181,036,256 Margin deposits 5,765,386 – 5,765,386 37,660,145 – 37,660,145 Due to BSP 21,500 – 21,500 16,861 – 16,861 Miscellaneous 784,416,671 – 784,416,671 346,457,637 – 346,457,637 212,294,215,206 9,618,294,564 221,912,509,770 191,479,812,322 12,177,594,322 203,657,406,644 Nonfinancial liabilities Accrued income tax payable 13,519,636 – 13,519,636 9,713,366 – 9,713,366 P=212,307,734,842 P=9,618,294,564 P=221,926,029,406 P=191,489,525,688 P=12,177,594,322 P=203,667,120,010

- 72 -
*SGVMC114803*
Parent Company 2010 2009
Less than
Twelve Months Over
Twelve Months Total Less than
Twelve Months Over
Twelve Months Total Financial assets Cash and other cash items P=6,362,296,658 P=– P=6,362,296,658 P=5,756,920,133 P=– P=5,756,920,133 Due from BSP 37,053,152,975 – 37,053,152,975 11,553,930,023 – 11,553,930,023 Due from other banks 5,970,000,543 – 5,970,000,543 6,761,701,623 – 6,761,701,623 Interbank loans receivable and
SPURA 50,000,000 – 50,000,000 11,848,000,000 – 11,848,000,000 Financial assets at FVPL 5,940,893,137 – 5,940,893,137 4,711,272,447 229,821,900 4,941,094,347 AFS financial assets - gross 1,081,928,149 49,390,314,770 50,472,242,919 2,274,296,429 42,490,328,090 44,764,624,519 HTM financial assets 5,510,316,044 12,956,256,730 18,466,572,774 3,138,549,663 18,839,655,140 21,978,204,803 Loans and receivables - gross 55,738,213,694 69,000,574,407 124,738,788,101 48,371,236,358 69,531,162,691 117,902,399,049 Accrued interest receivable 1,905,920,746 – 1,905,920,746 2,091,795,107 – 2,091,795,107 Other assets - gross: Accounts receivable 1,022,329,591 – 1,022,329,591 634,403,872 – 634,403,872 SCR 460,596,948 – 460,596,948 314,860,013 – 314,860,013 RCOCI 247,517,014 – 247,517,014 360,104,596 – 360,104,596 Miscellaneous 753,767,586 – 753,767,586 900,779,323 – 900,779,323 122,096,933,085 131,347,145,907 253,444,078,992 98,717,849,587 131,090,967,821 229,808,817,408 Nonfinancial assets Bank premises, furniture,
fixtures and equipment – 4,107,606,504 4,107,606,504 – 4,123,193,855 4,123,193,855 Investment properties - gross – 4,502,684,040 4,502,684,040 – 4,823,173,555 4,823,173,555 Deferred tax assets – 904,402,283 904,402,283 – 907,976,993 907,976,993 Equity investments – 1,194,734,528 1,194,734,528 – 1,190,511,869 1,190,511,869 Other assets - gross Net plan assets – 246,452,025 246,452,025 – 246,452,025 246,452,025
CWT 243,376,816 – 243,376,816 218,569,289 – 218,569,289 Branch Licenses – 450,501,931 450,501,931 – 450,501,931 450,501,931 Goodwill – 222,841,201 222,841,201 – 222,841,201 222,841,201
243,376,816 11,629,222,512 11,872,599,328 218,569,289 11,964,651,429 12,183,220,718 Less: Allowances for impairment and
credit losses (Note 14) – 9,321,047,742 9,321,047,742 – 8,909,411,628 8,909,411,628 Unearned interest and discounts – 957,159,185 957,159,185 – 1,017,800,431 1,017,800,431 – 10,278,206,927 10,278,206,927 9,927,212,059 9,927,212,059 P=122,340,309,901 P=132,698,161,492 P=255,038,471,393 P=98,936,418,876 P=133,128,407,191 P=232,064,826,067
Parent Company 2010 2009
Less than
Twelve Months Over
Twelve Months Total Less than
Twelve Months Over
Twelve Months Total Financial liabilities Deposit liabilities P=204,124,117,730 P=6,862,386,782 P=210,986,504,512 P=181,975,653,022 P=9,823,692,349 P=191,799,345,371 Bills payable 859,361,949 2,198,881,213 3,058,243,162 3,601,397,707 2,184,273,945 5,785,671,652 Manager’s checks 304,438,108 – 304,438,108 433,396,469 – 433,396,469 Accrued interest and other
expenses 1,946,895,772 – 1,946,895,772 1,834,724,666 – 1,834,724,666 Derivative liabilities 1,204,881,662 – 1,204,881,662 338,810,138 – 338,810,138 Other liabilities: Accounts payable 931,157,343 – 931,157,343 889,325,606 – 889,325,606 Other payable – – – 194,583,829 – 194,583,829 Acceptances payable 289,603,819 – 289,603,819 189,854,859 – 189,854,859 Due to PDIC 200,551,936 – 200,551,936 181,036,256 – 181,036,256 Margin deposits 5,765,386 – 5,765,386 37,660,145 – 37,660,145 Due to BSP 21,500 – 21,500 16,861 – 16,861 Miscellaneous 753,879,948 – 753,879,948 323,591,540 – 323,591,540 210,620,675,153 9,061,267,995 219,681,943,148 190,000,051,098 12,007,966,294 202,008,017,392 Nonfinancial liabilities Accrued income tax payable 13,519,636 – 13,519,636 9,713,366 – 9,713,366 P=210,634,194,789 P=9,061,267,995 P=219,695,462,784 P=190,009,764,464 P=12,007,966,294 P=202,017,730,758

- 73 -
*SGVMC114803*
21. Equity The Parent Company’s capital stock consists of:
2010 2009 Shares Amount Shares Amount Common stock - P=100 par value Authorized - shares 200,000,000 200,000,000 Issued and outstanding
Balance at beginning of year 97,508,772 P=9,750,877,200 88,643,469 P=8,864,346,900 Stock dividends* 9,751,845 975,184,500 8,865,303 886,530,300
107,260,617 P=10,726,061,700 97,508,772 P=9,750,877,200 *The stock dividend declared in 2010 and 2008 includes fractional shares equivalent to 968 shares.
The Parent Company shares are listed in the Philippine Stock Exchange.
On May 5, 2010, the BOD approved the declaration of 10.00% stock and P=12 per share cash dividends to stockholders of record as of July 22, 2010. The BSP and SEC approved the dividend declaration on June 23, 2010.
On May 7, 2009, the BOD approved the declaration of 10.00% stock and P=12 per share cash dividends to stockholders of record as of September 17, 2009. The BSP and SEC approved the dividend declaration on August 27, 2009.
On May 7, 2008, the BOD approved the increase in the Parent Company’s authorized capital from P=16 billion to P=20 billion and the declaration of 15.00% stock and P=20 per share cash dividends to stockholders of record as of September 25, 2008. The BSP and SEC approved the increase in authorized capital stock on August 19, 2008 and September 5, 2008, respectively. The dividend declaration was approved by the BSP on July 10, 2008.
The computation of surplus available for dividend declaration in accordance with SEC Memorandum Circular No. 11 issued in December 2008 differs to a certain extent from the computation following BSP guidelines.
As of December 31, 2010, 2009 and 2008, Surplus includes adjustment amounting to P=1.28 billion representing transfer of revaluation increment on land which was carried at deemed cost when the group transitioned to PFRS 1, First-time Adoption of Philippine Finacial Reporting Standards, in 2005.
In compliance with BSP regulations, 10.00% of the Parent Company’s profit from trust business is appropriated to surplus reserve. This annual appropriation is required until the surplus reserves for trust business equals 20.00% of the Parent Company’s authorized capital stock.
In the consolidated financial statements, a portion of the Group’s surplus corresponding to the net earnings of the subsidiaries and accumulated equity in net earnings of the associates amounting to P=95.47 million and P=130.92 million as of December 31, 2010 and 2009, respectively, is not available for dividend declaration. The accumulated equity in net earnings becomes available for dividends upon receipt of cash dividends from the investees.
Capital Management The primary objectives of the Group’s capital management are to ensure that it complies with externally imposed capital requirements and that it maintains strong credit ratings and healthy capital ratios in order to support its business and to maximize shareholders’ value.

- 74 -
*SGVMC114803*
The Group manages its capital structure and makes adjustments to it in light of changes in economic conditions and the risk characteristics of its activities. In order to maintain or adjust the capital structure, the Group may adjust the amount of dividend payment to shareholders, return capital to shareholders or issue capital securities. No changes were made in the objectives, policies and processes as of December 31, 2010 and 2009.
Regulatory Qualifying Capital Under existing BSP regulations, the determination of the Parent Company’s compliance with regulatory requirements and ratios is based on the amount of the Parent Company’s unimpaired capital (regulatory capital) as reported to the BSP. This is determined on the basis of regulatory accounting policies which differ from PFRS in some respects.
In addition, the risk-based capital ratio of a bank, expressed as a percentage of qualifying capital to risk-weighted assets, should not be less than 10.00% for both solo basis (head office and branches) and consolidated basis (Parent Company and subsidiaries engaged in financial allied undertakings but excluding insurance companies). Qualifying capital and risk-weighted assets are computed based on BSP regulations. Risk-weighted assets consist of total assets less cash on hand, due from BSP, loans covered by hold-out on or assignment of deposits, loans or acceptances under letters of credit to the extent covered by margin deposits and other non-risk items determined by the Monetary Board (MB) of the BSP.
On August 4, 2006, the BSP, under BSP Circular No. 538, issued the prescribed guidelines implementing the revised risk-based capital adequacy framework for the Philippine banking system to conform to Basel II capital adequacy framework. The new BSP guidelines took effect on July 1, 2007. Thereafter, banks were required to compute their Capital Adequacy Ratio (CAR) using these guidelines. As of December 31, 2010 and 2009, the Group’s CAR under BSP Circular No. 538 is 16.24% and 12.80%, respectively.
The CAR of the Group as reported to the BSP as of December 31, 2010 and December 31, 2009 are shown in the table below.
Consolidated Parent Company 2010 2009 2010 2009 (Amounts in Million Pesos) Tier 1 capital P=29,227.27 P=25,252.9 P=28,648.29 P=24,512.7 Tier 2 capital 1,648.69 1,926.3 1,619.87 1,901.0 Gross qualifying capital 30,875.96 27,179.2 30,268.16 26,413.7 Less required deductions 10.37 56.6 597.37 722.0 Total qualifying capital P=30,865.60 P=27,122.6 P=29,670.79 P=25,691.7 Risk weighted assets P=186,402.05 P=211,877.9 P=183,320.85 P=208,551.1 Tier 1 capital ratio 15.68% 11.92% 15.63% 11.75% Total capital ratio 16.56% 12.8% 16.19% 12.32%
The regulatory qualifying capital of the Parent Company consists of Tier 1 (core) capital, which comprises paid-up common stock, hybrid tier 1 capital securities, surplus including current year profit, surplus reserves and minority interest less required deductions such as unsecured credit accommodations to DOSRI, deferred income tax, and goodwill. Certain adjustments were made to the accounts and reserves of the Parent Company which were determined based on PFRS in order to conform to BSP’s requirements and guidelines in computing capital adequacy. The other component of regulatory capital is Tier 2 (supplementary) capital, which includes unsecured subordinated debt and general loan loss provision.
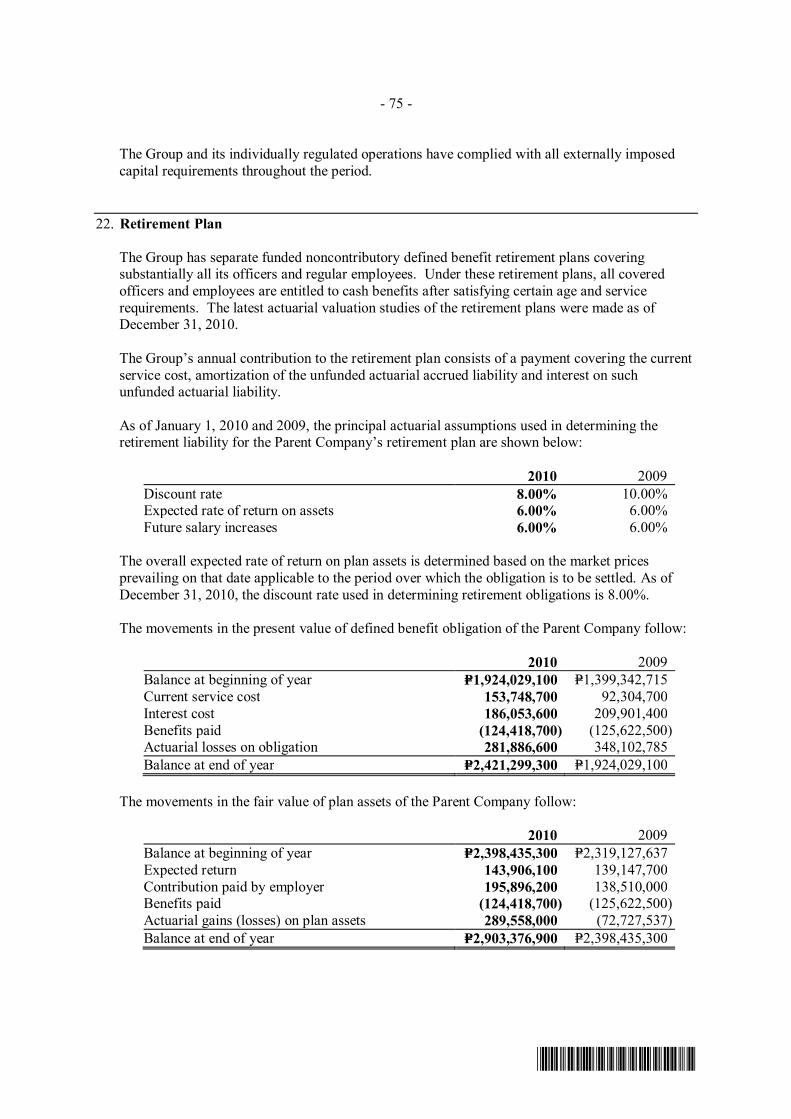
- 75 -
*SGVMC114803*
The Group and its individually regulated operations have complied with all externally imposed capital requirements throughout the period.
22. Retirement Plan
The Group has separate funded noncontributory defined benefit retirement plans covering substantially all its officers and regular employees. Under these retirement plans, all covered officers and employees are entitled to cash benefits after satisfying certain age and service requirements. The latest actuarial valuation studies of the retirement plans were made as of December 31, 2010.
The Group’s annual contribution to the retirement plan consists of a payment covering the current service cost, amortization of the unfunded actuarial accrued liability and interest on such unfunded actuarial liability.
As of January 1, 2010 and 2009, the principal actuarial assumptions used in determining the retirement liability for the Parent Company’s retirement plan are shown below:
2010 2009 Discount rate 8.00% 10.00% Expected rate of return on assets 6.00% 6.00% Future salary increases 6.00% 6.00%
The overall expected rate of return on plan assets is determined based on the market prices prevailing on that date applicable to the period over which the obligation is to be settled. As of December 31, 2010, the discount rate used in determining retirement obligations is 8.00%.
The movements in the present value of defined benefit obligation of the Parent Company follow:
2010 2009 Balance at beginning of year P=1,924,029,100 P=1,399,342,715 Current service cost 153,748,700 92,304,700 Interest cost 186,053,600 209,901,400 Benefits paid (124,418,700) (125,622,500) Actuarial losses on obligation 281,886,600 348,102,785 Balance at end of year P=2,421,299,300 P=1,924,029,100
The movements in the fair value of plan assets of the Parent Company follow:
2010 2009 Balance at beginning of year P=2,398,435,300 P=2,319,127,637 Expected return 143,906,100 139,147,700 Contribution paid by employer 195,896,200 138,510,000 Benefits paid (124,418,700) (125,622,500) Actuarial gains (losses) on plan assets 289,558,000 (72,727,537) Balance at end of year P=2,903,376,900 P=2,398,435,300

- 76 -
*SGVMC114803*
The amounts of net plan assets recognized in the balance sheets of the Parent Company (included under ‘Other assets’) follow:
2010 2009 Present value of defined benefit obligation P=2,421,299,300 P=1,924,029,100 Fair value of plan assets 2,903,376,900 2,398,435,300 482,077,600 474,406,200 Unrecognized actuarial gains (235,625,575) (227,954,175) Net plan assets P=246,452,025 P=246,452,025
Movements in accumulated unrecognized actuarial gains of the Parent Company follow:
2010 2009 Balance at beginning of year (P=227,954,175) (P=669,628,097) Actuarial losses on the present value of the defined
benefit obligation 281,886,600 348,102,785 Actuarial (gains) losses on plan assets (289,558,000) 72,727,537 Actuarial gains recognized during the year – 20,843,600 Balance at end of year (P=235,625,575) (P=227,954,175)
The movements in the net plan assets recognized in the balance sheets under ‘Other assets’
follow:
2010 2009 Balance at beginning of year P=246,452,025 P=250,129,825 Retirement expense (195,896,200) (142,214,800) Contribution 195,896,200 138,510,000 Balance at end of year P=246,452,025 P=246,425,025
The amounts of retirement expense included in Compensation and fringe benefits of the Parent Company in the statements of income follow:
2010 2009 Current service cost P=153,748,700 P=92,304,700 Interest cost 186,053,600 209,901,400 Expected return on plan assets (143,906,100) (139,147,700) Net actuarial gains recognized during the year – (20,843,600) Net pension expense P=195,896,200 P=142,214,800
Actual return amounted to P=433.46 million in 2010 and P=66.42 million in 2009.
The Parent Company expects to contribute P=133.67 million to its defined benefit pension plan in 2011.

- 77 -
*SGVMC114803*
In 2010 and 2009, the major categories of plan assets as a percentage of the fair value of total plan assets of the Parent Company are as follows:
2010 2009 Equity instruments 38% 31% Cash and cash equivalents 33% 14% Debt instruments 21% 42% Other assets 8% 13% 100% 100%
Information on the Parent Company’s retirement plan as for the current and previous years follows (in millions):
2010 2009 2008 2007 2006Present value of defined benefit
obligation P=2,421.30 P=1,924.03 P=1,399.34 P=1,723.58 P=2,095.46 Fair value of plan assets 2,903.38 2,398.44 2,319.13 2,590.71 2,150.18 Funded status 482.08 474.41 919.79 867.13 54.72 Experience adjustment arising on plan
assets 289.56 (72.73) (436.29) 310.09 291.01 Experience adjustment arising on plan
assets (281.89) (348.10) 490.57 35.01 19.06
23. Derivative Financial Instruments
Occasionally, the Parent Company enters into forward exchange contracts as an accommodation to its clients. These derivatives are not designated as accounting hedges. The aggregate notional amount of the outstanding buy US dollar currency forwards as of December 31, 2010 and 2009 amounted to US$385.75 million and US$237.13 million, respectively, while the sell US dollar forward contracts amounted to US$779.70 million and US$651.75 million, respectively. Weighted average buy US dollar forward rates as of December 31, 2010 and 2009 are P=46.96 and P=48.45, respectively, while the weighted average sell US dollar forward rates are P=43.99 and P=47.31, respectively.
As of December 31, 2010 and 2009, the fair values of the outstanding currency forwards, the embedded credit derivatives bifurcated from the CLN’s (see Note 8) and the share warrants follow:
2010 2009
Derivative
Asset Derivative
Liability Derivative
Asset Derivative
Liability Currency forwards P=171,746,979 P=1,204,881,662 P=570,729,514 P=338,810,138 Embedded credit derivatives 177,022,536 – 131,024,561 – Warrants 8,561,514 – 9,022,398 – P=357,331,029 P=1,204,881,662 P=710,776,473 P=338,810,138
Fair Value Changes on Derivatives The net movements in fair value changes of derivative instruments are as follows:
2010 2009 Balance at beginning of year P=371,966,335 P=16,596,989 Fair value changes during the year (1,175,761,287) 966,547,678 Settled transactions (43,755,681) (611,178,332) Balance at end of year (P=847,550,633) P=371,966,335

- 78 -
*SGVMC114803*
The net changes in fair value of the derivatives are presented in the statements of income under the following accounts:
2010 2009 2008 Foreign exchange gain/(loss) (P=1,265,054,059) (P=40,924,049) (P=45,576,303) Trading and securities gains (loss)* 45,537,091 396,293,395 (265,268,834) (P=1,219,516,968) P=355,369,346 (P=310,845,137)
* Net changes in fair value related to embedded credit derivatives 24. Lease Contracts
The lease contracts are for periods ranging from 1 to 25 years from the dates of contracts and are renewable under certain terms and conditions. Various lease contracts include escalation clauses, most of which bear an annual rent increase of 10.00%.
Annual rentals on these lease contracts included in ‘Occupancy cost’ in the statements of income in 2010, 2009 and 2008 amounted to P=191.86 million, P=191.13 million and P=159.48 million, respectively for the Group and P=191.86 million, P=170.68 million and P=135.40 million, respectively for the Parent Company.
Future minimum rentals payable of the Group and Parent Company under non-cancelable operating leases follow:
Consolidated Parent Company 2010 2009 2010 2009 Within one year P=176,334,460 P=160,997,355 P=160,716,989 P=154,538,692 After one year but not more than five years 567,407,946 456,671,170 493,648,633 427,358,126 After more than five years 122,860,576 129,728,022 92,055,996 100,911,795 P=866,602,982 P=747,396,547 P=746,421,618 P=682,808,613
25. Income and Other Taxes
Under Philippine tax laws, the Group is subject to percentage and other taxes (presented as Taxes and Licenses in the statements of income) as well as income taxes. Percentage and other taxes paid consist principally of gross receipt tax (GRT) and documentary stamp taxes (DST).
Income taxes include the corporate income tax, as discussed below, and final tax paid at the rate of 20.00% on gross interest income from government securities and other deposit substitutes. These income taxes, as well as the deferred tax benefits and provisions, are presented as ‘Provision for income tax’ in the statements of income.
Republic Act (RA) No. 9337, An Act Amending National Internal Revenue Code, provides that the RCIT rate shall be 35.00% until January 1, 2009. Starting January 1, 2009, the RCIT rate shall be 30.00%. The interest allowed as a deductible expense is reduced by 42.00% of interest income subjected to final tax under the 35.00% corporate tax regime and 33.00% under the 30.00% corporate tax regime. A MCIT of 2.00% on modified gross income is computed and compared with the RCIT. Any excess of the MCIT over the RCIT is deferred and can be used as a tax credit against future income tax liability for the next three years from the year of inception. In addition, NOLCO is allowed as a deduction from taxable income in the next three years from the year of inception.
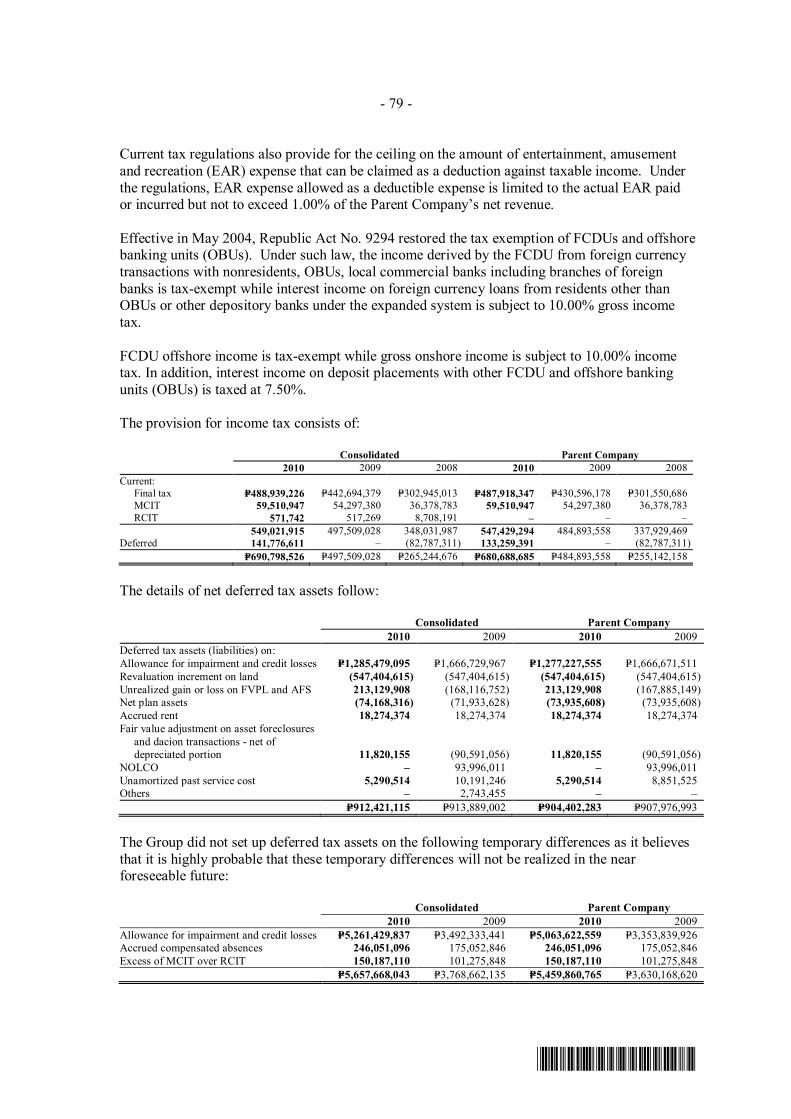
- 79 -
*SGVMC114803*
Current tax regulations also provide for the ceiling on the amount of entertainment, amusement and recreation (EAR) expense that can be claimed as a deduction against taxable income. Under the regulations, EAR expense allowed as a deductible expense is limited to the actual EAR paid or incurred but not to exceed 1.00% of the Parent Company’s net revenue.
Effective in May 2004, Republic Act No. 9294 restored the tax exemption of FCDUs and offshore banking units (OBUs). Under such law, the income derived by the FCDU from foreign currency transactions with nonresidents, OBUs, local commercial banks including branches of foreign banks is tax-exempt while interest income on foreign currency loans from residents other than OBUs or other depository banks under the expanded system is subject to 10.00% gross income tax.
FCDU offshore income is tax-exempt while gross onshore income is subject to 10.00% income tax. In addition, interest income on deposit placements with other FCDU and offshore banking units (OBUs) is taxed at 7.50%.
The provision for income tax consists of:
Consolidated Parent Company 2010 2009 2008 2010 2009 2008 Current: Final tax P=488,939,226 P=442,694,379 P=302,945,013 P=487,918,347 P=430,596,178 P=301,550,686 MCIT 59,510,947 54,297,380 36,378,783 59,510,947 54,297,380 36,378,783 RCIT 571,742 517,269 8,708,191 – – – 549,021,915 497,509,028 348,031,987 547,429,294 484,893,558 337,929,469 Deferred 141,776,611 – (82,787,311) 133,259,391 – (82,787,311) P=690,798,526 P=497,509,028 P=265,244,676 P=680,688,685 P=484,893,558 P=255,142,158
The details of net deferred tax assets follow:
Consolidated Parent Company 2010 2009 2010 2009 Deferred tax assets (liabilities) on: Allowance for impairment and credit losses P=1,285,479,095 P=1,666,729,967 P=1,277,227,555 P=1,666,671,511 Revaluation increment on land (547,404,615) (547,404,615) (547,404,615) (547,404,615) Unrealized gain or loss on FVPL and AFS 213,129,908 (168,116,752) 213,129,908 (167,885,149) Net plan assets (74,168,316) (71,933,628) (73,935,608) (73,935,608) Accrued rent 18,274,374 18,274,374 18,274,374 18,274,374 Fair value adjustment on asset foreclosures
and dacion transactions - net of depreciated portion 11,820,155 (90,591,056) 11,820,155 (90,591,056)
NOLCO – 93,996,011 – 93,996,011 Unamortized past service cost 5,290,514 10,191,246 5,290,514 8,851,525 Others – 2,743,455 – – P=912,421,115 P=913,889,002 P=904,402,283 P=907,976,993
The Group did not set up deferred tax assets on the following temporary differences as it believes
that it is highly probable that these temporary differences will not be realized in the near foreseeable future:
Consolidated Parent Company 2010 2009 2010 2009 Allowance for impairment and credit losses P=5,261,429,837 P=3,492,333,441 P=5,063,622,559 P=3,353,839,926 Accrued compensated absences 246,051,096 175,052,846 246,051,096 175,052,846 Excess of MCIT over RCIT 150,187,110 101,275,848 150,187,110 101,275,848 P=5,657,668,043 P=3,768,662,135 P=5,459,860,765 P=3,630,168,620
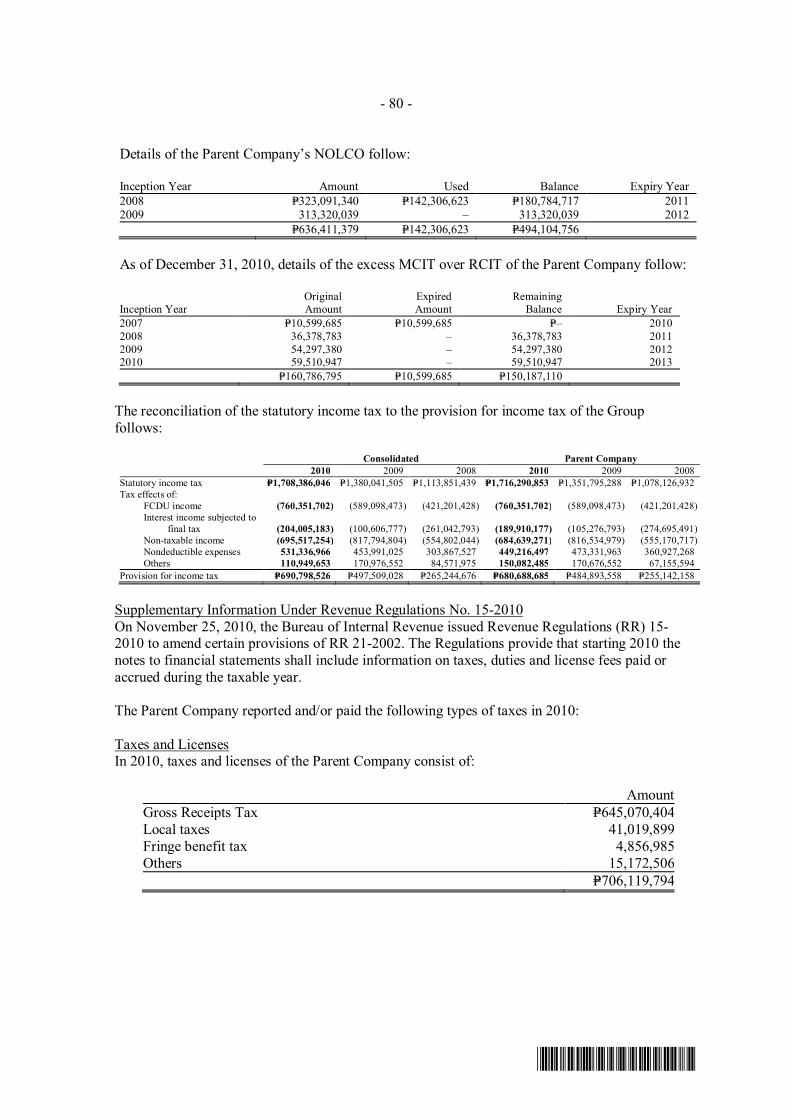
- 80 -
*SGVMC114803*
Details of the Parent Company’s NOLCO follow:
Inception Year Amount Used Balance Expiry Year 2008 P=323,091,340 P=142,306,623 P=180,784,717 2011 2009 313,320,039 – 313,320,039 2012 P=636,411,379 P=142,306,623 P=494,104,756
As of December 31, 2010, details of the excess MCIT over RCIT of the Parent Company follow:
Inception Year Original Amount
Expired Amount
Remaining Balance Expiry Year
2007 P=10,599,685 P=10,599,685 P=– 2010 2008 36,378,783 – 36,378,783 2011 2009 54,297,380 – 54,297,380 2012 2010 59,510,947 – 59,510,947 2013 P=160,786,795 P=10,599,685 P=150,187,110
The reconciliation of the statutory income tax to the provision for income tax of the Group follows:
Consolidated Parent Company 2010 2009 2008 2010 2009 2008 Statutory income tax P=1,708,386,046 P=1,380,041,505 P=1,113,851,439 P=1,716,290,853 P=1,351,795,288 P=1,078,126,932 Tax effects of: FCDU income (760,351,702) (589,098,473) (421,201,428) (760,351,702) (589,098,473) (421,201,428) Interest income subjected to
final tax (204,005,183) (100,606,777) (261,042,793) (189,910,177) (105,276,793) (274,695,491) Non-taxable income (695,517,254) (817,794,804) (554,802,044) (684,639,271) (816,534,979) (555,170,717) Nondeductible expenses 531,336,966 453,991,025 303,867,527 449,216,497 473,331,963 360,927,268 Others 110,949,653 170,976,552 84,571,975 150,082,485 170,676,552 67,155,594 Provision for income tax P=690,798,526 P=497,509,028 P=265,244,676 P=680,688,685 P=484,893,558 P=255,142,158
Supplementary Information Under Revenue Regulations No. 15-2010 On November 25, 2010, the Bureau of Internal Revenue issued Revenue Regulations (RR) 15-2010 to amend certain provisions of RR 21-2002. The Regulations provide that starting 2010 the notes to financial statements shall include information on taxes, duties and license fees paid or accrued during the taxable year.
The Parent Company reported and/or paid the following types of taxes in 2010:
Taxes and Licenses In 2010, taxes and licenses of the Parent Company consist of:
AmountGross Receipts Tax P=645,070,404Local taxes 41,019,899Fringe benefit tax 4,856,985Others 15,172,506 P=706,119,794
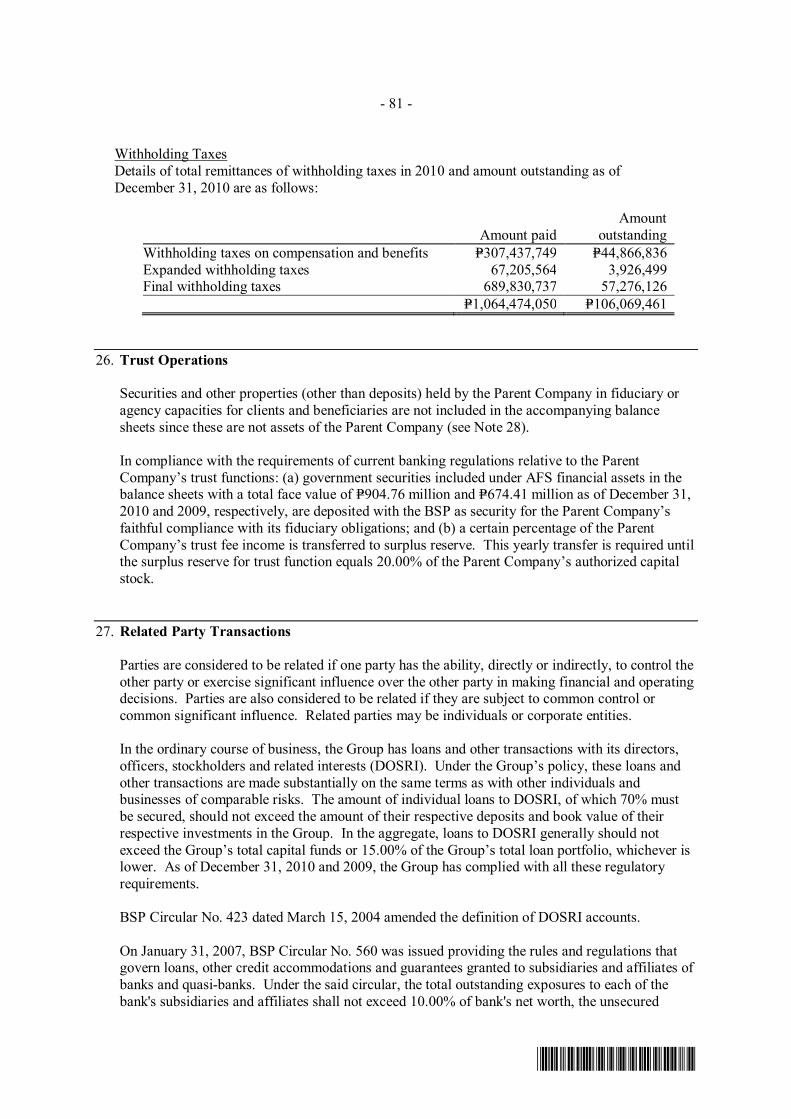
- 81 -
*SGVMC114803*
Withholding Taxes Details of total remittances of withholding taxes in 2010 and amount outstanding as of December 31, 2010 are as follows:
Amount paid Amount
outstanding Withholding taxes on compensation and benefits P=307,437,749 P=44,866,836 Expanded withholding taxes 67,205,564 3,926,499 Final withholding taxes 689,830,737 57,276,126 P=1,064,474,050 P=106,069,461
26. Trust Operations
Securities and other properties (other than deposits) held by the Parent Company in fiduciary or agency capacities for clients and beneficiaries are not included in the accompanying balance sheets since these are not assets of the Parent Company (see Note 28).
In compliance with the requirements of current banking regulations relative to the Parent Company’s trust functions: (a) government securities included under AFS financial assets in the balance sheets with a total face value of P=904.76 million and P=674.41 million as of December 31, 2010 and 2009, respectively, are deposited with the BSP as security for the Parent Company’s faithful compliance with its fiduciary obligations; and (b) a certain percentage of the Parent Company’s trust fee income is transferred to surplus reserve. This yearly transfer is required until the surplus reserve for trust function equals 20.00% of the Parent Company’s authorized capital stock.
27. Related Party Transactions
Parties are considered to be related if one party has the ability, directly or indirectly, to control the other party or exercise significant influence over the other party in making financial and operating decisions. Parties are also considered to be related if they are subject to common control or common significant influence. Related parties may be individuals or corporate entities.
In the ordinary course of business, the Group has loans and other transactions with its directors, officers, stockholders and related interests (DOSRI). Under the Group’s policy, these loans and other transactions are made substantially on the same terms as with other individuals and businesses of comparable risks. The amount of individual loans to DOSRI, of which 70% must be secured, should not exceed the amount of their respective deposits and book value of their respective investments in the Group. In the aggregate, loans to DOSRI generally should not exceed the Group’s total capital funds or 15.00% of the Group’s total loan portfolio, whichever is lower. As of December 31, 2010 and 2009, the Group has complied with all these regulatory requirements.
BSP Circular No. 423 dated March 15, 2004 amended the definition of DOSRI accounts.
On January 31, 2007, BSP Circular No. 560 was issued providing the rules and regulations that govern loans, other credit accommodations and guarantees granted to subsidiaries and affiliates of banks and quasi-banks. Under the said circular, the total outstanding exposures to each of the bank's subsidiaries and affiliates shall not exceed 10.00% of bank's net worth, the unsecured

- 82 -
*SGVMC114803*
portion of which shall not exceed 5.00% of such net worth. Further, the total outstanding exposures to subsidiaries and affiliates shall not exceed 20.00% of the net worth of the lending bank. BSP Circular No. 560 is effective February 15, 2007.
The following table shows information relating to the loans, other credit accommodations and guarantees classified as DOSRI accounts under regulations existing prior to said circular and new DOSRI loans, other credit accommodations granted under said circular:
Consolidated Parent Company 2010 2009 2010 2009 Total outstanding DOSRI loans P=2,136,543,579 P=1,934,862,209 P=2,136,543,579 P=1,934,862,209 Percent of DOSRI accounts granted
under regulations existing prior to BSP Circular No. 423 1.70% 1.65% 1.71% 1.65%
Percent of DOSRI accounts granted under BSP Circular No. 423 – – – –
Percent of DOSRI loans to total loans 1.70% 1.65% 1.71% 1.65% Percent of unsecured DOSRI loans to
total DOSRI loans 6.35% 2.33% 6.35% 2.33% Percent of past due DOSRI loans to
total DOSRI loans – – – – Percent of non-performing DOSRI
loans to total DOSRI loans – – – – The following table shows information relating to the loans, other credit accommodations and
guarantees, as well as availments of previously approved loans and committed credit lines not considered DOSRI accounts prior to the issuance of said circular but are allowed a transition period of two years from the effectivity of said circular or until said loan, other credit accommodations and guarantees become past due, or are extended, renewed or restructured, whichever comes later, as of December 31, 2010 and 2009:
Consolidated Parent Company 2010 2009 2010 2009 Total outstanding non-DOSRI accounts
prior to BSP Circular No. 423 P=75,000 P=135,000 P=75,000 P=135,000 Percent of unsecured non-DOSRI
accounts prior to BSP Circular No. 423 to total loans – – – –
Percent of past due non-DOSRI accounts prior to BSP Circular No. 423 to total loans – – – –
Percent of non-performing non-DOSRI accounts prior to BSP Circular No. 423 to total loans – – – –
The following table shows the related party transactions included in the Parent Company’s
financial statements:
Elements of Transactions Balance Sheet Amounts Income Statement Amounts Related party Nature of Transaction 2010 2009 2010 2009 Chinabank Insurance
Brokers, Inc. Deposit liabilities P=13,994,353 P=35,315,746 Accounts payable 155,807 282,053 Interest expense P=127,479 P=97,039
CBC Forex Corporation Deposit liabilities – 1,771,354 Service fees Interest expense 177,461 8,754

- 83 -
*SGVMC114803*
Elements of Transactions Balance Sheet Amounts Income Statement Amounts Related party Nature of Transaction 2010 2009 2010 2009
CBC Properties and Deposit liabilities P=2,453,965 P=1,672,558 Computer Center, Inc. Accounts payable 175,268 400,215
Service fees P=64,718,473 P=60,751,389 Interest expense 221,757 266,302
CBSI Deposit liabilities 69,993,581 140,233,652 Due from affiliate 99,600,589 108,231,847
Other related party transactions conducted in the normal course of business include the availment of computer and general banking services of a subsidiary to meet the Parent Company’s reporting requirements.
The remuneration of directors and key management personnel (included under ‘Compensation and fringe benefits’ in the statement of income) of the Group and Parent Company are as follows:
Consolidated Parent Company 2010 2009 2008 2010 2009 2008 Short-term benefits P=271,079,589 P=199,643,512 P=222,958,997 P=256,557,144 P=188,959,726 P=212,141,327 Post-employment benefits 2,540,281 3,177,427 4,086,068 1,265,302 1,982,633 2,948,714 P=273,619,870 P=202,820,939 P=227,045,065 P=257,822,446 P=190,942,359 P=215,090,041
28. Commitments and Contingent Assets and Liabilities
In the normal course of the Group’s operations, there are various outstanding commitments and contingent liabilities which are not reflected in the accompanying financial statements. Management does not anticipate any material losses as a result of these transactions.
The following is a summary of contingencies and commitments of the Group and Parent Company with the equivalent peso contractual amounts:
Consolidated Parent Company 2010 2009 2010 2009 Trust department accounts (Note 26) P=100,598,864,502 P=70,304,881,018 P=97,404,254,972 P=68,333,690,879 Unused commercial letters of credit 11,340,867,273 8,385,049,125 11,340,867,273 8,385,049,125 Outstanding guarantees issued 1,451,217,830 2,100,822,691 1,451,217,830 2,100,822,691 Deficiency claims receivable 289,815,905 423,539,684 289,815,905 423,539,684 Late deposits/payments received 312,509,340 409,049,268 312,432,226 408,752,189 Inward bills for collection 193,161,090 163,040,467 193,161,090 163,040,467 Outward bills for collection 49,504,645 130,693,963 49,375,641 130,494,742 Others 1,538,518,745 1,377,065,475 1,538,509,792 1,377,065,144
29. Segment Information The Group’s operating businesses are recognized and managed separately according to the nature
of services provided and the markets served, with each segment representing a strategic business unit. The Group’s business segments are as follows:
a. Consumer Banking Group - principally handles housing and auto loans for individual and
corporate customers;
b. Account Management Group - principally administers all the lending, trade finance and corollary banking products and services offered to corporate and institutional customers;

- 84 -
*SGVMC114803*
c. Branch Banking Group - principally handles retail and commercial loans, individual and
corporate deposits, overdrafts and funds transfer facilities, trade facilities and all other services for retail customers;
d. Treasury Group - principally provides money market, trading and treasury services, as well as
the management of the Bank’s funding operations by the use of government securities, placements and acceptances with other banks; and
e. Others - principally handles other services including but not limited to asset management,
insurance brokerage, remittances, operations and financial control , and other support services.
The Group reports its primary segment information on the basis of the above-mentioned segments.
Segment assets are those operating assets that are employed by a segment in its operating activities that are either directly attributable to the segment or can be allocated to the segment on a reasonable basis.
Segment liabilities are those operating liabilities that result from the operating activities of a segment and that either are directly attributable to the segment or can be allocated to the segment on a reasonable basis.
Interest income is reported net as management primarily relies on the net interest income as performance measure, not the gross income and expense.
The segment results include internal transfer pricing adjustments across business units as deemed appropriate by management. Transactions between segments are conducted at estimated market rates on an arm’s length basis. Interest is charged/credited to the business units based on a pool rate which approximates the marginal cost of funds.
Other operating income mainly consists of trading and securities gain (loss) - net, service charges, fees and commissions, trust fee income and foreign exchange gain - net. Other operating expense mainly consists of compensation and fringe benefits, provision for impairment and credit losses, taxes and licenses, occupancy, depreciation and amortization, stationery, supplies and postage and insurance. Other operating income and expense are allocated between segments based on equitable sharing arrangements.
The Group has no significant customers which contributes 10% or more of the consolidated revenues.
The Group’s asset producing revenues are located in the Philippines (i.e., one geographical location); therefore, geographical segment information is no longer presented.

- 85 -
*SGVMC114803*
The following tables present relevant financial information regarding business segments measured in accordance with PFRS as of and for the years ended December 31, 2010, 2009 and 2008 (in thousands):
Consumer Banking Account Management 2010 2009 2008 2010 2009 2008 Results of Operations Net interest income Third party P=1,177,784 P=1,274,029 P=1,220,818 P=4,173,482 P=4,267,424 P=3,805,844 Intersegment (517,990) (667,751) (856,871) (2,269,397) (2,343,495) (2,561,272) 659,794 606,278 363,947 1,904,085 1,923,929 1,244,572 Other operating income 58,051 45,138 61,970 215,713 213,363 256,507 Total revenue 717,845 651,416 425,917 2,119,798 2,137,292 1,501,079 Other operating expense (193,158) (178,410) (119,937) (333,584) (261,149) (125,477) Income before income tax 524,687 473,006 305,980 1,786,214 1,876,143 1,375,602 Income tax provision – – – – – – Net income P= 524,687 P=473,006 P=305,980 P=1,786,214 P=1,876,143 P=1,375,602 Total assets P=12,975,342 P=14,404,055 P=14,921,625 P=73,233,077 P=65,459,142 P=65,333,997 Total liabilities P=533,622 P=600,339 P=625,594 P=2,578,108 P=2,598,582 P=1,248,227 Depreciation and amortization P=5,942 P=5,816 P=5,446 P=4,316 P=3,494 P=3,421 Provision for impairment and
credit losses P=10,733 P=7,794 P=– P=84,445 P=152,249 P=105,593 Capital expenditures P=6,036 P=2,493 P=2,979 P=5,858 P=6,561 P=2,535
Branch Banking Treasury 2010 2009 2008 2010 2009 2008 Results of Operations Net interest income Third party (P=1,966,685) (P=2,489,006) (P=3,079,040) P=3,832,316 P=3,961,151 P=3,717,135 Intersegment 5,337,412 5,697,406 6,274,307 (1,993,840) (2,402,440) (2,802,057) 3,370,727 3,208,400 3,195,267 1,838,476 1,558,711 915,078 Other operating income 1,294,064 1,183,946 1,091,063 2,236,508 1,698,960 97,461 Total revenue 4,664,791 4,392,346 4,286,330 4,074,984 3,257,671 1,012,539 Other operating expense (3,634,354) (3,335,020) (2,799,449) (508,283) (453,991) (201,148) Income before income tax 1,030,437 1,057,326 1,486,881 3,566,701 2,803,680 811,391 Income tax provision – – – (487,534) – – Net income P=1,030,437 P=1,057,326 P=1,486,881 P=3,079,167 P=2,803,680 P=811,391 Total assets P=121,669,069 P=109,605,153 P=96,328,531 P=111,505,718 P=99,339,737 P=60,222,408 Total liabilities P=165,017,532 P=153,199,381 P=130,581,827 P=30,488,470 P=20,339,506 P=26,716,573 Depreciation and amortization P=301,773 P=278,236 P=193,995 P=9,549 P=7,007 P=2,314 Provision for impairment and credit
losses P=39,660 P=89,443 P=155,499 P=– P=– P=– Capital expenditures P=42,716 P=41,619 P=465,430 P=1,969 P=13,953 P=9,136
Others Total 2010 2009 2008 2010 2009 2008 Results of Operations Net interest income Third party P=1,416,070 P=1,222,440 P=859,457 P=8,632,967 P=8,236,037 P=6,524,215 Intersegment (556,185) (283,721) (54,106) – – – 859,885 938,719 805,351 8,632,967 8,236,037 6,524,215 Other operating income 882,019 963,078 635,921 4,686,355 4,104,485 2,142,922 Total revenue 1,741,904 1,901,797 1,441,272 13,319,322 12,340,522 8,667,137 Other operating expense (2,955,323) (3,511,814) (2,238,693) (7,624,702) (7,740,384) (5,484,704) Income before income tax (1,213,419) (1,610,017) (797,421) 5,694,620 4,600,138 3,182,433 Income tax provision (203,264) (497,509) (265,245) (690,798) (497,509) (265,245) Net income (P=1,416,683) (P=2,107,526) (P=1,062,666) P=5,003,822 P=4,102,629 P=2,917,188 Total assets (P=62,003,892) (P=54,606,311) (P=28,259,507) P=257,379,314 P=233,865,070 P=208,547,054 Total liabilities P=23,308,056 P=26,983,582 P=23,498,145 P=221,925,788 P=203,667,120 P=182,670,366 Depreciation and amortization P=325,213 P=373,408 P=265,812 P=646,793 P=667,971 P=470,988 Provision for impairment and credit
losses P=360,993 P=542,898 P=45,618 P=495,831 P=792,384 P=306,710 Capital expenditures P=174,958 P=139,712 P=170,785 P=231,537 P=204,338 P=650,865

- 86 -
*SGVMC114803*
30. Earnings Per Share (EPS)
Basic earnings per share amounts are calculated by dividing the net income for the year by the weighted average number of common shares outstanding during the year (adjusted for stock dividends).
The following reflects the income and share data used in the basic earnings per share computations:
2010 2009 2008 a. Net income attributable to equity holders of the parent P=5,003,386,250 P=4,100,418,318 P=2,914,639,364 b. Weighted average number of common
shares outstanding* (Note 21) 107,260,617 107,260,617 107,260,617 c. Earnings per share (a/b) P=46.65 P=38.23 P=27.17
* Weighted average number of outstanding common shares in 2009 and 2008 was recomputed after giving retroactive effect to stock dividends declared on May 7, 2009 and May 5, 2010 (see Note 21).
As of December 31, 2010, 2009 and 2008, there were no outstanding dilutive potential common shares.
Before consideration of the 10.00% stock dividends declared in 2010, the EPS for 2009 and 2008 were P=42.07 and P=29.92, respectively (see Note 21).
31. Financial Performance
The following basic ratios measure the financial performance of the Group and the Parent Company:
Consolidated Parent Company 2010 2009 2010 2009 Return on average equity 15.37% 14.49% 15.51% 14.24% Return on average assets 2.10 1.90 2.13 1.88 Net interest margin 3.97 4.16 3.94 4.16
32. Non-cash Investing Activities
The following is a summary of certain non-cash investing activities that relate to the analysis of the statements of cash flows:
Consolidated 2010 2009 2008 Net unrealized gain (loss) in AFS investment P=1,430,403,867 P=1,635,544,965 (P=2,258,534,911) Addition to investment properties in
settlement of loans 499,114,487 759,127,668 392,146,836 Addition to chattel mortgage in settlement
of loans 21,422,035 27,560,707 23,364,140 Cumulative translation adjustment 8,384,856 137,832,937 (83,944,076)

- 87 -
*SGVMC114803*
Parent 2010 2009 2008 Net unrealized gain (loss) in AFS investment P=1,434,122,595 P=1,625,696,552 (P=2,236,326,212) Addition to investment properties in
settlement of loans 477,286,903 691,567,096 346,332,631 Addition to chattel mortgage in settlement
of loans 21,422,035 27,560,707 23,364,140 Cumulative translation adjustment 8,384,856 137,832,937 (83,944,076)
33. Prior Period Adjustments
Prior period adjustments made by a subsidiary, CBSI, were included in the financial statements and resulted in a net decrease of P=162.12 million to the surplus balance attributable to the equity holders of the Parent Company as of January 1, 2008.
The prior period adjustments are summarized as follows:
Prior period adjustments Amount Provision for impairment and credit losses 1a (P=151,836,309) Impairment loss on investment properties 2a (11,728,219) Accrual of retirement expense 3a (2,134,948) Adjustment on depreciation of investment properties 2b (2,036,097) Reversal of litigation costs capitalized as part of investment
properties 2c (1,645,866) Provision for impairment losses on other assets 3b (1,163,970) Total adjustments
(P=170,545,409)
Effect of prior period adjustments Attributable to: Equity holders of the parent (162,117,567) Non-controlling interest (8,427,842) (P=170,545,409)
1. Loans and receivables
a. Additional provision for impairment and credit losses on receivables amounting to P=151.84 million.
2. Investment properties a. Recognition of provision for impairment losses for investment properties amounting to
P=11.73 million. b. Additional depreciation of investment properties amounting to P=2.04 million. c. Adjustment to expense out litigation costs initially capitalized as part of the cost of
investment properties amounting to P=1.65 million. 3. Others
a. Adjustment to record accrual of retirement expense amounting to P=2.13 million. b. Additional provision for impairment losses on other assets amounting to P=1.16 million.

- 88 -
*SGVMC114803*
The reconciliation of the effect on the surplus balance attributable to the equity holders of the Parent Company as of January 1, 2008 of the prior period adjustments follows:
Amount
As previously reported
P=15,406,929,820 Transfer of revaluation increment on land (Note 21)
1,277,277,435
Prior period adjustments attributable to Parent Company
(162,117,567) As restated
P=16,522,089,688