china: restructuring and reform is there a new normal? · the hyper-growth period. • second, the...
TRANSCRIPT

China: Restructuring and ReformIs there a new normal?
Barry Naughton
Chile Pacific Foundation
Santiago, April 7, 2016.
Outline
1. China has been the most rapidly growing economy in world history; ut that i a le g o th phase is o o e .
--Chi a’s g o th is i a ulous, ut its apid g o th phase ese les that of Japan and Korea, and we can learn from their earlier experience.
. Chi a’s espo se to the e d of i a le g o th has ee disti ti e:A. Xi Ji pi g’s autho ita ia e i alis .B. Economic policy: complex mix of ambitious reform proposals
a d shak i ple e tatio . Chi a has epeatedl u de shot.3. Restructuring and reform have not yet achieved qualitative success--
e a e ot i the e o al et, a d e should e pe t fu the turbulence.

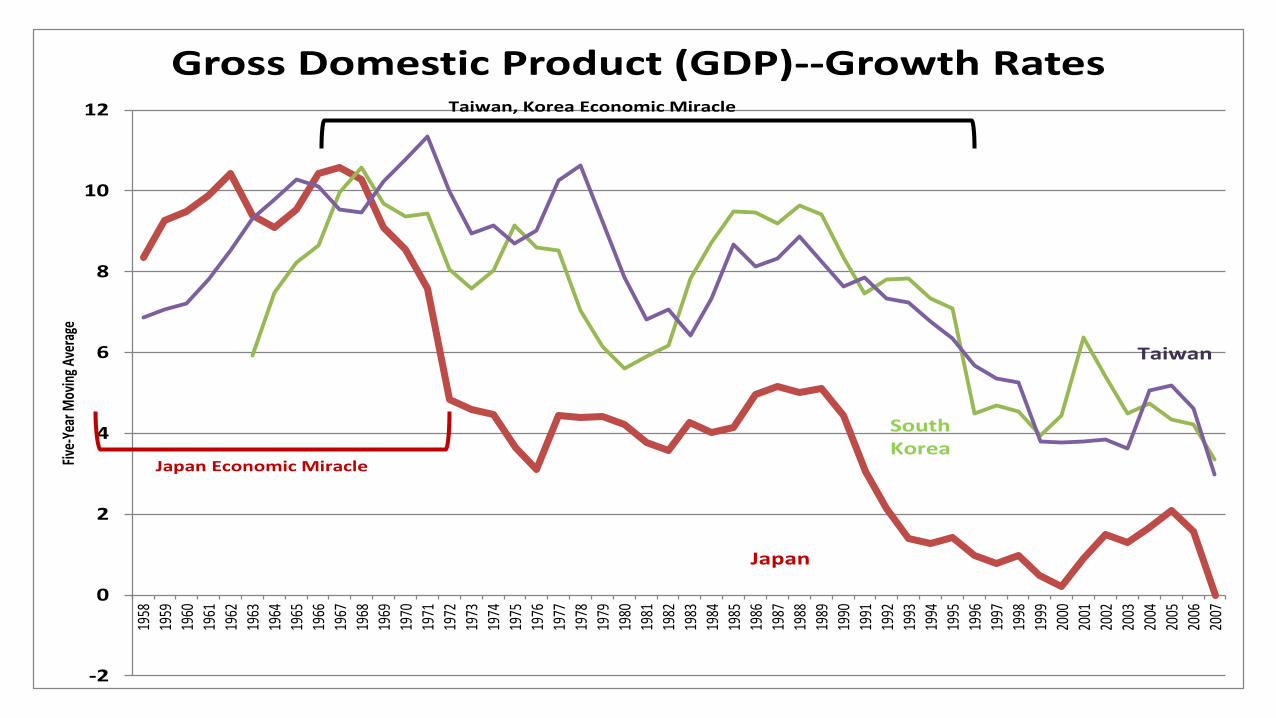
. Chi a is the ost po erful gro th achi e e er see
• China has experienced a 32 year period (1978-2010) during which GDP grew at over 8% per capita. All of the potential contributions to growth were high, and actual realized growth was very high.
• The 6th East Asian growth miracle, the biggest , the fastest, and the lo gest. Japa also g e a o e 8% pe apita, ut o l fo 8 ea s (1955-1973).• Demographic Dividend
• Rapid Structural Change
• Massive institutional and technological transfer
• Huge gai s f o e o o i ope ess a d su essful s ste efo s.• High saving and investment make it possible and accelerate the pace of
change.

In forerunner economies (Japan and Korea, especially) the e d of hyper-gro th displayed four simple features:
• First, long-term structural changes began to signal the coming end of the hyper-growth period.
• Second, the government tried to sustain rapid growth through increasing investment and expansionary monetary (and fiscal) policy.
• Third, a sudden, sharp drop in growth was triggered by a seemingly unrelated exogenous event.
• Fou th, g o th e e full ou ed a k, ut i stead e o e ed to a lower, more moderate long-term growth path.
-2
0
2
4
6
8
10
12
1958
1959
1960
1961
1962
1963
1964
1965
1966
1967
1968
1969
1970
1971
1972
1973
1974
1975
1976
1977
1978
1979
1980
1981
1982
1983
1984
1985
1986
1987
1988
1989
1990
1991
1992
1993
1994
1995
1996
1997
1998
1999
2000
2001
2002
2003
2004
2005
2006
2007
Five
-Yea
r M
ovin
g A
vera
geGross Domestic Product (GDP)--Growth Rates
Japan
South
Korea
Taiwan
Japan Economic Miracle
Taiwan, Korea Economic Miracle
0%
2%
4%
6%
8%
10%
12%
14%
16%
19
98
19
99
20
00
20
01
20
02
20
03
20
04
20
05
20
06
20
07
20
08
09
Q1
09
Q2
09
Q3
09
Q4
10
Q1
10
Q2
10
Q3
10
Q4
11
Q1
11
Q2
11
Q3
11
Q4
12
Q1
12
Q2
12
Q3
12
Q4
13
Q1
13
Q2
13
Q3
13
Q4
14
Q1
14
Q2
14
Q3
14
Q4
15
Q1
15
Q2
15
Q3
15
Q4
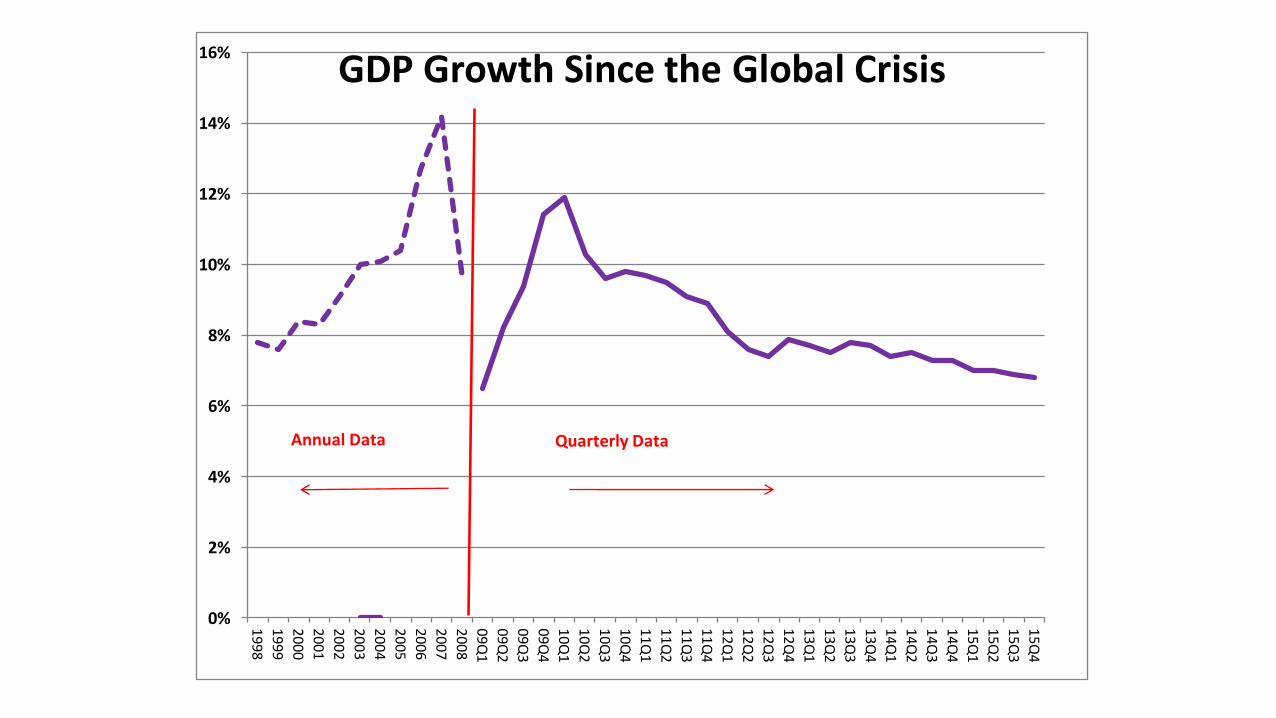
GDP Growth Since the Global Crisis
Annual Data Quarterly Data

Forerunners: The Response to Slowdown
1. The economic response is difficult:Specific short-run problems turn out to be part of long-run, inter-related intractable problems.
Policy-makers take a long time to learn that the policies and institutions that worked so well during the miracle growth era no longer work.
Eventually, the economy responds more-or-less well, re-orienting to a larger domestic market, moving into a service economy (post-industrial), and becoming a higher-skilled and more innovative economy.
2. The political response is unambiguous:Go e e t poli e o es less i t usi e, o e light tou h.Society becomes more open and pluralistic.
In some cases, societies democratize.
They are wealthier, middle-income, better-educated and more diverse societies.
Korea is a good example where all these things happened simultaneously, as a response to short-run problems and long-run success.

. Chi a’s Disti cti e Respo seA. Politically: Xi Jinping has
brought in a kind of revivalist, nationalist authoritarian system, very different from the liberalization we should anticipate.
B. Economically: Ambitious plans for system reform and structural transformation have been unevenly implemented.
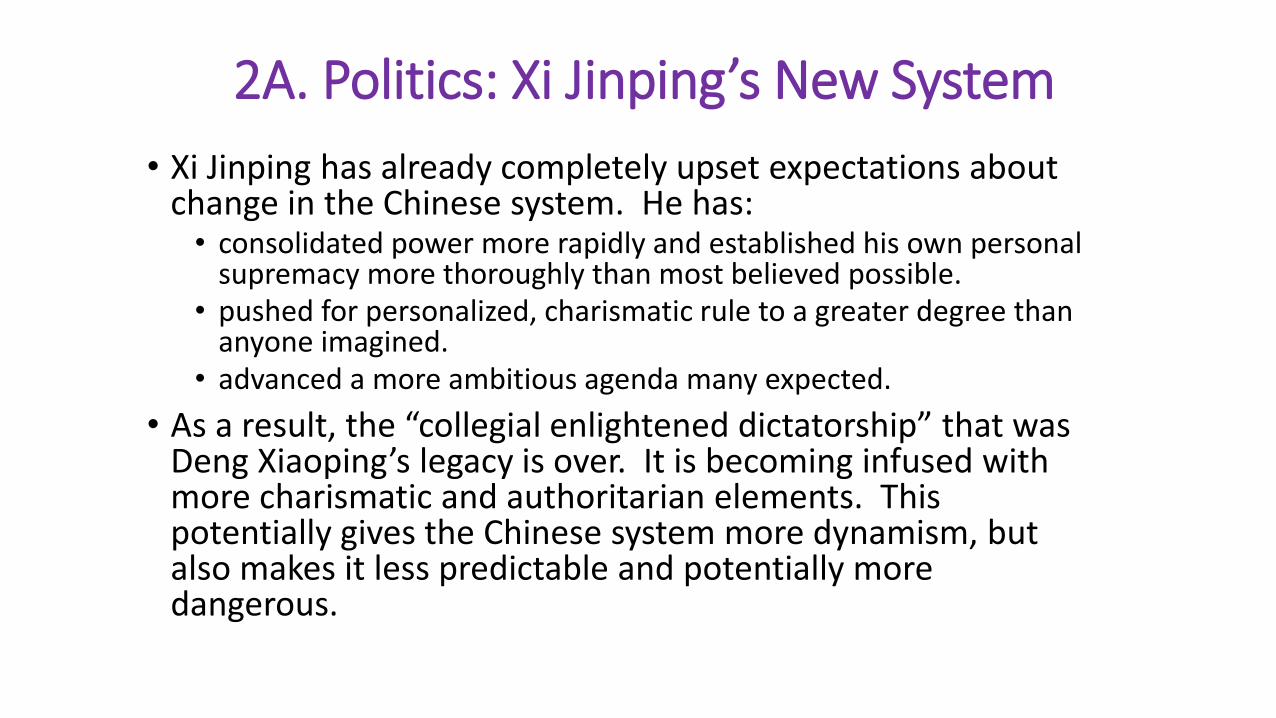
A. Politics: Xi Ji pi g’s Ne “yste• Xi Jinping has already completely upset expectations about
change in the Chinese system. He has:• consolidated power more rapidly and established his own personal
supremacy more thoroughly than most believed possible.
• pushed for personalized, charismatic rule to a greater degree than anyone imagined.
• advanced a more ambitious agenda many expected.
• As a esult, the ollegial e lighte ed di tato ship that as De g Xiaopi g’s lega is o e . It is e o i g i fused ith more charismatic and authoritarian elements. This potentially gives the Chinese system more dynamism, but also makes it less predictable and potentially more dangerous.

Xi Ji pi g’s Re i alist Age daAnti-
Corruption
Personalized Rule
Assertive Nationalism
Ideological Crackdown
Strong Party Leadership

2B. Economic Policy
• During the miracle growth years, Chinese economic policy was notably s a t. It as adapti e, i e e tal a d p ag ati .(This—alo g ith Chi a’s e t ep e eu ial a d elati el ell-educated population—e plai s a lot a out Chi a’s su ess.
• E te al o ditio s ha e ha ged: those poli ies do ’t o k toda .
• Policy-makers were relatively quick to recognize that changes called for a new growth model—more balanced and sustainable—but did not have effective tools to achieve it.
• Xi Jinping came in promising radical economic reforms, and in the Thi d Ple u of No e e , see ed to e deli e i g.
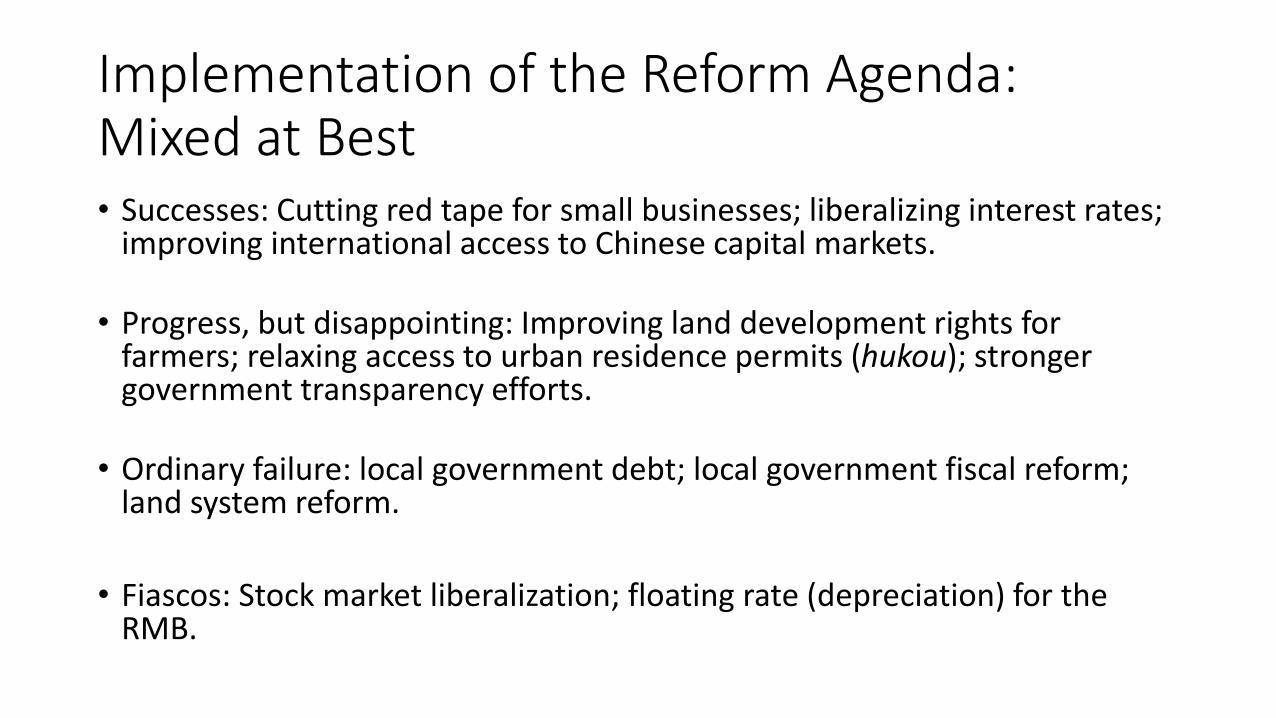
Implementation of the Reform Agenda: Mixed at Best
• Successes: Cutting red tape for small businesses; liberalizing interest rates; improving international access to Chinese capital markets.
• Progress, but disappointing: Improving land development rights for farmers; relaxing access to urban residence permits (hukou); stronger government transparency efforts.
• Ordinary failure: local government debt; local government fiscal reform; land system reform.
• Fiascos: Stock market liberalization; floating rate (depreciation) for the RMB.

State Enterprise ReformThe No e e Refo Do u e t had e iti g o ds a out Ma agi g Capital, Mi ed o e ship, a d I est e t fu ds. I stead, the positi e achievement was to resume the stalled SOE Reform Agenda from a decade ago:
A. Co e t i tuall all “OEs to Co po atio s u de Co pa La hi h as passed in 1995, 21 years ago).
B. Convert top-level holding companies into listed joint stock corporations gradually.
C. Set up Boards of Directors at virtually all firms and strengthen their power.
D. Strengthen the authority of the Communist Party over Boards of Directors and SOEs.
E. Di ide “OEs i to pu li se i e a d o e ial. Di ide Co e ial SOEs further into those in competitive sectors and those in not purely competitive sectors or with special tasks.
F. Private capital invited in whenever possible, and government stakes in competitive, commercial SOEs (only) could be converted to minority.
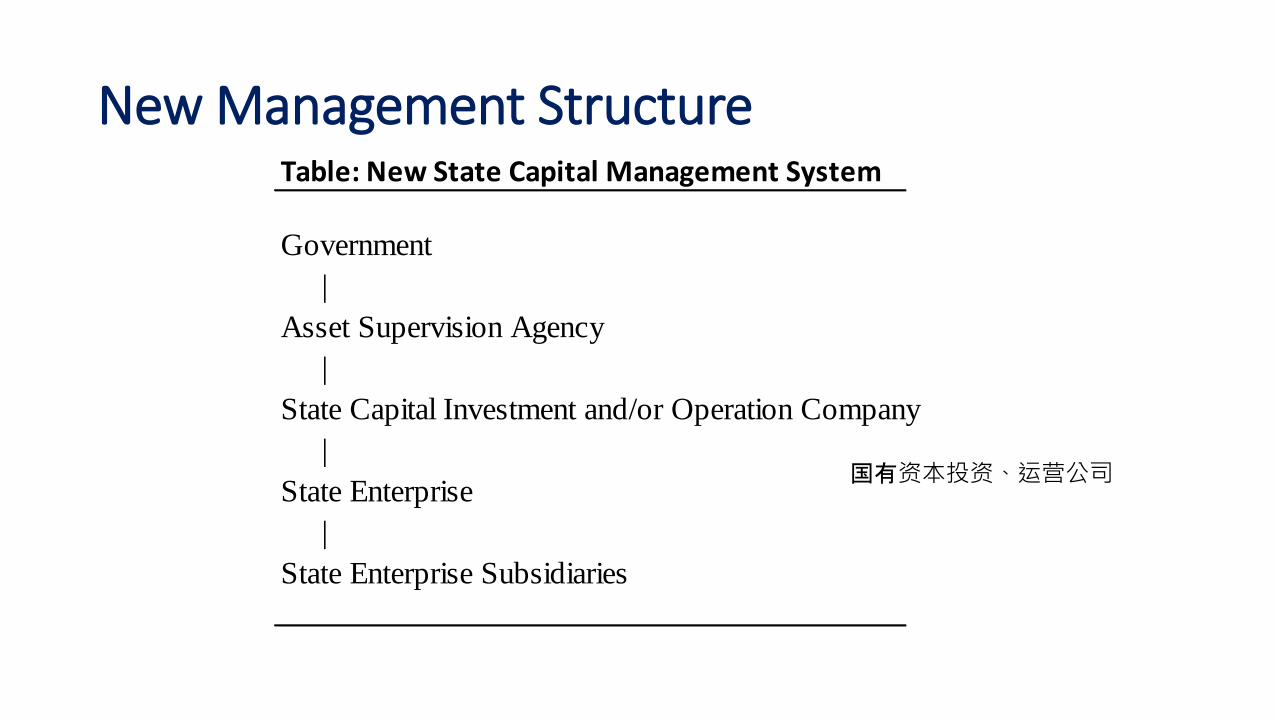
Table: New State Capital Management System
Government |Asset Supervision Agency |State Capital Investment and/or Operation Company |State Enterprise |State Enterprise Subsidiaries
New Management Structure
国有资本投资、运营公司

Commercial, Not-fully-competitive firms:
Any fi hose ai usi ess is i se to s that elate to atio al security, or the commanding heights of the national economy or i po ta t se to o ke poi t a eas, a d should e i e ti ized to
ette se ed i po ta t atio al st ategies a d a oe o o i o t ol a d spe ifi all de elop fo a d-looking strategic sectors and
well as any specially assigned responsibilities.
In other words, any firm that the government decides it wants to use as an instrument for anything. There is no dividing line. The government is i st u ted to ai tai a o t olli g stake i e e fi i this ot-fully- o petiti e lass.

Who decides what kind of firm it is?
• The owner.
• Currently the State Asset Regulatory Agency (SASAC and its local avatars).
• Ultimately, the SCIOs.
• SCIOs will have missions.
• SCIOs already have missions: for example, Gansu Province has already laid out a list of twenty-some objectives for its SOEs, drawn from its provincial plan. The implication is that a new SCIO will be set up to carry out these (unrealistic) objectives.
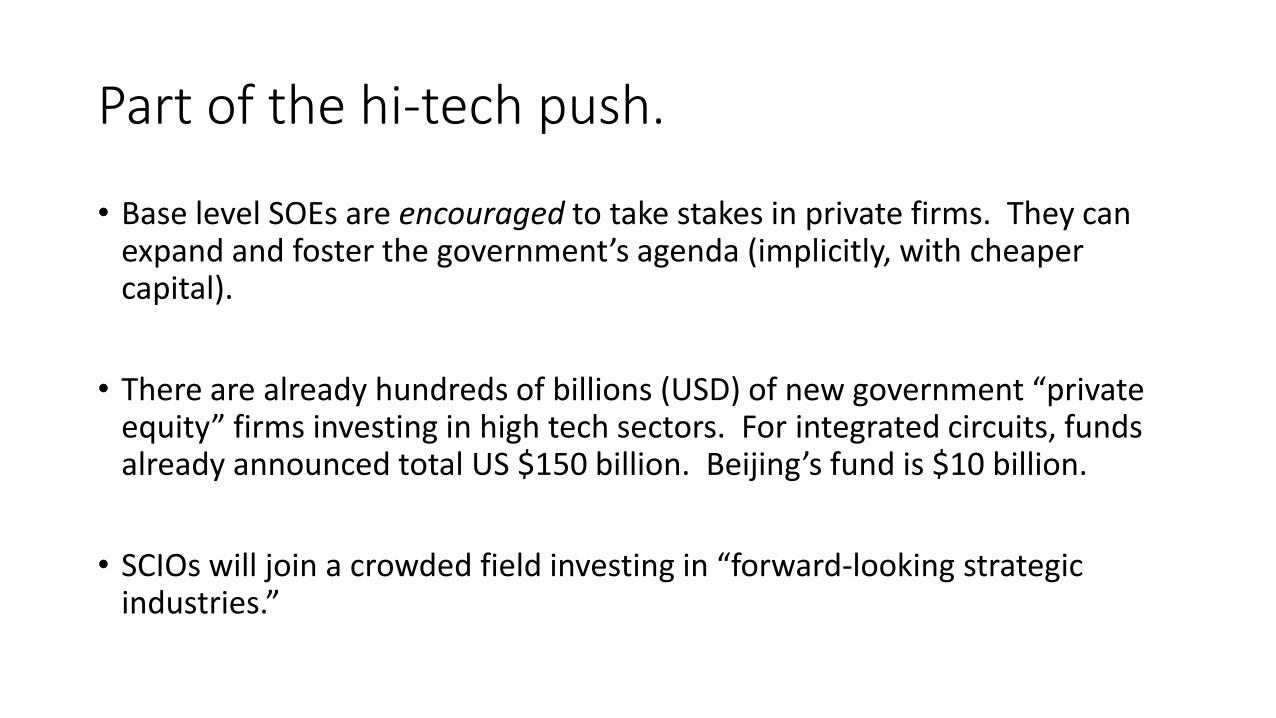
Part of the hi-tech push.
• Base level SOEs are encouraged to take stakes in private firms. They can e pa d a d foste the go e e t’s age da i pli itl , ith heape capital).
• The e a e al ead hu d eds of illio s U“D of e go e e t p i ate e uit fi s i esti g i high te h se to s. Fo i teg ated i uits, fu ds al ead a ou ed total U“ $ illio . Beiji g’s fu d is $ illio .
• “CIOs ill joi a o ded field i esti g i fo a d-looking strategic i dust ies.

3. Reform and Restructuring Have Not Yet Achieved Qualitative Success
• Growth fears and ideological considerations have repeatedly undermined successful implementation of reforms.• GDP growth should not fall below 6.5% to reach target of doubling GDP by
2020.
• As a result, credit policy has been generally accommodative, and debt burdens have continued to grow.
• In fact, policy has been more accommodative than is apparent because of the way that, for instance, local government debt restructuring was carried out. $3.2 trillion RMB in 2015—and $5 trillion RMB projected for 2016—has been placed on the books of state banks (at low interest rates).
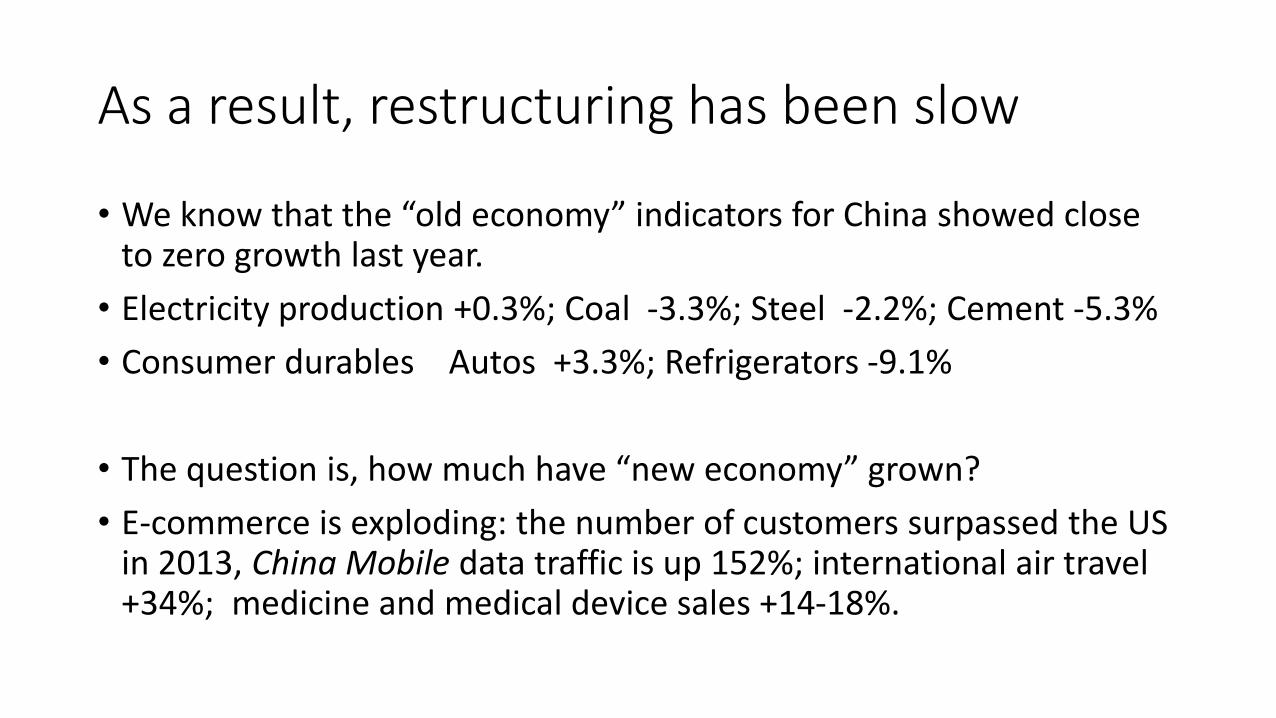
As a result, restructuring has been slow
• We k o that the old e o o i di ato s fo Chi a sho ed lose to zero growth last year.
• Electricity production +0.3%; Coal -3.3%; Steel -2.2%; Cement -5.3%
• Consumer durables Autos +3.3%; Refrigerators -9.1%
• The uestio is, ho u h ha e e e o o g o ?• E-commerce is exploding: the number of customers surpassed the US
in 2013, China Mobile data traffic is up 152%; international air travel +34%; medicine and medical device sales +14-18%.

0%
10%
20%
30%
40%
50%
60%
19
78
19
79
19
80
19
81
19
82
19
83
19
84
19
85
19
86
19
87
19
88
19
89
19
90
19
91
19
92
19
93
19
94
19
95
19
96
19
97
19
98
19
99
20
00
20
01
20
02
20
03
20
04
20
05
20
06
20
07
20
08
20
09
20
10
20
11
20
12
20
13
20
14
20
15
Fig 1. Composition of GDPProduction Side: Current Prices
Optimists
Focus Here

0%
10%
20%
30%
40%
50%
60%
19
78
19
79
19
80
19
81
19
82
19
83
19
84
19
85
19
86
19
87
19
88
19
89
19
90
19
91
19
92
19
93
19
94
19
95
19
96
19
97
19
98
19
99
20
00
20
01
20
02
20
03
20
04
20
05
20
06
20
07
20
08
20
09
20
10
20
11
20
12
20
13
20
14
20
15
Fig 2. Composition of GDPProduction Side: 2010 Constant Prices
Secondary: Industry + Construction
Tertiary: Services
Primary: Agriculture
Deflate properly and the effect almost disappears

0%
10%
20%
30%
40%
50%
60%
2007 2008 2009 2010 2011 2012 2013 2014 2015
Fig 3. Composition of GDPProduction Side: 2015 Constant Prices

Employment Data Contains two Anomalies
Changes in Labor Force and Employment (Millions)
Working Age Employed Primary Secondary Tertiary
Avg. 2011-2014 -8.3 2.8 -12.7 1.9 13.6
2015 -4.9 2.0 -8.7 -4.1 14.8
1. Many workers drawn from outside core working age employment.
2. Very rapid movement of people out of agriculture, not consistent with
anecdotal evidence or other data.


The quality of the aggregate labor data is poor. The picture the labor data paint is at best anomalous.
This data is derived from a household survey, the methodology of which we understand, and which is not linked to the success indicator of any bureaucrat. Which is right?
A Final Piece of Evidence:Supply-side Structural Reforms
• Announced fall 2015; clearly coming out of the Party Leadership Small Group system (i.e., not the government).
• NOT part of the Third Plenum economic reform program, nor is it related to it in any way. NOT part of the existing playbook. (Of course, this was not emphasized in Chinese media.)
• Seeks to accelerate the restructuring process, starting with closing down excess capacity in coal and steel.
• Seeks to carry out restructuring in accord with market forces, but also clearly seeks to assert Party leadership and control, to keep the process from spinning out of control.

Supply-Side Structural Reforms
供给侧结构性改革“udde e e phasis o agg essi el est u tu i g the suppl side :1. Close down excess capacity;
2. Get rid of unsold housing inventories;
3. De-leverage (write down debt);
4. Lower costs;
5. Fill in missing pieces.
Ela o ated i a lo g, lo g pie e i Ja ua , People’s Dail a Autho itati e Pe so age. 权威人士). Given the provenance of the
ideas, this must be a writing group closely working for
Liu He (财经领导小组办公室主任).

Ideally, supply-side reforms are driven by regulatory decisions, plus political pressure.• Five regulatory standards:
1. Pollution2. Energy consumption3. Output quality4. Occupational safety5. Technology (effectively a minimum size requirement).
• The o je ti e is to get id of zo ie fi s 僵尸• Pressure local governments not to prop up these firms; provide them with
subsidies conditional on shutting them down.
• Coal and Steel first: 29 Feb., announce expected lay-offs:• 1.2 million coal workers• 0.5 million steel workers

Challenges to Supply-side Reforms
• Lacks clear implementation paths for many of its crucial components.
• Built-in tensions:• between the way closing excess capacity depends on stronger regulatory and market
forces, and the fact that its implementation is pushed down onto local governments and Party secretaries;
• between desire to accelerate restructuring and desire to protect workers and ensure that their voice is heard;
• between drive to get the government out of excess capacity sectors and the desire to have government lead newly emerging sectors.
• No defined process for handling debt.
• Scope of Supply side reform is undefined and open to change as conditions change. It will undoubtedly go through many changes and different versions as implementation proceeds.

Conclusions 1• In early 2016, Chinese policy-makers seem to have successfully stabilized the
economy.• Careful management—combined with USD depreciation—has allowed the RMB to stabilize.
• Shanghai stock market has shrugged off year-beginning volatility, stabilized around 3,000.
• Increased credit creation has supported a rebound in infrastructure investment.
• If nothing else, it appears that the quality of Chinese economic policy-making has improved dramatically.
• However, these have been achieved through accommodative macroeconomic poli ies that a e esse tiall o e of the sa e, a d th ough li iti g efo s, e.g., in capital accounting opening.
• The e is still a o e ha g of de t, apa it , a d i stitutio al featu es. “o fa , these are getting worse, not better. Economic stresses have only barely begun penetrating into labor market conditions and household expectations, so there is a kind of expectations overhang as well.
Conclusions 2There is a heightened risk that the Chinese government is backing into a more
intrusive role in the economy. Direct government action is now approved in order to achieve:
• Investment in new high-tech sectors funded by government money;
• Government initiatives to shut down capacity in traditional industrial sectors;
• A government insistence on maintaining annual GDP growth rates at 6.5% or above.
The long-run dynamism of the Chinese economy is extraordinary. However, in the short run, reform and restructuring are still running behind the needs of the e o o . We a e fa f o a hie i g a e o al, a d e should e pe t further rounds of turbulence to emerge from China late this year or next.