china s mutual fund industry - cfa arx · 1 china’s mutual fund industry interim report 2016 a...
TRANSCRIPT

1
China’s Mutual Fund Industry
Interim Report 2016
A Review of Activities and Trends in China’s Wealth
Management and Mutual Fund Industry

2
V.Stone Financial Products Research Center
V.Stone Financial Products Research Center belongs to Shanghai V.Stone Capital Co., Ltd. V.Stone, with
its headquarter located at Shanghai Bund, aims to build the first-class asset management platform in
China. V.Stone Financial Products Research Center focuses on financial products research, especially on
mutual fund products, and all the research results are used to support investment, sales and consulting.

3
China’s Mutual Fund Industry
Interim Report 2016 A Review of Activities and Trends in China’s Wealth Management
and Mutual Fund Industry

1
Contents
Chapter One 4
Review of Capital Market 4
Review of Investment Environment 5
Economics: Stumbling Along the Bottom with No Recovery in Sight 5
Liquidity: Stable Overall but Little Incremental Capital in Stock Market 6
Policies: Prudent Monetary Policy and Proactive Fiscal Policy 8
International Market: FOMC and Brexit Influencing the Market 8
Exchange Rates: CNY Depreciation with Increasing Volatility 9
Review of Stock, Bond and Bulk Commodity Market 10
A-Share Market: Circuit-Breaker Mechanism and Structural Market 10
Bond Market: Rebound after Crash in April 13
Bulk Commodities: Crude Oil and Gold Both Remarkable 14
Chapter Two 15
Review of Mutual Fund Industry 15
Industry Scale 16
New Product Issuance 18
Fixed Income Products Taking the Leading Position 18
Hybrid Funds Popular while Equity Funds Leaving Out 19
Guaranteed Funds Almost Doubled 20
Fund Performance 21
Equity Funds 21
Hybrid Funds 22
Bond Funds 22
Commodity Funds and Hedge Funds 23
Money Market Funds 23
QDII Funds 23
New Policies and Trends 25
FOF On the Stage 25
First Foundation of Foreign Controlled Fund Management Company 26
Third-party Sales License Tightened up 27
Chapter Three 28
Wealth Management Industry Dynamics 28
Wealth Management Industry Scale 29
Comparison among Diversified Financial Products 30
Private Placement Funds: Equity Investment Transcending Security Investment
30
Insurance: Increasing Stock Investment 31
Bank Financing Products: Downward Returns but Still Dominating the Industry

2
32
Trust: Declining Growth Rate 34
Brokerage Asset Management: Collective Asset Management Plans Exceeding
One Trillion yuan 35
P2P: High Default Risk 36

3
Figure 1 Monthly Data of CPI & PPI ................................................................................................. 6
Figure 2 Margin Accounts & Daily Turnover of A-shares ............................................................... 7
Figure 3 CNY Exchange Rates ............................................................................................................ 10
Figure 4 CITIC Primary Industry Ranking ...................................................................................... 12
Figure 5 Scale of Mutual Fund Industry ........................................................................................... 17
Figure 6 Distribution of Mutual Fund Industry-1 .......................................................................... 17
Figure 7 Distribution of Mutual Fund Industry-2 .......................................................................... 17
Figure 8 Amount of New Funds and Issuance Shares ..................................................................... 19
Figure 9 Changes in Sizes of All Financial Sectors ......................................................................... 29
Figure 10 Proportions of the Size of Each Sector ............................................................................ 29
Figure 11 Changes in the Sizes of Private Placement Funds ......................................................... 30
Figure 12 Size and Distribution of the Private Placement Fund .................................................. 30
Figure 13 Total Assets and Growth Rate in Insurance Industry .................................................. 31
Figure 14 The Proportion of Insurance Property Investments ...................................................... 32
Figure 15 Fund Balances of Bank Financing Products ................................................................... 33
Figure 16 Issuance of New Bank Financing Products .................................................................... 33
Figure 17 Scale of Property Trust ...................................................................................................... 34
Figure 18 Property Trust Structure, by Business Functions .......................................................... 35
Figure 19 Property Trust Structure, by Investment Objectives .................................................... 35
Figure 20 The Historical Scale of Brokers’ Collective Asset Management ................................. 36
Figure 21 The Scale and Distribution of Brokers’ Collective Asset Management ...................... 36
Figure 22 The Amount of Total Platforms and Cumulative Problematic Platforms ................ 37
Figure 23 The Amount of Monthly New Added Platforms ............................................................ 37
Table 1 Stock Market Quotation ...................................................................................................... 12
Table 2 Bond Market Quotation ....................................................................................................... 14
Table 3 Commodity Market Quotation ........................................................................................... 14
Table 4 Overall Issuance of All Types of Funds, First Half Year of 2016 .................................... 20
Table 5 The Top Three Funds of Each Type, Ranged by Changes ................................................. 24
Table 6 Prospective types of FOF in Public Offering Funds ......................................................... 26
Table 7 Average Expected Rate of Return for Bank Financing Products .................................... 33
4
Chapter One
Review of Capital Market
Review of Investment Environment:
In the first half of 2016, market economy was still stumbling along the bottom
and there would be no obvious recovery in the near future. In terms of capital,
the overall situation was comparatively stable but little incremental flowing
into the stock market. In the aspect of policies, monetary policies kept
prudent and fiscal policies kept proactive. At international level, the interest
rate hike process of FOMC and the final result of Brexit influenced the
international market a lot. In the aspect of exchange rates, CNY(Chinese Yuan)
continued the way of depreciation with increasing volatility and decreasing
shocks.
Review of Stock, Bond and Bulk Commodity Market
In A-share market, circuit-breaker mechanism locked up lots of capital and
the structural market prevailed during the first half year. In bond market,
PBOC increased frequency and intensity of open market operations and used
a variety of liquidity tools to stabilize capital. After the crash and adjustment
in April, the bond market started to rebind. In the market of bulk
commodities, both the price of crude oil and gold rose remarkably.

5
Review of Investment Environment
Economics: Stumbling Along the Bottom with No Recovery in
Sight
Reviewing the first half of 2016, economy came back to stability after the
pulsed recovery early this year, but still stumbled along the bottom. At the
beginning of this year, common forecast for Chinese economy was quite
pessimistic. However, large quantity of loan and the loosening of
home-purchase restrictions in January contributed a lot to the boom of real
estate market, which extended from first-tier cities to second-tier cities and, to
some extent, promoted the recovery of Chinese economy. With such a
complex background, disagreements were generated on economic trend.
Optimists thought that the economy had started to recover while pessimists
held the opinion that the current recovery could not be sustainable.
In fact, with the stimulation of both fiscal and monetary policies, the price of
upstream bulk commodities, particularly of black metals, rose significantly.
Meanwhile, the prices of pork and vegetables have been forced up by the low
level of pig breeding stock and the abnormal weather. Affected by those
issues, CPI had been above 2% for three consecutive months, leading the
market to anticipate a continuously high degree of inflation. However, the
first-tier cities led by Shanghai started to tighten property policies and
conduct stringent home-purchase restrictions on April, while banks started to
tighten up on their credits simultaneously. Responded to those measures, the
economy fell a bit and disagreements on whether economy is recovering
began to diminish. Furthermore, authorities’ statement of L-shaped economy
tends to be recognized and admitted by the market.
Overall, the economy still remains at the bottom and the prospect for
economic recovery is quite bleak. At present, policymakers are very cautious
in the implementation of quantitative easing to boost economy and they pay
more attention on structural adjustment. Thus, the core missions for the
government now are conducting supply-side reform, reducing excess
production capacity, as well as encouraging and supporting emerging
industries.

6
Figure 1
Monthly Data of CPI & PPI
2014-2016, %
Sources: WIND, V.Stone
Liquidity: Stable Overall but Little Incremental Capital in Stock
Market
At the macro level, liquidity was stable overall in the first half of 2016.
Specifically speaking, in the second half of January, responding to
Agricultural Bank of China’s Bill Case, regulators made great efforts to rectify
and standardize banks’ note business. Through this series of initiatives,
interest rate of bill discount business rose significantly, generating great
worries about market liquidity. In March, The People's Bank of China (PBOC)
firstly conducted Macro Prudential Assessment (MPA) on banks. Some banks
concerned that interbank businesses might not meet the regulation of PBOC,
so they reduced the quantity of interbank lending, generating a tighter capital
market. However, the tightening at this time was only a short-duration
impact, and the capital market returned to steady after a short while. After
May, market started to concern about the potential impact brought by MPA in
June, but thanks to the fact that banks had already gained some experience in
dealing with MPA, their advanced preparation did help a lot in keeping
capital market steady. PBOC’s attitude is to keep capital market stable, which
is clarified in its statement that the impact of reducing commercial banks’
reserve requirements is quite big and that other monetary measures such as
MLF and open market operations should be used. The PBOC’s specific use of
monetary tools also showed this opinion. Except cutting the reserve
requirement ratio by 0.5% on March 1st, PBOC used more measures of MLF,
-7
-6
-5
-4
-3
-2
-1
0
0
0.5
1
1.5
2
2.5
320
14/0
4/0
1
20
14/0
5/0
1
20
14/0
6/0
1
20
14/0
7/0
1
20
14/0
8/0
1
20
14/0
9/0
1
20
14/1
0/0
1
20
14/1
1/0
1
20
14/1
2/0
1
20
15/0
1/0
1
20
15/0
2/0
1
20
15/0
3/0
1
20
15/0
4/0
1
20
15/0
5/0
1
20
15/0
6/0
1
20
15/0
7/0
1
20
15/0
8/0
1
20
15/0
9/0
1
20
15/1
0/0
1
20
15/1
1/0
1
20
15/1
2/0
1
20
16/0
1/0
1
20
16/0
2/0
1
20
16/0
3/0
1
20
16/0
4/0
1
20
16/0
5/0
1
CPI (left axis) PPI (right axis)

7
PSL, SLF and open market operations to increase the amount of capital and to
smooth fluctuations in capital market.
At the stock market level, there is little incremental capital participating in
the market. Affected by the introduction of a Circuit-Breaker Mechanism in
January, margin trading balance of stock market declined rapidly from above
1 trillion yuan. The balance continued to decline to around 830 billion yuan by
the impact of the bear market and remained at this level (the same level as in
early December 2014). As for turnover, all A shares’ daily turnover was
averaged at 534 billion yuan in the first half year. Compared with 1.0386
trillion yuan in 2015, trading volume is substantially halved. As for new
investors, growth of new investors was quite slow in the first half of 2016,
with a weekly average of 370 thousand people. Compared with the highest
point in 2015 of 1.4 million people, it fell by about 74%, reflecting investors’
low passion to stock market. As for Shanghai-Hong Kong Stock Connect,
61.462 billion yuan flew in to Shanghai stock market in the first half of 2016,
but the volatility of capital was huge and keeping an inverse relationship with
Shanghai Composite index. This means that when Shanghai Composite index
falls a lot, the capital inflows rapidly, and vice versa. At the same time,
117.116 billion yuan flew into Hong Kong stock market in the first half of 2016,
showing an accelerated trend of capital inflow especially in June. Besides,
compared with the valuation of A-shares, the lower valuation of Hong Kong
stocks might be more attractive for long-term investors.
Figure 2
Margin Accounts & Daily Turnover of A-shares
2015-2016, billion yuan (left axis), billion (right axis)
Sources: WIND, V.Stone
0
500
1,000
1,500
2,000
2,500
0
500
1,000
1,500
2,000
2,500
20
15/0
1/0
5
20
15/0
1/2
5
20
15/0
2/1
4
20
15/0
3/0
6
20
15/0
3/2
6
20
15/0
4/1
5
20
15/0
5/0
5
20
15/0
5/2
5
20
15/0
6/1
4
20
15/0
7/0
4
20
15/0
7/2
4
20
15/0
8/1
3
20
15/0
9/0
2
20
15/0
9/2
2
20
15/1
0/1
2
20
15/1
1/0
1
20
15/1
1/2
1
20
15/1
2/1
1
20
15/1
2/3
1
20
16/0
1/2
0
20
16/0
2/0
9
20
16/0
2/2
9
20
16/0
3/2
0
20
16/0
4/0
9
20
16/0
4/2
9
20
16/0
5/1
9
20
16/0
6/0
8
20
16/0
6/2
8
Daily Turnover of Wind A Shares (left axis) Margin Accounts (right axis)
8
Policies: Prudent Monetary Policy and Proactive Fiscal Policy
PBOC implemented prudent monetary policy in the first half of 2016. In the
first half year of 2016, the monetary policy of PBOC caught into dilemma as
the depreciation of exchange rate and the prospect of potential inflation
negatively affected the loosening monetary policy while the pressure of the
economic downturn positively affected that. However, since the
implementation of large quantity loan at the beginning of this year did not
generate a desirable result, decision-makers turned to focus on structural
adjustment, where reducing excess production capacity and conducting
supply-side reform became main tasks. The goal of monetary policy currently
is to stabilize the capital market, and to create a favorable environment for
structural adjustment.
The proactive fiscal policy was the main tone of the first half year. In the
first half of 2016, fiscal policy behaved actively, mainly in promoting
supply-side reform and reducing excess production capacity. It also aimed at
improving the implementation of PPP to promote private capital to
participate into government projects, changing the form of tax from Business
Tax to Value Added Tax to reduce tax burden for corporations, decentralizing
audit authority and abolishing redundant approval process to simplify project
application process, and promoting local government to conduct debt
replacement to reduce government debt burden. Overall, the fiscal policy of
2016 maintained positive. And with the decline in real estate sales, fiscal
policy needs to pay more attention in increasing investment in infrastructure
and other public facilities to underpinning the economy in the near future.
International Market: FOMC and Brexit Influencing the Market
Differentiation of monetary policies among world's major economies
increased, generating higher market risk. After December 2015 when the Fed
raised interest rate, the market became very sensitive to Fed’s interest rate
hike and the expectation of that changed dramatically. Early this year, an
agreement was made that the Fed would not raise interest rate until June,
which means no interest rate hike was expected in April’s FOMC. Some
members of the Fed’s interest-rate committee issued a ‘hawkish’ speech in
May, which disturbed market expectations and triggered financial market’s

9
volatility. However, because of the poor US economic data and concerns
about the referendum of Brexit in June, FOMC announced the decision of
keeping interest rates unchanged. Meanwhile, both Japan and the EU still
adopted loosening monetary policy. Japan announced the implementation of
negative interest rates at the beginning of this year, becoming the first Asian
country of adopting negative interest rates which let the market shocked a lot.
Besides, Europe continued its quantitative easing to expand the range of
available debt, but with limited room for quantitative easing, the effect was
not evident.
Brexit is out of expectation, generating significant market volatility on the
‘Black Friday’. On June 24th, the result of British referendum was announced
that people who support to leave the EU won 51.9% to 48.1% and the
European Parliament would start the relevant process. Before the
announcement of the result, most people believed that Britain would not
leave Europe, so the British pound, US and EU stock markets rose sharply at
that time. The unexpected referendum led to great volatility in capital market,
where the pound plummeted by 11% in a single day while most European
stock markets fell by around 10% at the opening of trading. In addition to
Brexit, Europe is still faced with terrorist attacks, refugee problems, strained
diplomatic relations with Russia and other thorny issues.
Exchange Rates: CNY Depreciation with Increasing Volatility
In the first half of 2016, the main trend of CNY (Chinese Yuan) exchange
rate was depreciation, with its volatility increased. Early this year, the CNY
exchange rate depreciated significantly without any sign. USDCNH
(exchange rate of US dollar to offshore traded Chinese Yuan) fell to 6.7608,
while USDCNY (exchange rate of US dollar to Chinese Yuan) depreciated to
6.5956, causing great panic to A-share market. Later on, PBOC intervened and
restricted the liquidity of CNH (offshore traded Chinese Yuan), making
CNYHIBOR (Chinese Yuan Hongkong InterBank Offered Rate) soared to
66.82% overnight in Hong Kong market. PBOC’s a series of initiatives
stabilized the exchange rate market, with both offshore and onshore exchange
rate rising to the level of around 6.5. Although concerns of huge exchange rate
volatility are temporarily lifted, a strong depreciation expectation in the
exchange rate market in the long-term still exists.

10
Affected by the depreciation of exchange rate in early 2016, PBOC announced
the central parity system that pricing exchange rate based on both closing
exchange rate and a basket of currencies’ exchange rate. CFETS, which was
launched by PBOC in late 2015, was gradually recognized by the market.
CNY started to be stable against the US dollar and depreciated against the
CFETS. The market accepted all these issues without panic, even when Brexit
triggered large depreciation of USDCNY to the level of 6.66, indicating that
communications between PBOC and the market played a significant role in
stabilizing expectations.
Figure 3
CNY Exchange Rates
2015-2016
Sources: WIND, V.Stone
Review of Stock, Bond and Bulk Commodity Market
A-Share Market: Circuit-Breaker Mechanism and Structural
Market
Early this Year, A-share market fell sharply because of both panic caused
by unexpected depreciation of CNY and the lack of market liquidity caused
by circuit-breaker mechanism. Later on, A-shares plummeted again in
5.8
5.9
6.
6.1
6.2
6.3
6.4
6.5
6.6
6.7
6.8
20
15/0
1/0
2
20
15/0
1/1
4
20
15/0
1/2
6
20
15/0
2/0
7
20
15/0
2/1
9
20
15/0
3/0
3
20
15/0
3/1
5
20
15/0
3/2
7
20
15/0
4/0
8
20
15/0
4/2
0
20
15/0
5/0
2
20
15/0
5/1
4
20
15/0
5/2
6
20
15/0
6/0
7
20
15/0
6/1
9
20
15/0
7/0
1
20
15/0
7/1
3
20
15/0
7/2
5
20
15/0
8/0
6
20
15/0
8/1
8
20
15/0
8/3
0
20
15/0
9/1
1
20
15/0
9/2
3
20
15/1
0/0
5
20
15/1
0/1
7
20
15/1
0/2
9
20
15/1
1/1
0
20
15/1
1/2
2
20
15/1
2/0
4
20
15/1
2/1
6
20
15/1
2/2
8
20
16/0
1/0
9
USD/CNY Central Parity Rate Spot USD/CNY Fixing

11
mid-January due to the Bill Case. With these two successive shocks, investors
in stock market became extremely depressed. CSI 300 fell by 21.04% and GEM
index dropped by 26.53% in January. Since then the Shanghai Composite
Index began to fluctuate at 3000. After three crashes respectively in April 20th,
May 6th and 9th, Shanghai Composite Index slipped from 3000 to around 2800.
It didn’t climb back to above 2900 until the last day of May. In June, the
plunge of external market, the fail of MSCI inclusion, and the Brexit event all
increased the volatility of the stock market. However, A-share market
rebounded after all these negative effects, rising for three consecutive trading
days and eventually closed at above 2900.
Although there was no clear trend for the whole market, some specific
industries stayed heated. Initially, by the impact of the expectation of
economic recovery, coal, steel and other cyclical stocks rebounded sharply
and led the market. Then the expectation of inflation pushed some industries
such as food and beverages, agriculture, forestry, animal husbandry and
fishery up. In March, the overall market ushered in a wave of rebound
especially rare-earth metals, OLED, new energy vehicles, lithium battery and
sun-new stocks. The market showed a significant structural characteristic.
Most indexes were recorded as a fall, but there were still some bright spots
in some sectors. Specifically, Shanghai Composite Index fell by 17.22% with
an average daily volume of 199.156 billion yuan; CSI 500 fell by 19.61% with
an average daily volume of 102.334 billion yuan; GEM Index fell by 17.92%
with an average daily volume of 33.779 billion yuan; And Wind All A-shares
fell by 17.04% with an average daily volume of 530.45 billion yuan. In terms of
industries, the performances of food and beverages (2.38%), non-ferrous
metals (-5.15%) and banks (-6.16%) stood out as the top three, while media
(-29.78%), catering and tourism (-27.26%) and transportation (-27.00%)
manifested the worst. In terms of themes, sub-new stocks, as new listing
shares, gained a well performance of 118.67% increase. Among other themes,
lithium battery index (10.51%), OLED index (9.23%), and rare-earth
permanent magnet (REPM) index (8.61%) performed as the first three,
whereas genetic testing index (-26.72%), Disney index (-26.68%), and
dislodging IOE index (-26.09%) performed the worst.

12
Table 1
Stock Market Quotation 2016.01.01-2016.06.30
Index Name Close Index Changes, %
Shanghai Composite Index 2929.61 -17.22
CSI 300 3153.92 -15.47
Small and Medium-sized Board Index 6892.73 -17.88
Growth Enterprise Market Index 2227.79 -17.92
Sources: V.Stone, WIND
Figure 4
CITIC Primary Industry Ranking
2016.01.01-2016.06.30, %
Sources: WIND, V.Stone
-35 -30 -25 -20 -15 -10 -5 0 5
Media
Catering and Tourism
Transportation
Computer
Commercial, Trade and Retail
Real Estate
Power and Utilities
Building
Composite Industry
Steel
Agriculture, Forestry, Animal Husbandry and Fishery
Light manufacturing
Machinery
Textile and Apparel
Defense Industry
Building Materials
Electric Equipment
Pharmaceuticals
Basic Chemicals
Communication
Petroleum and Petrochemical
Non-bank Financing
Motor Industry
Electronic Component
Coal
Appliances
Banking
Non-ferrous Metal
Food and Beverages

13
Bond Market: Rebound after Crash in April
The overall situation of the capital supply changed from loose to tight and
then to a steady state. From the beginning of this year, PBOC increased
frequency and intensity of open market operations and used a variety of
liquidity tools to stabilize capital. With the arrival of the day for deposit
payment in the first quarter and with the implementation of macro-prudential
assessment (MPA) system, bank financing experienced short-term tension
when the willingness of funding reduced. In April, affected by maturity of
MLF and changing of the tax form from Business Tax to Value Added Tax,
the interest rate of currency went upward. This upward tendency started
easing from late April and almost disappeared at the end of June. Moreover,
PBOC continued to increase the frequency and intensity of open market
operations to maintain the stability of capital.
After two-year bull market, the bond market began to adjust. For interest rate
bonds, yields of treasury bonds and policy financial bonds rose sharply due
to factors including capital supply, credit risk, tax system changes, rising
commodity price and concerns about the impact of deleveraging. But yields of
interest rate bond declined recently because of Brexit. As for credit debt, bond
default events occurred in the first five months of 2016 have been far more
than those of the whole year of 2015, no matter in terms of the number of
enterprises, the number of bonds, or the amount involved. These bond default
enterprises include DongBei Special Steel Group (the first local state-owned
enterprise involved in this kind of events), China Coal Group ShanXi HuaYu
Energy (the first coal state-owned enterprise involved in this kind of events),
and China Railway Material Group (the first AA+ state-owned enterprise
involved in this kind of events). The concentrated outbreak of these bond
default events made credit risk the most concern in the bond market, and
directly contributed to the negative situation for both stocks and bonds.
Overall, during the first half of 2016, ChinaBond Aggregate Index Net Price
Index fell by 0.50%, ChinaBond Corporate Bond Index Net Price Index fell by
3.21%, ChinaBond Treasury Bond Aggregate Index Net Price Index fell by
0.21%, and CSI Convertible Bond Index fell by 11.90%.

14
Table 2
Bond Market Quotation 2016.01.01-2016.06.30
Index Name Close Index Changes, %
Total Net Price Index 119.08 -0.5
Total Net Price Index of Corporate Bonds 91.39 -3.21
Total Net Price Index of Government Debts 120.03 -0.21
Sources: V.Stone, WIND
Bulk Commodities: Crude Oil and Gold Both Remarkable
NYMEX crude oil rose by 30.56% in the first half year. From a historical
point of view, the crude oil is still low, but has surged by nearly 50% since
February. Although Doha freezing output agreement failed, decreasing
drilling in the Middle East, Canada’s forest fires, and decreasing supply due
to the political situation in the Middle East caused the overall oil prices
showing an upward trend.
In the first half of this year, gold’s performance was quite brisk, with
COMEX gold rising by more than 24%. Gold price rose mainly due to the
fading expectation for Fed’s rate hike, with concerns of weak global growth
and concerns for US’s political uncertainty. In May, led by a higher
expectation of the Fed’s interest rate hike, the attraction of precious metal
declined and the price of gold fell. However, due to the failure of the rate hike
and the unexpected Brexit, the price of gold continued to rise. On the day of
the Brexit, the ‘Crazy Friday’, the price of gold broke the mark of 1300.
Table 3
Commodity Market Quotation 2016.01.01-2016.06.30
Index Name Close Index Changes, %
U.S. Dollar Index 95.95 -2.79
CNY Index 116.8 -3.47
COMEX Gold 1324.7 24.91
NYMEX WTI 48.4 30.56
Sources: V.Stone, WIND

15
Chapter Two
Review of Mutual Fund Industry
Industry Scale
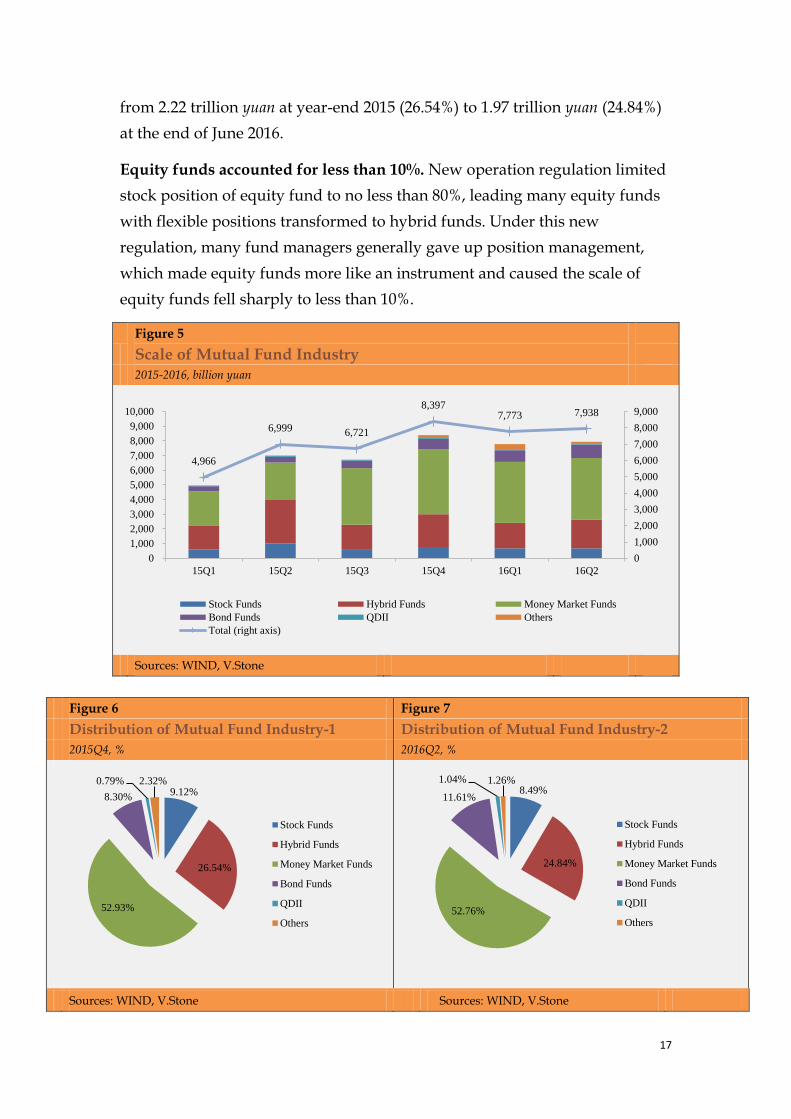
After breaking through 8 trillion yuan at year-end 2015, the scale of mutual
fund industry fell back in the first half of 2016. Specifically, money market
funds maintained the first. Bond funds increased slightly, while hybrid funds
shrank slightly. Moreover, equity funds accounted for less than 10% of the
whole market.
New Product Issuance
Fixed income products took the leading position no matter in terms of
amount or scale. Hybrid funds were the most popular funds while equity
funds left out. Moreover, during this first half year, guaranteed funds almost
doubled.
Fund Performance
This part is going to illustrate the quotation and performance of various funds,
including equity funds, hybrid funds, bond funds, commodity funds, hedge
funds, money market funds and QDII funds.
New Policies and Trends
FOF gradually appeared on the stage with bright prospects. In addition, the
approval process of establishing fund management company slowed down.
Besides, the issuance of third-party sale license tightened up, and many
companies were pending to be public offering fund management companies.

16
Industry Scale
After breaking through 8 trillion yuan at year-end 2015, the scale of mutual
fund industry fell back in the first half of 2016. Weeding out the ETF feeder
funds, we can roughly see a gradual increase in the size of mutual fund
industry since 2014. In the second quarter of 2015, the scale of mutual fund
industry reached 7 trillion yuan due to the bull market. However, as the
deleveraging starting from June 15th and exchange rate reform starting from
August 11th reduced the funds’ net value as well as investors' risk preference,
overall scale of mutual fund industry declined to 6.72 trillion yuan. Later on,
together with the market rebound in fourth quarter of 2015 and fund
companies’ intention to expansion, the scale of mutual fund industry finally
broke through 8 trillion yuan. Affected by the poor performance of the stock
market in the first half of 2016, investors preferred Guaranteed Funds and
QDII funds rather than equity funds or equity-oriented hybrid funds. Thus,
the scale of mutual fund industry fell back to lower than 8 trillion yuan in the
first half of 2016.
Money market funds maintained the first. The scale of money market funds
was 4.44 trillion yuan at year-end 2015, accounting for 52.93%. Although
annual return of money market funds fell due to the declining of risk-free rate,
asset shortage caused by bear market supported demand of cash management
and thus the growth of money market funds. Therefore, the overall size of
money market funds still accounts for 52.76% of the whole industry.
Bond funds increased slightly. Even though credit debt violation accidents
happened frequently, asset shortage coupled with bear market strengthened
the investment value of bond market where investors could still find band
operation opportunities. Overall, the scale of bond funds increased from 0.70
trillion yuan at year-end 2015 (8.30%) to 0.92 trillion yuan at the end of June
2016(11.61%).
Hybrid funds shrank slightly. The internal structure of hybrid fund market
changed in the first half of 2016. Equity-oriented hybrid funds with high stock
positions plummeted, resulting in reduction of the fund scale. Meanwhile,
bond-oriented hybrid funds, especially guaranteed funds, were popular,
driving the fund scale up. Taken together, the scale of hybrid funds shrank
17
from 2.22 trillion yuan at year-end 2015 (26.54%) to 1.97 trillion yuan (24.84%)
at the end of June 2016.
Equity funds accounted for less than 10%. New operation regulation limited
stock position of equity fund to no less than 80%, leading many equity funds
with flexible positions transformed to hybrid funds. Under this new
regulation, many fund managers generally gave up position management,
which made equity funds more like an instrument and caused the scale of
equity funds fell sharply to less than 10%.
Figure 5
Scale of Mutual Fund Industry
2015-2016, billion yuan
Sources: WIND, V.Stone
Figure 6 Figure 7
Distribution of Mutual Fund Industry-1 Distribution of Mutual Fund Industry-2
2015Q4, % 2016Q2, %
Sources: WIND, V.Stone Sources: WIND, V.Stone
4,966
6,999 6,721
8,397 7,773 7,938
0
1,000
2,000
3,000
4,000
5,000
6,000
7,000
8,000
9,000
0
1,000
2,000
3,000
4,000
5,000
6,000
7,000
8,000
9,000
10,000
15Q1 15Q2 15Q3 15Q4 16Q1 16Q2
Stock Funds Hybrid Funds Money Market Funds
Bond Funds QDII Others
Total (right axis)
9.12%
26.54%
52.93%
8.30%
0.79% 2.32%
Stock Funds
Hybrid Funds
Money Market Funds
Bond Funds
QDII
Others
8.49%
24.84%
52.76%
11.61%
1.04% 1.26%
Stock Funds
Hybrid Funds
Money Market Funds
Bond Funds
QDII
Others
18
New Product Issuance
Fixed Income Products Taking the Leading Position
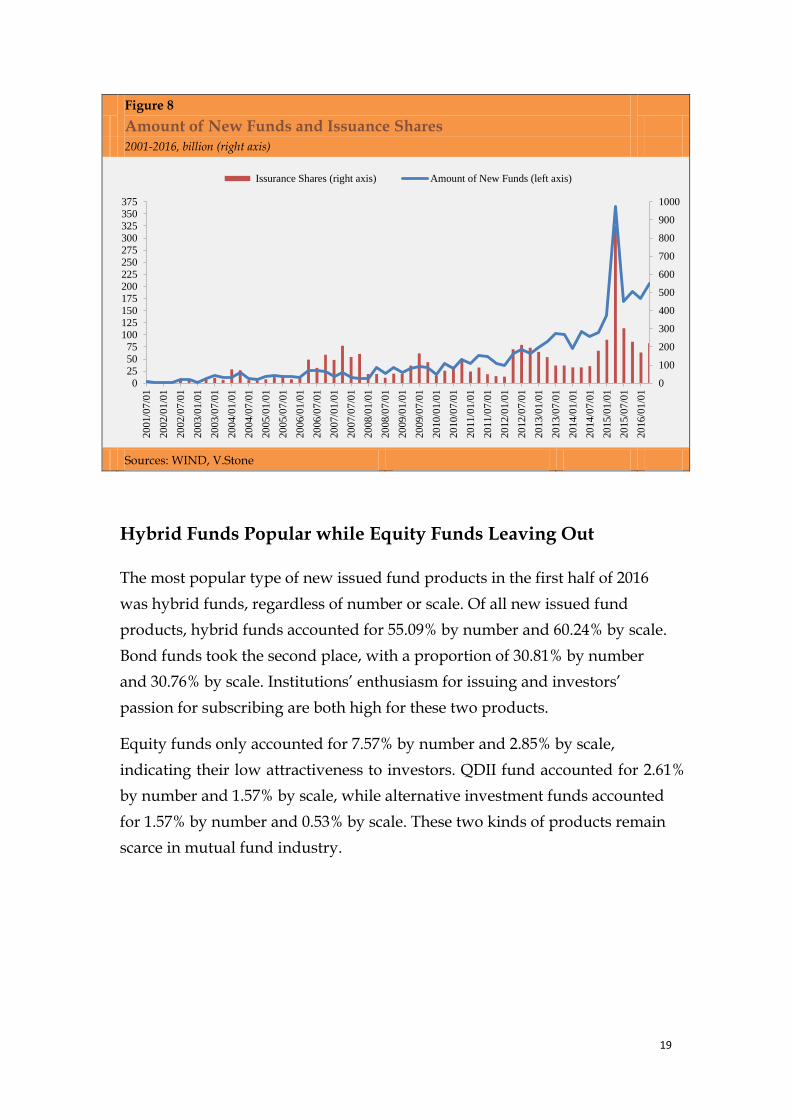
In the first half of 2016, 383 funds were set up, lower than 506 in the first half
of 2015 but higher than 360 in the second half of 2015, showing continuous
enthusiasm of new product issuance by institutions. However, the scale of
new product issuance declined because investors’ passion for subscribing
funds cooled down after stock market collapsed. Total number of shares of
new fund issuance was 389.12 billion, much less than 1,107.17 billion in the
first half of 2015 and 27% less than 531.05 billion in the second half of 2015.
Viewing issuance by category, 29 equity funds were set up, with 11.11 billion
shares; 211 hybrid funds were set up, with 234.42 billion shares; 118 bond
funds were set up, with 119.69 shares; 10 QDII funds were set up, with 6.11
billion shares; And 9 money market funds were set up, with 15.74 billion
shares.
Of all 383 new issued products, 174 are equity products, with 83.94 billion
shares (0.48 billion shares per product); and 202 are fixed income products,
with 302.77 billion shares (1.50 billion shares per product). Alternative
investment products are only 7, with 2.41 billion shares (0.34 billion shares
per product). It shows clearly that fixed income products are more preferable
to investors.
19
Figure 8
Amount of New Funds and Issuance Shares
2001-2016, billion (right axis)
Sources: WIND, V.Stone
Hybrid Funds Popular while Equity Funds Leaving Out
The most popular type of new issued fund products in the first half of 2016
was hybrid funds, regardless of number or scale. Of all new issued fund
products, hybrid funds accounted for 55.09% by number and 60.24% by scale.
Bond funds took the second place, with a proportion of 30.81% by number
and 30.76% by scale. Institutions’ enthusiasm for issuing and investors’
passion for subscribing are both high for these two products.
Equity funds only accounted for 7.57% by number and 2.85% by scale,
indicating their low attractiveness to investors. QDII fund accounted for 2.61%
by number and 1.57% by scale, while alternative investment funds accounted
for 1.57% by number and 0.53% by scale. These two kinds of products remain
scarce in mutual fund industry.
0
100
200
300
400
500
600
700
800
900
1000
0255075
100125150175200225250275300325350375
20
01/0
7/0
1
20
02/0
1/0
1
20
02/0
7/0
1
20
03/0
1/0
1
20
03/0
7/0
1
20
04/0
1/0
1
20
04/0
7/0
1
20
05/0
1/0
1
20
05/0
7/0
1
20
06/0
1/0
1
20
06/0
7/0
1
20
07/0
1/0
1
20
07/0
7/0
1
20
08/0
1/0
1
20
08/0
7/0
1
20
09/0
1/0
1
20
09/0
7/0
1
20
10/0
1/0
1
20
10/0
7/0
1
20
11/0
1/0
1
20
11/0
7/0
1
20
12/0
1/0
1
20
12/0
7/0
1
20
13/0
1/0
1
20
13/0
7/0
1
20
14/0
1/0
1
20
14/0
7/0
1
20
15/0
1/0
1
20
15/0
7/0
1
20
16/0
1/0
1
Issurance Shares (right axis) Amount of New Funds (left axis)
20
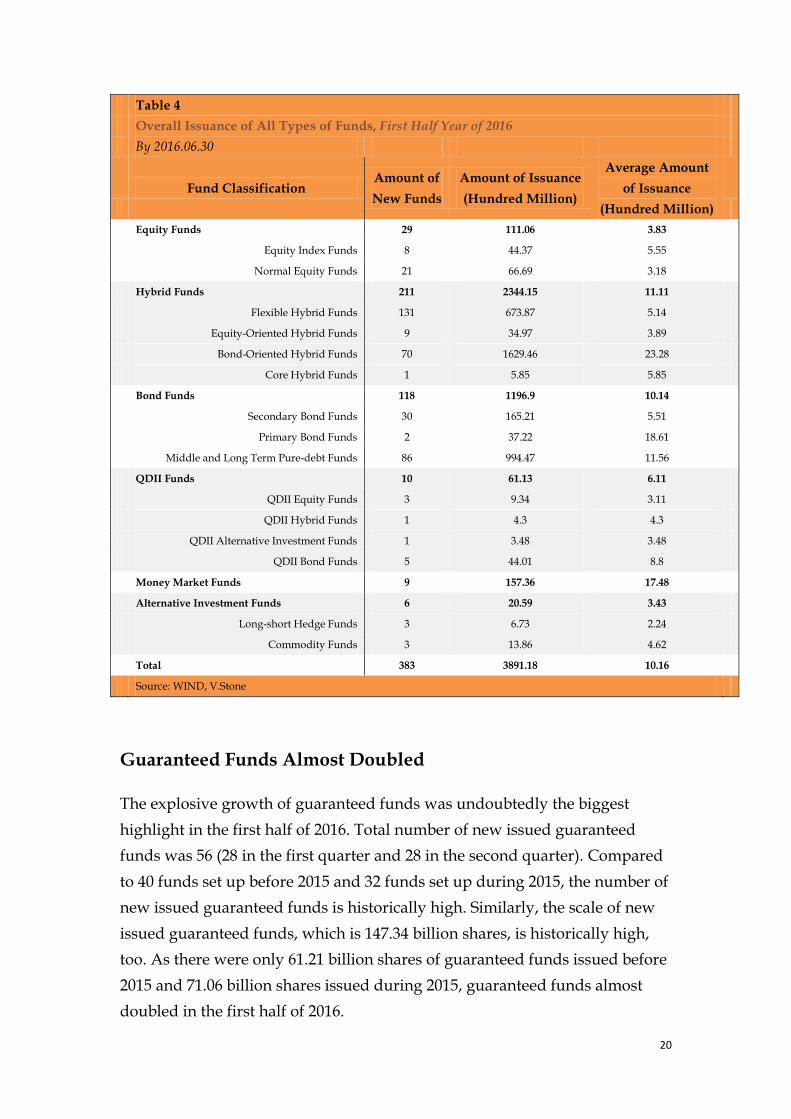
Table 4
Overall Issuance of All Types of Funds, First Half Year of 2016
By 2016.06.30
Fund Classification Amount of
New Funds
Amount of Issuance
(Hundred Million)
Average Amount
of Issuance
(Hundred Million)
Equity Funds 29 111.06 3.83
Equity Index Funds 8 44.37 5.55
Normal Equity Funds 21 66.69 3.18
Hybrid Funds 211 2344.15 11.11
Flexible Hybrid Funds 131 673.87 5.14
Equity-Oriented Hybrid Funds 9 34.97 3.89
Bond-Oriented Hybrid Funds 70 1629.46 23.28
Core Hybrid Funds 1 5.85 5.85
Bond Funds 118 1196.9 10.14
Secondary Bond Funds 30 165.21 5.51
Primary Bond Funds 2 37.22 18.61
Middle and Long Term Pure-debt Funds 86 994.47 11.56
QDII Funds 10 61.13 6.11
QDII Equity Funds 3 9.34 3.11
QDII Hybrid Funds 1 4.3 4.3
QDII Alternative Investment Funds 1 3.48 3.48
QDII Bond Funds 5 44.01 8.8
Money Market Funds 9 157.36 17.48
Alternative Investment Funds 6 20.59 3.43
Long-short Hedge Funds 3 6.73 2.24
Commodity Funds 3 13.86 4.62
Total 383 3891.18 10.16
Source: WIND, V.Stone
Guaranteed Funds Almost Doubled
The explosive growth of guaranteed funds was undoubtedly the biggest
highlight in the first half of 2016. Total number of new issued guaranteed
funds was 56 (28 in the first quarter and 28 in the second quarter). Compared
to 40 funds set up before 2015 and 32 funds set up during 2015, the number of
new issued guaranteed funds is historically high. Similarly, the scale of new
issued guaranteed funds, which is 147.34 billion shares, is historically high,
too. As there were only 61.21 billion shares of guaranteed funds issued before
2015 and 71.06 billion shares issued during 2015, guaranteed funds almost
doubled in the first half of 2016.
21
Among the 56 new issued guaranteed fund products, 15 of them are more
than 4 billion shares. The biggest one is GuangFa WenYu Guaranteed Fund
(002622.OF), with 4.995 billion shares. The second biggest one is CCB
Principal AnXin No.7 Guaranteed Fund (002585.OF), with 4.986 billion shares,
followed by Lion HeXin Guaranteed Fund (002560.OF) with 4.981 billion
shares.
33 Fund management companies participated in issuance of guaranteed funds.
CCB Principal Asset Management and Great Wall Fund Management tied for
the first place, both of which issued four. Bosera Asset Management, GuangFa
Fund Management, HuaAn Fund Management, Lion Fund Management and
PingAn-UOB Fund Management issued three guaranteed funds each.
Companies above shows positive attitude towards guaranteed funds. In
terms of shares issued, products from Bank of China Investment Management,
CCB Principal Asset Management and China Universal Asset Management
are the most popular ones to investors. BOC Investment Management set up 1
guaranteed fund with 4.954 billion shares. CCB Principal Asset Management
had 4 new products with 4.798 billion shares on average. And China
Universal Asset Management newly set up 2 products with 4.710 billion
shares on average.
Fund Performance
Equity Funds
Average return of equity funds in the first half of 2016 (excluding funds set
up in 2016) was -13.82%. Specifically, average return of normal equity funds
was -11.90% with 7% products achieving positive returns, while average
return of equity index funds was -14.49% with only 3% achieving positive
returns.
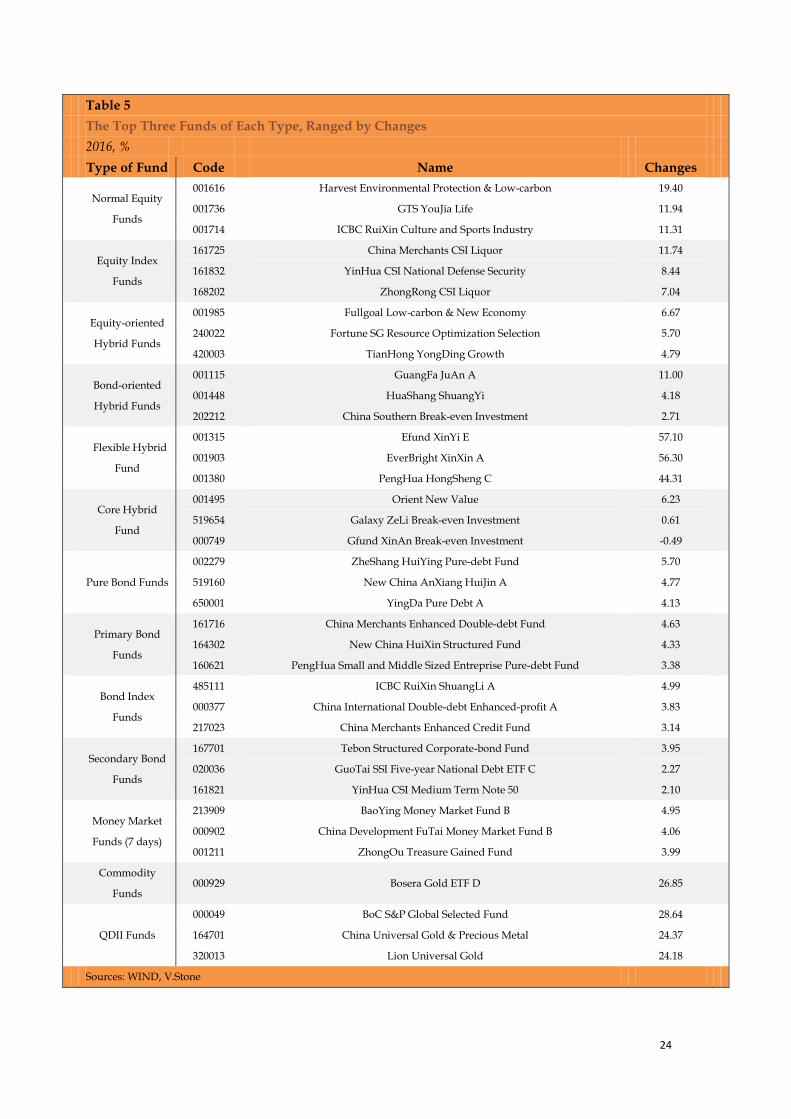
The champion of normal equity funds is Harvest Environmental Protection
and Low Carbon (001616.OF) with a return of 19.40%. As it was set up at the
end of 2015 and built its position during the Circuit-Breaker Mechanism
period, it was able to avoid the rapid decline and achieved excess return. The
champion of equity index funds is China Merchants CSI Chinese Liquor

22
(161725.OF) with a return of 11.74%. Generally speaking, Chinese liquor
theme funds outperformed other themes in the first half of 2016.
Hybrid Funds
Average return of hybrid funds in the first half of 2016 was -7.31%.
Specifically, average return of equity-oriented hybrid funds was -13.49%;
Bond-oriented hybrid funds had an average return of -0.59%; Flexible hybrid
funds gained an average return of -4.55%; And average return of core hybrid
funds was -9.30%.
3% of equity-oriented hybrid funds achieved positive returns, among which
the winner was Fullgoal Low Carbon New Economy (001985.OF). The reason
why it could reach a return of 6.67% was that it was set up at the end of 2015
and building its position during the Fusing Policy period. 61% of
bond-oriented hybrid funds earned positive returns, the highest of which was
11.00% by GuangFa JuAn A (001115.OF). Manager of GuangFa JuAn A
lowered its stock position to less than 4%, thus avoiding the sharp decline in
January 2016. 47% of flexible hybrid funds gained positive returns, and the
champion went to E Fund XinYi E with a return of 57.10%. The surprising
return was contributed by large amount of redemption. Only 2 of 21 core
hybrid funds had positive returns. Orient New Value (001495.OF) took the
first place due to its extraordinary performance when the market rebounded.
Bond Funds
Average return of bond funds in the first half of 2016 was 0.09%. Specifically,
average return of pure bond funds was 1.31%; Primary bond funds (allowed
to invest in convertible bonds) had an average return of 0.85%; Secondary
bond funds (allowed to invest in stocks) gained an average return of -2.11%;
And average return of bond index funds was -0.52%.
95% of pure bond funds achieved positive returns, among which the winner
was ZheShang HuiYing Pure Fund (002279.OF). 90% of primary bond funds
earned positive returns, the highest of which was 4.63% by China Merchants
ShuangZhai Enhanced (161716.OF). Manager of this fund took high position
in corporate bonds and convertible bonds. 38% of secondary bond funds
gained positive returns, and the champion went to ICBC Credit Suisse Double

23
Profit A (485111.OF) with a return of 4.99%. 85% of bond index funds had
positive returns. Tebon Corporate Bond Structured (167701.OF) took the first
place with a return of 3.95%.
Commodity Funds and Hedge Funds
Average return of commodity funds in the first half of 2016 was 24.76%.
Bosera Gold ETF D (000929.OF) was the winner with a return of 26.85%.
Unexpected accidents such as Brexit lowered down investors’ preference to
risk assets, thus supported the rising of gold prices. Average return of hedge
funds in the first half of 2016 was -1.34%, and the champion went to Fortune
SG Quantitative Hedge Fund A (000753.OF) with a return of 1.80%.
Money Market Funds
Generally speaking, 7-day annualized return for money market funds went
down compared to that at the beginning of 2016. As of June 30th, average
7-day annualized return of money market funds was 2.55%. The champion
was BaoYing Money B (213909.OF) with a return of 4.95%, while the
runner-up went to CDBS Cathay Money B (000902.OF) with a return of 4.06%.
QDII Funds
Average return of QDII funds in the first half of 2016 was 0.21%. Specifically,
gold and precious metals as well as oil and gas resources theme QDII
performed best, while Asia- or Hong Kong- related theme QDII performed
worst. Bank of China Investment S&P Worldwide Selected (000049.OF) was
the winner with a return of 28.64%, as it heavily invested in resources and
raw materials.
24
Table 5
The Top Three Funds of Each Type, Ranged by Changes
2016, %
Type of Fund Code Name Changes
Normal Equity
Funds
001616 Harvest Environmental Protection & Low-carbon 19.40
001736 GTS YouJia Life 11.94
001714 ICBC RuiXin Culture and Sports Industry 11.31
Equity Index
Funds
161725 China Merchants CSI Liquor 11.74
161832 YinHua CSI National Defense Security 8.44
168202 ZhongRong CSI Liquor 7.04
Equity-oriented
Hybrid Funds
001985 Fullgoal Low-carbon & New Economy 6.67
240022 Fortune SG Resource Optimization Selection 5.70
420003 TianHong YongDing Growth 4.79
Bond-oriented
Hybrid Funds
001115 GuangFa JuAn A 11.00
001448 HuaShang ShuangYi 4.18
202212 China Southern Break-even Investment 2.71
Flexible Hybrid
Fund
001315 Efund XinYi E 57.10
001903 EverBright XinXin A 56.30
001380 PengHua HongSheng C 44.31
Core Hybrid
Fund
001495 Orient New Value 6.23
519654 Galaxy ZeLi Break-even Investment 0.61
000749 Gfund XinAn Break-even Investment -0.49
Pure Bond Funds
002279 ZheShang HuiYing Pure-debt Fund 5.70
519160 New China AnXiang HuiJin A 4.77
650001 YingDa Pure Debt A 4.13
Primary Bond
Funds
161716 China Merchants Enhanced Double-debt Fund 4.63
164302 New China HuiXin Structured Fund 4.33
160621 PengHua Small and Middle Sized Entreprise Pure-debt Fund 3.38
Bond Index
Funds
485111 ICBC RuiXin ShuangLi A 4.99
000377 China International Double-debt Enhanced-profit A 3.83
217023 China Merchants Enhanced Credit Fund 3.14
Secondary Bond
Funds
167701 Tebon Structured Corporate-bond Fund 3.95
020036 GuoTai SSI Five-year National Debt ETF C 2.27
161821 YinHua CSI Medium Term Note 50 2.10
Money Market
Funds (7 days)
213909 BaoYing Money Market Fund B 4.95
000902 China Development FuTai Money Market Fund B 4.06
001211 ZhongOu Treasure Gained Fund 3.99
Commodity
Funds 000929 Bosera Gold ETF D 26.85
QDII Funds
000049 BoC S&P Global Selected Fund 28.64
164701 China Universal Gold & Precious Metal 24.37
320013 Lion Universal Gold 24.18
Sources: WIND, V.Stone
25
New Policies and Trends
FOF On the Stage
China Securities Regulatory Commission (CSRC) issued a draft on public
offering FOF which officially broke the ice and brought FOF on the stage.
On June 17th, CSRC issued ‘Public Offering of Securities Investment Fund
Operational Guidelines No. 2 – Fund of Funds Guidelines (Draft)’ (hereinafter
referred as the ‘Draft’), which means public offering FOF, the long-awaited
product, will be published officially in the near future.
Some rules are worth noting in the Draft. Firstly, the Draft clarifies the
definition of FOF. FOF refers to a fund that invests more than 80% of its assets
in sub-funds that are approved or registered by CSRC. Secondly, the Draft
sets restrictions on underlying fund investment. Market value of a single
underlying fund cannot be higher than 20% of the net value of FOF; FOF
cannot hold other FOF products; FOF cannot hold complex or derivative fund
shares such as structured funds. Thirdly, the Draft mentions double charging
problems. FOF managers cannot charge on underlying funds that are
managed by them; FOF custodians cannot charge on underlying funds that
are hosted by them. Further details are pending and may be different from
the Draft.
With public offering FOF on the stage, fund management companies begin to
actively adjust their product layout structures to meet investors’ needs. Public
offering FOF has diversified management modes and product categories
listed as follows:

26
Table 6
Prospective types of FOF in Public Offering Funds
Classification Criterion Types of Products
Fund Manager
& Investment Scope
Internal FOF Managers + Internal Funds
Internal FOF Managers + Funds in the Whole Market
External FOF Investment Advisors + Internal Funds
External FOF Investment Advisors + Funds in the Whole Market
Type of Investment Fund
FOF Investment in Open-ended Funds
FOF Investment in Exchange Traded Funds
Strategy of Investment
FOF investment in Well-selected Funds
FOF Investment in Allocation of Largest Category Assets
Sources: V.Stone, Wind
First Foundation of Foreign Controlled Fund Management
Company
Approval of foundation of fund management company slowed down.
According to Fund Management Company Directory disclosed by CSRC on
June 30th, there are a total of 114 fund management companies. The total
amount was only increased by four new fund management companies
compared with last year, indicating that the approval of the public offering
license has slowed down.
First foreign controlled fund management company was founded. China's
first foreign controlled fund management company, Hang Seng Funds was
approved by CSRC. Hang Seng Funds was registered in Shenzhen with the
registered capital of 200 million yuan. Hang Seng Bank accounted for 70% of
the shares, while ShenZhen Qianhai Financial Company accounted for 30%.
Many companies are pending to be public offering fund management
companies. According to documents by CSRC on June 17th, there are
currently 29 companies waiting for approval. The list includes private
placement fund management companies such as ChongYang Investment and
Shanghai V.Stone Capital, third-party sales companies such as Fund
EastMoney, insurance related companies such as CPIC, futures related
companies such as Nanhua Futures, and security firm related companies such
as HuaTai Securities and XiangCai Securities.

27
Third-party Sales License Tightened up
Third-party sale license approval was tightened up. CSRC began to approve
license for third-party fund sales since 2012 to boom the development of
mutual fund industry. However, third-party sales license approval has been
tightened up since 2016, as CSRC drafted new fund sales standards
documents and set up new threshold. Under such a background, third-party
fund sale license is worthy more than 15 million yuan in the market.
LU.com surpassed Fund.Eeatmoney.com to take the leading position in
third-party fund sale field. Fund.Eastmoney.com was the biggest third-party
sale institution at year-end 2015, when other four security firms ranked
second to fifth. Huge changes happened in the third-party fund sale field this
year. LU.com surpassed Fund.Eeatmoney.com to take the leading position,
followed by How Buy and TongHuaShun. Only one security firm, China
Securities, was ranked in the top 5. We can see that third-party fund sale may
take more and more market share and get through fierce competition in the
future.

28
Chapter Three
Wealth Management Industry Dynamics
Wealth Management Industry Scale
China's wealth management industry showed steady growth in scale, among
which insurance developed most rapidly and private placement funds
followed. Thus, the proportion of insurance increased while the rest
decreased.
Comparison among Diversified Financial Products
The overall size of private placement funds rose at a steady speed, with
equity investment transcending security investment. Insurance industry
steadily approached forward, where the proportion of stock and fund
investment increased gradually. Although there was a downward return in
the scale of bank financing products, they still dominated the capital industry.
Trust industry, with a declining growth rate, gradually exceeded 16 trillion
yuan. The scale of collective asset management plans broke 1 trillion yuan.
Among all collective asset management plans, bond products accounted for
nearly 50%. In addition, with high default risk, the number of new founded
platforms declined slightly.

29
Wealth Management Industry Scale
China's wealth management industry showed steady growth in scale.
Insurance developed most rapidly, followed by private placement funds.
According to the latest data, insurance increased from 12.4 trillion yuan to 14
trillion yuan, private placement funds increased from 4.2 trillion yuan to 4.6
trillion yuan, and trust increased from 16.3 trillion yuan to 16.6 trillion yuan.
Affected by bear market, scale of public offering funds decreased slightly.
Proportion of insurance increased, while the rest decreased. As shown
below, (inner ring on behalf of the proportion of 2014 and outer ring on behalf
of that of the third quarter of 2015), only proportion of insurance rose from
19.10% to 20.98%. Although scale of private placement funds and trust
increased, proportion of the two decreased with private placement funds
rising from 6.42% to 6.39% and trust rising from 25.19% to 24.89%.
Figure 9 Figure 10
Changes in Sizes of All Financial Sectors Proportions of the Size of Each Sector
2015-2016, trillion yuan 2014 Q4(inner ring) & 2015Q3 (outer ring), %
Sources: WIND, CHOICE, V.Stone Sources: WIND, CHOICE, V.Stone
0
0.5
1
1.5
2
2.5
Public
OfferingFunds
Private
PlacementFunds
Bank
FinancingProducts
Trusts Insurance
Q4 in 2015 Current Sizes
12.98%
6.42%
36.31%
25.19%
19.10%
11.92%
6.93%
35.28% 24.89%
20.98%
Public Offering Funds
Private Placement
Funds
Bank Financing
Products
Trusts
Insurance

30
Comparison among Diversified Financial Products
Private Placement Funds: Equity Investment Transcending
Security Investment
Overall size of private placement funds rose by 200% to more than 4 trillion
yuan. The overall scale of private placement funds, as of the first quarter of
2016, was 4.6 trillion yuan, growing more than 200% compared to 1.5 trillion
yuan at year-end 2014. The reason is that incentive system of private
placement funds is excellent, which motivates public offering fund managers
to create or join private placement funds, leading to the development of the
whole industry.
Equity investment transcended security investment, with both accounting for
80% of the whole private placement fund industry. As of the first quarter of
2016, the proportion of equity investment was the highest (42.06%), followed
by security investment (41.80%). Besides, the proportion of venture capital
funds accounted for 4.23%, and commodity investment funds accounted for
less than 0.1 ‰.
Figure 11 Figure 12
Changes in the Sizes of Private Placement
Funds
Size and Distribution of the Private Placement
Fund
2007-2015, billion yuan (right axis) 15Q3, %
Sources: CHOICE, V.Stone Sources: CHOICE, V.Stone
0
5,000
10,000
15,000
20,000
25,000
0
5,000
10,000
15,000
20,000
25,000
30,000
35,000
40,000
45,000
50,000
15Q2 15Q3 15Q4 16Q1
Amount of Funds (right axis) Size of Funds (left axis)
41.80%
42.06%
4.23%
0.00% 11.91%
Security Investment
Funds
Equity Investments
Funds
Venture Capital Funds
Commodity Investment
Funds
Others

31
Insurance: Increasing Stock Investment
Insurance industry steadily approached to 14 trillion yuan, with an annual
growth rate of about 20%. After ten years’ development, insurance industry
grew from 1.19 trillion yuan at year-end 2014 to 13.98 trillion yuan by the end
of May 2016. Annual growth rate was around 30% from 2004 to 2005, rising
rapidly to 47% at 2007 and remaining stable at 20% since 2008.
As for insurance assets, deposits accounted for the same proportion, while
the proportion of stock and fund investment increased gradually. Generally,
20%- 30% of insurance assets are for deposits. This proportion fell from 30%
in 2013 down to 20% at the end of 2015 and then to 18% in May 2016. There
are three main investment targets for insurance: bonds, stocks and funds. As
regulators ease the limitations of equity investment, proportion of stocks and
funds accounted for a gradually increasing part. As of May 2016, asset
invested in stocks and mutual funds was 1.94 trillion yuan, accounting for
16.05%.
Figure 13
Total Assets and Growth Rate in Insurance Industry
2015-2016, trillion yuan (left axis), % (right axis)
Sources: WIND, V.Stone
0
5
10
15
20
25
30
35
40
45
50
2
4
6
8
10
12
14
2004 2005 2006 2007 2008 2009 2010 2011 2012 2013 2014 2015 2016
Total Assets (left axis) Growth Rate (right axis)

32
Figure 14
The Proportion of Insurance Property Investments
2013-2016, % (left axis), trillion yuan (right axis)
Sources: WIND, V.Stone
Bank Financing Products: Downward Returns but Still
Dominating the Industry
Monthly issuance of new bank financing products maintained around 5000.
A total of 57,508 products were issued in 2014, and 71,167products were
issued in the first 11 months on 2015. As of May 2016, 30,548 bank financing
products were issued. Scale of bank financing products broke through 20
trillion yuan. Scale of bank financing products was 0.5 trillion yuan at the end
of year 2007. Then it grew from 1.7 trillion yuan at year-end 2009 to 10.21
trillion yuan at year-end 2013, and finally broke through 20 trillion yuan in
2015.
Expected rate of return declined gradually in recent three years. Average
expected rate of return for bank financing products peaked (9.87%) in 2007
when in the interest rate hiking cycle. With interest rate declining in the past
three years, yield for bank financing products fell, too, from 5.19% in 2014 to
4.35% in 2015, and reached 4.90% in May 2016. Non-Guaranteed products
had highest average expected rate of return. As of May 2016,
2
4
6
8
10
12
14
0%
10%
20%
30%
40%
50%
60%
70%
80%
90%
100%
Bank Deposits Bond Investments Stocks & Funds Others Total Assets (right axis)

33
non-Guaranteed products had expected rate of return of 4.2%, much higher
than that of guaranteed fixed income products (3.34%) and guaranteed
floating income products (3.45%).
Table 7
Average Expected Rate of Return for Bank Financing Products
Date
Average
Expected
Rate of Return
Guaranteed Fixed
Income Products
Guaranteed
Floating Income
Products
Non-Guaranteed
Products
2005/12/01 4.08 3.95 5.78 -
2006/12/01 4.35 3.59 4.71 5.97
2007/12/01 9.87 4.36 9.64 14.69
2008/12/01 3.29 2.67 2.52 4.39
2009/12/01 3.10 1.89 3.22 3.46
2010/12/01 3.26 2.82 3.18 3.59
2011/12/01 5.09 4.29 4.65 5.46
2012/12/01 4.45 3.30 4.17 4.77
2013/12/01 5.67 4.85 5.27 5.98
2014/12/01 5.19 4.32 4.64 5.52
2015/12/01 4.35 3.67 3.71 4.71
2016/05/01 3.90 3.34 3.45 4.20
Source: CHOICE, V.Stone
Figure 15 Figure 16
Fund Balances of Bank Financing Products Issuance of New Bank Financing Products
2007-2015, trillion yuan 2015-2016, thousand
Sources: WIND, V.Stone Sources: CHOICE, V.Stone
0
5
10
15
20
25
20
07/1
2
20
08/0
5
20
08/1
0
20
09/0
3
20
09/0
8
20
10/0
1
20
10/0
6
20
10/1
1
20
11/0
4
20
11/0
9
20
12/0
2
20
12/0
7
20
12/1
2
20
13/0
5
20
13/1
0
20
14/0
3
20
14/0
8
20
15/0
1
20
15/0
6
20
15/1
1
0
1
2
3
4
5
6
7
8
20
15/0
1
20
15/0
2
20
15/0
3
20
15/0
4
20
15/0
5
20
15/0
6
20
15/0
7
20
15/0
8
20
15/0
9
20
15/1
0
20
15/1
1
20
15/1
2
20
16/0
1
20
16/0
2
20
16/0
3
20
16/0
4
20
16/0
5

34
Trust: Declining Growth Rate
Trust industry exceeded 16 trillion yuan with a declining growth rate. The
size of the trust assets showed a steady growth overall and reached 15.62
trillion yuan as of the third quarter of 2015. Compared to the scale of year-end
2014 (13.98 trillion yuan), it climbed 12%. It is worth noting that the industry
scale declined for the first time during the third quarter of 2015 due to the
impact of asset shortage. In the fourth quarter of 2015, trust industry exceeded
16 trillion yuan for the first time, and reached 16.58 trillion yuan in the first
quarter of 2016. Although the scale of trust industry reached peak, the growth
rate declined.
Trust for financing, investment and transaction management showed a
situation of tripartite confrontation. Classified total trust assets by functions,
assets for financing, investment and transaction management were three
pillars with 1/3 each. Classified trust assets by investment directions, most
assets went to corporations (23.74%) and least went to real estate (8.71%).
Figure 17
Scale of Property Trust
2008-2016, trillion yuan
Sources: CHOICE, V.Stone
0
2
4
6
8
10
12
14
16
18
20
08/1
2
20
09/0
3
20
09/0
6
20
09/0
9
20
09/1
2
20
10/0
3
20
10/0
6
20
10/0
9
20
10/1
2
20
11/0
3
20
11/0
6
20
11/0
9
20
11/1
2
20
12/0
3
20
12/0
6
20
12/0
9
20
12/1
2
20
13/0
3
20
13/0
6
20
13/0
9
20
13/1
2
20
14/0
3
20
14/0
6
20
14/0
9
20
14/1
2
20
15/0
3
20
15/0
6
20
15/0
9
20
15/1
2
20
16/0
3

35
Figure 18 Figure 19
Property Trust Structure, by Business Functions Property Trust Structure, by Investment
Objectives
16Q1, % 16Q1, %
Sources: CHOICE, V.Stone Sources: CHOICE, V.Stone
Brokerage Asset Management: Collective Asset Management
Plans Exceeding One Trillion yuan
The scale of collective asset management plans broke 1 trillion yuan.
Brokerage asset management mainly has three categories: collective assets
management plans, special account asset management plans and designated
asset management plans. Special account asset management plans have a
small scale, while designated asset management plans have specific sales
channels. Collective asset management plans had a scale of 0.51 trillion yuan
at year-end 2014, but reached 1.5 trillion yuan at the end of 2015, indicating its
rapid growth.
Among all collective asset management plans, bond and money products
accounted for over 70%. As of June 24th 2016, bond products and money
products took 48.76% and 27.55%, respectively, followed by hybrid products
which accounted for 14%. Different from mutual funds, brokerage collective
asset management plans oriented at some specific investors rather than
general investors.
24.85%
33.23%
41.91%
Financing Trust
Investment Trust
Transaction
Management Trust
23.74%
18.02%
18.13%
18.49%
8.71% Industrial and
Commercial Enterprise
Basic Industry
Security Market
Financial Institution
Real Estate

36
Figure 20 Figure 21
The Historical Scale of Brokers’ Collective
Asset Management
The Scale and Distribution of Brokers’
Collective Asset Management
2009-2015, billion yuan 2016, %
Sources: WIND, V.Stone, HuaBao Securities Sources: WIND, V.Stone
P2P: High Default Risk
The number of new founded platforms declined slightly, with the number
of problematic platforms accounting for nearly 40%. P2P is a heated topic
recently due to accidents like ‘E Zu Bao’. As of June 2016, problematic
platforms were more than 1600, reaching an unbelievably high percentage
(41.27%). 383 platforms suffered cash difficulties and ran away, which raised
the safety concerns about P2P. With the emergence of the problems, the
number of new platforms per month also declined accordingly, dropping
from 171 in November 2015 to 51 in May 2016. Investors must be careful to
choose trust worthy platforms.
0
200
400
600
800
1000
1200
1400
1600
1800
2009 2010 2011 2012 2013 2014 2015
2.84%
13.73%
48.76%
27.55%
0.94% 0.13%
Stock Products
Hybrid Products
Bond Products
Money Products
Others
QDII

37
Figure 22 Figure 23
The Amount of Total Platforms and
Cumulative Problematic Platforms The Amount of Monthly New Added Platforms
2015-2016 2015-2016
Sources: iFinD, V.Stone, WIND Sources: iFinD, V.Stone, WIND
0
500
1,000
1,500
2,000
2,500
3,000
3,500
4,000
20
15/0
1/0
1
20
15/0
2/0
1
20
15/0
3/0
1
20
15/0
4/0
1
20
15/0
5/0
1
20
15/0
6/0
1
20
15/0
7/0
1
20
15/0
8/0
1
20
15/0
9/0
1
20
15/1
0/0
1
20
15/1
1/0
1
20
15/1
2/0
1
20
16/0
1/0
1
20
16/0
2/0
1
20
16/0
3/0
1
20
16/0
4/0
1
20
16/0
5/0
1
Total Platforms Problematic Platforms (cumulants)
0
20
40
60
80
100
120
140
160
180
20
15/0
1/0
1
20
15/0
2/0
1
20
15/0
3/0
1
20
15/0
4/0
1
20
15/0
5/0
1
20
15/0
6/0
1
20
15/0
7/0
1
20
15/0
8/0
1
20
15/0
9/0
1
20
15/1
0/0
1
20
15/1
1/0
1
20
15/1
2/0
1
20
16/0
1/0
1
20
16/0
2/0
1
20
16/0
3/0
1
20
16/0
4/0
1
20
16/0
5/0
1
New Added Platforms

38
China’s Mutual Fund Industry
Interim Report 2016
A Review of Activities and Trends in China’s Wealth Management
and Mutual Fund Industry

39

40
China’s Mutual Fund Industry Interim Report 2016
A Review of Activities and Trends in China’s Wealth
Management and Mutual Fund Industry