china’s agricultural water scarcity and …€™s agricultural water scarcity and conservation...
TRANSCRIPT
China’s Agricultural Water Scarcity and Conservation Policies
Bryan LohmarEconomist,
Economic Research Service, USDA
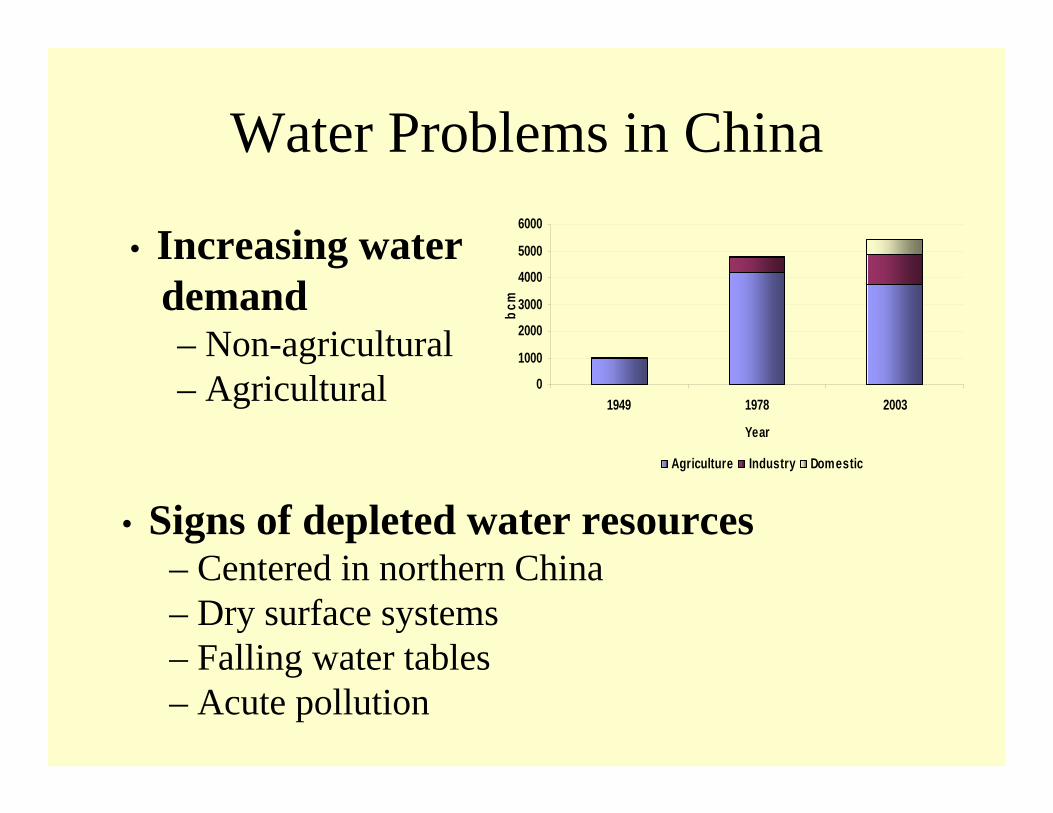
Water Problems in China
• Signs of depleted water resources– Centered in northern China– Dry surface systems– Falling water tables– Acute pollution
• Increasing waterdemand– Non-agricultural– Agricultural 0
1000
2000
3000
4000
5000
6000
1949 1978 2003
Year
bcm
Agriculture Industry Domestic

The Debate Over How China’s Water Problems May Affect Agriculture
The Bright Side
China has the capacity to adapt and adjust to the lower water supplies while maintaining or even increasing irrigated acreage
The Dark Side
China will be confronted with a severe water crisis that will significantly reduce irrigated acreage and agricultural production

Future Agricultural Production will Depend on New Policies and
Institutions• Past focus of policies and institutions was to
exploit water as a cheap resource to boost agricultural and industrial production
• Current changes emphasize more rational water allocation and water conservation

Today’s Presentation• Introduce water shortage problems in China
• Provide an overview of our findings:– Ground water issues– Surface water issues– Water pricing and conservation incentives
• Discuss implications for agricultural production, rural incomes, and trade
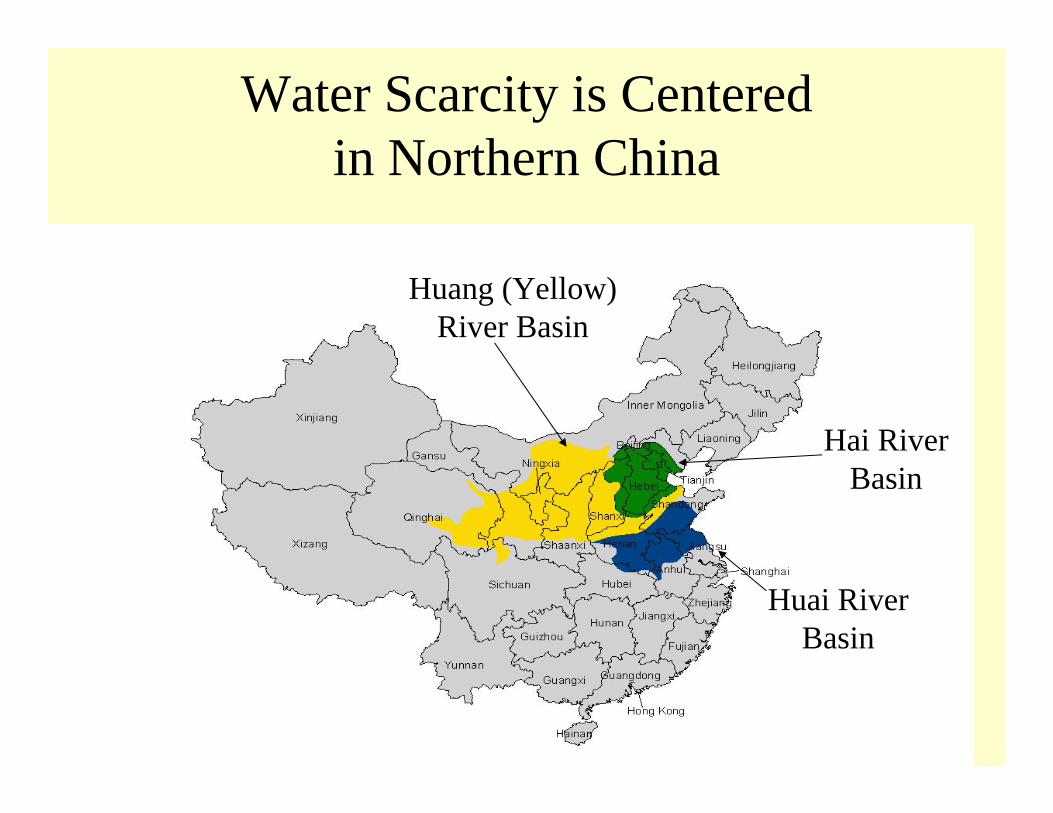
Water Scarcity is Centeredin Northern China
Hai RiverBasin
Huang (Yellow)River Basin
Huai RiverBasin
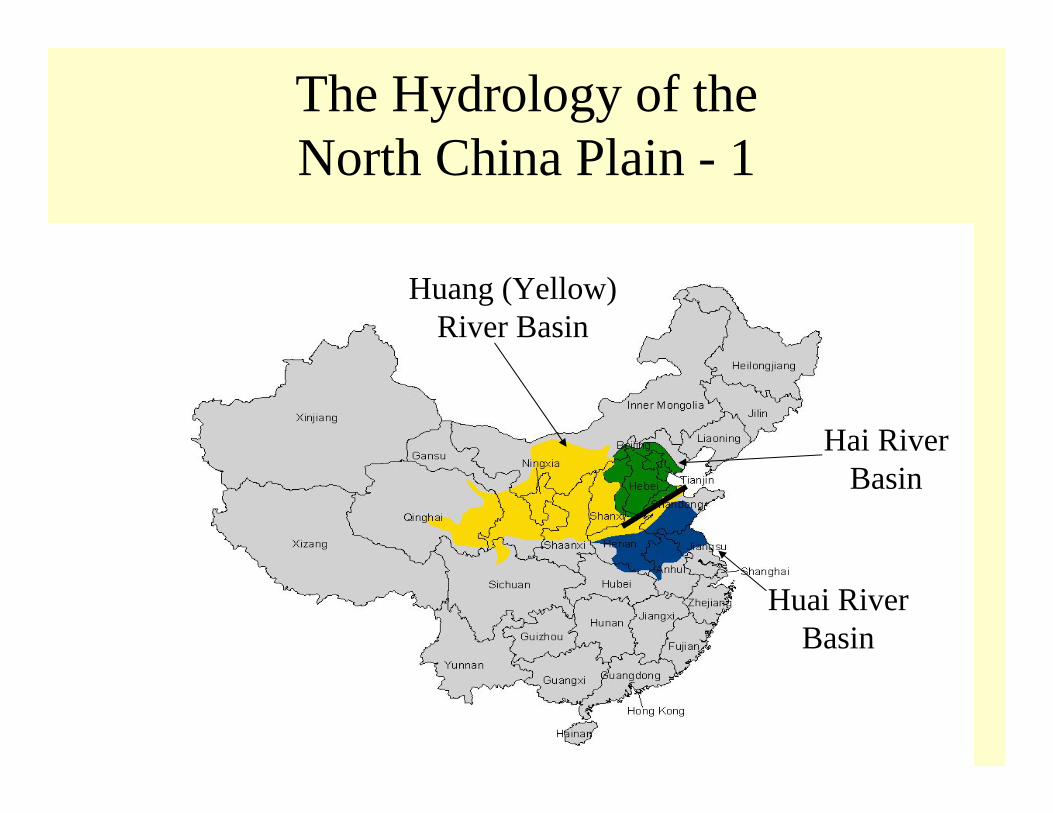
The Hydrology of theNorth China Plain - 1
Hai RiverBasin
Huang (Yellow)River Basin
Huai RiverBasin
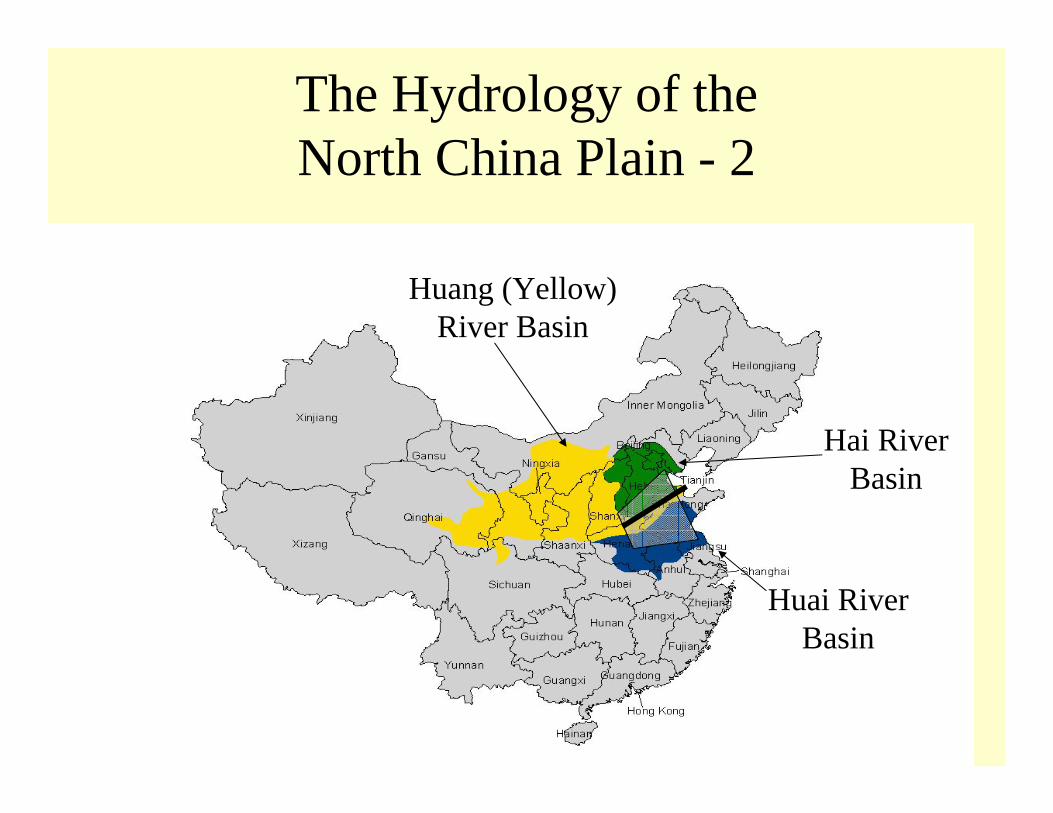
The Hydrology of theNorth China Plain - 2
Hai RiverBasin
Huang (Yellow)River Basin
Huai RiverBasin
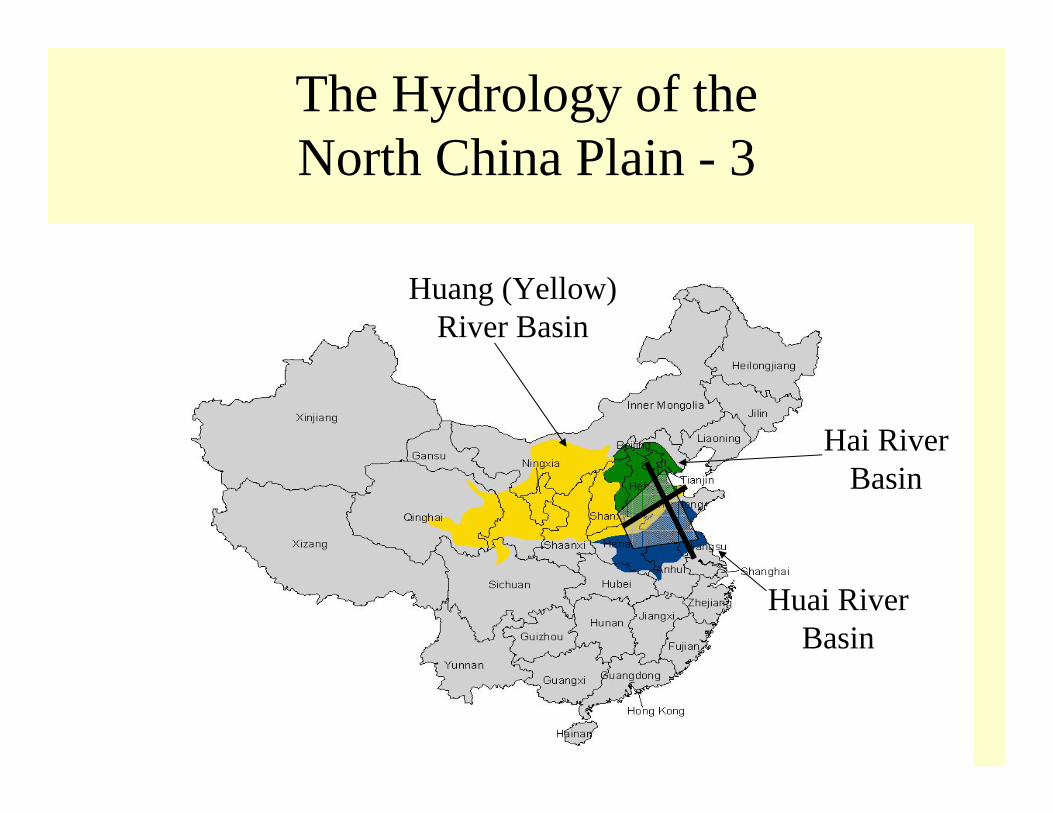
The Hydrology of theNorth China Plain - 3
Hai RiverBasin
Huang (Yellow)River Basin
Huai RiverBasin
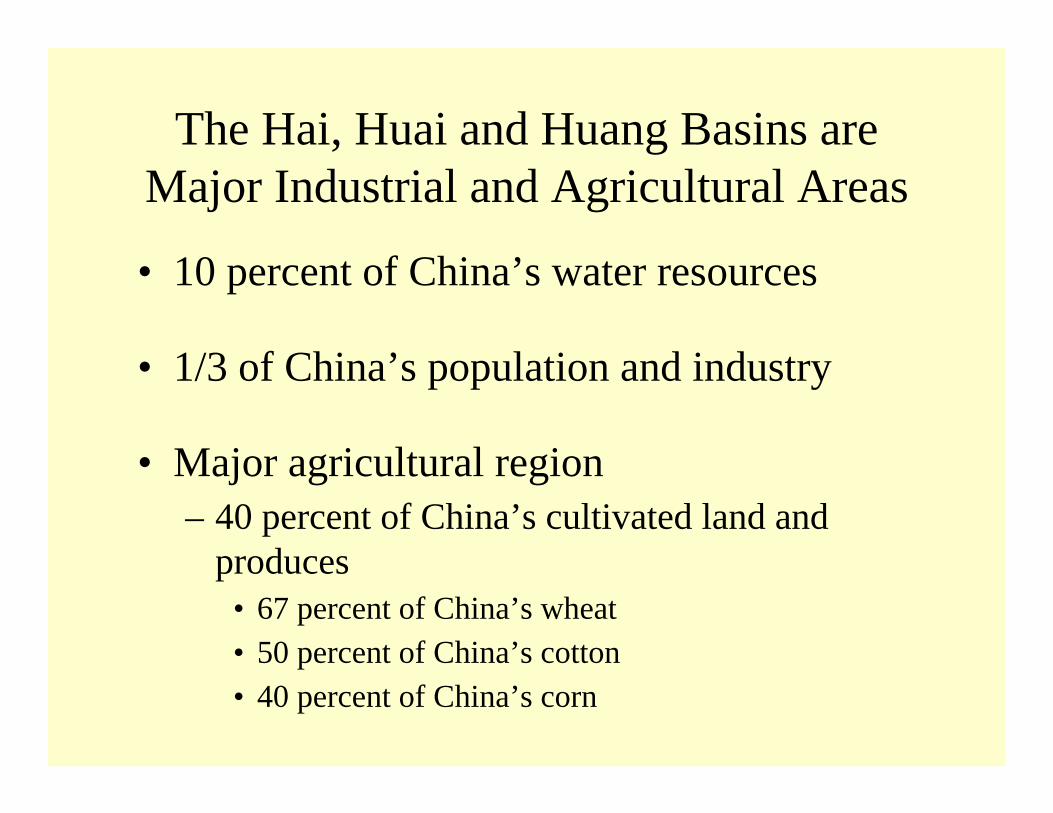
The Hai, Huai and Huang Basins are Major Industrial and Agricultural Areas
• 10 percent of China’s water resources
• 1/3 of China’s population and industry
• Major agricultural region– 40 percent of China’s cultivated land and
produces• 67 percent of China’s wheat• 50 percent of China’s cotton• 40 percent of China’s corn
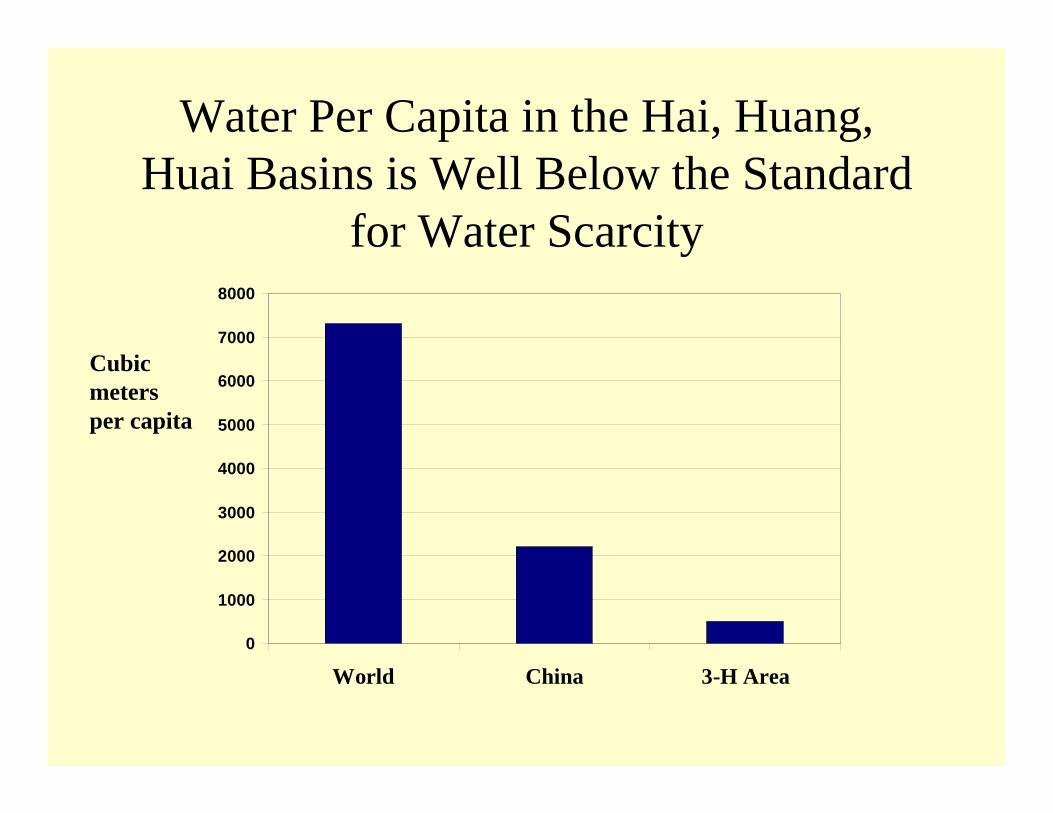
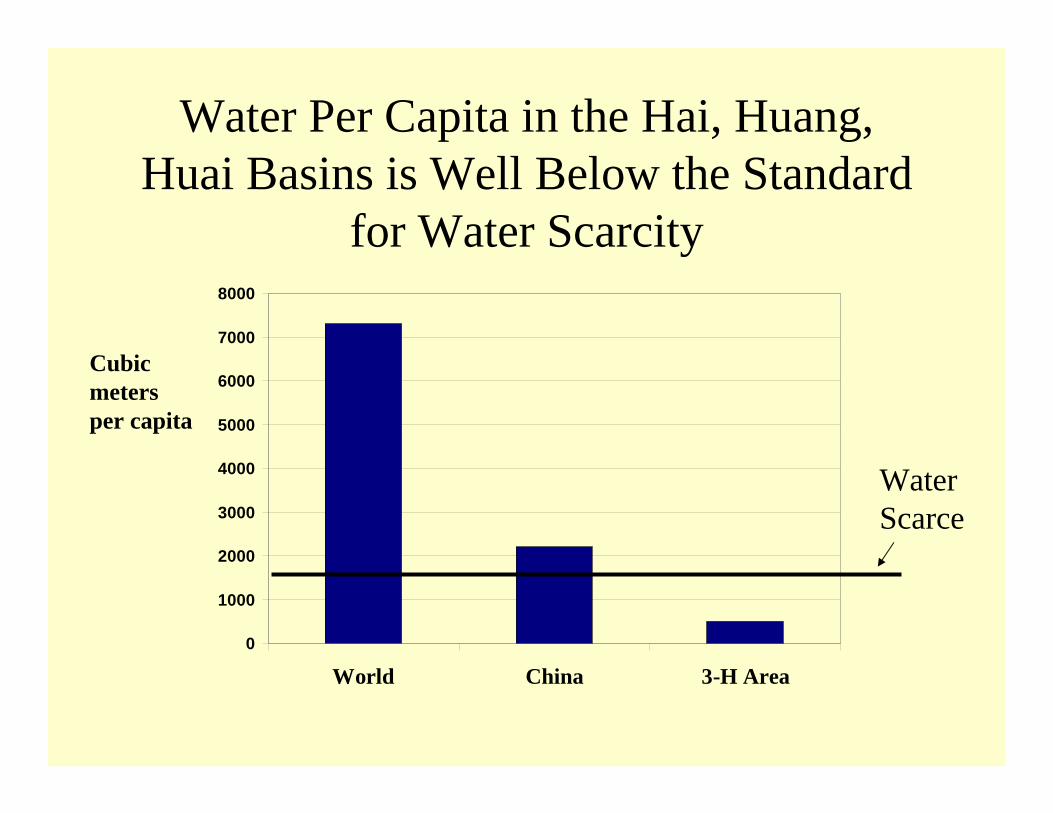
Water Per Capita in the Hai, Huang, Huai Basins is Well Below the Standard
for Water Scarcity
Cubicmetersper capita
0
1000
2000
3000
4000
5000
6000
7000
8000
World China 3-H Area
Water Per Capita in the Hai, Huang, Huai Basins is Well Below the Standard
for Water Scarcity
Cubicmetersper capita
0
1000
2000
3000
4000
5000
6000
7000
8000
World China 3-H Area
WaterScarce
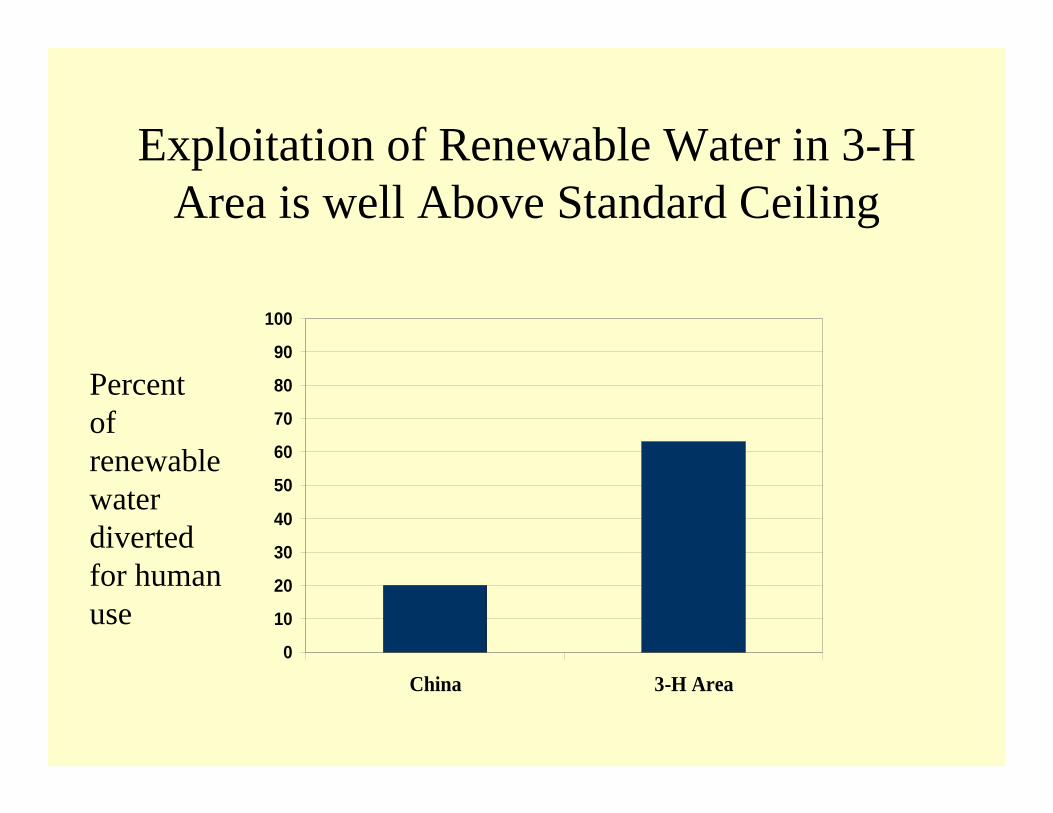
Exploitation of Renewable Water in 3-H Area is well Above Standard Ceiling
Percentof renewable water divertedfor humanuse
0
10
20
30
40
50
60
70
80
90
100
China 3-H Area

Exploitation of Renewable Water in 3-H Area is well Above Standard Ceiling
Percentof renewable water divertedfor humanuse
0
10
20
30
40
50
60
70
80
90
100
China 3-H Area
OverConsumption
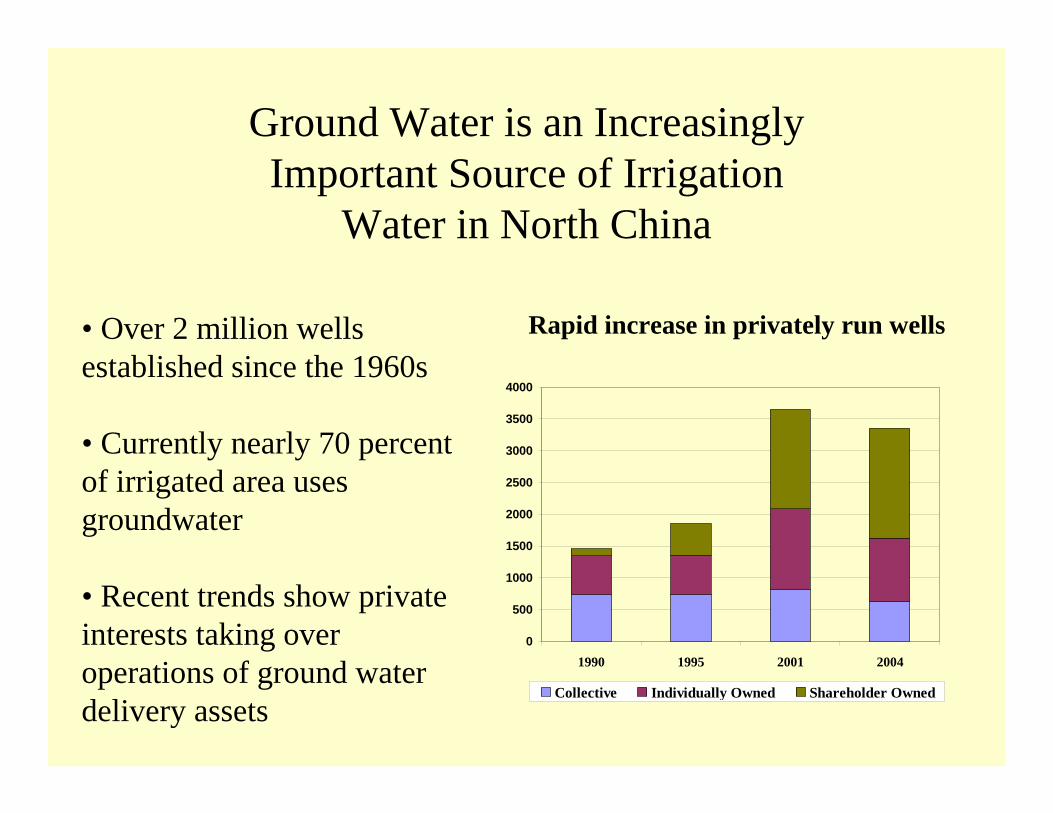
Ground Water is an IncreasinglyImportant Source of Irrigation
Water in North China
0
500
1000
1500
2000
2500
3000
3500
4000
1990 1995 2001 2004
Collective Individually Owned Shareholder Owned
Rapid increase in privately run wells• Over 2 million wells established since the 1960s
• Currently nearly 70 percent of irrigated area uses groundwater
• Recent trends show private interests taking over operations of ground water delivery assets

Regulations Are Not Commonly Enforced
• Wells drilled by permit only....Less than 5% of villages
• Regulation on pump spacing…Less than 7% of villages
• Control volume of pumping……..2 out of 400 villages
• Control price of water……….Less than 10% of villages
Source: Survey Results from 400 Villages in North China
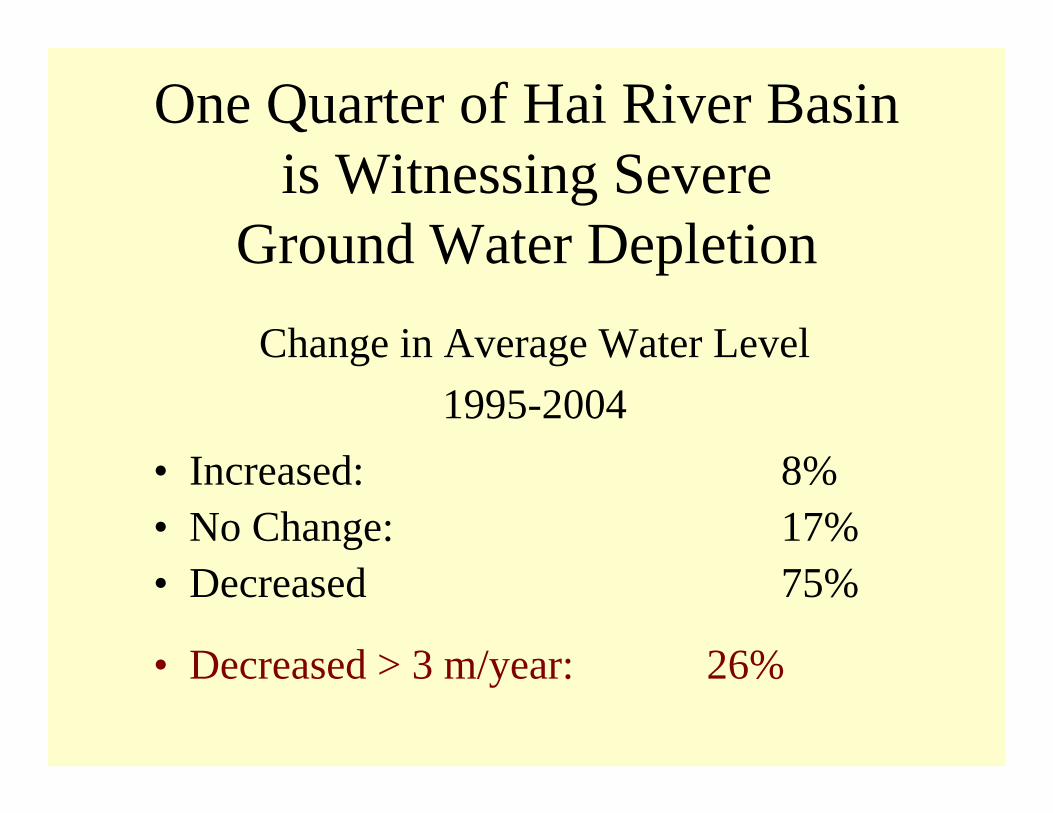
One Quarter of Hai River Basin is Witnessing Severe
Ground Water DepletionChange in Average Water Level
1995-2004• Increased: 8%• No Change: 17%• Decreased 75%
• Decreased > 3 m/year: 26%
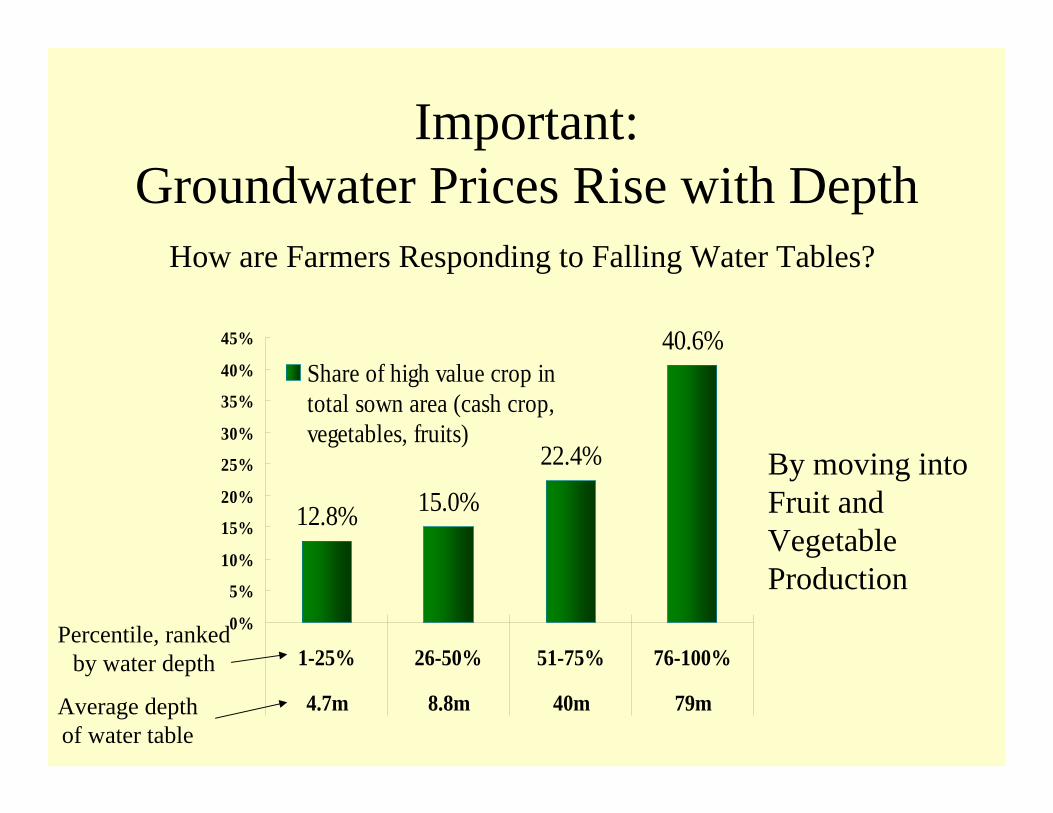
12.8% 15.0%
22.4%
40.6%
0%
5%
10%
15%
20%
25%
30%
35%
40%
45%
1-25% 26-50% 51-75% 76-100%
4.7m 8.8m 40m 79m
Share of high value crop intotal sown area (cash crop,vegetables, fruits)
Important:Groundwater Prices Rise with Depth
Percentile, rankedby water depth
Average depthof water table
By moving intoFruit andVegetable Production
How are Farmers Responding to Falling Water Tables?

Ground water: Summary
• Ground water tables falling rapidly in many parts of Hai River Basin
• Current policies to manage ground water withdrawals are not enforced at the local level
• Expansion of wells mostly from private owners and operators
• Farmers are responding to deeper water tables– Water tables are still well above their depth
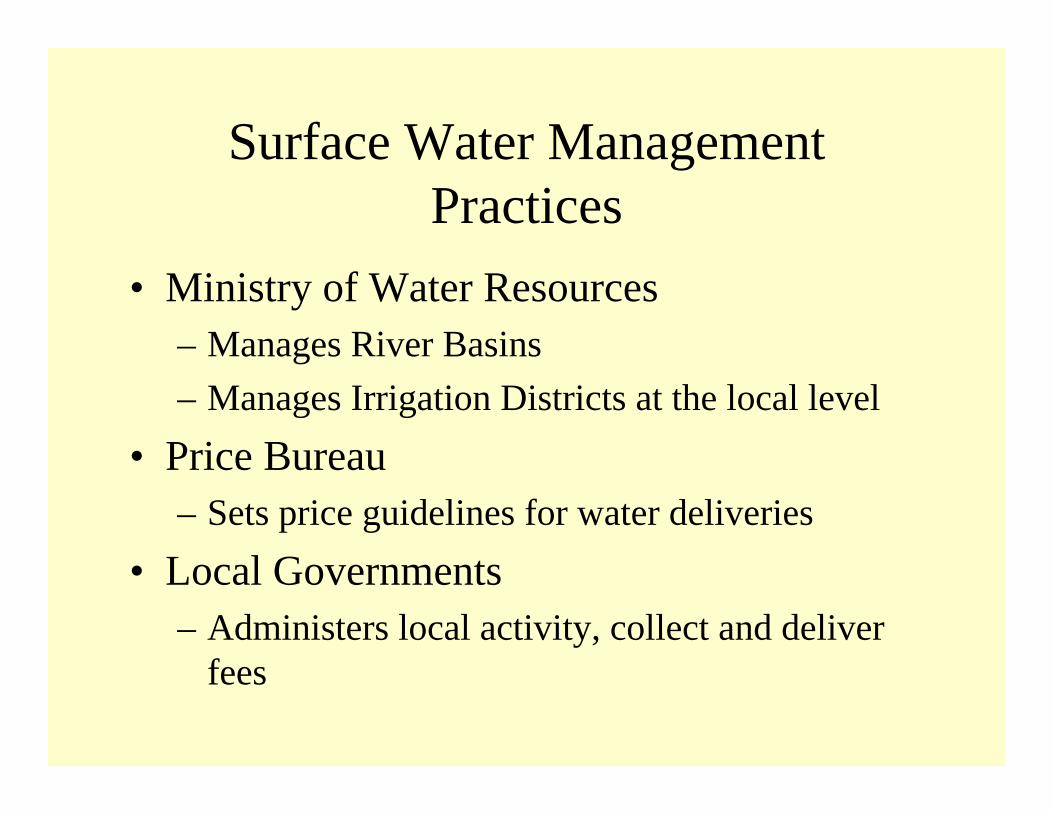
Surface Water Management Practices
• Ministry of Water Resources– Manages River Basins– Manages Irrigation Districts at the local level
• Price Bureau– Sets price guidelines for water deliveries
• Local Governments– Administers local activity, collect and deliver
fees

Surface Water Management Reform
• River Basin Management Policies– Potentially large gains from alternative
allocations along the Yellow River Basin– Confounded by provincial interests
• Irrigation District Management Policies– Seeks to resolve cost recovery and promote
water conservation
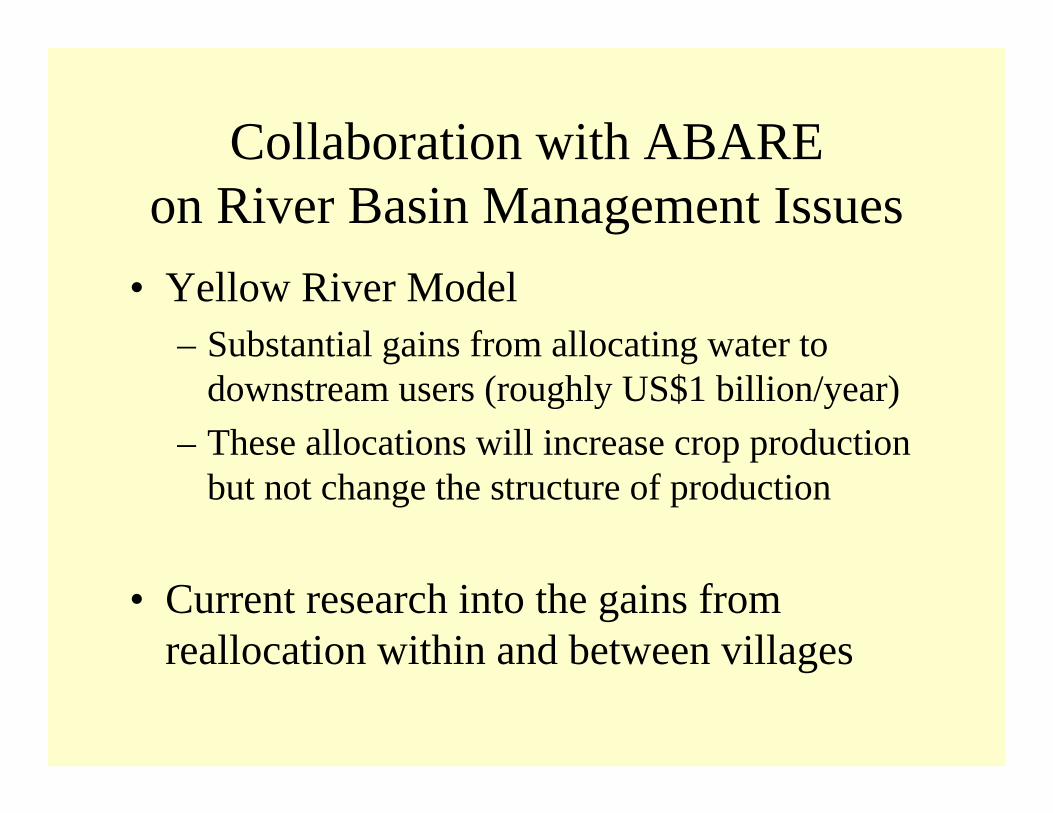
Collaboration with ABARE on River Basin Management Issues
• Yellow River Model– Substantial gains from allocating water to
downstream users (roughly US$1 billion/year)– These allocations will increase crop production
but not change the structure of production
• Current research into the gains from reallocation within and between villages
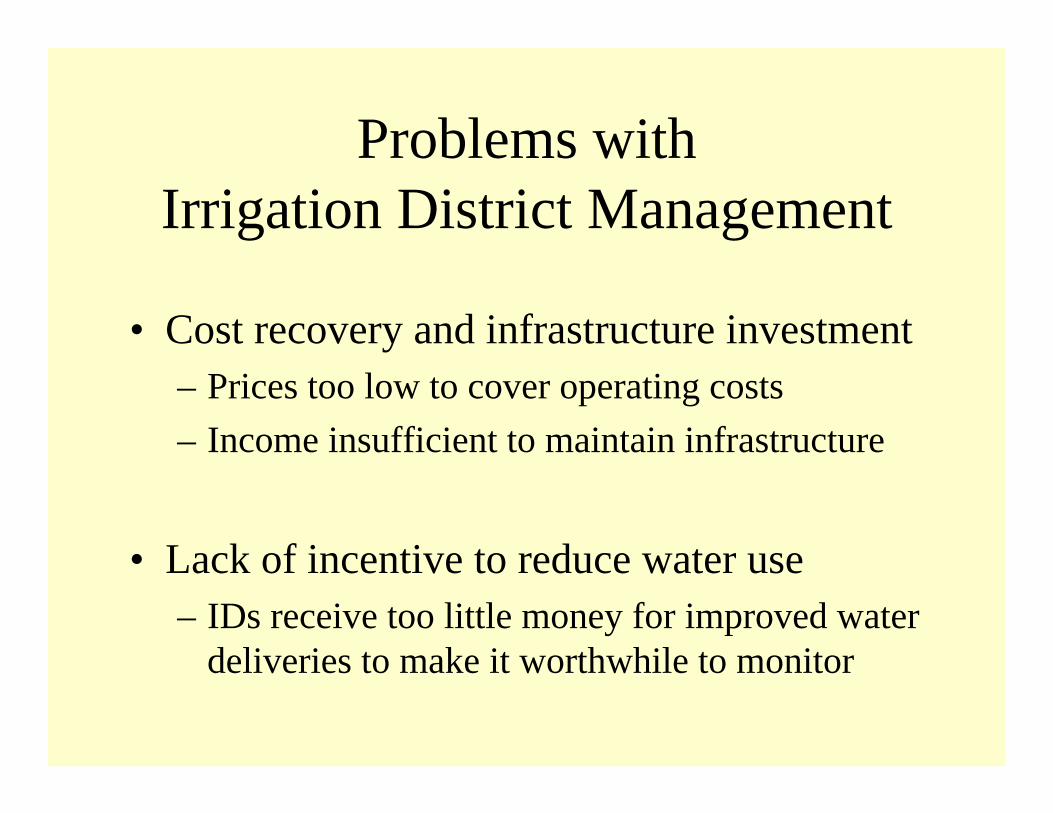
Problems withIrrigation District Management
• Cost recovery and infrastructure investment– Prices too low to cover operating costs – Income insufficient to maintain infrastructure
• Lack of incentive to reduce water use– IDs receive too little money for improved water
deliveries to make it worthwhile to monitor
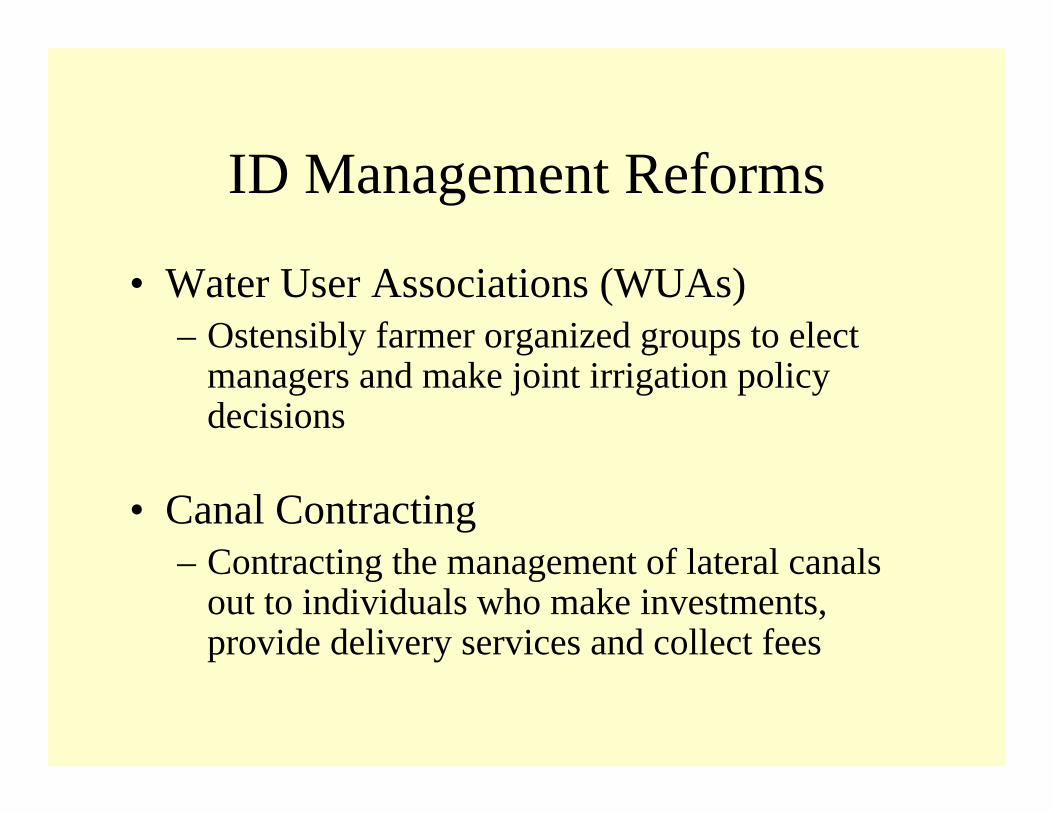
ID Management Reforms
• Water User Associations (WUAs)– Ostensibly farmer organized groups to elect
managers and make joint irrigation policy decisions
• Canal Contracting– Contracting the management of lateral canals
out to individuals who make investments, provide delivery services and collect fees
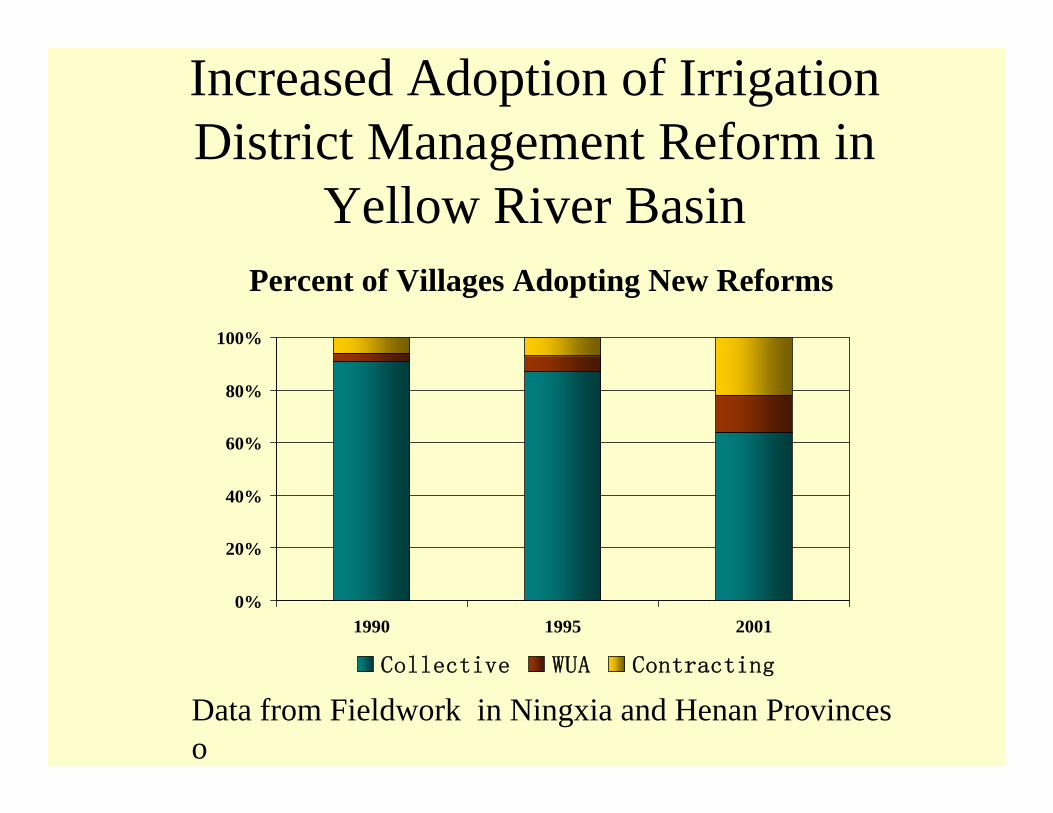
Increased Adoption of Irrigation District Management Reform in
Yellow River Basin
0%
20%
40%
60%
80%
100%
1990 1995 2001
Collective WUA Contracting
Percent of Villages Adopting New Reforms
Data from Fieldwork in Ningxia and Henan Provinceso
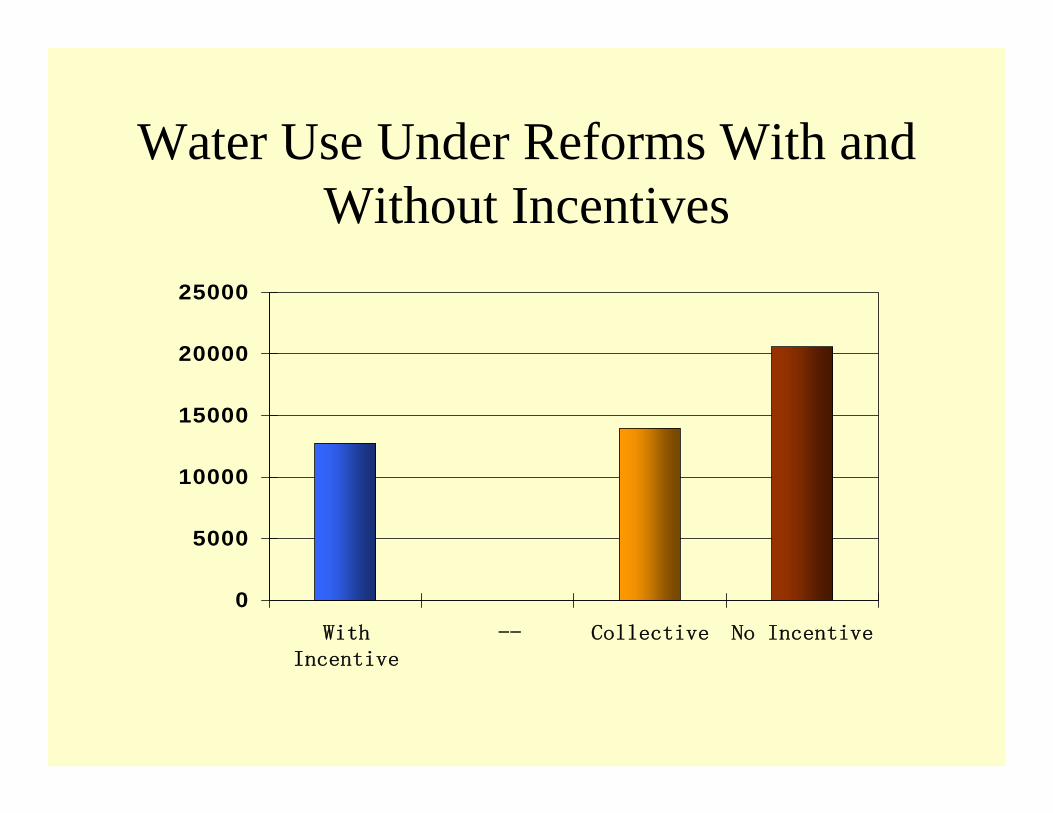
Water Use Under Reforms With and Without Incentives
0
5000
10000
15000
20000
25000
WithIncentive
-- Collective No Incentive
Summary of Findings on Irrigation District Management Reform
• When effective, ID management reform can– Reduce water applications significantly– Have little negative effect on crop production
or rural incomes
• Unclear how the reforms affect– Cost recovery– Longer term investments
Water-saving Irrigation Technologies
• Both the Ministry of Water Resources and the Ministry of Agriculture have been actively promoting water-saving irrigation technologies
• Incentives to adopt such technologies are not strong, but often they are profitable despite water savings
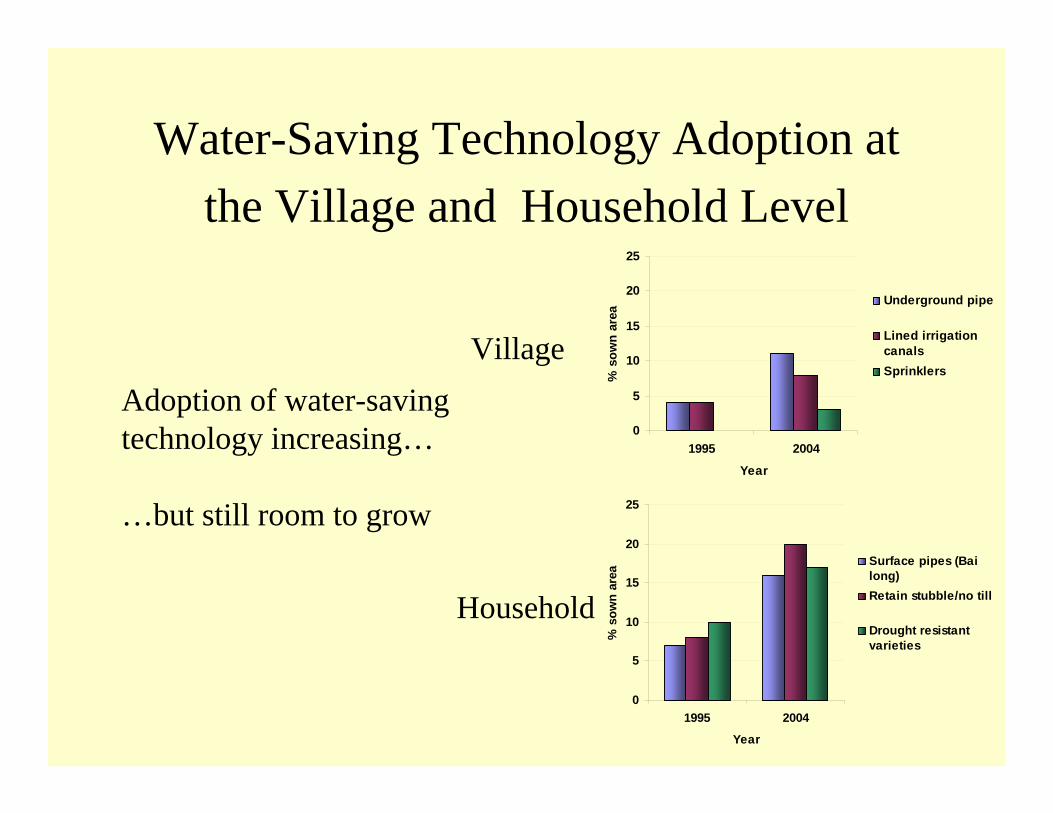
Water-Saving Technology Adoption at the Village and Household Level
0
5
10
15
20
25
1995 2004
Year
% s
own
area
Surface pipes (Bailong)Retain stubble/no till
Drought resistantvarieties
0
5
10
15
20
25
1995 2004
Year
% s
own
area
Underground pipe
Lined irrigationcanalsSprinklers
Village
Household
Adoption of water-savingtechnology increasing…
…but still room to grow
Determinants of Technology Adoption
• Econometric results indicate– Relationship to water price– Correlation with groundwater– Some technologies correlated with
extension activity• Plastic sheeting• Drought resistant varieties
Pricing and Delivery Practices Present Major Obstacles to
Promoting Water Conservation• Prices are too low
– 20-30 percent of VMP for ground water, less for surface water
• Prices are not always volumetric– Costly with so many small plots of land to
irrigate• Farmers do not control deliveries
– Do not decide when or how much
Caveats to Price Policies• Nearly all surface water is not priced
volumetrically
• Price must rise significantly to induce conservation
• Raising prices runs counter to other important policy goals:– Raising rural incomes– Grain self-sufficiency

Water Quality
• Interactions within agriculture:– Nitrogen fertilizers– Pesticides– Salinity– Soil erosion
• Industrial-agriculture interactions– In one survey, respondents reported that 95
percent of groundwater pollution was from industry

• More work with ABARE, MWR, CAS, UC Davis– USDA participation supported by FAS Emerging
Markets Office• ERS China Briefing Room
– www.ers.usda.gov/Briefing/China