china’s approach to capital flows since 1978
TRANSCRIPT

Working Paper SeriesCongressional Budget Office
Washington, DC
China’s Approach to Capital Flows Since 1978
Juann H. HungMacroeconomic Analysis Division
Congressional Budget OfficeEmail: [email protected]
April 20082008-02
Working papers in this series are preliminary and are circulated to stimulate discussion andcritical comment. These papers are not subject to CBO’s formal review and editing processes. Theanalysis and conclusions expressed in them are those of the authors and should not be interpretedas those of the Congressional Budget Office. References in publications should be cleared with theauthors. Papers in this series can be obtained at www.cbo.gov (select Publications and thenWorking Papers). The author thanks Adam Weber for his valuable research assistance, and BobDennis, John Peterson, Kim Kowalewski, Doug Hamilton, Bruce Arnold, and Joseph Kile for theirhelpful comments.

2
China’s Approach to Capital Flows Since 1978
Abstract
Since China began its pro-market reform in 1978, its management of capital flows hasfollowed a cautious learning-by-doing approach, guided by the goal of propellingstrong economic growth while minimizing risk to stability. Claiming that the country’sfinancial infrastructure is still not ready to deal with large swings of financial flows,China has frequently fine-tuned restrictions of portfolio flows but generally kept a tightrein of those flows. Meanwhile, promoting foreign direct investment (FDI) inflows(and outflows in recent years)—with the aim of accessing foreign management know-how, technologies, raw material, and markets for exports—has been an importantelement of China’s development strategy.
There is some evidence that China’s approach of encouraging FDI in strategic locationsand sectors while restricting portfolio flows has contributed to its high growth ratessince 1994. But that approach also has some problematic legacies. China’s FDI policiesmay have exacerbated a pattern of unbalanced growth between rural and urban areasand rising income inequality. China’s gradualist approach toward capital-accountliberalization also has retarded the development of an efficient domestic financialmarket and well-functioning foreign exchange market, which need to be in place forthe smooth functioning of a flexible exchange rate system.

3
China’s Approach to Capital Flows Since 1978
1. Introduction
China began finding its way cautiously toward pro-market reforms and opening
its economy in late 1978. Its management of capital flows has followed a learning-by-
doing approach, guided by the goal of propelling and sustaining economic growth and
development while minimizing risk to economic (and political) stability.
The government has frequently fine-tuned but generally kept a tight rein on
private portfolio flows, claiming that China’s financial infrastructure is still not ready
to deal with large swings of those flows. During periods when capital flight was a more
serious threat, controls over outflows tended to tighten while those over inflows
became more relaxed. In contrast, when inflows (betting on an appreciation of the yuan
or prices of financial assets in China) became more problematic, controls over them
tended to become more restrictive. In recent years, China has also lowered barriers on
portfolio outflows as a way to help ease the pressure of the rapid rise in its balance of
payments.
Promoting foreign direct investment (FDI) inflows has remained an important
element of China’s development strategy since the (post-1978) reform era began. In the
early years of the reform era, China had small foreign exchange (FX) reserves and was
far behind technologically. Against that backdrop, attracting FDI inflows was viewed
as a way to jump-start China’s economic growth. Nevertheless, initiatives to promote
those inflows were timid and tentative at first, and FDI was allowed only in special
economic zones. Since 2004, China’s policymakers—enabled by its large holdings of
FX reserves—have also permitted outward FDI to rise rapidly. Both inward and

4
outward FDI deals appear to have aimed at accessing foreign technologies,
management skills, and export markets. It appears that outward FDI deals also have
given an added emphasis to securing raw materials which are critical to the
sustainability of China’s rapid growth.
There is some evidence that China’s approach to capital flows has contributed
to its economy’s high growth rates since 1994. Some studies—but not all—have found
that the rapid rise in FDI inflows has made an important contribution to China’s
growth.1 Most analysts agree that the government’s control over portfolio flows
shielded its economy from the 1997-1998 Asian crisis, when many of its neighboring
economies were buffeted by large swings in foreign capital flows. Some analysts also
argue that China’s ability to sustain its currency-peg regime since 1994, which was
underpinned by its tight controls of portfolio flows, played an important role in
maintaining China’s price stability and economic growth, though other analysts have
partly blamed the currency peg for the sharp rise in recent inflation.2 Up to 1994, China
was afflicted by cycles of boom and bust (Figure 1). After it consolidated the official
exchange rate and the swap rate and fixed the exchange rate at the lower swap rate in
1994, price inflation was brought down to 3 percent in 1997 (from over 20 percent in
1994), and the devastating cycles of boom and bust have not yet resurfaced.3 From
1 For example, see Whalley and Xin (2006) and Wei (1993).
2 For example, McKinnon (2007) argues that, given that China’s financial market is not ready to support“normal” operations of monetary policies to allow the central bank to control inflation and that the Fedhas proved to be credible in keeping U.S. inflation under control, China’s policy of pegging its currencyto the dollar fixed exchange rate allows it to eliminate inflation expectations, thereby keeping pricestability and fostering an environment conducive to investment and growth.
3 Before 1994, the swap rate was allowed to float, forming a platform for a market mechanism. SeeSection 3.1 for more detail.

5
1996 to 2007, China’s annual real gross domestic product (GDP) growth rates averaged
9.2 percent, while consumer price inflation averaged about 1.9 percent.
Nevertheless, China’s approach to capital flows appears to also have some
problematic legacies. Its approach to encouraging FDI in selected industries and in
limited geographical areas, combined with its restrictions on labor mobility, may have
contributed to an unbalanced growth pattern that is partially responsible for the sharp
rise in income inequality between the urban and rural residents. The sharp rise in
China’s net exports, which to a large extent reflects exports of foreign-invested
enterprises, may have also added to the international community’s criticism of China’s
currency policies.
China’s controls over portfolio flows and its inflexible exchange rate system
also face mounting challenges: The sharp rise in its trade surplus and large net FDI
inflows may have fueled China’s overheating economy in recent years, causing
troubling upward pressures on asset-price inflation. Domestic stock markets has been
prone to rampant speculation in part because domestic stocks available for public
trading are limited while private portfolio outflows have been restricted. Since 2005,
China has rapidly relaxed controls over portfolio outflows as part of its efforts to cool
down its overheating economy and to relieve the upward pressure on its exchange rate.
However, in part because most investors are still betting that the yuan—which has been
allowed to appreciate only tiny increments each day until lately—will continue to rise
against the dollar, such partial liberalization of capital controls has not yet succeeded in

6
cooling the Chinese economy.4 Moreover, as international pressure for a more flexible
yuan grows, the downside of China’s past tight controls of portfolio flows has also
grown more obvious. Those tight controls helped to insulate China’s financial markets
from destabilizing swings of capital flows, but they have also retarded the development
of China’s FX infrastructure (i.e., the development of sufficient numbers of market
makers and instruments for hedging currency risks, such as forward contracts and
derivatives), which needs to be in place for the smooth functioning of a flexible
exchange rate system.
2. Foreign Direct Investment
This section looks into the role of the Chinese government, among other
factors, in propelling the rapid rise of FDI inflows over the past two decades. It then
discusses the impact of those inflows on the Chinese economy. Finally, it discusses the
surge in China’s FDI outflows since 2003.
2. 1. The Government’s Policies Toward Foreign Direct Investment (FDI) Inflows
China opened up to inward FDI in a cautious and experimental manner. In the
earlier years of the reform era, changes were slow and laws and regulations remained
rather restrictive. Pro-market reforms and policies toward FDI inflows were first
4 To relieve the rising pressure on the yuan to appreciate, the People’s Bank of China announced achange in the exchange rate regime on July 21, 2005, replacing the yuan’s de facto peg to the U.S. dollarby a crawling-peg regime, which uses a basket of currencies as a “reference” for the central parity thatwill be announced at the end of each previous trading day. The yuan was allowed to appreciate ordepreciate a maximum of 0.3 percent each day from that parity. On May 21, 2007, that band waswidened to 0.5 percent. In practice, the movement of the yuan has been within a much narrower bandthan officially allowed, even though the yuan’s appreciation against the dollar has quickened since early2007. (The yuan appreciated 7.5 percent against the dollar over the 12 months since January 2007, morethan double the 3.6 percent rise over the 12 months since January 2006.)

7
experimented with in four special economic zones (SEZs) in 1980.5 In 1984, those
experiments were expanded to another 14 open coastal cities (OCCs); and generous tax
incentives were set up in both SEZs and OCCs with the goal of attracting FDI that
would bring along advanced technology. For example, in the first two years that a
foreign-invested enterprise (FIE) in those special economic zones or cities made a
profit, it was exempt from corporate income tax.6 In subsequent years, the same FIEs
would be subject to an average corporate income tax of 15 percent, less than half the
standard 33 percent paid by Chinese companies.7 FDI inflows jumped 98 percent in
1984 and continued to grow at double digit rates for several years (Figure 2). Growth
of FDI inflows began to fall in 1989, after the government’s harsh suppression of the
Tiananmen Square protest, and was nearly nil in 1990. In response, the government
began to take measures to reassure foreign investors. For example, a law was enacted
in 1990 to prohibit the state from nationalizing joint ventures and simplify the
procedures for new foreign investment. In 1991, the government eliminated a 10
percent tax imposed on distributed profits remitted abroad by FIEs. In 1992, Deng
Xiaoping’s speech during his tour of the south (of China) further reaffirmed China’s
5 Three of them (Shenzhen, Shantou, and Zhuhai) are in Guangdong Province; one of them (Xiamen) isin Fujian Province.
6 FIEs are enterprises established in China by foreign investors using their own capital, includingenterprises funded with capital from Hong Kong, Macao, and Taiwan (HMT). In China, any of a numberof legal entities can be considered FIEs, including equity joint ventures, cooperative joint ventures,wholly owned foreign enterprises, and foreign-invested companies limited by shares. Though regardedas independent businesses, FIEs must receive government approval and can operate only in certainindustries. To establish FIEs, foreign investors submit either their own investment proposals or chooseones previously submitted by Chinese companies, in which case the FIEs become joint ventures withChinese partners.
7 See Prasad and Wei (2005) and Tseng and Zebregs (2002). Tseng and Zebregs also discuss otherfactors that may have helped to attract FDI, such as market size; infrastructure; and the establishment ofopen economic zones, which have more liberal investment and trade regimes than other areas.

8
commitment to pro-market reforms, and FDI soared in 1992 and 1993 (Figures 2 and
3). When those inflows declined somewhat following the 1997-1998 Asian crisis, the
government extended preferential treatment to FDI in energy, transportation, and
infrastructure industries. The profit tax on FIEs in the western region was reduced in an
attempt to promote development there.
After China’s accession to World Trade Organization (WTO) in 2001, FDI
inflows began to surge again. Since then, FDI flows from industrial countries have
risen substantially, and they have mainly gone to the financial service sector. After
2002, foreign banks were allowed to buy equity of domestic banks, although the share
of ownership could not exceed 20 percent for a single foreign investor or 25 percent for
total foreign ownership. In addition, foreign banks were allowed to provide yuan
service to domestic firms in open cities beginning in 2003. One aim of easing
restrictions of foreign ownership of domestic banks was to improve their corporate
governance and practices, thereby speeding up the development of the financial
markets and institutions.
Clearly, the government’s role in promoting FDI inflows was not limited to
improving the legal framework to make China a more welcoming and credible
environment for direct investment. It went further than that, with the passage of laws
that offered a variety of preferential treatment to FIEs in strategically important
industries and in selected cities or economic zones. Recognizing the long-term
distorting effects of such a complex network of tax laws, and because domestic
enterprises have stepped up their complaints against unfair tax treatment, the
government enacted a new corporate income tax law (which took effect on January 1,

9
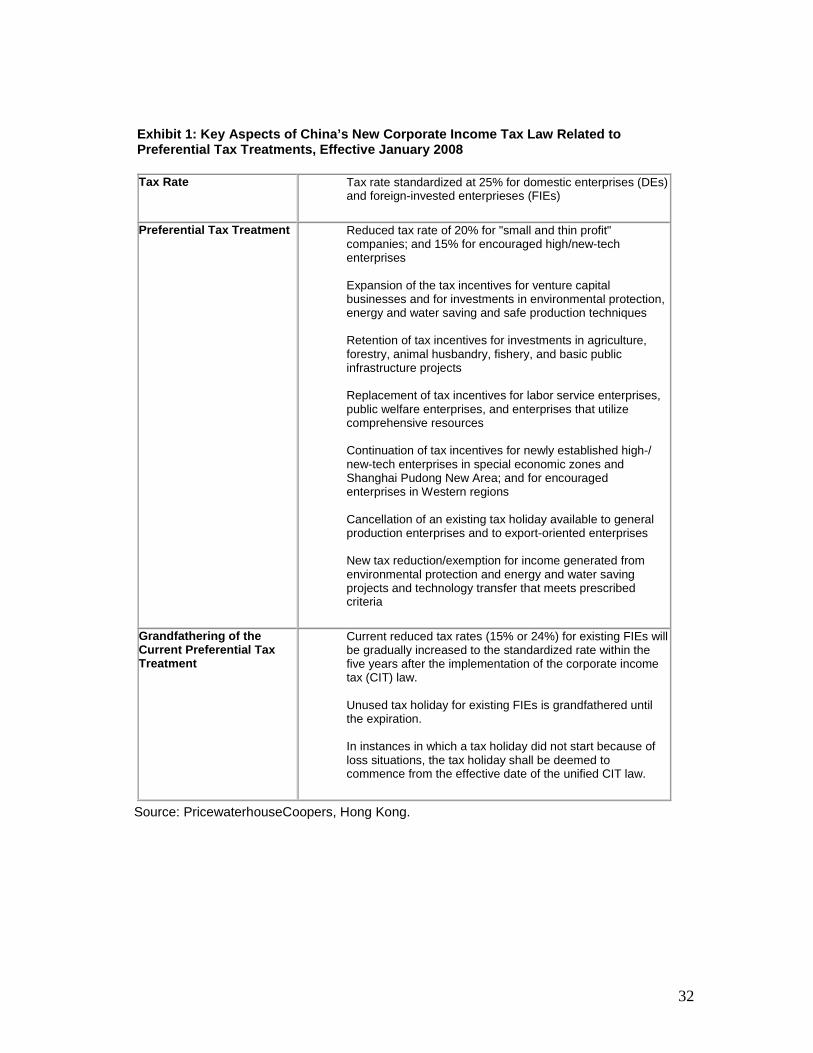
2008) that consolidated tax rates of both domestic enterprises and FIEs at 25 percent.
But significant preferential tax treatment remains, as shown in Exhibit 1.
2.2. Market Drivers of FDI in China
Two factors—inexpensive labor and the potentially large market—are probably
the most notable and most agreed-upon market forces that have attracted FDI into
China.
Low labor costs have been especially important for attracting vertical
investment (investment intended to take advantage of low-cost production for
reexporting of its products abroad). In the early years of the reform era, FDI into China
was mostly dominated by such export-oriented investment. That export-oriented FDI
came mainly from other Asian economies that had pursued export-led growth but
whose domestic labor had become too costly to compete with Chinese labor. In
particular, Hong Kong and Taiwan, with their geographical proximity and cultural ties
to China, became the prime source of such FDI inflows. In 1992, combined FDI from
Hong Kong and Taiwan accounted about 78 percent of total inward FDI, with Hong
Kong alone accounting for 68.2 percent (Table 1).8
Since the mid-1990s, however, the fact that Chinese consumers have grown
wealthier has made the enormous market potential of China an increasingly more
8 It should be noted that a portion of FDI inflows from Hong Kong are likely to be due to round-tripping(i.e., capital originating from China returning in disguise as FDI to take advantage of tax, tariff, andother benefits) and inflows that actually originated from other countries. Estimates of total round-tripping ranged from 7 percent of inflows in 1996 to almost 25 percent in 1992.
10
important factor in attracting FDI.9 Thus, direct investments from North America and
Western Europe, which are heavily tilted to horizontal investments (i.e., investments
whose products are intended to service the Chinese domestic market), have grown
more sizable.10 After 2001, as China allowed foreign entry into its financial sector and
banking industries (to comply with conditions of its accession to the WTO), direct
investments from the United States and other OECD countries began to account for an
increasingly larger share of total FDI inflows to China, as those countries’ financial
firms competed to get a foothold in the Chinese market. In 1992, FDI from the
European Union, the United States, and Japan accounted for about 13 percent of total
FDI in China; by 2006, that share rose to 26 percent (Table 1).11
In addition to low labor costs and the potential of a large market, some
researchers suggest that the sharp rise in China’s FDI inflows over the past decade may
also have reflected deficiencies in China’s domestic capital markets. Private firms in
China have little access to external financing because most funds are funneled to state-
owned enterprises. In particular, private firms have faced discrimination relative to
state-owned enterprises, both from the banking system (in terms of loan decisions by
9 The high prices American banks were willing to pay for a small share in China’s state-owned banks (ofquestionable financial health) would seem irrational if those banks were not aiming to get a foothold in arapidly expanding market earlier than their rivals.
10 According to Whalley and Xin (2006), FIEs controlled by U.S. investors sold more than 80 percent oftheir products locally in 2002. In comparison, FDI inflows from Japan have been more balanced betweenvertical and horizontal investments, with about 45 percent of production for China’s domestic market.
11 The share of FDI inflows from major industrial countries, especially those from the United States, maybe even higher in recent years if adjusted for their FDI channeled through tax havens such as the BritishVirgin Islands. FDI from the (British and U.S.) Virgin Islands accounted for 11.6 percent of total FDIinto China in 2002; that share rose to 16.2 percent by 2006. Meanwhile, contrary to the impression onegets from financial news, the share of FDI from the United States had declined since it peaked at 10percent in 2002, falling to a mere 4 percent by 2005 before recovering to 9 percent in 2006. Juxtaposingthese two pictures suggests that some U.S. multinational corporations may have set up corporations insafe-haven locations to serve as a conduit for their direct investment in China.

11
state-owned banks) and the equity market (in terms of approval of stock listings.)12 As
a result, private firms may have taken advantage of pro-FDI policies and used foreign
joint ventures as a way to acquire needed capital in order to undertake investment.13
However, that phenomenon—to the extent it occurred—may have become
considerably less important since 2001: Foreign capital financed only 4.2 percent of
fixed investment from 2001 to 2006, down from over 8 percent during the 1990s
(Table 2).
2.3. Effects of Inward FDI on China’s Economy
China’s post-reform economic growth has been propelled mainly by rapid
growth in net exports, productivity growth, and investment.14 FDI inflows have made
important contributions to China’s growth through their effect on net exports and
productivity growth, even though they directly financed only about 6 percent of fixed
investment from 1981 to 2006 (Table 2). Given the existence of various obstacles on
labor mobility in China, however, the restrictions allowing FDI only in designated
special zones (or cities), along with the special incentives given to FDI in higher-tech
12 The banking system tends to make politically-motivated, rather than economic-motivated, loans tostate-owned enterprises; state-owned enterprises are also more likely to obtain approval for equity-financing through the stock market.
13 Related to this view is the Bretton-Wood II hypothesis, which maintains that the Chinese have rapidlyaccumulated foreign reserves in part to reduce foreign investors’ reluctance of investing in a still high-risk environment.
14 As pointed out by Prasad (2007), because of the high content of imported material in Chinese exports,net exports’ direct contribution to China’s nominal GDP growth (from the perspective of growthaccounting) was not significant until after 2004, when China’s trade surplus surged. However, theoverall effect of net exports on growth should be much bigger than indicated by growth accountingbecause investment growth, which is stimulated in part by exports, is counted solely as a component ofdomestic demand growth in that accounting.

12
sectors with higher potential productivity growth, may have also contributed to rapidly
rising income inequality in China.
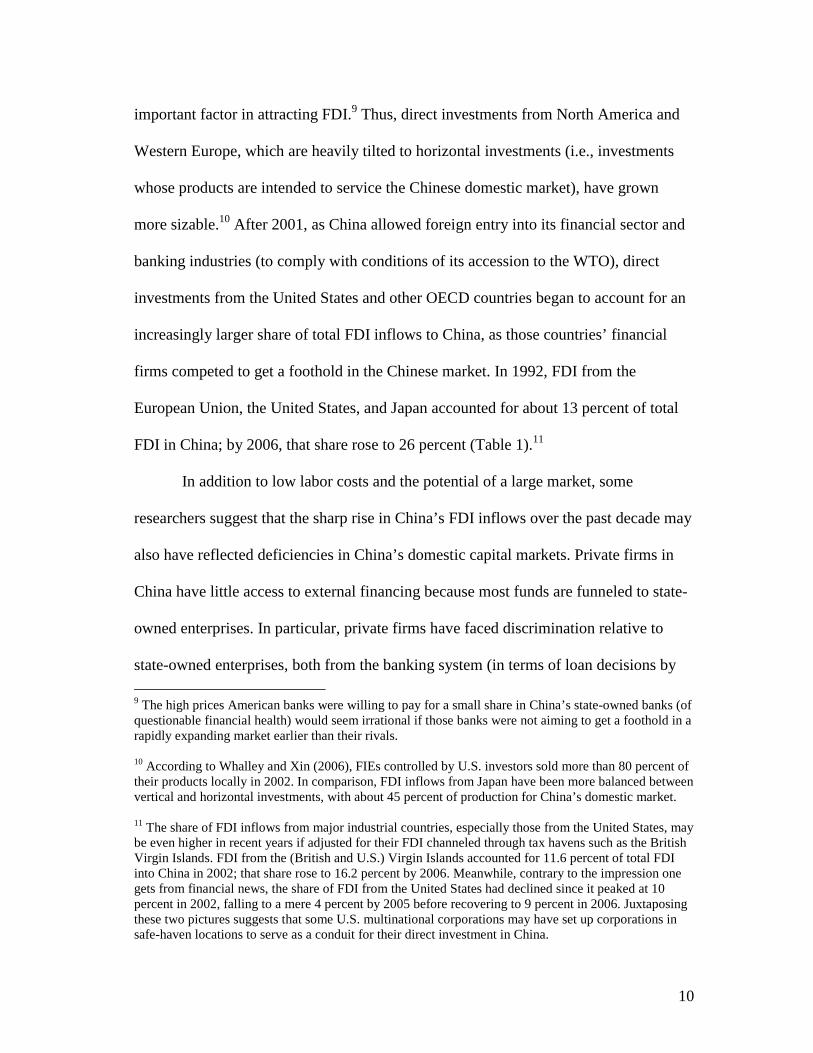
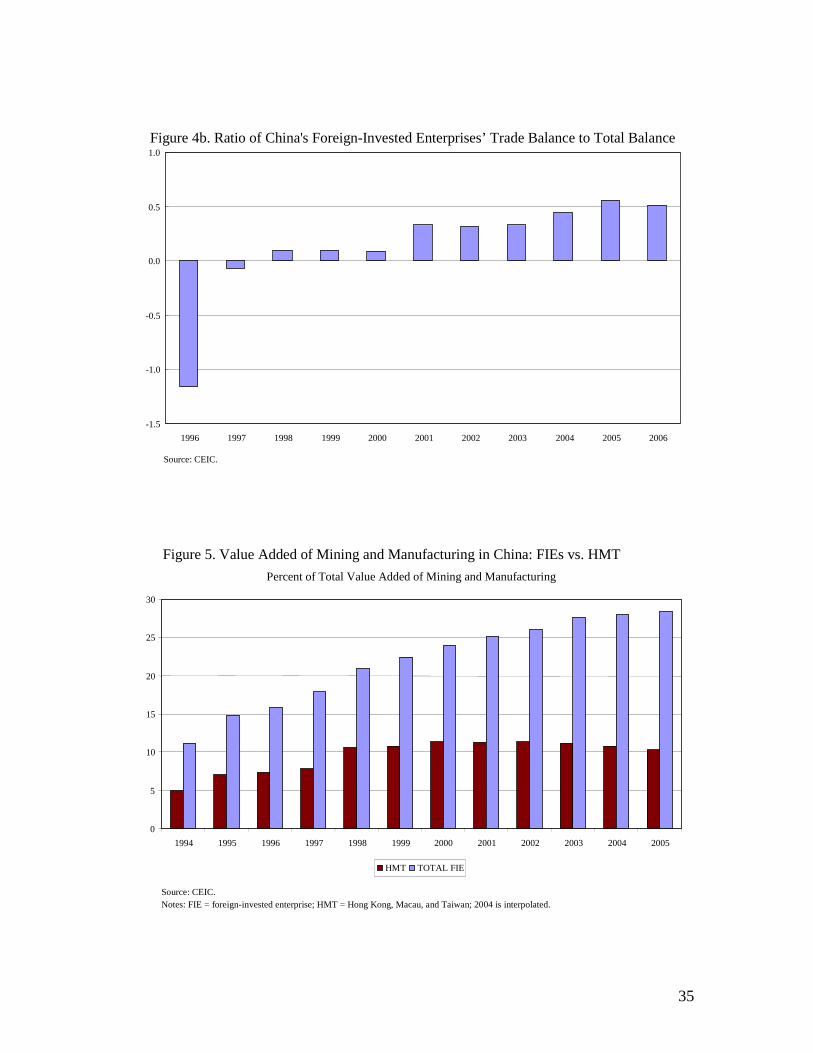
Contribution to Net Exports. FIEs have become increasingly important
contributors to the rise in China’s net exports since 2000 (Figures 4a and 4b). From
2000 to 2005, FIEs’ net exports share of China’s total net exports surged from a mere
10 percent to 53 percent. (During that period, China’s net exports rose from $24 billion
to $102 billion.) That contribution to net exports, however, appears to have peaked in
2005, perhaps reflecting the rising importance of horizontal FDI (whose products are
intended for the Chinese market).
FIEs’ role as rising net exporters was not established until after 1998. They
were still net importers in 1996 and 1997 (the only two years for which data are
available), perhaps in part because of the high cost of imported capital goods needed in
the initial stages of establishing a new enterprise.
FIEs may also have contributed to growth in net exports indirectly through
technology spillover to local Chinese firms. This is suggested by the shift in the
composition of China’s overall exports toward higher-value products at a faster speed
than the composition of FDI inflows. In the early 1990s, exports still mainly consisted
of garments and other low-value manufactured goods. But since then, they are
increasingly composed of higher-valued items, such as electronic goods. For example,
from 1994 to 2006, the share of higher-end exports categorized as machinery &
transport equipment surged from 18.1 percent of total exports to 47.1 percent, while
the share of miscellaneous manufactures (mostly apparel and clothing accessories and
footwear) fell from 41.3 percent to 24.6 percent (Table 4).

13
Contribution to Productivity Growth. Several studies have found that the
rapid growth in total factor productivity (TFP) is a main pillar of China’s real GDP
growth in the reform era, second only to capital formation. For example, Kuijs and
Wang (2006) found that capital accumulation contributed over 50 percent, and TFP
growth about 33 percent, to China’s output growth between 1978 and 2004, with
employment growth contributing the modest remainder. Bosworth and Collins (2007)
also have similar findings.
Some researchers argue that inward FDI has spurred TFP growth in China.
Whalley and Xin (2006) suggest that inward FDI may have contributed to real GDP
growth by as much as 3.9 percentage points annually in 2003 and 2004, about 41
percent of total GDP growth during that time. They further point out that this is mainly
because labor productivity of FIEs (which employed only about 3.2 percent of the
work force in those years) was about 9 times that of the non-FIE economy. Those
findings, though they may appear shockingly high, do not seem to be outside the realm
of likelihood in light of the sharp rise in the share of FIEs’ contributions to the rise in
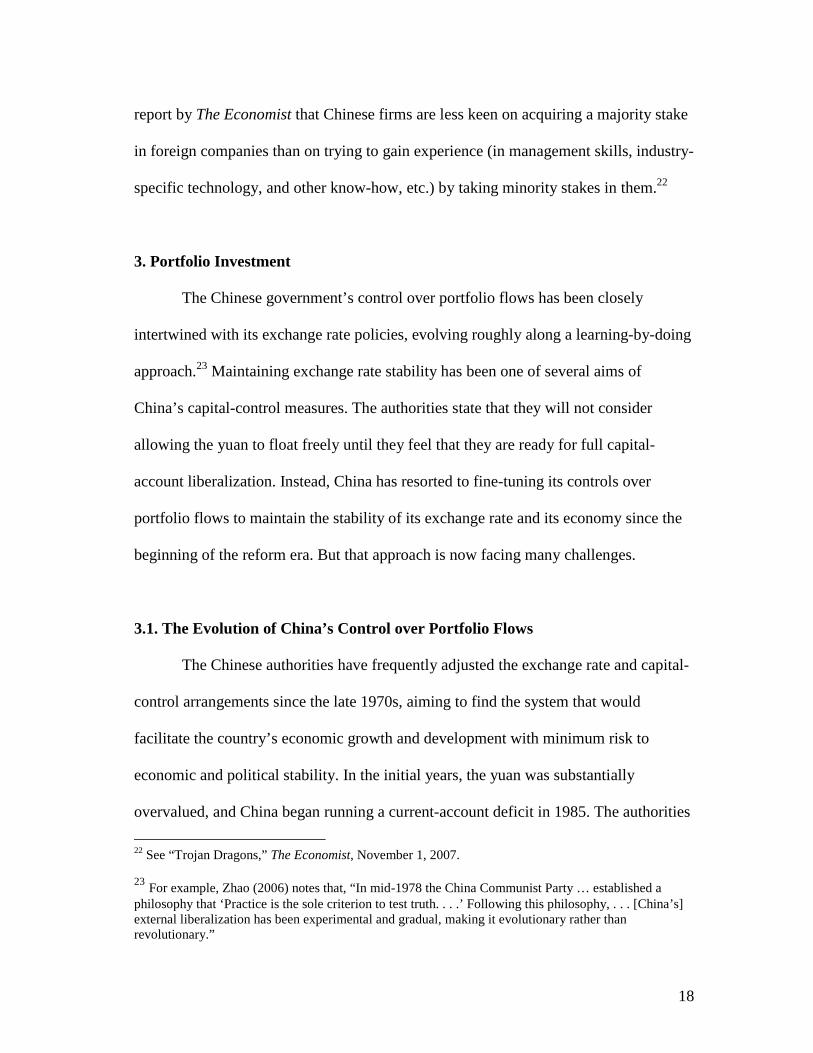
China’s overall value added. Even though the share of foreign investment in financing
China’s total fixed investment has stayed modest (around 6 percent), FIEs’ share of
value added in the industrial sector (i.e., the manufacturing and mining sector) soared
from 11 percent in 1994 to 28 percent in 2004 (Figure 5).15 Since the industrial sector
accounted for about 47 percent of China’s GDP in 2004, the contribution of industrial
FIEs to GDP in that year amounted to about 13 percent (=0.28 * 0.47). But since FIEs
in the industrial sector accounted for only 64 percent of all FIEs in China, that 13
15 Because of capital controls, the vast majority of foreign investment is FDI.

14
percent is the lower bound of FIEs’ total contribution to China’s GDP in that year. If
we assume that the contributions of FIEs to GDP are about the same across all
industries to which they belong, then the contribution of all FIEs to GDP would have
been higher, at about 20 percent (=0.13/0.64) in 2004. This is a significant increase
from FIEs’ contribution to GDP in 1996, which was about 13 percent based on similar
imputations.16
FIEs may have boosted China’s productivity growth in part because of the rapid
rise in FDI in the IT (information technology), or communication, computer, and other
electronic equipment sector. From 1997 to 2001, FDI in the IT sector rose from 5.9
percent to 15.1 percent of total inward FDI (Table 3). The rise of FDI in the IT sector,
directly through FIEs’ own output and indirectly through the effect of technology
spillover from FIEs on the output of non-FIEs, caused the IT sector’s value-added
share in the industrial (i.e., mining and manufacturing) sector to rise rapidly from the
1997 through 2003 (Figure 6). The stable share of the industrial sector in China’s GDP
(around 45 percent) in turn implies that FIEs contributed significantly to China’s
growth during that time (Figure 7).
Contribution to Unbalanced Growth. The government’s policy toward FDI
inflows in high-tech industries and only in SEZs and selected cities, however, may
have contributed to an unbalanced growth that is now threatening the stability and
sustainability of China’s future growth. About 84 percent of FDI in China is located in
suburban/urban areas of nine provinces in recent years, with the other 20 provinces
16 Data on the share of industrial FIEs in total FIEs are not available before 1996. That share was 58percent in 1996.

15
with vast rural lands sharing the remaining share.17 Given the existence of various
obstacles restricting labor mobility and the faster growth of the FIE subeconomy than
the non-FIE economy, the high concentration of FDI in urban areas has contributed to
the high concentration of job creation in those areas. 18 That uneven distribution of job
creation in turn has contributed to the rapidly rising income inequality in China.
Income inequality in China has grown rapidly even as the country’s GDP per
capita has grown faster than that of industrial economies, such as the United States, as
well as other emerging-market economies, such as India (Table 5). According to
official data, annual per capita income of urban dwellers rose more than sixfold from
1985 ($250) to 2006 ($1,600); in contrast, per capita income of rural dwellers during
that period rose only threefold, from about $200 to $600 (Figure 8). Since a potentially
large number of rural people may not be counted in official data because of the one-
child policy, that gap could be even larger than the official data indicate. However,
unbalanced growth between urban and rural areas and rising inequality are hallmarks of
countries undergoing rapid development, so the precise role of FDI policy is hard to
determine.
17 See Whalley and Xin (2006).
18 Labor movements have continued to be restricted by the household registration (hukou) system, eventhough some reforms to that system have been initiated since the mid-1990s. Migrant workers who couldnot obtain household registration are considered illegal immigrants, deprived of social benefits—such aspolice protection and public education for their children. Consequently, China’s employment growthmainly occurred in cities, with little growth in rural areas. Even though firms in the booming cities arefacing a labor shortage, they cannot easily tap the surplus labor from rural areas or other cities. SeeWhalley and Zhang (2004).

16
2.4. Outward FDI
China’s FDI outflows remained relatively insignificant for most the post-1978
reform era (Figure 3). However, as China’s rapidly growing FX reserves began to put
increasing upward pressure on the Chinese exchange rate and asset prices in 2004, the
country’s policy on FDI outflows shifted toward a more liberal regime, and those
outflows began to surge.19 That shift was partly aimed at reducing the extent to which
its currency needed to appreciate and the urgency of that appreciation. The shift
occurred when ensuring a steady supply of raw materials to sustain China’s rapid
economic catch-up had become more urgent than ever, and after China had acquired
enough FX reserves to afford direct investment abroad.
China’s approach to outward FDI, like its approach to inward FDI, is closely
tied to its strategy of accelerating its economic development through accessing foreign
technology and management skills, export markets, and raw materials. For now,
however, ensuring a steady supply of raw materials appears to have topped other
objectives.20 For example, from 2003 to 2006, the lion’s share of China’s outward FDI
(36 percent) went into the mining sector (Table 6). The two other major sectors that
also received large shares of China’s outward FDI were those important in facilitating
sales of Chinese products in their overseas markets as well in transmitting marketing
and logistical skills to Chinese firms at home. From 2003 to 2006, on average, the
19 For example, in 2005 some domestic firms were allowed to set up corporations abroad to facilitateoverseas listing, mergers, and acquisitions.
20 China’s strong demand for raw material in the past several years has been cited as a major factorbehind the rapid rise in prices of commodities such as petroleum, natural gas, iron ore, and copper, etc.

17
transport, storage, and postal service sector received 8 percent of total FDI outflows,
while the leasing and commercial services sector received 22 percent.
The impression one gets from the press—that China’s foreign direct
investments have concentrated heavily in strategic sectors in Africa and in Latin
America—turns out to be unsupported by the data. Indeed, other Asian countries have
persisted as the largest recipients of China’s FDI outflows, followed by Latin America
at a distance. Even though it appears that Latin America has overtaken Asia as the
largest recipient of those outflows after 2004, that picture is misleading because the
Cayman Islands—a popular tax haven—accounted for over 80 percent of China’s
outward FDI received by the region (Table 7).21 Indeed, assuming for illustration
purposes that all China’s FDI in the Cayman Islands eventually went somewhere other
than either Asia or Latin America (i.e., North America, Europe, or Africa), the share of
China’s FDI in Latin America (excluding the Cayman Islands) would have been only 4
percent in 2006, considerably below the share in Asia, which was 44 percent that year.
Despite the flurry of news about China’s overseas investment, China’s FDI
outflows are still dwarfed by its FDI inflows or portfolio outflows. Even after a couple
of years of sharp growth, China’s FDI outflows reached only $18 billion by 2006, just
a fraction of its FDI inflows ($78 billion) or portfolio outflows ($110 billion) in that
year. That portfolio outflows were much larger than FDI outflows seems to confirm a
21 The Cayman Islands is a popular tax haven because there are no income taxes, capital gains taxes,profits taxes, or estate taxes there. Its laws also allow companies to be formed with a minimum ofpaperwork. Thus, business transactions could be easily routed through the Cayman Islands to takeadvantage of the favorable tax laws. For example, a company in country X, which ultimately sells toU.S. department stores, might first sell its products to a Cayman subsidiary, which then resells thoseproducts to U.S. stores. The effect is to “book” the sale in the Caymans—with a zero tax rate— ratherthan in country X, with its high corporate tax rate. A wealthy individual subject to high income andestate taxes in his own country could also unload his ownership of wealth to corporations or trusts set upin the Cayman Islands to avoid those taxes.
18
report by The Economist that Chinese firms are less keen on acquiring a majority stake
in foreign companies than on trying to gain experience (in management skills, industry-
specific technology, and other know-how, etc.) by taking minority stakes in them.22
3. Portfolio Investment
The Chinese government’s control over portfolio flows has been closely
intertwined with its exchange rate policies, evolving roughly along a learning-by-doing
approach.23 Maintaining exchange rate stability has been one of several aims of
China’s capital-control measures. The authorities state that they will not consider
allowing the yuan to float freely until they feel that they are ready for full capital-
account liberalization. Instead, China has resorted to fine-tuning its controls over
portfolio flows to maintain the stability of its exchange rate and its economy since the
beginning of the reform era. But that approach is now facing many challenges.
3.1. The Evolution of China’s Control over Portfolio Flows
The Chinese authorities have frequently adjusted the exchange rate and capital-
control arrangements since the late 1970s, aiming to find the system that would
facilitate the country’s economic growth and development with minimum risk to
economic and political stability. In the initial years, the yuan was substantially
overvalued, and China began running a current-account deficit in 1985. The authorities
22 See “Trojan Dragons,” The Economist, November 1, 2007.
23 For example, Zhao (2006) notes that, “In mid-1978 the China Communist Party … established aphilosophy that ‘Practice is the sole criterion to test truth. . . .’ Following this philosophy, . . . [China’s]external liberalization has been experimental and gradual, making it evolutionary rather thanrevolutionary.”

19
were forced to devalue the yuan several times for the first two decades of the reform
era (Figure 9). The exchange rate system changed from a centrally planned
administrative mechanism to a dual exchange rate system, then to a managed float with
a narrow band, followed by a de facto peg to the U.S. dollar, and finally to a managed
float with slightly widened band. Along the way, the authorities revised capital-control
measures several times, aiming to stem capital flight at some times and block inflows
at other times, to support the stability of those exchange rate regimes.
Overall, the evolution of China’s capital-controls can be roughly broken into
seven phases:
(1) 1978-1985: China cautiously opened up to capital inflows. In December
1978, the Chinese government initiated economic reform and started opening up to the
rest of the world. The aim of those policies was to jump start the economy by tapping
foreign capital to fund investment and attracting foreign technology to promote export
growth and import substitution. The exchange rate system was supposed to facilitate
those goals in an economic system that kept central planning at the core while allowing
market mechanism to function at the margin.
Finding the “equilibrium” exchange rate of the yuan without the help of a well-
functioning FX market turned out to be difficult. In 1981, China introduced a dual
exchange rate system: an internal settlement (2.8 yuan/dollar) rate for authorized
current-account transactions and an official rate for other transactions (1.5 yuan/dollar).
The dual exchange rate system was intended to boost foreign exchange reserves, which
stood at $2.3 billion in 1980. Domestic enterprises had to surrender foreign exchange
earnings to the state and received yuan at the official exchange rate. Depending on the

20
source of the exchange earnings, they could also receive a share of the surrendered
foreign exchange as “retention quotas.”
The official rate proved to be unsustainably high and was gradually devalued.
On January 1, 1985, the official rate was eventually unified with the settlement rate at
2.8 yuan/dollar. All transactions were to be settled at the official rate, and the
settlement rate was discontinued. However, judging from the continuing decline of
China’s current account balance (to -3.7 percent of GDP in 1985), the yuan was still
overvalued even at the consolidated rate (Figure 9). Subsequently, the official rate fell
to 3.72 yuan/dollar by the end of 1986, a depreciation of 25 percent from its value in
early 1985.
(2) 1986-1991: Capital controls were first eased but then retightened. In
1986, China reintroduced a dual exchange rate system in 1986, and swaps centers
(formally, Foreign Exchange Adjustment Centers) were established in some cities.
Foreign-invested enterprises and Chinese enterprises with retention quotas (of foreign
exchange) were permitted to trade foreign exchange among themselves at a rate
different from the official rate in those swap centers. All domestic banks were also
allowed to conduct foreign exchange business.
By 1988, most cities had established foreign exchange swap centers. The
trading volume in swap centers steadily increased, and more firms were allowed to
trade in the swap market. As the swap rates continued to decline, the fixed official rate
was under increasing downward pressure. The authorities managed to keep the official
rate at 3.72 yuan/dollar for nearly three years but finally gave in and, in December
1989, began a sequence of devaluating the yuan. The official rate subsequently fell to

21
5.22 yuan/dollar by March 1991. In April 1991, the official exchange rate regime was
changed from a periodical adjustment to a managed float, allowing the authorities to
adjust the rate even more frequently.
The swap market rates generated market distortions and became problematic in
the late 1980s and early 1990s. (China had one official foreign exchange rate and often
many market exchange rates because of imperfect arbitrage between swap centers.)
Against this backdrop, rules and regulations were introduced to strengthen the
supervision of external transactions. For example:
• All receipts of foreign-invested enterprises in foreign currencies were to bedeposited in domestic banks, and all expenditures in foreign currencies were tobe paid from those accounts.
• A domestic enterprise could invest overseas with its own foreign exchangeearnings, and the State Administration of Foreign Exchange (SAFE) had toexamine the source of its foreign exchange earnings. The investing enterprisehad to deposit 5 percent of the investment in a special account of a bankdesignated by SAFE. The profits and other foreign exchange earnings weresupposed to be repatriated home and surrendered to the state.
• A ceiling was imposed on the outstanding short-term external debt of eachfinancial institution.
• All firms conducting foreign trade were required to submit to SAFE a copy oftheir export contracts, customs declaration forms, and cash vouchers. SAFEcould launch investigations and impose punishments on firms that failed toprovide these documents verifying repatriation of exports proceeds.
(3) 1992-1993: Capital controls on inflows were eased following the
Tiananmen Square suppression. After the growth of capital inflows ground to a halt
following the harsh suppression of the Tiananmen Square protest, Deng Xiaoping
called for an acceleration of reforms and an opening up during his famous “tour
through the south” in early 1992. His view was soon endorsed by the Congress of the

22
Communist Party. The authorities officially accepted a market-based floating exchange
regime and current-account convertibility as the ultimate goals of the exchange reform.
Besides FDI inflows, China started exploring more channels to use foreign capital. In
1992, the B-share market was launched in Shenzhen and Shanghai, allowing domestic
corporations to issue shares denominated foreign currencies, which only nonresidents
were allowed to buy. In 1993, nonbank financial institutions were allowed to conduct
business in foreign currencies.
However, accelerated liberalization in the external and financial sectors may
have contributed to economic overheating in 1992 and 1993. Price inflation soared
from about 5 percent in 1992 to 24 percent in 1994. The average annual growth rate of
real GDP surged to 14 percent in 1992 and 1993 (Figure 2). The current-account
balance swung from a surplus of $13.3 billion (3.1 percent of GDP) in 1991 to a deficit
11.9 billion (-1.8 percent of GDP) in 1993. The high inflation and a rapidly falling
current account drove expectations of further depreciation of the yuan. The exchange
rate in the swap market fell to over 10 yuan/dollar in mid 1993, before intervention by
the People’s Bank of China lifted it to 8.7 yuan/dollar at the end of 1993. (Meanwhile,
the official rate remained at a much higher 5.8 yuan/dollar.) Against this backdrop,
reforming the exchange rate regime became an urgent issue.
(4) 1994-1996: Controls on inflows were tightened, while controls on
outflows eased, to support the new exchange rate regime and combat inflation.
On January 1, 1994, the official and swap market exchange rates were unified at the
prevailing swap market exchange rate (8.7 yuan/dollar). The unified exchange rate
regime was a managed floating rate with a narrow band (+/- 0.25 percent) in each

23
trading day. The China Foreign Exchange Trade System (CFETS) became operational,
creating an integrated system of foreign exchange trading centralized in Shanghai. The
swap centers in the old regime became branches of the Shanghai market. A two-tier
trading system was established. Firms traded foreign exchange with banks. Banks
traded their net foreign exchange position in CFETS. As exchange rate flexibility
increased, foreign exchange designated banks were allowed to offer yuan forward
products for firms to hedge exchange risk.
Firms were no longer allowed to retain foreign exchange for current-account
transactions. They had to surrender their foreign exchange earnings from such
transactions at the official rate and purchase foreign exchange when a payment in
foreign currency was needed. Foreign exchange proceeds from capital-account
transactions could not be converted into renminbi (RMB, or yuan), unless approved by
SAFE.
After those policy changes, credit growth cooled and inflation moderated. The
current-account deficit turned into a surplus by 1994, and the yuan gradually
appreciated to 8.45 by the end of 1994. However, the expectation of further
appreciation of the yuan in turn induced large speculative capital inflows through
loopholes and all sorts of schemes, partially offsetting the government efforts to
contain the overheating.
In response, measures were taken to relax restrictions on capital outflows and to
enhance controls over inflows. Except for FDI, all financial-account transactions were
to be approved by SAFE case by case.

24
(5) 1997-2000: Controls on outflows were tightened, while restrictions on
inflows eased in the aftermath of the Asian crisis. Capital outflows became an
increasing problem in late 1997 and early 1998, as the eruption of the Asian crisis in
the summer of 1997 prompted concerns about the devaluation of the RMB. FDI
inflows remained strong. But large portfolio outflows ensued, as foreign banks sharply
reduced their exposure, causing the financial account to turn from a surplus of $21
billion in 1997 to a deficit of $6 billion in 1998 (Table 8). Illegal capital flight, which
can be roughly estimated by the errors and omissions in the balance of payments
account, rose sharply in 1997 and remained high in 1998 and 1999.24
To reduce illegal capital outflows and maintain a stable exchange rate, the
authorities tightened the screening of capital-account transactions and imposed severe
penalties, such as imprisonment, for fraudulent behavior. Meanwhile, controls of
inflows were relaxed. Restrictions on extending external guarantees, issuing bonds in
the international market, and FIEs’ borrowing in yuan were relaxed.
The banking industry also began to open up to foreign investment. In 1997, 13
more cities were opened for foreign banks to conduct business in RMB, adding to the 5
open cities already in place. In 1999, the geographic restriction on foreign banks was
repealed, though such restrictions on foreign banks’ conducting business in the yuan
remained. Moreover, foreign banks were allowed to invest in domestic banks, in hope
24 The entry for errors and omissions in China’s balance of payments accounting can be used to extractinformation on illicit portfolio financial flows. China’s policy of allowing current-account convertibilitybut not financial-account convertibility (except for FDI inflows) suggests that the entry for errors andomissions—the gap between the change in foreign reserves and the combined balance of both the currentaccount and the financial account—is mostly due to underreporting or overreporting of financial (ratherthan current-account) flows.

25
that this would improve domestic banks’ corporate governance and promote sound
practices.
During the Asian financial crisis, the trading band of ±0.25 percent was
narrowed further. Even though the regime was still nominally a managed float, China
had essentially operated it as a de facto peg to the dollar and the exchange rate was
kept at 8.28 yuan/dollar until July 2005.
(6) 2001-2004: Portfolio inflows were eased following China’s accession to
the WTO. China’s accession to the WTO in December 2001 marked a new stage for
China’s external liberalization. In addition to committing to tariff cuts, China has
promised that a large number of key services—including important business services,
courier services, wholesale trade, franchising, tourism services, rail and road transport,
and freight forwarding services—will be fully or almost fully open to foreign entry by
2008. Substantial foreign entry will also be allowed in many other services—including
in telecommunications, audiovisual services, construction, retail trade, insurance,
banking, securities, and maritime transport.
Since then, China has made rapid progress toward opening up its financial
sector to foreign investment. More cities were opened to foreign banks to conduct
business in the RMB. In addition to the liberalization of direct investment by foreign
banks, domestic investors have been allowed to invest in B-shares with self-owned
foreign exchange earnings since 2001. Starting in 2002, qualified foreign institutional
investors (QFII) have been allowed to invest in the domestic capital market (bond and
stock markets). Consequently, from 2001 to 2004, portfolio inflows dwarfed outflows,
contributing to upward pressure on the yuan exchange rate.

26
(7) 2005-Present: Portfolio outflows are encouraged to ease the upward
pressure on the yuan. The Chinese government has long maintained that the yuan is
not ready to float until the country’s FX and financial markets are ready to manage the
potentially large swings of portfolio flows. Therefore, instead of allowing the rapid rise
in China’s current-account surplus and net capital inflows to freely drive up the yuan
exchange rate, the authorities began to lower barriers on capital outflows and tighten
restrictions of portfolio inflows to help relieve that upward pressure on the yuan.25
Since 2004, for example, the government has allowed multinational corporations
operating in China more freedom to move funds in and out of the country, insurance
companies to invest in foreign-currency-denominated assets overseas, social insurance
funds to invest in overseas securities markets, qualified foreign institutions to issue
RMB-denominated bonds in China, and emigrants as well as overseas citizens
receiving inheritances to transfer their property abroad. In 2005, the first foreign
company was listed on the Shanghai Stock Exchange. Corporations were allowed to
keep all of their foreign exchange earnings in their own accounts, up from 80 percent
previously. Since early 2006, qualified domestic institutional investors—basically local
fund managers and banks—have been permitted to invest money offshore. Most
recently (on December 17, 2007), the China Banking Regulatory Commission also
announced that Chinese citizens would soon be able to buy shares and mutual funds in
London and New York through their local banks.
25 Since July 21, 2005, the yuan was also allowed to fluctuate within a band of 0.3 percent each day fromthe parity established the previous day. That band was widened to 0.5 percent since May 21, 2007.

27
Portfolio outflows began to surge after 2004, outgrowing the rise in inflows
(Figures 10 and 11). In 2004, portfolio inflows still exceeded outflows by $20 billion;
but by 2006, outflows exceeded inflows by $68 billion—amounting to a reversal of net
capital inflows of $88 billion (Table 8). Using an alternative gauge of net portfolio
inflows—which adjusts for the error-and-omission balance (shown in Table 8 as the
adjusted net portfolio inflows), the reversal is an even greater $127 billion (from a $47
billion net inflow to a $80 net outflow).
4.2. The Challenges Ahead
In view of the country’s past struggles with swings in capital flows, it is not
surprising that China is reluctant to abolish capital controls before its financial market
is ready. Even though China has begun liberalizing its financial services industry at a
rapid pace since its accession to the WTO, it is questionable whether its banks and
capital markets can now function efficiently as financial intermediaries. As long as its
financial sector is still underdeveloped, portfolio inflows are likely to be used
inefficiently. The banking and corporate sectors may also tend to increase their
exposure to currency risk faster than their ability to manage that risk, a problem that
was central to the Asian crisis of 1997-1998. At the same time, once capital is allowed
to exit freely, a large amount of capital flight could occur if perceptions of political
uncertainty suddenly increase.
Most economists also agree that it is unwise for countries (such as China),
where FX trading is inhibited (either by incomplete markets or government regulations

28
or both), to plunge into a floating exchange rate regime.26 A sufficient number of
market makers willing and able to take open positions is an important factor for a
reasonably smooth market-based float.27 Despite all the progress China has made so
far, Chinese commercial banks are still constrained in their ability to take large open
positions to fulfill their roles as FX market makers for a variety of reasons: The
domestic bond market is still not sufficiently deep and liquid, the domestic banking
system is still tightly regulated, and capital controls are not near to being completely
abolished. With no natural market makers in the system, an immediate switch to freely
float the yuan would very likely result in wildly erratic movements in the yuan
exchange rate, while the ability and options of traders (exporters and importers) to
hedge currency risks would still be limited.
Some economists, such as Eichengreen (2006), argue that the progress already
made toward partial liberalization of capital controls actually makes it even more
urgent for China to allow the yuan greater flexibility (under a managed float).
Currently, China’s crawling-peg exchange rate regime allows the yuan to move within
26 Those economists include McKinnon (2007) and Eichengreen (2006). Even analysts in the PetersonInstitute for International Economics, who are among the most critical of China’s slowness in allowingits currency to appreciate, do not believe China is ready to adopt a free float yet. Goldstein and Lardy(2003), and more recently Goldstein (2004, 2007), maintain that “full capital account liberalization inChina has to wait for a strengthening of China’s banking and financial system—not that exchange rateappreciation has to wait for financial-sector reform.” Since a free-floating exchange rate is not advisablewithout full capital-account liberalization, they have advocated that China should first revalue itscurrency in one big step (by about 20 percent to 25 percent from its level in June 2005) and widen thecurrency band substantially (to between 5 percent and 7 percent). After that first-stage reform and afterChina has strengthened its domestic financial system enough to permit a significant liberalization ofcapital outflows, then the country should then adopt a managed float.
27 In countries where FX trading is not inhibited and is well functioning, large banks normally havedirect access to the international market and are the dealers that match buy and sell orders for thedomestic currency. In the absence of government intervention (including playing the role of a marketmaker), these dealers must continually take open positions—for or against the domestic currency—inorder to “make” the foreign exchange market. In doing so, they provide depth and liquidity to themarket, helping to stabilize the currency (at least in a well-behaved market).

29
a band of only 0.5 percent from the central parity announced the previous day, making
it relatively easy for speculators to make one-way bets. Given that most investors
consider the yuan to still be significantly undervalued, lowering restrictions on capital
outflows could only encourage more speculative inflows, rendering the authorities less
capable of insulating the economy from the effects of those inflows.
The authorities thus are facing a dilemma. The risk is high if China floats the
yuan before its financial and FX markets are up to speed. The risk is also high if capital
flows are liberalized while its financial market is still underdeveloped and its exchange
rate is heavily managed. Continuing to restrict portfolio flows, however, will continue
to inhibit the development of its financial and FX markets, delaying the time when the
yuan is ready to float. Meanwhile, the cost of delaying the yuan’s eventual shift to
float—manifested in the effect that the rapidly rising FX reserves have on inflationary
pressure and economic overheating—is mounting steadily. Given the Chinese
economy’s sizable weight in the global economy, especially in the Asian region, the
stakes are high in China’s transition toward floating its exchange rate.
5. Conclusion
China’s economic growth since the early 1990s has been very rapid, with
growth of income per capita averaging about 9 percent a year. In some aspects, China’s
record is even more impressive than those of the four Asian newly industrialized
economies (Singapore, Hong Kong, South Korea, and Taiwan). This paper discusses
the contribution that China’s approach toward capital flows appears to have made to
that record.

30
But China’s approach to capital flows is not an unqualified success. It may have
contributed to a pattern of unbalanced growth and rising income inequality, which risks
the sustainability of its rapid growth. China’s fine-tuning and gradualist approach
toward capital-account liberalization, necessary to sustain its currency-peg exchange
rate policy, may have also retarded the development of an efficient domestic financial
market and well-functioning foreign exchange market. The acceleration of liberalizing
portfolio flows since 2001 has contributed to notable progress in the financial sector;
however, given China’s currency-peg regime, it also further hampers the Chinese
central bank’s ability to rein in inflation and an overheating economy. Now that China
has grown into a major world economy, whether it can successfully manage the
transition toward full capital-account convertibility and a free-floating exchange rate
matters not only to China but also to the global economy.

31
References
Bosworth, Barry, and Susan Collins (2007), “Accounting for Growth: ComparingChina and India,” NBER Working Paper No. 12943.
Eichengreen, Barry (2006), “China’s Exchange Rate Regime: The Long and Short ofIt,” Manuscript, University of California Berkeley.
Goldstein, Morris (2004), “Adjusting China’s Exchange Rate Policies,” PetersonInstitute for International Economics, Working Paper 04-1.
Goldstein, Morris (2007), “A (Lack of) Progress Report on China’s Exchange RatePolicies,” Peterson Institute for International Economics, Working Paper.
Goldstein, Morris, and Nicholas Lardy (2003), “Two-Step Currency Reform forChina,” Asian Wall Street Journal, September 12.
Kuijs, Louis, and Tao Wang (2006), “China’s Patten of Growth: Moving toSustainability and Reducing Inequality,” China & World Economy, No.1.
McKinnon, Ronald (2007), “Why China Should Keep Its Dollar Peg: A HistoricalPerspective from Japan,” Stanford University Working Paper No. 323.
Prasad, Esward, and Shang-Jin Wei (2005), “The Chinese approach to Capital Inflows:Patterns and Possible Explanations” NBER Working Paper No. 11306.
Prasad, Esward (2007), “Is the Chinese Growth Miracle Built to Last?” Manuscript,Cornell University.
Tseng, Wanda, and Harm Zebregs (2002), “Foreign Direct Investment in China: SomeLessons for Other Countries,” IMF Policy Discussion Paper, February.
Wei, Shang-Jin (1993), “The Open Door Policy and China’s Rapid Growth: Evidencefrom City-level Data,” NBER Working Paper No. 4602.
Whalley, John, and Xian Xin (2006), “China’s FDI and Non-FDI Economies and theSustainability of Future High Chinese Growth,” NBER Working Paper No. 12249.
Whalley, John, and Zhang Shunming (2004), “Inequality Change In China and(Hukou) Labour Mobility Restrictions,” NBER Working Paper 10683.
Zhao, Min (2006), “External Liberalization and the Evolution of China’s ExchangeSystem: an Empirical Approach,” World Bank China Office Research Paper No. 4.
32
Exhibit 1: Key Aspects of China’s New Corporate Income Tax Law Related toPreferential Tax Treatments, Effective January 2008
Tax Rate Tax rate standardized at 25% for domestic enterprises (DEs)and foreign-invested enterprieses (FIEs)
Preferential Tax Treatment Reduced tax rate of 20% for "small and thin profit"companies; and 15% for encouraged high/new-techenterprises
Expansion of the tax incentives for venture capitalbusinesses and for investments in environmental protection,energy and water saving and safe production techniques
Retention of tax incentives for investments in agriculture,forestry, animal husbandry, fishery, and basic publicinfrastructure projects
Replacement of tax incentives for labor service enterprises,public welfare enterprises, and enterprises that utilizecomprehensive resources
Continuation of tax incentives for newly established high-/new-tech enterprises in special economic zones andShanghai Pudong New Area; and for encouragedenterprises in Western regions
Cancellation of an existing tax holiday available to generalproduction enterprises and to export-oriented enterprises
New tax reduction/exemption for income generated fromenvironmental protection and energy and water savingprojects and technology transfer that meets prescribedcriteria
Grandfathering of theCurrent Preferential TaxTreatment
Current reduced tax rates (15% or 24%) for existing FIEs willbe gradually increased to the standardized rate within thefive years after the implementation of the corporate incometax (CIT) law.
Unused tax holiday for existing FIEs is grandfathered untilthe expiration.
In instances in which a tax holiday did not start because ofloss situations, the tax holiday shall be deemed tocommence from the effective date of the unified CIT law.
Source: PricewaterhouseCoopers, Hong Kong.

33
Figure 2. China's Foreign Direct Investment FlowsPercent Change from Previous Year
-25
0
25
50
75
100
125
150
175
1982 1984 1986 1988 1990 1992 1994 1996 1998 2000 2002 2004 2006
-200
0
200
400
600
800
1,000
1,200
1,400
Inflow (Left) Outflow (Right)
Source: State Administration of Foreign Exchange.
Figure 1. China's Real Gross Domestic Product and Consumer Price IndexPercent Change from Previous Year
-5
0
5
10
15
20
25
1972 1974 1976 1978 1980 1982 1984 1986 1988 1990 1992 1994 1996 1998 2000 2002 2004 2006
CPI
Real GDP
Source: China National Bureau of Statistics.

34
Figure 3. China's Foreign Direct Investment FlowsBillions of US$
-10
0
10
20
30
40
50
60
70
80
1982 1984 1986 1988 1990 1992 1994 1996 1998 2000 2002 2004 2006
Outflow
Inflow
Source: State Administration of Foreign Exchange.
Figure 4a. China's Trade Balances: Total vs. Foreign-Invested Enterprises’Billions of US$
-2
0
2
4
6
8
10
12
14
16
1996 1997 1998 1999 2000 2001 2002 2003 2004 2005 2006
Total
FIEs
Source: CEIC.Note: FIE = foreign-invested enterprise.
35
Figure 4b. Ratio of China's Foreign-Invested Enterprises’ Trade Balance to Total Balance
-1.5
-1.0
-0.5
0.0
0.5
1.0
1996 1997 1998 1999 2000 2001 2002 2003 2004 2005 2006
Source: CEIC.
Figure 5. Value Added of Mining and Manufacturing in China: FIEs vs. HMT
Percent of Total Value Added of Mining and Manufacturing
0
5
10
15
20
25
30
1994 1995 1996 1997 1998 1999 2000 2001 2002 2003 2004 2005
HMT TOTAL FIE
Source: CEIC.Notes: FIE = foreign-invested enterprise; HMT = Hong Kong, Macau, and Taiwan; 2004 is interpolated.

36
Figure 6. Value Added of Selected Industries in ChinaPercent of Total Value Added of Mining and Manufacturing
0
1
2
3
4
5
6
7
8
9
1993 1994 1995 1996 1997 1998 1999 2000 2001 2002 2003 2004 2005 2006
Communication, Computer,& Other Electronic
Garments, Footwear,& Headgear
Textiles
Source: CEIC.Note: 2004 is interpolated.
Figure 7. China's Gross Domestic Product by Sector
Percent
0
10
20
30
40
50
60
1952 1955 1958 1961 1964 1967 1970 1973 1976 1979 1982 1985 1988 1991 1994 1997 2000 2003 2006
Agriculture
Mining andManufacturing
Services
Source: China National Bureau of Statistics.

37
Figure 8. Annual Income per Capita in China: Urban vs. RuralUS$
0
200
400
600
800
1,000
1,200
1,400
1,600
1,800
1985 1990 1995 2000 2005
Urban
Rural
Source: CEIC.Note: 1986 rural income per capita is interpolated.

38
Figure 9. China’s Current-Account Balance and the RMB Official Exchange Rate
200520001995199019851980
15
10
5
0
-5
15
10
5
0
-5
RMB/US$ (end of period) Percent of GDP
Swap centerestablished
Exchange ratesystem changedto a managedfloating
Official rate andswap market rateunified
Outbreak of Asianfinancial crisis
Departure fromthe de facto peg
Current-accountbalance (Right)
Realexchangerate (Left) Nominal
exchangerate (Left)
Sources: Min Zhao, External Liberalization and the Evolution of China’s Exchange System: an Empirical Approach(2006); China National Bureau of Statistics; China State Administration of Foreign Exchange; Organisation ofEconomic Co-operation and Development; Haver Analytics.
Note: RMB = renminbi (yuan); GDP = gross domestic product.

39
Figure 10. Growth of China's Portfolio Inflows and Outflows(Percent Change from Previous Year)
-1,000
-500
0
500
1,000
1,500
1984 1986 1988 1990 1992 1994 1996 1998 2000 2002 2004 2006
Inflows
Outflows
Source: State Administration of Foreign Exchange.
Figure 11. China's Portfolio FlowsBillions of US$
-20
0
20
40
60
80
100
120
1982 1984 1986 1988 1990 1992 1994 1996 1998 2000 2002 2004 2006
Outflows
Source: State Administration of Foreign Exchange.
Inflows

40
Hong Kong (China) 53.9 68.2 35.7 33.9 33.1 31.3 24.8 29.1
European Union 4.2 2.2 8.9 7.0 7.4 7.0 7.2 9.8
United States 13.1 4.6 9.5 10.3 7.9 6.5 4.2 9.4
Japan 14.4 6.5 9.3 7.9 9.5 9.0 9.0 6.6
Korea -- -- -- 5.2 8.4 10.3 7.1 5.6
Singapore -- -- -- 4.4 3.9 3.3 3.0 3.4
Taiwan 6.4 9.5 6.4 7.5 7.4 5.1 3.0 3.1
Other 8.0 9.0 30.3 23.8 22.7 27.4 41.6 33.0
Virgin Islands -- -- -- 11.6 10.8 11.1 12.5 16.2
Source: MOFCOM FDI Statistics.Web address: http://www.fdi.gov.cn/pub/FDI_EN/Statistics/AnnualStatisticsData/default.jsp.
Table 1. Changing Sources of FDI Inflows to China
Percent of Total Realized Value for Year
20061990 1992 2001 2002 2003 2004 2005
Percent of Total, Average
State Appropriation 24.0 12.7 3.9 4.8 4.8
Domestic Loan 13.4 21.4 21.7 18.6 18.1
Foreign Capital 4.3 4.9 8.9 7.4 4.2
Self-Raised and Other 58.3 61.0 65.5 69.2 72.9
Total 100.0 100.0 100.0 100.0 100.0
Source: CEIC.Note: There is a break in the data in 1996.
Table 2. Fixed Asset Investment in China by Source of Funds
2001-20061981-1984 1985-1988 1989-1996 1997-2000

41
Percent of Total Capital Utilized
Agricultural 1.4 1.9 1.8 0.9
Construction 3.2 1.7 1.3 1.0
Electricity, Gas, and Water Supply 4.6 4.8 1.9 1.8
Manufacturing 62.1 65.9 71.0 57.7
Textile 4.1 4.1 3.9 3.0
Chemical Material and Product 3.2 4.7 4.4 3.8
Communication, Computer, and Other Electronic Equipment 5.9 15.1 11.6 11.8
Other Manufacturing 49.0 42.0 51.0 39.1
Mining 2.1 1.7 0.9 0.7
3.7 1.9 2.1 2.9
Real Estate 11.4 11.0 9.8 11.8
Banking and Insurance -- 0.1 0.4 9.7
Information Transmission, Computer Service, and Software -- -- 1.5 1.5
Scientific Research -- -- 0.5 0.7
Leasing and Commercial Service -- -- 4.7 6.1
Othera 11.6 10.9 4.2 5.2
Total 100.0 100.0 100.0 100.0
Source: CEIC.a. Includes wholesale and retail trade, catering, water conservancy, residential and other services, social organization, education,health care, and recreation.
Table 3. Distribution of China’s Foreign Direct Investment Inflows by Sector, Selected Years
20062004
Transport, Storage, and Postal Service
1997 2001

42
Percent of Total
Food 8.3 4.8 3.2 2.7
Crude Materials (Except Fuel) 3.4 1.6 1.0 0.8
Mineral Fuels 3.2 3.2 2.4 1.8
Chemical Products 5.2 5.0 4.4 4.6
Basic Manufacturesa 19.2 16.5 17.0 18.0
Machinery and Transport Equipment 18.1 35.7 45.2 47.1
Office and ADP Machines 2.2 8.8 14.7 13.9
Electrical Machinery 4.9 9.5 10.0 10.5
Telecom. and Sound Recording Equipment 5.6 8.9 11.5 12.8
Other Machinery and Transport Equipment 5.4 8.4 9.0 10.0
Miscellaneous Manufactures 41.3 32.7 26.4 24.6
Apparel and Clothing Accessories 19.6 13.8 10.4 9.8
Footwear 5.0 3.8 2.6 2.3
Travel Goods and Handbags 2.0 1.5 1.1 0.9
Other Miscellaneous Manufacturesb 14.7 13.7 12.3 11.6
Otherc 1.4 0.6 0.4 0.4
Total 100.0 100.0 100.0 100.0
Source: CEIC.Note: ADP = automated data processing.a. Includes leather, rubber, wood, paper, yarn, fabric, iron, steel, nonmetallic mineral manufactures, andnonferrous metals.b. Includes furniture, photographic equipment, watches, prefabricated buildings, professional instruments,and sanitary plumbing.c. Includes beverages, tobacco, and animal and vegetable oils.
Table 4. Composition of China’s Exports, Selected Years
1994 2001 20062004

43
Percent of Total
Agricultural 2.9 5.3 0.9 1.0 2.5
Construction 0.8 0.9 0.7 0.2 0.6
Electricity, Gas, and Water Supply 0.8 1.4 0.1 0.7 0.7
Manufacturing 21.9 13.7 18.6 5.1 14.8
Mining 48.3 32.7 13.7 48.4 35.8
2.7 15.1 4.7 7.8 7.6
Real Estate -0.5 0.2 0.9 2.2 0.7
Information Transmission and Computer Service 0.3 0.6 0.1 0.3 0.3
Scientific Research 0.2 0.3 1.1 1.6 0.8
Leasing and Commercial Service 9.8 13.6 40.3 25.6 22.3
Othera 12.9 16.2 19.0 7.0 13.8
Total 100.0 100.0 100.0 100.0 100.0
Source: CEIC.
a. Includes wholesale and retail trade, catering, water conservancy, residential and other services, social organization, health care, and recreation.
Table 6. Distribution of China's Nonfinancial Outward Direct Investment, by Sector
Average,2003-2006
Transport, Storage and Postal Service
20062003 2004 2005
Average Annual Growth Rate
China 3.9 8.1 8.8 8.9 173 1,593
India 0.3 3.5 3.6 5.1 207 591
U.S. 2.5 2.1 1.8 1.6 23,037 37,807
Sources: Haver Analytics; Federal Reserve Board; Department of Commerce, Bureau of Economic Analysis and Bureauof the Census; China National Bureau of Statistics; Reserve Bank of India.Note: The GDP data underlying column one come from the Federal Reserve Board, whereas the GDP data underlying theother columns come from Haver Analytics. Therefore, the first column may not be consistent with the later columns.
Table 5. Real per Capita GDP
1979 Level(2000 US$)
2006 Level(2000 US$)
1971-79 1980-89 1990-99 2000-06

44
Percent of Total Nonfinancial Outward Direct Investment
Asia 52.7 54.6 35.7 43.5
Hong Kong 40.3 47.8 27.9 39.3
Japan 0.3 0.3 0.1 0.2
Korea 5.4 0.7 4.8 0.2
Singapore -0.1 0.9 0.2 0.7
Europe 5.1 2.9 3.2 3.4
Russia 1.1 1.4 1.7 2.6
North America 2.0 2.3 2.6 1.5
United States 2.3 2.2 1.9 1.1
Latin America 36.4 32.1 52.7 48.0
Cayman Islands 28.3 23.4 42.1 44.4
Africa 2.6 5.8 3.2 2.9
Other 1.2 2.4 2.5 0.7
Source: CEIC.
Table 7. Regions and Countries Receiving China’s Nonfinancial Outward
Direct Investment
20062003 2004 2005

Tab
le8.
Ch
ina'
sB
alan
ceo
fP
aym
ents
(Bil.
of
US
$)(+
:Cap
italI
nflo
ws;
-:C
apita
lout
flow
s)19
9719
9819
9920
0020
0120
0220
0320
0420
0520
06
Cha
nge
inF
XR
eser
ves
(+:in
crea
se)
35.9
6.2
8.7
10.7
47.3
75.5
117.
020
6.4
207.
024
7.0
Cur
rent
Acc
ount
Bal
ance
37.0
31.5
21.1
20.5
17.4
35.4
45.9
68.7
160.
824
9.9
Fin
anci
alA
ccou
ntB
alan
ce21
.0-6
.35.
22.
034
.832
.352
.811
0.7
58.9
6.0
Net
FD
IInf
low
s41
.741
.137
.037
.537
.446
.847
.253
.167
.860
.3N
etP
ortfo
lioIn
flow
s6.
9-3
.7-1
1.2
-4.0
-19.
4-1
0.3
11.4
19.7
-4.9
-67.
6O
ther
Inflo
ws
-27.
6-4
3.7
-20.
5-3
1.5
16.9
-4.2
-5.9
37.9
-4.0
13.3
75.5
Err
ors
and
Om
issi
ons
-22.
1-1
8.9
-17.
6-1
1.7
-4.9
7.8
18.4
27.0
-16.
8-1
2.9
Mem
o:A
djus
ted
Fin
anci
alA
ccou
ntB
al.
-1.1
-25.
2-1
2.4
-9.8
30.0
40.1
71.2
137.
842
.1-6
.9A
djus
ted
Net
Por
tfolio
Inflo
ws
-15.
2-2
2.6
-28.
9-1
5.7
-24.
3-2
.529
.846
.7-2
1.7
-80.
4(in
clud
ing
erro
rs&
omis
sion
s)
Cur
rent
acco
unt/G
DP
Rat
io(%
)3.
83.
01.
91.
71.
32.
42.
83.
57.
09.
0
Sou
rce:
Chi
na's
Sta
teA
dmin
istr
atio
nof
For
eign
Exc
hang
e.N
ote:
(1).
Cha
nge
inF
orei
gnE
xcha
nge
(FX
)R
eser
ves
=C
urre
ntA
ccou
ntB
alan
ce+
Fin
anci
alA
ccou
ntB
alan
ce+
Err
ors
and
Om
issi
ons.
(2).
GD
P=
gros
sdo
mes
ticpr
oduc
t.