chinese community profile
TRANSCRIPT
CHINESE COMMUNITY PROFILE
Julie Newton-Werro
Brad Fry
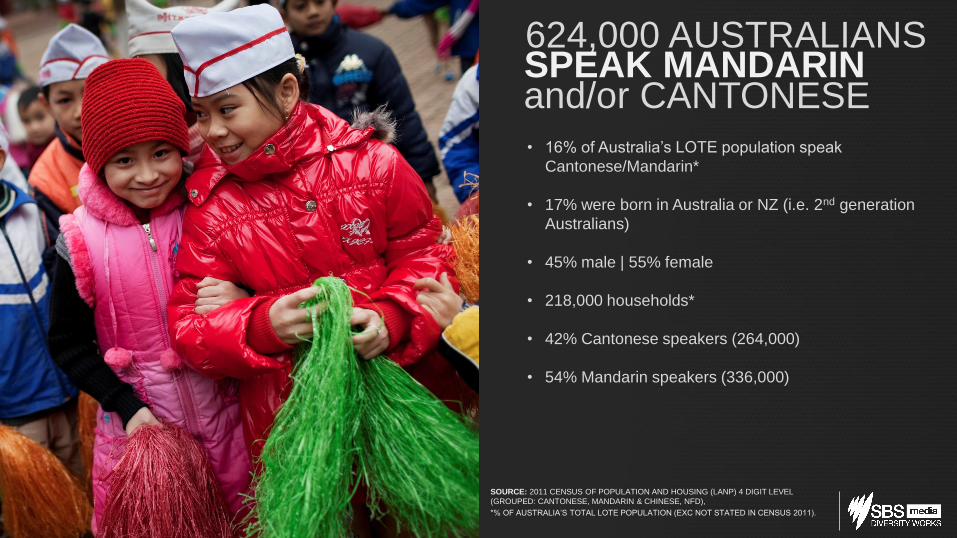
SOURCE: 2011 CENSUS OF POPULATION AND HOUSING (LANP) 4 DIGIT LEVEL
(GROUPED: CANTONESE, MANDARIN & CHINESE, NFD),
*% OF AUSTRALIA’S TOTAL LOTE POPULATION (EXC NOT STATED IN CENSUS 2011).
• 16% of Australia’s LOTE population speak
Cantonese/Mandarin*
• 17% were born in Australia or NZ (i.e. 2nd generation
Australians)
• 45% male | 55% female
• 218,000 households*
• 42% Cantonese speakers (264,000)
• 54% Mandarin speakers (336,000)
624,000 AUSTRALIANS SPEAK MANDARIN and/or CANTONESE
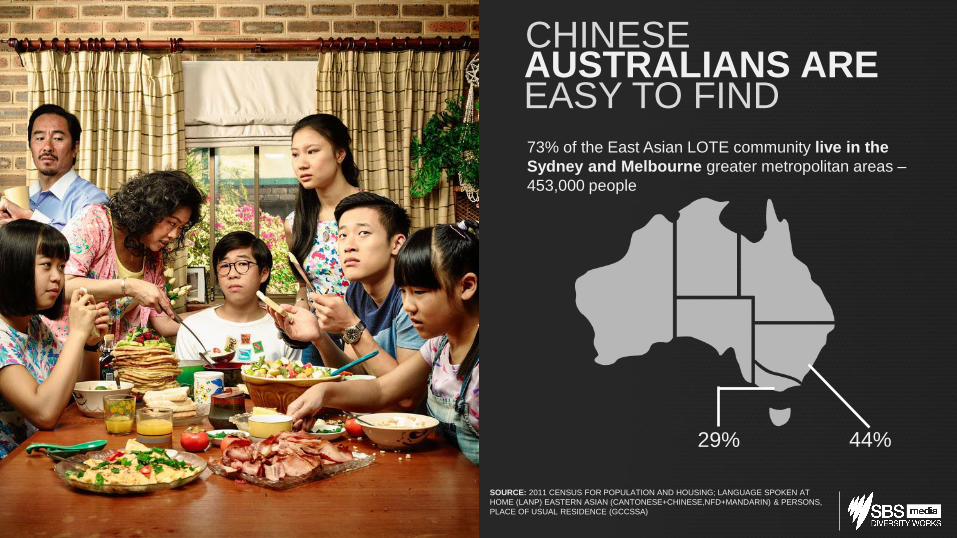
SOURCE: 2011 CENSUS FOR POPULATION AND HOUSING; LANGUAGE SPOKEN AT
HOME (LANP) EASTERN ASIAN (CANTONESE+CHINESE,NFD+MANDARIN) & PERSONS,
PLACE OF USUAL RESIDENCE (GCCSSA)
73% of the East Asian LOTE community live in the
Sydney and Melbourne greater metropolitan areas –
453,000 people
CHINESE AUSTRALIANS ARE EASY TO FIND
29% 44%
SOURCE: 2011 CENSUS OF POPULATION AND HOUSING (LANP) 4 DIGIT LEVEL (EXCLUDES JAPANESE &
KOREAN),
*% OF AUSTRALIA’S TOTAL LOTE POPULATION (EXC NOT STATED IN CENSUS 2011).
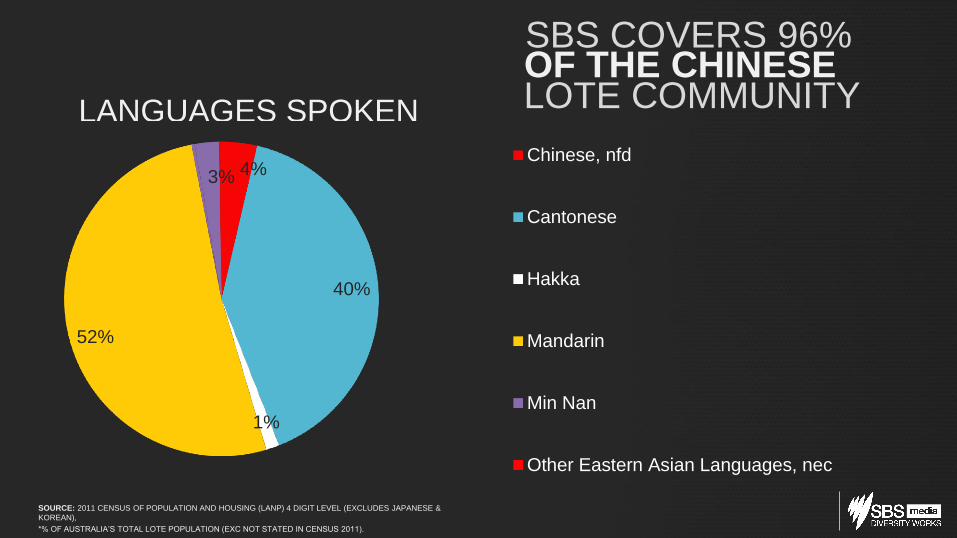
SBS COVERS 96% OF THE CHINESE LOTE COMMUNITY
4%
40%
1%
52%
3%
Chinese, nfd
Cantonese
Hakka
Mandarin
Min Nan
Other Eastern Asian Languages, nec
LANGUAGES SPOKEN
SOURCE: ROY MORGAN SINGLE SOURCE DATA, JULY2014-JUNE2015; LOTE (CANTONESE AND
MANDARIN)
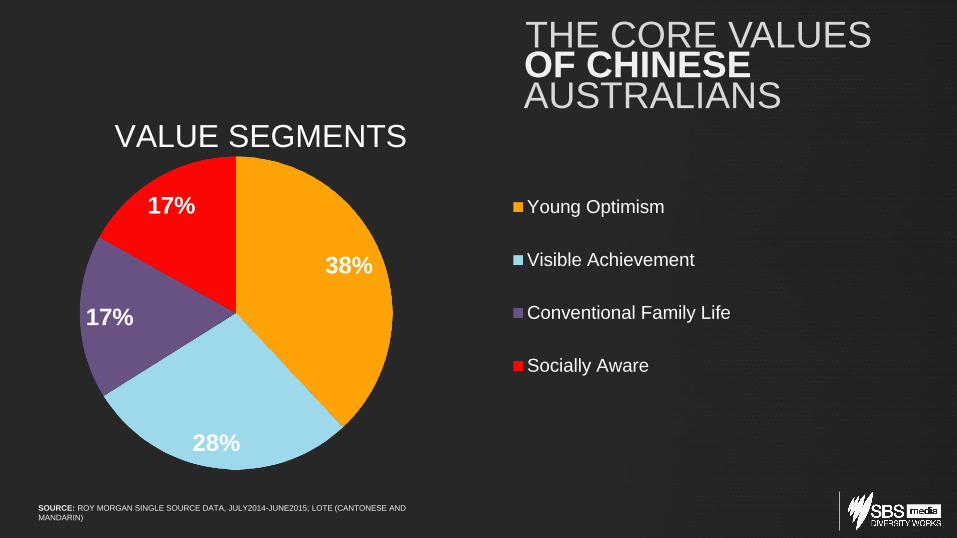
THE CORE VALUES OF CHINESE AUSTRALIANS
38%
28%
17%
17% Young Optimism
Visible Achievement
Conventional Family Life
Socially Aware
VALUE SEGMENTS
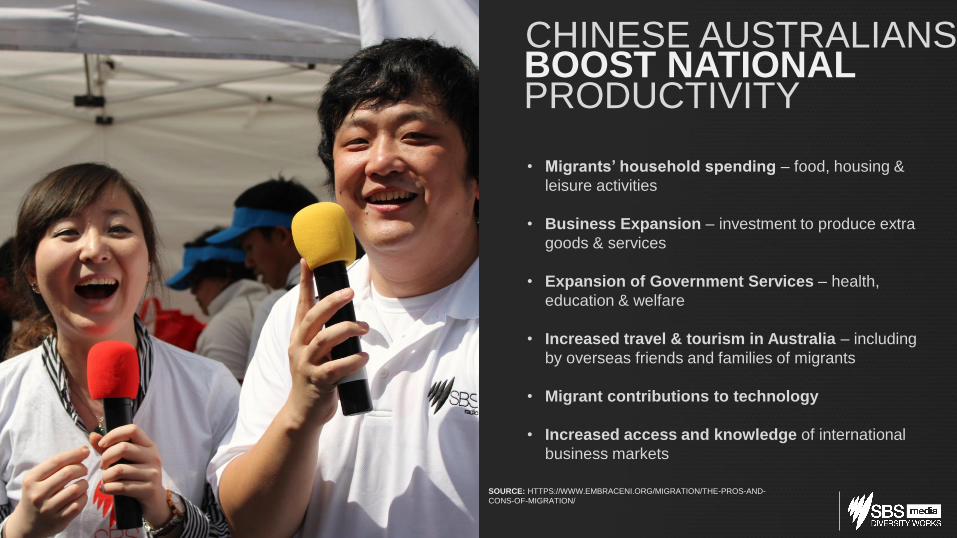
• Migrants’ household spending – food, housing &
leisure activities
• Business Expansion – investment to produce extra
goods & services
• Expansion of Government Services – health,
education & welfare
• Increased travel & tourism in Australia – including
by overseas friends and families of migrants
• Migrant contributions to technology
• Increased access and knowledge of international
business markets
CHINESE AUSTRALIANS BOOST NATIONAL
SOURCE: HTTPS://WWW.EMBRACENI.ORG/MIGRATION/THE-PROS-AND-
CONS-OF-MIGRATION/
PRODUCTIVITY
SOURCE: ROY MORGAN SINGLE SOURCE DATA, JULY2014-JUNE2015; SPEAK A LANGUAGE OTHER THAN ENGLISH AT HOME (CHINESE LANGUAGES GROUPED: CANTONESE & MANDARIN)
APPROXI,MATE NUMBER OF HOUSEHOLDS IN=218,000. HOUSEHOLD EXPENDITURE SURV EY 2009-2010, AVERAGE WEEKLY EXPENDITURE MIGRANTS DATABASE #34150DS0061
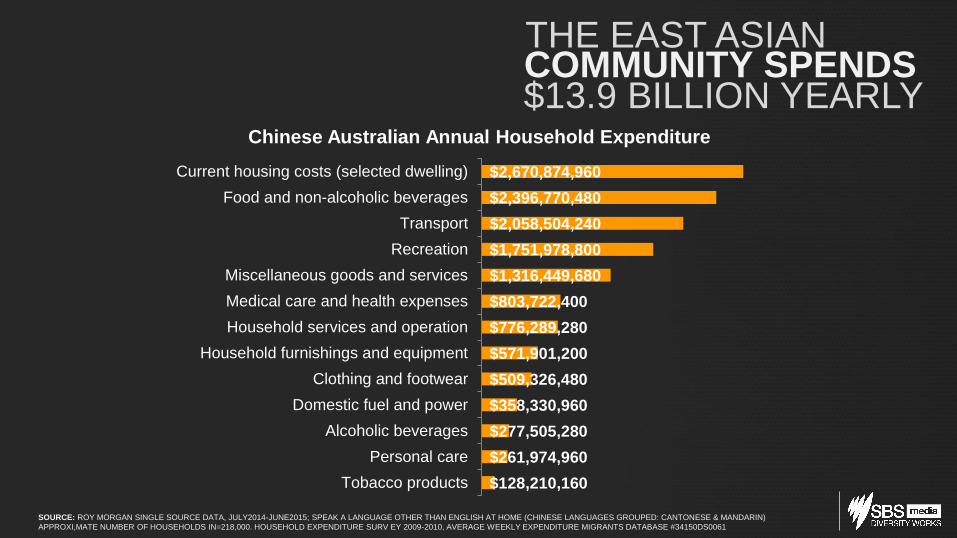
THE EAST ASIAN COMMUNITY SPENDS $13.9 BILLION YEARLY
$128,210,160
$261,974,960
$277,505,280
$358,330,960
$509,326,480
$571,901,200
$776,289,280
$803,722,400
$1,316,449,680
$1,751,978,800
$2,058,504,240
$2,396,770,480
$2,670,874,960
Tobacco products
Personal care
Alcoholic beverages
Domestic fuel and power
Clothing and footwear
Household furnishings and equipment
Household services and operation
Medical care and health expenses
Miscellaneous goods and services
Recreation
Transport
Food and non-alcoholic beverages
Current housing costs (selected dwelling)
Chinese Australian Annual Household Expenditure

SOURCE: ROY MORGAN SINGLE SOURCE DATA, JULY2014-JUNE2015; SPEAK A LANGUAGE
OTHER THAN ENGLISH AT HOME (CHINESE LANGUAGES GROUPED: CANTONESE &
MANDARIN).
Read more: http://www.afr.com/news/policy/education/chinese-students-do-better-in-australia-
20140831-jdge9#ixzz3sTlSZQsA
Follow us: @FinancialReview on Twitter | financialreview on Facebook
Chinese Australians:
• 79% say ‘success’ is important to them
• 55% consider themselves as intellectual
• 51% more likely to say that schools don’t place enough
emphasis on academic achievement
Compared to the general population, Chinese Australians
are:
• almost twice as likely to undertake tertiary study
• 49% more likely to have a degree
EDUCATIONAL ACHIEVEMENT IS A PRIORITY
Chinese Australians:
• 47% are of mid-high socio-economic (A,B,C)
• 64% want job security (11% higher)
• 56% are households with more than one income
Compared to the population average, Chinese
Australians are:
• 24% more likely to be professionals/managers
• 13% more likely to be white collar workers
FINANCES

SOURCE: ROY MORGAN SINGLE SOURCE DATA, JULY2014-JUNE2015;
SPEAK A LANGUAGE OTHER THAN ENGLISH AT HOME (CHINESE
LANGUAGES GROUPED: CANTONESE & MANDARIN).
Chinese Australians:
• 74% say they prefer to do online banking
• 77% say they like to be well insured
• 74% do not have any personal loans, which is 15%
more likely than the general population 14+
• 1 in 5 have a current mortgage for a home, which is
16% lower than the general population 14+
• over one third have a credit card, which is 10% lower
than the general population 14+
RETAIL BANKING
Chinese Australians:
• 55% do not make additional personal
superannuation contributions
Compared to the population average, Chinese
Australians are:
• 21% less likely to have wealth management
• 51% less likely to have any shares
RETAIL BANKING
SOURCE: ROY MORGAN SINGLE SOURCE DATA, JULY2014-JUNE2015;
SPEAK A LANGUAGE OTHER THAN ENGLISH AT HOME (CHINESE
LANGUAGES GROUPED: CANTONESE & MANDARIN).

Chinese Australians:
• 58% say they trust well known brands better than
stores own, which is 22% more likely than the
population average
• 86% say they believe quality is more important than
price
• 64% are always ready to try new and different products
• more than half say they want to look stylish
Compared to the population average, Chinese Australians
are:
• 27% more likely to buy a European car
RETAIL SPENDING
SOURCE: ROY MORGAN SINGLE SOURCE DATA, JULY2014-JUNE2015;
SPEAK A LANGUAGE OTHER THAN ENGLISH AT HOME (CHINESE
LANGUAGES GROUPED: CANTONESE & MANDARIN).
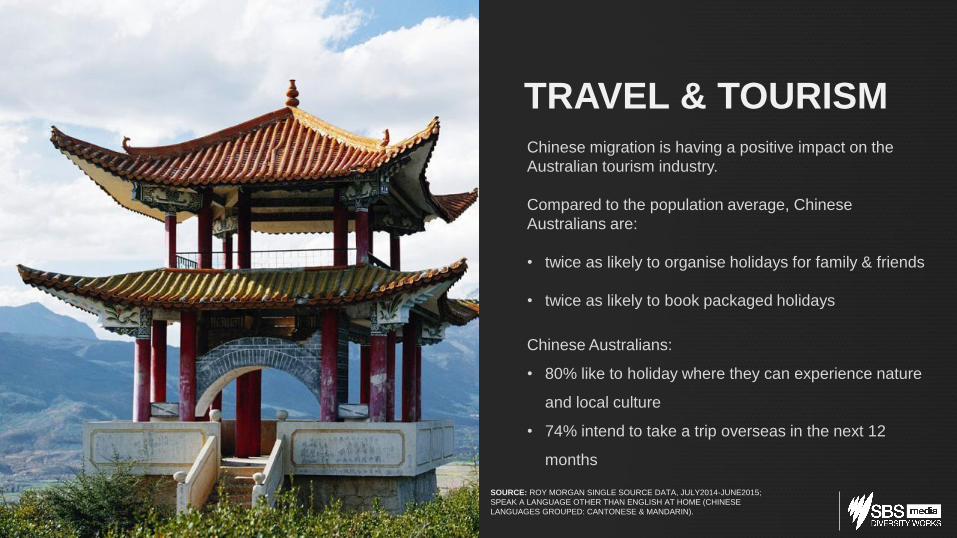
Chinese migration is having a positive impact on the
Australian tourism industry.
Compared to the population average, Chinese
Australians are:
• twice as likely to organise holidays for family & friends
• twice as likely to book packaged holidays
Chinese Australians:
• 80% like to holiday where they can experience nature
and local culture
• 74% intend to take a trip overseas in the next 12
months
TRAVEL & TOURISM
SOURCE: ROY MORGAN SINGLE SOURCE DATA, JULY2014-JUNE2015;
SPEAK A LANGUAGE OTHER THAN ENGLISH AT HOME (CHINESE
LANGUAGES GROUPED: CANTONESE & MANDARIN).

Chinese Australians place an emphasis on quality meals.
However, the younger segment tends to eat more fast
food.
Compared to the population average, Chinese
Australians are:
• 29% more likely to have eaten at a QSR fast food
outlet in the last 3 months
• 26% more likely to experiment with new foods
• 23% more likely to have traditional meals at home
• 17% more likely to entertain spontaneously
• 49% more likely to buy natural medicines & health
products
FOOD
SOURCE: ROY MORGAN SINGLE SOURCE DATA, JULY2014-JUNE2015;
SPEAK A LANGUAGE OTHER THAN ENGLISH AT HOME (CHINESE
LANGUAGES GROUPED: CANTONESE & MANDARIN).
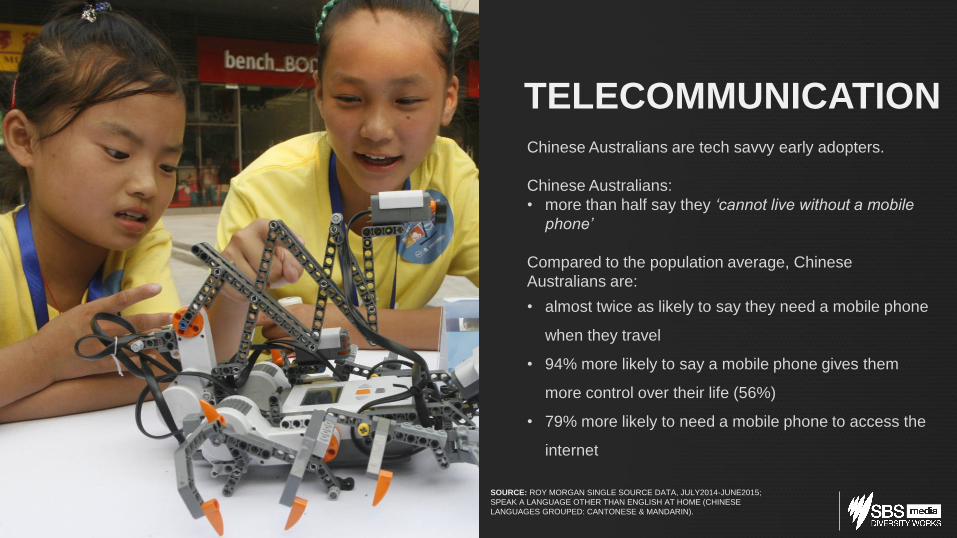
Chinese Australians are tech savvy early adopters.
Chinese Australians:
• more than half say they ‘cannot live without a mobile
phone’
Compared to the population average, Chinese
Australians are:
• almost twice as likely to say they need a mobile phone
when they travel
• 94% more likely to say a mobile phone gives them
more control over their life (56%)
• 79% more likely to need a mobile phone to access the
internet
TELECOMMUNICATION
SOURCE: ROY MORGAN SINGLE SOURCE DATA, JULY2014-JUNE2015;
SPEAK A LANGUAGE OTHER THAN ENGLISH AT HOME (CHINESE
LANGUAGES GROUPED: CANTONESE & MANDARIN).
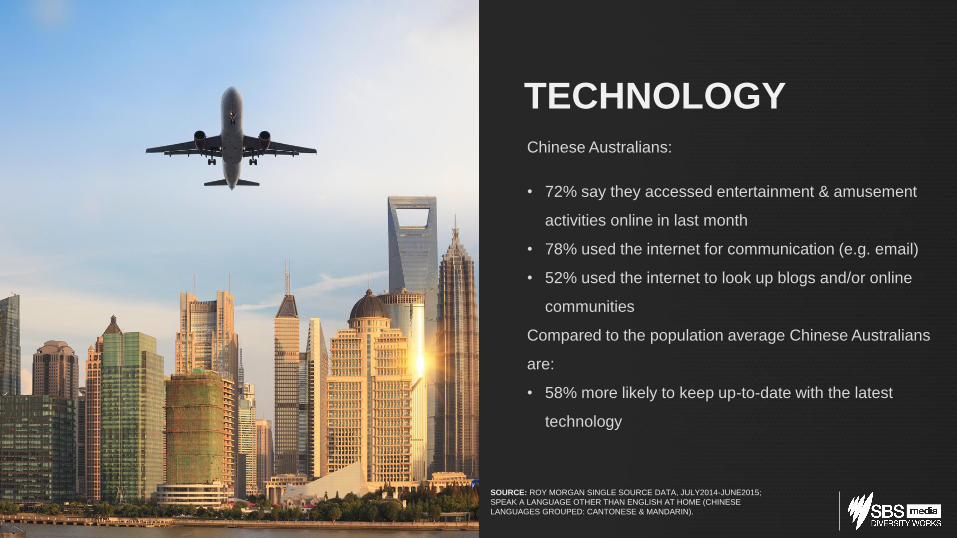
Chinese Australians:
• 72% say they accessed entertainment & amusement
activities online in last month
• 78% used the internet for communication (e.g. email)
• 52% used the internet to look up blogs and/or online
communities
Compared to the population average Chinese Australians
are:
• 58% more likely to keep up-to-date with the latest
technology
TECHNOLOGY
SOURCE: ROY MORGAN SINGLE SOURCE DATA, JULY2014-JUNE2015;
SPEAK A LANGUAGE OTHER THAN ENGLISH AT HOME (CHINESE
LANGUAGES GROUPED: CANTONESE & MANDARIN).
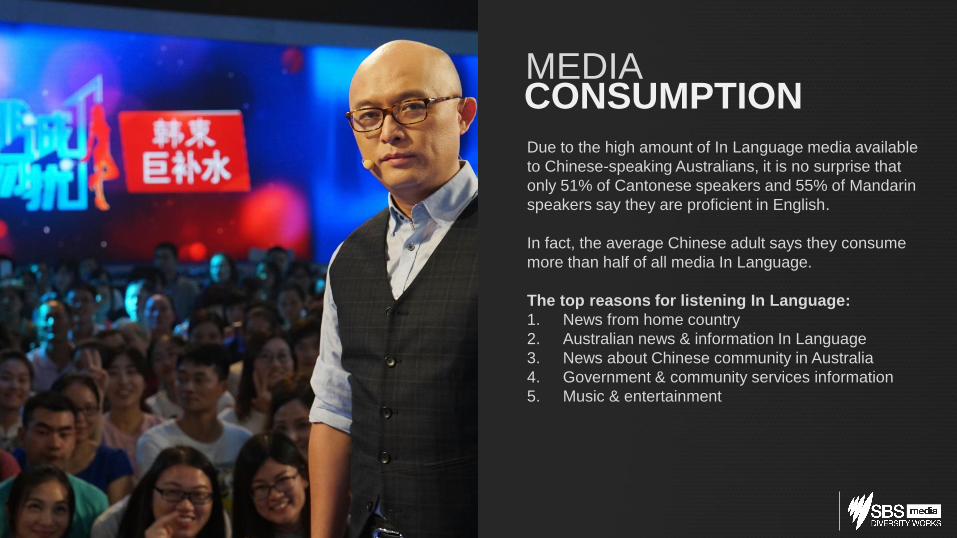
Due to the high amount of In Language media available
to Chinese-speaking Australians, it is no surprise that
only 51% of Cantonese speakers and 55% of Mandarin
speakers say they are proficient in English.
In fact, the average Chinese adult says they consume
more than half of all media In Language.
The top reasons for listening In Language:
1. News from home country
2. Australian news & information In Language
3. News about Chinese community in Australia
4. Government & community services information
5. Music & entertainment
MEDIA CONSUMPTION
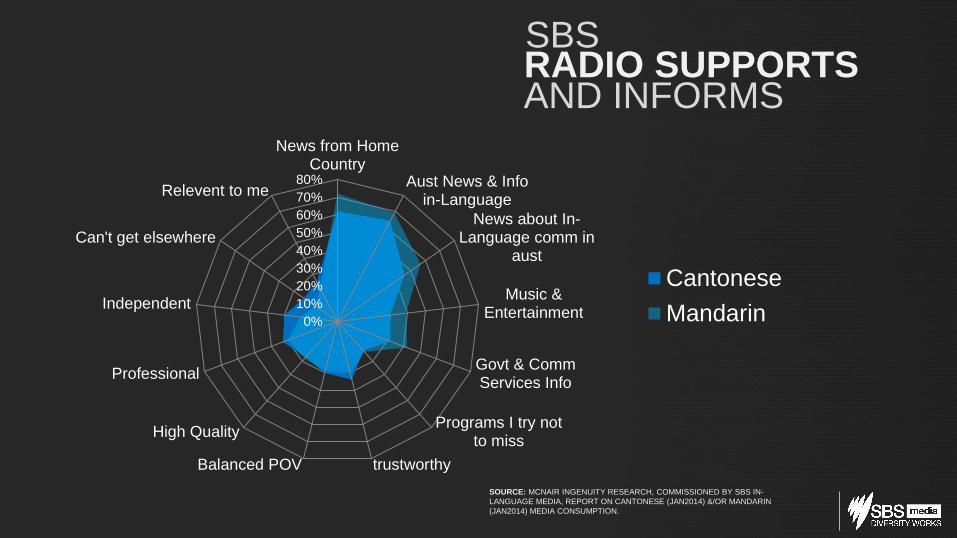
SBS RADIO SUPPORTS AND INFORMS
0%
10%
20%
30%
40%
50%
60%
70%
80%
News from HomeCountry
Aust News & Infoin-Language
News about In-Language comm in
aust
Music &Entertainment
Govt & CommServices Info
Programs I try notto miss
trustworthyBalanced POV
High Quality
Professional
Independent
Can't get elsewhere
Relevent to me
Cantonese
Mandarin
SOURCE: MCNAIR INGENUITY RESEARCH, COMMISSIONED BY SBS IN-
LANGUAGE MEDIA, REPORT ON CANTONESE (JAN2014) &/OR MANDARIN
(JAN2014) MEDIA CONSUMPTION.
SOURCE: THE EXCHANGE, SBS MANDARIN RADIO QUESTIONNAIRE, FEB2014 AND
SBS CANTONESE QUESTIONNAIRE, NOV2014:, IN YOUR OWN WORDS WHAT ARE THE
REASONS YOU LISTEN TO THE SBS MANDARIN/CANTONESE RADIO PROGRAM?
BASE: ALL RESPONDENTS MANDARIN N=149 AND CANTONESE N=352
“Your broadcast talks about national and
international news, weather, cooking,
medical care, gardening, computer
technology, sports, legal matters, a wide
range of topics, all in a language
so familiar to me”
Shu, F, 55-64, Sydney
SBS RADIO ENTERTAINS
“Get updated news explained in
Cantonese for better understanding
about events around the world and
locally in Australia too”
Andy, M, Melbourne
“Getting information and news not only
focusing on Australia”
Anthony, M, 45-54,Sydney