chinese fdi accelerate pakistanÕs - igc · the country’s technological backwardness, ... china...
TRANSCRIPT

Working paper
Can Chinese FDI Accelerate Pakistan’s Growth?
Shahid Yusuf
February 2013

Can Chinese FDI Accelerate Pakistan’s Growth?
Shahid Yusuf, Chief Economist, The Growth Dialogue, George Washington
University, School of Business, Washington D.C. Abstract Pakistan’s GDP growth has slowed to a barely 3 percent rate that is economically and politically unacceptable. The country’s technological backwardness, its low-level of industrialization, the scale of its domestic market and the youth bulge all suggest that it is punching much below its weight. There is economic potential that is not being exploited if a virtuous growth spiral could be catalyzed through policy action that attracts much needed foreign direct investment into industry and infrastructure that promotes the diversification and technological upgrading of exports and helps integrate Pakistani firms more closely with global supply chains. Although the flow of FDI from China has been modest to date, once China begins offshoring more of its labor-intensive manufacturing activities, Pakistan’s textile, leather, white goods and auto industries could stand to benefit. During the medium term, China’s FDI can indirectly assist Pakistan’s industrialization by helping to ease transport and energy constraints. However, by the second half of the decade, increased Chinese FDI in light manufacturing could be induced if much needed policies are implemented.
The International Growth Centre is a policy research consortium directed by London School of Economics and Oxford University with support from the Department for International Development. The IGC Pakistan office is based at Lahore University of Management Sciences. The country team includes Resident Country Director Dr. Naved Hamid, Lead Academics Dr. Ali Cheema and Dr. Asim Khawaja and In-Country Economists, Yasir Khan and Hina Shaikh. The team is led by Country Director Dr. Ijaz Nabi.
For further information please contact Yasir Khan, In-Country Economist ([email protected])

2
Executive Summary
Following the example of several of the successful East Asian economies, Pakistan could promote the deepening, diversification and technological sophistication of its tradable sectors by increasing the flow of FDI. As the East Asian experience (and other international experience as well) has demonstrated, FDI augments local resources, gives rise to spillovers, can induce local producers to ascend quality ladders, multiples linkages with global value chains and improves access to foreign markets.
In 2000, FDI in Pakistan from all sources was $322 million. Since then the volume of FDI in Pakistan swelled to $5.4 billion in 2008 before dropping to $3.7 billion in 2009 and $1.7 billion in 2011. As a percent of Pakistan’s GDP, FDI was less than 1 percent through 2004; it rose to a still modest 3.57 percent in 2006/7 and has since dropped back to under 1 percent. The biggest investors for the past decade have been the U.S., the UK, Netherlands, the UAE, and Switzerland. The bulk of FDI has been concentrated in six sectors these being in order of priority: communications, finance, oil and gas, power, petroleum refining and trade. Other subsectors and in particular, the key export oriented ones such as textiles, leather goods, ceramics, metal products, rubber products, and chemicals, have attracted little FDI. Foreign investors also largely neglected medium tech industries with good export potential such as electronics, electrical machinery, machine tools, transport equipment, and pharmaceuticals. Even in the peak years – 2004 and 2007, manufacturing attracted less than 20 percent of FDI from all sources.
China’s share of total FDI is small. It was a sizable $700 million in just a single year 2006-7 and by 2010-11 had tailed off to $47 million. As a share of total FDI, China accounted for a very small fraction – less than 0.5 percent in most years - except in 2006/7 when briefly its FDI rose to 14 percent of the total. The stock of Chinese investment in Pakistan reached $1.37 billion in 2010 (a miniscule percentage of China’s total overseas investment) and flows in 2011 and 2012 have been meager. Much of this investment is in the power sector, with infrastructure (ports and highways), telecommunications, mining, and trade attracting smaller amounts. With China’s overseas FDI rising rapidly, attracting more of this capital would be to Pakistan’s advantage and especially so if Chinese FDI were to strengthen the garments industry, and facilitate the upgrading of other tradable activities.
Relative to other sources of FDI, China may be Pakistan’s best bet for three reasons: it is likely to be the principal driver of global growth and South-South trade with China as the principal axis, is on a rising trend as against trade with Pakistan’s traditional trading partners – the U.S. and the Eurozone. Second, China has the capital to export now and in the future and some of its firms are spreading their wings and seeking overseas production bases. Third China is now competing for the more profitable parts of supply chains and considering vacating some of the low value adding processing activities. Firms in Pakistan and Vietnam might well displace Chinese producers in value chains controlled by Chinese MNCs.

3
Two of China’s most remarkable achievements and the ones that Pakistan can most usefully learn from are the extraordinary rapidity with which it absorbed new production technologies in a wide range of manufacturing subsectors, raised industrial productivity, and created dynamic production clusters in newly emergent industrial cities; and managed to dramatically increase the share of medium and high tech exports in handful of years.
In seeking to enhance the flow of FDI from China, Pakistan can capitalize on four factors. x Pakistan’s tightening trade relations with China, which are closely linked to FDI. In recent
years, China’s exports to Pakistan have been buoyed by FDI in transport infrastructure, trade facilitation, the power sector and telecommunications and through close ties with the Pakistan’s military industrial complex;
x Mineral resources, principally, copper, coal, iron ore, zinc, chromite and lead which are found in Sind and Baluchistan;
x China’s interest in furthering Pakistan’s development and the political stability of its border regions, a process that would serve China’s strategic and energy security interests;
x And the exploiting of Pakistan’s potential as a market and a platform for manufacturing activities that China could transfer overseas as its labor costs rise.
The incentives Pakistan is offering foreign, including Chinese investors, are comparable to
those of its competitors and further sweetening of the terms is unlikely to make a material difference to FDI flows. International and Pakistan’s own experience suggests that the direct and spillover benefits from FDI would be magnified if it could reinforce private and public efforts to boost industrial capabilities in five respects: x Equipment modernization and automation (CAM) so as to raise quality, productivity and
flexibly respond to small lot orders and short deadlines; x Training of workers, supervisory staff and management including in the use of the latest ICT
without which participation in global value chains is a stretch, and of hedging techniques to cope with market volatility;
x R&D in products and processes (this would promote diversification, raise quality and introduce green technologies) but also upstream in agriculture so as to improve the cotton varieties grown in Pakistan. Advances in design through greater use of CAD would enable producers to ascend quality ladders;
x Marketing and branding to internalize more of the value chain and raise profitability; and x Compliance with labor and environmental standards and adoption of “clean manufacturing”
as a rule
Policy actions focusing on the above could enlarge the gains from FDI, but first more FDI needs to be coaxed into Pakistan. Before that happens certain constraints need to be relaxed. These are not so much economic as political: powerful and entrenched industrial groups want to retain the protection that assures them handsome profits and absolves them of the need to aggressively diversify, innovate and to compete in global markets; government paralysis

4
stymies necessary policy reforms; and the smoldering internal conflicts on Pakistan’s border regions and their impact on domestic security, have rendered the business environment unacceptable to all but the most stout hearted foreign investor and buyers of Pakistan’s products. Until Pakistan rights itself politically and the government credibly commits itself to a long term high growth strategy1 and all that it entails, only a trickle of FDI will materialize from China or elsewhere, and Pakistan will not realize the growth potential inherent in exporting because it will remain an underachieving exporter of ‘value’ textiles and other low tech commodities.
1 There is no dearth of analysis of Pakistan’s ills and what might put the country on the path to prosperity. See Abbas (2011); Cohen and others (2011); Economist 2012; IMF 2012.

5
Introduction
Accelerating and sustaining GDP growth at a significantly higher level than the 5 percent
average of the past sixty years, is a priority for Pakistan. Achieving this in the face of a global
economic sluggishness and domestic headwinds is the country’s major policy challenge2. An
adequate response will require bold policy initiatives including and in particular, with respect to
Pakistan’s international economic relations most notably with China, which has long been an
important political ally and has emerged as Pakistan’s second ranked trading partner (in 2011)
and a source of capital in the form of loans as well as foreign direct investment (FDI).
This paper is divided into four parts: Part 1 takes note of Pakistan’s weakening economic
performance in recent years (discussed at greater length in Annex A), and examines the role an
external partner – in this case China – could play in helping quicken Pakistan’s growth rate
through foreign direct investment 3 and how this would jive with China’s economic objectives
and its overseas investment and aid strategies. Thus far China’s investment in Pakistan has
been relatively small and in export oriented manufacturing sector it has been negligible. FDI in
infrastructure and the resource sector could increase in the near term were the enabling
environment to improve, however, it is questionable whether much Chinese manufacturing is
likely to migrate to Pakistan during the rest of this decade although there is scope in apparel,
2 All but a handful of countries have failed to maintain high growth rates. Since the early 1950s, there have been 83 episodes of growth acceleration i.e. countries raised their per capita growth rates by 2 percent or more for 8 years. However, most of these were short lived. Just 8 countries out of a total of 190 sustained per capita growth rates of 7 percent or more for two decades and another 12 for 15 years. Moreover, performance between decades correlates weakly: countries growing strongly in one decade are likely to regress towards a slower mean rate in the next decade. Among the factors that appear to influence the capacity to sustain growth are the volume of manufactured exports, FDI and avoidance of exchange rate overvaluation. Democratic institutions and a relatively equal income distribution also seem to contribute. See Hausmann, Pritchett and Rodrik (2005); Virmani (2012); and Berg, Ostry and Zettelmeyer (2012). 3 FDI was responsible for export-oriented industrialization of Malaysia, Thailand, Mauritius and the Philippines and made a substantial contribution to China’s own industrial development. In fact, 28 percent of China’s ordinary exports and 84 percent of its processed or assembled exports were MNCs or their joint ventures operating in China (Moran 2011). The World Economic Forum (2012) estimates that as much as 70 percent of China’s exports are attributable to foreign companies. Official estimates arrive at a lower figure of about 53 percent.

6
white goods and the automotive sector4. Nevertheless, Pakistan stands to gain from greater FDI
in non-manufacturing sub-sectors as this would stimulate domestic investment and pave the
way for industrial FDI down the road from China as well as from traditional sources. This is the
focus of part 2. Part 3 explores the prospects for FDI in textiles and apparel and discusses how
this could lead to an increase in domestic value added. Part 4 concludes with a summing of the
policy actions that would induce FDI and crowd in domestic investment into existing and new
leading sectors. Currently social instability, a problematic business environment and political
gridlock tend to negate the incentives on offer to foreign investors. Breaking of the logjam will
require decisive political action – Chinese or other FDI will not begin to flow in the volume
Pakistan needs until certain outstanding political issues are resolved. Once the contending
political entities recognize the seriousness of the crisis Pakistan faces and demonstrate a
willingness to agree on and implement long term developmental goals, economic policies can
acquire traction and begin to produce results.
1. Accelerating Growth by Easing Constraints and Stimulating Trade and FDI
Since 2008, the Pakistani economy has grown at barely 3 percent per annum and
medium term projections are not encouraging. How might Pakistan begin to realize its growth
potential? Systematically tackling a number of key constraints in a sequenced manner would be
a first and necessary step. Some of these can be dealt with in the short term with immediate
results helping to win support for longer term and more difficult reforms and early wins could
begin crowding in sorely needed domestic and foreign investment. Substantially easing power
shortages by solving the triangular debt problem5, curbing urban violence and taking initial
steps to enhance government revenues and enforce fiscal discipline would set the stage for
longer term reforms, stimulate private investment and provide the government with the
resources to finance much needed developmental spending. Improving the competitiveness of
4 In other words whether we can expect a replay of the East Asian flying geese model with a South Asian country following in the footsteps of China, the goose in the lead. 5 This will be a first step. It will need to be followed up with an adjustment of tariffs, increased investment in power generation and distribution (especially hydro and nuclear) and better local level management so as to contain inefficiencies, chronic losses and problems of tariff collection.

7
the business environment in particular by dismantling the many barriers that entrench existing
producers and curb competition, and remedying some of problems that affect the quality of
logistics, are medium term measures that can be initiated once the reform process has gained
traction and acquires momentum. Most difficult and time consuming will be the reforms that
correct the grave deficiencies bedeviling institutions especially legal and regulatory ones; create
a robust growth- promoting, financial system; and build the education, vocational training and
research capabilities that Pakistan will need if it is to move up the value chain and sustain
growth.
The medium term reforms listed above can be the means of initiating a growth spiral if
they are complemented by additional policy measures that attract a much larger volume of FDI
to Pakistan. The experience of successful economies such as Thailand, Malaysia, Singapore,
Vietnam, Mauritius and China all underscore the catalytic and transformational role of FDI in
the 1970s through the 1990s6. Each of these countries was able to enter a stage of export led
industrialization largely because of FDI. Given Pakistan’s straitened current circumstances – and
its inability to emerge from low-level industrial trap even though it was on par with Korea in the
1960s – only FDI might conceivably impart the urgently needed boost, and China in the medium
and longer term may be able to provide the volume of resources and (appropriate)
technologies to put Pakistan on a high growth trajectory.
That exports can drive growth by generating demand, inducing technology transfer,
subjecting firms to competitive pressures and helping raise productivity, is now so well
established that it scarcely bears repeating. Export-led growth led by the manufacturing sector
largely accounts for the East Asian Miracle during the 1970s and the 1980s and partly explains
China’s performance in the 1990s and through 20077.
6 The emergence and growth of an apparel exporting industry in the coastal regions of China is described by Abernathy and others (1999). 7 It also underlies the performance of several Southeast Asian countries ad of Korea and Taiwan (China) to the present day.

8
Korea and Taiwan initially followed inward looking and protectionist strategies that
were the norm in the 1950s and 1960, but shifted their stance as the limits of the domestic
market and foreign exchange constraints made it imperative to search for overseas markets8.
Korea adopted the “Export Number 1” slogan in 1964 and followed this with a devaluation of
the won, a 50% reduction on the taxation of profits from exporting and a lowering of interest
charges on export financing (Mah 2010). Subsequently, its exports/GDP ratio rose from 8
percent in 1962-66 to 43 percent in 1997-2001. For Singapore and Hong Kong, the smallness of
the domestic economy rendered trade a necessity from almost the very outset. The attractions
of export led growth were reinforced starting in the late 1960s9 by an expanding global
economy and by the dismantling of barriers to trade10.
East Asian economies initially relied on exports of light manufactures11 – textiles,
footwear, leather goods, processed foodstuffs, plywood, rubber products, light consumer
electronics and toys. Market entry and penetration were facilitated by tacit knowledge and
manufacturing skills built up through a first round of production for the domestic market,
through aggressive pricing made possible by domestic cost advantages and exchange rate
policies alongside the rapid assimilation of production technologies imported from abroad.
Complementing the efforts of East Asian exporters was the search by United States-based retail
chains for lower-cost overseas sources of supply for standardized consumer products12. These
factors together enabled East Asian firms to enter a virtuous spiral, which they exploited, to the
8 The early protectionist phase arguably enabled Korea, Taiwan, Thailand and Malaysia to build a disciplined, manufacturing workforce and manufacturing capabilities that proved to be attractive to MNCs. 9 West Germany and Japan were among the earliest exemplars. 10 This process commenced with the GATT in 1949 and was implemented through a succession of trade rounds reaching an apogee with the (8th) Uruguay Round signed in 1994. 11 There is a compelling correlation between GDP growth and manufacturing value added (UNIDO 2009). Dani Rodrik (2012) maintains “all of the successful economies of the last six decades owe their growth to rapid industrialization. Manufacturing enables rapid catch-up because it is relatively easy to copy and implement foreign production technologies, even in poor countries suffering from multiple disadvantages. Manufacturing industries tend to close the gap with the technology frontier at the rate of about 3 percent per annum regardless of policies, institutions or geography. http://www.project-syndicate.org/commentary/no-more-growth-miracles-by-dani-rodrik 12 See Basker and Pham on the Wal Mart effect (2007) http://ideas.repec.org/p/umc/wpaper/0506.html; Gereffi (2002) on buyer driven supply chains for clothing and other light manufactures; http://www.colorado.edu/IBS/PEC/gadconf/papers/gereffi.html

9
full through focused learning by doing13 that augments production capability and by exporting.
Very soon they began investing in modern equipment so as to improve quality, upgrade their
product range and to engage in product diversification embracing medium and higher tech
metallurgical, chemical, electronic, transport products and household consumer durables. This
process of diversification and the steady widening of export beachheads in advanced
economies, enabled a progressive increase in domestic value added and was reflected in the
growth performance14. Throughout, the principal driver of growth was the manufacturing
sector.
Although globalization that greatly widened trading opportunities has crested and may
even be on the wane15, for “lagging industrializers” such as Pakistan, exports (of manufactures)
remain vital source of demand and a necessary means of realizing and augmenting current
growth potential. But export-led growth acceleration will remain beyond Pakistan’s reach so
long as it remains focused on low value garments, textiles, leather goods, carpets and
processed food. These products are the ones that can contribute to an export surge during the
balance of the decade and should remain in Pakistan’s export portfolio but as was the case with
East Asian economies, their share of total exports needs to decline and more of Pakistan’s
exports should be comprised of higher value manufactures (including garments and technical
textiles) the demand for which is rising more rapidly and which promise higher profit margins to
exporters than traditional light manufactures16. In short, industrial and export diversification
will be critical to a growth strategy that derives substantial impetus from exports17. It is in
realizing this strategy that China could assist Pakistan.
13 See Khan (2010). 14 See Harding and Javorcik (2011). 15 Hufbauer and Suominen (2010). With the Doha Round stalled and seemingly moribund, regional and bilateral arrangements are whittling away at some of the remaining barriers. However, the slowing of the global economy in 2011 has raised the specter of murky protectionism and worse. See Baldwin and Evenett (2009). 16 It is noteworthy that one of Pakistan’s leading industrialists, who may well be reflecting the views of his peers, doubts the wisdom of diversifying away from textiles and fertilizers. See Financial Times, 2012, August 11th. FT Lunch with Mian Muhammad Mansha. 17 The empirical case for diversification by low-income countries is presented by the contributors to Newfarmer, Shaw and Walkenhorst (2009); and by Carrere, Strauss-Kahn and Cadot (2011). While much

10
2. Determinants of China’s External Economic Relations
China is the only country to have achieved a per capita GDP growth rate of more than 7
percent for over two decades and although growth is likely to slow somewhat as the country
enters its fourth decade of relentless expansion, GDP may continue increasing at 5-7 percent
per annum during the balance of the decade. China is currently embarked on a process of
economic rebalancing which entails a diminishing reliance on exports as a source of growth,
and increasing the share of domestic consumption. This process of rebalancing and of structural
change is likely to increase import demand and in time, to induce some overseas migration of
Chinese industry supported by a rising tide of Chinese FDI18. Pakistan could be one of the
beneficiaries of trade with China and Chinese FDI. How much benefit it derives will be a
function of China’s FDI and trade strategies and Pakistan’s responsiveness to the opportunities
that may be in the offing.
Trends in OFDI and Pattern
What are the factors shaping China’s FDI and how might closer economic ties be to the
mutual advantage of both countries?
China made a slow start at investing overseas in the late 1970s with the establishment
of the China International Trust and Investment Company (CITIC) in 1979, followed by a
cautious overseas push by Sinotrans (the Chinese logistics company) and the specialized trading
company, China National Metals and Minerals Import and Export Corp. (Minmetals). Between
1982 and 1985, the overseas stock of FDI had risen from $44 million to $900 million. A further
of the growth can be at the intensive margin, for low-income countries with a limited basket of low value exports, a broadening of the export offerings can be a necessary to growing export earnings. Diversification can lead to the discovery of “big hits” or major export successes to individual or a few major markets, which can substantially boost export revenue. Easterly and Reshef (2010). Examples are the export of fish (Nile perch) by Uganda to the UK, the export of ceramic bathroom and kitchen items by Egypt to Italy, and the export of women and girls’ cotton suits by Fiji to the U.S. 18 Japan, Korea and Taiwan have all used FDI to strategically disperse their industries in line with changing domestic comparative advantage and to acquire overseas assets.

11
easing of restrictions on overseas investments through the late 1990s19 was followed by the
introduction of the “Go Global” policy in 1999-2001. Until this point nearly 60 percent of
China’s investment was in North America, Australia and Europe, the balance was in developing
countries. “Go Global” led to a marked shift in FDI towards Africa, Latin America and Southeast
Asia. Accession to the WTO in 2001 initiated another surge in overseas investment and Chinese
foreign assistance with a continuing focus on developing countries (see Figure 3). With the start
of the 12th FYP (2010 – 2015), the Go-Out strategy has received additional impetus with Chinese
companies being encouraged to seek overseas investment opportunities, a process that is
reinforced with the steps being taken streamline the approval process, provide subsidies and
tax breaks, make available risk assessment and insurance services, to redouble the support
provided by the EX-Im Bank and other commercial banks20, to internationalize the renminbi –
and by the strengthening of the Chinese currency.
In the post 2001 period 77 percent of Chinese FDI was in developing countries21. Annual
FDI outflows estimated at $5.5 billion in 2004 had risen to $68 billion in 2010 and by that year22,
China’s overseas stock was pegged at almost $300 billion23 spread over 177 countries or
territories. Tables 1&2 below provide snapshots of the sectoral and the geographical
distribution of China’s OFDI. Over 79 percent of investment is in services of various sorts with
leasing and commercial services dominating the rest. Manufacturing somewhat surprisingly
accounts for just 17.8 percent and mining for 14 percent of the total. By 2007/8 more than
19 By 1996, China’s overseas FDI stock had risen to $18 billion, exceeding that of Korea and Brazil. Cheng and Ma (2007). 20 Salidjanova (2011). 21 Voss, Buckley and Cross (2011). China’s overseas investment were aided and facilitated by the creation of an African investment Fund and in 2007 by a Sovereign Wealth Fund (the China Investment Corporation) with $200 billion in assets, that have since grown to $410 billion. 22 Although mineral resource deals and the creation of wholly owned subsidiaries attract media attention, more of China’s FDI is taking the form of M&A deals which provide access to technology, brands or markets. Salidjanova (2011). Earlier deals such as TCLs investment in Thomson Electronics, and SAIC’s takeover of Ssangyong were unsuccessful, but companies have persisted and more recent M&As are proving to be more rewarding. See Williamson and Raman (2011). 23 Virtually every publication on China’s OFDI comments at length on the difficulty of arriving at precise figures, notes the partial nature of official statistics and maintains that official statistics underestimate the true amount. See for example Rosen and Hanemann (2009); Davies (2012); Cheng and Ma (2007); Scissors (2011).

12
7,000 Chinese firms were engaged in overseas ventures with 1,500 firms exploring overseas
opportunities each year many of them being small private firms24. The top 5 Chinese non-
financial overseas investors (in 2010) were the China Petrochemical Corp., China National
Petroleum Corp. China National Offshore Oil Corp. China Resources Holdings Corp. and China
Ocean Shipping25. In fact the top 20 are mostly resource based, transport, or construction
companies, China UNICOM, China Mobile, SinoSteel and the CITIC Group being the exceptions.
China’s leading manufacturing firms in telecommunications, auto and computer industries, are
lower down the list: ZTE Corp is in 23rd place, Geely in 25th place, Legend ranked 26th and so
on26.
Research reported by Lipsey and Sjoholm (2011) and Salidjanova (2011) indicates that as
much as 70 percent of the stock of FDI in developing Asia (South and South East Asia through
2008, originated directly and indirectly (via tax havens27 and Hong Kong) from developing
countries, primarily China28 and the trend points to a continuing significance of South-South FDI
a departure from the North-South FDI of yesteryear. Lipsey and Sjoholm (2011) also cite
evidence suggesting that FDI from East Asia to other Asian countries reflects a pattern found
elsewhere in the world which is that large countries are responsible for more FDI; as geographic
distance increases FDI flows decline; and FDI complements bilateral trade flows. In other words,
China is more likely to invest in neighboring countries and especially ones with which it has
strong trade ties.
24 Rosen and Hanemann (2009). 25 Davies (2012) has CITIC and China Ocean shipping heading the list in 2008. 26 Economic Watch 2011. 27 These are principally the Cayman Islands, the British Virgin Islands both of which are large recipients of capital flows from China. Hong Kong was by far the largest recipient of Chinese OFDI followed by the British Virgin Islands, Cayman Islands, Australia, Singapore and the U.S. (2009). Salidjanova (2011). 28 Davies (2012) estimates that 72 percent of China’s FDI is in Asia ($228 billion in 2010).

13
Figure 3: China’s OFDI: Policies and Trends
Source: Thilo Hanemann, Changing patterns of Chinese Outward FDI, Stanford Center for International
Development, December 6th 2011.

14
Table 1. Sectoral Distribution of China’s OFDI29
29 See Davies (2012)
15
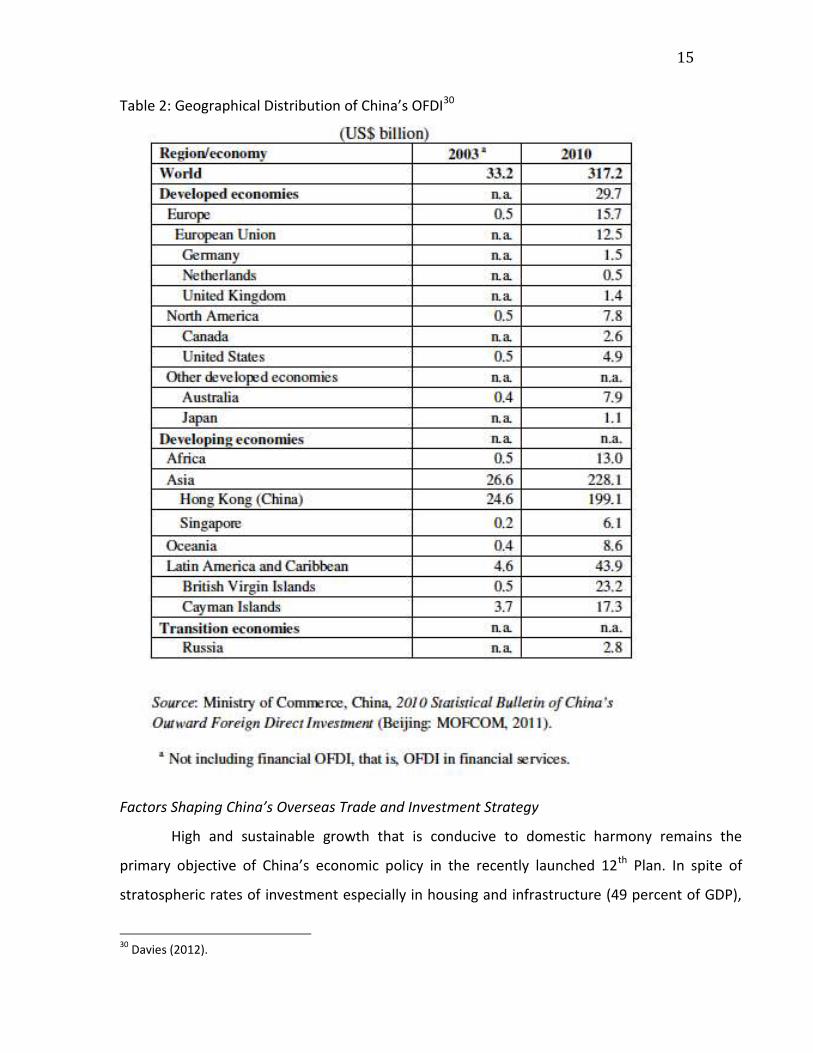
Table 2: Geographical Distribution of China’s OFDI30
Factors Shaping China’s Overseas Trade and Investment Strategy
High and sustainable growth that is conducive to domestic harmony remains the
primary objective of China’s economic policy in the recently launched 12th Plan. In spite of
stratospheric rates of investment especially in housing and infrastructure (49 percent of GDP),
30 Davies (2012).

16
the economy has slowed to a below 8 percent rate in 2012 and could drop further. A rate
approximating 7 – 7.5 percent during the balance of the decade is the desired target as it is
assumed to generate enough employment to absorb new entrants and workers transferring
from the rural sector. Looking forward, investment is expected to decline and the expectation is
that domestic consumption (that accounted for 35 percent of GDP in 2011) will close the
demand gap. But there is considerable uncertainty regarding the future trend in consumption
as it has been increasing at a solid 8 percent per annum in real terms and a faster increase
might only materialize if there is a significant easing of financial repression, a partial transfer of
corporate savings to households through a reform of dividend policies, and a strengthening of
the safety net for urban as well as rural households that leads to a shaving of the 26 percent
rates of private saving. Domestic consumption may displace investment and exports as the
driver of growth in due course but barring unforeseen developments, China will need to rely in
investment and exports to meet its medium term growth objectives. Hence one hinge of
China’s international economic policy is the diversification of export markets to lessen its
reliance on slow growing and crisis beset OECD countries without having to shrink the share of
manufacturing in GDP during the course of this decade (34 percent in 2011). Increased trade
with LICs and MICs can enable China to maintain the tempo of its manufactured exports.
A second hinge of China’s international economic policy is the desire to capture a bigger
share of the export value chain by moving both up stream into R&D, innovation, product
design, branding and manufacture of key high value components, and downstream into
marketing, distribution, retail and customer relations. In short, Chinese producers much like
their foreign counterparts are eager to exercise greater control over more of the supply chain
than they currently do and in the process extract more of the quasi rent/profit. The heavy
overseas investment in down stream services, including leasing is explained by the desire to
establish or widen bridgeheads in new or existing markets with the help of such investment so
as to facilitate the export of products and to capture the profit from complementary services.

17
A third hinge is the export of construction services and equipment and of labor to work
on overseas projects31. Channeling semi-skilled workers overseas takes some of the pressure of
Chinese local authorities to find jobs and absorbs the surplus capacity in China’s huge
construction industry32. The development of transport infrastructure in China’s trading partners
in Asia33, Africa, and Latin America provides an avenue for exporting services, construction
equipment, cranes and cargo handling machinery34, and other material inputs manufactured in
China, it also strengthens transport infrastructure in these countries facilitating both trade and
FDI. By reducing costs (including inventory costs)35 and enhancing capacity to handle and ship
products in a timely manner, and compressing cargo dwell times in ports, infrastructure
development is closely correlated with trade. Modern infrastructure, properly maintained is the
long-term advantage of developing countries36. In the near term, Chinese exporters are the
biggest gainers. China’s revenue from overseas construction activities encompassing 160,000
contracts rose steeply from $11 billion in 2002 to $57 billion in 200837.
A fourth hinge of China’s overseas economic strategy is the quest for raw materials to
fuel China’s urban industrial development. Already China is the largest consumer of coal,
copper, iron ore, nickel, cement, wood products and other resources and the second largest
consumer of petroleum. Securing supplies of vital mineral resources through investment in new
mines and oilfields, acquiring ownership rights in existing production sites and entering into
31 Chinese companies find it far easier to work with a Chinese workforce than to hire, train and communicate with local workers. Exporting labor also eases the mismatch between the domestic labor supply and demand especially now that the construction boom might be easing. 32 China’s construction firms signed $2.5 billion worth of contracts in 1990. By 2010, this had risen to $134.4 billion, although growth slowed to 6.5 percent in 2011 from an average of 20 percent in the preceding years. See Lin and Bai (2011). 33 As China’s firms have improved their technological skills, they have begun competing for more sophisticated projects recently winning the contract to construct the high-speed rail link between Mecca and Medina, as well as the contract to build a bridge connecting San Francisco with Oakland. http://www.ft.com/intl/cms/s/0/3529578c-d7f9-11e0-a5d9-00144feabdc0.html#axzz1zy34fUyT 34 Shanghai Zhenhua Heavy Industries is the largest supplier of such equipment in the world. And CIMC is the world’s leading manufacturer of shipping containers. 35 Datta (2012) shows how firms that have benefitted from India’s Golden Quadrilateral have cut their costs. 36 That trade facilitation through the development of soft (transparency, customs management) and hard infrastructure (transport, port facilities, ICT) promotes export performance is empirically demonstrated by Portugal –Perez and Wilson (2011). 37 Rosen and Hanemann (2009).

18
partnerships with other producers so as to gain access to material inputs from multiple sources,
has become an abiding concern of China’s policymakers38. It has induced Chinese companies to
venture far afield and to take on projects deemed too risky by firms from other countries.
However, on balance, China shows no signs of attempting to monopolize and to control global
supplies of raw materials. In fact, as Moran (2010, p.2) points out, China’s FDI in natural
resource extraction is serving to “expand diversify and make the global supply system more
competitive”.
In addition to increasing its current mix of exports and enlarging its control over the
value chain for these products, China is determined to diversify into high tech products and to
technologically upgrade its export basket. In order to telescope the time needed to do this,
China is making haste to develop domestic technological capabilities by investing 1.89 percent
of GDP (2011) in R&D so as to accelerate technology assimilation from abroad and create
indigenous innovation capacity. It is actively engaged n acquiring technologies through licensing
and it attempts to maximize technology transfer through FDI by MNCs. All these have yielded
substantial dividends. Technological catch-up has been little short of phenomenal. However, in
pursuit of its efforts to become the equal of the world’s most innovative nations in the course
of this decade, China has also embarked on a far-reaching effort to acquire the most advanced
still uncodified technologies and associated tacit knowledge by taking over or investing in
foreign firms that have valuable intellectual property, sophisticated production technologies,
design expertise, a brand name or a sizable global market share. In recent years, Chinese firms
have purchased numerous European and American firms with world-class technologies or other
assets. This is the fifth hinge of China’s overseas FDI39.
38 Acquisition of agricultural land particularly in Africa so as to assure supplies of grain and oilseeds is part and parcel of China’s overseas FDI strategy – and one it shares with middle-eastern countries. This is controversial and arouses suspicion in recipient countries. 39 The media can exaggerate China’s efforts in this area and the salience of Chinese firms in the international sphere. Nolan (2012) offers a balanced commentary on what Chinese firms have achieved to date and where they stand with respect to their foreign competitors.

19
Chinese FDI also serves the country’s security concerns: securing oil supplies,
safeguarding sea lanes, helping maintain the stability of neighboring countries so that their
problems do not spillover into China’s own border areas, are all objectives that that can be
furthered through commercial (dual purpose) FDI. In enabling countries to exploit their mineral
resources or build infrastructure, China is helping safeguard its own security, cementing
alliances and accumulating international influence. This then is the sixth and final hinge of what
is a typically multi-faceted strategy implemented through a variety of channels public and
private.
To summarize, China’s overriding objective is the rapid development and technological
modernization of its economy and achieving this increasingly involves investment overseas,
technological borrowing, and a tightening of its trade linkages with countries that are likely to
be important strategic partners because of geography, market size or natural resources. OFDI
offers an avenue for sustaining export growth; for building and controlling value chains in
products where China has a comparative advantage or is acquiring it; for improving access to
mineral and other natural resources; for stimulating technology acquisition and innovation
capabilities; and for strengthening China’s political leverage in the international sphere.
Inevitably, China will pursue its own interests, however, in doing so it can also serve those of
Pakistan where they intersect or can be made to intersect with China’s.
3. FDI and Growth: Pakistan’s Experience
As noted above, TFP gains stem mainly from competition-induced improvements in
efficiency, technology transfer and innovation40. A wealth of research has established that trade
and FDI promote TFP through each of these channels41. Trade aside from exposing firms to
40 TFP differences among countries are greatest in the more technologically advanced and R&D intensive manufacturing industries and FDI can be instrumental in closing these gaps. See Fadinger and Fleiss (2011). 41 The impact of FDI can be decomposed into a number of components these being: economic value added (e.g. total VA and capital formation, export generation and fiscal revenues); job creation ; and

20
competition and encouraging technology absorption also allows firms to benefit from scale
economies often not available in narrow and quickly saturated, domestic markets. FDI is a
conduit for capital, for embodied technology (that shifts the production frontier), soft skills and
tacit knowledge that firms need to raise efficiency as well as quality (thereby moving closer to
the production frontier) and to reduce wastage and defect rates42. Throughout East Asia and
most notably in China, FDI has assisted firms to climb technology ladders and is associated with
increasing TFP and greater product sophistication43. With services now accounting for the lion’s
share of GDP in virtually all countries and for a third of exports (nearly half of all exports in
value terms), FDI in services, is also enabling recipient countries to diversify their exports and
services complement and add value to the export of manufactures44. Thus empirical research
endorses trade liberalization as a means of augmenting productivity and a dismantling of trade
restrictions triggers other policies and institutional changes that buttress economic
performance45. Similarly, FDI can be a powerful growth enabler that is attracted by a country’s
openness to trade and that in turn can reinforce export –led growth. FDI is a source of capital
that tends to be scarce in many LICs, Pakistan included. It is responsible for technology transfer
and vertical technology spillovers. When it comes to jump starting growth in Pakistan through
export oriented industrialization and complementary infrastructure development, FDI can
arguably46 offer the leverage that Pakistan requires to initiate a growth spiral– and absent a
substantial dose of FDI and the endorsement it would provide that the country is on the path to
recovery, no other medicine is likely to suffice. The question is: could China be a substantial
source of FDI and would this investment lead to the industrial widening, export diversification
implications for sustainable development (e.g. social impact, environmental implications, technology transfer and effect on job skills). See http://www.antiessays.com/free-essays/294117.html 42 Yao and Wei (2007). 43 Xu and Lu (2009) show that product sophistication depends on whether a firm is a wholly owned subsidiary of a foreign company. Chinese owned companies are lower on the scale of sophistication. On FDI spillovers in China, see Ito and others 2012. 44 Francois and Hoekman (2010); Fernandes and Paunov (2012). 45 Winters (2004). 46 The endorsement of FDI as a driver of growth needs to be hedged because East Asian experience aside, the findings from cross country and firm level research remains somewhat equivocal. It is impossible to claim categorically that FDI will accelerate growth – but then it is difficult to be categorical about other growth drivers as well. See the surveys of the literature in Carkovic and Levine (2002); Cipollina and others (2011); Adams (2009); and Contessi and Weinberger (2009).

21
and global market penetration that Pakistan has failed to realize thus far? Moreover, would it
bring with the combination of technology transfer, spillovers and product upgrading that will
spring Pakistan from the low level industrial trap in which it has languished for the past three
decades? The answer spelled out below is that Chinese FDI is not likely to be a silver bullet,
however, in conjunction with a number of domestic policy initiatives, it might impart the
growth impetus that Pakistan sorely needs.
The recent history of trade FDI between China and Pakistan is the backdrop against
which future possibilities can be explored. The point to be noted at the outset is that currently,
South Asia accounts for a small part of China’s overall trade. Between 2000 and 2010, South
Asia’s trade with China grew at a 32 percent rate from $5.7 billion to $80.5 billion with India the
dominant player accounting for 78 percent of the total or $61.7 billion). But this amounts to
only 5 percent of China’s trade with the Asia Pacific region although it is a much larger share of
South Asia’s trade with the rest of the world. Trade with Pakistan grew from $2 billion in 2002
to $8.7 billion in 2010 with the increase since the middle of the decade helped by an FTA
negotiated in 2006 that lowered customs duties. In 2010, Pakistan exported $1.73 billion worth
of textiles and minerals to China and imported chemicals, machinery, telecommunications
equipment and white goods worth $6.94 billion47.
In 2000, FDI in Pakistan from all sources was $322 million48. Since then the volume of
FDI in Pakistan swelled to $5.4 billion in 2008 before dropping to $3.7 billion in 2009 and $1.7
billion in 2011. As a percent of Pakistan’s GDP, FDI was less than 1 percent through 2004 rose to
a still modest 3.57 percent in 2006/7 and has since dropped back to under 1 percent. The
biggest investors for the past decade have been the U.S., the UK, Netherlands, the UAE, and
Switzerland. China’s share is small. It was a sizable $700 million in just a single year 2006-7 and
by 2010-11 had tailed off to $47 million. As a share of total FDI, China accounted for a very
small fraction – less than 0.5 percent in most years - except in 2006/7 when briefly its FDI rose
to 14 percent of the total. The bulk of FDI has been concentrated in six sectors these being in 47 The actual imports from China might be higher. 48 This data is based on Annex 2 Tables 1-4

22
order of priority: communications, finance49, oil and gas, power, petroleum refining and trade50.
Other subsectors and in particular, the key export oriented ones such as textiles, leather goods,
ceramics, metal products, rubber products, and chemicals, have attracted little FDI. Foreign
investors also largely neglected medium tech industries with good export potential such as
electronics, electrical machinery, machine tools, transport equipment, and pharmaceuticals.
Even in the peak years – 2004 and 2007, manufacturing attracted less than 20 percent of FDI
from all sources.
The stock of Chinese investment in Pakistan reached $1.37 billion in 2010 (a miniscule
percentage of China’s total overseas investment) and flows in 2011 and 2012 have been
meager. Much of this investment is in the power sector, with infrastructure (ports and
highways), telecommunications, mining, and trade attracting smaller amounts. The relatively
limited flows of FDI in Pakistan from the rest of the world are attributable according to Khan
and Khan (2011, p.13) to “institutional weaknesses, corruption, ineffective legal institutions,
political uncertainty, ineffective legal institutions, weak regulatory systems, and low labor
productivity”. The tapering of FDI since 2008-9 can be traced to the upsurge in violence and
crime that the security forces have had difficulty checking. Starting from this low base and given
the economic interests of both Pakistan and China, how might Chinese FDI benefit Pakistan and
how might Pakistan enhance Chinese investment in areas that would contribute to long-term
growth?
Four factors are likely to draw Chinese investment in the light of the above brief review of
China’s overseas investment strategy.
x Pakistan’s market for China’s exports that is already being tapped through investment in
transport infrastructure, trade facilitation, the power sector and telecommunications and
through close ties with the Pakistan’s military industrial complex;
49 Privatization and financial liberalization pulled in FDI. 50 Khan and Khan (2011).

23
x Mineral resources, principally, copper, coal, iron ore, zinc, chromite and lead which are
found in Sind and Baluchistan;
x Infrastructure development to further Pakistan’s growth and the political stability of its
border regions and increase its integration with the China, a process that would serve
China’s strategic and energy security interests;
x And the exploiting of Pakistan’s potential as a platform for manufacturing activities that
China could transfer overseas as its labor costs rise.
All these might serve Pakistan’s development objectives also, although given the large
trade deficit with China, it is in Pakistan’s interest that trade becomes a two way street and that
the development of energy and transport is fully aligned with Pakistan’s strategic interests.
However, from Pakistan’s growth perspective the benefits accruing from Chinese FDI and closer
economic relations are in the sphere of industrialization and the deepening of export and
technological capabilities.
Two of China’s most remarkable achievements and the ones that Pakistan can most
usefully learn from are the extraordinary rapidity with which it absorbed new production
technologies in a wide range of manufacturing subsectors, created dynamic production clusters
in newly emergent industrial cities; and managed to graduate within a handful of years from
low tech exports to medium and high tech products and to climb product ladders. As Peter
Schott and others have shown, China’s exports now almost completely overlap with those of
the advanced OECD countries except that China’s products are of a lower quality and in a lower
price range51. Having mastered the most advanced technologies in many areas, China is now
attempting to move up the supply chain and become an innovator and designer of products
and not just the manufacturer or assembler of products conceived and developed by others.
Pakistan’s greatest industrial deficit is in the area of industrial capabilities, which has inhibited
the diversification into product groups with long quality ladders52. In part this is the outcome of
51 Hanson (2012); Schott (2006) faculty.som.yale.edu/peterschott/files/research/papers/chinex_310.pdf 52 Lederman and Maloney (2012) maintain that what matters more is not what countries produce but how firms produce and their technological capabilities.

24
a protected and insufficiently enabling domestic business environment but equally it can be
traced to the paucity of FDI in manufacturing industries. Whether China is positioned to begin
transferring segments of its industries to countries such as Pakistan in the process displacing
some of its investment in Vietnam, Cambodia and other Southeast Asian countries is an open
question. Also uncertain is China’s capacity to transfer ‘appropriate’ technology to Pakistan,
when past cross-country and Chinese experience suggests that technology flows have generally
been from advanced countries with large investments in R&D to developing countries – China
itself having profited most from FDI embodying technologies devised by the leading OECD
economies. Nevertheless, China may be Pakistan’s best bet for four reasons: it is likely to be the
principal driver of global growth and South-South trade with China as the principal axis, is on a
rising trend as against trade with Pakistan’s traditional trading partners – the U.S. and the
Eurozone. Second, China has the capital to export now and in the future and some of its firms
are spreading their wings and seeking overseas production bases. Third China is now competing
for the more profitable parts of supply chains and considering vacating some of the low value
adding processing activities. Firms in Pakistan and Vietnam might well displace Chinese
producers in value chains controlled by Chinese MNCs. Fourth, China is targeting markets in the
Middle East, Africa and Latin America now that the growth potential is draining from its
traditional OECD markets, and countries such as Pakistan could be large markets in their own
right and regional production hubs for Chinese producers. Fifth and finally, China is keen to
export its own model of development that is based on urban-industrial development often
germinating around special economic zones.
4. Gains from FDI and China’s Potential Role
Pakistan and China began engaging in a systematic dialogue on economic issues starting
with the creation of the Joint Committee of Economy, Trade and Technology in 1982. The FTA,
which came into effect on July 1st 2007, marked a major step and the two countries are aiming
to raise the volume of trade to $15 billion by 2015. China’s major investments in Pakistan

25
include the Chashma nuclear power plant, the Karakorum Highway, the Saindak copper and
gold mine53, the 1st Phase of the Gwadar port project and the acquisition of Paktel by China
Mobile. However, as noted above, investment in manufacturing has lagged and it is by helping
build Pakistan’s industrial and technological capabilities that China could most directly
contribute to Pakistan’s growth.
In recent years much has been made of the rising wages in China that are eating into the
profits of firms manufacturing low value garments and footwear. Although China is some
distance from the “Lewis turning point” and the transfer of rural workers to the urban sector
will continue, the expectation is that China much like Japan, Korea and Taiwan (China) will be
offshoring some of its industries. This process has already begun with Chinese firms establishing
production facilities in Vietnam, Cambodia54, and Ethiopia, and exploring possibilities in the
Philippines and Bangladesh55. Garment and footwear manufacturers are attracted by low wages
whereas producers of white goods, and autos are transferring some production/assembly to
Africa, the Middle East, Central Asia, Eastern Europe and even the U.S. in order to gain market
access. Most of the items being produced are commodities using standardized and highly
codified technologies and the technological spillovers are insignificant except perhaps in some
of the African countries. The pace of this transfer is likely to be affected by three sets of factors.
First, high rates of productivity increase in Chinese industry partially offset rising wages
and Chinese firms are still able to contain their wage costs and overheads by moving production
to inland locations. The advantages of vertical integration and minimizing fragmentation of the
value chain also argue in favor of keeping production of items such as men’s shirts, suits and
53 http://en.wikipedia.org/wiki/Saindak_Copper_Gold_Project 54 Cambodia’s neighborhood with its manufacturing capacity and scope for backward and forward linkages gives it regional comparative advantage (Baldwin and Okubo 2012). The creation of a trade cooperation zone in Cambodia, the Sihanoukville Special Economic Zone has also facilitated Chinese OFDI. See Wang, Wu and Yao (2008). 55 China’s largest online clothing retailer, Vancl, is testing the waters by sourcing from Bangladesh on a trial basis. http://www.ft.com/cms/s/0/ea439996-e13c-11e1-839a-00144feab49a.html#axzz23pT2KBHQ

26
outerwear within China as a company such as Esquel has done with shirts56. A consolidation of
global supply chains commenced after the phasing out of the quotas assigned by the Multi-
Fiber Arrangement (MFA) in 2005. Increasingly buyers prefer to deal with fewer larger and
more strategically located suppliers. Rising fuel costs are another factor that are leading to
greater compactness of global value chains (Fernandez-Stark, Frederick and Gereffi 2011;
Draper 201257).
Second, buyer driven value chains such as for apparel, are becoming more and more
exacting as lean retailing has become the rule,58 demanding small lot production, short delivery
cycles,59 frequent changes in designs, steady reduction in unit costs, certification of production
establishments and adherence to labor laws, in addition to high quality, reliability and punctual
delivery. This is easier to ensure from production units and through channels established on the
Chinese mainland although factories in Cambodia, the Philippines and Vietnam60 have shown
that they can meet the requirements of global apparel value chains.
Third, even though wages in Cambodia, Bangladesh and Pakistan are lower than in
China, these are rising rapidly and at times outpacing productivity gains. The frequency of
56 The Hong Kong based Esquel Group is one of the world’s largest producer of high quality men’s shirts supplying retailers such as Brooks Brothers, Nike and Nordstrom. It runs a highly integrated operation, producing much of its own extra long staple cotton in Xinjiang, ginning it in its own mills, and then processing the output in its own spinning, fabric, and cut and sew facilities, before sending the final product to Esquel’s own distribution centers. 57 http://www.voxeu.org/article/shifting-geography-global-value-chains-implications-developing-countries-and-trade-policy. Marks and Spencer intends to stop the cross hemispherical transfer of goods and other European buyers have begun reassessing the total costs of outsourcing to China and elsewhere and to focus on insourcing. 58 Abernathy, Volpe and Weil (2006, p. 2216) describe the process in these words: “Once a week products are ordered at the stock-keeping unit level (SKU). For example, an order will be placed with a manufacturer for a specific number of its men’s jeans of a given style, color, fabric weight and finishing treatment etc. The order goes to the manufacturer’s computer require(ing) that the jeans be placed in identified cartons for each of the retailer’s stores and delivered to the distribution center”. The cartons must be appropriately bar coded and the jeans themselves be floor ready with prices marked as requested. 59 An extreme example is the Spanish apparel manufacturer Zara that works with lead times from sketch of a design to delivery at its stores of 2 weeks. 60 In both Cambodia and Vietnam, skilled labor shortages hamper industrial expansion, technological upgrading and productivity. In the Philippines, skilled labor is less of a constraint, which counterbalances higher wage costs.

27
strikes and work stoppages adds to the costs. Moreover, in Bangladesh, Cambodia and
Pakistan, foreign investors must factor in bureaucratic hurdles, lengthy lead times, higher
logistics costs, electricity outages that can curtail production, skill shortages, factory level
compliance with work rules, and the difficulties of communicating with and managing a foreign
workforce61.
All three factors could inhibit any acceleration of offshoring by Chinese firms especially
during a slowdown of the global (and the Chinese) economy that seems likely to persist, and in
the face of rising fuel costs. Geographical dispersion of labor-intensive activities from preferred
Southeast Asian locations with ties to the mainland might also be curbed.
FDI in the textile and garments industry would be advantageous for Pakistan62, however,
it is questionable whether the country stands to gain much from the transfer of cut, make and
trim (CMT) operations at the very bottom of the value chain. After more than 50 years of
operating in the nether reaches of the industrial food chain, Pakistan’s textile and garments
sector must move up product and quality ladders, develop the textile machinery sector63 and
seek FDI from China or elsewhere that furthers these objectives. Pakistan’s leading firms such
as Gul Ahmed Textiles and Nishat Mills need to diversify. In addition to bread and butter items
such as bed sheets, pillowcases, duvet covers, cushions, valences and table linen64, they could
aim for the high-end apparel segment encompassing the more fashionable outerwear,
formalwear and functional wear65, and technical textiles aimed at the construction, medical,
transport, and packaging subsectors – and bid for FDI in these segments Chinese or other. If
61 Bangladesh’s problems with logistics (road and port bottlenecks), workforce skills, power, raw material and product mix are described in McKinsey (2011). 62 FDI in the textiles sector amounted to a meager $27.8 million in 2009-10. It rose marginally during 2010-11. Textile Outlook International, No. 150, June 2011. 63 The success of high end garment manufacturers as in Italy depends on a symbiosis with machinery producers who help produce the types of yarns, weaves, blends and fabrics that sophisticated and innovative apparel producers demand in order to stay at the forefront. 64 Textile Outlook International No. 151, July 2011. 65 Apparel constituted less than a third of Pakistan’s total textile exports in 2010: $3,024.9 million from a total of $10,182.1 million. Knitted garments were the top export item followed by cotton fabric and bed wear. All categories of textile exports declined at double-digit rates between January 2011 and January 2012.

28
textiles is to remain Pakistan’s leading manufacturing sector66 and help fulfill its growth
objectives, the future lies in sophisticated, technologically advanced products incorporating
modern designs and fully complemented by ICT and marketing services.
As noted above, China’s emergence as a foreign investor is of a recent vintage and many
Chinese firms are not yet ready to engage in such a transfer of production, of advanced
technology (little of which is their own) and of soft skills. There could be a number of reasons:
firms might fear the emergence of competitors; they may lack the technological, organizational
and communication skills to operate effectively in Pakistan, or do not perceive the advantages
of creating production bases in Pakistan and knitting them into their global chain or the global
supply chains of their MNC partners. Furthermore, Chinese policymakers may want to rely on
exports to power China’s own growth for several more years and a transfer of manufacturing to
low-income countries would conflict with efforts to develop China’s inland provinces and
provide jobs for underemployed rural workers67. In which case, during the medium term,
Chinese FDI might most usefully support Pakistan’s manufacturing sector indirectly – as it has
done to date - through the modernization of transport and energy infrastructure and the
creation of a few industrial free trade zones. Such investment would be rendered more
valuable if contractual due diligence is observed, and the projects are carefully monitored and
supervised to ensure that Chinese suppliers deliver on contractual specifications and provisions
are included to transfer construction and maintenance skills68. Looking beyond this decade, the
likelihood that more of China’s manufacturing industry better suited to Pakistan’s level of
development, will begin migrating overseas to Pakistan and elsewhere increases. Irrespective of
whether Pakistan can attract a larger share of China’s FDI into industry or not, policies to
increase Pakistan’s attractiveness to foreign investors could have a handsome payoff and
especially so if they bolster capabilities in a number of critical areas defined below.
66 It contributes close to 9 percent of GDP, accounts for 46 percent of the value added by manufacturing and employs 38 percent of the formal urban workforce. Khan and Khan (2010). 67 The setting up of leather manufacturing in Ethiopia is linked to the supply of hides and the environmental issues associated with leather making. 68 The common complaint raised against Chinese construction companies is that they underbid, and do shoddy work even if they complete the project in time.

29
5. Leveraging FDI: Policy measures
Starting with the Foreign Private Investment Act of 1976, and continuing with the
Economic Reforms Act of1992 and the Foreign Currency Accounts Ordinance of 2001, Pakistan
has instituted an incentive regime for FDI that is relatively liberal. A wholly owned subsidiary
can be set up in any sector without prior approval; there is no lower limit to investment in
manufacturing; dividends and disinvestments can be remitted overseas without permission
being sought from the State Bank; the rupee is fully convertible; tax relief amounts to 50
percent of investment in manufacturing and there is no double taxation of dividends69. To
further improve the chances of attracting investment from China, Pakistan is discussing the
possibility of setting up Special Economic Zones that might eventually mimic the successes of
China’s iconic SEZs such as Shenzhen and Zhuhai70.
The incentives Pakistan is offering are comparable to those of its competitors and
further sweetening of the terms is unlikely to make a material difference. International and
Pakistan’s own experience suggests that the direct and spillover benefits from FDI would be
magnified if it could be made to reinforce private and public efforts to boost industrial
capabilities in five respects:
x Equipment modernization and automation (CAM) so as to raise quality, productivity and
flexibly respond to small lot orders and short deadlines;
x Training of workers, supervisory staff and management including in the use of the latest ICT
without which participation in global value chains is a stretch71, and of hedging techniques
to cope with market volatility;
69 Khan and Khan (2012). 70 http://www.pakboi.gov.pk/index.php?option=com_content&view=article&id=376:china-offers-sez-to-pakistan&catid=44:latest-news&Itemid=310; http://tribune.com.pk/story/389884/pakistan-china-sign-3-mous-for-development/ 71 World Bank (2008).

30
x R&D in products and processes (this would promote diversification, raise quality72and
introduce green technologies) but also upstream in agriculture so as to improve the cotton
varieties grown in Pakistan73. Advances in design through greater use of CAD would enable
producers to ascend quality ladders;
x Marketing and branding to internalize more of the value chain and raise profitability; and
x Compliance with labor and environmental standards and adoption of “clean manufacturing”
as a rule
Policy actions focusing on the above could enlarge the gains from FDI, but first more FDI
needs to be coaxed into Pakistan. Before that happens certain constraints need to be relaxed.
These are not so much economic as political: powerful and entrenched industrial groups want
to retain the protection that assures them handsome profits and absolves them of the need to
diversify, innovate and to compete in global markets; government paralysis stymies necessary
policy reforms; and the smoldering internal conflicts on Pakistan’s border regions have
rendered the business environment unacceptable to all but the most stout hearted foreign
investor and buyers of Pakistan’s products. Until Pakistan rights itself politically and the
government credibly commits itself to a long term high growth strategy74 and all that it entails,
only a trickle of FDI will materialize from China or elsewhere, and Pakistan will not realize the
growth potential inherent in exporting because it will remain an underachieving exporter of
‘value’ textiles and other low tech commodities.
72 The textile industry needs to grasp the opportunities presented by nano materials and explore the options in technical textiles. 73 Bt cotton was introduced in 2002 and has begun spreading however per acre yields remain very low and have stagnated, see Nabi (2010, p.66); Abdullah (2010); http://www.technologytimes.pk/2011/12/12/future-of-bt-cotton-in-pakistan-still-under-clouds/ 74 There is no dearth of analysis of Pakistan’s ills and what might put the country on the path to prosperity. See Abbas (2011); Cohen and others (2011); Economist 2012; IMF 2012.

31
Annex 1: Recent Performance and Challenges
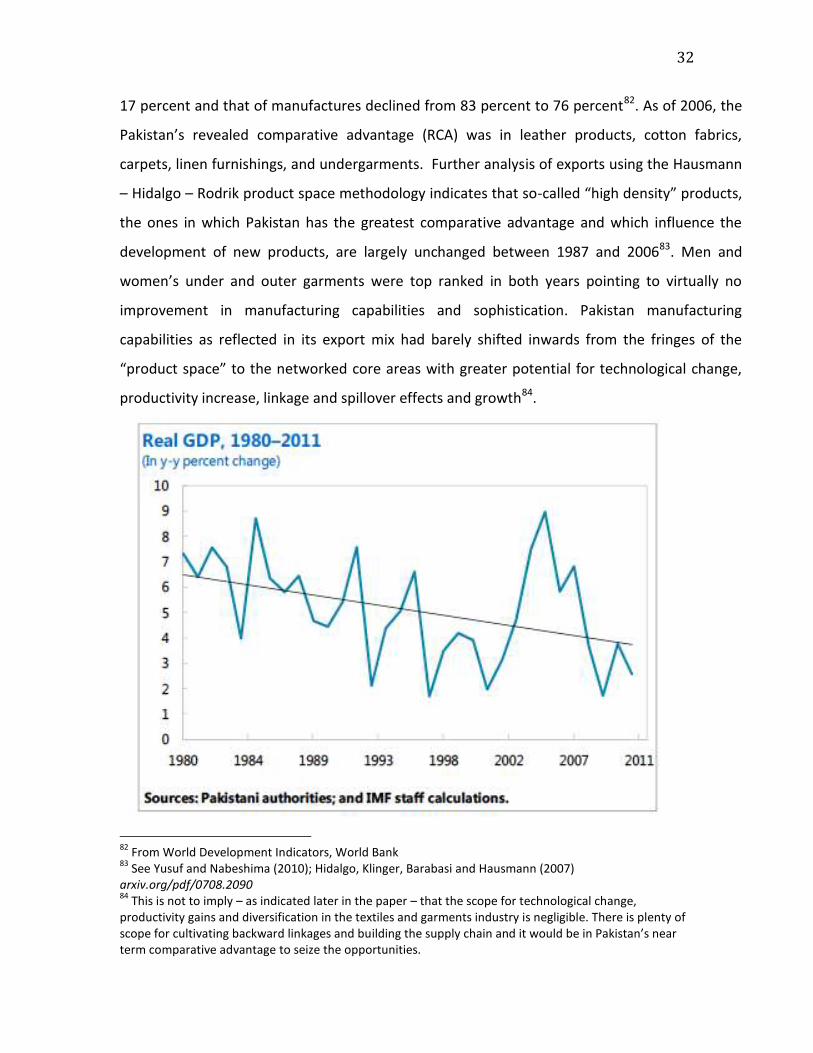
Between 1990 and 2009, Pakistan’s growth averaged 4.5 percent per annum, however,
since 2008, GDP has increased by less than 3 percent per annum in part because of the global
recession, in part also because domestic social turbulence has repressed economic activity (See
Figure 1). With a per capita GDP of under $1,400 (2012 est.), population expanding at a rate in
excess of 2.2 percent75 and 41 percent of the population living on less than $2 a day (2005)76,
the projected GDP growth rates for the 2012- 2014 period – between 2.5 and 3.5 percent per
annum – promise little if any improvement in the welfare of the majority and in the face of
rising unemployment77 and income inequality78, are likely to result in greater immiserization for
a sizable minority of the population79. Faster growth spearheaded by manufacturing has taken
on a greater urgency because changes in the structure of Pakistan’s economy and trade have
lagged far behind those of East Asian economies that have chalked out a (and arguably the
only) pathway to rapid growth. Just 17 percent of Pakistan’s GDP is derived from manufacturing
as against 34 percent for Thailand, and although three quarters of Pakistan’s exports are
manufactured products, these are comprised mostly of textiles ($13.8 billion)80, leather goods
and carpets81, all in the low value/low-tech category of products, whereas high and medium
tech products account for a large share of the exports of Thailand, Vietnam, the Philippines and
Malaysia. Moreover, the product composition of Pakistan’s exports has evolved very little since
1995. In fact, it may have regressed as the share of food products has risen from 12 per cent to
75 Because family limitation has been neglected and female literacy is low, the fertility rate is 3.9. Economist Report on Pakistan, February 11th 2012. 76 The poverty rate was 17.2 percent in 2007/08. However, half of the population is poor according to a broad measure of poverty (IMF 2012). And the UNDP’s HDI of 187 countries put Pakistan in 145th place in 2011. 77 Formal unemployment is assumed to be 6 percent, but underemployment is widespread in all sectors. The WEF’s Global Competition Report (2011) captures the inefficiency of the labor market. Pakistan’s labor market is near the bottom, ranked 136th out of 142 countries. 78 The Gini coefficient for Pakistan was estimated at 32.7 in 2006 (WDI). It is likely to have increased since as it has in most other countries. 79 The Framework for Economic Growth prepared by Pakistan’s Planning Commission is aiming for growth rate of 7 percent. See Ikram (2011). 80 Mainly low value items such as underwear, bed linen, and towels. 81 Other exports include rice, fruit, sporting goods, surgical instruments, chemicals, marble and cotton yarn.
32
17 percent and that of manufactures declined from 83 percent to 76 percent82. As of 2006, the
Pakistan’s revealed comparative advantage (RCA) was in leather products, cotton fabrics,
carpets, linen furnishings, and undergarments. Further analysis of exports using the Hausmann
– Hidalgo – Rodrik product space methodology indicates that so-called “high density” products,
the ones in which Pakistan has the greatest comparative advantage and which influence the
development of new products, are largely unchanged between 1987 and 200683. Men and
women’s under and outer garments were top ranked in both years pointing to virtually no
improvement in manufacturing capabilities and sophistication. Pakistan manufacturing
capabilities as reflected in its export mix had barely shifted inwards from the fringes of the
“product space” to the networked core areas with greater potential for technological change,
productivity increase, linkage and spillover effects and growth84.
82 From World Development Indicators, World Bank 83 See Yusuf and Nabeshima (2010); Hidalgo, Klinger, Barabasi and Hausmann (2007) arxiv.org/pdf/0708.2090 84 This is not to imply – as indicated later in the paper – that the scope for technological change, productivity gains and diversification in the textiles and garments industry is negligible. There is plenty of scope for cultivating backward linkages and building the supply chain and it would be in Pakistan’s near term comparative advantage to seize the opportunities.

33
Underlying the slow change in the structure of the economy is a long-standing and
persistent underinvestment in productive capacity and in gains in total factor productivity (TFP).
Both are critical proximate causes of growth85 with TFP having the edge over the longer term86
although in earlier stages of development when countries are urbanizing, building key
infrastructures and establishing an industrial base, capital generally dominates TFP87. When
East Asian countries88 were growing rapidly in the first half of the 1990s, their investment rates
averaged 35 percent or more and capital was the primary driver of growth. However, most late
developing countries are seemingly unable to push rates of capital formation above 25 percent
of GDP – and the majority fall below that level – with the result that attaining growth rates of 7
percent or more requires efficient utilization of capital and strongly increasing TFP. Pakistan is
squarely in the category of low investors. Gross capital formation was under 20 percent from
1995-2008 (19 percent in 1995, 22.05 percent in 2008). Since 2008, it has been trending sharply
downward and was 18.2, 15.4, and 11.3 percent in 2009, 2010 and 2011 respectively (See
Figure 2). Although a return to earlier trend rates could occur once the global economy revives
and conditions within Pakistan improve, the new normal might be a rate of gross domestic
investment in the 16-18 percent range. Absent an increase in gross domestic savings (averaging
13 percent during 2008-2011) and/or an infusion of capital from external sources, the economy
would struggle to achieve growth rates of even 6 percent. Given that recent incremental capital
output ratios (ICOR) have been in excess of 4, GDP is unlikely to increase by more than 4- 4.5
percent. A growth rate of 7-8 percent, which is highly desirable for pressing economic and
social reasons89, can only be reached if investment can be pushed up a few notches to 23 – 24
percent range and complemented by TFP growth of 3 percent per annum.
85 Acemoglu (2012): www.ppge.ufrgs.br/giacomo/arquivos/eco02237/acemoglu-2007.pdf 86 Comin, Hobijn, and Rovito (2008). 87 Jorgenson and Vu (2007). 88 China, Korea, Malaysia, Singapore and Thailand had high rates of gross capital formation and growth in the first half of the 1990s. China is currently investing almost 49 percent of GDP. 89 Pakistan’s youth bulge could worsen the turmoil in the country if employment generation does not pick up.

34
Sources of Growth
Pakistan’s industrial and technological backwardness, its youthful population 90 ,
expanding urban agglomerations and large domestic market point to considerable untapped
growth potential. A growth rate of 8 percent underpinned by gross investment equivalent to 24
percent of GDP and a 3 percent per annum increase in total factor productivity (TFP) are
feasible objectives for the latter half of the decade assuming that needed policies are
implemented and external conditions continue to improve. The capital to labor ratio in Pakistan
is low by international standards and investment in productive capacity embodying modern
technologies could in principle, yield large returns91. The scope for technological catching-up in
all areas is vast. Past estimates of TFP are encouraging. During the 1960s, in the 1980s and
briefly during the 2003-2008 period, TFP grew annually by up to 2.6 percent and by one
90 The labor force is increasing by 3.4 percent per annum which adds 2 million new entrants each year 91 Technology absorption is the primary determinant of differences in TFP and the wide gaps in incomes among countries. See Parente and Prescott (2000); Basu, Fernald and Shapiro (2003,); and Comin and Hobijn (2010).

35
estimate, TFP of manufacturing rose by 3.2 percent per annum from 1964-65 through 2000-
2001. TFP growth was lower during the 1970s (1.1 percent) and the 1990s (0.8 percent). For the
entire period extending from 1960 to 2004, TFP rose by about 1.5 percent annually. Fast
growing economies such as China and the Republic of Korea registered TFP growth of 3 percent
by transferring resources from the rural sector to higher value adding urban activities, through
industrial diversification, by harnessing advanced technologies and by moving up the value
chain. These countries and others in East Asia also benefitted from the productivity gains
accruing from urban agglomeration and scale economies. All these opportunities are potentially
available to Pakistan. The scope for structural transformation via urban development is
considerable as 63 percent of the population is rural; and Pakistan now has a number of large
urban centers that could augment productivity growth from agglomeration economies
following industrial deepening, the emergence of urban clusters and the construction of
supporting infrastructure. Furthermore, Pakistan’s has yet to exploit the growth dividend to be
derived from greater openness to trade. Its merchandise (exports and imports) trade to GDP
ratio was 34 percent in 2011. By comparison, that of Thailand in 2009 was 108 percent,
Bangladesh was 41 percent and that of Vietnam was 141 percent. Pakistan has also failed to
leverage the advantages of foreign direct investment (FDI). Net inflows have been in the region
of 1.5 percent of GDP and the stock of FDI at the end of 2011 was estimated at $31.2 billion
(15.3 percent of GDP). By comparison Vietnam a rapidly expanding economy with a per capita
GDP comparable to that of Pakistan, had net inflows of FDI in 2009 equal to 8.4 percent of GDP
and the stock of FDI in 2011 was $67.6 billion. The average inflow for South Asia in 2009 was 2.3
percent while for Sub Saharan Africa it was 3.1 percent.
Performance and Business Indicators and Constraints
A number of indicators partially explain the paucity of domestic and foreign investment
in productive assets and the low ratio of trade to GDP. According to the World Bank’s Doing
Business Survey for 2012, Pakistan was ranked 105 down from 96 in 2011 (China was in 91st
place, Thailand in 17th place, and Vietnam in 98th place). The World Bank’s Logistics
Performance Index which takes account of border controls, transport, logistics services and

36
timeliness of delivery, ranked Pakistan 71st in 2012 (Thailand was 38th, Vietnam 53rd and China
26th). Pakistan’s competitiveness was also comparatively low – the World Economic Forum
report for 2012 ranked it 118th while China took 26th place and Thailand and Vietnam 39th and
65th places respectively. The Failed State Index puts Pakistan in 13th place in 2012 between
Guinea and Nigeria92. And on Transparency International’s Corruption perception index for
2011, Pakistan scored 2.5 out of 10 and was ranked 134 from a total of 182 countries with New
Zealand in first place and Somalia at the very bottom93.
These indices reflect weaknesses or constraints in eight areas, which collectively are
hampering Pakistan’s performance:
x Institutional shortcomings94 that affect property rights, contract enforcement and dispute
resolution and thereby compromise market functioning;
x Entry barriers and the protection that is afforded to powerful business interest groups
reduce market competition. In addition, Pakistan maintains relatively high tariff barriers
(with thousands of tariff lines) on manufactured goods amounting to weighted mean of
12.1 percent (2009). The simple mean tariff on all products is 15 percent. This is buttressed
by numerous statutory regulatory orders that protect individual producers by imposing
higher tariffs;95
x Uncompetitive financial markets that largely channel resources to the public sector and the
leading business groups to the neglect of the smaller and potentially more dynamic firms
(IMF 2012);
92 http://www.foreignpolicy.com/failed_states_index_2012_interactive. See also comments by Guruswamy (2011); Rizvi (2011); and Hotiana http://www.foreignpolicy.com/articles/2012/06/22/debating_failed_states_index. http://www.bbc.co.uk/news/world-south-asia-13318673 93 http://cpi.transparency.org/cpi2011/results/#CountryResults 94 Acemoglu, Rodrik and others view institutional constraints and rent seeking behavior as being directly responsible for slow growth – with low investment being a proximate cause. 95 The barriers include local content requirements for autos, regulatory duties, technical and sanitary standards, and the use of anti-dumping rules. See Pursell, Khan and Gulzar (2011).

37
x Low literacy, skill shortages and poor quality of the technical and professional workforce96
all of which are directly attributable to the state of Pakistan’s learning system97;
x An underdeveloped technology and innovation system because Pakistan trains and employs
few researchers (152 per million people) and spends 0.67 percent of GDP on R&D (2000-
2008);
x Frequent and prolonged power outages that are exceedingly costly for businesses98. In
Faisalabad, the hub of the textile industry, one half of the city’s 250,000 power looms have
shut down, as have 10 percent of the spinning mills with 200,000 workers losing their jobs99.
Non-payment of distribution companies (DISCOs), mainly by public entities100, difficulty in
collecting the already too low customer tariffs from users, scarcity of fuel, theft and
transmission losses (30 percent) have resulted in acute and persistent shortages even
though generating capacity (of 20,000 MW) far exceeds peak demand (of 14,700 MW);
x Endemic violence and a precarious law and order situation in the major cities greatly add to
the uncertainties confronting existing businesses and prospective investors, local or foreign;
x Fiscal101 and governance issues combined with political discord, hamper policy reform and
limit the government’s freedom – or readiness - to undertake developmental initiatives.
96 See Kazmi (2007) www.shrdc.org/doc/sjhrd/.../8.%20Syeda%20Wadiat%20Kazmi.pdf 97 Public spending on education in 2009 was 2.7 percent of GDP and the primary completion rate at 61 percent was among the lowest in the world 98 Half of all power consumption is by domestic users, 27 percent by industry and 13 percent by agriculture. During 2010-2012, Pakistan might have sacrificed up to 3-4 percent of GDP because of power outages according to the ADB. 99 Business Week, A Vital Pakistan Industry. April 30th 2012, 14-15. 100 With the government and public corporations struggling to pay their bills, power distributors and producers are the hapless victims of an increasingly vicious debt triangle a solution to which is the only road to restoring power supplies. The DISCOs are compensated intermittently and have difficulty paying electricity producers, which in turn cannot buy sufficient fuel. The DISCOs attempt to alleviate the problem through borrowing at high rates and as their burden has increased the government has been forced to step in and bail them out. The circular debt now amounts to 400 billion rupees or 2 percent of GDP. See Oxford Analytica, Pakistan Opts for a Quick Fix. April 18th 2012. 101 Mobilizing additional revenues is a matter of urgency in the interests of macroeconomic adjustment and stability and in order to finance development spending. However, the political obstacles are formidable, an entrenched culture of tax evasion and corruption tests the limited capacity of the collection agency and a significant ratcheting up of taxes – even if this was feasible – risks slowing an already weak economy.

38
Annex 2: Data on FDI

39

40
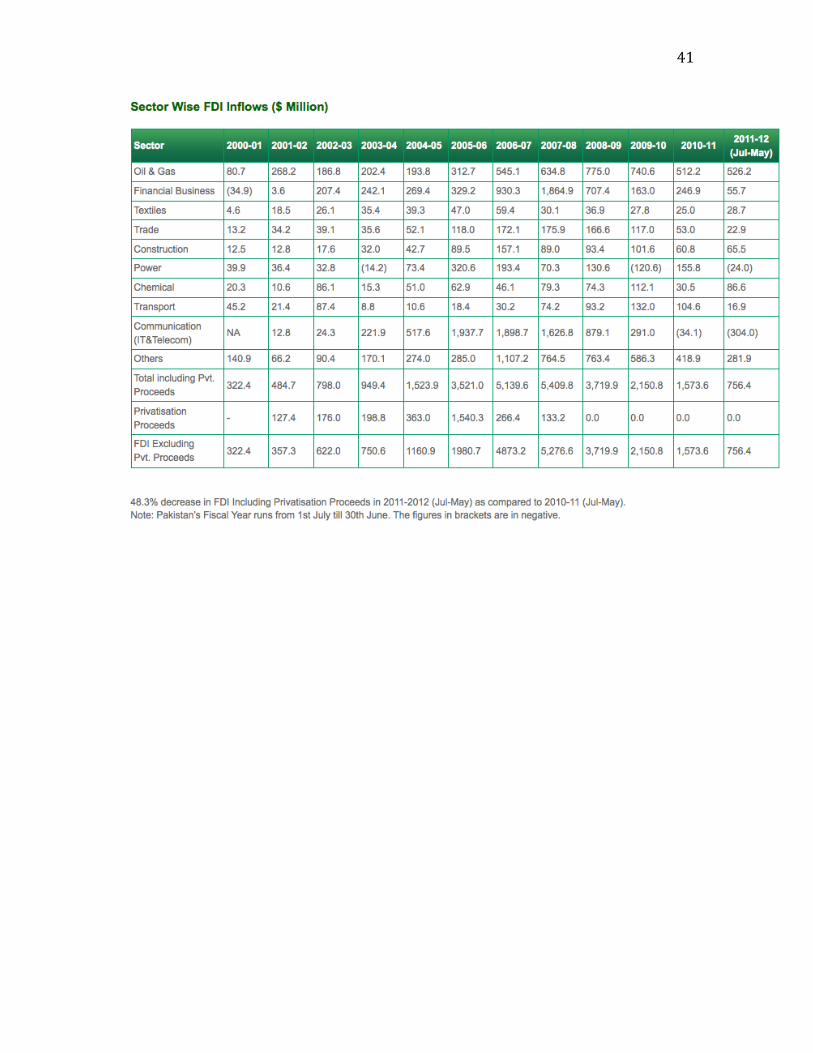
41

42
References Abbas, Hassan. 2011. Pakistan 2020: A vision for building a better future. Asia Society. Abdullah, Ahsan. 2010. An analysis of Bt Cotton cultivation in Pakistan. AgBioForum, 13(3);6 Abernathy, Frederick, H. J.T. Dunlop, J.H. Hammond and D. Weil. 1999. The development of the China apparel industry. Cambridge, MA. Harvard Center of Textile and Apparel Research. Abernathy, Frederick H. and Anthony Volpe. 2006. The future of apparel and textile industries: prospects and choices for public and private actors. Environment and Planning, 38: 2207-32. Adams, Samuel. 2009. Can FDI help to promote growth in Africa. African Journal of Business Management. 3(5): 178-183. Baldwin, Robert and Simon Evenett eds. 2009. The collapse of global trade, murky protectionism and the crisis: recommendations for the G 20.http://www.voxeu.org/epubs/cepr-reports/collapse-global-trade-murky-protectionism-and-crisis-recommendations-g20 Baldwin, Robert, and Toshihiro Okubo. 2012. New-paradigm globalization and networked FDI: Evidence from Japan. VOX May 24th. Basker, Emek and Hoang Van Pham. (2007). Wal Mart as catalyst to US-China trade.ideas.repec.org/p/dpc/wpaper/0111.html Basu, Susanto, John Fernald and Matthew Shapiro. 2003. Productivity Growth in the 1990s: Technology, Utilization or Adjustment. NBER Working Paper No. 8359. National Bureau of Economic Research, Cambridge MA Berg, Andy, Jonathan D. Ostry and Jeromin Zettelmeyer. 2008. What makes growth sustained? IMF Working Paper No. WP/08/59. IMF Washington DC. Bloom, Nicholas, A. Mahajan, D. Mckenzie and J. Roberts. 2010. Why do firms in developing countries have low productivity? papers.ssrn.com/sol3/papers.cfm?abstract_id=1533430 Carkovic, Maria V. and Ross Levine. 2002. Does FDI accelerate economic growth? www.iie.com/publications/chapters_preview/3810/08iie3810.pdf Carrere, Celine, Vanessa Strauss-Kahn and Olivier Cadot. 2011. Export Diversification: What’s behind the hump. Review of Economics and Statistics, 90(2): 590-605. Cheng, Leonard K. and Zihui Ma. 2007. China’s outward FDI: Past and Future. http://www.nber.org/chapters/c10475.pdf Cipollina, Maria, Giorgia Giovannetti, Filomena Pietrovito, and Alberto F. Pozzolo. 2011. FDI and growth: what cross-country industry data say. Universita degli Studi del Molise, Economics and Statistics Discussion Paper No. 060/11. Cohen, Stephen, P. and Others. 2011. The Future of Pakistan. Washington DC. Brookings Institution. Comin, Diego and Bart Hobijn. 2010. Technology diffusion and postwar growth. NBER Working Paper NO. 16378. National Bureau of Economic Research. Cambridge MA. Comin, Diego, Bart Hobijn, and Emilie Rovito. 2006. World Technology Usage lags. NBER
Working Paper No. 12677. National Bureau of Economic Research, Cambridge MA.
43
Contessi, Silvio and Ariel Weinberger. 2009. FDI, productivity and country growth: An Overview. Review, The Federal Bank of St. Louis. 91(2): 61-78. Datta, Saugato. 2012. The impact of improved highways on Indian firms. Journal of Development Economics. 99: 46-57. Davies, Ken. 2012. Outward FDI from China and its policy context, 2012. Columbia FDI Profiles. Vale Columbia Center. Easterly, William, and Ariel Reshef. 2010. African export successes: Surprises, stylized facts and explanations. NBER Working Paper No. 16597. National Bureau of Economic Research. Cambridge MA. Economist. 2012. Perilous Journey: Special report, Pakistan. London. Fadinger, Harald and Pablo Fleiss. 2011. Trade and sectoral productivity. Economic Journal. 121: 958-89. Fernandez, Ana, M. and Caroline Paunov. 2012. Foreign direct investment in services and manufacturing productivity: Evidence from Chile. Journal of Development Economics. 97: 305-21. Fernandez-Stark, Karina Stacey Frederick and Gary Gereffi. 2011. The apparel global value chain. Duke Center on Globalization Governance and Competitiveness. November. Francois, Joseph, and Bernard Hoekman. 2010. Services Trade and Policy. Journal of Economic Literature, 48(3): 642–92 Hanemann, Thilo. 2011. Changing Patterns of Chinese Outward FDI. is-db.stanford.edu/evnts/6930/Hanemann_1.pd Hanson, Gordon, H. 2012. The Rise of Middle Kingdoms: Emerging Economies in Global Trade, Journal of Economic Perspectives. 26(2), pages 41-64, Spring. Harding, Torfinn and Beata S. Javorcik. 2011. FDI and export upgrading. Dept. of Economics, Working Paper No.526. University of Oxford. Hausmann, Ricardo, Lant Pritchett and Dani Rodrik. 2005. Growth Accelerations," Journal of Economic Growth, 10(4): 303-329. Hidalgo, Cesar, Klinger, Barabasi and Ricardo Hausmann. 2007. The product space conditions the development of nations. www.sciencemag.org › 27 July 2007 Hufbauer, Gary, C. and Kati Suominen. 2010. Globalization at Risk. New Haven Conn. Yale University Press. Ikram, Khalid. 2011. Pakistan’s Framework for economic growth. International Growth Center. London. IMF. 2012. Pakistan: 2011 Article IV Consultation. Washington DC. February. Ito, Banri, N. Yashiro, Z. Xu, X. Chen and R. Wakasugi. 2012. How do Chinese industries benefit from FDI spillovers? China Economic Review. 23: 342-356. Jorgenson, Dale W. and Khuong M. Vu. 2009. “Growth Accounting within the International
Comparison Program.” ICP Bulletin 6(1):3–28. Kazmi, Syeda W. 2007. Vocational education and skills development: A case of Pakistan. SAARC Journal of Human Resource Development. Pp. 105-117. Khan Safdar Ullah. 2006. Macro determinants of total factor product in Pakistan. SBP Research Bulletin, 2(2). Khan, Aftab A. and Mehreen Khan. 2010. Pakistan textile industry facing new challenges. Research Journal of International Studies. 14: 21-29.

44
Khan, Muhammad A. and Shujaat A. Khan. 2011. FDI and economic growth in Pakistan: A sectoral analysis. Working paper No. 2011/67. PIDE. Islamabad Lederman, David and William F. Maloney. 2012. Does What You Export Matter. Washington DC, World Bank. Yi, Lan and Bai Yong. 2011. The expansion of Chinese construction companies in the global market. 47th Annual International Conference Proceedings. Associated Schools of Construction. Lipsey, Robert and Frederik Sjoholm. 2011. South-South FDI and development in East Asia. deas.repec.org/p/hhs/iuiwop/0885.html Mah, Jai, S. 2010. Export Promotion Policies, Export Composition and Economic Development in Korea. Law and Development Inaugural Conference, Sydney, October. McKinsey and Co. 2011. Bangladesh’s ready-made garments landscape: The challenge of growth. www.mckinsey.com/.../mckinsey/.../bangladesh_ready_made_garme.. Moran, Theodore H. 2010. China’s Strategy to Secure Natural Resources. No. 92. Washington DC. Peterson Institute of International Economics. Moran, Theodore H. 2011. Foreign manufacturing multinationals and the transformation of the Chinese economy: New measurements new perspectives. Working paper no. 11-11. Washington DC. Peterson Institute of International Economics. Nabi, Ijaz. 2010. Economic Growth and Structural Change in South Asia: Mirage or Miracle. Lahore, DPRC. Newfarmer, Richard, William Shaw and Peter Walkenhorst. Eds. 2009. Breaking into New Markets. Washington DC World Bank. Nolan, Peter. 2012. Is China Buying the World? London, Polity Press. Owen, Nicholas, and Alan C. Jones. 2003. A comparative study of British and Italian textile and clothing industries. DTI Economics Paper No. 2. London. Parente, Stephen and Edward Prescott. 2000. Barriers to Riches. Cambridge MA. MIT Press. Portugal-Perez, Alberto and John S. Wilson. 2011. Export performance and trade facilitation reform: Hard and soft infrastructure. World Development, 4(7): 1295-1307. Pursell, Garry, Ashraf Khan and Saad Gulzar. 2011. Pakistan’s trade policies: future directions. Working Paper No. 11/0361. International Growth Center. June.www.theigc.org Rosen, Daniel H. and Thilo Hanemann. 2009. China’s changing outbound FDI profile: Drivers and policy implications. No. PBO9-14. Washington DC, Peterson Institute of International Economics. Salidjanova, Nargiza. 2011. Going-out: An overview of China’s outward FDI. USCC Staff Research Report Schott, Peter. 2006. "The Relative Sophistication of Chinese Exports," NBER Working Papers 12173, National Bureau of Economic Research, Cambridge MA. Scissors, Derek . 2011. China’s Investment Overseas in 2010. Web Mimeo. The Heritage Foundation. No. 3133. UNIDO. 2009. Industrial Development Report 2009. Vienna.

45
Virmani, Arvind (2012) Accelerating and Sustaining Growth: Economic and Political Lessons. Washington DC, IMF Working Paper IMF/12/185 Voss, Hinrich Peter J. Buckley and Adam R. Cross. 2011. Thirty years of Chinese outward FDI. www.ceauk.org.uk/.../Voss-Buckley-Cross-30-years-outward-FDI.do.. Wang, Jinmin, Jiebing Wu and Xianguo Yao. 2009. The expansion of textile and clothing firms of China to Asian least developed countries: The case of Cambodia. www.unescap.org/tid/artnet/pub/wp6008.pdf Williamson, Peter J. and Anand P. Raman. 2011. The globe: How China reset its global acquisitions agenda. Harvard Business Review. April. Winters, L. Alan. 2004. Trade liberalization and Economic Perfomance: An overview. Economic Journal. 114(493): F4-F21. WorldBank. 2008. The global textile and garments industry: The role of ICTs in exploiting the value-chain. InfoDev. Washington DC. World Economic Forum. 2011. Global Competition Report. Geneva. World Economic Forum. 2012. The shifting geography of global value chains. Geneva. Xu, Bin and Jiangyong Lu. 2009. Foreign direct investment, processing trade, and the sophistication of China’s exports. China Economic Review. 2009. Yao, Shujie and Kailei Wei. 2007. Economic growth in the presence of FDI: The perspective of newly industrializing countries. Journal of Comparative Economics. 35: 211-34. Yusuf, Shahid and Kaoru Nabeshima. 2010. Changing the Industrial Geography in Asia. Washington DC. World Bank.

Designed by soapbox.co.uk
The International Growth Centre (IGC) aims to promote sustainable growth in developing countries by providing demand-led policy advice based on frontier research.
Find out more about our work on our website www.theigc.org
For media or communications enquiries, please contact [email protected]
Subscribe to our newsletter and topic updates www.theigc.org/newsletter
Follow us on Twitter @the_igc
Contact us International Growth Centre, London School of Economic and Political Science, Houghton Street, London WC2A 2AE