chinook salmon stock assessment and research plan, 2013...special publication no. 13-01 chinook...
TRANSCRIPT

Special Publication No. 13-01
Chinook Salmon Stock Assessment and Research Plan, 2013
by
ADF&G Chinook Salmon Research Team
January 2013
Alaska Department of Fish and Game Divisions of Sport Fish and Commercial Fisheries

Symbols and Abbreviations The following symbols and abbreviations, and others approved for the Système International d'Unités (SI), are used without definition in the following reports by the Divisions of Sport Fish and of Commercial Fisheries: Fishery Manuscripts, Fishery Data Series Reports, Fishery Management Reports, and Special Publications. All others, including deviations from definitions listed below, are noted in the text at first mention, as well as in the titles or footnotes of tables, and in figure or figure captions. Weights and measures (metric) centimeter cm deciliter dL gram g hectare ha kilogram kg kilometer km liter L meter m milliliter mL millimeter mm Weights and measures (English) cubic feet per second ft3/s foot ft gallon gal inch in mile mi nautical mile nmi ounce oz pound lb quart qt yard yd Time and temperature day d degrees Celsius °C degrees Fahrenheit °F degrees kelvin K hour h minute min second s Physics and chemistry all atomic symbols alternating current AC ampere A calorie cal direct current DC hertz Hz horsepower hp hydrogen ion activity pH (negative log of) parts per million ppm parts per thousand ppt, ‰ volts V watts W
General Alaska Administrative Code AAC all commonly accepted abbreviations e.g., Mr., Mrs.,
AM, PM, etc. all commonly accepted professional titles e.g., Dr., Ph.D., R.N., etc. at @ compass directions:
east E north N south S west W
copyright ã corporate suffixes:
Company Co. Corporation Corp. Incorporated Inc. Limited Ltd.
District of Columbia D.C. et alii (and others) et al. et cetera (and so forth) etc. exempli gratia (for example) e.g. Federal Information Code FIC id est (that is) i.e. latitude or longitude lat. or long. monetary symbols (U.S.) $, ¢ months (tables and figures): first three letters Jan,...,Dec registered trademark â trademark ä United States (adjective) U.S. United States of America (noun) USA U.S.C. United States
Code U.S. state use two-letter
abbreviations (e.g., AK, WA)
Mathematics, statistics all standard mathematical signs, symbols and abbreviations alternate hypothesis HA base of natural logarithm e catch per unit effort CPUE coefficient of variation CV common test statistics (F, t, c2, etc.) confidence interval CI correlation coefficient (multiple) R correlation coefficient (simple) r covariance cov degree (angular ) ° degrees of freedom df expected value E greater than > greater than or equal to ³ harvest per unit effort HPUE less than < less than or equal to £ logarithm (natural) ln logarithm (base 10) log logarithm (specify base) log2, etc. minute (angular) ' not significant NS null hypothesis HO percent % probability P probability of a type I error (rejection of the null hypothesis when true) a probability of a type II error (acceptance of the null hypothesis when false) b second (angular) " standard deviation SD standard error SE variance population Var sample var

SPECIAL PUBLICATION NO. 13-01
CHINOOK SALMON STOCK ASSESSMENT AND RESEARCH PLAN, 2013
By ADF&G Chinook Salmon Research Team
Alaska Department of Fish and Game Division of Sport Fish, Research and Technical Services 333 Raspberry Road, Anchorage, Alaska, 99518-1565
January 2013

The Special Publication series was established by the Division of Sport Fish in 1991 for the publication of techniques and procedures manuals, informational pamphlets, special subject reports to decision-making bodies, symposia and workshop proceedings, application software documentation, in-house lectures, and became a joint divisional series in 2004 with the Division of Commercial Fisheries. Special Publications are intended for fishery and other technical professionals. Special Publications are available through the Alaska State Library, Alaska Resources Library and Information Services (ARLIS) and on the Internet: http://www.adfg.alaska.gov/sf/publications/. This publication has undergone editorial and peer review.
ADF&G Chinook Salmon Research Team Alaska Department of Fish and Game, Anchorage USA
This document should be cited as: ADF&G Chinook Salmon Research Team. 2013. Chinook salmon stock assessment and research plan, 2013.
Alaska Department of Fish and Game, Special Publication No. 13-01, Anchorage.
The Alaska Department of Fish and Game (ADF&G) administers all programs and activities free from discrimination based on race, color, national origin, age, sex, religion, marital status, pregnancy, parenthood, or disability. The department administers all programs and activities in compliance with Title VI of the Civil Rights Act of 1964, Section 504 of the Rehabilitation Act of 1973, Title II of the Americans with Disabilities Act (ADA) of 1990, the Age Discrimination Act of 1975, and Title IX of the Education Amendments of 1972.
If you believe you have been discriminated against in any program, activity, or facility please write: ADF&G ADA Coordinator, P.O. Box 115526, Juneau, AK 99811-5526
U.S. Fish and Wildlife Service, 4401 N. Fairfax Drive, MS 2042, Arlington, VA 22203 Office of Equal Opportunity, U.S. Department of the Interior, 1849 C Street NW MS 5230, Washington DC 20240
The department’s ADA Coordinator can be reached via phone at the following numbers: (VOICE) 907-465-6077, (Statewide Telecommunication Device for the Deaf) 1-800-478-3648,
(Juneau TDD) 907-465-3646, or (FAX) 907-465-6078 For information on alternative formats and questions on this publication, please contact:
ADF&G Division of Sport Fish, Research and Technical Services, 333 Raspberry Road, Anchorage AK 99518 (907) 267-2375

i
TABLE OF CONTENTS Page
LIST OF TABLES......................................................................................................................................................... ii
LIST OF FIGURES ....................................................................................................................................................... ii
EXECUTIVE SUMMARY ........................................................................................................................................... 1
INTRODUCTION ......................................................................................................................................................... 2
Background .................................................................................................................................................................... 2 Goal of the Research Plan.............................................................................................................................................. 3 LIFE HISTORY OF CHINOOK SALMON ................................................................................................................. 4
EVIDENCE FOR STOCK-SPECIFIC DECLINES ...................................................................................................... 6
FUNDAMENTAL KNOWLEDGE GAPS ................................................................................................................... 8
Abundance and Rate Information .................................................................................................................................. 9 When and Where Productivity is Changing................................................................................................................. 10 How Productivity is Changing ..................................................................................................................................... 11 Adapting Fishery Management .................................................................................................................................... 12 METHODS TO ADDRESS KNOWLEDGE GAPS ................................................................................................... 12
Use of Indicator Stocks ................................................................................................................................................ 12 Estimation of Adult Abundance .................................................................................................................................. 14 Estimation of Juvenile Abundance .............................................................................................................................. 15 Process Studies ............................................................................................................................................................ 16 Local and Traditional Knowledge ............................................................................................................................... 16 Development of Management Strategies ..................................................................................................................... 18 RESEARCH RECOMMENDATIONS ....................................................................................................................... 18
Stock- and Fishery-Specific ......................................................................................................................................... 18 Unuk River ............................................................................................................................................................. 18 Stikine River ........................................................................................................................................................... 19 Taku River .............................................................................................................................................................. 20 Chilkat River ........................................................................................................................................................... 22 Copper River ........................................................................................................................................................... 23 Susitna River ........................................................................................................................................................... 25 Kenai River ............................................................................................................................................................. 26 Karluk River ........................................................................................................................................................... 28 Chignik River ......................................................................................................................................................... 30 Nushagak River ...................................................................................................................................................... 31 Kuskokwim River ................................................................................................................................................... 32 Yukon River ........................................................................................................................................................... 34
Across Stocks and Fisheries ........................................................................................................................................ 36 Marine Surveys and Modeling ................................................................................................................................ 36 Offshore Fishery Sampling ..................................................................................................................................... 37 Process Studies ....................................................................................................................................................... 37 Genetic Baseline and Marker Development ........................................................................................................... 39 Programmatic Support ............................................................................................................................................ 40
FUNDING RECOMMENDATIONS .......................................................................................................................... 40 ACKNOWLEDGEMENTS ......................................................................................................................................... 40 REFERENCES CITED ............................................................................................................................................... 40 TABLES AND FIGURES ........................................................................................................................................... 43
ii
LIST OF TABLES Table Page 1. Average inshore and federal waters harvests and fishery-specific activities recommended to fill
knowledge gaps in stock-specific harvest assessment. .................................................................................. 44 2. Stock-specific activities recommended to fill knowledge gaps in Chinook salmon escapement, smolt,
and local and traditional knowledge (LTK) assessments (CWT-tagging means coded-wire-tagging). ........ 45 3. Recommended activities to fill knowledge gaps that cut across Chinook salmon stocks and fisheries. ....... 47 4. Approximate annual costs (including startup costs) by type of activity to address Chinook salmon
knowledge gaps (thousands of dollars). ........................................................................................................ 48
LIST OF FIGURES Figure Page 1. Minimum, maximum, and average standardized productivity residuals of twelve stocks of Chinook
salmon in Alaska (adapted from Catalano 2012). ......................................................................................... 49 2. Minimum, maximum, and average of standardized deviations from average run abundance of 21 stocks
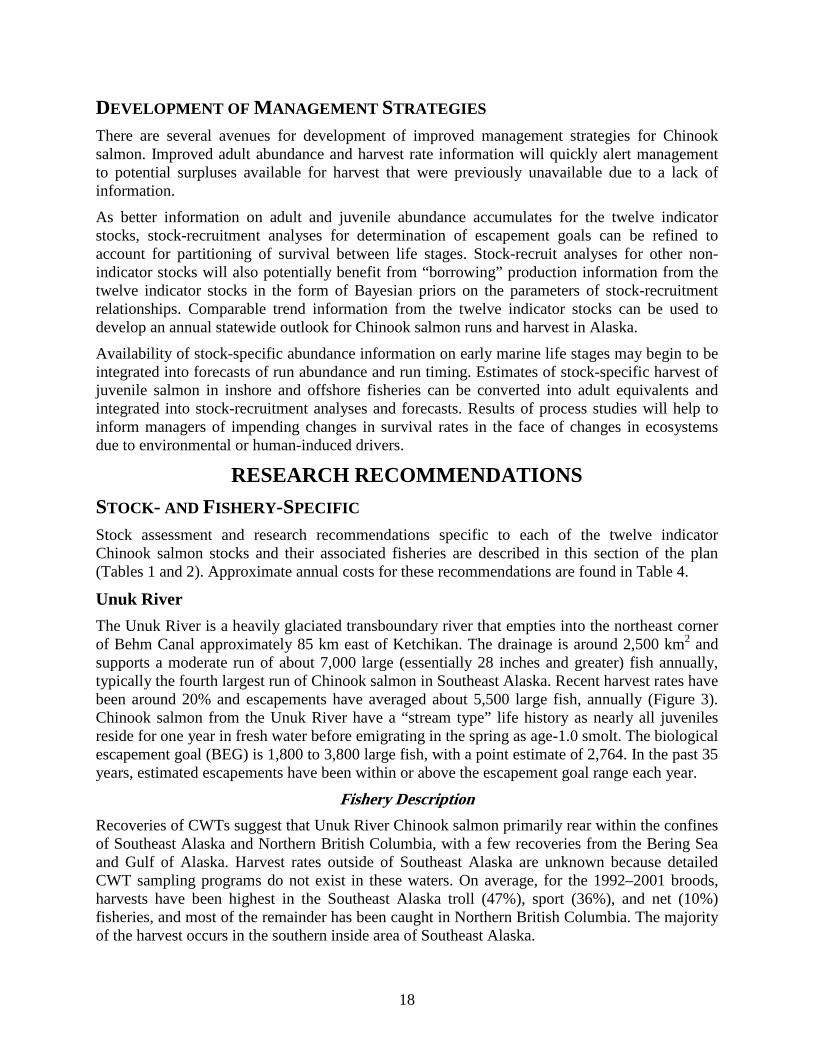
of Chinook salmon in Alaska. ....................................................................................................................... 50 3. Harvest and escapement of Chinook salmon in the Unuk River, 1986-2010. ............................................... 51 4. Harvest and escapement of Chinook salmon in the Stikine River, 1981-2009. ............................................. 51 5. Harvest and escapement of Chinook salmon in the Taku River, 1973-2010. ................................................ 52 6. Harvest and escapement of Chinook salmon in the Chilkat River, 1991-2010. ............................................ 52 7. Harvest and escapement of Chinook salmon in the Copper River, 1980-2010. ............................................ 53 8. Harvest and escapement of Chinook salmon in the Susitna River, Deshka River component, 1979-
2010. .............................................................................................................................................................. 53 9. Harvest and escapement of Chinook salmon in the Kenai River, late-run component, 1986-2011. ............. 54 10. Harvest and escapement of Chinook salmon in the Karluk River, 1976-2011. ............................................. 54 11. Harvest and escapement of Chinook salmon in the Chignik River, 1978-2011. ........................................... 55 12. Harvest and escapement of Chinook salmon in the Nushagak River, 1966-2011. ........................................ 55 13. Harvest and escapement of Chinook salmon in the Kuskokwim River, 1976-2011. .................................... 56 14. Harvest and escapement of Chinook salmon in the Yukon River, Canadian component, 1982-2010. ......... 56

1
EXECUTIVE SUMMARY Recent Alaska-wide downturns in productivity and abundance of Chinook salmon stocks have created social and economic hardships across many communities in rural and urban Alaska. There is a fundamental need to more precisely characterize productivity and abundance trends of Chinook salmon stocks across Alaska, gather essential information necessary to understand root causes of these widespread declines, and track population trends into the future. This document outlines a foundation of stock assessment and research programs among a suite of indicator stocks across Alaska designed as a long-term commitment to address fundamental knowledge gaps, elucidate causal mechanisms behind observed trends, and improve management capabilities.
A team of nine1 Alaska Department of Fish and Game biologists and scientists worked collaboratively with federal agencies and academic partners to develop this plan to guide efforts towards better understanding productivity and abundance trends of Chinook salmon. In this plan we describe the general life history of Chinook salmon in Alaska; document stock-specific declines in productivity, abundance, and harvest that have occurred; and, described gaps in knowledge that limit management options when responding to downturns in productivity.
The core of this proposed plan is a stock-specific, life history-based approach to research focused on twelve indicator stocks from around Alaska, representing diverse life history and migratory characteristics across a broad geographic range. Stock assessment programs on indicator stocks target specific objectives so that gaps in our knowledge of Chinook salmon can be addressed in a practical, cost-effective, and structured approach. The twelve indicator stocks, from Southeast Alaska to the Arctic-Yukon-Kuskokwim are: Unuk, Stikine, Taku, Chilkat, Copper, Susitna, Kenai, Karluk, Chignik, Nushagak, Kuskokwim, and Yukon rivers. Recommended stock assessments include enumeration of adult escapement and stock-specific harvests in all relevant fisheries, as well as estimates of juvenile Chinook salmon abundance during the smolt stage (Table 1 and Table 2). As a companion to these stock-specific and fishery-based projects, we also recommend a suite of local and traditional knowledge studies (Table 2), nearshore marine surveys, and life history process studies (Table 3). Approximate annual costs by type of activity are shown in Table 4. This plan represents a long-term effort where implementation of stock assessment programs on indicator stocks addresses critical knowledge gaps that limit management capabilities. Implementation to the fullest extent possible provides most opportunity for improved information to assist managers, particularly during times of low abundance.
1 The ADF&G Research Team consisted of Bob Clark, Eric Volk, Andrew Munro, Steve Fleischman, Bill Templin, Ed Jones, Jim Fall, John H.
Clark, and Dave Bernard.

2
INTRODUCTION BACKGROUND The state of Alaska manages all salmon stocks based on the sustained yield principle as promulgated in Article VIII, Section 4 of the Alaska Constitution. Also inherent to Alaska’s management of salmon is the constitutional objective of developing natural resources to maximize benefits for Alaskans. Soon after statehood, Alaska adopted an escapement-based approach to management that stipulated the development and use of spawning escapement goals as the primary management targets for major stocks of salmon. This approach prioritizes the achievement of salmon spawning escapements that will sustain yields into the future over all other uses of salmon, including harvests. Management of salmon stocks for escapement goals, while central to sustaining yields in the long term can precipitate actions that greatly curtail and sometimes cease harvesting activities, especially during times of low salmon productivity and abundance. Chinook salmon are currently in this situation throughout Alaska.
Chinook salmon are critically important to subsistence, commercial, and sport users across diverse fisheries in Alaska, and recent statewide downturns in productivity and abundance have created social and economic hardships for many communities in rural and urban Alaska. There is significant need to more precisely characterize productivity and abundance trends of Chinook salmon stocks in Alaska, gather essential information necessary to understand root causes of these widespread declines, and track population trends into the future. This document outlines a framework of new and continuing stock assessment and research programs among a suite of indicator stocks across Alaska designed as a long term commitment to address fundamental knowledge gaps, elucidate causal mechanisms behind observed trends, and improve management capabilities.
In July of 2012 the Alaska Department of Fish and Game (ADF&G) initiated a comprehensive planning approach to increase our stock assessment capabilities for Chinook salmon. Planning began with a series of meetings among scientists representing ADF&G, federal agencies, and academia to determine what gaps existed in our knowledge of Chinook salmon life history and stock assessment. These meetings resulted in the development of a draft gap analysis that recommended a suite of twelve indicator Chinook salmon stocks throughout Alaska, provided detailed descriptions of gaps in knowledge for each of these stocks and the fisheries that harvest them, and recommended research projects to address the knowledge gaps. The draft gap analysis was disseminated to other scientists and the general public for their comments on 8 October 2012. Comments on the gap analysis were solicited until 9 November 2012 resulting in 40 written comments.
ADF&G hosted a symposium in Anchorage (October 22–23, 2012) to provide information on recent downturns in Chinook salmon abundance, provide perspectives on relevant research and management needs, and discuss how best to address key knowledge gaps important for our understanding of Chinook salmon stocks in Alaska. The symposium also provided a forum for interested stakeholders to ask questions of agency scientists and provide comment and advice on projects needed to address knowledge gaps. The goal of the symposium was to identify key knowledge gaps and assemble a list of research priorities to address specific questions that inform observations of Chinook salmon abundance and productivity in Alaska. Over 450
3
stakeholders attended the two-day symposium in-person or via phone or Internet, and approximately 450 questions and comments were received during the event.
In developing this plan, the ADF&G Research Team considered written comments received on the draft gap analysis, all presentations and panelist discussions at the Chinook salmon symposium, and public comments and questions received during the symposium. We also utilized comments from independent peer reviews solicited from three fisheries scientists familiar with Chinook salmon life history and population dynamics. This information was used to more fully describe the life history approach we used as the framework for research planning, to improve the description of observed declines and gaps in knowledge of Chinook salmon abundance in Alaska, and to broaden the scope of prioritized research projects in the plan.
There has been significant partnering of state and federal agencies, academia, and non-governmental organizations in addressing the issue of declining Chinook salmon productivity and abundance. An earlier and now parallel effort was begun in 2011 by the Arctic-Yukon-Kuskokwim (AYK) Sustainable Salmon Initiative (SSI) to bring together a panel of fishery experts to develop and discuss hypothesized drivers for the decline in abundance of Chinook salmon in the AYK region. There has been sharing of data sets, expertise, and critical thought between the AYK SSI effort and this statewide research planning effort, with several scientists serving on both panels. We are confident that the AYK SSI effort will result in a Chinook Salmon Research Action Plan for the AYK Region that complements the framework and direction in this statewide stock assessment and research plan.
GOAL OF THE RESEARCH PLAN This stock assessment and research plan results from collaboration with AYK SSI on similar planning efforts, partnering with federal agencies and academia to develop the draft gap analysis, convening the 2012 Chinook Salmon Symposium to inform and solicit input from stakeholders, and consideration of all comments received on the gap analysis and from the symposium. The goal of this stock assessment and research plan is to recommend stock assessment and research projects to address fundamental knowledge gaps and elucidate causal mechanisms behind observed trends in Chinook salmon productivity and abundance, so that we can improve management capabilities. To that end, this plan:
· Provides a brief review of Chinook salmon life history in Alaska.
· Reviews evidence for stock-specific abundance and productivity declines for Chinook salmon in Alaska.
· Describes some fundamental knowledge gaps.
· Reviews some of the methods and studies we suggest for addressing knowledge gaps, and how these efforts might inform management strategies.
· Provides specific stock assessment and research recommendations forming the foundation of a long-term effort to better understand and manage Chinook salmon in Alaska.
· Provides guidance on the allocation of resources to implement the plan. The central objective of implementing this plan is to create a consistent stock assessment framework across a diversity of indicator systems in Alaska that will provide improved
4
information for sustained yield management of Chinook salmon for a range of run sizes and productivity regimes. Linkage of improved monitoring data with process-based research will provide insight into ecological and environmental mechanisms causing recent abundance declines and give managers better predictive tools. This plan does not address all Chinook salmon stocks in Alaska, nor does it address research and management issues that are unique to one or only few stocks in the state. We also recognize that the plan does not directly address the entire range of possible large scale environmental and biological factors that are likely to affect Chinook salmon, such as impacts of climate change to marine and freshwater habitats and changes to carrying capacity for salmon in the North Pacific Ocean and Bering Sea. However, we are confident that results of the basic stock assessment and research recommended herein will be integral to gaining a more complete understanding of important factors influencing Chinook salmon productivity in Alaska.
LIFE HISTORY OF CHINOOK SALMON Much of what is known about the general life history of Chinook salmon in Alaska has been summarized by Healey (1991) and Morrow (1980) and is briefly summarized here with extensions to their summaries as cited. With some rare exceptions, Chinook salmon in Alaska exhibit the stream-type life history where adult runs occur during spring and summer, spawning occurs during summer and fall, the majority of juveniles spend one year in freshwater before smolting, and make extensive ocean migrations to feed and mature.
Run timing of adults varies across the state, with migrations into freshwater beginning as early as April or as late as July. Chinook salmon in large river systems such as the Yukon River may have a protracted run timing due to wide variation in distances fish must migrate to disparate spawning areas. In some instances there may be two runs of Chinook salmon in a single drainage where, for example, earlier arriving fish spawn in smaller tributary habitats and later arriving fish spawn in larger mainstem habitats. The Kenai and Kasilof rivers, in Southcentral Alaska support such multiple runs of Chinook salmon.
Spawning of Chinook salmon primarily occurs between July and September, with capacity of spawning populations limited by factors related to watershed area (Parken et al. 2006). Unlike the protracted run timing typically seen in many salmon species, timing of spawning appears to be highly synchronized and compressed in most Chinook salmon populations in Alaska. Chinook salmon can spawn in a wide variety of habitats in terms of water depths, substrate type, and current velocities, although they prefer areas of high subgravel flow, specifically found at the heads of riffles and in pools below log jams. This preference for high subgravel flow limits available Chinook salmon spawning area in most rivers of Alaska.
Fecundity of female stream-type Chinook salmon varies by size and is also thought to vary by population along a latitudinal gradient. For example, fecundity of fish in the Salcha River drainage ranged from 7,400 to 13,400 eggs per female depending on length (Skaugstad and McCracken 1991), which is somewhat higher fecundity than that reported in the general literature for Chinook salmon populations further south (Healy and Heard 1984).
As with other Pacific salmon, female Chinook salmon deposit eggs into redds dug into the streambed. Within the redd, Chinook salmon ova are susceptible to drying as river levels drop in fall and winter, freezing during winter, and mechanical abrasion due to floods during summer and fall. Time to hatching varies with stream temperature, generally taking 12 or more weeks in Alaska. Fry emerge from the gravel 2 to 3 weeks after hatching.

5
After hatching and emergence, fry disperse from spawning areas to feed in mainstem or tributary habitats of large watersheds. Juvenile Chinook salmon favor areas of moderate current and instream cover for feeding during summer. Some populations exhibit migrations from tributaries into mainstem areas for overwintering. Understanding of overwinter survival rates for juvenile Chinook salmon in freshwater is very limited. Most juvenile Chinook salmon in Alaska overwinter in freshwater and emigrate as age-1 smolt the following spring, although there are juveniles in some Southeast Alaska populations that migrate seaward at age-0 prior to their first winter (e.g., Situk River, Thedinga et al. 1998). Seaward emigration of smolt generally occurs between May and July (King and Breakfield 2002), with smolt ranging in length from approximately 50-100 mm (Pahlke et al. 2010).
Very little is known about habitats occupied by juvenile Chinook salmon as they first enter nearshore marine waters of Alaska. As with other populations of stream-type Chinook salmon, it is thought that juveniles in Alaska spend little time in their natal river estuary and rapidly move into the coastal currents along the shoreline where very little biological sampling has been done to date. It has been hypothesized that the first year at sea is a critical period of growth (during summer and fall) and survival (during winter) for juvenile Chinook salmon, a period that is modulated by climatic conditions (Beamish and Mahnkin 2001).
As juveniles grow and begin to feed predominately on fish, they migrate further offshore into the shelf areas of the Gulf of Alaska and Bering Sea, where there is information on their distribution from coded-wire tag (CWT) recoveries and genetic analysis of samples from various research cruises and from bycatch in Federal groundfish fisheries. These data indicate that most Chinook salmon originating in the Gulf of Alaska migrate north and west from their natal streams in Southeast and Southcentral Alaska along the Alaska Current, with some populations migrating as far as the Bering Sea (Larson et al. 2012). As an exception, some stocks in Southeast Alaska rear near shore and entirely within the confines of Southeast Alaska. Juvenile Chinook salmon in the Gulf of Alaska represent a complex and highly variable mix of Alaska populations primarily originating in Southcentral and Southeast Alaska, interspersed among populations and hatchery releases originating in Canada and the Lower 48. It appears that western Alaska and Bristol Bay populations of Chinook salmon do not make extensive migrations into the central or eastern Gulf of Alaska. Relative abundance of juvenile Chinook salmon in the Bering Sea tends to be related to distance from their natal river, with western Alaska and Bristol Bay populations making up the bulk of Alaska-origin fish in the Bering Sea, followed by western and central Gulf of Alaska populations, and then Southeast Alaska, Canadian, and Lower 48 populations.
As Chinook salmon grow and mature, they are thought to make seasonal migrations in the ocean to feed. For example, a conceptual model of Chinook salmon in the Bering Sea from high seas tag recoveries and stable isotope analyses suggest seasonal migrations onto the Bering Sea shelf during winter and out into the Bering Sea basin during summer (Myers et al. 2009). After typically spending three to six years feeding in marine waters on a variety of fish, squid, and euphausids, Chinook salmon in Alaska return back to natal systems to spawn. Maturation rate tends to be sex and population specific, with males tending to mature earlier than females and northern populations in Alaska maturing later than more southerly populations. Chinook salmon in Alaska return primarily at an age of five or six years, but can range in age from three to eight years.

6
EVIDENCE FOR STOCK-SPECIFIC DECLINES Patterns of Chinook salmon productivity and abundance generally have varied over time and among different areas of Alaska. However, recent declines in productivity, abundance, and inshore harvests appear widespread and persistent throughout Alaska.
Productivity of a salmon population is defined as the number of adult salmon produced per spawner when the number of spawners is low and competition is at a minimum. Because productivity of salmon populations is influenced by density-dependent factors related to the number of spawners present in any given year, it is useful to separate those effects from density-independent processes, such as environmental factors affecting the population. In doing so, trends in productivity are adjusted for the effect of spawner abundance, revealing the remaining trend in density-independence that is likely to provide evidence for widespread declines in productivity. This can best be accomplished by looking at time series of standardized residuals from stock-recruit analyses, which represent variation around the spawner-recruit relationship not explained by spawner density.
Recent analysis of these quantities for 12 Chinook salmon stocks from throughout Alaska (Catalano 2012) reveals that productivity residuals showed no consistent temporal pattern prior to brood (spawning) year 2001. In many brood years prior to 2001 there were approximately equal numbers of stocks showing positive or negative residuals. Beginning with brood year 2001, residual patterns in most of these stocks are consistently negative (Figure 1). This indicates that productivity was consistently lower than would be expected given the density-dependent effect of abundance of spawning adults in these brood years. The negative pattern of residuals continues through the most recently returning brood year of 2007. For more than half of these stocks, recent productivity residuals are the lowest observed since data collection began in the 1970’s. These declines in productivity would have begun to negatively affect run abundances and inshore harvests during calendar year 2005 when age-4 fish from the 2001 brood year returned to spawn, but most likely would have fully affected run abundances and inshore harvests during calendar year 2007 through the present when all ages classes would have been affected by a decline in productivity. Unfortunately, we do not have marine survival information for many of these stocks to determine if these declines in productivity were due to decreased survival in fresh or marine waters or both. We also lack information on Chinook salmon productivity in Alaska prior to the 1970’s that would allow us to understand the current downturn in relation to long-term patterns of productivity. A central element of this plan is to initiate new and improve existing stock assessment programs for a suite of indicator stocks so that consistent statewide evaluations of Chinook salmon productivity trends and the source of these trends may be made into the future.
Run abundance of a salmon stock is defined as the sum of stock-specific harvest and escapement that occurred during a single year and is the result of partial returns from three or more brood years of production, as juveniles from each of these multiple brood years mature and return from their feeding migrations in marine waters to spawn. Available run abundance data for Chinook salmon in Alaska indicate significant declines were first fully detected in 2007 as expected from a persistent drop in productivity that began in 2001. Run abundance data available from 21 stocks in Alaska show substantial variability and moderate to no coherence among stocks prior to 2004 (Figure 2). This was followed by consistent declines in run abundance across the state that became particularly coherent from 2007 to present, consistent with a downward trend in

7
productivity across the state. There are indications of a consistent downturn in Chinook salmon run abundance during the early to mid-1970s, although this observation is based on limited information from seven of the 21 stocks in Figure 2.
Inshore harvests are defined as Chinook salmon harvests from a specific area of the state that may be stock-specific or from a mixture of stocks. As productivity and run abundances trended downward statewide, management of fisheries became more restrictive to achieve established escapement goals. As a result, average annual inshore harvest of Chinook salmon in all Alaska fisheries during the 13-year period prior to coherent downturns in run abundance (1994–2006) and the 5-year period afterward (2007–2011) have decreased as follows: subsistence and personal use – 175,000 to 154,000 fish, about a 12% reduction; commercial – 584,000 to 425,000 fish, about a 27% reduction; and sport – 178,000 to 141,000 fish, about a 21% reduction (Table 1). Decreases in inshore commercial harvest of Chinook salmon occurred in all management areas of Alaska. Harvest in subsistence fisheries in western Alaska management areas were most affected by the downturn in abundance, whereas decreased harvest in sport fisheries was most notable in the Southeast, Copper River, and Cook Inlet areas. Records of inshore harvest of Chinook salmon exist prior to 1994 that could possibly be used to put the current downturn in a historic context, but these harvest data become confounded by marked changes in fishery management and available fishing power that occurred just after statehood as state-based management and limited entry in commercial fisheries were instituted.
Although there was a 12% reduction in average subsistence and personal use harvest of Chinook salmon statewide during the two time periods discussed above, the significance of decreased subsistence harvests of these fish are most severely felt in western Alaska, the Copper River, and Cook Inlet. Evidence of the importance of Chinook salmon as food and in support of cultural traditions can be seen in the reliance on these fish in villages of the Yukon and Kuskokwim rivers, which account for over 80% of the annual subsistence harvest of Chinook salmon in Alaska. Amounts necessary for subsistence (ANS), set by the Alaska Board of Fisheries for these two drainages are 44,500 to 66,704 fish for the Yukon and 64,500 to 83,000 fish for the Kuskokwim. These ANS harvests were not met during 2008 through 2011 on the Yukon River and in 2011 on the Kuskokwim River.
Other smaller subsistence fisheries exist around the state, with ANS amounts determined specifically for Chinook salmon in the Susitna (700 to 2,700 fish) and Chignik (100 to 150 fish) drainages. Amounts necessary for subsistence were not met in the Susitna drainage fishery at Tyonek during 2009 and 2011. Although there are no Chinook salmon-specific ANS in the Nushagak and Copper drainages, significant subsistence fisheries exist and harvests from these two areas have decreased since 2007.
Chinook salmon are also harvested offshore in the Exclusive Economic Zone off Alaska as bycatch in groundfish fisheries. Most of the bycatch occurs in trawl fisheries, primarily for pollock. Bycatch of Chinook salmon in the Bering Sea/Aleutian Islands area declined 14% during the time periods 1994-2006 (average of 47,000 fish) and 2007-2011 (average of 41,000 fish; Table 1). Bycatch of Chinook salmon in the Gulf of Alaska increased 33% during these same time periods (from an average of 19,000 fish to an average of 28,000 fish), primarily due to a large bycatch in 2010. Recent peaks in bycatch occurred in 2007 in the Bering Sea/Aleutian Islands and in 2007 and 2010 in the Gulf of Alaska. The bycatch is of mixed-stock origin, with a portion coming from stocks outside of Alaska. The bycatch is also a mix of juvenile and adult Chinook salmon. The magnitude of adult equivalent bycatch of coastal western Alaska Chinook

8
salmon stocks (Bristol Bay, Kuskokwim, lower Yukon, and Norton Sound stocks) in the Bering Sea/Aleutian Islands pollock fishery appears related to brood year abundances of these stocks.
In summary, there is clear evidence of recent and persistent statewide declines in Chinook salmon productivity, run abundance, and inshore harvest from available stock assessment data as well as from local and traditional knowledge sources. This decline in productivity appears to have begun with the 2001 brood year and has persisted through at least the 2007 brood year, resulting in below average run abundance and harvest during 2007 through the present. There is some evidence that a statewide downturn in run abundance occurred during the early to late 1970s, but this is based on incomplete information. Trends in stock-specific productivity during brood years 1975 through 2000 and in run abundance during 1977 through 2006 did not appear consistent statewide, although some regional trends were apparent throughout the time series.
What is not clear from available data is where, when, and how changes in productivity of Chinook salmon occurred. Also unclear is why the downturn in abundance is currently statewide, but was apparently not statewide in extent during the recent past. Moreover, available data were insufficient to foresee this downturn as it began and to readily adapt fishery management schemes as it occurred. Fishery management has been responsive to lower run abundances in an attempt to achieve escapement goals. However, these responses have been very conservative in the face of uncertainties in run abundance and timing. Conservative management in the face of uncertainty will sustain Chinook salmon stocks by reducing the risk of overfishing and inadequate escapements, but it will also increase the risk of foregone harvest opportunities that can threaten the viability of social and economic systems in Alaska that are highly dependent on Chinook salmon for their cultural value, sustenance, and income. Better information is needed from all life stages of Chinook salmon so that downturns in productivity and abundance can be forecasted, escapement goals and methods of developing escapement goals can be improved to account for changes in productivity, and fishery management can become more responsive to inseason changes in abundance and run timing to better balance the risk of overfishing with the risk to fishery viability.
FUNDAMENTAL KNOWLEDGE GAPS Several questions come to mind in attempting to understand the current statewide downturn in abundance of Chinook salmon in Alaska in the context of improving management capabilities. For example, did the change in productivity occur due to changes in survival rates in freshwater, marine waters, or both and did the influence of freshwater versus marine survival vary among areas of the state? What factor or factors causes these changes in freshwater and marine survival rates and do these factors vary over time and by area of the state? What is the expected productivity of the 2008 brood year and beyond? If the causative factor occurs in marine waters, what additional information would we need to help predict run size? If the causative factor is in freshwater, what additional information would we need to help predict run size? Are run abundance data accurate and precise enough to set management targets that are robust to downturns in productivity? Are inseason assessments of run abundance accurate and precise enough to manage for below average yields while maintaining minimum escapements? Does the downturn in productivity suggest that lower escapement goals are appropriate?
As described in the previous sections of this plan, there are gaps in current stock assessment data and these gaps in knowledge prevent us from fully addressing many of the questions posed above. Based on current knowledge of Chinook salmon life history, salmon production theory,

9
and our understanding of freshwater and marine physical and biological processes in Alaska and the North Pacific Ocean, the fundamental gaps in our knowledge can be categorized into four broad and interrelated categories:
· Lack of basic abundance and rate information during key periods in the Chinook salmon life history.
· Limited understanding of when and where productivity has been changing.
· Limited understanding of what is changing productivity.
· Limited ability to adapt knowledge of Chinook salmon life history into escapement-based fishery management strategies.
ABUNDANCE AND RATE INFORMATION Accurate and precise measurements of abundance during key periods in Chinook salmon life history are critical and foundational to addressing gaps in our knowledge. Key life history metrics are adult spawning escapements; one or more juvenile stages in freshwater, especially the stage just prior to emigration to marine waters as smolts; one or more stages in marine waters, especially the stage during the first year of marine residence as juveniles; and, total returning abundance represented as adults or adult equivalents. Interrelationships between abundance at each life stage can be represented as a rate of production or survival. Specifically, the rate of production resulting from an adult spawner to the subsequently returning adults can be partitioned into a series of multiplicative rates between life stages, that when combined result in the familiar return-per-spawner ratio. For example, with brood year adult escapement (S), smolt produced from that brood (J), and subsequent return of smolts from that brood as adults (R), the adult return-per-spawner ratio for that brood year is simply:
JR
SJ
SR
×= , where
SJ is the production of that brood year in terms of smolt produced (J) per adult spawner (S) and JR is the survival of that brood year in terms of returning adults produced (R) per smolt
produced (J). In this example, smolt abundance is used to partition total production from spawning adult back to returning adult into two multiplicative rates, which can be thought of as freshwater production and marine survival. Note that total abundance at other life stages (e.g., fall fry or early marine juvenile) can be inserted into this relation as a rate to substitute for the smolt life stage or to further partition the total rate of adult production. At a minimum, rates of a freshwater stage (fry or smolts) produced per adult spawner, and of returning adults produced per smolt or fry must be estimated to begin to address gaps in knowledge of Chinook salmon.
Partitioning of the Chinook salmon life cycle into freshwater ( SJ ) and marine ( JR ) phases requires that total abundance be estimated at each life stage. In the example above, accurate and precise estimates of adult spawning escapement (S), smolt abundance (J), and the total return of these smolt as adults (R) are required to partition production into freshwater and marine components.
Direct estimation of adult spawning escapement is generally straightforward with annual weir counts, mark-recapture, or sonar, but may require subtraction of harvests that occur upstream of

10
an inriver enumeration site. Smolt or fry abundance is usually estimated by mark-recapture methods, by marking smolts or fry in freshwater and recoveries of marked adults returning to freshwater. Because of the variable and multiple year maturation schedule of Chinook salmon, total return of adults requires several years of estimation of all stock-specific harvests and inriver runs or escapements as well as estimates of age composition of all harvests and inriver runs. Stock-specific harvests are either estimated directly if a single stock is being harvested or must be estimated from mark-recapture and/or genetic stock identification methods if harvests are mixed-stock. Age compositions are estimated with samples taken from stock-specific harvests and inriver runs.
In evaluating stock assessment programs throughout Alaska, we find that measures of these basic elements of the life cycle of Chinook salmon are either partially or completely missing. Enumeration of escapement or of the inriver run is lacking or incomplete in many Chinook salmon stocks in Alaska. For all but a few select stocks in Southeast Alaska, there are no programs to estimate Chinook salmon fry or smolt abundance in Alaska. While inshore harvests of Chinook salmon are generally well estimated in Alaska, programs to estimate stock-specific harvest in mixed-stock subsistence, commercial, and sport fisheries are lacking in many areas of the state. Stock identification in fishery harvests using genetic tools is still developing and frequently lacks desired stock-specific resolution in some parts of the state, especially in western Alaska. Age composition data are generally available for many Chinook salmon stocks, but some programs lack age composition data from either stock-specific harvests and/or escapements. Estimates of adult equivalent bycatch of Chinook salmon in groundfish fisheries in the Gulf of Alaska and Bering Sea are only available for broadly defined genetic reporting groups and cannot yet be fully integrated into Chinook salmon stock assessments.
Our review of stock assessment capability also assessed the availability of local and traditional knowledge (LTK) for the 12 indicator stocks. Such knowledge, based upon local observations and experience and generally shared within Alaska communities across generations, can provide detailed insights about salmon stocks, such as historic and current population sizes and ranges, condition, habitats, and run timing. This information informs and compliments stock assessments accomplished through fisheries science. In addition, studies of LTK directly engage fisheries users in cooperative efforts to document and understand stock status and trends. While a great deal of local and traditional knowledge is held by Alaskans, studies to systematically record and communicate this knowledge are lacking for most Chinook salmon stocks in the state.
These basic and fundamental gaps in knowledge of abundance hinder understanding of variation and trends in freshwater production and marine survival over time and confound the ability to discern density-dependent effects (i.e., limitations in production due to stock-specific competition in freshwater) from density-independent effects (i.e., limitations in production due to the environment and the ecosystem) in determining spawning escapement goals that will optimize fishery yields.
WHEN AND WHERE PRODUCTIVITY IS CHANGING Basic adult and smolt abundance information is vital to understanding rates of production and survival of Chinook salmon. This information is also foundational to understanding when and where productivity is changing and abundance trends are determined. However, information on adult and smolt abundance alone may be insufficient to understanding trends in productivity and abundance. For example, if brood year strength is largely determined after the smolt stage, then
11
early marine juvenile Chinook salmon abundance may be needed to better understand the trends in production we observe. If much of the observed variation in production is occurring in freshwater, then smolt abundance data may be sufficient to track trends. However, brood year strength may be established during the fry stage so it may be important to estimate fry abundance as well as smolt abundance.
Integration of abundance data from various stages of Chinook salmon life history into models will increase understanding why trends may differ across regions of the state and why trends become coherent at times. For example, at times both freshwater and marine survival rates may be negatively affecting production whereas at other times only marine survival rates are negatively affecting production; and where and when marine survival rates are determined may also change. Abundance information and models of life history can also be combined with studies of important processes thought to affect trends in productivity of Chinook salmon. For example, summer growth of Chinook salmon during their early marine residence is thought to affect survival over their first winter in the ocean. This hypothesis can only be adequately tested if there are accurate and precise estimates of abundance at life stages just before and after these critical time periods. Beyond the minimum requirements of adult and smolt abundance, understanding when and where to direct stock assessment efforts towards abundance estimation will be a significant technical, logistic, and financial challenge.
HOW PRODUCTIVITY IS CHANGING Although fishery management can be improved by a better understanding of where and when productivity is changing and brood year strength is determined, the ability to predict and adapt to changes in productivity will only progress if the actual processes that control productivity of Chinook salmon can be understood. Process information gained while conducting freshwater and marine abundance estimation and from sampling of fishery harvests or bycatch can be used to understand what causes productivity to vary.
Freshwater ecosystems in Alaska are experiencing changes due to climate change (Clark et al. 2010). Observed and hypothesized changes in aquatic environments range from altered stream temperatures, changes in precipitation patterns and flow regimes, to changes in distributions of prey and predators. These changes may have significant impacts on freshwater production of Chinook salmon at the statewide scale, although effects of these changes will likely vary from region to region of Alaska and have varying effects on Chinook salmon production. Because stream-type Chinook salmon spend one winter in freshwater as juveniles, growth during the first summer after hatching will likely affect overwinter survival. In addition to lacking abundance information at the smolt and fry stage that can be compared statewide, comprehensive process studies of growth, feeding, and survival in freshwater are lacking throughout Alaska. Moreover, there is a lack of basic physical data on stream temperature, stream flow, and explanatory landscape features that can be analyzed and compared at the regional and statewide scale.
Chinook salmon spend most of their life history and achieve most of their growth in the marine environment. A major hypothesis concerning the survival of salmon in the marine environment is that there is a critical size and time period when brood year class strength is determined. It is currently thought that salmon must gain sufficient growth during their early marine residence during summer and fall so that they have sufficient energy stores to survive their first winter at sea (Beamish and Mahnkin 2001). The critical growth period during early marine residence of Chinook salmon likely occurs in nearshore areas whereas overwintering is thought to occur
12
further offshore. Availability and quality of food and abundance of predators at this time are critical variables in determining early marine growth. Studies to measure these quantities have been and are being conducted in the Bering Sea and in Southeast Alaska, although the focus has not been on Chinook salmon. Alternatively, studies to measure and integrate physical proxies (e.g., ocean circulation patterns) for prey and predator distribution and abundance have been conducted, especially in the Bering Sea (Hunt et al. 2011, Cooper et al. 2012), and have begun in the Gulf of Alaska.
Understanding how productivity is changing in salmon and Chinook salmon in particular will be critical if fishery managers are to understand and respond to the potential consequences of large scale environmental drivers such as climate change and ocean acidification. This information may also become critical to our ability to mitigate the interaction of groundfish fisheries and their bycatch of Chinook salmon in a timelier manner.
ADAPTING FISHERY MANAGEMENT As a consequence of gaps in knowledge of abundance of Chinook salmon during their life history, lack of knowledge of where and when productivity has changed, and a limited understanding of the factors controlling productivity trends, fishery managers are forced to react to changes in run abundance with a high degree of precaution so that escapement goals can be achieved. This forces the balance of competing risks to fall disproportionately on the viability of the fishery and the social and economic systems that are reliant on the fishery. While fishery managers will likely not be able to control the effect of natural processes on productivity of Chinook salmon, with improved abundance and life history process information, they could begin to more accurately forecast and adapt management systems to allow for sustained annual harvests of Chinook salmon while ensuring escapements are adequate to optimize yields in the future. For example, improved prediction of run timing based on environmental variables has been shown to increase management precision of Chinook salmon in the lower Yukon River (Mundy and Evenson 2011). Although not specifically for Chinook salmon, Wertheimer et al. (2009) have developed a forecast of pink salmon harvest in Southeast Alaska based on an index of juvenile abundance derived from a nearshore marine trawl survey.
Improved abundance and life history process information will also aid in the development of escapement goals for Chinook salmon stocks in Alaska. Separation of variability in production into freshwater and marine components will improve precision of stock-specific freshwater carrying capacity and optimization of escapement levels that will achieve sustained yields. These data will also help to inform forecasts of returning Chinook salmon so that managers can adequately forewarn fishery stakeholders of anticipated management actions and expected yields. Models of life history process and production of Chinook salmon could lead to development of management techniques and strategies that are robust to changes in climate.
METHODS TO ADDRESS KNOWLEDGE GAPS USE OF INDICATOR STOCKS Chinook salmon stocks that spawn in different areas of Alaska have differing migratory patterns and contributions to fisheries, so that an effort to comprehensively understand Alaska Chinook salmon productivity and abundance trends must include a variety of geographically distinct stocks. Comparison of productivity and abundance trends across stocks experiencing different

13
freshwater and marine environments will assist in identification of causal mechanisms acting at local or much broader geographic scales.
In Alaska, there are hundreds of individual Chinook salmon stocks. Available information for individual stocks ranges from simple knowledge that Chinook salmon spawn in a certain water body to detailed information including spawning abundance, inshore harvests, smolt production, and freshwater and marine survival statistics. We recommend establishing a suite of Chinook salmon indicator, or principal stocks, and implement a minimum stock assessment program for each stock as described in the Research Recommendations section of this plan.
Establishing a suite of indicator stocks will provide an ongoing statewide index of Chinook salmon productivity and abundance trends across a diversity of drainage types and size, representing a wide range of ecological and genetic attributes from Southeast Alaska to Arctic waters. These stocks also produce a large proportion of the statewide Chinook salmon harvest and are cultural, subsistence, and economic mainstays of the communities located within each river drainage. We have recommended twelve Chinook salmon indicator stocks: Unuk, Stikine, Taku, Chilkat, Copper, Susitna, Kenai, Karluk, Chignik, Nushagak, Kuskokwim, and Yukon. Many of these stocks represent complex arrays of tributary-spawning sub-stock components that may differ in productivity and abundance trends, challenging our ability to accurately describe overall productivity and abundance trends for these large indicator stocks. However, there is considerable uncertainty in identifying sub-stocks in harvests that occur in the ocean or river mainstem and in identifying juveniles from these sub-stocks that may be rearing in waters away from their natal tributary. These uncertainties reduce the utility of using sub-stocks as indicators of trends in large complex river systems. Nevertheless, where tributary-spawning sub-stocks or groups of sub-stocks are genetically identifiable, they represent opportunities for use as practical and precise indices of trends of these large river indicator stocks. Lastly, we recognize that there are numerous other stocks that could justifiably be included, but tried to strike a compromise that provides broad representative coverage across Alaska, but is not overwhelming in scope and cost.
We recommend that a stock assessment program be implemented for each of the twelve Chinook salmon indicator stocks that promote the following features:
1. Ability to estimate annual Chinook salmon escapement for each indicator stock, along with the annual age-sex-size composition.
2. Ability to comprehensively estimate annual total harvest of each Chinook salmon indicator stock, along with the age-size composition.
3. Ability to estimate production in adult equivalents for each Chinook salmon indicator stock for each brood year.
4. Ability to estimate the number of smolt produced by brood year for each Chinook salmon indicator stock; from these statistics and data from number 1 above, estimate smolt production per spawner for each Chinook salmon indicator stock for each brood year (freshwater survival).
5. Ability to estimate marine survival for smolt emigrating from each Chinook salmon indicator stock for each brood year.
6. Ability to estimate annual abundance of each stock in the nearshore marine environment for use in forecasting.
14
7. Ability to update and refine production models to improve estimation of escapement that produces maximum sustained yield for each Chinook salmon indicator stock.
8. Ability to provide forecasts of returns for each indicator stock for improved management capability.
9. Ability to provide adequate local traditional knowledge (LTK) concerning patterns and trends of use for each indicator stock.
We reviewed existing stock assessment programs for each of the twelve indicator stocks and identified gaps in knowledge required to achieve the features described above. In some cases, existing in-river assessment programs are adequate to assess total escapement, in other cases, only tributary escapement assessment programs exist, or existing in-river assessments have known biases that require attention. Often, only inshore harvest accounting exists and existing assessments of stock contributions to fisheries are based upon assumptions with little corroborating evidence. In some cases, inriver harvest-accounting is likely biased and improvements are needed. In many cases, we lack LTK information to help provide context to the current downturn and to provide evidence of long-term changes in local environmental conditions and phenology of biological events. General methods of addressing these knowledge gaps are described in the following sections of this plan.
ESTIMATION OF ADULT ABUNDANCE Estimation of adult abundance requires stock-specific information on the escapement or inriver run as well as all of the inshore and offshore harvests. Escapement is usually estimated directly from run abundance in freshwater unless there are harvests upstream of where run abundance is measured. Total run is the sum of inriver run abundance or escapement plus all stock-specific harvests that occur downstream of where run abundance is measured, including inshore and offshore harvest in adult equivalents if juvenile salmon are harvested. Stock-specific age composition of adults is needed from each component of the total run so that these abundances can be used to determine brood year production.
Escapement or inriver run can be enumerated directly with weirs (e.g., Karluk); estimated from expanded tower or sonar counts (e.g., Nushagak), or from mark-recapture experiments using external tags (e.g., Taku) or genetic markers (either genetic stock identification or parental-based marks); or, reconstructed using a statistical model of an index or indices of run size and formulations of how the index or indices relate to the total escapement or inriver run (e.g., Kuskokwim). Age compositions are estimated from scales taken from individual fish as samples during weir counts or as part of the estimation process.
Stock-specific harvests can be estimated directly from permit returns, creel or household surveys, and/or fish tickets if the harvests occur solely on one stock. For mixed-stock harvests from inriver, inshore, and offshore fisheries, stock-specific harvest can be estimated by genetic stock identification (GSI) techniques, or from contributions from CWT recoveries. For all of these methods, the mixed-stock harvest must be sampled to obtain genetic tissues or examined for presence of an external mark (adipose fin clip) indicating the fish bears a CWT. A combination of GSI and CWT techniques would be optimal for estimation of stock-specific contributions in situations where coded-wire-tagged (CWT-tagged) fractions of a stock are low (see next section) and contributions are thought to be small due to small stock size or due to low contributions to a
15
large overall harvest. Age composition is estimated from scales taken from individual fish as samples during GSI tissue collection and/or examination of fish for external marks.
GSI methods require that a comprehensive baseline be available that represents all potentially contributing populations. In addition, there must be sufficient difference measured among the populations or population groups (stocks) with the genetic markers used to allow the mixed stock analysis method to resolve stock composition with defined levels of accuracy and precision. In general, genetic differences should allow for a misclassification rate of less than 10% and stock composition estimates should be ±5% of the true value 90% of the time. Resolution of the current baseline is described in Templin et al. (2011a). One of the main areas where the current genetic baseline lacks the ability to achieve these levels of genetic discrimination is among coastal western Alaska stock groups (Bristol Bay, Kuskokwim, lower Yukon, and Norton Sound stocks) of Chinook salmon.
ESTIMATION OF JUVENILE ABUNDANCE Typically, abundance of smolt (or fry) is estimated within a mark-recapture experiment. Smolt or fall fry are captured in freshwater by a variety of techniques including baited minnow traps, inclined-plane traps, or screw traps and CWT-tagged. The adipose fin is also removed as an external mark. Trapping of smolt occurs primarily during late winter and early spring prior to emigration or as fry during fall prior to overwintering. The most successful implementation of this type of mark-recapture experiment occurs when recoveries of CWT-tagged fish are made when they return as adults. Because this type of experiment usually results in a very low proportion (typically 1 or 2%) of the population of smolt or fry marked, sample sizes for examination of adults for CWTs must be large enough for precise estimation of juvenile abundance. Large numbers of returning adults can be examined at weirs or other stock-specific near shore or inriver sampling programs such as from terminal fisheries, inriver test netting, carcass sampling, or an inriver fishery.
This mark-recapture method has been shown to provide precise and accurate estimates of smolt abundance even in relatively large and occluded river systems such as those found in southeast Alaska. Pahlke et al. (2010) reported that sufficient numbers of smolt could be CWT-tagged over the duration of their emigration to saltwater in the Stikine River to achieve relatively precise estimates of smolt abundance. For example, by marking approximately 24,000 smolt from the 2002 brood year and examining approximately 8,500 returning adults in succeeding return years they were able to achieve a coefficient of variation of approximately 10% on their estimate of smolt abundance. In some applications of this method both fall fry and smolt are CWT-tagged, resulting in an estimate of fry abundance, smolt abundance, fry to smolt survival, and smolt to adult survival rates.
There are other methods of smolt abundance estimation worth considering. Parental-based tagging shows promise as a method to estimate juvenile abundance in Chinook salmon stock using methods of accumulation curves and capture-mark-recapture techniques (Lukacs and Burnham 2005, Petit and Valiere 2006). In some circumstances, direct estimation of smolt abundance can be achieved using screw traps and time-stratified mark-recapture estimators (e.g., Bonner and Schwarz 2011).
Stock-specific abundance of juvenile Chinook salmon in marine waters can be estimated using a combination of GSI sampling to identify stocks and the area-swept estimation of abundance. Catches from trawl surveys conducted using a systematic spatial sampling design are expanded

16
for area swept to estimate overall abundance of juveniles in an area. For example, the Bering Aleutian Salmon International Survey (BASIS) program has used a surface rope trawl to quantitatively sample juvenile salmon in the Eastern Bering Sea (Farley et al. 2005). From the BASIS program, CWT recoveries and GSI were used to identify coastal western Alaska, middle Yukon, and upper Yukon populations of Chinook salmon in trawl catches for analysis (Murphy et al. 2009).
PROCESS STUDIES The most common growth studies on Chinook salmon examine growth determined from standardized measurements taken from scales where freshwater and marine zones of growth are readily discerned and can be compared to environmental variables and stock production data. These studies can help our understanding of how growth during various life stages interacts with and affects survival between life stages. ADF&G holds an extensive historic collection of Chinook salmon scales that provides a valuable resource for comparative studies using time series data (Ruggerone et al. 2009). Alternatively, long term collections of age, sex, and size data may help to inform observed reductions in size-at-age of mature Chinook salmon in the indicator stocks, which could negatively affect productivity due to declining female fecundity and egg size. Other process studies emphasize the estimation of energy content (via measurement of lipid content) or feeding ecology (via measurement of fatty acids or stable isotopes). These studies seek to explain changes in observed growth or estimated survival rates between life stages by relating these quantities to energy reserves or where juveniles are feeding and what they are feeding on during a particular life stage.
LOCAL AND TRADITIONAL KNOWLEDGE The North Pacific Research Board’s Science Plan (NPRB 2005:144) includes a useful definition of local and traditional knowledge (LTK) as:
“an array of information, understanding, and wisdom accumulated over time based on experience and often shared within a group or community. This knowledge may be the product of an individual’s time on the land or sea (local knowledge), or it may be accumulated over generations and perpetuated within a culture (traditional knowledge).”
Regarding Chinook salmon, LTK can provide detailed observations about abundance, distribution, run timing, condition, and habitat, often focused on specific locations and informed by considerable time depth. In addition to empirical information, LTK raises research questions and hypotheses for further investigation and testing. Thus LTK studies seek both to document local knowledge and to involve the holders of this knowledge directly in applying this information to inform scientific inquiries and fisheries management.
LTK research may involve several interrelated methods. These include:
· Key respondent interviews. Semi-directed interviews with knowledgeable individuals who are identified by community members or through researchers’ experience explore key topics and research questions using an interview guide or protocol (Huntington 1998; Bernard 2011). An important element in key respondent, or in-depth qualitative interviews, is to collect information from a range of people who have first-hand knowledge about a topic. By conducting interviews with a diverse group of
17
knowledgeable respondents, bias in the results is reduced. It also provides an opportunity to gather information from those with varying experiences related to the subject or topic in question. Using maps often helps ground LTK within particular areas, and a life-history approach establishes a time frame for a respondent’s observations. Such interviews are often audio-taped, with permission; portions may be transcribed or summarized, and are indexed and analyzed using key words and concepts.
· Group discussions. Several experts on a topic are brought together for a semi-directed discussion, using the same tools as are available for key respondent interviews. An advantage is that group dialogues stimulate memories and help identify areas of consensus as well as ranges of experience and observations.
· Participant observation. Researchers accompany fishers during harvesting and assist with processing at fish camps, recording LTK offered during these activities in field notes. LTK is sometimes more accessible during actual practice of subsistence activities than during formal interviews in a home or office setting.
· Literature review: ethnographic and ethnohistoric documents. LTK often is available in published or archived traditional stories, life histories, ethnographies, and community histories. These sources add time depth to contemporary LTK, and may be used to expand the geographic scope of field projects.
· Recording comments during post season harvest surveys. ADF&G conducts post-season harvest surveys with subsistence fishing households in several management areas, most notably the Kuskokwim and Yukon areas. While providing harvest data, survey respondents often offer LTK in the form of evaluations of abundance and run timing, and the condition of salmon. These qualitative data can be recorded on the survey forms for later analysis. Projects that obtain assessments of salmon returns and subsistence harvests in-season from subsistence fishers can also record LTK offered during these discussions for further analysis.
· Local observer networks. A formal process is developed whereby local fishers and other observers may report observations and interpretations directly to a central location. An example is the Local Environmental Observer (LEO) network organized by the Alaska Native Tribal Health Consortium (www.anthc.org/chs/ces/climate).
The results of LTK research can be summarized in technical reports, journal articles, community presentations, and written overviews intended for the general public. The content of interviews and surveys can be organized in databases that are accessible through key word searches.
The NPRB’s Science Plan (NPRB 2005:146) notes that to contribute to scientific and management goals, LTK research must meet standards as high as those applied to all other scientific programs. Rigorous LTK studies have clear research goals, sound methods, an appropriate scope, qualified personnel, and an adequate budget, as identified through a research design. Finally, and equally important, successful LTK studies require a strong community role and must meet the ethical standards for social science research, including voluntary participation, informed consent, anonymity if requested, community review, and sharing of findings with the study communities.
18
DEVELOPMENT OF MANAGEMENT STRATEGIES There are several avenues for development of improved management strategies for Chinook salmon. Improved adult abundance and harvest rate information will quickly alert management to potential surpluses available for harvest that were previously unavailable due to a lack of information.
As better information on adult and juvenile abundance accumulates for the twelve indicator stocks, stock-recruitment analyses for determination of escapement goals can be refined to account for partitioning of survival between life stages. Stock-recruit analyses for other non-indicator stocks will also potentially benefit from “borrowing” production information from the twelve indicator stocks in the form of Bayesian priors on the parameters of stock-recruitment relationships. Comparable trend information from the twelve indicator stocks can be used to develop an annual statewide outlook for Chinook salmon runs and harvest in Alaska.
Availability of stock-specific abundance information on early marine life stages may begin to be integrated into forecasts of run abundance and run timing. Estimates of stock-specific harvest of juvenile salmon in inshore and offshore fisheries can be converted into adult equivalents and integrated into stock-recruitment analyses and forecasts. Results of process studies will help to inform managers of impending changes in survival rates in the face of changes in ecosystems due to environmental or human-induced drivers.
RESEARCH RECOMMENDATIONS STOCK- AND FISHERY-SPECIFIC Stock assessment and research recommendations specific to each of the twelve indicator Chinook salmon stocks and their associated fisheries are described in this section of the plan (Tables 1 and 2). Approximate annual costs for these recommendations are found in Table 4.
Unuk River The Unuk River is a heavily glaciated transboundary river that empties into the northeast corner of Behm Canal approximately 85 km east of Ketchikan. The drainage is around 2,500 km2 and supports a moderate run of about 7,000 large (essentially 28 inches and greater) fish annually, typically the fourth largest run of Chinook salmon in Southeast Alaska. Recent harvest rates have been around 20% and escapements have averaged about 5,500 large fish, annually (Figure 3). Chinook salmon from the Unuk River have a “stream type” life history as nearly all juveniles reside for one year in fresh water before emigrating in the spring as age-1.0 smolt. The biological escapement goal (BEG) is 1,800 to 3,800 large fish, with a point estimate of 2,764. In the past 35 years, estimated escapements have been within or above the escapement goal range each year.
Fishery Description Recoveries of CWTs suggest that Unuk River Chinook salmon primarily rear within the confines of Southeast Alaska and Northern British Columbia, with a few recoveries from the Bering Sea and Gulf of Alaska. Harvest rates outside of Southeast Alaska are unknown because detailed CWT sampling programs do not exist in these waters. On average, for the 1992–2001 broods, harvests have been highest in the Southeast Alaska troll (47%), sport (36%), and net (10%) fisheries, and most of the remainder has been caught in Northern British Columbia. The majority of the harvest occurs in the southern inside area of Southeast Alaska.

19
Current Stock Assessment Escapement of large Chinook salmon in the Unuk River is estimated annually using a mark-recapture study that first began in 1997. In addition, standardized observer counts of large Chinook salmon escapement started in 1977. Radio telemetry studies were conducted in 1994 and 2007, and results indicated that observer surveys covered 80% of the spawning area. The mean expansion factor of 4.83 was estimated using 7 years of coupled mark-recapture estimates and peak observer counts. In addition to the adult work, juvenile Unuk River Chinook salmon were first tagged with coded wire beginning with the 1982 to 1986 broods, and more recently, with the 1992 to present broods. Coupled with a marine sport and commercial harvest sampling program that began in 1994 in Southeast Alaska, estimates of harvest for this region are available for the 1992 to the present brood years.
Gaps in Current Stock Assessment Harvest estimates from the Gulf of Alaska and Bering Sea are unknown. Currently there are no detailed CWT sampling programs in place in the Gulf of Alaska and Bering Sea to gather the information necessary to accurately assess harvest rates from these waters. The majority of funding has been provided through the Dingell-Johnson Act (D-J) that provides federal funds to the state for the management and restoration of fisheries having a sport fishing connection. Other sources have included the Alaska Sustainable Salmon Fund, which are federal funds from the Pacific Coastal Salmon Recovery Fund (AKSSF), and the Pacific Salmon Commission’s (PSC) Chinook Technical Committee’s Letter of Agreement (LOA), which are federal funds allocated to the PSC for abundance-based management of Chinook salmon. Future funding from these sources is considered doubtful.
Recommended Stock Assessment Projects We have identified the following projects as beneficial to increasing our knowledge of this stock:
· Stable funding for the current annual adult mark-recapture and age, sex, and length sampling project.
· Stable funding for the current annual juvenile CWT-tagging program.
Stikine River The Stikine River originates in British Columbia and flows into central Southeast Alaska east of the towns of Petersburg and Wrangell. The anadromous portion of the drainage is around 15,000 km2 and supports a run of about 44,000 large (essentially 28 inches and greater) fish annually, typically the second largest run of Chinook salmon in Southeast Alaska. Recent harvest rates have been around 50% and escapements have averaged about 22,000 large fish, annually (Figure 4). Chinook salmon from the Stikine River have a “stream type” life history because nearly all juveniles reside for one year in fresh water before emigrating in the spring as age-1.0 smolt. The BEG is 14,000 to 28,000 large fish with a point estimate of 17,500. Since 1985, escapements to the Stikine River were within or above the escapement goal range every year except 2009.
Fishery Description Recoveries of CWTs indicate that Stikine River Chinook salmon mostly rear in the Bering Sea and Gulf of Alaska. Harvest rates outside of Southeast Alaska are unknown because detailed CWT sampling programs do not exist in these waters. In 1976, as part of a coastwide Chinook

20
salmon rebuilding program, springtime commercial gillnet fishing was closed until the third Monday in June in Southeast Alaska. As a result, most Chinook salmon bound for the Stikine River were harvested in the Petersburg and Wrangell marine sport fisheries and incidentally in the District 108 sockeye gillnet fishery. However, with development of the detailed Chinook salmon stock assessment program on the Stikine River, members from the U.S. and Canadian Transboundary River Panel (TBR) of the PSC successfully negotiated new directed Chinook salmon fisheries as part of the Pacific Salmon Treaty (PST) beginning in 2005. These fisheries were only implemented during periods of surplus escapement as determined using preseason forecasts and inseason estimates of total terminal run. Prior to 2005, harvest rates were around 20%, but since the onset of directed Chinook salmon fishing, harvest rates on Stikine River Chinook salmon have averaged around 50%. Most harvests occur in the U.S. commercial gillnet and sport fisheries near Petersburg and Wrangell, and inriver in the Canadian gillnet and aboriginal fisheries.
Current Stock Assessment Escapement of large Chinook salmon in the Stikine River is estimated annually using a mark-recapture study that first began in 1996. In addition, standardized observer counts of large Chinook salmon escapement started in 1975 and since 1985, counts were made exclusively using a weir operated at the Little Tahltan River. Radio-telemetry studies were conducted in 1997 and 2005, and results from telemetry, along with the mark-recapture studies, indicated that the weir counts represented about 20% of the total escapement. In addition to the adult work, juvenile Chinook salmon were first tagged with coded wire in the Stikine River 1976, 1979, and 1980 broods and more recently, with the 1998 to present broods. This CWT-tagging program was used to estimate smolt abundance and to also estimate harvests of Stikine-origin Chinook salmon in the commercial and sport fisheries near Wrangell and Petersburg, and in the commercial troll fishery in Southeast Alaska.
Gaps in Current Stock Assessment Harvest estimates from the Gulf of Alaska and Bering Sea are unknown. Currently, there is no detailed CWT sampling program in the Gulf of Alaska and Bering Sea to gather the information necessary to accurately assess harvest rates from these waters. A GSI program is used annually to distinguish Stikine-origin fish in Chinook salmon harvests from the Petersburg and Wrangell marine fisheries, and additional baseline samples from inriver spawning tributaries would strengthen the program and reduce misclassification error. Past funding sources have included various federal and PSC-supported funding sources (e.g., LOA, Northern Fund, and Canada). Future funding from these sources is considered uncertain.
Recommended Stock Assessment Projects We have identified the following projects as beneficial to increasing our knowledge of this stock:
· Stable funding for the current annual juvenile CWT-tagging programs.
· A study of local and traditional knowledge of the Stikine River Chinook salmon stock.
Taku River The Taku River originates in British Columbia and flows into Taku Inlet south of Juneau. The drainage is around 17,000 km2 and supports a run of about 48,000 large (essentially 28 inches
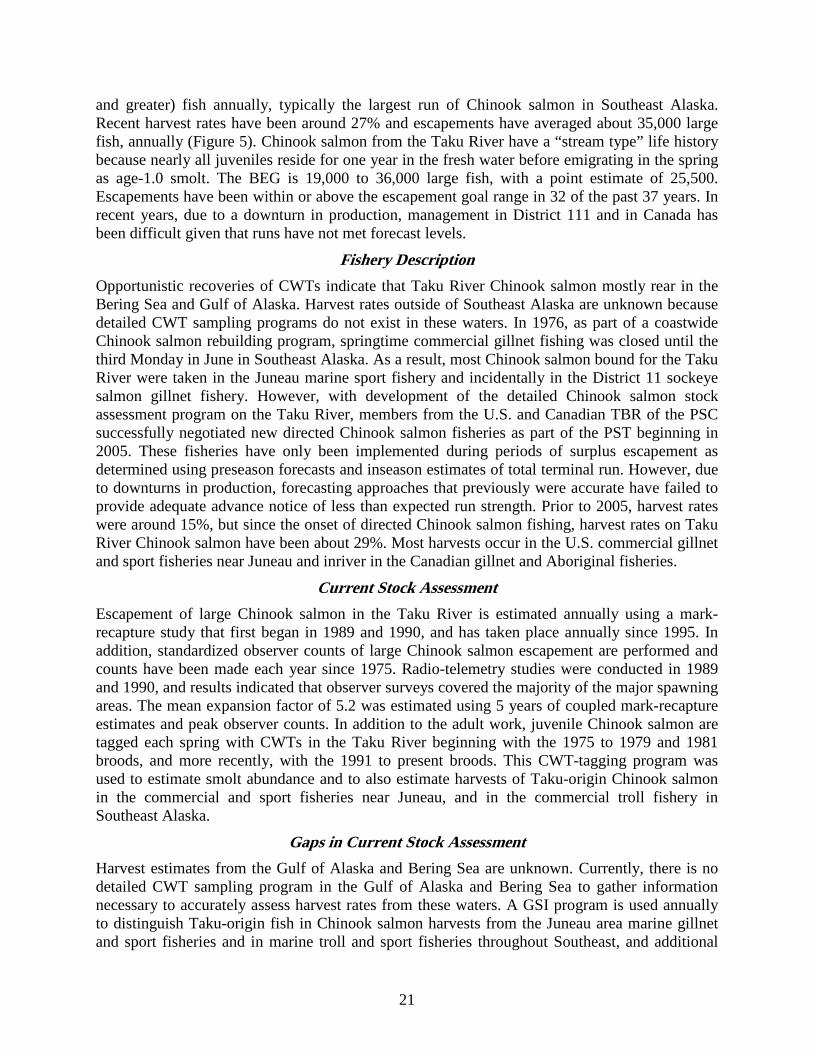
21
and greater) fish annually, typically the largest run of Chinook salmon in Southeast Alaska. Recent harvest rates have been around 27% and escapements have averaged about 35,000 large fish, annually (Figure 5). Chinook salmon from the Taku River have a “stream type” life history because nearly all juveniles reside for one year in the fresh water before emigrating in the spring as age-1.0 smolt. The BEG is 19,000 to 36,000 large fish, with a point estimate of 25,500. Escapements have been within or above the escapement goal range in 32 of the past 37 years. In recent years, due to a downturn in production, management in District 111 and in Canada has been difficult given that runs have not met forecast levels.
Fishery Description Opportunistic recoveries of CWTs indicate that Taku River Chinook salmon mostly rear in the Bering Sea and Gulf of Alaska. Harvest rates outside of Southeast Alaska are unknown because detailed CWT sampling programs do not exist in these waters. In 1976, as part of a coastwide Chinook salmon rebuilding program, springtime commercial gillnet fishing was closed until the third Monday in June in Southeast Alaska. As a result, most Chinook salmon bound for the Taku River were taken in the Juneau marine sport fishery and incidentally in the District 11 sockeye salmon gillnet fishery. However, with development of the detailed Chinook salmon stock assessment program on the Taku River, members from the U.S. and Canadian TBR of the PSC successfully negotiated new directed Chinook salmon fisheries as part of the PST beginning in 2005. These fisheries have only been implemented during periods of surplus escapement as determined using preseason forecasts and inseason estimates of total terminal run. However, due to downturns in production, forecasting approaches that previously were accurate have failed to provide adequate advance notice of less than expected run strength. Prior to 2005, harvest rates were around 15%, but since the onset of directed Chinook salmon fishing, harvest rates on Taku River Chinook salmon have been about 29%. Most harvests occur in the U.S. commercial gillnet and sport fisheries near Juneau and inriver in the Canadian gillnet and Aboriginal fisheries.
Current Stock Assessment Escapement of large Chinook salmon in the Taku River is estimated annually using a mark-recapture study that first began in 1989 and 1990, and has taken place annually since 1995. In addition, standardized observer counts of large Chinook salmon escapement are performed and counts have been made each year since 1975. Radio-telemetry studies were conducted in 1989 and 1990, and results indicated that observer surveys covered the majority of the major spawning areas. The mean expansion factor of 5.2 was estimated using 5 years of coupled mark-recapture estimates and peak observer counts. In addition to the adult work, juvenile Chinook salmon are tagged each spring with CWTs in the Taku River beginning with the 1975 to 1979 and 1981 broods, and more recently, with the 1991 to present broods. This CWT-tagging program was used to estimate smolt abundance and to also estimate harvests of Taku-origin Chinook salmon in the commercial and sport fisheries near Juneau, and in the commercial troll fishery in Southeast Alaska.
Gaps in Current Stock Assessment Harvest estimates from the Gulf of Alaska and Bering Sea are unknown. Currently, there is no detailed CWT sampling program in the Gulf of Alaska and Bering Sea to gather information necessary to accurately assess harvest rates from these waters. A GSI program is used annually to distinguish Taku-origin fish in Chinook salmon harvests from the Juneau area marine gillnet and sport fisheries and in marine troll and sport fisheries throughout Southeast, and additional

22
baseline samples from inriver spawning tributaries would strengthen the program and reduce misclassification error. The GSI program used for this purpose has been funded with a cadre of soft money funding sources for the past decade. Future funding to support the Southeast Alaska GSI program from these sources is considered uncertain. Past funding sources for the CWT-tagging program have included various federal and PSC-supported funding sources (e.g., LOA and Northern Fund). Future funding from these sources is considered uncertain.
Recommended Stock Assessment Projects We have identified the following projects as beneficial to increasing our knowledge of this stock:
· Stable funding for the current annual juvenile CWT-tagging program.
We also recommend the following project to augment needed information for this and other stocks of Chinook salmon harvested in Southeast Alaska:
· Genetic stock identification (GSI) of Chinook salmon harvested in Southeast Alaska troll and sport fisheries and in the gillnet fisheries in districts 8 and 11.
Chilkat River The Chilkat River is a moderate-sized glacial river that empties into upper Lynn Canal near Haines. The drainage is approximately 2,600 km2 and supports a moderate run of about 4,000 large (essentially 28 inches and greater) fish annually, which is typically the fifth largest run of Chinook salmon in Southeast Alaska. Recent documented harvest rates have been around 16% and escapements have averaged just over 3,000 large fish, annually (Figure 6). Chinook salmon from the Chilkat River have a “stream type” life history because nearly all juveniles reside for one year in fresh water before emigrating in the spring as age-1.0 smolt. The BEG is 1,750 to 3,500 large fish (point estimate is 2,200 large fish). This goal has been in place since 2003. In the past 21 years, estimated escapements have been within or above the escapement goal range each year, with the exception of 2007.
Fishery Description Recoveries of CWTs suggest that Chilkat River Chinook salmon primarily rear within the confines of Southeast Alaska and Northern British Columbia; however, a few recoveries have been from the Bering Sea and Gulf of Alaska. Harvest rates outside of Southeast Alaska are unknown because detailed CWT sampling programs do not exist in these waters. Available CWT information on this stock suggests that documented harvest rate is about 16% for recent years. The majority of the harvest occurs in the northern portion of Southeast Alaska.
Current Stock Assessment Escapement of large Chinook salmon in the Chilkat River is estimated annually using a mark-recapture study that first began in 1991. From 1975 to 1992, observer counts were conducted on two small tributaries with relatively clear water, yet results from these estimates were inconsistent. Radio-telemetry studies conducted in 1991 and 1992 found that spawning Chinook salmon in these two tributaries represented less than 5% of the total escapement and did not represent trends in abundance; therefore, observer surveys were discontinued. In addition to the adult work, juvenile Chilkat River Chinook salmon were first tagged with CWTs beginning with the 1988 to 1989 broods, and more recently, with the 1997 to present broods. This CWT-tagging program is used to estimate smolt abundance and to also estimate harvests of Chilkat-origin

23
Chinook salmon in the commercial and sport fisheries near Haines and Juneau, and in the other commercial and sport troll fisheries in Southeast Alaska.
Gaps in Current Stock Assessment Harvest estimates from the Gulf of Alaska and Bering Sea are unknown. Currently, there is no detailed CWT sampling program in place in the Gulf of Alaska and Bering Sea to gather the information necessary to accurately assess harvest rates from these waters. Past funding sources have included the Northern Fund, AKSSF, and the LOA funds provided to the PSC. Future funding from these sources is considered doubtful.
Recommended Stock Assessment Projects We have identified the following projects as beneficial to increasing our knowledge of this stock:
· Stable funding for the current annual adult mark-recapture and age, sex, and length sampling project.
· Stable funding for the current annual juvenile CWT-tagging programs.
· A study of local and traditional knowledge of the Chilkat River Chinook salmon stock.
Copper River The Copper River is a glacially dominated system located in Southcentral Alaska and is the second largest river in Alaska in terms of average discharge and fifth largest in terms of drainage area (62,000 km2). It flows south from the Alaska Range, and Wrangell and Chugach mountains, and empties into the Gulf of Alaska east of Prince William Sound. Copper River Chinook salmon spawn and return to many tributaries of the Copper River, including Chitina, Tonsina, Klutina, Gulkana, and East Fork Chistochina rivers. Freshwater entry of Chinook salmon occurs during late May through mid-July, with 50% of the run typically entering by early June. Annual run size has averaged 74,000 fish since 1980, with a minimum spawning escapement goal of 24,000 fish. Age composition of this stock ranges from 3- to 8-year olds and is dominated by 6-year olds, although 5-year olds can dominate in some years.
Fishery Description There are subsistence, personal use, commercial, and sport fisheries that harvest Copper River Chinook salmon runs. There is a subsistence gillnet fishery at the mouth of the Copper River; fish wheel and dipnet fisheries in the Copper River between Chitina and the Slana River confluence; and a fish wheel, dip net, and spear fishery in Tanada Creek and on the Copper River adjacent to the village of Batzulnetas. A personal use dip net fishery occurs in the Copper River near the village of Chitina. Harvests in all inshore fisheries in the area average 50,000 fish annually with an annual harvest rate of 63% during 1990–2010 (Figure 7). The inshore commercial fishery consists of a drift gillnet fishery at the mouth of the Copper River in the Copper River District of Prince William Sound. The sport fishery is prosecuted in fresh water on several of the many tributaries (e.g., Gulkana and Klutina rivers). Where there is road access to these tributaries, both shore- and boat-based sport fishing occurs. Current escapement performance of Copper River Chinook salmon is good, with the minimum spawning escapement goal exceeded 5 of 6 times during 2006–2011.
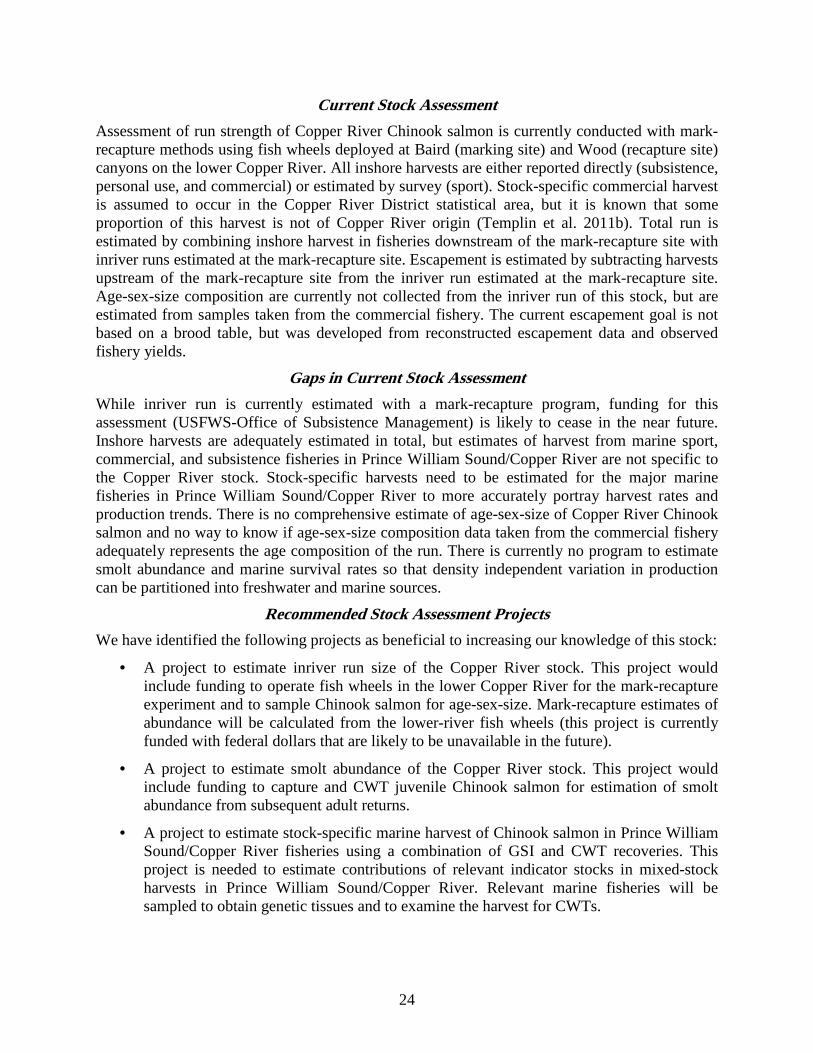
24
Current Stock Assessment Assessment of run strength of Copper River Chinook salmon is currently conducted with mark-recapture methods using fish wheels deployed at Baird (marking site) and Wood (recapture site) canyons on the lower Copper River. All inshore harvests are either reported directly (subsistence, personal use, and commercial) or estimated by survey (sport). Stock-specific commercial harvest is assumed to occur in the Copper River District statistical area, but it is known that some proportion of this harvest is not of Copper River origin (Templin et al. 2011b). Total run is estimated by combining inshore harvest in fisheries downstream of the mark-recapture site with inriver runs estimated at the mark-recapture site. Escapement is estimated by subtracting harvests upstream of the mark-recapture site from the inriver run estimated at the mark-recapture site. Age-sex-size composition are currently not collected from the inriver run of this stock, but are estimated from samples taken from the commercial fishery. The current escapement goal is not based on a brood table, but was developed from reconstructed escapement data and observed fishery yields.
Gaps in Current Stock Assessment While inriver run is currently estimated with a mark-recapture program, funding for this assessment (USFWS-Office of Subsistence Management) is likely to cease in the near future. Inshore harvests are adequately estimated in total, but estimates of harvest from marine sport, commercial, and subsistence fisheries in Prince William Sound/Copper River are not specific to the Copper River stock. Stock-specific harvests need to be estimated for the major marine fisheries in Prince William Sound/Copper River to more accurately portray harvest rates and production trends. There is no comprehensive estimate of age-sex-size of Copper River Chinook salmon and no way to know if age-sex-size composition data taken from the commercial fishery adequately represents the age composition of the run. There is currently no program to estimate smolt abundance and marine survival rates so that density independent variation in production can be partitioned into freshwater and marine sources.
Recommended Stock Assessment Projects We have identified the following projects as beneficial to increasing our knowledge of this stock:
· A project to estimate inriver run size of the Copper River stock. This project would include funding to operate fish wheels in the lower Copper River for the mark-recapture experiment and to sample Chinook salmon for age-sex-size. Mark-recapture estimates of abundance will be calculated from the lower-river fish wheels (this project is currently funded with federal dollars that are likely to be unavailable in the future).
· A project to estimate smolt abundance of the Copper River stock. This project would include funding to capture and CWT juvenile Chinook salmon for estimation of smolt abundance from subsequent adult returns.
· A project to estimate stock-specific marine harvest of Chinook salmon in Prince William Sound/Copper River fisheries using a combination of GSI and CWT recoveries. This project is needed to estimate contributions of relevant indicator stocks in mixed-stock harvests in Prince William Sound/Copper River. Relevant marine fisheries will be sampled to obtain genetic tissues and to examine the harvest for CWTs.

25
· An analysis of the harvest of Chinook salmon in the subsistence fishery in Copper River District of Prince William Sound, as well as commercial removals of Chinook salmon for personal use, including an LTK component.
Susitna River The Susitna River is a large (49,000 km2), glacially influenced drainage that originates in the Alaska Range north of Anchorage. It flows generally south from the Alaska Range for 400 km before entering Cook Inlet west of Anchorage. Susitna River Chinook salmon spawn and return to many of the tributaries of the Susitna River, including Alexander Creek, Chulitna River, Clear Creek, Deshka River, Goose Creek, Lake Creek, Little Willow Creek, Montana Creek, Peters Creek, Prairie Creek, Sheep Creek, Talachulitna River, and Willow Creek. Freshwater entry of Chinook salmon occurs during late May through mid-July, with 50% of the run typically entering by the middle of June. Annual run size is currently unknown, but is indexed with a weir on the Deshka River and rotary-wing aerial surveys conducted on 12 tributaries of the Susitna River. Run size of the Deshka River component has averaged 35,000 fish per year since 1979 (Figure 8), with a spawning escapement goal of 13,000 to 28,000 fish. Based on information from the Deshka River assessment, age composition of this stock ranges from 3- to 7-year olds and is dominated by 5-year olds, although 4- or 6-year olds can predominate in some years.
Fishery Description There are subsistence, commercial, and sport fisheries that harvest Susitna River Chinook salmon runs. A subsistence set gillnet fishery occurs along the west side Cook Inlet beaches adjacent to the village of Tyonek. The inshore commercial fishery consists of a set gillnet fishery in the Northern District of Upper Cook Inlet (UCI). The inshore sport fishery is prosecuted in fresh water on the many tributaries. On the east side of the Susitna drainage there is road access to these tributaries and shore-based sport fishing predominates. Boat-based sport fishing predominates on the roadless west side tributaries of the Susitna River. Harvests in all inshore fisheries average 29,000 fish annually; harvest rate is unknown, but is thought to be less than 25% annually and averages 14% in the Deshka River since 1990. There is no escapement goal for the Susitna River stock, but there are spawning escapement goals on 13 of the monitored tributaries. On the Deshka River the spawning escapement goal has been achieved in 4 of 6 years during 2006–2011. Three other tributaries of the Susitna River are currently listed as stocks of concern, with Alexander Creek listed as a management concern, and Willow and Goose creeks listed as yield concerns.
Current Stock Assessment There is currently no overall assessment of run strength of Susitna River Chinook salmon. Run strength is indexed by counts of fish passing through a weir at the Deshka River and from partial counts of fish from rotary-wing aerial surveys conducted on 12 tributaries. All inshore harvests are either reported directly (subsistence and commercial) or estimated by survey (sport). Stock-specific commercial harvest is assumed to occur only in the Northern District of UCI. There is no estimation of total run or escapement. Age-sex-size composition is not estimated for this stock, but is indexed from samples taken at the Deshka River weir. The Deshka River spawning escapement goal was developed from a brood table and stock-recruit analysis, but the remaining tributary spawning escapement goals are based on percentile summaries of observed escapements from partial counts of rotary-wing aerial surveys conducted postseason.

26
Gaps in Current Stock Assessment There is no assessment of overall run strength and assessments of run strength at tributaries are largely imprecise indices of abundance. While overall harvest rate of this stock is likely to be low relative to the optimum, it is currently unknown. Inshore harvests are adequately estimated in total, but estimates of harvest from marine subsistence, commercial, and sport fisheries in Cook Inlet are not specific to the Susitna River stock. Stock-specific harvests need to be estimated for all marine fisheries in Cook Inlet to more accurately portray harvest rates and production trends. There is no comprehensive estimate of age-sex-size of Susitna River Chinook salmon and no way to know if age-sex-size composition data taken at the Deshka weir adequately represents the entire stock. There is currently no program to estimate smolt abundance and marine survival rates so that density-independent variation in production can be partitioned into freshwater and marine sources.
Recommended Stock Assessment Projects We have identified the following projects as beneficial to increasing our knowledge of this stock:
· A project to estimate inriver run size of the Susitna River stock. This project would include funding to operate fish wheels in the lower Susitna River to sample Chinook salmon for age-sex-size and take genetic tissues for identification of tributary runs, such as the Deshka River (existing weir site) and an additional weir site. Sampling of harvests from inriver sport fisheries will also be conducted to obtain genetic tissues. Mark-recapture estimates of abundance will be calculated from genetic sampling at the lower river fish wheels and inriver sport fishery, combined with counts of fish passing through the two weir sites.
· A project to estimate smolt abundance of the Susitna River stock. This project includes funding to capture and CWT juvenile Chinook salmon for estimation of smolt abundance from subsequent adult returns. This project includes personnel to increase sampling of the inriver sport fishery for CWTs in returning adults.
· A project to comprehensively estimate stock-specific marine harvest of Chinook salmon in Cook Inlet fisheries using a combination of GSI and CWT recoveries. This project is needed to estimate contributions of relevant indicator stocks in mixed-stock harvests in Cook Inlet. Commercial set and drift gillnet fisheries in the Central and Northern Districts of UCI, sport fisheries along the Kenai Peninsula and the Homer winter fishery, and the Tyonek subsistence fishery will be sampled to obtain genetic tissues and to examine the harvests for CWTs.
· A study of local and traditional knowledge of the Susitna River Chinook salmon stock.
Kenai River The Kenai River is located in the northern Kenai Peninsula of Southcentral Alaska and has two distinct runs of Chinook salmon. Fish entering the river in May and June spawn predominantly in tributaries and fish entering in July and August spawn predominantly in the mainstem of the Kenai River. For management purposes, these two life history patterns are delineated as the early (May–June) and late (July–August) runs. The early run is smaller than the late run and averages 16,000 fish per year, with a spawning escapement goal of 4,000 to 9,000 fish. The late run averages 56,000 fish per year (Figure 9), with a spawning escapement goal of 17,800 to 35,700 fish. Age composition of both of these runs tends to be dominated by 6-year olds.

27
Fishery Description There are subsistence, personal use, commercial, and sport fisheries that harvest Kenai River Chinook salmon runs. Personal use (set gillnet and dip net) and subsistence (hook and line) fisheries are small. The commercial fisheries consist of a set gillnet fishery along the beaches of the eastern Kenai Peninsula and a drift gillnet fleet that operates in the Central District of UCI. The sport fishery is prosecuted primarily from boats inriver and in marine waters. The early run is harvested primarily by the sport fishery and is assumed to have no appreciable commercial or personal use fishery harvest. Harvests of early-run fish in the sport and subsistence fisheries average 4,300 fish annually, with the harvest rate averaging 25%. Harvest of late-run fish is split evenly between sport and commercial fisheries, with the remainder taken in small personal use and subsistence harvests. Late-run harvests average 26,300 fish annually, with an average harvest rate of 47%. Management of all fisheries is conducted inseason to achieve the spawning escapement goals for each run. Escapement goal performance has been generally good, with escapement goals achieved 90% of the time during 2006–2010, although performance since 2009 is somewhat uncertain due to changes in run assessment methodology.
Current Stock Assessment Until 2012, assessment of run strength of Kenai River Chinook salmon was conducted with split-beam sonar, which differentiated Chinook salmon from smaller salmon of other species based on distance from shore (smaller salmon are assumed to migrate closer to shore than Chinook salmon) and echo-based characteristics (echo magnitude or echo length) related to fish size. Assessment methodology is currently transitioning to DIDSON imaging sonar, which can estimate fish size more accurately. An inriver test gillnet fishery is conducted adjacent to the sonar site to gather catch rate and species composition data for use in corroboration of sonar passage estimates. Mark-recapture estimates of the inriver run are also calculated using GSI data from the inriver test fishery and passage data at weirs on selected tributaries to the Kenai River. All inshore harvests are either reported directly (subsistence, personal use, and commercial) or estimated by survey (sport). Total runs are estimated by combining terminal harvests in fisheries downstream of the sonar with inriver runs estimated at the sonar. Escapements are estimated by subtracting harvests upstream of the sonar from the inriver runs estimated at the sonar. Age-sex-size compositions are estimated from samples from the commercial and sport fisheries, and from the inriver gillnet test fishery. Brood tables constructed from these data were used to conduct stock-recruit analyses for each run to determine the current escapement goals.
Gaps in Current Stock Assessment Historical assessment of run strength is known to be biased due to misclassification of smaller and more numerous sockeye and pink salmon as Chinook salmon by the split-beam sonar due to imprecision in estimation of echo-based discriminators and the assumption of discrimination based on distance from shore. The newer DIDSON technology, in combination with information on fish size from the inriver test fishery, is thought to provide accurate estimates of species composition based on size of fish. The current sonar site experiences large tide-related fluctuations in water level that make it impractical to sample the entire river cross-section with sonar, and recent experiments have detected substantial numbers of Chinook salmon passing behind the transducers. An alternative sonar site has been identified above tidal influence where nearly the entire cross-section of river can be sampled. Although inshore harvests are adequately estimated in total, estimates of harvest from marine waters are not specific to the Kenai River

28
stock. Stock-specific harvests need to be estimated for marine fisheries, including the sport fishery along the Kenai Peninsula and commercial harvests in Central District of UCI to more accurately portray harvest rates and production trends. Attempts have been made to estimate smolt abundance and marine survival of the Kenai River stock, but there is currently no program to estimate these quantities so that density independent variation in production can be partitioned into freshwater and marine sources.
Recommended Stock Assessment Projects We have identified the following projects as beneficial to increasing our knowledge of this stock:
· A 3-year project to move the sonar site and run-strength assessment upstream to a site where the majority of the width of the river can be ensonified. This project was initiated in 2012 with existing capital funding, but requires additional funds for personnel to conduct run-strength assessments at the upstream site, concurrently with the current sonar site for comparison. At the end of the 3-year project, the current site would be discontinued, and the sonar and run-strength assessment moved to the new site. This project includes personnel to increase sampling of the inriver sport fishery for CWTs in returning adults as part of the smolt abundance assessment.
· A project to estimate smolt abundance by run (tributary and mainstem runs) of the Kenai River stock. This project includes funding to capture, CWT, and genetically identify juvenile Chinook salmon for estimation of smolt abundance by run from subsequent adult returns.
· A project to comprehensively estimate stock-specific marine harvest of Chinook salmon in Cook Inlet fisheries using a combination of GSI and CWT recoveries. This project is needed to estimate contributions of relevant indicator stocks in mixed-stock harvests in Cook Inlet. Commercial set and drift gillnet fisheries in the Central and Northern Districts of UCI, sport fisheries along the Kenai Peninsula and the Homer winter fishery, and the Tyonek subsistence fishery will be sampled to obtain genetic tissues and to examine the harvest for CWTs. This is the same project as that recommended for the Susitna River stock in Cook Inlet.
· A study of local and traditional knowledge of Kenai River Chinook salmon stocks.
Karluk River The Karluk River is located on the southwest end of Kodiak Island and supports 1 of only 2 native stocks of Chinook salmon on the Kodiak Archipelago. From its source at the outlet of Karluk Lake, the Karluk River flows 35.2 km to its terminus at Karluk Lagoon. Freshwater entry of Chinook salmon occurs during late May through mid-July, with 50% of the run typically entering by the middle of June. Spawning occurs during August and September in the Karluk River, with few to no fish spawning in Karluk Lake or any of the inlet streams. Annual run size has averaged 9,000 fish since 1976 (Figure 10), with a spawning escapement goal of 3,000 to 6,000 fish. Age composition of this stock ranges from 3- to 7-year olds and is dominated by 6-year olds or occasionally, 5-year olds.

29
Fishery Description There are subsistence, commercial, and sport fisheries that harvest Karluk River Chinook salmon. A small subsistence beach seine fishery at Karluk Lagoon and a subsistence hook-and-line fishery in the Karluk River harvests this run. The commercial fishery is a purse seine fleet that primarily targets 2 sockeye salmon runs entering the Karluk River; harvests of Chinook salmon from June 1 through July 15 are thought to be Karluk-origin fish. The sport fishery is prosecuted primarily in fresh water from fly-in trips that originate either at the outlet of the lake, at an area midway downstream known as the portage, or at Karluk Lagoon. Harvest in all inshore fisheries averages 2,300 fish annually, with an average harvest rate of 23%. Karluk River Chinook salmon are currently a stock of management concern because during the 6 years from 2006 to 2011, the spawning escapement goal has been achieved only twice.
Current Stock Assessment Assessment of run strength of Karluk River Chinook salmon is conducted with a weir located 400 m upstream of Karluk Lagoon. All inshore harvests are either reported directly (subsistence and commercial) or estimated by survey (sport). Stock-specific commercial harvest is assumed to occur from June 1 through July 15 in the Inner and Outer Karluk sections statistical areas. Total run is estimated by combining inshore harvest in fisheries downstream of the weir with inriver runs estimated at the weir. Escapement is estimated by subtracting harvests upstream of the weir from the inriver runs estimated at the weir. Age-sex-size composition data are currently not collected from this stock, but were estimated from samples taken at the weir from 1993–2010. Brood tables constructed from these data were used to conduct stock-recruit analyses to determine the current escapement goal.
Gaps in Current Stock Assessment Age-sex-size composition data are currently not collected from the inriver run or fishery harvests due to budgetary constraints. Although inshore harvests are adequately estimated in total, estimates of harvest from the commercial fishery are not specific to the Karluk River stock. Stock-specific harvests need to be estimated for the commercial fishery to more accurately portray harvest rates and production trends. There is currently no program to estimate smolt abundance and marine survival rates so that density independent variation in production can be partitioned into freshwater and marine sources. While not part of this stock assessment, hatchery releases of Chinook salmon into systems on the east side of Kodiak Island are derived from Karluk River brood source. These hatchery releases need to be marked with CWTs so that they can be correctly identified in mixed-stock fishery samples.
Recommended Stock Assessment Projects We have identified the following projects as beneficial to increasing our knowledge of this stock:
· A project to estimate age-sex-size composition of the inriver run of the Karluk River stock that would include funding to sample for age-sex-size of all monitored Chinook salmon stocks on Kodiak Island and the Alaska Peninsula. Funding is also needed to lease private land, which would permit access to the weir site near Karluk Lagoon.
· A project to estimate smolt abundance of the Karluk River stock. This project includes funding to capture and CWT juvenile Chinook salmon for estimation of smolt abundance from subsequent adult returns. This project includes the cost associated with CWT-

30
tagging hatchery releases on the east side of Kodiak Island of fish derived from Karluk River brood source.
· A project to comprehensively estimate stock-specific marine harvests of Chinook salmon in Kodiak Archipelago fisheries using a combination of GSI and CWT recoveries. This project is needed to estimate contributions of relevant indicator stocks in mixed-stock harvests around the Kodiak Archipelago. All commercial salmon fisheries will be sampled to obtain genetic tissues and to examine the harvest for CWTs.
Chignik River The Chignik River is located on the Alaska Peninsula near the village of Chignik and is the largest Chinook salmon-producing system on the southern shore of the Alaska Peninsula. The Chignik River watershed is dominated by Black and Chignik lakes, with the Black and Chignik rivers draining them, respectively. Chignik Chinook salmon exhibit late run timing, with freshwater entry of Chinook salmon occurring during late June through mid-August. Typically, 50% of the run enters the Chignik River by mid-July. Annual run size has averaged 5,500 fish since 1978 (Figure 11), with a spawning escapement goal of 1,300 to 2,700 fish. Age composition of this stock ranges from 3- to 7-year olds and is composed of roughly equal proportions of 5- and 6-year olds, with 4-year olds predominating in some years.
Fishery Description There are subsistence, commercial, and sport fisheries that harvest Chignik River Chinook salmon. A small subsistence fishery in the Chignik River and Lake harvests this run. The commercial fishery is a purse seine fleet that primarily targets two sockeye salmon runs entering the Chignik River; incidental harvests of Chinook salmon from the Chignik Lagoon are thought to be Chignik-origin fish. There is a small sport fishery prosecuted in the Chignik River downstream from the weir site. Harvest in all inshore fisheries averages 2,200 fish annually, with an average harvest rate of 37% since 1990. Current escapement performance of Chignik River Chinook salmon is very good, with the spawning escapement goal achieved annually during 2006–2011.
Current Stock Assessment Assessment of run strength of Chignik River Chinook salmon is conducted with a video-based count at a weir located approximately halfway between Chignik Lagoon and Chignik Lake. All inshore harvests are either reported directly (subsistence and commercial) or estimated by survey (sport). Stock-specific commercial harvest is assumed to occur in the Chignik Lagoon statistical area. Total run is estimated by combining inshore harvests in fisheries downstream of the weir with inriver runs estimated at the weir. Escapements are estimated by subtracting harvests upstream of the weir from the inriver runs estimated at the weir. Age-sex-size composition are currently not collected from this stock, but were estimated from samples taken from sport harvests during 1995–2005. Brood tables constructed from these data were used to conduct stock-recruit analyses to determine the current escapement goal.
Gaps in Current Stock Assessment Age-sex-size composition data are currently not collected from the inriver run or fishery harvests due to logistical and budgetary constraints. Although inshore harvests are adequately estimated in total, estimates of harvest from the commercial fishery are not specific to the Chignik River

31
stock. Stock-specific harvests need to be estimated for the commercial fishery to more accurately portray harvest rates and production trends. There is currently no program to estimate smolt abundance and marine survival rates so that density independent variation in production can be partitioned into freshwater and marine sources.
Recommended Stock Assessment Projects We have identified the following projects as beneficial to increasing our knowledge of this stock:
· A project to estimate age-sex-size composition of the inriver run of the Chignik River stock.
· A project to estimate smolt abundance of the Chignik River stock. This project includes operating funds to capture, and Passive Integrated Transponder (PIT) tag and CWT juvenile Chinook salmon for estimation of smolt abundance from subsequent adult returns. The additional PIT tagging is needed for this assessment to identify individually-tagged salmon in adult returns at this video-based weir site, rather than handling fish at the weir and visually inspecting for a CWT.
· A project to comprehensively estimate stock-specific marine harvest of Chinook salmon in Chignik and South Peninsula fisheries using a combination of GSI and CWT recoveries. This project is needed to estimate contributions of relevant indicator stocks in mixed-stock harvests in the Chignik and South Peninsula management areas. Commercial salmon fisheries will be sampled to obtain genetic tissues and to examine the harvest for CWTs.
· Improvements to the existing subsistence harvest monitoring and assessment program.
Nushagak River The Nushagak River is located in Southwestern Alaska and flows about 390 km from its headwaters to Bristol Bay. The Nushagak Drainage has two main tributaries: the Nuyakuk River, draining Tikchik lakes, which enters from the west; and the Mulchatna River, which flows into the Nushagak River from the east. The Nushagak River is the largest Chinook salmon producer in Bristol Bay, with an average run size of 156,000 fish. Average escapement is 80,500 fish per year (Figure 12), with an escapement goal of 40,000 to 80,000 fish. Chinook salmon subsistence, commercial, and sport fisheries are managed using the Nushagak-Mulchatna King Salmon Management Plan, which was adopted into regulation in 1992. The plan was established because of declining run sizes from a peak in the early 1980s. It was modified in the mid to late 1990s because of trends in age composition of spawning escapement (the proportion of larger age 5 to 7 fish were less than desired). The plan establishes an inriver goal of 75,000 fish at the sonar (65,000 escapement, reasonable opportunity for subsistence, and sport guideline harvest level of 5,000 fish greater than 20 inches in length). Commercial openings are scheduled to maintain natural representation of age structure. The early part of the run is comprised mainly of smaller, younger age-classes, whereas older age-classes are more prevalent in the later portion of the run.
Fishery Description There are subsistence, sport, and commercial fisheries that harvest Nushagak River Chinook salmon. Subsistence harvest in the Nushagak District (set gillnet) requires a permit and averages 13,000 fish annually. The sport fishery in the Nushagak River is primarily catch-and-release, but
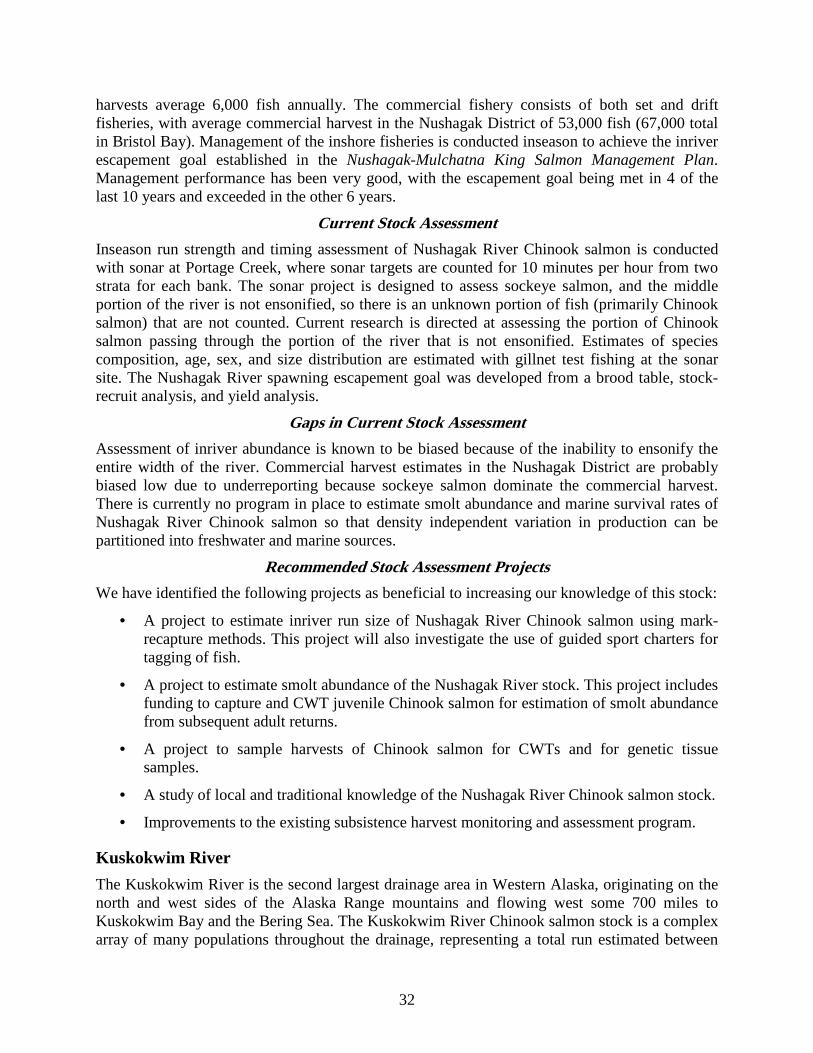
32
harvests average 6,000 fish annually. The commercial fishery consists of both set and drift fisheries, with average commercial harvest in the Nushagak District of 53,000 fish (67,000 total in Bristol Bay). Management of the inshore fisheries is conducted inseason to achieve the inriver escapement goal established in the Nushagak-Mulchatna King Salmon Management Plan. Management performance has been very good, with the escapement goal being met in 4 of the last 10 years and exceeded in the other 6 years.
Current Stock Assessment Inseason run strength and timing assessment of Nushagak River Chinook salmon is conducted with sonar at Portage Creek, where sonar targets are counted for 10 minutes per hour from two strata for each bank. The sonar project is designed to assess sockeye salmon, and the middle portion of the river is not ensonified, so there is an unknown portion of fish (primarily Chinook salmon) that are not counted. Current research is directed at assessing the portion of Chinook salmon passing through the portion of the river that is not ensonified. Estimates of species composition, age, sex, and size distribution are estimated with gillnet test fishing at the sonar site. The Nushagak River spawning escapement goal was developed from a brood table, stock-recruit analysis, and yield analysis.
Gaps in Current Stock Assessment Assessment of inriver abundance is known to be biased because of the inability to ensonify the entire width of the river. Commercial harvest estimates in the Nushagak District are probably biased low due to underreporting because sockeye salmon dominate the commercial harvest. There is currently no program in place to estimate smolt abundance and marine survival rates of Nushagak River Chinook salmon so that density independent variation in production can be partitioned into freshwater and marine sources.
Recommended Stock Assessment Projects We have identified the following projects as beneficial to increasing our knowledge of this stock:
· A project to estimate inriver run size of Nushagak River Chinook salmon using mark-recapture methods. This project will also investigate the use of guided sport charters for tagging of fish.
· A project to estimate smolt abundance of the Nushagak River stock. This project includes funding to capture and CWT juvenile Chinook salmon for estimation of smolt abundance from subsequent adult returns.
· A project to sample harvests of Chinook salmon for CWTs and for genetic tissue samples.
· A study of local and traditional knowledge of the Nushagak River Chinook salmon stock.
· Improvements to the existing subsistence harvest monitoring and assessment program.
Kuskokwim River The Kuskokwim River is the second largest drainage area in Western Alaska, originating on the north and west sides of the Alaska Range mountains and flowing west some 700 miles to Kuskokwim Bay and the Bering Sea. The Kuskokwim River Chinook salmon stock is a complex array of many populations throughout the drainage, representing a total run estimated between

33
240,000 and 423,000 fish in recent years (Figure 13). There are currently 10 tributary escapement goals based upon weirs or aerial surveys, including Kogrukluk (4,800–8,800), Kwethluk (4,100–7,500), George (1,800–3,300), Kisaralik (400–1,200), Aniak (1,200–2,300), Salmon (330–1,200), Holitna (970–2,100), Cheeneetnuk (340–1,300), Gagaryah (300–830), and Salmon rivers (470–1,600). Using a recent run reconstruction (Bue et al. 2012) and stock recruit analysis, a drainage-wide escapement goal of 65,000–120,000 fish was recommended (Hamazaki et al. 2012) for implementation in 2013. Kuskokwim River run strength has been highly variable over the past 2 decades, with strong returns during 2004–2006, and much weaker runs since 2007, with historically low returns during 2010–2011.
Fishery Description The largest Chinook salmon subsistence fishery in Alaska takes place in the Kuskokwim River, with annual harvests between about 27,000 and 110,000 fish over the last 5 decades. Total harvests during the same time period range from about 59,000 to 164,000 fish. Gear used for subsistence fishing for Chinook salmon is primarily large-mesh drift gillnets. Directed commercial harvests of Chinook salmon ended in 1987, and incidental harvests in the chum and sockeye commercial fisheries have been less than 10,000 fish in the most recent decade. There is a very small sport fishery in various tributaries of the Kuskokwim River. Most tributary escapement goals were met regularly prior to 2008; however, many have fallen short since then. Restrictions to subsistence fishing have been imposed since 2010 in response to low run abundance.
Current Stock Assessment Inseason run strength and timing is estimated using catch-per-unit-effort (CPUE) from the Bethel test fish project. Age, sex, and size data are currently collected at weir-based escapement projects. Estimates of Chinook salmon harvested in chum and sockeye commercial fisheries are adequate, and subsistence harvest estimates from survey information are generally deemed fairly accurate; however, consistent and systematic samples of subsistence harvest for age, sex, and size are needed.
Gaps in Current Stock Assessment There is currently no accurate measure of inseason run abundance for Kuskokwim River Chinook salmon, with inseason management reliant upon CPUE data from the Bethel test fish project. Current run reconstructions and stock recruit analyses would benefit from additional mark-recapture studies, particularly during years of low abundance. Consistent sampling for age, sex, and size are necessary at all tributary weir sites, the Bethel test fishery, and the subsistence harvest. There is currently no program to estimate smolt abundance and marine survival rates so that density independent variation in production can be partitioned into freshwater and marine sources.
Recommended Stock Assessment Projects We have identified the following projects as beneficial to increasing our knowledge of this stock:
· A 3-year mark-recapture project to estimate inriver abundance and collect age, sex and size information. This project will also explore select tributaries in the Kuskokwim River where CWT-tagging of juvenile Chinook salmon might be conducted.
· An annual project to continue key weir projects and age-sex-size collection at weirs.

34
· An annual project to estimate smolt abundance in the Goodnews River (or other surrogate stock) in Kuskokwim Bay as a surrogate for smolt abundance trends of the Kuskokwim River stock. This project would include funding to capture and CWT juvenile Chinook salmon in the Goodnews River (or other surrogate stock) for estimation of smolt abundance from subsequent adult returns. Funding would also be provided to scan returning Chinook salmon for CWTs at a fish processing facility in Kuskokwim Bay.
· A project to sample harvests of Chinook salmon for CWTs and for genetic tissue samples.
· Age-sex-size sampling of the subsistence harvest (included in operating funds for age-sex-size data collection at weirs).
· An analysis of subsistence Chinook salmon harvest patterns and trends in the Kuskokwim River drainage.
· An evaluation of the existing subsistence harvest monitoring program, including an inseason assessment pilot project that examines responses to inseason management actions.
· A study of local and traditional knowledge of Kuskokwim River Chinook salmon stocks.
Yukon River The Yukon River originates in Yukon Territories, Canada, and flows north and west approximately 3,000 km to its mouth in the Bering Sea. Approximately 40% of the Yukon River drainage area lies in Canada. The Yukon River Chinook salmon stock is a complex amalgam of many populations originating in Alaska and Canada. Available data suggest that roughly half of Chinook salmon production in the Yukon originates from the Canadian Yukon, with a drainage-wide total run of approximately 100,000–400,000 Chinook salmon in recent years (Figure 14). There are currently six escapement goals established for Alaska Yukon River populations including a weir-based escapement goal on the East Fork Andreafsky River (2,100–4,900), peak aerial survey goals on the West Fork Andreafsky River (640–1,600), Anvik River (1,100–1,700), and Nulato River (940–1,900), and tower-based goals on the Chena (2,800–5,700) and Salcha (3,300–6,500) rivers. There is also a sonar-based goal for Chinook salmon crossing the U.S/Canada border of 42,500–55,000 fish, established by agreement between the U.S. and Canada under the auspices of the PST. Yukon River Chinook salmon are currently considered to be in a period of low productivity where escapement goals are not always met and fishery restrictions are common. The Alaska Board of Fisheries has designated Yukon River Chinook salmon a stock of yield concern.
Fishery Description Yukon Chinook salmon are harvested over a large area throughout the drainage, primarily by subsistence and commercial fishermen. Fisheries are managed within six districts in the Alaskan portion of the drainage. Commercial and subsistence fishing employs large mesh gillnets and fish wheels in various parts of the drainage. Total in-river harvest for all fisheries over the past fifty years ranges from about 30,000–200,000 Chinook salmon, with an average of 73,000 fish taken annually in the most recent decade. In Alaska, in-river subsistence fishers typically take between 30,000 and 60,000 Chinook salmon annually. There is very limited sport harvest in tributaries near Fairbanks. Management of in-river fisheries is conducted inseason to achieve escapement
35
goals, based upon information from test fisheries in the lower river and from a sonar site at Pilot Station at river mile 121. Fisheries have been severely restricted in recent years to achieve escapement goals.
Current Stock Assessment Assessment of run strength for Yukon River Chinook salmon is primarily conducted using CPUE from the lower Yukon River test fishery, Hooper Bay/Dall Point offshore test fishery, Mountain Village test fishery, a Rapids fish wheel project, and with estimated sonar passage at Pilot Station. Genetic samples taken from the lower Yukon test fishery, Pilot Station test nets, and commercial and subsistence harvests characterize the stock composition of the run, which is typically resolved to the level of lower middle and upper Yukon spawning stocks, but can be resolved at a finer scale when necessary. Run strength for the Canadian component is assessed with sonar at Eagle on the U.S./Canada border. Commercial in-river harvests are reported on fish tickets and subsistence harvest numbers are acquired by postseason survey. Total in-river runs of Yukon River Chinook salmon can be estimated by adding harvest numbers and escapements below Pilot Station to the sonar estimates. Age, sex and size samples are taken from test fish, escapement, and harvest samples. Brood tables exist for Upper Yukon River Chinook salmon (Canada), a stock which is genetically distinct from Alaska stocks.
Gaps in Current Stock Assessment Run-strength assessment is known to be biased for several reasons including difficulties in estimating Chinook salmon abundance at Pilot Station sonar because Chinook salmon are co-migrating with far more abundant summer chum salmon. Commercial in-river harvests are adequately estimated; however, information about timing and effort in subsistence fisheries, which now comprise a substantial or majority of Chinook salmon harvests, is incomplete due to low (15%) response to voluntary returns of harvest calendars in areas not accessible by road. Estimates of escapement are generally good; however, only a small number of systems are monitored with weirs or towers, with the remainder monitored by aerial surveys or not monitored. Current estimates of in-river run strength need to be confirmed independently.
Recommended Stock Assessment Projects We have identified the following projects as beneficial to increasing our knowledge of this stock:
· A telemetry or genetically-based mark-recapture assessment to estimate inriver run as the basis for annual run reconstruction.
· An annual project to estimate smolt abundance for a genetically identifiable component (e.g., Canadian Yukon) of the Yukon River as a surrogate for smolt abundance trends of the entire Yukon River stock. This project would include funding to capture and CWT juvenile Chinook salmon for estimation of smolt abundance from subsequent adult returns of a component of the Yukon River stock. Funding would also be provided to scan returning Chinook salmon for CWTs in fishery and escapement projects.
· A project to sample harvests of Chinook salmon for CWTs and for genetic tissue samples.
· A study of local and traditional knowledge of Yukon River Chinook salmon stocks.
36
· An analysis of subsistence Chinook salmon harvest patterns and trends on the Yukon River drainage.
· An evaluation of the existing subsistence harvest monitoring program, including an inseason assessment pilot project.
ACROSS STOCKS AND FISHERIES Stock assessment and research recommendations that are relevant across individual stocks and fisheries are described in this section of the plan (Table 3). Approximate annual costs for these recommendations are found in Table 4.
Marine Surveys and Modeling We recommend that information on trends in marine survival estimates be obtained by continuing or expanding research cruises trawling in nearshore areas of the Bering Sea and Gulf of Alaska. Mounting evidence suggests that the first season of marine life following juvenile migration from river habitats represents a critical period for growth and survival. As a result, data on condition and relative abundance of Chinook salmon juveniles during early marine residence will likely provide essential insight into overall marine survival, as well as potentially important predictive capacity for brood year strength. Currently genetic baselines are not enough advanced to discriminate specific stocks caught in these nearshore surveys. (e.g., Nushagak, Kuskokwim, and Lower Yukon). However, stored samples from these surveys will provide information in the future once the baseline has matured and additional genetic markers have been developed.
Eastern Bering Sea research cruises were initiated in 1999 through the Ocean Carrying Capacity Program at Auke Bay Laboratories (NOAA-ABL) to study early marine distribution, migration, and growth of Bristol Bay juvenile sockeye salmon. This program expanded to include most of the continental shelf areas of the Eastern Bering Sea and included ecosystem information on other salmon species, forage fish, other nekton, plankton, and oceanographic conditions. Bering Sea trawl surveys continued during 2002–2007 as part of the Bering-Aleutian Salmon International Survey (BASIS) and during 2009–2010 as part of the Bering Sea Integrated Ecosystem Research Project (BSIERP).
Research activities under the BASIS program were, in part, designed to address stock-specific migration patterns of juvenile salmon, identify key biological, oceanographic, and climatic factors affecting salmon growth rates, and provide information to determine whether there is a limit to carrying capacity for salmon in the Bering Sea. Relative abundance of Chinook salmon juveniles in Northern Bering Sea surveys, combined with the ability to genetically discriminate fish originating from the Canadian Yukon, have provided valuable predictive information on future run sizes and migration timing for this stock.
Eventually we must ask how information from large-scale marine surveys and monitoring efforts will address whether we can increase the numbers of Chinook salmon returning to Alaska rivers and better predict stock-specific run abundance. We recommend that data from the large-scale marine surveys be utilized in models that connect climate to fish productivity. Examples of these include the FEAST Model, developed in cooperation with the North Pacific Research Board, to predict Bering Sea walleye pollock recruitment under a climate change scenario. The models are appealing because they integrate various parts of the marine ecosystem and can incorporate

37
human and environmental drivers in a single framework. Data (i.e., physical and biological oceanography, fish diet, energetic status, size, growth, and distribution) from research surveys are used to parameterize the models.
In turn, these models can then be used to address questions regarding salmon production. For example, bio/physical data from BASIS can be utilized in models to ask if Chinook salmon returns to Western Alaska would increase if we increase/decrease escapement goals. Similarly, if we increase hatchery production of Chinook salmon, will they survive the Bering Sea environment in cost-effective numbers? Will they compete with other populations of salmon? To investigate the utility of these trawl research cruises to meaningfully inform integrated ecosystem models for salmon management in Alaska, we have recommended a modeling effort for Western Alaska Chinook salmon as one of our goals cutting across Chinook salmon stocks and fisheries. Demonstration of utility for these stocks may inform applications to others.
Offshore Fishery Sampling Chinook salmon bycatch in Bering Sea and Aleutian Island (BSAI) federal groundfish fisheries peaked in 2007 at nearly 130,000 fish. The North Pacific Fishery Management Council (council) began developing a new bycatch management program for the BSAI pollock fishery in 2008, implemented in 2011. Average annual bycatch in BSAI groundfish fisheries during 2008–2011 has been approximately 19,000 Chinook salmon. In the Gulf of Alaska, Chinook salmon bycatch in the groundfish fisheries peaked in 2010 at nearly 55,000 fish. The council adopted a hard cap for the GOA pollock fishery of 25,000 fish in 2011.
We believe that it is important to acquire as much stock-specific information as possible from Chinook salmon harvested as bycatch in groundfish fisheries in the Gulf of Alaska and Eastern Bering Sea. While age, size, CWT, and genetic tissue sampling already occurs or is planned in these fisheries, significantly increasing sample sizes and increasing resolution of these data to a specific geographic harvest location (i.e., to the individual haul) in applicable groundfish sectors would allow for improved mapping of stock-specific ocean distribution and migratory timing, as well as the potential for improved Chinook salmon bycatch avoidance measures. Biological data collection in these fisheries needs to increase to achieve stock monitoring goals and to improve spatial resolution. Moreover, this effort will require partnerships between state, federal, and industry researchers to properly manage the confidentiality and data-sharing issues that will arise in acquiring this information. As part of this effort to increase sample sizes and improve spatial resolution, and in anticipation of additional CWT-tagging of Chinook salmon stocks in Alaska, we recommend that intensity of sampling for CWTs be increased to the coastwide standard of 20% of the catch in both the Eastern Bering Sea and Gulf of Alaska fisheries.
Process Studies We recommend three new interrelated process studies be conducted to examine potential factors determining productivity in freshwater (initially focused on the Yukon River indicator stock) and marine environments.
Study 1—The first recommended study would examine climate-induced changes to Chinook salmon spawning and freshwater rearing habitats. Changes in stream habitats that lead to population declines may be driven by climate-related effects that alter flow and thermal regimes. Flow and thermal regimes are basic components of habitat and are important factors in explaining the distribution and abundance of riverine fishes. Altered flow and thermal regimes
38
may facilitate the spread of predatory species into previously unoccupied habitats, or modify life history attributes of prey species (e.g., spawn timing, fry emergence, decrease growth during early life stages, shift smolt migration timing), leading to increased mortality during early life stages. This study will take place in the Chena River basin, Alaska with goals to, 1) develop spatially and temporally explicit flow, temperature, and physical habitat models that can be used to characterize historic and future Chinook salmon spawning and rearing habitat quality, 2) quantify the role of high water events in inducing movement between rearing habitats and flow/predation refugia, and 3) link results of models with field observations to evaluate consequences of projected changes to temperature and flow regimes on juvenile Chinook salmon mortality.
To meet the first objective, spatially and temporally continuous flow, temperature, and physical habitat models will be developed that can be used to characterize historic and future Chinook salmon spawning and rearing habitat quality in the Chena River basin. These models will generate metrics that describe physical habitat, flow and thermal regimes across broad regions at relatively fine spatial (< 1 km) and temporal (daily) scales. Similar models have been successfully employed across the Western U.S. and are parameterized using digital elevation models, hydrography layers, and precipitation data, all of which are available for the Chena River or will be developed as part of this project. To meet the second objective an observational study with two parts will be conducted, to 1) map the spatial distribution of Chinook spawning and rearing habitats in the Chena basin to calibrate physical habitat and intrinsic potential models, and to 2) evaluate the role of potentially predator-rich flow refugia on mortality of juvenile Chinook using PIT tag technology. This component will link directly to the second process study (below). Finally, results from models and field studies will be integrated to predict how projected climate change may influence Chinook spawning and rearing habitat, and ultimately mortality and recruitment, in the Chena River basin.
Study 2—The second recommended study will examine predation as a source of Chinook salmon declines in Alaska. Little is known about the predators of and predation mortality on juvenile Chinook salmon throughout Alaska, particularly in the Yukon River drainage. From consultations with management agencies and those with local and traditional knowledge, it has become clear that predators are likely an important cause of juvenile Chinook salmon mortality and population declines in the Yukon River drainage. Further, changes in habitat and climate patterns may be favoring predatory species, potentially allowing them to increase their range and abundance, and therefore their effect on Chinook salmon. Yet, little is known about key predators, where and when they may be important, or how much mortality predation may be causing. This study aims to determine the key predators as well as where and when predation is occurring. Additionally, what habitats and which physiological states (e.g., body condition) make juvenile Chinook most vulnerable to predation will be determined.
This study will use two approaches for assessing potential predators of juvenile Chinook salmon: 1) opportunistic predator collections along the Yukon River and 2) focused field studies on the Chena River. Opportunistic predator collections will involve working with subsistence communities and agencies that have current fisheries projects or related activities and infrastructure in place at several locations throughout the Yukon River drainage, to take advantage of, and bolster on-going fish sampling efforts and collaborations. At these sites, local partners will oversee and conduct predator collections from which the predator stomach contents will be collected.

39
Study 3— The third recommended study will examine measures of body condition in freshwater and in marine waters and relate these measures at various life history stages to environmental and biological variables. Chinook salmon will be sampled at various life stages (i.e., fry, out-migrating smolt, marine juveniles, various open ocean age classes, and returning adults) and data collected on morphometrics, proximate composition of body stores and gonads, diet, and metabolic profiles. To address environmental drivers of production, time series of measurements of physical environmental factors (e.g., ocean temperatures, ice cover) and biological factors (e.g., phytoplankton densities, oceanic abundance of pink salmon) will be assembled for statistical comparisons with the time series of Chinook salmon growth, condition, and survival. Potential nutritional stressors will be identified that can then be utilized on archived samples for a retrospective view on changes in Chinook salmon population structure.
Archived scale samples from several decades of returning Chinook salmon are a vital source of information on past growth in both freshwater and the ocean. These historical patterns provide the context to determine if recent poor returns exhibit unusually poor growth, and what life stages are impacted. Many of these archived scales have not been examined, so digitizing and analyzing growth rings on these scales will be a major component of this study.
Adequate food supply is probably one of the most important determinants of growth, fecundity, and ultimately population success. Addressing potential changes in feeding ecology through competition or changing ecosystem structure, and consequently changes in energy budgets are critical to our understanding of salmon growth and health. The majority of the scale and physiological data as well as tissue archives are from adult fish sampled as they return to their river of origin; these samples represent the survivors of each cohort. As many of the hypothesized mechanisms of population control take place in the open ocean, it will be important to incorporate samples taken at sea. Few such efforts exist: major ones include those of NOAA (the OCC, BASIS, and SECM programs), the High Seas program based on Japanese research vessels with the integral involvement of the University of Washington, and samples of bycaught Chinook salmon from groundfish fisheries monitored by NOAA's observer programs. Collaborations with these programs would include sharing of existing samples and data, collaborative sampling with processors and subsistence fishermen, and potentially piggybacking on existing sampling programs to collect additional high seas data to address our specific questions.
Genetic Baseline and Marker Development We recommend additional work on genetic baseline and marker development to increase resolution of currently available genetic stock identification techniques. Additional collections of Chinook salmon spawners are needed to improve the Alaska Chinook salmon baseline, especially from drainages on the Alaska Peninsula and Kodiak, in Bristol Bay, and of West Cook Inlet. Additional samples are also needed from the Yentna River in the Susitna River drainage, the Chitina River in the Copper River drainage, and from Alaska hatcheries and transboundary rivers in Southeast Alaska.
The inability to distinguish lower river spawning populations of Bristol Bay, Kuskokwim, and Yukon Chinook salmon from each other is a major knowledge gap and additional marker development is necessary to improve identification ability.

40
Programmatic Support Implementation of additional CWT activities across Alaska will lead to greatly increased workload at the CWT lab and additional fiscal resources will be required for the CWT lab to handle the added workload. Moreover, many more scales from both adult and juvenile Chinook salmon will be collected. These scales will need to be read to determine age and samples will require archiving. An additional biometrician will be required to support the development of new and improved sampling designs and estimators for all recommended research programs. Additional publications staff members are needed to ensure timely reporting of results of recommended research programs.
FUNDING RECOMMENDATIONS The Research Team recommendations for funding of the stock-specific and across stock components of this plan are summarized as approximate annual costs in Table 4. Costs of each component are annualized solely to illustrate the relative costs of each component, independent of timelines for implementation or the relative priorities for realizing funding within and between each component. We further emphasize that our recommendations for addressing gaps in knowledge will only be successful with a long term commitment to funding the basic components of Chinook salmon life history such as spawning escapement, smolt, and harvest assessments for all twelve of the indicator stocks. Other components in Table 4 are important, but can be funded as short term (3 to 5 year) projects as needed and as basic understanding of Chinook salmon life history improves. Also note that funding levels in Table 4 include all recommendations in this plan with the exception of offshore fishery sampling.
ACKNOWLEDGEMENTS Our agency and academic partners in this stock assessment and research plan are greatly appreciated for their contributions to this plan and the gap analysis. Dr.’s Phil Mundy and Milo Adkison were vital to our scientific collaborations and partnerships. We also appreciate the efforts of the AYK SSI Chinook Expert Panel to understand the causes of decline in Chinook salmon that helped to inspire and inform this plan. We are also particularly indebted to the many volunteers, presenters, panelists, and public participants of the 2012 Chinook salmon symposium for their organization, hard work, expertise, observations, and numerous comments that greatly improved the symposium and this plan. Thank you also goes to the commissioner’s office of ADF&G for their support and guidance during the process of development of the gap analysis, symposium agenda, and this plan. Ray Hilborn, David Hankin, and Brian Riddell provided insightful peer reviews of this plan. Tom Brookover is commended for his leadership and patience during the symposium and development of this plan.
REFERENCES CITED Beamish, R. J. and C. Mahnkin. 2001. A critical size and period hypothesis to explain natural regulation of salmon
abundance and the linkage to climate and climate change. Progress in Oceanography 49: 423-437.
Bernard, H. R. 2011. Research Methods in Anthropology: Qualitative and Quantitative Approaches. Fifth edition. Lanham, Maryland: Altamira Press.
Bonner, S.J., and C.J. Schwarz. 2011. Smoothing population size estimates for time-stratified mark–recapture experiments using Bayesian P-splines. Biometrics 67(4): 1498-1507.

41
REFERENCES CITED (Continued) Bue, B. G., K. L. Schaberg, Z. W. Liller and D. B. Molyneaux. 2012. Estimates of the historic run and escapement
for the Chinook salmon stock returning to the Kuskokwim River, 1976-2011. Alaska Department of Fish and Game, Fishery Data Series No. 12-49, Anchorage.
Catalano, M. 2012. A comparative analysis of patterns in productivity for AYK and selected non-AYK Chinook salmon stocks. AYKSSI Chinook Salmon Outreach Workshop Background Paper. December 10–11, 2012, Anchorage.
Cooper, L. W., M. A. Janout, K. E. Frey, R. Pirtle-Levy, M. L. Guarinello, J. M. Grebmeier, J. R. Lovvorn. 2012. The relationship between sea ice break-up, water mass variation, chlorophyll biomass, and sedimentation in the northern Bering Sea. Deep Sea Research Part II: Topical Studies in Oceanography, Volumes 65–70, 15 June 2012, Pages 141-162.
Clark, R. A., A. Ott, M. Rabe, D. Vincent-Lang, and D. Woodby. 2010. The effects of climate change on key habitats in Alaska. Alaska Department of Fish and Game, Special Publication No. 10-14, Anchorage.
Farley, E. V., J. M. Murphy, B. W. Wing, J. H. Moss, and A. Middleton. 2005. Distribution, migration pathways, and size of western Alaska juvenile salmon along the Eastern Bering Sea shelf. Alaska Fishery Research Bulletin 11(1): 15-26.
Hamazaki, T., M. J. Evenson, S. J. Fleischman and K. L. Schaberg. 2012. Escapement goal recommendation for Chinook salmon in the Kuskokwim River Drainage. Alaska Department of Fish and Game, Fishery Manuscript Series No. 12-08, Anchorage.
Healey, M. C. 1991. Life history of Chinook salmon. Pages 311-393 [In] Groot, C. and L. Margolis, editors. Pacific salmon life histories. University of British Columbia Press, Vancouver.
Healy, M. C. and W. R. Heard. 1984. Inter- and intra-population variation in fecundity of Chinook salmon (Oncorhychus tshawytcsha) and its relevance to life history theory. Canadian Journal of Fisheries and Aquatic Sciences 41:476-483.
Hunt, G. L., K. O. Coyle, L. B. Eisner, E. V. Farley, R. A. Heintz, F. Mueter, J. M. Napp, J. E. Overland, P. H. Ressler, S. Salo, and P. J. Stabeno. 2011. Climate impacts on eastern Bering Sea foodwebs: a synthesis of new data and an assessment of the Oscillating Control Hypothesis. ICES Journal of Marine Science 68(6): 1230-1243.
Huntington, H. P. 1998. Observations on the utility of the semi-directive interview for documenting traditional ecological knowledge. Arctic 51(3):237-242.
King, B. E. and J. A. Breakfield. 2002. Coded wire tagging studies in the Kenai River and Deep Creek, Alaska, 1998. Alaska Department of Fish and Game, Fishery Data Series No. 02-03, Anchorage.
Larson, W. A., F. M. Utter, K. W. Myers, W. D. Templin, J. E. Seeb, A. V. Bugaev, and L. W. Seeb. 2012. Single-nucleotide polymorphisms reveal distribution and migration of Chinook salmon (Oncorhynchus tshawytscha) in the Bering Sea and North Pacific Ocean. Canadian Journal of Fisheries and Aquatic Sciences, 10.1139 /cjfas-2012-0233.
Lukacs, P. M. and K. M. Burnham. 2005. Review of capture-recapture methods applicable to non-invasive genetic sampling. Molecular Biology 14: 3009-3919.
Morrow, J. E. 1980. The freshwater fishes of Alaska. Alaska Northwest Publishing Company, Anchorage.
Mundy, P. R. and D. F. Evenson. 2011. Environmental controls of phenology of high-latitude Chinook salmon populations of the Yukon River, North America, with application to fishery management. ICES Journal of Marine Science 68(6): 1155-1164.
Murphy, J. M., W. D. Templin, E. V. Farley, and J. E. Seeb. 2009. Stock-structured distribution of western Alaska and Yukon juvenile Chinook salmon (Oncorhychus tshawytcsha) from United States BASIS surveys. North Pacific Anadromous Fish Commission Bulletin 5: 51-59.
42
REFERENCES CITED (Continued) Myers, K. W., R. V. Walker, N. D. Davis, J. L. Armstrong, and M. Kaeriyama. 2009. High seas distribution,
biology, and ecology of Arctic-Yukon-Kuskokwim salmon: direct information from high seas tagging experiments, 1954–2006. American Fisheries Society Symposium 70: 201-239.
NPRB (North Pacific Research Board). 2005. North Pacific Research Board Science Plan. The North Pacific Research Board. Anchorage, Alaska.
Pahlke, K. A., P. Richards, and P. Etherton. 2010. Production of Chinook salmon from the Stikine River, 1999–2002. Alaska Department of Fish and Game, Fishery Data Series No. 10-03, Anchorage.
Parken, C. K., R. E. McNichol, and J. R. Irivine. 2006. Habitat based methods to estimate escapement goals for Chinook salmon stocks in British Columbia, 2004. Research Document 2006/083. Ottawa, ON: Canadian Science Advisory Secretariat.
Petit, E. and N. Valiere. 2006. Estimating population size with non-invasive capture-mark-recapture data. Conservation Biology 20(4): 1062-1073.
Ruggerone, G. T., J. L. Nielsen, and B. A. Agler. 2009. Climate, growth, and population dynamics of Yukon River Chinook salmon. North Pacific Anadromous Fish Commission Bulletin 5: 279-285.
Skaugstad, C. and B. McCracken. 1991. Fecundity of Chinook salmon, Tanana River, Alaska. Alaska Department of Fish and Game, Fishery Data Series No. 91-8, Anchorage.
Templin, W. D., J. E. Seeb, J. R. Jasper, A. W. Barclay, and L. W. Seeb. 2011a. Genetic differentiation of Alaska Chinook salmon: the missing link for migratory studies. Molecular Ecology Resources 11: 226-246.
Templin, W. D., A. W. Barclay, J. M. Berger, L. W. Seeb and S. D. Moffitt. 2011b. Genetic stock identification of Copper River Chinook salmon harvest, 2005–2008. Alaska Department of Fish and Game, Fishery Manuscript Series No. 11-08 Anchorage.
Thedinga, J. F., S. W. Johnson and K. V. Koski. 1998. Age and marine survival of ocean-type Chinook salmon Oncorhynchus tshawytscha from the Situk River, Alaska. Alaska Fishery Research Bulletin 5(2):143-148.
Wertheimer, A. C., J. A. Orsi, E. A. Fergusson, and M. V. Sturdevant. 2009. Forecasting pink salmon harvest in Southeast Alaska from juvenile salmon abundance and associated environmental parameters: 2008 returns and 2009 forecast. NPAFC Document 1201 (available at http://www.npafc.org).

43
TABLES AND FIGURES

44
Table 1.–Average inshore and federal waters harvests and fishery-specific activities recommended to fill knowledge gaps in stock-specific harvest assessment.
Chinook Fishery
Average Harvest (1994–2006)
Average Harvest (2007–2011)
Stock-Specific Harvest Assessment
Southeast Subsistence: 1,000
Commercial: 309,000 Sport: 71,000
Subsistence: 1,000 Commercial: 297,000
Sport: 65,000
Genetics mixed-stock analysis and sampling of troll, sport, and districts 108 and 111 gillnet
Copper River and Prince
William Sound
Subsistence: 7,000 Commercial: 48,000
Sport: 10,000
Subsistence: 5,000 Commercial: 18,000
Sport: 8,000
Age-size of commercial harvest. CWT recovery of major fisheries at 20% minimum coverage; genetic mixed-stock analysis of major fisheries
Cook Inlet Subsistence: 3,000
Commercial: 18,000 Sport: 74,000
Subsistence: 2,000 Commercial: 12,000
Sport: 45,000
Comprehensive marine CWT and genetics sampling of Upper subdistrict set gillnet, Kenai Peninsula sport, Tyonek subsistence, Northern District set gillnet, Central District drift gillnet, winter sport fishery in Homer
Kodiak Subsistence: <1,000 Commercial: 19,000
Sport: 8,000
Subsistence: <1,000 Commercial: 15,000
Sport: 9,000
CWT recovery of major fisheries at 20% minimum coverage; genetic mixed-stock analysis of major fisheries
Chignik and Alaska
Peninsula
Subsistence: 1,000 Commercial: 17,000
Sport: 4,000
Subsistence: <1,000 Commercial: 14,000
Sport: 3,000
CWT recovery of major fisheries at 20% minimum coverage; genetic mixed-stock analysis of major fisheries
Bristol Bay Subsistence: 16,000 Commercial: 78,000
Sport: 8,000
Subsistence: 14,000 Commercial: 38,000
Sport: 8,000
Improved genetic baseline resolution (listed under Table 3). CWT and genetic sampling of Chinook harvests.
Kuskokwim Subsistence: 90,000 Commercial: 30,000
Sport: 2,000
Subsistence: 84,000 Commercial: 21,000
Sport: 2,000
Improved genetic baseline resolution (listed under Table 3) . CWT and genetic sampling of Chinook harvests..
Yukon Subsistence: 51,000 Commercial: 64,000
Sport: 1,000
Subsistence: 44,000 Commercial: 10,000
Sport: 1,000
Improved genetic baseline resolution (listed under Table 3) . CWT and genetic sampling of Chinook harvests.
Norton Sound Kotzebue
Subsistence: 6,000 Commercial: 5,000
Sport: 1,000
Subsistence: 4,000 Commercial: 1,000
Sport: <1,000
Improved genetic baseline resolution (listed under Table 3) . CWT and genetic sampling of Chinook harvests.
Federal waters bycatch (all groundfish fisheries)
GOA: 19,000 BSAI: 47,000
GOA: 28,000 BSAI: 41,000
Increased observer sampling rate of bycatch for CWT and genetics, as well for process studies (listed under Table 3)
Totals
Subsistence: 175,000 Commercial: 584,000
Sport: 178,000 Federal Waters: 66,000
Subsistence: 154,000 Commercial: 425,000
Sport: 140,000 Federal Waters: 69,000
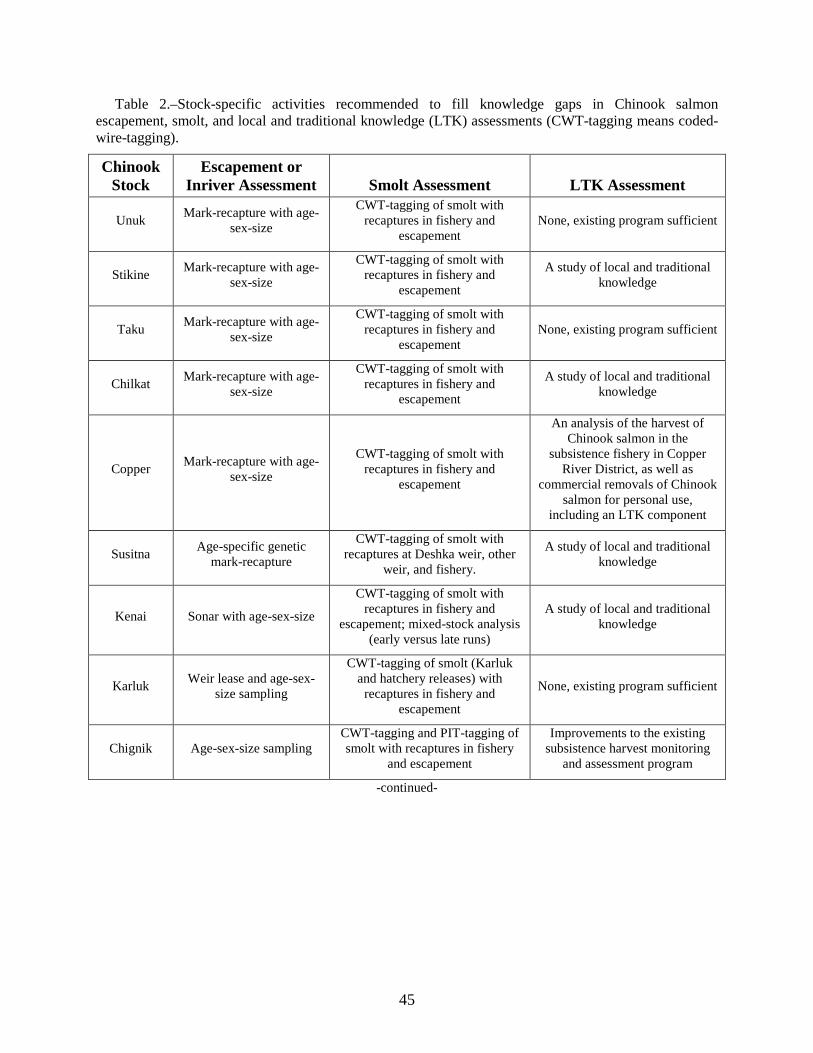
45
Table 2.–Stock-specific activities recommended to fill knowledge gaps in Chinook salmon escapement, smolt, and local and traditional knowledge (LTK) assessments (CWT-tagging means coded-wire-tagging).
Chinook Stock
Escapement or Inriver Assessment Smolt Assessment LTK Assessment
Unuk Mark-recapture with age-sex-size
CWT-tagging of smolt with recaptures in fishery and
escapement None, existing program sufficient
Stikine Mark-recapture with age-sex-size
CWT-tagging of smolt with recaptures in fishery and
escapement
A study of local and traditional knowledge
Taku Mark-recapture with age-sex-size
CWT-tagging of smolt with recaptures in fishery and
escapement None, existing program sufficient
Chilkat Mark-recapture with age-sex-size
CWT-tagging of smolt with recaptures in fishery and
escapement
A study of local and traditional knowledge
Copper Mark-recapture with age-sex-size
CWT-tagging of smolt with recaptures in fishery and
escapement
An analysis of the harvest of Chinook salmon in the
subsistence fishery in Copper River District, as well as
commercial removals of Chinook salmon for personal use,
including an LTK component
Susitna Age-specific genetic mark-recapture
CWT-tagging of smolt with recaptures at Deshka weir, other
weir, and fishery.
A study of local and traditional knowledge
Kenai Sonar with age-sex-size
CWT-tagging of smolt with recaptures in fishery and
escapement; mixed-stock analysis (early versus late runs)
A study of local and traditional knowledge
Karluk Weir lease and age-sex-size sampling
CWT-tagging of smolt (Karluk and hatchery releases) with
recaptures in fishery and escapement
None, existing program sufficient
Chignik Age-sex-size sampling CWT-tagging and PIT-tagging of smolt with recaptures in fishery
and escapement
Improvements to the existing subsistence harvest monitoring
and assessment program
-continued-
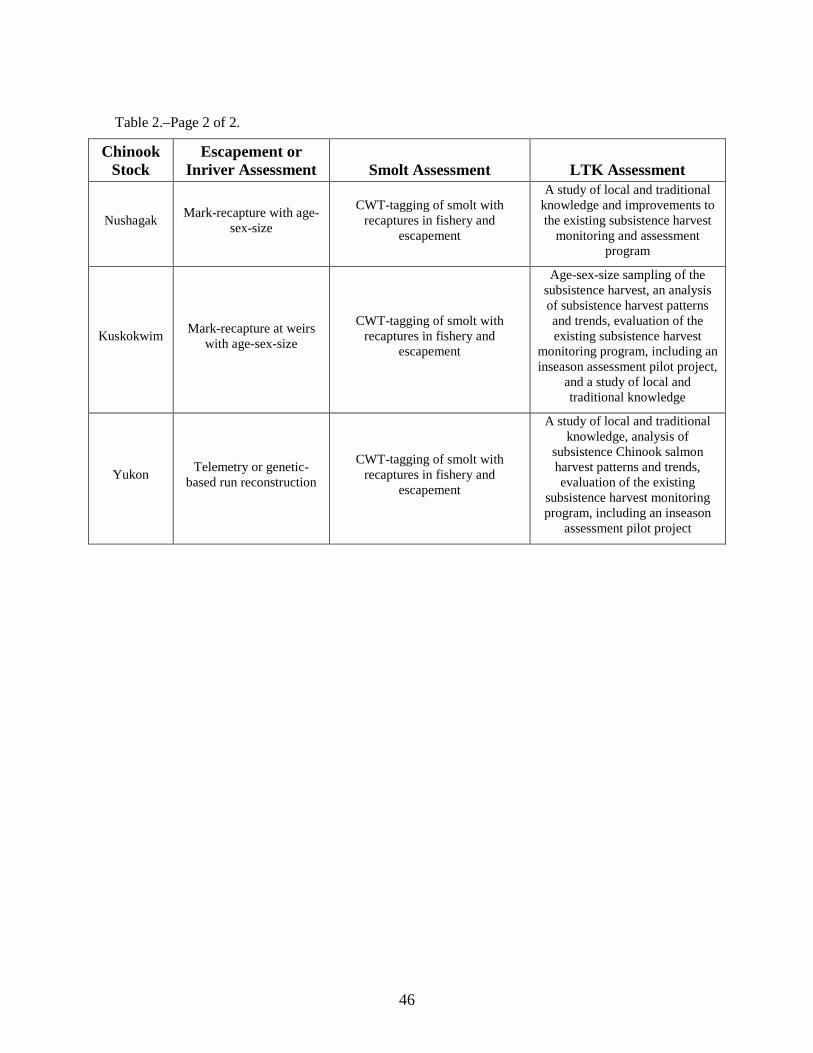
46
Table 2.–Page 2 of 2.
Chinook Stock
Escapement or Inriver Assessment Smolt Assessment LTK Assessment
Nushagak Mark-recapture with age-sex-size
CWT-tagging of smolt with recaptures in fishery and
escapement
A study of local and traditional knowledge and improvements to the existing subsistence harvest
monitoring and assessment program
Kuskokwim Mark-recapture at weirs with age-sex-size
CWT-tagging of smolt with recaptures in fishery and
escapement
Age-sex-size sampling of the subsistence harvest, an analysis of subsistence harvest patterns and trends, evaluation of the existing subsistence harvest
monitoring program, including an inseason assessment pilot project,
and a study of local and traditional knowledge
Yukon Telemetry or genetic-based run reconstruction
CWT-tagging of smolt with recaptures in fishery and
escapement
A study of local and traditional knowledge, analysis of
subsistence Chinook salmon harvest patterns and trends, evaluation of the existing
subsistence harvest monitoring program, including an inseason
assessment pilot project

47
Table 3.–Recommended activities to fill knowledge gaps that cut across Chinook salmon stocks and
fisheries.
Activity Explanation Nearshore Marine Trawl
Research Cruises As a companion to stock-specific estimates of marine survival, 3 years of trawl research cruises to study trends in nearshore marine abundance and distribution of juvenile Chinook salmon in the northern and southern Bering Sea, and Gulf of Alaska
Modeling effort for Western Alaska Chinook
salmon
Use of data from research surveys to parameterize models for addressing questions regarding salmon production.
Offshore Fishery Sampling
GOA: Improvement in observer sampling rate (bycatch and CWT/genetic bycatch composition). Sample for CWT at 20% minimum for harvest coverage. BSAI: Sample for CWT at 20% minimum for harvest coverage. Both: Improved geographic and stock-specific resolution of bycatch to the individual haul. Consider use of bycatch samples for process studies of feeding, growth, maturation, and energy content.
Process Studies on the Yukon River
Three studies are recommended with the Yukon River as an initial focus stock. The first study is to examine climate-induced changes to Chinook salmon spawning and freshwater rearing habitats. The second study would examine predation as a source of Chinook salmon declines in Alaska. The third study will examine Chinook salmon condition during various freshwater and marine life stages and relate these measurements to adult production and environmental variables.
Genetic Baseline Development
Additional collections of Chinook salmon are needed to improve the Alaska Chinook salmon genetic baseline, which is required for stock identification purposes.
Genetic Marker Development
The inability to distinguish lower river spawning populations of Bristol Bay, Kuskokwim, and Yukon Chinook salmon from each other is a major knowledge gap; additional genetic marker development is necessary to improve identification ability.
CWT Lab Support Implementation of additional CWT activities across Alaska will lead to greatly increased workload at the CWT lab and additional fiscal resources will be required for the CWT lab to handle the added workload.
Scale Reading Support Many more scales from both adult and juvenile Chinook salmon will be collected. These scales will need to be read to determine age and samples will require archiving.
Biometric Support An additional biometrician will be required to support the program as identified
Publication Support Additional staff members are needed to ensure timely reporting of results of this program.

48
Table 4.–Approximate annual costs (including startup costs) by type of activity to address Chinook salmon knowledge gaps (thousands of dollars).
Type of Activity Approximate Annual Cost
Stock-Specific Escapement or Inriver Run Assessments $3,000
Stock-Specific Smolt Assessments $2,500
Stock-Specific LTK Assessments $500
Stock-Specific Harvest Assessments $1,800
Marine Surveys and Modeling $1,600
Process Studies $700
Genetic Baseline and Marker Development $300
Programmatic Support $500
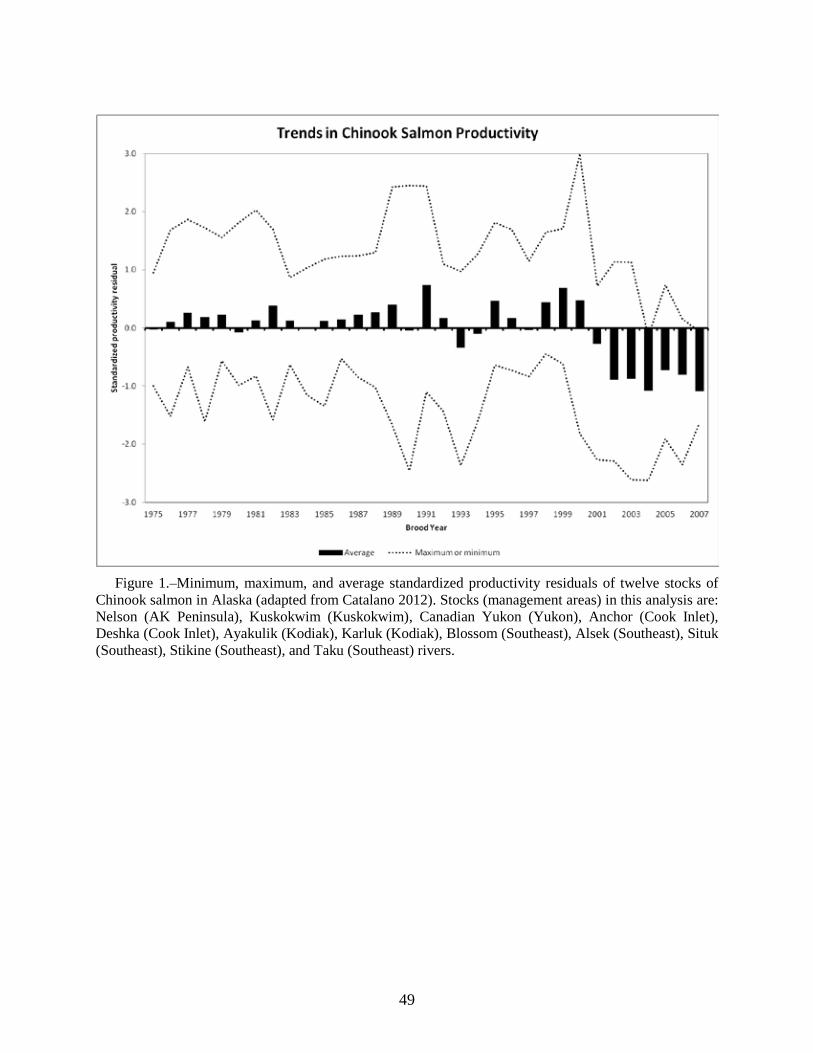
49
Figure 1.–Minimum, maximum, and average standardized productivity residuals of twelve stocks of
Chinook salmon in Alaska (adapted from Catalano 2012). Stocks (management areas) in this analysis are: Nelson (AK Peninsula), Kuskokwim (Kuskokwim), Canadian Yukon (Yukon), Anchor (Cook Inlet), Deshka (Cook Inlet), Ayakulik (Kodiak), Karluk (Kodiak), Blossom (Southeast), Alsek (Southeast), Situk (Southeast), Stikine (Southeast), and Taku (Southeast) rivers.

50
Figure 2.–Minimum, maximum, and average of standardized deviations from average run abundance
of 21 stocks of Chinook salmon in Alaska. Stocks (management areas) in this analysis are: Ayakulik (Kodiak), Chignik (Chignik), Nelson (AK Peninsula), Karluk (Kodiak), Nushagak (Bristol Bay), Situk (Southeast), Alsek (Southeast), Chilkat (Southeast), Taku (Southeast), Stikine (Southeast), Unuk (Southeast), Goodnews (Kuskokwim), Deshka (Cook Inlet), Anchor (Cook Inlet), Late Run Kenai (Cook Inlet), Kuskokwim (Kuskokwim), Canadian Yukon (Yukon), Chena (Yukon), Salcha (Yukon), Unalakleet (Norton Sound), Copper (PWS) rivers.

51
Figure 3.–Harvest and escapement of Chinook salmon in the Unuk River, 1986-2010.
Figure 4.–Harvest and escapement of Chinook salmon in the Stikine River, 1981-2009.
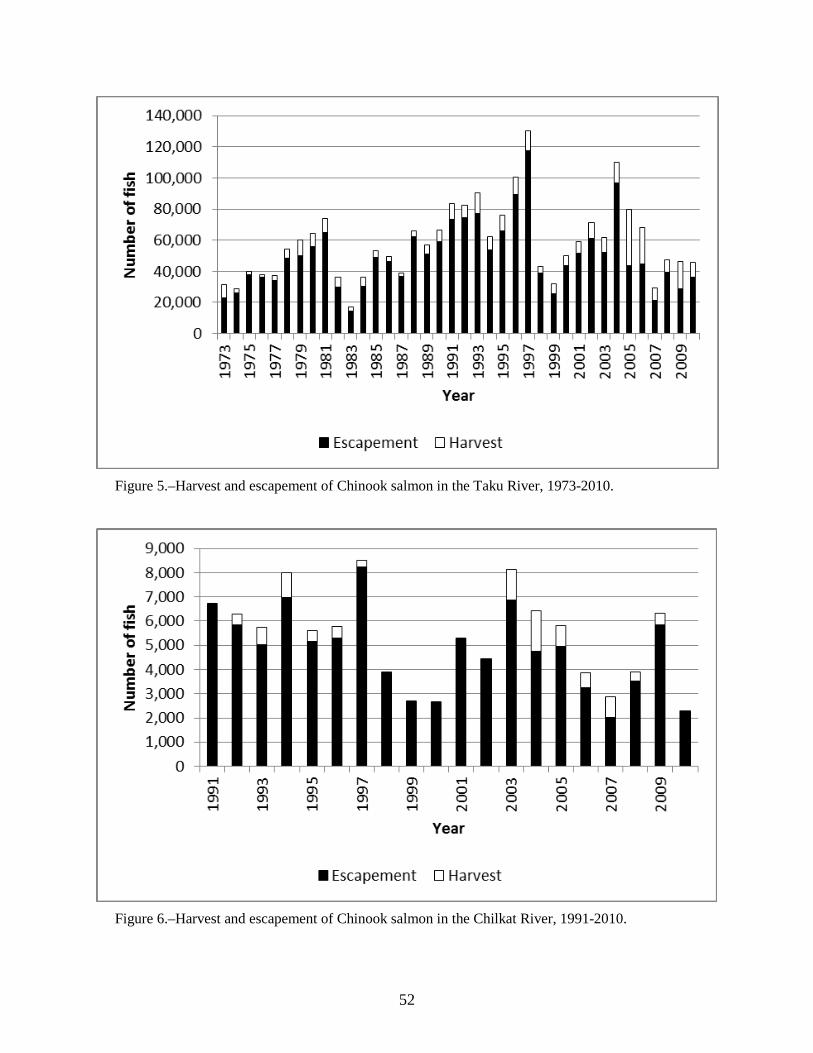
52
Figure 5.–Harvest and escapement of Chinook salmon in the Taku River, 1973-2010.
Figure 6.–Harvest and escapement of Chinook salmon in the Chilkat River, 1991-2010.
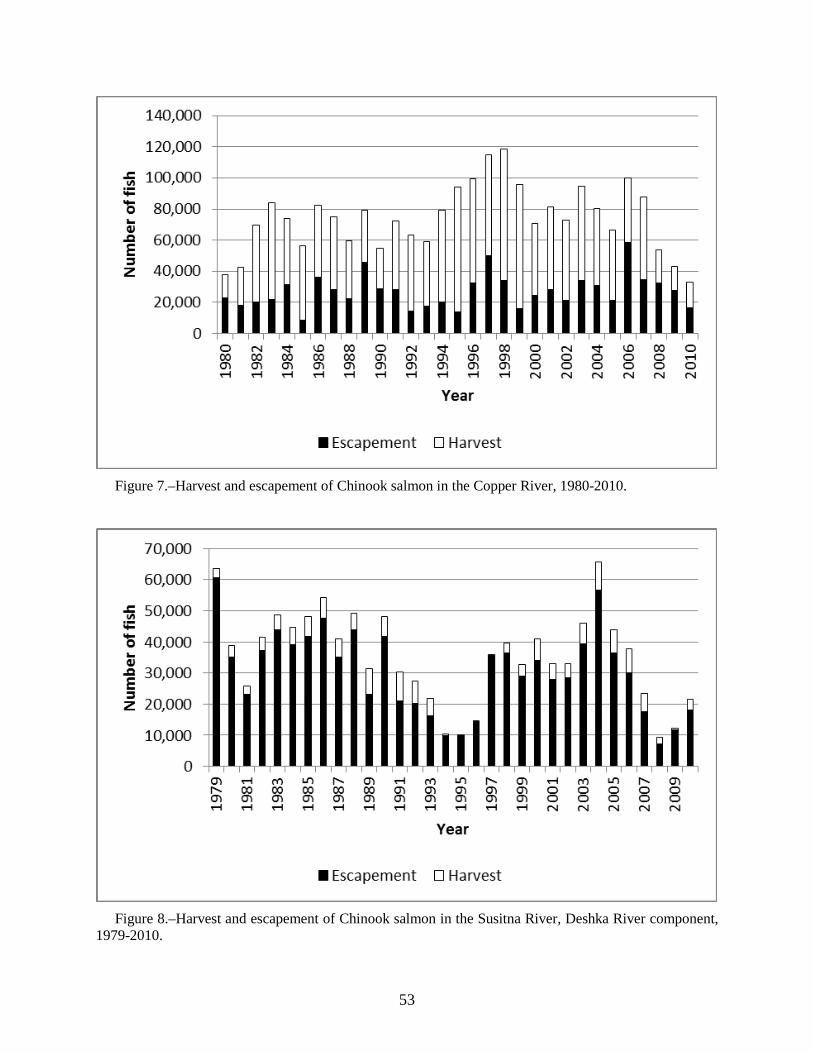
53
Figure 7.–Harvest and escapement of Chinook salmon in the Copper River, 1980-2010.
Figure 8.–Harvest and escapement of Chinook salmon in the Susitna River, Deshka River component,
1979-2010.
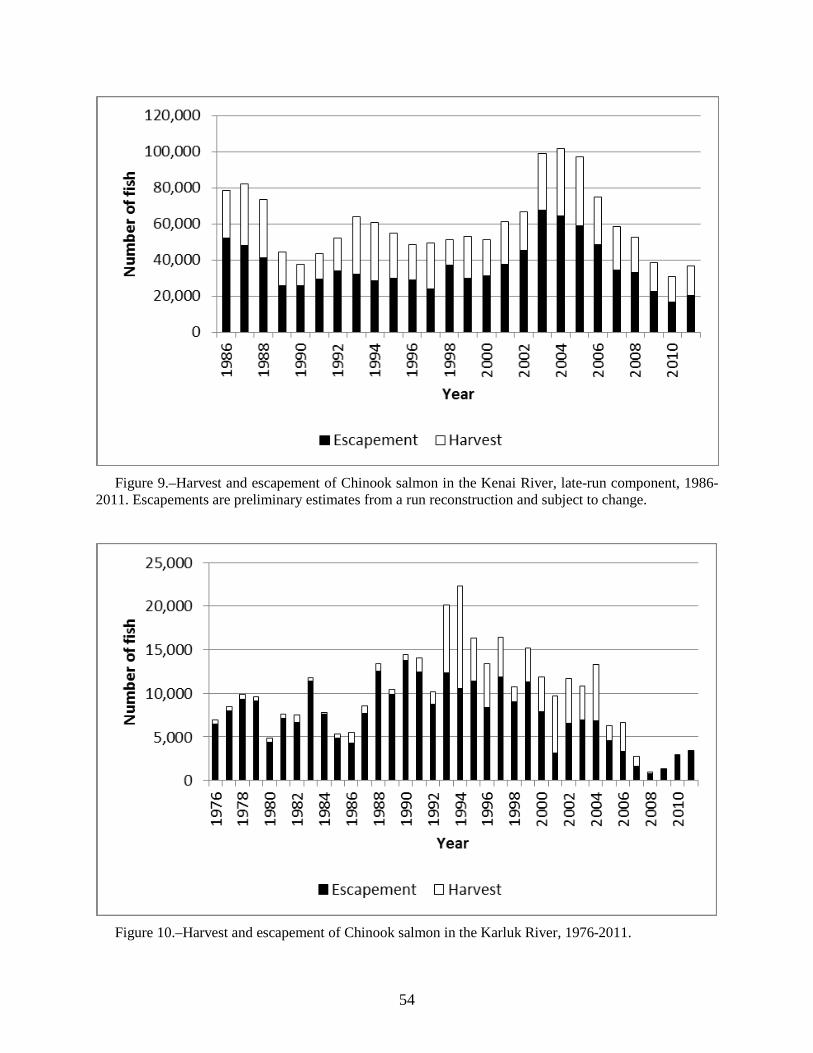
54
Figure 9.–Harvest and escapement of Chinook salmon in the Kenai River, late-run component, 1986-
2011. Escapements are preliminary estimates from a run reconstruction and subject to change.
Figure 10.–Harvest and escapement of Chinook salmon in the Karluk River, 1976-2011.

55
Figure 11.–Harvest and escapement of Chinook salmon in the Chignik River, 1978-2011.
Figure 12.–Harvest and escapement of Chinook salmon in the Nushagak River, 1966-2011.

56
Figure 13.–Harvest and escapement of Chinook salmon in the Kuskokwim River, 1976-2011.
Figure 14.–Harvest and escapement of Chinook salmon in the Yukon River, Canadian component,
1982-2010. Escapements are preliminary estimates from a run reconstruction and subject to change.