chlorophyll fluorescence spectra as an indicator of x-ray
TRANSCRIPT
Hindawi Publishing CorporationSpectroscopy: An International JournalVolume 27 (2012), Issue 4, Pages 206–213doi:10.1155/2012/951064
Chlorophyll Fluorescence Spectra asan Indicator of X-Ray + EMS-InducedPhytotoxicity in Safflower
Jitendra Kumar Pandey,1 Preeti Srivastava,2 Ram Singh Yadav,2 and Ram Gopal1, 3
1M. N. Saha Center of Space Studies, IIDS, Nehru Science Center, University of Allahabad,Allahabad 211002, India
2Plant Genetics Laboratory, Department of Botany, University of Allahabad, Allahabad 211002, India3Laser Spectroscopy and Nanomaterials Lab, Department of Physics (UGC-CAS),University of Allahabad, Allahabad 211002, India
Correspondence should be addressed to Jitendra Kumar Pandey, [email protected]
Copyright © 2012 Jitendra Kumar Pandey et al. This is an open access article distributed under the Creative CommonsAttribution License, which permits unrestricted use, distribution, and reproduction in any medium, provided the original workis properly cited.
Abstract. The present investigation deals with the study of in vivo laser-induced chlorophyll florescence spectra (LICF) ofsafflower leaves (Carthamus tinctorius L.) for X-rays + EMS-treated plants. Seeds were treated with different doses of X-ray + EMS (5, 8, 12, 25, and 30 Kr + 0.5% EMS) and were grown in the green house. The effects of the concerned treatmenton chlorophyll (Chl) contents and Chl fluorescence were investigated after 7 days of germination. Results obtained revealed thatthe values of Chl contents, intensity of Chl fluorescence spectra, and fluorescence intensity ratio (FIR) F685/F730 are directlycorrelated with the treatment doses monitored. The treatment sets of 8, 12, and 25 Kr + 0.5% EMS doses showed an increase inFIR and thereby a decrease in the Chl contents. However, the lowest treatment dose of 5 Kr + 0.5% showed a decrease in FIRand thereby an increase in chlorophyll contents. Safflower seeds treated with 30 Kr + 0.5% EMS were proved to be lethal asthey showed no germination. Thus, our study demonstrates early detection of chlorophyll damage caused by various physicaland chemical mutagens through the application of LICF spectra.
Keywords: X-ray + EMS treatment, Laser-induced chlorophyll fluorescence, Fluorescence intensity ratio, Photosyntheticpigment contents (chlorophyll a, chlorophyll b, and carotenoids), Safflower (Carthamus tinctorius L.)
1. Introduction
Laser-induced fluorescence (LIF) is a powerful tool for plant investigation, and it can illustrate a lot ofinformation about plant health and identity of plants. Leaf pigments emit fluorescence after irradiationwith laser light [1]. The in vivo chlorophyll fluorescence spectra of plant leaves shows two fluorescencemaxima, one in the spectral region near 685 nm and other in the region near 730 nm [2]. The shape of thefluorescence spectra and the value of the fluorescence intensity ratio (FIR) up to a great extent dependupon the Chl contents and absorbance of the leaves [3]. Fluorescence intensity ratios show a good cor-relation with pigment contents and pigment ratios [4]. The intensity of the red and far-red chlorophyll
Spectroscopy: An International Journal 207
fluorescence is inversely related to the photosynthetic activity. With the decrease in the photosynthesisowing to various stress conditions, the FIR increases. The increase in chlorophyll content in plants resultsin a decrease in the value of the FIR.
Safflower is one of the world’s oldest oilseed crops that have been grown commercially for edibleoil and natural dye sources around the world [5]. Safflower petals besides being a source of dye aremedicinally important in curing several chronic diseases like hypertension, coronary heart ailments,rheumatism, and male- and female-fertility-related problems [6, 7]. It is an important alternative plantthat can be used to increase edible oil sources. It is a highly tolerant crop that can be safely grown underarid and saline sodic conditions [8, 9].
X-rays are nonparticulate electromagnetic radiations with a wavelength of 0.001–10 A. These arehigh-energy radiations and consist of photons, that is, small packets of energy. X-rays are produced whenvery fast moving electrons strike a high-melting-point element like Tungsten in X-ray tubes. X-rays areoften referred to as hard (0.001–0.1 A) or soft (1–10 A) depending upon their wavelength. X-rays arehighly penetrating and sparsely ionizing. Ionizing radiations produce a wide range of effects on DNAthrough either free radical effects or direct action on DNA. It causes breaks in sugar phosphate backboneof one or both strands of DNA, consequently, leading to the rearrangements through tautomerization,deletions, chromosome loss, and so forth. Mutations are also caused by damage or loss of bases.Sometimes the effect may result in cross-linking of DNA to itself or proteins, breaking of H-bondsof bases, blockage of cell division, organelle failure, or cell death [10–12].
EMS is a widely used chemical mutagen that is a nonfunctional agent with one reactive group. Itcauses ethylation of bases in DNA. EMS is a monofunctional alkylating agent that reacts with DNA atthe 7-N and 6-0 positions. Alkylation of ring N causes depurination, which leads to backbone breaks.When 7-ethylguanine is produced, it pairs with thymine to cause G:C → A:T transitions. The lethalityof EMS is due to alkylation of proteins. Alkylating agents interact with DNA causing changes in itsstructure. This may result in the loss, addition, or replacement of bases, thus, altering their sequence inthe DNA and affecting the fidelity of the genetic message. Relative frequencies of mutation depend onthe reactivity of the agents involved. Deletion and insertion leading to producing frameshift mutations.The inactivating alterations include removal of bases, dimmer formation, cross-linking of the two DNAstrands, and single or double strand breaks [13, 14].
X-ray and EMS both are highly toxic for plant and animal health. In order to evaluate themutagenic efficiency of X-rays and EMS on seeds, the present study has been conducted on safflower.Here, we investigate the combined effect of highly toxic chemical mutagen EMS and mutagenicioning radiation X-ray treatment of seeds on pigment contents and chlorophyll fluorescence responseof safflower leaf and to suggest the most appropriate dose for further mutation breeding programs.
2. Material and Methods
2.1. Procurement of Seeds and Chemical
Seeds of safflower (Carthamus tinctorius L. var. A1) was obtained from NBPGR, New Delhi, India, andEMS was obtained from Merck, India.

208 Spectroscopy: An International Journal
2.2. Plant Growth and X-Ray + EMS Treatment
The dry seeds of safflower were exposed to five different doses of X-ray irradiation, that is, 5, 8, 12, 25,and 30 Kr, respectively. X-ray irradiation was delivered at 230 kV for 84 rad/min at room temperature.X-ray-irradiated seeds were presoaked in 0.5% solution of ethylmethane sulphonate (EMS) for 5 hours.Then, the X-ray + EMS-treated seeds of safflower after washing well in running water were sown in 3replicates with 10 seeds in each pot. Seeds treated with distilled water were kept as control and werealso sown in their respective pot simultaneously in greenhouse conditions to a raise the M1 generation.All the treated sets except for 30 Kr + 0.5% EMS showed germination, which depicts that this dose islethal for safflower.
2.3. Determination of Pigment
Plant leaves (20 mg) from control and X-ray + EMS-treated safflower plants were extracted in 3 mL80% acetone (v/v, in double distilled water), and the extract was used for the measurement of pigmentcontents. The pigment contents were determined from the transparent, centrifuged acetone extractsolution by measuring the absorbance in the region 380–700 nm using the UV/VIS spectrometer (PerkinElmer lambda 35). The pigment contents were determined according to the method of Lichtenthaler andWellburn [15].
2.4. Laser-Induced Chlorophyll Fluorescence Spectra
LICF spectra were recorded using computer control Acton 0.5 M triple grating monochromator,Hamamatsu R928 PMT, as a detector, excited with 405 nm violet diode laser (Oxxus CE, made inFrance, Modal PS-001) light. The beam expander was aligned to obtain 4.0 cm2 expanded laser lighton leaves. The fluorescence radiation was collected on the entrance slit of monochromator.
LICF spectra were recorded in the region of 650–780 nm with 1800 grooves/mm grating blazedat 500 nm wavelength using survey mode of spectra sense software. These spectra were analyzed usingGRAMS 32 software with Curve-Fit Array Basic program. Spectral correction was made from theresponse curve of PMT and grating of monochromator.
2.5. Curve Fitting
Interactive nonlinear curve fitting was made using the Levenberg-Marquardt algorithm method. Afterchoosing the Gaussian spectral function, the individual component peaks were selected. Peak widthswere adjusted so as to obtain approximately the line shape of the spectrum. It provides a reasonablematching fit of the spectral data with good F-statistics, standard error for peak amplitude, peak centerand bandwidth (full width at half-intensity maximum).
3. Results and Discussion
3.1. Photosynthetic Pigments
Treated the Plants showed better growth than the control plants for 5 Kr + 0.5% EMS treatment asthe photosynthetic pigments, that is, Chl a, Chl b, and carotenoid contents were increased by 7.39,

Spectroscopy: An International Journal 209
Table 1: Photosynthetic pigment contents and pigment ratios of control and X-ray + EMS-treatedsafflower plants.
X-ray + EMStreatment
Chl a(µg/mL)
Chl b(µg/mL)
Total Chl(µg/mL) Chl a/b Car (µg/mL) Chl/Car
Control 8.25 ± 0.06 1.92 ±0.07 10.17 ± 0.06 4.29 ± 0.12 0.77 ± 0.12 13.14 ± 0.12
5 Kr + 0.5%EMS
8.86 ± 0.05(7.39)
2.14 ±0.04
(11.46)
11.00±0.05(8.16)
4.14 ± 0.07(–3.49)
0.78 ± 0.07(1.30)
14.10±0.08(7.31)
8 Kr + 0.5%EMS
8.21 ± 0.06(–0.48)
1.76 ±0.09
(–8.33)
9.97 ± 0.08(–1.97)
4.66 ± 0.14(8.62)
1.07 ± 0.09(38.96)
9.30 ± 0.08(–29.22)
12 Kr + 0.5%EMS
7.64 ± 0.08(–7.39)
1.71 ±0.07
(–10.94)
9.35 ± 0.08(–8.06)
4.48 ± 0.13(4.43)
0.92 ± 0.07(19.48)
10.21 ± 0.16(–22.30)
25 Kr + 0.5%EMS
6.69 ± 0.12(–18.91)
1.22 ±0.10
(–36.46)
7.91 ± 0.11(–22.22)
5.47 ± 0.11(27.51)
1.15 ± 0.24(49.35)
6.88 ± 0.15(–47.64)
± Values indicate standard deviation (mean n = 3). The values in parenthesis show percent decrease/increase over controlplant.
11.36, and 1.30%, respectively, over the control plants (Table 1). Except the dose of 5 Kr + 0.5% EMS,with increasing dose of X-ray + EMS treatment, the leaf Chl contents decreased continuously and thatdecrease was recorded up to 22.22% for 25 Kr + 0.5% EMS as compared to the control plants (Table 1),whereas carotenoid contents increased continuously for all used treatment doses and this increase wasup to 49.35% for 25 Kr + 0.5% EMS. The decrease in the Chl b content was higher in comparison tothe Chl a for the doses 8, 12, and 25 Kr + 0.5% EMS; thus the ratio of Chl a/b increased for these dosesand it increased maximally up to 27.51% for 25 Kr + 0.5% EMS. The Chl a/b ratio decreased for 5 Kr +0.5% EMS as the increase in the Chl b was higher at this dose. As the carotenoids contents increasedfor all used doses, the Chl/Car ratio decreased for all used doses except the 5 Kr + 0.5% EMS becauseat this dose the increase in the carotenoid contents was lower than the increase in the Chl contents.
The decrease in the pigment contents for 8, 12,and 25 Kr + 0.5% EMS doses clearly reflects theeffect of mutagenic treatment on safflower plants and obviously the maximum inhibition observed at themaximum dose of treatment with minimum Chl contents (or maximum decrease in the Chl contents).The inhibition response decreases with the decrease in the intensity of treatment doses, and it shows apositive response for 5 Kr + 0.5% EMS dose. Lower value of the Chl a/b indicates the presence of morelight-harvesting Chl complexes of LHC2 [16, 17], thus we can assume that a lower number of lightharvesting Chl complexes in the case of 8, 12, and 25 Kr + 0.5% EMS-treated plants and it decreaseswith the increase in the dose of treatment, whereas light-harvesting Chl complexes may be increasingfor treatment of 5 Kr + 0.5% EMS dose. Carotenoids are essential constituents of Chl-binding proteinsin all higher plants and they have two key roles in plants and algae: firstly they absorb light energy foruse in photosynthesis, and secondly they protect chlorophyll from photodamage [18]. Increase in thecarotenoid contents may be due to X-ray + EMS-induced damage in photosystem of plant, which has

210 Spectroscopy: An International Journal
Table 2: Chlorophyll fluorescence parameters of the curve-fitted spectra of control and X-ray + EMS-treated safflower plants excited by 405 nm violet diode laser.
Treatment ofX-ray + EMS
Curve-fitted chlorophyll fluorescence parametersF685 F730
Peak(nm)
Height(arb)
Width(nm)
Area(arb)
Peak(nm)
Height(arb)
Width(nm)
Area(arb)
Control 682.87 3198.59 22.40 80911 727.39 1249.70 47.92 533065 Kr + 0.5%EMS 683.12 1565.35 21.35 35533 727.14 675.36 49.46 35365
8 Kr + 0.5%EMS 683.64 4533.64 23.44 112898 727.14 1585.76 55.73 92891
12 Kr + 0.5%EMS 683.38 6479.01 23.48 161588 725.32 1715.12 52.07 94431
25 Kr + 0.5%EMS 683.65 9349.17 22.91 227651 723.50 2893.03 54.69 167043
similar symptoms like photodamage in plant, in response to the fact that the carotenoid contents of theplant increase and the increase was at its maximum in the case of 25 Kr + 0.5% EMS-treated plants.Increase in the carotenoid contents was comparatively lower than the increase in the Chl a and s for 5 Kr+ 0.5% EMS dose, which further shows better physiological condition of the plant at this dose.
3.2. Laser-Induced Chlorophyll Fluorescence Spectra
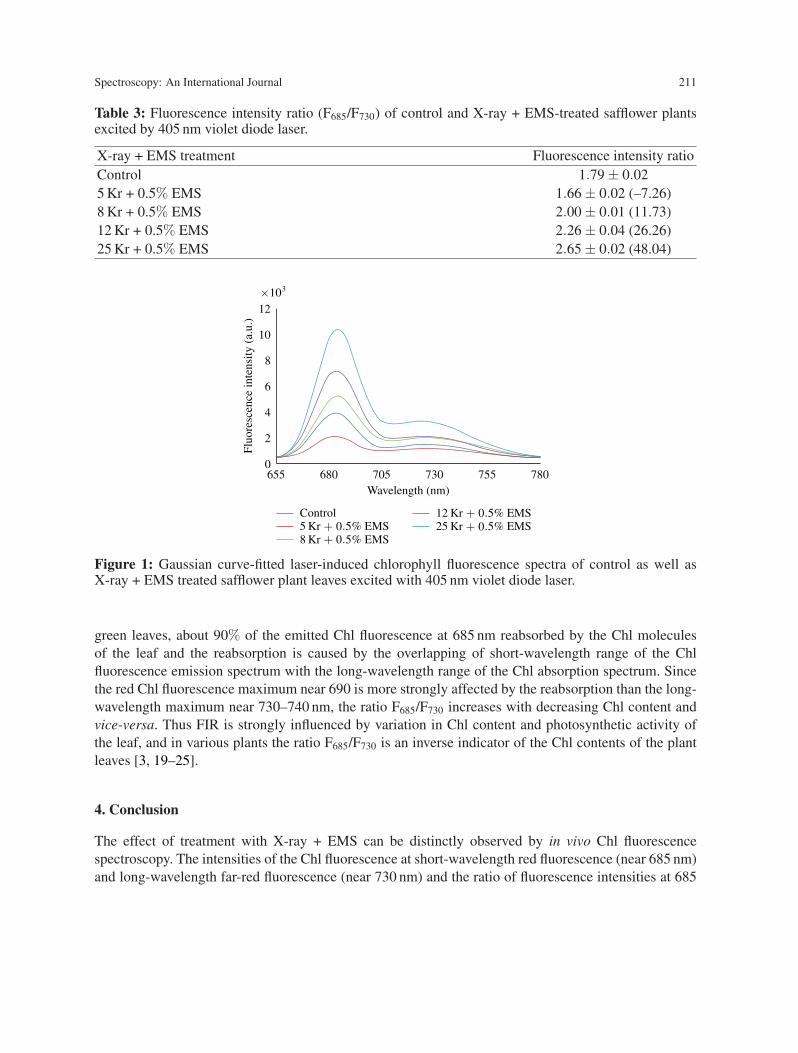
The LICF spectra of the control and X-ray + EMS-treated plants exhibit two fluorescence maxima inred (F685) and far-red (F730) regions (Figure 1). The curve-fitted fluorescence parameters such as peakposition, peak height, band width, and band area are given in the Table 2. These spectra indicate that theintensities of the Chl fluorescence (red and far-red) are much affected by the X-ray + EMS treatment. Thevariation in the Chl fluorescence intensity at F685 is markedly different than the fluorescence intensity atF730. The intensity of the fluorescence emission was much increased at 685 nm for inhibitory doses of X-ray + EMS treatment. The fluorescence intensity at 685 nm is much higher than at 730 nm as presentedin Figure 1 and Table 2. Similarly, the decrease in the fluorescence intensity at 685 nm was much higherthan the decrease at the 730 nm for 5 Kr + 0.5% EMS dose. FIR (F685/F730) was calculated from curve-fitted LICF spectra (Table 3). The FIR showed a decrease of 7.26% for 5 Kr + 0.5% EMS dose. TheFIR increased significantly with increase in the dose of treatment. It increased up to 48.04% for 25 Kr +0.5% EMS treatment.
The intensity and shape of the Chl fluorescence emission spectrum of leaves at room temperatureare primarily dependent on the concentration of the fluorophore Chl a and to a lower degree also on theleaf structure, the photosynthetic activity, and leaf optical properties. The later determine the penetrationof excitation light into the leaf as well as the emission of Chl fluorescence from different depths of theleaf. The fluorescence intensity near 685 nm increases with the decrease in the fluorophore Chl a. Theincrease in the short-wavelength red fluorescence with the decrease in the Chl contents is due to thereduction of the reabsorption of the emitted red Chl fluorescence by the Chl absorption band. In the
Spectroscopy: An International Journal 211
Table 3: Fluorescence intensity ratio (F685/F730) of control and X-ray + EMS-treated safflower plantsexcited by 405 nm violet diode laser.
X-ray + EMS treatment Fluorescence intensity ratioControl 1.79 ± 0.025 Kr + 0.5% EMS 1.66 ± 0.02 (–7.26)8 Kr + 0.5% EMS 2.00 ± 0.01 (11.73)12 Kr + 0.5% EMS 2.26 ± 0.04 (26.26)25 Kr + 0.5% EMS 2.65 ± 0.02 (48.04)
12
10
8
6
4
2
0
Fluo
resc
ence
inte
nsity
(a.u
.)
655 680 705 730 755 780Wavelength (nm)
×103
Control5 Kr .5% EMS8 Kr .5% EMS
12 Kr + 0+ 0+ 0
+ 0
.5% EMS25 Kr .5% EMS
Figure 1: Gaussian curve-fitted laser-induced chlorophyll fluorescence spectra of control as well asX-ray + EMS treated safflower plant leaves excited with 405 nm violet diode laser.
green leaves, about 90% of the emitted Chl fluorescence at 685 nm reabsorbed by the Chl moleculesof the leaf and the reabsorption is caused by the overlapping of short-wavelength range of the Chlfluorescence emission spectrum with the long-wavelength range of the Chl absorption spectrum. Sincethe red Chl fluorescence maximum near 690 is more strongly affected by the reabsorption than the long-wavelength maximum near 730–740 nm, the ratio F685/F730 increases with decreasing Chl content andvice-versa. Thus FIR is strongly influenced by variation in Chl content and photosynthetic activity ofthe leaf, and in various plants the ratio F685/F730 is an inverse indicator of the Chl contents of the plantleaves [3, 19–25].
4. Conclusion
The effect of treatment with X-ray + EMS can be distinctly observed by in vivo Chl fluorescencespectroscopy. The intensities of the Chl fluorescence at short-wavelength red fluorescence (near 685 nm)and long-wavelength far-red fluorescence (near 730 nm) and the ratio of fluorescence intensities at 685
212 Spectroscopy: An International Journal
and 730 nm (FIR) depend upon the dose of X-ray + EMS treatment. The FIR is the lowest (1.66) inthe case of 5 Kr + 0.5% EMS-treated set, which depicts that this dose has biostimulatory effect onplant and thus could be safely employed for breeding purposes as compared to control plants where itwas recorded to be 1.79. The applied FIR method has several advantages. It is a nondestructive/in vivoand noncontact/remote sensing technique, and the plant leaves remain intact during the measurementbecause cutting induces additional stress. Additional measurements can be performed with the sameplant at any time. It can be used with chlorophyll-fluorescence LIDAR techniques for remote monitoringof vegetation and damage assessment.
Acknowledgment
P. Srivastava and J. K. Pandey are thankful to UGC, New Delhi, for granting fellowship in order to carryout the research work.
References
[1] R. Maurya, S. M. Prasad, and R. Gopal, “LIF technique offers the potential for the detection ofcadmium-induced alteration in photosynthetic activities of Zea Mays L,” Journal of Photochemistryand Photobiology C, vol. 9, no. 1, pp. 29–35, 2008.
[2] J. K. Pandey and R. Gopal, “Laser-induced chlorophyll fluorescence: a technique for detection ofdimethoate effect on chlorophyll content and photosynthetic activity of wheat plant,” Journal ofFluorescence, vol. 21, no. 2, pp. 785–791, 2011.
[3] C. Buschmann, “Variability and application of the chlorophyll fluorescence emission ratio red/far-red of leaves,” Photosynthesis Research, vol. 92, no. 2, pp. 261–271, 2007.
[4] R. Maurya and R. Gopal, “Laser-induced fluorescence ratios of Cajanus cajan L. under the stressof cadmium and its correlation with pigment content and pigment ratios,” Applied Spectroscopy,vol. 62, no. 4, pp. 433–438, 2008.
[5] H. Baydar and O. Y. Gokmen, “Hybrid seed production in safflower (Carthamus tinctorius) follow-ing the induction of male sterility by gibberellic acid,” Plant Breeding, vol. 122, no. 5, pp. 459–461,2003.
[6] S. D. More, C. V. Raghavaiah, D. S. Hangarge, B. M. Joshi, and A. S. Dhavan, “Tolerant genotypesand management for alleviation of salinity stress in safflower (Carthamus tinctorius L.) in India,” inProceedings of the 6th International Safflower Conference, E. Esendal, Ed., pp. 180–186, Istambul,Turkey, June 2005.
[7] Z. Ekin, “Resurgence of safflower (Carthamus tinctorius L.) utilization: a global view,” Journal ofAgronomy, vol. 4, no. 2, pp. 83–87, 2005.
[8] N. Camas, A. K. Aryan, and C. Cirak, “Relationships between seed yield and some charactersof safflower (Carthamus tinctorius L.) cultivars grown in the Middle Black Sea Conditions,” inProceedings of the 6th International Safflower Conference, E. Esendal, Ed., pp. 193–198, Istambul,Turkey, June 2005.
[9] S. Kizil, O Cakmak, S. Kirici, and M. Inan, “A comprehensive study on safflower (Carthamus tinc-torius L.) in semi-arid conditions,” Biotechnology and Biotechnological Equipment, vol. 22, no. 4,pp. 947–953, 2008.
[10] F. J. De Serres, “X-ray induced specific-locus mutations in the ad-3 region of two-componentheterokaryons of Neurospora crassa. VI. Induction kinetics of gene/point mutations, multilocusdeletions and multiple-locus mutations,” Mutation Research, vol. 231, no. 2, pp. 109–124, 1990.

Spectroscopy: An International Journal 213
[11] L. J. Stadler and H. Roman, “The effect of X-rays upon mutation of the gene A in maize,” Genetics,vol. 33, no. 3, pp. 273–303, 1948.
[12] F. H. Ssobles, “Peroxides and the induction of mutations by x-rays, ultraviolet, and formaldehyde,”Radiation Research, vol. 3, supplement, pp. 171–183, 1963.
[13] G. R. Hoffmann, “Genetic effects of dimethyl sulfate, diethyl sulfate, and related compounds,”Mutation Research, vol. 75, no. 1, pp. 63–129, 1980.
[14] G. A. Sega, “A review of the genetic effects of ethyl methanesulfonate,” Mutation Research, vol.134, no. 2-3, pp. 113–142, 1984.
[15] H. K. Lichtenthaler and A. R. Wellburn, “Determinations of total carotenoids and chlorophylls aand b of leaf extracts in different solvents,” Biochemical Society Transactions, vol. 11, pp. 591–592,1983.
[16] H. K. Lichtenthaler, G. Kuhn, U. Prenzel, C. Buschmann, and D. Meier, “Carotenoid compositionof chlorophyll-carotenoid-proteins from radish chloroplasts,” Zeitschrift fur Naturforschung, vol.37, pp. 464–475, 1982.
[17] H. K. Lichtenthaler, “Chlorophylls and carotenoids—pigments of photosynthetic membranes,” inMethods in Enzymology, S. P. Colowick and N. O. Kaplam, Eds., vol. 148, pp. 350–382, AcademicPress, San Diego, Calif, USA, 1987.
[18] G. A. Armstrong and J. E. Hearst, “Genetics and molecular biology of carotenoid pigmentbiosynthesis,” FASEB Journal, vol. 10, no. 2, pp. 228–237, 1996.
[19] H. K. Lichtenthaler and U. Rinderle, “The role of chlorophyll fluorescence in the detection ofstress conditions in plants,” CRC Critical Reviews in Analytic Chemistry, vol. 19, supplement 1,pp. S29–S85, 1988.
[20] A. A. Gitelson, C. Buschmann, and H. K. Lichtenthaler, “Leaf chlorophyll fluorescence correctedfor re-absorption by means of absorption and reflectance measurements,” Journal of Plant Physi-ology, vol. 152, no. 2-3, pp. 283–296, 1998.
[21] R. Gopal, K. B. Mishra, M. Zeeshan, S. M. Prasad, and M. M. Joshi, “Laser-induced chlorophyllfluorescence spectra of mung plants growing under nickel stress,” Current Science, vol. 83, no. 7,pp. 880–884, 2002.
[22] F. Babani and H. K. Lichtenthaler, “Light-induced and age-dependent development of chloroplastsin etiolated barley leaves as visualized by determination of photosynthetic pigments, CO2 assim-ilation rates and different kinds of chlorophyll fluorescence ratios,” Journal of Plant Physiology,vol. 148, no. 5, pp. 555–566, 1996.
[23] A. A. Gitelson, C. Buschmann, and H. K. Lichtenthaler, “The chlorophyll fluorescence ratioF735F700 as an accurate measure of the chlorophyll content in plants,” Remote Sensing of Envi-ronment, vol. 69, no. 3, pp. 296–302, 1999.
[24] K. B. Mishra and R. Gopal, “Detection of nickel-induced stress using laser-induced fluorescencesignatures from leaves of wheat seedlings,” International Journal of Remote Sensing, vol. 29, no.1, pp. 157–173, 2008.
[25] J. K. Pandey and R. Gopal, “Laser-induced chlorophyll fluorescence and reflectance spectroscopyof cadmium treated Triticum aestivum L. plants,” Spectroscopy, vol. 26, no. 2, pp. 129–139, 2011.

Submit your manuscripts athttp://www.hindawi.com
Hindawi Publishing Corporationhttp://www.hindawi.com Volume 2014
Inorganic ChemistryInternational Journal of
Hindawi Publishing Corporation http://www.hindawi.com Volume 2014
International Journal ofPhotoenergy
Hindawi Publishing Corporationhttp://www.hindawi.com Volume 2014
Carbohydrate Chemistry
International Journal of
Hindawi Publishing Corporationhttp://www.hindawi.com Volume 2014
Journal of
Chemistry
Hindawi Publishing Corporationhttp://www.hindawi.com Volume 2014
Advances in
Physical Chemistry
Hindawi Publishing Corporationhttp://www.hindawi.com
Analytical Methods in Chemistry
Journal of
Volume 2014
Bioinorganic Chemistry and ApplicationsHindawi Publishing Corporationhttp://www.hindawi.com Volume 2014
SpectroscopyInternational Journal of
Hindawi Publishing Corporationhttp://www.hindawi.com Volume 2014
The Scientific World JournalHindawi Publishing Corporation http://www.hindawi.com Volume 2014
Medicinal ChemistryInternational Journal of
Hindawi Publishing Corporationhttp://www.hindawi.com Volume 2014
Chromatography Research International
Hindawi Publishing Corporationhttp://www.hindawi.com Volume 2014
Applied ChemistryJournal of
Hindawi Publishing Corporationhttp://www.hindawi.com Volume 2014
Hindawi Publishing Corporationhttp://www.hindawi.com Volume 2014
Theoretical ChemistryJournal of
Hindawi Publishing Corporationhttp://www.hindawi.com Volume 2014
Journal of
Spectroscopy
Analytical ChemistryInternational Journal of
Hindawi Publishing Corporationhttp://www.hindawi.com Volume 2014
Journal of
Hindawi Publishing Corporationhttp://www.hindawi.com Volume 2014
Quantum Chemistry
Hindawi Publishing Corporationhttp://www.hindawi.com Volume 2014
Organic Chemistry International
ElectrochemistryInternational Journal of
Hindawi Publishing Corporation http://www.hindawi.com Volume 2014
Hindawi Publishing Corporationhttp://www.hindawi.com Volume 2014
CatalystsJournal of