chmr report - reclamation of battery case piles …
TRANSCRIPT

OGOG10G
CC : ' '53Center for Hazardous Materials Research " u
: 7r. >,M • i.ar- — tt ^J-z-^ - 'ttcn 'TT* ~ A * ̂ " ~ C^w— * * 'a , I V • 3 V . . 3 U <-« ' L<' i ^ », i_wO
CHMR '":^.^f"____________IJOlSC,
RECLAMATION OF MATERIALS FROM BATTERY CASE PILESFROM THE TONOLU CORPORATION SUPERFUND SITE
IN NESQUEHONING, PENNSYLVANIA
RNAL REPORT
Prepared for
U.S. Environmental Protection AgencyRisk Reduction Engineering Laboratory
Edison, New Jersey
Prepared by
Center for Hazardous Materials ResearchPittsburgh, Pennsylvania
and
Exide CorporationReading, Pennsylvania
Under
JEPA Contract CR-818199-01-0(Emerging Technologios Program)
July 23,1992
Approved by:
^Steven T. OstheimDirector, Government ProgramsA subsidiary of the University of Pittsburgh Trust.

ACKNOWLEDGEMENTS
The Center for Hazardous Materials Research (CHMR) and Exide Corporation (Exide)research team would like to acknowledge the cooperation received during thisevaluation from the U.S. Environmental Protection Agency. In particular, we would liketo thank the following individuals from the EPA's Superfund Technology DemonstrationDivision who provided helpful guidance on the project.
Ms. Norma M. Lewis Chief, Emerging Technology SectionMr. Patrick Augustin Project Officer, Demonstration SectionMr. Mike Royer Technical Support Branch, STDD, RRELMs. Donna McCartney Remedial Project Manager •»
CHMR also gratefully acknowledges the following individuals from the research teamwho were responsible for important contributions to this project.
Exide Corporation
Mr. Kenneth Elliott Exide Project ManagerMr. Howard Master Exide/GBC Plant ManagerMr. Ralph Master Exide/GBC Plant SuperintendentMr. Peter Killian Exide/GBS General ForemanMr. Jeff Leed Exide Corporate Director Environmental
Resources
Center For Hazardous Materials Research
Mr. Steve Ostheim Project AdministratorMr. Stephen Paff Project ManagerMr. Stephen Timm Engineering AssistantMs. Joanne Babincak Word Processing
Work on this project is funded through Cooperative Agreement NumberCR-818199-01-0 established between the U.S. Environmental Protection Agency Officeof Research & Development and the Center For Hazardous Materials Research. Theorganizations which contributed to funding this project under the terms of thecooperative agreement include:
U.S. Environmental Protection Agency, Risk Reduction Engineering Laboratory;Exide/GeneraJ Battery Corporation; andThe Center for Hazardous Materials Research.
The members of the project research team appreciate the opportunity to participate inthis important project to research and develop a new and innovative technology for theremediation and processing of materials and wastes containing lead.
WPPEXIDE/52 i 4-2009-002

EXECUTIVE SUMMARY
The Center for Hazardous Materials Research i.CHMR) ana Exide Corporation,oursuant to EPA contract CR-818199-01-0 under the Emerging Technologies program,are investigating the potential for using secondary lead smelters for the recovery oflead from battery cases and other materials removed from Superfund sites. Thepurpose of this investigation is to determine if these materials, which typically containlead in concentrations of 1% to 10%, can be processed through existing secondarylead smelters in an economical fashion to reclaim usable lead.
As part of the investigation, CHMR/Exide processed materials from the Tonolli site inNesquehoning, PA., through Exide/General Battery Corporatioo's Reading, PAsecondary lead recycling facility. The results of the test program are summarizedbelow:
CHMR/Exide processed "test" materials from the Tonolli CorporationSuperfund site in the reverberatory and blast furnaces at Exide/GeneralBattery Corporation's (Exide's) Reading smelter between September 9 and13, 1991. Feed rates varied between 7% and 20% (by weight) of the totalfeed material charged to the furnaces.
Battery case materials from the Tonolli site were successfully processedthrough the facility's blast furnaces.
Battery case material from the Tonolli site could not be processed in thefacility's reverberatory furnaces. However, Exide believes that physical sizereduction of the battery case materials could be utilized to facilitateprocessing of materials in the reverberatory furnaces. An evaluationemploying size reduction was conducted in February 1992, during whichrubber battery case material from another Superfund site were successfullyprocessed in the reverberatory furnace.
Additional equipment will be required to facilitate the handling of batterycase materials on an ongoing basis. This equipment includes size reductionequipment, materials storage equipment, a large front end loader for mixingcases with other feed material, and a new feed system to facilitate thecharging of feed material to the blast furnaces. Exide plans to install a newfeed system by September 1992.
One to two additional full-time employees will be required to store, grind andmix the material with regular feedstocks.
Estimated processing costs based upon the test results and ExideCorporation's current methods of operation, are $116 to $137 per cubicyard. These costs do not include loading of materials at the Tonoili site,transportation costs to Reading, or any other required activities at theTonolli site.
The projected feed rate for the Tonolli battery case material (based uponthe five truck load test) at the Exide Reading facility is 50 to 120 cubic yardsper day. Optimum feed rates will need to be determined during actualimplementation.
WPPEXIDE/52 a 4-2009-002

INQUIRIES
Questions about this report, the CHMR/Exide research program, or the possibility offurther testing or treatability studies for other sites may be addressed to:
Stephen W. PaffCenter for Hazardous Materials Research320 William Pitt WayPittsburgh, PA 15238(412)826-5320
or
Ken ElliottExide Corporation645 Penn StreetP.O.Box 14205Reading , PA 19612-4205g , i
78-(215)378-0874
WPPEXIDE/52 • 4-2009-002

TABLE OF CONTENTS
ACKNOWLEDGEMEm"S i
EXECUTIVE SUMMARY ii
INQUIRIES Hi
1.0 INTRODUCTION 1
2.0 DESCRIPTION OF EVALUATION •. 2
2.1 Process Description . 22.2 Experimental Design 32.3 Chronology of Evaluation 3
3.0 RESULTS AND DISCUSSION 7
3.1 Test Materials 73.2 Furnace Input Parameters 83.3 Sulfur Dioxide Emissions 103.4 Slag and Lead Production and Quality 12
4.0 CONCLUSIONS 14
4.1 Process Throughputs 144.2 Reclamation Efficiency 154.3 Process Economic 154.4 Additional Costs of Site Remediation 20
ATTACHMENTS
Attachment A - FiguresAttachment B - Tables
APPENDICES
Appendix A - Photographs taken at the Tonolli site while loading battery casesAppendix B - Tonolli Site Map
WPPEXIDE/52 iv 4-2009-002

1.0 INTRODUCTION
The Center for Hazardous Materials Research (CHMR) and Exide/General BatteryCorporation (Exide) are engaged in a joint research study to determine the feasibilityand economics of using Exide's secondary lead smelters for the recovery of lead fromlead-containing materials from Superfund sites and other facilities. This project ispartially funded under a grant from the U.S. Environmental Protection Agency Office ofResearch and Development.
Battery case materials are one of the principal materials of interest for the study,because they are present in large quantities at more than forty Superfund sites acrossthe country.' The Tonolli Corporation site in Nesquehoning, PA%was identified as apotential source of battery case materials for the Exide secondary smelter in Reading,PA. Due to the relative proximity of the site to Exide's facility, and the suitability of thematerial found at the site for the purposes of the research, the Tonolli site was chosenas a source of battery case material.
Following the receipt of permission from the EPA ORD Project Officer and the TonolliRemedial Project Manager, Exide contracted with permitted hazardous wastetransporters for the excavation, transport, and delivery of five truckloads of the batterycase material to their Reading facility. This material was processed for the recovery oflead between September 9 and 13, 1991.
Subsequent sections of this report include a description of the evaluation, the resultsand discussion, conclusions and recommendations for future activities.
Japan K. Baau, at «!.. «Tihi«uii of ConMToctnafagbafor niniiiafiiii of Laari Mfc* IWu|>*M Sta. (Fort* WhaotorEnvfraaporao. Contract M-C94033 wth EPA RMt Reduction Engmaaring Laboratory. Cincinnati. OH, 19B1).
WPPEXIDE/52 1 4-2009-002

2.0 DESCRIPTION OF EVALUATION
The purpose of the evaluation was to determine the feasibility and economics of therecovery of lead from battery case materials. The Tonolli Corporation Superfund site inNesquehoning, Pennsylvania was used as the source of these materials. Thematerials were processed at Exide's Reading, Pennsylvania, secondary lead smeltingfacility.
Exide's Reading smelter is primarily engaged in recycling lead from lead-acid batteries,such as those utilized in automobiles and the recycling of polypropylene from batterycases for subsequent reuse. Exide uses both reverberatory and blast furnaces torecycle lead. These furnaces and other plant operations are typtaal of the secondarylead smelting industry.
2.1 PROCESS DESCRIPTION
A general process schematic for Exide's secondary lead smelter in Reading, PA, isprovided in Figure 1 in the attachment to this document.
Spent batteries received at the Reading smelter are crushed in a Saturn shredder. Thecrushing process releases the sulfuric acid which is collected, piped to the on-sitewastewater treatment facility, and treated. The lead and polypropylene cases areprocessed through a hammermill into a MA sink/float process, in which the lead isphysically separated and conveyed to feed piles within a containment building. Thepolypropylene cases float in the liquid tanks and are collected and processed throughthe facility's plastic recycling operation.
In the plastics recycling operations, the plastic chips are thoroughly cleaned, shreddedto a fine size, mixed with a color modifier, and processed through an extruder wherethe polypropylene is pelletized. Exide also accepts polyethylene containers (primarilymilk jugs), as a recycling service to the local municipalities and school districts, which ismixed with the polypropylene during the plastic recycling process. The plastic pelletsare subsequently transferred to Exide's plastic injection molding facility in Lampeter,PA, for use in the production of new battery cases.
The two reverberatory furnaces at Reading are charged with battery material from theMA sink/float system as well as other lead containing material. The furnaces are fueledwith natural gas and oxygen. The reverberatory furnaces are charged using aconveyor system that feeds into a ram which pushes material into the furnace. Thefurnaces are tapped for slag (which typically contains 60 to 70 percent lead), and a soft(pure) lead product.
WPPEXIDE/52 2 4-2009-002

The two blast furnaces are charged with the slag generated from the reverberatoryfurnaces as weU as other lead-bearing materials. The furnaces are fueled-by coke,coal, air and oxygen. The blast furnaces are charged with 3 to 6 tons of material perhour. Iron and limestone are added as fluxing agents to enhance furnace production.The furnaces are tapped continuously to remove lead and intermittently to remove theslag. The slag contains primarily silica and iron oxides, and is transported to an off-sitelandfill for disposal.
Lead produced in the blast furnaces is pumped to the refining process where additionalmetals are added to make specific lead alloys. The lead is pumped to the castingoperations where it is molded into "pigs" which are transported to Exide's batterymanufacturing facilities for use in the manufacture of lead-acid batteries.
22. EXPERIMENTAL DESIGN
During the evaluation, the material from the Tonolli site was fed to the reverberatoryand blast furnaces at points A and B, respectively, as noted on Figure 1. Initially, thetest material was fed directly to each furnace using a front-end loader, which loadedone load of test material, then several loads of regular feed (depending on the mixratio), then another load of test material, and so on. However, it became apparent thatthe furnaces would better handle the test material if it were initially mixed with theregular feed, and the resultant mixture charged to the furnaces.
The plant is equipped with two blast and two reverberatory furnaces. Generally, onereverberatory furnace and one blast furnace were utilized for processing the Tonollimaterial, while the second reverberatory furnace and blast furnace remained in normal,routine operation. Conducting the test in this manner allowed for comparison of theoperation of the "test" furnaces with the "reference" or "control" furnaces.
During the evaluation, the operating parameters (fuel usage, oxygen usage, slagproduction, lead production, etc.) for each set of furnaces were obtained. In addition,samples of slag and lead were obtained from each furnace to be used to determineeffects on production quality.
More details concerning the experiment may be found in the
(Tonolli Field Report)which was submitted to the EPA Emerging Technologies Project Officer in January1992.
2.3 CHRONOLOGY OF EVALUATION
The following represents a chronology of the activities conducted in support of theevaluation, between September 5 and 13, 1991. Photographs of some of the activitiesare included in Appendix A.
WPPEXIDE/52 4-2009-002

Material Acquisition and Sampling (9/5/91)
On September 5, 1991, five dump trailers of material were loaded with dattery casematerials from the Tonolli Superfuna site in Nesquehonmg, Pennsylvania. Because thebattery case materials were stored in piles at the Tonolli site and no separation ofmaterials was necessary, no problems were encountered during loading activities. Nodusting problems were encountered during loading activities. A total of 167,750pounds of material was transported in five dump trailers, ranging from 42 to 48 cubicyards of material per trailer. A site map is included in Appendix B to this report.
Composite samples of each battery case pile were collected during the loading processat the Tonolli site. The samples were subsequently analyzed to determine:
•» »
bulk density;
percent of the hard rubber material in the total sample;
percent of polypropylene plastic in the total sample;
percent of other miscellaneous material (i.e. soils, concrete, etc.);
percent of metallic lead in the total sample;
lead concentration using the Toxicity Characteristic Leaching Procedure(TCLP) on rubber cases;
total sulfur; and
percent of lead contained in the rubber, soil, concrete, etc.
The analytical results are presented in Table 1 and discussed in Section 3.
Day On* (9/9/91)
Major activities completed during the first day of the test included:
density determination of test material and quantification of feed rates toeach furnace; andcharging of 7% test material* into one blast furnace and 11% test materialinto one reverberatory furnace.
CHMR/Exide determined the density of the Tonolli battery case materials by weighingtrucks as they entered and exited the plant and dividing by the truck bed volume.
' Al ehwgino rates an baaad upon paroant by VMM* unlaaa othanriM noted. Th» pamant by vmigM to calculated by dfcMngtha weight of -tear material chaigadto ttw fumaea by tha total wmght of tod (including toaT material and typical tead).
WPPEXIDE/52 4 4-2009-002
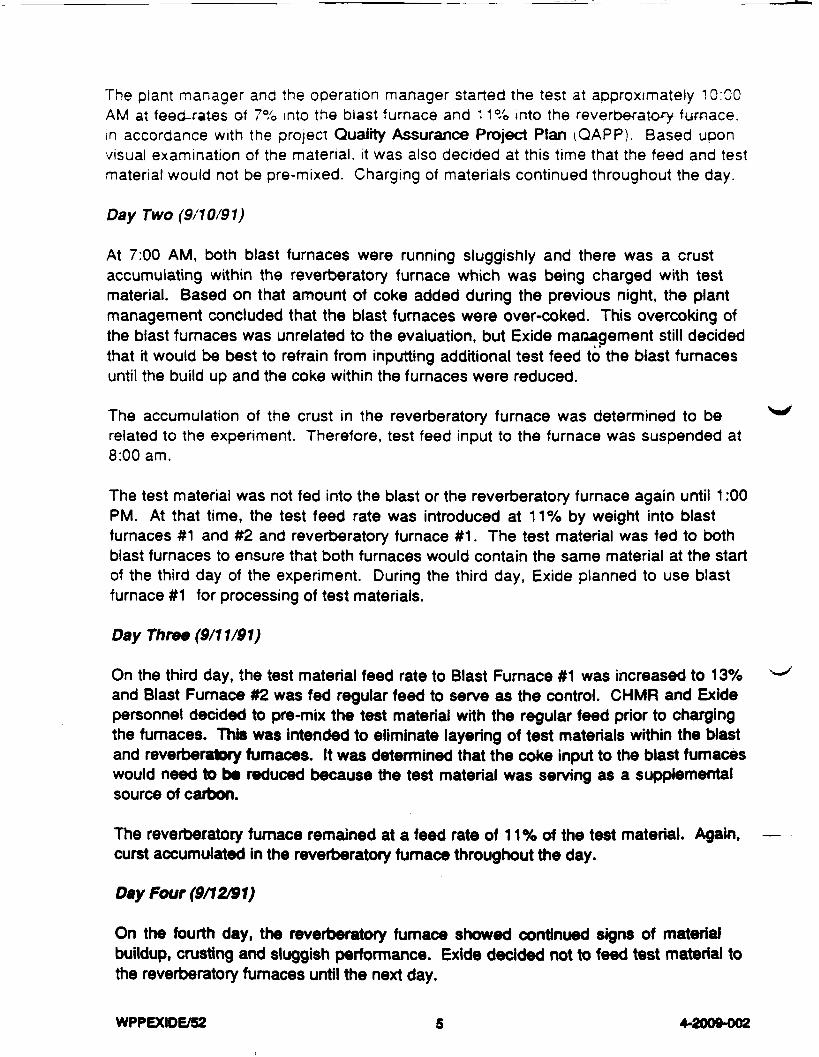
The plant manager and the operation manager started the test at approximately 10:00AM at feed-rates of 7% into the blast furnace and 11% into the reverberatoey-furnace.in accordance with the project Quality Assurance Project Plan (QAPP). Based uponvisual examination of the material, it was also decided at this time that the feed and testmaterial would not be pre-mixed. Charging of materials continued throughout the day.
Day Two (9/10/91)
At 7:00 AM, both blast furnaces were running sluggishly and there was a crustaccumulating within the reverberatory furnace which was being charged with testmaterial. Based on that amount of coke added during the previous night, the plantmanagement concluded that the blast furnaces were over-coked. This overcoking ofthe blast furnaces was unrelated to the evaluation, but Exide management still decidedthat it would be best to refrain from inputting additional test feed to the blast furnacesuntil the build up and the coke within the furnaces were reduced.
The accumulation of the crust in the reverberatory furnace was determined to berelated to the experiment. Therefore, test feed input to the furnace was suspended at8:00 am.
The test material was not fed into the blast or the reverberatory furnace again until 1:00PM. At that time, the test feed rate was introduced at 11% by weight into blastfurnaces #1 and #2 and reverberatory furnace #1. The test material was fed to bothblast furnaces to ensure that both furnaces would contain the same material at the startof the third day of the experiment. During the third day, Exide planned to use blastfurnace #1 for processing of test materials.
Day Thno (9/11/91)
On the third day, the test material feed rate to Blast Furnace #1 was increased to 13%and Blast Furnace #2 was fed regular feed to serve as the control. CHMR and Exidepersonnel decided to pre-mix the test material with the regular feed prior to chargingthe furnaces. This was intended to eliminate layering of test materials within the blastand reverberatory furnaces. It was determined that the coke input to the blast furnaceswould need to be reduced because the test material was serving as a supplementalsource of carbon.
The reverberatory furnace remained at a feed rate of 11% of the test material. Again,curst accumulated in the reverberatory furnace throughout the day.
Day Four (9/12/91)
On the fourth day, the reverberatory furnace showed continued signs of materialbuildup, crusting and sluggish performance. Exide decided not to feed test material tothe reverberatory furnaces until the next day.
WPPEXIDE/52 5 4-2009-002

The blast furnace test feed rate was held constant at 13% test material until 3:00 AMon September 13* when the feed, rate of the test material was increased to. 20% _byweignt.
Day Five (9/13/91)
Beginning at 8:00 AM on the final day of the test, the reverberatory furnace was fed ata rate of 7.25% test material. At this feed rate, no crust accumulation in thereverberatory furnace was noted. However, the reverberatory furnace still performedsluggishly. Exide plant management hypothesized that the continual buildup could beattributed to the slow rate of burning associated with the relatively large pieces ofmaterial in the Tonolli test feed. Because of this, it was concluded that processing ofmaterials from the Tonolli site in the reverberatory furnaces wasjiot a viable optionwithout size reduction of the battery case materials.
Both blast furnaces were fed test material at 20% by weight until the operation of oneof the furnaces was discontinued in order to complete scheduled repairs andmaintenance. The testing was continued using the second blast furnace and theoverall evaluation was concluded by 10:00 PM on September 13, 1991 when all theTonolli material had been processed.
WPPEXIDE/52 6 4-2009-002

3.0 RESULTS AND DISCUSSION
In order to assess the viability and economics of the process, CHMR/Exide recordedthe settings of various plant parameters, the production figures for both sets offurnaces, and stack parameters. In addition, CHMR obtained samples of the inputmaterial, slag and lead. The sampling was conducted in accordance with the QAPP.The results from the sampling and analysis are presented and discussed below.
All statistical analyses were conducted according to the procedures outlined in Section5 of the QAPP. All confidence ranges, q-tests, analyses of variance (ANOVAanalyses), etc. were performed based on 90% confidence limits.
«kIn-depth analyses were performed only on the blast furnace data. No statisticalanalyses were conducted on reverberatory furnace parameters, because suchanalyses were not necessary to show that the reverberatory furnaces could not acceptthe battery case material feed as received from the Tonolli site.
3.1 TEST MATERIALS
The test materials consisted of pieces of rubber and polypropylene, typically shreddedto approximately 1 to 3 inches in size, combined with reddish-brown sludge, dust, bitsof concrete and iron, small wood scraps and pieces of cloth. Because of the varyingparticle sizes and shapes, the material was not densely packed. No void fractionmeasurements were performed, but the void fraction was estimated at about 50%.
The test materials were sampled for various parameters, including density,, leadcontent, sulfur content, TCLP values, percentage rubber, and other parameters. Theresults from these analyses are presented in Table 1, attached to this document.
Table 1 shows lead concentrations ranging between 0.28% and 15.7%, with anaverage of 3.5%.
The wide rang* In analytical results from analyses of the Tonolli material was attributedto non-homogeneity in the material itself, rather than errors in the analyses. CHMRreviewed the analytical procedure and QA/QC notes for the analyses, and determinedthat no obvious errors in analyses existed. Analyses 1 through 4 were of samplescomposited from the material on the trucks loaded from the site. Analyses 5 and 6 —were composited from bags of material obtained from five locations in the pile ofmaterial present at the smelter. Analyses 7 and 8 were duplicate analyses from onebag of material grabbed for analyses 5 and 6. The composite for analyses 5 and 6included one bag which contained a very high fraction of reddish brown sludge. Thissludge apparently contained a very high fraction lead. Thus, the seeminglyinconsistent analytical results for lead were probably due to the non-homogeneousnature of the Tonolli material.
WPPEXIDE/52 7 4-2009-002

A prior report, entitlea Preliminary Assessment of the Feasibility of Processing SelectedTonolli Lead Battery Ste Wsstffr at an Exide Corporation Smelter in Reading. .PA —Tonolli Superfund Site, prepared by Foster-Wheeier Enviresponse for the USEPA.indicated an average concentration of 3.6% lead in the Tonolli material. This leadconcentration was consistent with the average obtained from the Tonolli analysesperformed by CHMR/Exide.
The heat value of the Tonolli material averaged 10,000 BTU/lb, based on twoanalyses. The estimated heating value of metallurgical coke is 13,000 BTU/lb.*
3.2 FURNACE INPUT PARAMETERS
The input parameters recorded included air flows, oxygen consurqption, back pressure,and a record of materials introduced into the furnaces. These parameters wererecorded by Exide and CHMR personnel during each shift. Twenty percent of the dataper shift was collected by Ken Elliott (Exide) or Stephen Timm (CHMR) in accordancewith Section 6.3 of the QAPP.
Relative values of air flows, oxygen usage and test feed percentage for Furnace #1 areplotted against time in Figure 2a. Back pressure and relative test feed inputs areplotted against time in Figure 2b.
Air enriched with oxygen is used in blast furnace to oxidize coke and other combustiblematerial to maintain a sufficiently high temperature to melt and fuse the material in thefurnace. The air is enriched with oxygen to produce higher flame temperatures, moreefficient burning, and as a side benefit, smaller blowers are required to introduce extraoxygen than are required to push through air. The required rates of air and oxygeninputs to the furnaces are determined by the operators and set manually. The air andoxygen settings are recorded at the beginning of each shift, and whenever they arechanged.
The furnace back pressure is a measure of the pressure against which the air blowersmust push in order to force air into the furnace. The back pressure increases as the airrequired by the furnace increases. At constant air, the back pressure is a measure ofthe resistance of the material inside the furnace to the flow of air. The back pressureincreases when small particles are fed to the furnace or if material begins to back upinside the furnace.
Relative values were used for Figure 2 and other figures so that they could be scaled tofit on the same graph (for comparative purposes), and because some of the values areconsidered confidential by Exide. Most of the figures also show a furnace parameter orother variable plotted as a function of time, with the relative (or exact) test feedpercentage superimposed. Such plots show dearly whether trends exist between theparameter and the use of test feed in the furnace.
WPPEXIDE/52 8 4-200*002

The figures show no obvious correlation between air flows/oxygen usage and thepercentage, .oi test-feed for Blast Furnace #1. The statistical analyses presented inTable 2, confirm that no significant difference is demo.nstrated by the data.
The data indicate that the use of test feed caused an increase in back pressure in BlastFurnace #1. The average back pressure while regular feed was processed was4.95±0.6 inches of water, and 7.42±0.4 inches of water when test feed was charged tothe furnace. To more clearly demonstrate the relationship between test feed and backpressure, a "smoothed" back pressure was plotted, showing the average back pressurelevel at each test feed input level, with four hour transitions assumed. The smoothedcurve indicates that back pressure increased with increasing test feed concentration,until the test feed was increased to 20% by weight, when the back pressure decreasedslightly. „ .
Figures 3a and 3b show similar results for Blast Furnace #2, except a 10 percentincrease in air consumption was shown for Furnace #2 while the test feed was run.The ANOVA results for Furnace #2 are provided in Table 2. The relative oxygen levelsfor both furnaces were 6.47±0.32.
The relative air consumption in Blast Furnace #2 while regular feed only was processedwas 6.75±0.25, and while the Tonolli material was processed was 7.42±0.12. Thedifference in air consumption in Furnace #2 between times when test feed wasprocessed and when it was not appears to be largely due to a significantly decreasedair consumption rate on Wednesday, September 11, which occured when no test feedwas processed in the furnace. It also correlates to a time when the overall productionrate of the furnace decreased, possibly due to attempts by the operators to reducebuildup in the furnace. This buildup was only partly attributable to the test feed. If thedecreased air due to coke buildup is eliminated from the statistical analysis, then nosignificant difference is demonstrated between air consumption with and without testfeed.
The ANOVA analysis for back pressure for Furnace #2 showed no demonstrateddifference between times when test feed was, and was not, processed. However, anexamination of Figure 3b indicates that an apparent correlation between back pressureand test feed input The figure shows back pressure increasing with test feed input,then decreasing when the material was not input (Wednesday, September 11), andincreasing again as test feed was processed in the furnace. Surprisingly, it decreasedslightly as the test feed input concentration was increased from 13% to 20%. This. _decrease may have been due to the plant operators' attempts to reduce the buildupwithin the furnace (which was only partially attributable to the test feed input) byreducing coke input.
WPPEXIDE/52 9 4-2009-002

Although some of the aoparent correlation between back pressure ana test feed inputmay oe attributable to buildups within the furnace caused by overcpking, the evidenceis strong that the Tonolli material significantly contributed to the back pressureincrease. The most likely reason for the increase in back pressure while the Tonollimaterial was run is that the Tonolli material was large enough that it burned relativelyslowly, but sufficiently small to fill some of the pore spaces inside the furnace feed shaft.
The increase in back pressure seen during the evaluation probably had little affect onoverall furnace performance or overall process economics. However, as the backpressure increased, the blowers had to work harder to blow air into the furnace, and athigher back pressures (above 30 or 40 inches of water), the blowers will stall.Therefore, based on the data, which suggest about a 5 inch back pressure increase per10% addition of battery case matehal, the maximum battery casejnaterial feed ratio isbetween 30% and 50% by weight.
Overall, the data indicate the following differences when the "test" feed was processedin the blast furnaces as compared with more "typical" feed:
no significant difference in oxygen levels as a result of processing the Tonolli feed;
no difference in air consumption inside Furnace #1 as a result of processing theTonolli feed;
a 10% increase in air consumption inside Furnace #2 while the Tonolli materialwas processed, which may be attributable to factors other than the consumptionof test material; and
a significant increase in back pressure (approximately 5 inches per 10% feedratio) while the furnaces were processing test material.
The significance of these differences with respect to process economics are discussedin Section 4.3.
3.3 SULFUR DIOXIDE EMISSIONS
The Tonolli material was found to contain 2.611.0% sulfur. Overall, this concentrationdid not represent a significant difference wtth regular feed material, which may contain2% to 5% sulfur. Therefore, no significant differences in overall plant sulfur emissionswere anticipated. However, CHMR/Exide monitored the fate of sulfur in the process toensure that processing the test material did not result in an increase in production ofcalcium sulfate sludge, SO2 emisstonsrorsulfur concentration In the slag. —————
Approximately 50% of the sulfur entering a blast furnace leaves as oxides in the fluegas stream. Nearly 100% of this sulfur at Exide's Reading smelter is removed ascalcium sulfate sludge from the SO2 scrubber system. However, a small portion of thesulfur in the flue gas is released as stack emissions. Therefore, CHMR/Exidemonitored both the calcium sulfate sludge generation and SO2 concentrations in thestack emissions.
WPPEXIDE/52 10 4-2009-002

Sulfur which does not leave the furnaces in the flue gas leaves in the blast furnaceslag. To monitor the rate of sulfur generation in the-slag, CHMR/Exide analyzed theslag for sulfur concentrations.
The results from monitoring stack gases, calcium sulfate sludge production, and sulfurin the slag are discussed below.
SO 2 Emissions
CHMR/Exide obtained data concerning sulfur dioxide emissions from Exide's airmonitoring equipment. This equipment is operated under requirements specified inExide's air quality permit.
»» \
The monitoring results are presented in Figures 4 and 5, which show theconcentrations of SO2 (measured in parts per million) in stack systems #1 and #2.Each stack system is connected to the corresponding blast and reverberatory furnace.The average sulfur stack emission in system #1 was 64±6 ppm, while the averagestack emission in system #2 was 69±9 ppm. Both of these values were below Exide'spermitted average of approximately 110 ppm. No statistically significant differencesexist between the emissions from the two systems. (The overall average plant SO2concentration was 66±6 ppm.)
Results from ANOVA analyses of the data are presented underneath the figures.These analyses indicate no differences were demonstrated between SO2 emissionswhen the test material was and was not processed, for either set of furnaces. Inaddition, the figures do not show a significant correlation between SO2 concentrationsas a function of test material input ratio. Therefore, CHMR/Exide conclude that theTonolli feed material did not have a significant affect on the SO2 concentration in thestacks.
These results indicate that processing of the Tonolli material did not significantly affectsulfur stack emissions from the plant.
Calcium Sulfato Studg* Production
During each shift, specific gravity measurements of slurry generated from the airemission control equipment (scrubbers) were taken by the operator on duty. Thespecific gravity is related to the calcium sulfate concentration in the slurry, and_therefore gives a measure of total sulfur uptake in the sludge. Typical slurry specificgravity is between 1.1 and 1.3. Slurry specific gravities for both air emission controlsystems averaged 1.18±0.02, and showed no correlation with test feed input.
At the end of each shift, the amount of slurry was calculated by counting the number of10 cubic yard tankers transported from the scrubbers to the on-site sludge dewateringfacility. The number of tankers varied only between 2 and 4 per shift,
WPPEXIDE/52 11 4-2009-002

with a total of 9 trucKs per cay except Thursaay. Septemoer 12. wnen 8 trucks weretransported. Normally, between 8 and 10 tankers per day are transported. .Therefore.CHMR-'Exide conclude that there was no significant increase in calcium sulfate sludgesroauction due to processing the Tonoiii material in :he bias: furnaces.
3.4 SLAG AND LEAD PRODUCTION AND QUALITY
The amount and nature of slag and lead produced by the furnaces were criticalexperimental parameters. The amount and quality of lead produced is important forobvious reasons, as lead is the salable product from facility operations. The slaggeneration rate and chemical composition were also important, as slag disposalrepresents a significant operating expense.
•yLead and slag production for each furnace during each shift was measured. Relativevalues for production are given in Figures 6 and 7, with test feed ratios superimposed.In addition, ANOVA statistical analyses were performed to determine if significantdifferences existed between the amounts of slag or lead produced while the testmaterials were run versus the amounts produced while only regular feed wasprocessed in the furnaces. The results indicate no statistically significant change in theproduction rates of slag or lead while the test feeds were run in either furnace. Theonly significant drop in production during the week occured in Furnace #2 onSeptember 10, when lead production dropped due to overcoking in the furnace (seeSection 2.3).
Lead samples from the blast furnaces were obtained during each shift. All samples oflead collected were analyzed on site in the Exide's laboratory. The results from thelead analyses are presented in the Tonolli Field Report. They indicate no significantincrease in contaminants in the lead product.
Composite samples of slag were taken as the slag was being tapped from the furnacesfed test materials. Grab samples of slag were taken from the furnaces being chargedonly with regular feed. The molten slag samples were collected by the Exide operatorsby inserting a shovel into the furnaces in accordance with the QAPP.
Figures 8 through 10 and Table 3 show the results of the analyses of slag. Nodistinction is made between the furnaces in the table and figures. Rather, analyticalresults from slags collected while test feeds were processed in the furnaces areseparated from those collected while no test feeds were processed. The primacy _parameters analyzed for include lead, sulfur, antimony, silica and ferric oxideconcentrations in the slag. Lead concentrations are shown in Figure 8, sulfur andantimony are shown in Figure 9, and silica in Rgure 10. Table 8 shows ANOVAanalyses comparing concentrations of constituents in the slag produced from regularand test feeds.
WPPEXIDE/52 12 4-2009-002

Basically, the results show no demonstrable differences in sulfur, silica, antimony, andiron oxide concentrations when the test feed was processed in the furnaces: Theresults do show a significant difference in lead concentrations in the slag. When onlyregular feed was processed, the lead concentration was 2.2±0.6%. When Tonollimaterial was added, the lead concentration increased to 3.7±0.7%.
Much of this difference may be attributable to the problems encountered when bothfurnaces were overcoked earlier in the week. The overcoking problem wasexacerbated by the addition of test feed. High coke results in a reducing environmentwithin the furnace which increases the concentration of lead in the slag. OnWednesday, September 11, Exide management and CHMR recognized the problemand responded by reducing the amount of coke and increasing the amount of iron fedto the blast furnaces. Iron acts as a slag conditioner which removes-lead oxides andsulfates from slag by converting them to elemental lead. The data show a decrease inthe lead content in the slag beginning during shift 9 (the third shift on September 11)and continuing throughout the remainder of the week. By September 12 and 13, thelead concentration in the slag had diminished, and a relatively stable slag compositionwas maintained at 2.5%, which is approximately equal to the lead concentration in slagwhen no Tonolli input was fed to the furnace.
WPPEXIDE/52 13 4-2009-002

4.0 CONCLUSIONS
Based upon this test, several conclusions can be drawn regarding the feasibility andeconomics of recovering lead from the battery case materials from the TonolliSuperfund site at the Exide/General Battery Corporation secondary lead smelter inReading, PA.
This report presents the results from one experiment conducted with one specific testat one secondary lead smelter. Readers should be cautioned to remember that furtherstudy will be necessary to determine the general applicability and economics of the useof secondary lead smelters to recover lead from battery case materials. In addition,further treatability studies using the specific materials found at a stte may be necessarybefore an accurate cost estimate is obtained for processing those materials.
Primary conclusions which may be drawn from the experiment are as follows.
The material from the Tonolli site can be processed through the blast furnaces atExide's Reading smelter.
The material (as obtained) from the Tonolli site cannot be processed through thereverberatory furnaces at Exide's Reading smelter. (An evaluation conducted byCHMR/Exide in February 1992 using similar material from another Superfund siteindicates that such materials may be processed in the reverberatory furnaces ifthe material is first ground. Details from that evaluation will be forthcoming.)
The effects of processing the battery case materials on various blast furnaceparameters are summarized in Table 4. The table indicates that overall, the effects ofprocessing the Tonolli feed on furnace parameters were minimal. However, it shouldbe noted that there are other significant issues which relate to both the feasibility andthe economics of processing the Tonolii battery case materials at Exide's Readingsmelter. These include: loss of production, materials handling, process throughputs,operator requirements, and overall process economics. These costs are discussed inmore detail in Section 4.3.
4.1 PROCESS THROUGHPUTS
The Tonolli battery case materials may be processed in either or both of the blastfurnaces at Exide's Reading facility. . . . _ _ . . _ _ _ . . . . . .. .. _. ____ -
The projected volume of Tonolli battery case material (based upon the five truck loadtest) which potentially could be processed in the blast furnaces at Exide's Readingfacility is between 50 and 120 cubic yards (18 and 45 tons) per day. Optimum feedrates would be established as part of a longer processing program.
WPPEXIOE/52 14

As more battery case material is processed, it will begin to disolace typical furnacefeed. This will.ultimately result m a decrease in production from-.the plant, The_ ..revenue loss from decreased production will have to be offset by increased processingfees for the battery case material. In addition, CHMR/Exide believe that feed ratesabove a certain amount would displace so much regular feed and so adversely affectthe performance of the furnace as to stop production altogether. CHMR/Exide did notattempt to find this maximum feed level above which the furnace would be impaired.
It is not viable to process the battery case materials from the Tonolli site in Exide'sreverberator/ furnaces without size reduction prior to processing. The data collectedduring the test clearly indicated that the feeding of Tonolli battery case materials (e.g.,relatively large battery cases) into the reverberator/ furnace causes significantproblems with furnace production. The capacity of the reverberatpry furnaces for thematerial after size reduction cannot be estimated at this time.
4.2 RECLAMATION EFFICIENCY
Blast furnaces normally recover in excess of 99% of the lead feed. Based on theresults of the experiment, it appears that it is possible to reclaim lead from the Tonollimaterial at essentially the same efficiency as lead is reclaimed from regular feeds in theblast furnace, provided that the coke input to the furnaces is decreased, and the ironinput increased to maintain a low lead concentration in the slag.
4.3 PROCESS ECONOMICS
Itemized cost estimates for processing Tonolli battery case materials at Exide'sReading smelter are given in Table 5, which shows cost categories, the cost basis, andtotal cost per cubic yard of material. The total costs for running the material are shownto range from $116 to $131 per cubic yard depending on plant throughput rates.
The cost calculation employed in developing Table 5 is based on three basic economicinputs: operating costs, capital costs and income. To at least break even whenprocessing any materials, the income generated must be equal to or greater than thesum of the operating and capital costs.
To analyze the costs associated with processing battery case materials, CHMR/Exidedistinguished between costs associated with processing all feed materials andadditional costs associated solely with processing battery case material. Likewise,when computing income from the operations, CHMR/Exide distinguished between theincome generated from the lead in the material, and income which may be lost becausethe battery case material displaces regular feed.
WPPEXIDE/52 15 4-2009-002

Table 5 is based on the following assumptions regarding feed rates, ieadconcentrations and other parameters.
The feed rates will range between 50 and 120 cubic yards per day.
The Tonolli battery case material density is assumed to be 720 Ibs/yd3.
Capital costs are divided among 180 days of operation using battery casematerial feed per year.
The transporter will use 40 cubic yard trucks.
The remedial contractor will load 8 trucks per day, and Exide will have storage forup to 600 cubic yards. Thus, the contractor may excavate for 2 or 3 days, wait aweek until Exide processes the material, and then excavate for 2 or 3, days again.
A total of 8,000 cubic yards of battery case material are present on the Tonolli site.
The Tonolli battery case material contains 3% lead, and 3% sulfur.
Table 5 contains several categories of costs. These categories, and the individual lineitems, are discussed in more detail below.
PRODUCTION COSTS
1. Share of Normal Operating and Capital Costs
This cost represents the cost to process one pound of typical feed material through theblast furnace. It includes furnace operators, supervisors, supplies, furnace capitalcosts, maintenance, and other costs associated with smelter operations. It is based onan estimate of $0.10/lb of lead produced in a secondary lead smelter, provided in areport entitledr "Impact of Existing and Proposed Regulations Upon the Domestic LeadIndustry," by Raymond Isherwood et al (Bureau of Mines, August 1988). In currentdollars, this value is approximately $0.12/pound lead produced.
The $0.12/lb lead produced figure relates the cost of producing one pound of lead fromfurnace feed, not the ooet of processing one pound of feed. This cost is determined bymultiplying the average iMd concentration in regular furnace feed (approximately 60%)with the cost per pound of lead produced ($0.12) to yield a cost of $0.072/1b of materialfed to the blast furnaces. To avoid double counting waste disposal costs for slag andsludge produced from the battery case material, which are treated separately in theeconomic calculation, the figure was decreased to $0.066/1b fed to the blast furnace.The cost per pound of material processed is multiplied by the weight of material percubic yard (720 pounds) to yield a cost per cubic yard.
WPPEXIDE/52 16 4-2009-002

ADDITIONAL LABOR COSTS
This cost category includes personnel hours required to process battery case materialsin aadition to those which are normally required to process regular furnace feeds. Alladditional labor rates are based on estimates of fully loaded rates for the individualsinvolved. Fully loaded rates include salary, fringe benefits and other direct and indirectpersonnel costs, including training, health and safety, accounting, etc.
2. Contractual. Engineering and other Up-front Costs
This encompasses all the up-front costs associated with contracting, bidding,negotiating, planning, and preparing to reclaim the lead from the Tonolli material. Italso includes periodic legal review, reporting, and other time spegt administering theproject. The cost of $40,000 is arrived at based on estimates from the NationalEnvironmental Technologies Applications Corporation (NETAC) as to the cost ofcontracting in Superfund situations.
3. Loading on-site at Tonolli
This category includes the hourly and per diem (travel, expenses) associated with oneperson on site to ensure that the correct materials are loaded and to coordinateactivities with the smelter during loading operations.
4. Mixing and Loading
One full-time operator will be required during each shift to handle, mix, and charge thebattery case material to the blast furnaces. A second operator may be required for 8hours per day to determine mix ratios, coke rates, and other parameters associatedwith processing the battery case material. In addition, approximately 2.5 hours ofoperator time will be required per truckload to unload incoming trucks and ensure thatthe material is placed properly within Exide's storage areas.
5. Management
Management time includes the time spent by plant management and environmentalstaff coordinating the lead reclamation activities, reviewing progress, determiningprocessing levels, and working with on-site representatives to ensure a smoothoperation. In addition, approximately 1 hour of management time per truckJoad isanticipated to coordinate storage, and review manifests and other shipping documents.
WPPEXIDE/52 17 4-2009-002

ADDITIONAL CAPITAL
6. Additional Capital Expenditures
Because it was necessary to feed the rubber cases mixed with regular process inputmaterial, additional equipment will be required to facilitate the handling of battery casematerials on an on-going basis. This equipment includes:
a large front end loader for mixing cases with other feed material;
a new feed system to facilitate the charging of feed material to the blast furnacesin a more controlled and exact manner; and
engineering controls to manage material storage and handling. ^
Overall, the estimated cost of capital improvements required to process battery casematerials on an on-going basis is between $350,000 and $450,000.
DISPOSAL COSTS
7. Slag Disposal
Based on the percentage of concrete, soil and other debris in the battery casematerials, the percentage of the Tonolli material which will be incorporated into the slagwas calculated to be between 7% and 30%, with an average of approximately 12%.Based on this value, and the estimated cost of $225/ton for slag disposal under therecently promulgated land-ban regulations, a cost of slag disposal is calculated.
8. Sludge Disposal
Calcium sulfate sludge production is proportional to the sulfur content of the feed. Acontent of 3% is assumed, with 50% of that removed in the calcium sulfate sludge.The sludge is assumed to contain 60% water.
ADDITIONAL PRODUCTION COSTS
Additional Production costs include changes in materials usage for the furnaces basedon the chemistry and physical properties of the Tonolli material.
WPPEXIDE/52 18 4-2009-002

9. Reduced Coke Usage
The rubber in the battery case materials contains a high percentage of coal and cokefines. This material is believed to act as a carbon source inside the blast furnaces,replacing the coke normally fed to the furnace. The battery material will not replacecoke pound-for-pound, however, since it is believed that much of the battery casematerial burns in the upper parts of the furnace, and the battery case material is not thecorrect size or shape to provide the structure necessary to support the chemicalreactions which must occur inside the furnace. Based on the experimental results, inwhich coke usage was successfully reduced approximately 16% when the furnace wasfed 13% by weight battery case materials, CHMR determined that coke reduction isequal to approximately 10% of the weight of Tonolli battery case material fed to thefurnace. »
10. Increased Iron Usage
In order to maintain a reducing environment in the furnace, a small amount ofadditional iron is added with the battery case materials.
INCOME CHANGES
11. Lead Recovered from the Battery Case Materials
The estimate of the amount of lead recovered is based on a nearly 100% recovery ratefor the lead originally in the battery case materials. The cost basis for this lead isbased on current market prices for lead, less a small amount for refining and salescosts.
12. Loss of Production
Based on the results of the evaluation, little, if any production loss occurs at relativelylow ratios of battery case materials to regular feed. As the battery case material ratio isincreased, it is anticipated that it will begin to displace regular feed material in thefurnace, and thtrafore may produce a significant drop in production. This lostproduction is calculated assuming that the battery case material displacesapproximately 30% of Its weight in typical feed material, and typical feed containsapproximately 60% lead.
WPPEXIDE/52 19 4-2009-002

OTHER COSTS
13. Analysis of Material
At least one composite sample per truckload will be taken by Exide and analyzed fortotal lead and other constituents. Each analysis is expected to cost approximately $70.
14. Miscellaneous/Contingency
This category represents 10% of the sum of the preceding costs to cover unforeseenexpenses or contingencies. This category does not include Exide's profit fromaccepting the battery case material.
4.4 ADDmONAL COSTS OF SfTE REMEDIATION
Additional costs, not included in Table 5, associated with reclaiming materials from theTonolii sites at Exide's facility include:
excavation costs;
transportation costs (to the smelter);
costs of clean fill, topsoil and site restoration; and
mobilization, sampling and analysis, and health and safety costs forworkers at the site.
The magnitude of these costs is dependent on the conditions at the Tonolii site,including accessibility of the material, proximity to communities, and other factors notaddressed in this report.
WPPEXIDE/52 20 4-2009-002

ATTACHMENT A
RGURES

FIGURE 1SECONDARY LEAD SMELTING
PROCESS SCHEMATIC
Approx. 20.000oent bat ter ies/dav
Vwaste acid neutralization
treatment
>^ sludge to disposalv •~—-'~ discharge
Saturn Shredderi-(Batteries crushed) i
MA Sink FloatProcess
> polypropylene* to recycle/reuse
Pb containing mat'l
Furnace gases
natural gas_oxygen ~~
softleadproduct
REVERBERATORYFURNACE
> 2000 F
Recycled bag house dust
_ slag (60% Pb)W vj/ _____Furnace gases
coke, iron_air, oxygen
BLASTFURNACE
2200 F
alloyingagents
other leadfeeds
lead product(soft & hard)
Lead to Battery Plant
Vslagto off—siteRCRA dispoul
VAFTERBURNER
BAG HOUSESo off-siteisposal pennitted
stackemissions
dust recydedin reverb, furnace
A) (Bs«.
Test feed inputs

FIGURE 2aBlast Furnace #1
Air, Oxygen and Test Material Feeds
e 1S _
T21 W« W15 WS 7h7 7hl5Time (hours from midnight on each day)
Blast Air (relative units) _^_ Oxygen (relative units)Percent Test Mat'1 in Feed
Th2< r J
FIGURE 2bBlast Furnace #1
Back Pressure vs. Test Feed Input Concentration
Time (hours from midnight on each day). Back Pressure (inches water) , "Smoothed" Back Pressure (inches)Percent Test Maf 1 in Feed

FIGURE 3aBlast Furnace #2
Air. Oxygen and Test Material Feeds
Time (hours from midnight on each day)Blast Air (relative units) _+_ Oxygen (relative units)Percent Test Mat'1 in Feed
FIGURE 3bBlast Furnace #2
Back Pressure vs. Test Feed Input Concentration
Time (hours from midnight — etc i day), Bade Pressure (inches water). Percent Test Mat'1 in Feed
. "Smoothed" Back Pressure (inches)

FIGURE 4SO2 Concentrations vs. Test Feed Input, Stack
_- :oo —
1010Time, hours from midnight on 9/9
SO2 Stack Concentrations, ppm (#1) , Relative Level, Test Mat'1 in Feed
The relative test feed levels are included to show the relative relationship betweenSO2 stack concentrations and blast furnace feed. They are not strict mass ratios.
ANOVA ANALYSISSYSTEM #1Explanation/formulaxl , x2 average data valuessi , s2 standard deviationsm , n2 number of data11 , t2 = 90% conf. level factorss = stand, dev., across all dataZ - ts ((n1 + n2)/(nl n2)) ^ .5D-abs(x1-x2)
Signif. difference iff D > ZConclusion:
SO2 emiss SO2 emiss(reg feed) (test + reg)
58.140 65.93541.038 40.836
25 1081.66 1.64
40.83314.8637.795
No diff. demonstratedX - 64.47 ± 5.88

FIGURE 5SO2 Concentrations vs. Test Feed Input, Stack #2
£ -!- -y.
~ >oo —
i :so —
£ :oo —cVI
i i
_
Time, hours from midnight on 9/9SO2 Stack Concentrations, ppm (#2) , Relative Level, Test Mat'1 in reed
The relative test feed levels are included to show the relative relationship betweenS02 stack concentrations and blast furnace feed. They are not strict mass ratios.
ANOVA ANALYSISSYSTEM #2Explanation/formulaxl , x2 average data valuessi , s2 standard deviationsm , n2 number of datat1 , t2 = 90% conf . level factorss = stand, dev., across all dataZ = ts ((n1 + n2)/(n1 n2)) ~ .5D »abs(x1-x2)
Signif. difference iff D > ZConclusion:
SO2emiss SO2emiss(reg feed) (test + reg)
79.077 67.70842.152 45.593
13 721.78 1.64
45.03122.25511.369
No diff. demonstratedx = 69.45 ± 8.69

FIGURE 6RELATIVE LEAD AND SLAG PRODUCTION vs. TEST FEED INPUT
FURNACE #1
•J
-3
<U
Shift (during week of 9/9-9/13)_^_ Rel. Pb Prod, (per shift) #1 _+_ Rel. slag prod, (per shift)
A - Percentage test feed, relative unitsThe relative units are relative to the average furnace production throughout the week.
ANOVA ANALYSIS| SYSTEM *1 LEAD AND SLAG PRODUCTION
Explanation/formulaxl , x2 average data valuess1 , s2 standard deviationsn1 , n2 number of datat1 , t2 = 90% conf. level factorss = stand, dev., across all dataZ = ts ((n1 + n2)/(n1 n2)) ~ .5D = abs( x1 - x2)
Signif. difference iff D > ZConclusion:
Lead(reg
|
iI
I!
prod jfeed)
0.710.48
32.920.320.390.39
Lead(test
prod Slag+ reg) ; (reg
1.100.21
91.86
I No diff. demonstrated'x - 1.00 £0 17
prodfeed)
1.000.08
32.920.060.080.00
iSlag1 (test
prod+ reg)
1.00;0.07 j
si1.861!i
iNo diff. demonstrated jx = 1.00± 0.03 i

FIGURE 7RELATIVE LEAD AND SLAG PRODUCTION vs. TEST FEED INPUT
FURNACE #2
I
•J
1 : 5 3 5 — — — — ; * $ 4 i o T i i : i lShift (during week of 9/9-9/13)
, Relative Pb Production (per shift) #2 , Relative slag production (per shift)A Percentage test feed, relative units
The relative units are relative to the average furnace production throughout the week.
SYSTEM #2ANOVA ANALYSISLEAD AND SLAG PRODUCTION
Lead prod ! Lead prod i Slag prod ; Slag prodExplanation/formulaxl , x2 average data valuessi , s2 standard deviationsm , n2 number of datat1 , t2 = 90% conf. level factors
; s = stand, dev., across all data! Z = ts ((n1 + n2)/(n1 n2)) ~ .5D = abs( x1 - x2)
i Signrf. difference iff D > Z! Conclusion:
(reg feed) (test +i 0.87
0.51: 3
2.92i 0.29; 0.33
0.17
reg)1.030.23
121.8
No diff. demonstrated!x » 1.00 ±0.13
(reg feed) i (test +1.030.00
32.920.070.080.03
reg)0.990.08
12i1.8
No diff. demonstratedx = 1 .00 ± 0.03

FIGURE 8Lead Levels in Blast Slag
With and Without Test Feed Input to Furnace
Shift*Lead in slag, no test mat'lLead in slag, test mat'l
Average Lead %, no test mat;'lAvg Lead in slag, w/ test mat'l

FIGURE 9Antimony and Sulfur Levels in Blast SlagWith and Without Test Feed to furnace
Shift*. Sulfur in Slag; no test feed , Sulfur in slag; with test mat'l in furnace. Antimony in slag; no test feed_»_ Antimony in slag; with test mat'l in furn

FIGURE10Silica Levels in Blast Slag
With and Without Test Feed to furnace
0.4
O.J5
SO 0.)
.5 0.25
0.2s/5
•i 0.15
U~ 0.1 I
o.ts
14
Silica in Slag; no test feedShift #
_+_ Silica in slag with test mat'l in furnace

ATTACHMENT B
TABLES

-ABLE 1CHMR/EXIOE TONOLLI TEST
ANALrTICAL RESULTS FROM INCOMING TEST MATERIALSSEPTEMBER 1991
Sa~«.e
234
5 *6 *
7 ***8 •**
DUIK
jeis,:y
24 .4
232'6.9284
-araRuooer
fwt %)763%707%67 9%79.9%
= ;as;ic,'wt %)22.5%278%27.5%180%
Co-creie.So,; etc
'Wt%)
1.0%26%2.6%2.0%
28.2% "168%"
3.0%
Sulfur'wt%)
3.10%
1.93%2.71%
"c*.ai
'wt %)0.34%082%047%1 .57%15.7%
7.3%1.15%028%
Metallic_eaa
fwt %)0.25%005%0.05%0.10%
0.10%
7CL?Leaa
(mg/l)1309111.8131.31594
Avg: 26.7 74±6.4% 24±5.5% 8.0±8.3% 2.6±1.0% 3.5±3.7% 0.11 ±0.07% 133±23
Notes:Samples 5 and 6 were composited separately from samples 1 through 4. They apparently contained asignificantly higher concentration of lead. Much of this lead may have been present as sludge on therubber case material in these samples. In addition, the samoles contained aoproximately 20% silica,calcium and iron, indicating that perhacs relaovety less banery case (rubber) material was present, andmore particulars were present.
Soil, concrete, etc. column for samples 5 and 6 includes a combination of individual analytical results forsilica, calcium and iron. The value for samples 1 through 4 was determined by separating out theindividual components of the sample by hand prior to analysis. The difference between the values for thetwo sets of samples is accounted for by variability in the Tonolli material.
Samples 7 and 8 were duplicate samples submitted to two labs for total lead analysis for QA7QCpurposes. The difference in the results may be accounted for by variability in the amount of sludge stuckthe surface of the rubber, as surface lead accounts for the bulk of the lead in to the battery case material.
Overall bulk density calculated by averaging sample densities values with thoseobtained with trucK weights and volumes. These latter values were:
29.0 27.3 23.7 31.4 26.8 Ib/ft3Q-test removed the minimum valued 16.9 Ib/ft3 based on 90% confidence limitThe average was therefore: 26.7 * 1.9 Ib/fl3 or 723 ± 52 Ibs/yd3

TABLE 2ANOVA ANALYSIS OF BLAST AIR, OXYGEN AND BACK PRESSURE
Tonolli Experiment, September 1991
BLAST FURNACEAIR OXYGEN
Explanation/formulaxi . x2 average data valuessi , s2 standard deviationsni , n2 number of data11 , t2 = 90% conf. level factorss = stand, dev., across all data!Z = ts((m +n2)/(nl n2))~.5D = abs( x1 - x2)
Signif. difference iff D > ZConclusion:
Regular Reg. Feed & Regular Reg. Feed &Feed Only Test Feed Feed Only Test Feed
7.86 8.00 6.37 6.520.98 0.47 2.67 2.11
21 84 21 841.70 1.64 1.7 1.640.60 2.220.24 0.890.14 0.15
No diff. demonstrated No diff. demonstratedx = 7.97 ±0.10 x = 6.49 ±0.37 -..
BLAST FURNACE #2AIR OXYGEN
Explanation/formulaxi , x2 average data valuessi , s2 standard deviationsni , n2 number of datat! , t2 = 90% conf. level factors is = stand, dev.. across all dataiZ - ts ((n1 + n2)/(nl n2)) ~ .5D = abs( xi - x2)
Signif. difference iff D > ZConclusion:
Regular Reg. Feed & Regular Reg. Feed &Feed Only Test Feed Feed Only Test Feed
6.75 7.42 6.56 6.420.82 0.68 1.87 3.16
26 89 26 891.65 1.64 1.65 1.640.76 2.880.28 1 .050.67 0.14
Signif. diff. No diff. demonstratedx2 - x1 = 0.67 ± 0.29 X = 6.45 ± 0.44
BACK PRESSURERegular Reg. Feed &Feed Only Test Feed
4.95 7.421.53 2.38
21 841.7 1.64
2.440.982.47
Signif. diff.x2 - x1 = 2.47 ± 0.71
BACKPRESSURE WRegular Reg. Feed &Feed Only Test Feed
15.19 13.55!5.48 5.42
26 891.65 1.645.562.031.64
No diff. demonstratedx = 13.92 ± 0.86
BLAST FURNACES #1 and *2, COMBINED DATAAIR
Explanation/formulax1 , x2 average data values
' si , s2 standard deviationsn1 , n2 number of datati , t2 = 90% conf. level factorss = stand, dev., across •• dataZ = ts((n1 + n2)/(n1n4)~.5
|D = abs(x1-x2)Signif. difference iff D > Z
' Conclusion:
Regular Reg. Feed &Feed Only Test Feed
7.24 7.701.04 0.67
47 1731.64 1.640.770.210.46
Signif. diff.x2 - x1 - 0.46 ± 0.26

TABLE 3BLAST SLAQ ANALYTICAL RESULTS
Shift1234r>6789101 11214
Furnace22
1.2122?
2.121222
*/. Test Mal'lIn Input
0%7%0%0%11%11%13%
0%, 13%0%13%0%0%20%
% LeadReg. Reg »•
feed only Test feed2.8%
.31%* 1.1%
2.7%1.90%
2.5%1.0%
33%5.3%
48%2.6%3.3%47%4.5%2.5%
2.5%
% SulfurReg. Reg +
feed only Test feed2.99%
3.90%5.20%
297%4.90%
5.04%2.90%
1.40356
5.912.101.174.455.201.75
3.20
=leg +st teed
1.40%356%
5.91%2.10%1.17%4.45%5.20%1.75%
3.20%
% AntimonyReg. Reg +
feed only Test feed1.50%
012%0.01%
0.54%0.52%
1.04%0.06%
0.28%0.20%
2.15%0.57%0.20%0.38%0.39%0.41%
0.19%
%Si(Reg.
feed only24.8%
29.5%15.1%
24.4%21.7%
4.7%23.9%
32Reg +
Test feed
33.9%30.0%
21.4%32.6%32.6%21.2%23.8%28.0%
18.8%
%FeOReg. Reg +
feed only Test feed30%
29%32% 24%63%
47%33%30%
36% 44%45% 42%
48%30%43%
55%
xl.sint11.s7P
x2 aveiaga data values92 standard deviations
. n? number of data12 - 90%conf level factorsslum) risv . across all dataIs ((n1 t n2)/(n1 n2» ~ 5abs(xt x2)
Skjnil difference Iff D > ZConclusion:
ANOVA AnalysisDetermination if Significant Differences Exist Between Slags Produced When
Test Feed Was Processed and When H Was Not
% LeadReg.
feed only T2 15%0.83%
71.94
001200110.015
Signil. diff.x2 - xl = 0.02 ±
Reg +sst feed
3.70%1.10%
91.86
0.01 _
% SulfurReg. Reg +
feed only Test feed3.99% 3.19%1.05% 1.72%
7 9194 1.86
00150.0140.008
No diff. demonstratedx = 0.04 ± 0 01
% AntimonyReg. Reg +
feed only Test feed054% 0.53%056% 0.62%
7 91.94 1.86
000600060000
No dill, demonstratedx = 0 005 * 0.003
%902Reg. Reg +
feed only Teel feed20.6% 26.9%8.2% 5.8%
7 91.94 1.86
0.0740.0730.063
No diH. dvmomlraUdx *= 0.24 ± 0.04
%FeQReg. Reg +
feed only Test feed39.9% 39.0%11.8% 10.3%
7 91.94 1.86
0.1060.103
, 0.010No diff. demonstratedx - 0.39 ± O.OS

TABLE 4
SUMMARY OF EFFECTS OF PROCESSING TONOLLI MATERIALON THE BLAST FURNACES AT EXIDE'S READING FACIUTY
Parameter> Effect of AddingI Test Feed to Furnace
MitigatingCircumstance Response
Airi|| Oxygen
Back Pressure
i S02 Emissions
Lead production
; Slag production
Lead cone, in slag
Sulfur in slag
Antimony in slag
Silica in slag
FeO in slag
Increase on Furnace #2
No observed difference
Increased
No observed difference
No observed difference
No observed difference
Increased from 2.2 to 3.7%Reducing environment
No observed difference
No observed difference
No observed difference
No observed difference
Probably due to buildup;otherwise insignificant
Partially due to overcoking Decrease particle size
OvercokingToo much carbon
Reduce cokeReduce coke; increased Fe

TABLE 6
ESTIMATED ECONOMICS OF PROCESSING THE TONOLLI MATERIALAT EXIDE'S READING SMELTER
Assumptions: 50 to '20 cubic yards,'day processed.(67 to 1 60) processHg days to complete tne remediation
0.36 tons/cubic yard density180 days per year processing tne materials.40 cifclc yards per true*6 trucks/day loaded from site; 6OO y03 storage capacity at Exjde
8000 cubic yards of material on the site0.03 weigtt traction lead tn material (overall)
Item
PRODUCTION COSTS1 . Share of normal
tunace oper. andcapital costs
ADDITIONAL LABOR2. Contract engr. etc.
3. Loading
4. Mbdng/stze reduct& unloading
6. Management
ADDITIONAL CAPITAL6. Required capital
Expenditures
DISPOSAL COSTS7. Slag Disposal
a. Sludge disposal
ADO*L PROD. COSTS9. Reduced coke usaga
1 o. increased Iron usage
INCOME CHANGES11. Lead recovered
1 2. Loss of production(function d feed vol.)
OTHER COSTS13. Analyses of man
1 4. Msc/condngency
Arnt Req'd (& notes)
Labor, mgt, supplies, fuel,depreciation, H & S. etc.Based on Bur. of Mn. study
Incurred mostly up-front
8 hrs/day on site
32 hrs/day2.5 hrs/tuck
6 hrs/day1 nrs/fruck
$450.000 Front end loader,feed system. &controls
0.1 25 ton/ton feed
0.037 ton/Ion feed
75 to/yd* feed
30t>/yd3feed(est)
22 ft/yd* feed
10 to/yd3 for feeds<60yd3/day
I30to/yd3feed>60
1.25 analysis/truck
Percentage of total costs
Cost basts
$0.066 /1b feed
$40.000 over entire job
$900 /day Incl. per diem33 Total days loading
$40 /hr$40 /hr
S80>tir$80 Air
10% cost of capltal/yr7 yr depredation
10% malntenance/yr
$225 /ton
$125 Aon
$0.09 /to coke
$0.02 /to Iron
$0.22 /to lead value
$0.22 /to lead value
$70 /analysis
10% sum oil to 13
Cost per cubic yard
SA8 $48
S5 S5
$4 $4
$11 $26$3 $3
$4 $10$2 $2
$2 $5$3 $7$2 $5
$10 $10
$2 $2
($6) ($6)
$1 $1
($5) ($5)
$19 $2
$2 $2
$10 $12
Total break-even cost per cubic yard: $116 $131

APPENDIX A
Photographs

. • -• ,v^j' "' ' '" '
Material Being Loaded from the Tonoili Site
Tonoll Material Inside Exide's Storage Area

APPENDIX B
Tonofli Site Map

iHftMtMflUM ^1
> 0 60 l?0
APPROXIMATE SCALE: r-l
TONOLLI CORPOHATIONESQUEHONINQ, PA