choice for the future - cabinet office...the past records between 1990 and 2013 are compiled from...
TRANSCRIPT

Choice for the Future <Reference Charts>
May 2014 Committee for Japan’s Future
[Table of Contents] ○ Population ..................................................... 1-3 ○ Growrh and Development ............................ 4-12 ○ Human Resources .......................................13-22 ○ Prospects of the Regions ........................... 23-27 ○ Meeting Record ............................................. 28
Provisional translation by Cabinet Office

2,000
4,000
6,000
8,000
10,000
12,000
14,000
1990 2000 2010 2020 2030 2040 2050 2060 2070 2080 2090 2100 2110
(万人)
(年)
2013年12,730万人
(高齢化率:25.1%)
社人研(国立社会保障・人口問題研究所)
中位推計
出生率回復(2.07)ケース
2060年 10,545万人(人口減少率(対2013年比)17.2%)
(高齢化率:33.0%)
4,286万人
(高齢化率:41.3%)
総人口
8,674万人
(人口減少率(対2013年比)31.9%)
(高齢化率:39.9%)
出生率回復(2.07)ケース
2110年 9,661万人(高齢化率:26.6%)
Long-term population changes (total population) and projections
1. Projection of Population
1
If the current trend continues, the population in 2060 is expected to decrease by two thirds of the current pupolation, that is, approximately 87 million.
However, if the total fertility rate goes up to 2.07 by 2030, it is estimated that the population in 50 years will be 100 million, and another generation later, the population will take an upward turn, even if only a slight increase.
Population decline will stop (mid
2090s)
(Million people) 2013
127.3 mil. people (Population aging
rate: 25.1%)
Case where the birthrate recovers (2.07)
2110: 96.61 million people (Population aging rate: 26.6%)
Total population
(Year)
Population decline stops
(Mid 2090s) Population decline rate
(comparison with 2013) 31.9%) (Population aging rate: 39.9%)
86.74 mil. people
42.86 mil. people (Population aging
rate: 41.3%) (National Institute of Population and Social Security Research)
Medium variant projections
IPSS
(Remark) 1. The past records between 1990 and 2013 are compiled from “Population Census Report” and “Annual Report of Population Estimates" by the Ministry of Internal Affairs and Communications (MIC) and "Vital Statistics" by the Ministry of Health, Labour and Welfare (MHLW). 2. The medium variant projections by the National Institute of Population and Social Security Research in Japan (IPSS) are based on "Population Projections for Japan (January 2012)" by the IPSS. Until 2014, the total fertility rate shifted around 1.39, and afterwards, it is expected to drop to 1.33 by 2024 and hover at around 1.35. 3. The estimates for recovered birthrate were calculated with the population by gender and age in 2013 as a baseline assuming that the total fertility rate recovers to 2.07 in 2030 and the rate hovers at that level while the survival rate was the assumed value after 2013 for the medium variant projections by the IPSS (i.e., life expectancy goes up to 84.19 for males and 90.93 for females by 2060).
Case where the birthrate recovers (2.07) 2060: 105.45 million people
(Population decline rate (comparison with 2013) 17.2%) (Population aging rate: 33.0%)

Long-term population changes ("new productive age population"/"productive population") and projections
(Remark ) 1. The past records between 1990 and 2013 are compiled from “Population Census Report” and “Annual Report of Population Estimates” by the Ministry of Internal Affairs and Communications (MIC) and "Vital Statistics" by the Ministry of Health, Labour and Welfare (MHLW).
2. The medium variant projections by the IPSS are based on "Population Projections for Japan (January 2012)" by the IPSS. Until 2014, the total fertility rate shifted around 1.39, and afterwards, it is expected to drop to 1.33 by 2024 and hover at around 1.35.
3. The estimates for recovered birthrate were calculated with the population by gender and age in 2013 as a baseline assuming that the total fertility rate recovers to 2.07 in 2030 and the rate hovers at that level while the survival rate was the assumed value after 2013 for the medium variant projection by the IPSS (i.e., life expectancy goes up to 84.19 for males and 90.93 for females by 2060).
2. Projected Population of 20 to 70-Year-Olds
2
If the current situation continues, the productive population will drop to 44 million by 2060 and continue to decrease at the same pace.
If the total fertility rate recovers to 2.07 by 2030 and when 20 to 70 years old is a "new productive age population”, the “new productive age population” will reach around 56 million in 2060 and afterwards shift around that size.
2,000
3,000
4,000
5,000
6,000
7,000
8,000
9,000
10,000
1990 2000 2010 2020 2030 2040 2050 2060 2070 2080 2090 2100 2110
(万人)
(年)
生産年齢人口
(15~64歳)
2,333万人
2,126万人
(万人)
2013年7,901万人
出生率回復(2.07)ケース
2110年 5,461万人
(万人)
(年)
20~70歳人口
(「新生産年齢人口」)
社人研
中位推計 4,418万人
(万人)
2013年7,901万人
2013年8,329万人
4,777万人
出生率回復(2.07)ケース
2060年 5,555万人
2013 83.29 mil. people
2013 79.01 mil. people
IPSS Medium variant
projections
Productive population
(15-64 years)
(10,000 people)
(Year)
44.18 mil. people
47.77 mil. people
Population aged 20-70 ("new productive age
population")
Case where the birthrate recovers (2.07)
2060: 55.55 mil. people
Case where the birthrate recovers (2.07)
2110: 54.61 mil. people
23.33 mil. people
21.26 mil. people

0 500 1000 1500 2000 25000
10
20
30
40
50
60
70
80
90
100
2060年
~19歳
1,104 12.7%
20~64歳
4,105 47.3%
65~74歳
1,128 13.0%
75歳~
2,336 26.9%
(Remark) Created from "Population Projections for Japan (January 2012)" by the IPSS. The estimates for recovered birthrate were calculated with the population by gender and age in 2013 as a baseline assuming that the total fertility rate recovers to 2.07 in 2030 and the rate hovers at that level while the survival rate was the assumed value after 2013 for the medium variant projections by the IPSS (i.e., life expectancy goes up to 84.19 for males and 90.93 for females by 2060).
0 500 1000 1500 2000 25000
10
20
30
40
50
60
70
80
90
100
2010年
~19歳
2,293 17.9%
20~64歳
7,564 59.1%
65~74歳
1,529 11.9%
75歳~
1,419 11.1% Case where the birthrate recovers
Case where the current situation
continues
0 500 1000 1500 2000 25000
10
20
30
40
50
60
70
80
90
100
2030年
~19歳
1,698 14.6%
20~64歳
6,278 53.8%
65~74歳
1,407 12.1%
75歳~
2278 19.5%
0 500 1000 1500 2000 25000
10
20
30
40
50
60
70
80
90
100
2030年
~19歳
2,176 18.0%
20~64歳
6,245 51.6%
65~74歳
1,413 11.7%
75歳~
2269 18.7%
(10,000)
(10,000) 0 500 1000 1500 2000 2500
0
10
20
30
40
50
60
70
80
90
100
2060年
~19歳
2,181 20.7%
20~64歳
4,881 46.3%
65~74歳
1,132 10.7%
75歳~
2,351 22.3%
(10,000)
3
3. Changes in Demographic Structure until 2060 In the current Japan‘s demographic structure, the working-age population accounts for 59.1% while the elderly population
makes up 23.0%. If the current trend continues, the imbalance in the demographic structure will remain in 2060. If the birthrate recovers (i.e., in the case where the total fertility rate increases to 2.07 by 2030) the demographic structure will
consists of 20.7% for the population under 20 years, 46.3% for the age group of 20-64 years, and 33.0% for the population over 65 years, which means the imbalance will almost be resolved.
2010
2030 2060
75+ years
65-74 years
65-74 years
65-74 years 65-74 years
65-74 years
Ratio by age group and the number of age groups almost match and the
imbalance disappears
75+ years
75+ years
75+ years
0-19 years
0-19 years 0-19 years
0-19 years 0-19 years
75+ years
(10,000 people)
(10,000 people)
(10,000 people) (10,000 people)
(10,000 people)
20-64 years
20-64 years
20-64 years
20-64 years
20-64 years

* Future images when no action is taken to change the current situation
Productivity
Decline of labor force population
Decline of saving rate
Capital
Labor
Growth of labor force participation rates
Stagnation in technology
advancement
Decrease in productivity
Increase in
productivity
* Future image when choosing another way
Labor
Capital
Productivity
Aging population
Population decline
Capital accumulation
- Innovation - Branding, marketing - Knowledge capital
- Labor participation of young people, females, elderly people according to ability and motivation
- Investment in growing industries - Strengthening financial functions - Promotion of investment in Japan
Open
Dynamism
4
4. Future Image of Growth and Development If the current trend continues, Japan's economic growth and development will inevitably lose its dynamism
due to decrease of pupulation, savings rate, and technology advancement. From the macro aspect, the following are desired: (1) increase in productivity, (2) growth of labor force
participation rates, and (3) flow from savings to investment as well as increase of inward investment. In particular, the increase level of productivity is a focal point.
⇒ Increase in value-added productivity at the micro level through innovation ⇒ Dynamic industry structure through bold systematic reforms ⇒ Efforts to increase the growth of the global economy by building an open nation

6,577
5,683
3,795 4,453
0
1,000
2,000
3,000
4,000
5,000
6,000
7,000
2013 2030 2060
(万人)
(年)
6,5776,285
4,792
5,522
現状継続
ケース
経済成長・労働参加ケース
出生率回復ケース
年平均減少率:▲0.3%減少数:▲17万人
年平均減少率:▲0.9%減少数:▲53万人
年平均減少率:▲0.4%減少数:▲25万人
年平均減少率:▲1.3%減少数:▲63万人
社人研中位推計ケース
(Remark) Created from "Labour Force Survey" by the MIC, "Estimate for Demand and Supply of Labor (2014)" by the Employment Policy Research Group of the MHLW, "Population Projections for Japan (January 2012) " by the IPSS, and "Labour Force Survey" by Statistics Sweden.
(Note) 1. Labor force population is the total number of employees and completely unemployed people aged 15 and over. 2. The case where the current situation continues is estimated by fixing the labor force participation by gender and age in 2012 (the Employment Policy Research Group of the MHLW).
The case where economic growth and labor force participation improve is estimated assuming that participation of women and elderly and young people into the labor market progresses (the Employment Policy Research Group of the MHLW). For example, the labor force participation of women aged 30-49 years is assumed to increase from 71% in 2012 to 85% in 2030 with the M-shaped curve eliminated.
3. The case of medium variant projections by the IPSS is calculated by multiplying the population by gender and age in 2060 which the IPSS estimated by the labor force participation. The estimates for recovered birthrate were calculated first by assuming that the total fertility rate recovers to 2.07 in 2030 and the rate hovers at that level afterwards while the survival rate was the assumed value after 2013 for the medium variant projections by the IPSS (i.e., life expectancy goes up to 84.19 for males and 90.93 for females by 2060) and second by multiplying the values by labor force population rate.
4. Labor force population in 2060 took into consideration the above Note 1., i.e., estimate by the Employment Policy Research Group of the MHLW and is based on the assumptions that labor force participation of women and elderly progresses, and labor force participation of women aged between 30 and 49 years goes up to Sweden‘s level (85% in 2030 → 90% in 2060), using labor force participation of people over 60 years raised by five years respectively.
Estimate of labor force population
Raise the labor force participation of females of 30-49 years to Sweden's level (90%)
Raise the labor force participation of males and females over 60 years by five years respectively
2060 2030 2013
5
5. Estimate of Labor Force Population The labor force population will decline to around 55 million in 2060 even if the birthrate recovers (the total
fertility rate recovers to 2.07 in 2030) women work as much as those in Sweden, and elderly people work five years longer than now.
Annual average Decline rate: -0.3%
Number of phenomena: - 0.17 mil. Annual average
Decline rate: -0.4% Number of phenomena:
- 0.25 mil.
Annual average Decline rate: -0.9%
Number of phenomena: - 0.53 mil.
The case where the current situation
continues
Case where the
birthrate recovers
Case of economic growth and labor participation
Case of IPSS's medium variant
projections
(10,000 people)
(Year)
Annual average Decline rate: -1.3%
Number of phenomena: - 0.63 mil.

(Remark) Created based mainly on "System of National Accounts" and "Private Corporate Capital Stock" by the Cabinet Office, "Labour Force Survey" by MPHPT, "Indices of Industrial Production" and "Indices of Tertiary Industry Activity" by METI, "Monthly Labour Survey" by the MHLW, "Estimate for Demand and Supply of Labor (2014)" by the Employment Policy Research Group of the MHLW, and "Population Projections for Japan (January 2012) " by the IPSS.
(Note) 1. Regarding labor force population in the case where the current situation continues, labor force participation and working hours are assumed to remain the same as the ones in 2012. 2. In the case where economic growth and labor force participation improve, labor force population in 2020 and 2030 is adopted from the estimate by the Employment Policy Research Group of the MHLW. Working hours are assumed to remain at
the same level as in 2012. 3. Regarding the labor force population in 2060 in the case where the labor force participation of women and elderly progresses and working hours of elderly people become longer, it is assumed that the labor force participation of women and
elderly people improves more than in 2030 (women aged 30-49 work as much as those in Sweden, labor force participation rate for elderly people over 60 years becomes five years longer), and working time of male and females over 60 is used for 64 years.
4. Like the case of Note 3 above, labor force participation in 2060 in the case where the birthrate recovers is estimated assuming that the total fertility rate recovers to 2.07 in 2030 and the rate hovers at that level afterwards, while the survival rate was the assumed value after 2013 for the medium variant projections by the IPSS (i.e., life expectancy goes up to 84.19 for males and 90.93 for females by 2060).
6
6. Changes in Potential Growth: Degree of Contribution of Labor Input and Capital Investment
The degree of contribution of labor input is expected to remain on the declining trend even if the birthrate recovers, the labor force participation of women and elderly progresses and working hours of elderly people become longer.
The controbution level of capital investment will be smaller than before. The increase of total factor productivity (TFP) is required for the improvement of the potential growth rate.
0.6
-0.3 -0.3
2.0
0.5 0.6
1.8
1.4
0.5
4.4
1.6
0.8
-2.0
-1.0
0.0
1.0
2.0
3.0
4.0
5.0
1981-1990 1991-2000 2001-2010
(年平均成長率、%)
資本投入寄与度
TFP寄与度
潜在GDP成長率
(年)
労働投入寄与度
-0.5 -0.6
-0.9
-0.1 -0.3
-0.6
-0.3
-2.0
-1.0
0.0
1.0
2.0
3.0
2011-2020 2021-2030 2031-2060
(年平均成長率、%)
現状継続ケース
(年)
女性・高齢者の労働参加が図られ、高齢者の労働時間が伸びるケース
出生率が回復し、女性・高齢者の労働参加が図られ、高齢者の労働時間が伸びるケース
経済成長・労働参加ケース
労 働 投 入 寄 与 度
Changes in Japan's potential growth rate
0.4 0.5
0.6
0.3 0.3 0.3 0.4 0.4
0.5
-2.0
-1.0
0.0
1.0
2.0
3.0
2011-2020 2021-2030 2031-2060
(年平均成長率、%)
実質GDPと設備投資が、いずれも2%成長するケース
(年)
実質GDPが1%成長、設備投資が1.5%成長するケース
実質GDPと設備投資が、いずれも1%成長するケース
資 本 投 入 寄 与 度
(Average annual growth rate, %)
(Year)
(Year)
(Year)
(Average annual growth rate, %)
(Average annual growth rate, %)
Contribution degree of labor input
Contribution degree of capital investment
Contribution degree of capital investment
Contribution degree of TFP
Potential GDP growth rate
Contribution degree of labor input
Case where the birthrate recovers, the labor force participation of women and elderly progresses and working hours of elderly people becomes longer
Case where the labor force participation of women and elderly progresses and working hours of elderly people becomes longer
Case of economic growth and labor participation
Case where real GDP grows by 1% and facility investment goes up by 1.5%.
Case where real GDP and facility investment both increase by 2%
Case where real GDP and facility investment both increase by 1%
Case where the current situation continues
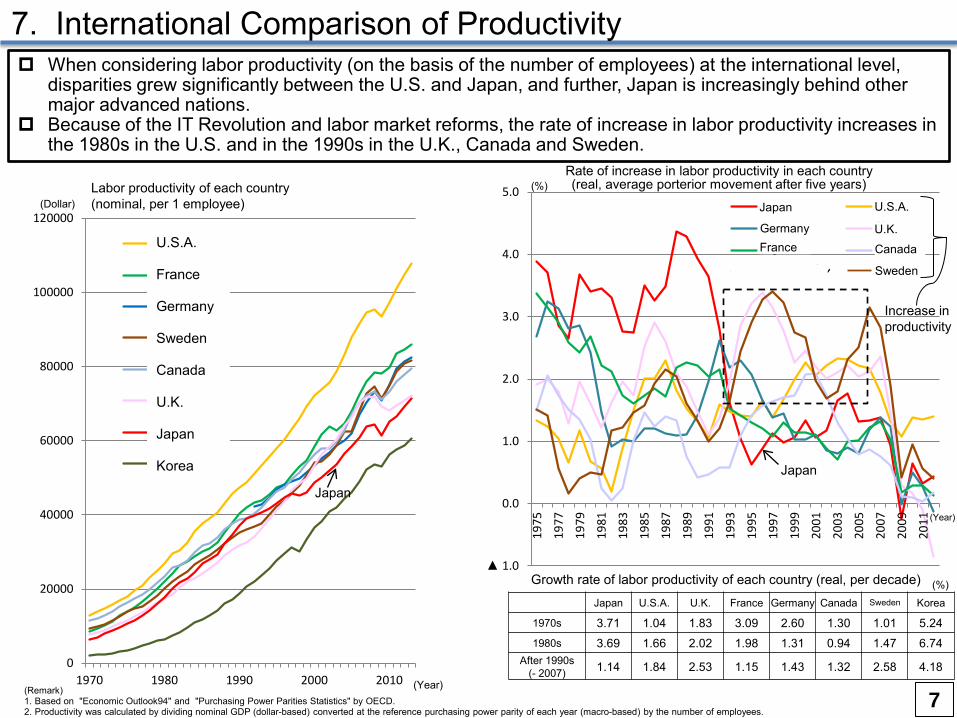
Growth rate of labor productivity of each country (real, per decade)
(Remark) 1. Based on "Economic Outlook94" and "Purchasing Power Parities Statistics" by OECD. 2. Productivity was calculated by dividing nominal GDP (dollar-based) converted at the reference purchasing power parity of each year (macro-based) by the number of employees.
(Year)
▲ 1.0
0.0
1.0
2.0
3.0
4.0
5.0
1975
1977
1979
1981
1983
1985
1987
1989
1991
1993
1995
1997
1999
2001
2003
2005
2007
2009
2011
日本 米国
ドイツ 英国
フランス カナダ
スウェーデン
Japan
(Year)
(%) Labor productivity of each country (nominal, per 1 employee)
Rate of increase in labor productivity in each country (real, average porterior movement after five years)
Japan U.S.A. U.K. France Germany Canada Sweden Korea
1970s 3.71 1.04 1.83 3.09 2.60 1.30 1.01 5.24 1980s 3.69 1.66 2.02 1.98 1.31 0.94 1.47 6.74
After 1990s (- 2007) 1.14 1.84 2.53 1.15 1.43 1.32 2.58 4.18
(%)
Sweden
Increase in productivity
(Dollar)
0
20000
40000
60000
80000
100000
120000
1970 1980 1990 2000 2010
米国
フランス
ドイツ
スウェーデン
カナダ
英国
日本
韓国
Japan
7
7. International Comparison of Productivity When considering labor productivity (on the basis of the number of employees) at the international level,
disparities grew significantly between the U.S. and Japan, and further, Japan is increasingly behind other major advanced nations.
Because of the IT Revolution and labor market reforms, the rate of increase in labor productivity increases in the 1980s in the U.S. and in the 1990s in the U.K., Canada and Sweden.
U.S.A. France Germany Sweden Canada U.K. Japan Korea
Canada
U.K.
U.S.A. Japan
Germany France

Japan Germany Total population
Peak 2008 (128.08 million people)
2003 (82.53 million people)
Decrease rate - 0.1% - 0.1%
Total fertility rate* 1.41 1.36*
Population aging rate*
24.1% 21.1%
Productive population
Peak 1998 (67.93 million people)
1999 (55.96 million people)
Decrease rate - 0.5% - 0.3%
Main data
* 2012. The total fertility rate of Germany is the one in 2011.
8
8. Productivity Comparison between Japan and Germany In Japan and Germany, total population and productive population are both in decline. The contribution of labor input to the
potential growth rate is also negative. On the other hand, in Germany, the contribution of TFP and capital investment to the economic growth is larger than in Japan.
Behind the economic growth of Germany, there are promoted participation in the labor market as a result of the labor market reform policy under the Schroeder regime, proactive ICT capital investment in the service industry, and the creation of additional value in business services among others.
(Remark) Created from EU KLEMS and statistics of each country.
0.7 0.4
-0.3 -0.2 -0.2
1.7 2.0
1.7 1.0
0.5
1.7 2.3
0.9
0.1 0.7
4.1 4.6
2.3
0.9 0.9
-1.0
0.0
1.0
2.0
3.0
4.0
5.0
1981-1985 1986-1990 1991-1995 1996-2000 2001-2007
Japan
TFP contribution
Capital investment contribution
Labor input contribution
(Change in contributions from previous year, %)
-0.7
0.5
-0.4 0.0
-0.2
0.9
1.2 1.3 1.3
0.8
1.0
1.5
1.0 0.7 1.2
1.3
3.2
1.9 2.0 1.7
-1.0
0.0
1.0
2.0
3.0
4.0
5.0
1981-1985 1986-1990 1991-1995 1996-2000 2001-2007
Germany (前年比寄与度、%) (Change in contributions from previous year, %)
TFP contribution
Capital investment contribution
Labor input contribution
(Year) (Year)
Potential growth rate

0
5
10
15
20
25
Japan and Germany's exports by industry ($ 100 mil.)
Japan
Germany
Share of business services (Note) is 6% Country A
Country B
Country C Created based on data from OECD (2013).
Image of export amount of added value*
Export amount (100)
Export amount (110)
Added value (10)
Added value (100)
* With the intermediary goods trade expanded because of Global Value Chain (GVC), added values are double counted in the calculation of total amount of world trade. To deal with this issue and to measure wolrd trade in value added calculated by each country, OECD and WTO jointly constructed a database for the world trade in value added.
9
9. Added Value of Japan and Germany by Industry With the value chain becoming more complicated and an international division of labor developing including
services, is possible to identify in which domestic industirial secotrs addded values are created in terms of export by paying attention to export amount of added value (calculated from added value created within a country), instead of export amount including values of imported intermediate goods.
According to the export amount of added value calculated by OECD, the business service industry is creating the most added value in Germany. On the other hand, in Japan, the highest added value is created at the distribution stage.
05
10152025
Japan and Germany's added value exports by industry (億ドル)
Japan
Germany
Share of business services (Note) is 23%
Japan and Germany are reversed
For Japan's wholesale and transportation, added value exports are larger than exports
($ 100 mil.)
Source: Created by the Cabinet Office based on OECD-WTO-TiVA. Note: Business services concludes marketing, consulting, IT-related, advertising, legal, accounting, R&D-related and other services.

0%
2%
4%
6%
8%
10%
12%
80 85 90 95 2000 05 07
無形資産投資(GDP比、実質)
(年)
情報化資産
革新的資産
経済的競争能力
0%
20%
40%
60%
80%
100%
日本
EU1
5
北欧諸国
英国等
大陸欧州
地中海諸
国
アメリカ
オースト
ラリア
無形資産投資の構成比(2005年)
Innovative property
経済的競争能力
情報化資産
(Remark) Based on analyses in Annual Report on the Japanese Economy and Public Finance 2011 Computerized information, innovative property and economic competitive capabilities are estimated using the following methods: (1) Computerized information ... Software order is estimated based on investment in software, package software on sales of the
software service industry, and internally developed software on the ratio of internaly developed software calculated using the Economic Census and database on sales of the information providing service industry.
(2) Innovative property ... R&D in the field of natural science is estimated based on science technology research and survey, rights of resource exploitation on cost of mineral exploitation and amount invested in exploration, copyright and license on nominal output values of publishing and printing services and other creative services for video/sound/character information purchased in each industry, design on sales of the design industry, display on sales of the display industry, machine design on sales of the machine design industry, architectural design on nominal output value of engineering services, and product development in the financial services industry on 20% of nominal intermediate input in the financial services industry and insurance business respectively.
(3) Economic competitive capabilities ... Brand assests is estimated based on advertising cost and marketing survey (advertising cost is 60% of nominal output value purchased from the advertising industry by other industries and market survey is the figure calculated by multiplying nominal output volume in the information services industry by the ratio of the information providing services industry obtained using Economic Census), human capital particular to individual companies on average training costs for regular employees from General Survey on Working Conditions, organizational strucuture on the figure calculated by multiplying nominal output volume in the professional and business services industry by the ratio of the managing and consulting services industry obtained using Economic Census respectively.
経済的競争能力
・ブランド資産、マーケティング力
・企業固有の人的資本
・組織構造
情報化資産
革新的資産
・自然科学分野の研究開発
・資源開発権
・著作権及びライセンス
・他の製品開発、デザイン、自然科学分野以外の研究開発
・データベース
(デザイン、ディスプレイ、機械設計、 建築設計、金融業における製品開発)
・受注ソフトウェア
・パッケージ・ソフトウェア
・自社開発ソフトウェア
10
10. Current Status and International Comparison of Knowledge Capital Investment (Intangible Assets Investment)
According to the breakdown of knowledge investment, a low proportion was classified under "economic competitive capabilities“, such as brand power and marketing capacity, while a high proportion was under the "innovative property“, such as research and development investment. Investment in intangible assets (to GDP, real) Composition ratio of investment in intangible assets (2005)
Economic competitive capabilities
Economic competitive capabilities
Innovative property
Innovative property
Computerized information
Computerized information
Economic
competitive capabilities
Computer-ized
information
Japa
n E
U15
N
orth
Eur
ope
U.K
., et
c.
Con
tinen
tal
Eur
ope
Med
iterra
nean
co
untri
es
U.S
.A
Aus
tralia
(Year)
• R&D in the field of natural science • Rights of resource exploitation • Copyright and license • Other product development, design, R&D in
other fields than natural science (design, display, machine design, architectural design, product development in the financial services industry)
• Brand property, marketing capacity • Human capital in corporate enterprises • Organizational structure
• Software order • Package software • Internally developed software • Database

2% 0%
24%
8%
3% 15%
5%
12% 5% 6%
20%
3% 0%
28%
11% 3%
14% 7%
10%
7% 17%
1980 1970 1990 2000 2010
6% 1%
38%
8% 2%
15% 5% 8%
7% 10% 4% 0%
30%
10% 3%
16% 6%
9%
7% 15% 1% 0%
22%
6%
3% 16%
6%
13%
6% 6%
21%
(Remark) Japan: created based on “System of National Accounts” by the Cabinet Office. Before 1990, the information and communication industries were combined to make up category of transportation and communication industry.
Other countries: Created based on "National Accounts Main Aggregates Database" by the U.N.
GDP by economic activity Agriculture, forestry and fisheries
Mining
Manufacturing
Construction
Electricity/gas/water
Wholsaling and retailing
Financial and insurance
Real estate
Transportation
Services Information and Communications
Services industry total 47%
Services industry total 56%
Services industry total 58%
Services industry total 66%
Services industry total 71%
GDP breakdown by category of economic activity for Japan remains almost unchanged for the past 10 years. In other countries, some industries such as the financial services industry, the medical and welfare services industry, and the education industry, significantly grew.
11. International Comparison of GDP Classified by Economic Activities
11
3%
28%
5% 7% 15%
9%
16%
10%
7%
1%
12% 4%
4%
15%
6% 33%
17%
8% 1% 16%
3% 5%
16%
6%
31%
15%
7% 2% 19%
5% 4%
18% 6%
25%
13% 8%
3%
21%
7% 5%
18% 7%
20%
8% 11% 3%
25%
4% 5%
19% 7%
17%
8% 12%
2%
22%
11%
6% 14% 8%
17%
13%
7% 2%
19%
5% 7%
15% 9%
22%
14%
7% 1%
15% 5%
6%
17% 9%
27%
16%
4% 1%
10% 5% 6%
17%
8%
53%
7%
26%
3% 7% 12% 10%
14%
4% 17%
5%
21%
4% 6%
12% 10% 15%
3%
24%
4%
19% 4%
7% 12% 9%
19%
4%
22%
2%
21% 3% 4%
11% 11%
25%
18%
5% 2%
17% 5% 5%
13% 10%
48%
U.S.A.
U.K.
Sweden
Manufacturing
Mining and electricity/ gas/water
Construction
Wholsaling, retailing etc.
Transportation, communication etc.
Financial and real estate, etc.
Education, medical servieces, etc.
Education, administrative services (including national defense)
Agriculture, etc. Manufacturing
Mining and electricity/ gas/water, etc.
Construction
Wholsaling, retailing, etc.
Transportation, communication etc.
Others
Agriculture, etc.
Services industry total 63%
Services industry total
57%
Services industry total
57%
Services industry total 64%
Services total
59%
Services industry total
64%
Services industry total
70%
Services industry total
67%
Services industry total
66%
Services industry total 75%
Services industry
total 79%
Services industry
total 73%
Services industry total
70%
Services industry
total 78%
Services industry
total 71%
Japan

-10
-8
-6
-4
-2
0
2
4
6
8
10
2000 02 04 06 08 10 12
(名目GDP比、%)
(備考)内閣府「国民経済計算年報」をもとに作成。
(年度)
企業
一般政府
家計
経常収支
Changes in balance between savings and investment by sector (I-S balance)
Case of neglecting the present situation
Gross Domestic Product (GDP) = Consumption + Investment + Government expenditures + Balance of trade (Export - Import)
(GDP - Tax + Income from abroad - Consumption - Investment) + (Tax - Government expenditure) = (Trade balance + Income from abroad) Net savings of the domestic private economy Treasury budget Current account
12
12. Effects on Macro-Economy (prospects of balance between savings and investment by sector)
As population aging advances, excess savings in household budgets are in decline. Assuming that the budget deficit increases, financial flow from other countries is necessary to compensate for domestic capital
shortfall.
(To nominal GDP, %)
Company
Household budget
Current account
General government
(Fiscal year)
(Remark) Created from "Annual Report on National Accounts for 2012" by the Cabinet Office.

13. Map of Current Situation of "Human Resources" (Concept Illustration) Human resource development and labor market optimized for the economic and social model developed through the post-war period of high growth
• Emphasis on maintaining and improving standards at the national level
• Education emphasizing uniformity • Lack of a long-term perspective such as the
advancement of science technologies
• Educational costs oppressing household finances
• Discontinuity between education and career (Contents learned are not considered in the labor market)
• Trainings after graduation rely on OJT provided by companies
• Re-learning is not common among working people
• Bulk hiring of new graduates (hiring for potential) • Policy of nurturing human resources in-house • Emphasis on team power • Work style without clarifying duties • Treatment emphasizing seniority • Wage based on stable employment, long time labor and
livelihood > Trainings focusing on OJT
• Non-regular employees: low wages, unstable employment, few
chances of OJT • Low unemployment rate among young people at the international level • External labor markets (special professions, mid-career) are
undeveloped • Criteria for ability evaluations in external labor markets are not clear
Regular employees (non-limited employment) Inside company
• Financial condition is relatively stable • People tend to work long hours and striking a
balance between work and life is difficult • Only one of partners (woman in particular) is liable
to be charged with housework and child-rearing
• Career formation initiated by company • Difficult for middle-aged and elderly
people who experienced divorce to be re-employed
• Few places to utilize their abilities and skills • <--> Many non-regular employees • Quite a few number of women leaving their jobs
during childbirth and child-rearing
• Difficult to get promoted to managing posts without working long hours
• Career formation is difficult • Re-employment after childbirth and child-
rearing is difficult • Few opportunities to be a regular employee
• Unstable life due to unstable employment and low wages
• Trainings after graduation are not considered
Regular
employees
Wom
en N
on-regular em
ployees
• Setting retiring age and subsequent drastic changes in working environment
• Shortage of places for elderly people to utilize their capabilities
• Shortage of successors of know-how and skills
• Increase in the ratio of elderly people
• Lifestyle-related disease became central to disease structure
• Rapid growth of demand for nursing as the result of aging baby boomers
• Accessibility to medical services under the universal healthcare system
• Issues related to "place to belong" and "purpose of life" for elderly people
Work style of elderly people Life of elderly people
Working environment
• Extension of average life span and life expectancy
• Improvement of physical strength and increase of willingness to work among elderly people
• Lack of knowledge about medical cost • Differences in awareness of disease
prevention and health maintenance
• Work style in younger age significantly
affects livelihood in old age • Significance of human relationships
• Few places for NEETs and job hoppers to learn professional skills
• Few opportunities to receive education linked with working such as training to develop global human resources
• Few places for lifelong learning
• Living conditions make it difficult to feel fulfillment
Work style Human resource
development
• Poor utilization of vocational abilities in the advanced age period
Widening disparities
Decline in Birthrate/Population Stable economic growth Globalization
Educational environment
Education before employment
Education after employment
- Social changes including the declining birthrate - Changes in desired human resources and work style amid population decline and aging
• Average academic achievement is one of the highest in the world
• Not enough training for acquiring the strength to live a life
• Educational environment where "non-straghter" that is, those with negative background such as repeating school year and dropout cannot succeed
• Educational gaps due to differences in parents' income
• Difficult to challenge global players • Difficult to acquire abilities to form
career on one's own initiative and expertise necessary for professions
Increase of social security costs
Social system
Work style and life in the advanced age period
Current status of people
Human life
Social issues
• NEETs (Not in Education, Employment or Training) remaining at high levels, aging • Lack of social resources to support employment
Survival of local communities
13

14. Labor Force Participation of Women in Major countries (M-shaped curve)
0.0
10.0
20.0
30.0
40.0
50.0
60.0
70.0
80.0
90.0
100.0
15-19 25-29 35-39 45-49 55-59 65-69
日本 アメリカ イギリス
ドイツ フランス スウェーデン
Japan
Germany
(%)
(Age)
Source: Japan: "Labour Force Survey" by the MIC, Other countries: OECD Database
Japan U.S.A.
Germany
France
U.K.
Sweden
42.3%
47.5% 47.4% 47.2% 47.2% 46.5% 46.1% 45.3% 43.6%
41.6% 39.2%
36.1%
11.1%
38.7%
34.4% 31.2%
43.0%
35.7%
29.9%
36.7% 34.3%
9.4%
52.7%
25.0%
0.0%
10.0%
20.0%
30.0%
40.0%
50.0%
60.0%
日本
フランス
ノルウェー
スウェーデン
アメリカ
イギリス
ドイツ
オーストラリア
シンガポール
韓国
フィリピン
マレーシア
就業者 管理的職業従事者
International comparison of the labor force participation rates for women
International comparison of the ratios of female managerial employees
Source: "Labour Force Survey" (2012) by the MIC ILO LABORSTA (2012) Eurostat: Eurostat Database (2012) Note 1) Data for Japan are from 2012, for Australia from 2008, and for other
countries from 2010. Note 2) In "Labour Force Survey" by the MIC, "managerial employee" means
workers with section chief status or higher position of companies such as managerial public officer. The definitions of "managerial employee" vary country by country.
Female employees All employees
14
In Japan, the labor force participation of women in and around their 30s and early 40s still illustrates an "M-shaped curve". In major European countries, such an M-shaped curve cannot be seen. When compared with other countries, the ratio of female managerial employees is low in Japan.
Ja
pan
Fran
ce
Nor
way
S
wed
en
U.S
.A
U.K
. G
erm
any
Aus
tralia
S
inga
pore
K
orea
P
hilip
pine
M
alay
sia
U.S.A.
France
U.K.
Sweden
Female managerial employees All managerial employees

(Remark) Created from OECD Annual Labour Force Statistics and OECD Factbook 2013.
Changes in total fertility rate and labor force participation of women in major countries (15 to 64 years old)
1.0
1.2
1.4
1.6
1.8
2.0
2.2
2.4
2.6
45.0 50.0 55.0 60.0 65.0 70.0 75.0 80.0 85.0
(合計特殊出生率)
(15~64歳の女性労働力率、%)
● 始点(1970年) ■ 終点(2010年)
アメリカ フランス
日本 スウェーデン
1990
2005
1980
1980
2000
2001
イギリス
ドイツ
15
15. Relation between Birthrate and Labor Force Participation of Women
In France and Sweden, simultaneous recovery of high labor force participation and increased birthrate was achieved. Recently, in Sweden in particular, a birthrate higher than 1970 was attained.
The birthrate tends to be higher when the labor force participation of women is high in recent years.
(Total fertility rate)
(Labor force participation of women aged 15-64, %)
Starting point (1970) End point (2010) U.K.
France
Germany
Japan Sweden
U.S.A.

16. Changes in Average Ideal/Planned Numbers of Children
13.6%
22.3%
45.6%
15.7%
1.7% 0.3% 0.0%
5.0%
10.0%
15.0%
20.0%
25.0%
30.0%
35.0%
40.0%
45.0%
50.0%
0人 1人 2人 3人 4人 5人以上
Source: Created from "The Fourteenth Japanese National Fertility Survey in 2010" by the IPSS.
Distribution of married couples by the number of children (2010)
Changes in average ideal/planned numbers of children
1.85 1.88 1.93 1.86 1.84 1.78 1.77 1.71
2.61
0.32
2.62
0.32
2.67
0.3
2.64
0.32
2.53
0.32
2.56
0.35
2.48
0.34
2.42
0.36
0
0.5
1
1.5
2
2.5
3
第7回調査 (1977年)
第8回調査 (1982年)
第9回調査 (1987年)
第10回調査 (1992年)
第11回調査 (1997年)
第12回調査 (2002年)
第13回調査 (2005年)
第14回調査 (2010年)
2.17 2.20 2.23 2.18 2.16 2.13 2.11 2.07
Source: Created from "Japanese National Fertility Survey, Married Couples" by the IPSS.
Note) The subjects for the survey were married couples (first marriage for both partners) whose wives were under 50 years old. The planned number of children was calculated by adding the number of children in existence to the planned additional number of children. The total number includes the cases where marriage duration was not clear. The years of surveys are the ones when the surveys were conducted.
(people)
Ideal number of children
Planned additional number of children
Number of children in existence
Planned num
ber of children
16
Although the average ideal and actual numbers of children are both on a downward trend in the long term, the ideal and planned numbers of children remain 2 or higher.
On the other hand, the average number of children in existence is actually under 2, there exists a gap between desires and reality.
(People)
0 people 1 people 2 people 3 people 4 people 5+ people
7th survey 8th survey 9th survey 10th survey 11th survey 12th survey 13th survey 14th survey (1977) (1982) (1987) (1992) (1997) (2002) (2005) (2010)

17. Ratio of Non-Regular Employment of Men and Women and Wage Disparities
0.0%10.0%20.0%30.0%40.0%50.0%60.0%70.0%80.0%
男性の非正規比率
0.0%10.0%20.0%30.0%40.0%50.0%60.0%70.0%80.0%
女性の非正規比率
0
100
200
300
400
500
600
700
800
男女別 雇用形態別賃金カーブ 正規 男性 正規 女性 非正規 男性 非正規 女性
Source: "Labour Force Survey (Detailed Tabulation)" (2013) by the MIC
Source: "Basic Survey on Wage Structure" (2013) by the MHLW Note) Data above are for general workers and do not consider part-
time workers. Wages are based on annual income.
(10,000 yen)
0.0
50.0
100.0
150.0
200.0
250.0
20歳以下 30〜39歳 40〜49歳 50〜59歳 60歳以上
男性
ドイツ フランス 英国
0.0
50.0
100.0
150.0
200.0
250.0
20歳以下 30〜39歳 40〜49歳 50〜59歳 60歳以上
女性
ドイツ フランス 英国 Germany
Source: "Structure of Earnings Statistics 2010" by the EU (Note) Data above are monthly earnings, and the index
number was "20 years old or younger" of each country as a base of 100.
Wage curves for men and women (EU)
17
In the case of males, the percentage of non-regular employees is high among young and elderly people, while it is high in all ages in the case of females.
Wages of non-regular male and female employees are significantly low in comparison to those of regular male and female employees.
Ratio of non-regular male employees
Ratio of non-regular female employees
Wage curves by gender and by form of employment
Regular, male Non-regular, male
Regular, female Non-regular, female
Germany France
France
U.K.
U.K.
-19
year
s ol
d
20-2
4 ye
ars
old
25-2
9 ye
ars
old
30-3
4 ye
ars
old
35-3
9 ye
ars
old
40-4
4 ye
ars
old
45-4
9 ye
ars
old
50-5
4 ye
ars
old
55-5
9 ye
ars
old
60-6
4 ye
ars
old
65-6
9 ye
ars
old
70- y
ears
old
20 years old and under
20 years old and under
30-39 years old
30-39 years old
50-59 years old
50-59 years old
40-49 years old
40-49 years old
60 years and over
60 years and over
Female
Male
15-2
4
25-3
4
35-4
4
45-5
4
55-6
4
65-
15-2
4
25-3
4
35-4
4
45-5
4
55-6
4
65-
(Age)
(Age)

2.4%
9.6%
33.4%
60.1%
40.1%
1.3% 3.7%
14.5%
27.1%
11.6%
0.0%
10.0%
20.0%
30.0%
40.0%
50.0%
60.0%
70.0%
15~19歳 20~24歳 25~29歳 30~34歳 15~34歳計
正規の職員・従業員 非正規の職員・従業員
Source: "Employment Status Survey" (2012) by the Statistics Bureau, MIC (Note) 1. The term "non-regular worker"means a person such as a part-time/temporary worker, dispatched worker, a contract worker, and a shokutaku
(short-term contract) worker. 2. The term "males with spouse" here means the total number of males excluding single men.
18. Comparison of Ratio of Males with Spouses by Age and Form of Employment
Regular workers
Non-regular workers
(%)
18
When comparing the ratio of males with spouses by form of employment, the percentage of non-regular male employees with spouses is notably low in all ages.
This suggests that economic conditions, such as income and form of employment, have a major impact on the decision to marry.
15-19 years old 20-24 years old 25-29 years old 30-34 years old Total: 15-34 years old
Regular employees Non-regular employees

19. International Comparison of Birthrate Decline Related Index
Japan France U.K. Sweden Germany U.S.A.
Average age of first marriage of women
29.2 (2012)
30.8 (2011) ― 33.0
(2011) 30.2
(2011) 25.8 (Note 1)
Average age of women when giving birth to their first children
30.3 (2012)
28.6 (2006)
30.6 (2010)
29.0 (2011)
29.0 (2011)
25.1 (2005)
Ratios of children born out of marriage (2008) 2.1% 52.6% 43.7% 54.7% 32.7% 40.6%
Ratio of long-hours workers (49 or more per week) (2012)
Total 22.7% Males 31.6%
Females 10.6%
Total 11.6% Males 16.1%
Females 6.5%
Total 12.0% Males 17.3%
Females 5.8%
Total 7.6% Males 10.7%
Females 4.2%
Total 11.2% Males 16.4%
Females 5.0%
Total 16.4% Males 21.8%
Females 10.2%
Hours consumed for housework and childcare by husbands (2006) 1:00 2:30 2:46 3:21 3:00 3:13
Ratio of family related government expenditures against GDP (2009)
(Note 2)
* Including child allowance and childcare services
0.96% (1.35% in FY2011)
3.20% 3.83% 3.76% 2.11% 0.70%
Source: Average age of first marriage of women: “Vital Statistics” by the MHLW for Japan, and data from “Eurostat Database” for France, Sweden, and Germany. Average age of women when giving birth to their first children: “Vital Statistics” by the MHLW for Japan, data from “Eurostat Database” for European
countries, and “National Health Statistics Report” by the Centers for Disease Control and Prevention, National Center for Health Statistics for U.S.A. (March 22, 2012).
Ratio of long-hours workers: "ILO database". Hours consumed for housework and childcare by husbands: "How Europeans Spend Their Time: Everyday Life of Women and Men" (2004) by Eurostat,
"American Time-Use Survey Summary" (2006) by the Bureau of Labor Statistics of the U.S., and "Survey on Time Use and Leisure Activities" (2006) by the MIC.
Ratio family related government expenditures against GDP: "Social Expenditure Database" by OECD. Note 1) Data for U.S.A. are the average figures for the period between 2006 and 2010. Note 2) The ratio of family related expenditures against GDP is the figure only for expenditure and excludes tax deduction.
19

10.4 12.3
6.7
10.2 9.1 6.1 7.3
1.4
1.8
0.1
0.5 2.2
0.8 1.0
1.0
2.0
2.9
5.0 2.3
1.5
2.4
7.2
9.0
8.1
7.3 8.6
8.3 6.6
1.0
3.2
3.8
3.7
2.1
0.7 2.3
1.2
3.7
2.5
3.0
3.5
1.8
3.1
22.2
32.1
24.1
29.8
27.8
19.2
22.1
0.0
5.0
10.0
15.0
20.0
25.0
30.0
35.0
日本 フランス イギリス スウェーデン ドイツ アメリカ OECD平均
20. International Comparison of Social Security Related Government Expenditure
Social security related government expenditures against GDP in Japan are at the almost the same level as the average of OECD member countries and relatively lower than European countries. The ratio of family related government expenditure is low.
Source: "Social Expenditure" by OECD (2009)
(Contrasted with GDP, %)
年金・介護 遺族(遺族年金等) 障害者施策・労災等 医療 家族 その他 計
20
Japan France U.K. Sweden Germany U.S.A. OECD average
Pension/ Nursing care
Survivor (ex. survivor pension)
Measures for Persons with Disabilities/workmen's compensation
Medical Family Others Total

25.00
27.00
29.00
31.00
33.00
35.00
37.00
39.00
41.00
43.00
1998 1999 2000 2001 2002 2003 2004 2005 2006 2007 2008 2009 2010 2011 2012
65~69歳 男子 65~69歳 女子 70~74歳 男子
70~74歳 女子 75~79歳 男子 75~79歳 女子
(Remark) Created from “Physical Fitness Survey (Japan Fitness Test)” by the Ministry of Education, Culture, Sports, Science and Technology (MEXT).
Note) Data above is the average of the total scores for the following items: grip strength, sit-ups, sit and reach, standing test on one leg with eyes open, 10 meter obstacle walk, 6 minutes walk
21. Changes in Physical Fitness of Elderly People
21
Most of the scores for physical fitness of elderly people show trends of improvement. Comparing the total scores of 1998 and 2012, the score of 2012 improved and became close
to the score for people five years younger.
Trends in physical fitness of elderly people
65-69 years old, Male 65-69 years old, Female 70-74 years old, Male 70-74 years old, Female 75-79 years old, Female 75-79 years old, Male

2010年
1,419万人
(11.1%)
2020年
1,879万人
(15.1%) 2030年
2,278万人
(19.5%)
2040年
2,223万人
(20.7%)
2050年
2,385万人
(24.6%)
2060年
2,336万人
(26.9%)
0
500
1,000
1,500
2,000
2,500
-
20
40
60
80
100
120
140
160
2000 2005 2010 2015 2020 2025 2030 2035 2040 2045 2050 2055 2060
(万人)(兆円)
(Source) 1. Regarding the social welfare benefits, actual values up to FY2011 are based on “The Financial Statistics of Social Security in Japan FY2011" by the IPSS, estimates for FY2012 and onward are based on "Revised Future Estimation of Social Security Cost (March 2012)" by the MHLW.
* Preconditions for the economic situation used in the above estimates: Conditions up to 2022 are based on Conservative Scenario in “Economic and Fiscal Projections for Medium to Long Term Analysis (January 24, 2012)" by the Cabinet Office, and conditions in 2023 and onward are based on nominal economic growth rate (1.8%), wage growth rate (2.4%) and price increase rate (1.2%).
2. The ratio of the population aged 75 and over is based on medium variant projections for birth and death in "Population Projections for Japan (January 2012)" by the IPSS.
Changes in social welfare benefit by sector
Medical care
Pension
Nursing care, etc.
Estimate
FY2025 Medical care: 54.0 trillion yen Pension: 60.4 trillion yen Nursing care, etc.: 34.4 trillion yen Total: 148.9 trillion yen
Population aged 75 and over (Percentage of total population)
Uneven distribution of medical and nursing care services (as of 2040)
(Source) The 9th National Council on Social Security System Reform (April 19, 2013). Extracted from the material document submitted by Professor Tai Takahashi (Graduate School, International University of Health and Welfare)
FY2011 Medical care: 34.1 trillion yen Pension: 53.1 trillion yen Nursing care, etc.: 20.4 trillion yen Total: 107.5 trillion yen
22. Future of Social Security
It is expected that social welfare benefit increases especially in the fields of medical care and nursing care. Uneven regional distribution of medical and nursing care services is anticipated, and especially in the Tokyo
metropolitan area, there will be a major shortage of those services as the population ages.
22
(Trillion yen) (10,000 people)
2010 14.19 mil.
people
2020 18.79 mil.
people 2030
22.78 mil. people
2040 22.23 mil.
people
2050 23.85 mil.
people
2060 23.36 mil.
people
Regions that can afford: For both medical and nursing care. (slight increase or decline of elderly population) For medical care. Slightly for nursing care. For medical care. Average for nursing care
Regions that cannot afford:
For both medical and nursing care. Especially for nursing care. Especially for medical care.

3割以上5割未満減少,
619自治体(34.4%)
3割未満減少,
269自治体
(15.0%)
維持・増加, 15自治体(0.8%)
1万人未満
523自治体
(全体の29.1%) 1万人以上5万人未満
316自治体
(全体の17.6%)
5万人以上10万人未満
40自治体
(全体の2.2%)
10万人以上
17自治体
(全体の0.9%)
5割以上減少, 896自治体
(49.8%)
23. "Possibility of Disappearance" of Local Cities
Estimates of the number of communities whose "female population aged 20-39" will decline by more than 50% for local cities whose population outflows do not stop
1799
1276
1556
0
500
1000
1500
2000
Total number of
local governments
Cases w
here population outflow
s do not stop C
ases where population
outflows stop
The number of local governments as of 2040
Possibility of disappearance
of 523 local governments
Possibility of disappearance
of 243 local governments
Breakdown by population size for municipalities whose female population aged 20-39 will decline more than 50%
The number of municipalities from the aspect of changes in female population aged 20-39
(Remark) Created from the material document for the first “Committee for Japan’s Future” submitted by Mr. Masuda (committee member) (January 30, 2014).
(Note) 1. "Local governments with high possibility of disappearance" is defined as a community whose population will be less than 10,000 by 2040 among local governments whose "female population aged 20-39" will decline by 50% during the period between 2010 and 2040.
2. Created from “Regional Population Projection for Japan: 2010-2040 (March 2010)” and associated data by the IPSS. 3. Estimates for the cases where population outflows do not stop are calculated by multiplying the net migration rates by year, sex,
and age (for population aged under 85) by a certain adjustment coefficient according to positive and negative migration rates so that the net social increase (total of items with positive net migration rate) and the net social decrease (total of items with negative net migration rate) of population during the period from 2010 to 2015 hover at almost the same level afterwards.
4. For the figures above, a ward is considered to be one municipality regarding 12 designated cities. In addition, municipalities in Fukushima prefecture are not included. 23
For the local cities whose population outflow to large metropolitan area (especially Tokyo) does not stop, there is a deep concern that 523 out of 1,800 local governments have the "possibility of disappearance" in 2040. Even for local cities whose population outflows stop, 243 local governments still will suffer from the "possibility of disappearance".
same, increase, 15 local governments (0.8%)
Decrease by 50% or more,
896 municipalities (49.8%)
Decrease by 30% or more/less than 50%,
619 municipalities (34.4%)
Decrease by less than 30%,
269 municipalities
(15.0%) Less than
10,000 people, 523 municipalities
(29.1%) 10,000 people or more and
less than 50,000 people,
316 municipalities
(17.6%)
100,000 people or more,
17 municipalities (0.9% of the total)
50,000 people or more and less than 100,000
40 municipalities (2.2% of the total)

24. Population Concentration in Urban Areas in the World
Status of population concentration in urban areas in the world (2013)
Fortune Global 500 The number of main offices of
global businesses by city
Note 1: Source is Demographia: World Urban Areas & Population Projections (Wendell Cox) Note 2: "Urban area" is basically defined as an area with a population density of 400 people /km2 or more and lined with buildings. Note 3: Total population of each country is based on estimates for 2013 regarding medium fertility from "World Population Prospects: The 2010 Revision" by the U.N. Note 4: The Tokyo metropolitan area here means the area consists of Tokyo, Kanagawa, Chiba and Saitama prefectures, and some urbanized areas in Gunma, Tochigi and Ibaraki prefectures.
The population of the Tokyo metropolitan area is 30 million or more, accounting for nearly 30% of the total population in Japan. Also, 70% of main offices of global businesses are located in the area.
Such a high concentration of domestic population and functions is remarkable except in Korea.
(Source) Fortune Global 500 (2013)
Fortune Global 500 lists global businesses of top ranking up to 500th in terms of sales value.Share means the percentage of global businesses listed in Fortune Global 500 whose main offices are located in the above cities in the total number of such businesses in each country.
Ranking City of main office
No. of businesses Share
1 Beijing 48 53.9% 2 Tokyo 45 72.6% 3 Paris 19 61.3%
4 New York 18 13.6%
5 London 17 63.0% 6 Seoul 12 85.7% 7 Osaka 8 12.9% 7 Shanghai 8 9.0%
3,724
2,675
2,287 2,330 2,283 2,177 2,124 2,067 2,057 2,003
1,579 1,507
1,087 958 731
29.29%
10.70%
46.42%
1.86% 1.65%
22.12%
11.66%
6.46%
10.27%
16.38%
11.05%
18.37% 16.91%
15.17%
8.84%
0.00%
5.00%
10.00%
15.00%
20.00%
25.00%
30.00%
35.00%
40.00%
45.00%
50.00%
0
500
1000
1500
2000
2500
3000
3500
4000
都市
圏の人
口(万
人)
総人
口に占めるシェア
(%)
都市的地域の人口(万人)
その都市的地域の存する国の総人
口に占めるシェア
24
Population in urban areas (10,000 people) Percentage in the total population of the country where the urban area is located
Pop
ulat
ion
in u
rban
are
as (1
0,00
0 pe
ople
)
Per
cent
age
in th
e to
tal p
opul
atio
n (%
)
Toky
o m
etro
polit
an
area
(Not
e 4)
Jaka
rta
Seo
ul -
Inch
on
Del
hi
Sha
ngha
i
Man
ila
Kar
achi
New
Yor
k
Sao
Pau
lo
Mex
ico
city
Mos
cow
Cai
ro
Par
is
Lond
on
Ess
en -
Dus
seld
orf
73.9
30.9
-35.0 -55.0 -56.0
-44.9 -100
-50
0
50
100
150
200
農業、林業
建設業
製造業
情報通信業
運輸業、郵便業
卸売業、小売業
金融業、保険業
不動産業、物品賃貸業
学術研究、専門・技術サービス業
宿泊業、飲食サービス業
生活関連サービス業、娯楽業
教育、学習支援業
医療・福祉
東京圏 三大都市圏 その他の地域
(万人)
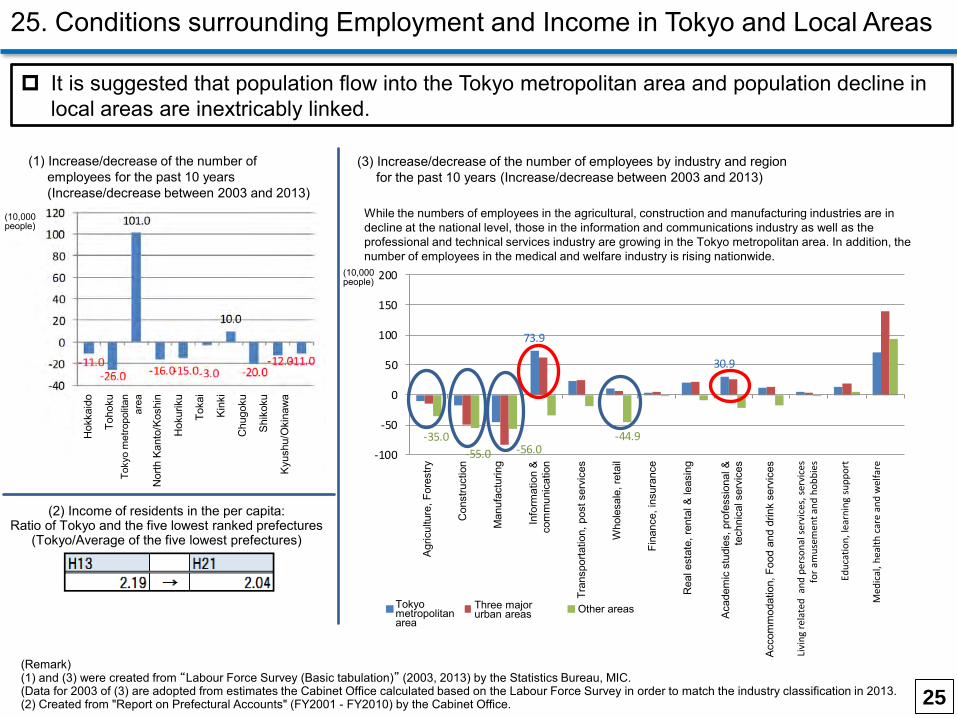
25. Conditions surrounding Employment and Income in Tokyo and Local Areas
It is suggested that population flow into the Tokyo metropolitan area and population decline in local areas are inextricably linked.
(2) Income of residents in the per capita: Ratio of Tokyo and the five lowest ranked prefectures
(Tokyo/Average of the five lowest prefectures)
(1) Increase/decrease of the number of employees for the past 10 years (Increase/decrease between 2003 and 2013)
(Remark) (1) and (3) were created from “Labour Force Survey (Basic tabulation)” (2003, 2013) by the Statistics Bureau, MIC. (Data for 2003 of (3) are adopted from estimates the Cabinet Office calculated based on the Labour Force Survey in order to match the industry classification in 2013. (2) Created from "Report on Prefectural Accounts" (FY2001 - FY2010) by the Cabinet Office.
(3) Increase/decrease of the number of employees by industry and region for the past 10 years (Increase/decrease between 2003 and 2013)
While the numbers of employees in the agricultural, construction and manufacturing industries are in decline at the national level, those in the information and communications industry as well as the professional and technical services industry are growing in the Tokyo metropolitan area. In addition, the number of employees in the medical and welfare industry is rising nationwide.
25
(10,000 people)
(10,000 people)
Tokyo metropolitan area
Three major urban areas Other areas
Hok
kaid
o
Toho
ku
Toky
o m
etro
polit
an
area
Nor
th K
anto
/Kos
hin
Hok
urik
u
Toka
i
Kin
ki
Chu
goku
Shi
koku
Kyu
shu/
Oki
naw
a
Agr
icul
ture
, For
estry
Con
stru
ctio
n
Man
ufac
turin
g
Info
rmat
ion
&
com
mun
icat
ion
Tran
spor
tatio
n, p
ost s
ervi
ces
Who
lesa
le, r
etai
l
Fina
nce,
insu
ranc
e
Rea
l est
ate,
rent
al &
leas
ing
Aca
dem
ic s
tudi
es, p
rofe
ssio
nal &
te
chni
cal s
ervi
ces
Acc
omm
odat
ion,
Foo
d an
d dr
ink
serv
ices
Liv
ing
rela
ted
and
per
sona
l ser
vice
s, se
rvic
es
for a
mus
emen
t and
hob
bies
Educ
atio
n, le
arni
ng s
uppo
rt
Med
ical
, hea
lth c
are
and
wel
fare
(Remark) Created based on "Annual report on the internal migration in Japan derived from the basic resident registers" by the Statistics Bureau, MIC.
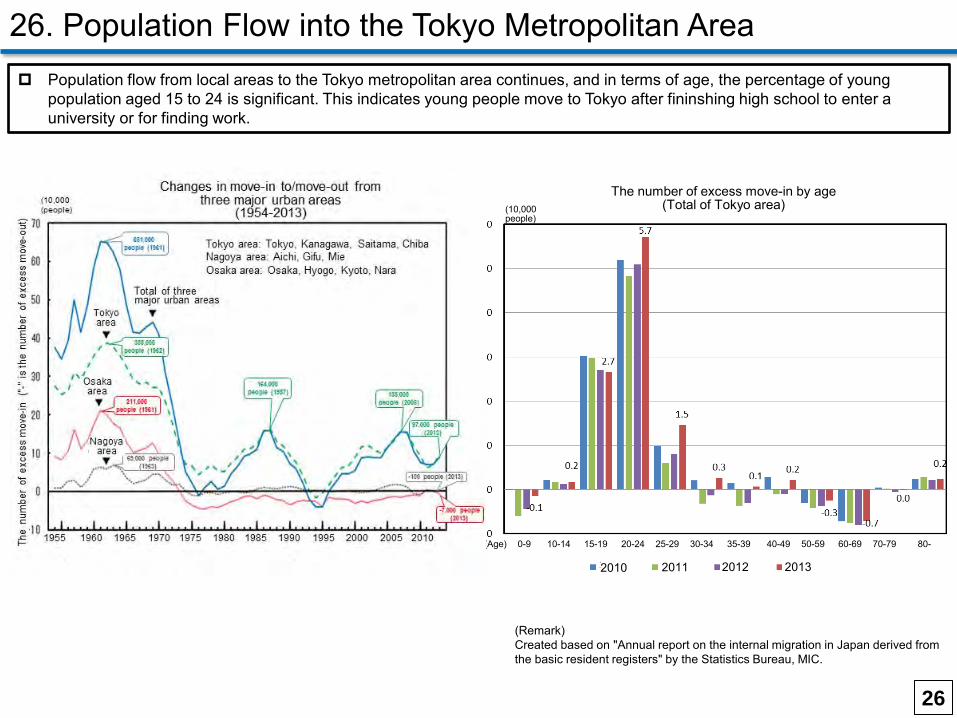
26. Population Flow into the Tokyo Metropolitan Area Population flow from local areas to the Tokyo metropolitan area continues, and in terms of age, the percentage of young
population aged 15 to 24 is significant. This indicates young people move to Tokyo after fininshing high school to enter a university or for finding work.
26
(10,000 people)
(Age) 0-9 10-14 15-19 20-24 25-29 30-34 35-39 40-49 50-59 60-69 70-79 80-
2010 2011 2012 2013
The number of excess move-in by age (Total of Tokyo area)

27. Map of Current Situation of Population Concentration in Tokyo (Concept Illustration)
Concentration of industries and
population
[High-growth period]
Tokyo metropolitan
area
Local areas
Structure of population outflow
Information dissemination abilities centralized in Tokyo Extensive authority of administration
Good transportation network Advanced culture and interactive functions
Head office functions remaining in the Tokyo metropolitan area Concentration of international
operations and financial functions
Strong yen Increased competition from
Asian countries
Improvement of logistical efficiency by developing domestic transportation network
Improvement of communication functions
Overseas transfer and closure of plants
Decline of employment in local areas
Young people move to the Tokyo metropolitan area after finishing high School
to enter a university or for finding work
Relative gaps in income, etc. compared to local areas
Population concentration in the Tokyo metropolitan
area
Accumulation of human capital
High productivity
Depressed economic and social activities in local areas
Population decline in local areas
Initially, large-scale flow of population to three major city areas
Distribution of functions of plants, etc. lowers population decline with income gap
Normalization of outflow of population (esp. young people) from local areas Fixing of income disparity
Spiral in which a population outflow causes further economic disparities and population outflows
Spiral of Concentra-
tion
Spiral of Outflow
Decentralization of plants, etc.
Infrastructure development
Decline of branch functions
[Issues]
Enhancement of global
competitive-ness
Vitalization of industries supporting local areas
Control of outflow of
population, especially for young people
[Stable growth period] Around 1973 - 1975
27

• January 20: First Council on Fiscal and Economic
Policy (CEFP) meeting - Set up the "Future of Choices" committee
• January 30: First committee meeting - Agenda of the committee
• February 14: Second committee meeting - Items to be considered at the committee - Potential growth rate, people's feeling of well-being
and income, demographic movement
• February 24: Third committee meeting - Future to be aimed at - Economic growth and development, issue of declining birthrate
• March 12: Fourth committee meeting
- Prospects of the regions
• April 7: Fifth committee meeting - Human resources
• April 21: Sixth committee meeting
- Discussions considering reports from chiefs of working groups
- Interim draft summarizing points
• May 13: Seventh committee meeting - Reports from working groups - Interim summarization
Chairperson
Akio Mimura: Senior Advisor, Honorary Chairman at Nippon Steel and Sumitomo Metal Corporation
19th Chairman of the Japan Chamber of Commerce and Industry
Acting chairperson Kazumasa Iwata: President at the Japan Center for Economic
Research Former deputy governor at the Bank of Japan
Fujiyo Ishiguro: President & CEO of Netyear Group Corporation
Yuriko Kato: President, M2 Labo Co., Ltd.
Sawako Shirahase: Professor at the University of Tokyo, Graduate School of Humanities and Sociology
Tomotaka Takahashi: CEO of ROBO GARAGE Co., Ltd.
Masataka Fukao: Associate Professor at Ryukoku University, Faculty of Policy Science
President of the Kyoto Foundation for Positive Social Change
Hiroya Masuda: Visiting Professor at the University of Tokyo, Graduate School of Public Policy Former governor of Iwate Prefecture
Hiroshi Yoshikawa: Professor at the University of Tokyo, Graduate School of Economics
28. Meeting Record of “Committee for Japan’s Future” Meeting record List of committee members
28