chord recognition by fitting rescaled chroma vectors to chord
TRANSCRIPT

1
Chord recognition by fitting rescaled chroma
vectors to chord templatesLaurent Oudre, Member, IEEE, Yves Grenier Member, IEEE, Cedric Fevotte, Member, IEEE
Abstract—In this paper we propose a simple and fast methodfor chord recognition in music signals. We extract a chromagramfrom the signal which transcribes the harmonic content of thepiece over time. We introduce a set of chord templates taking intoaccount one or more harmonics of the pitch notes of the chordand calculate a scale parameter to fit the chromagram framesto these chords templates. Several chord types (major, minor,dominant seventh,...) are considered. The detected chord over aframe is the one minimizing a measure of fit between the rescaledchroma vector and the chord templates. Several popular distancesand divergences from the signal processing or probability fieldsare considered for our task. Our system is improved by somepost-processing filtering that modifies the recognition criteria soas to favor time-persistence.
The transcription tool is evaluated on 3 corpus: the Beatlescorpus used for MIREX 08, a 20 audio songs corpus and aresynthesized MIDI corpus. Our system is also compared tostate-of-the-art chord recognition methods. Experimental resultsshow that our method compares favorably to the state-of-the-artand is less computationally demanding than the other evaluatedsystems. Our systems entered the MIREX 2009 competition andperformed very well.
Index Terms—chord recognition, music signal processing, mu-sic signal representation, music information retrieval
I. INTRODUCTION
COMPLETE musical analysis of a pop song, that is to say
the transcription of every single note played by every
instrument is a very complex task. The musical content of a
pop song is thus more often translated into a more compact
form such as sequences of chords. A chord is a set of notes
played simultaneously. A chord can be defined by a root note
which is the note upon which the chord is perceived and a
type giving the harmonic structure of the chord. For example
a C major chord is defined by a root note C and a type major
which indicates that the chord will also contain the major third
and the perfect fifth, namely the notes E and G. The result
of chord transcription consists in sequences of chords played
successively with their respective lengths. This compact and
robust writing not only helps to play-back the song but also
gives information on the harmonic content and structure of the
song. Automatic chord transcription finds many applications
in the field of Musical Information Retrieval. The characteriza-
tion of a song by its chord transcription can be used in several
tasks among which song identification, query by similarity or
analysis of the structure of the piece.
Automatic chord transcription includes in most cases two
successive steps: a feature extraction which captures the musi-
Copyright (c) 2010 IEEE. Personal use of this material is permitted.However, permission to use this material for any other purposes must beobtained from the IEEE by sending a request to [email protected]
cal information and a recognition process which outputs chord
labels from the extracted features.
The first step consists in the extraction of relevant and
exploitable musical content from the audio. As such, pitch
perception of a note can be decomposed into two different
notions: height, corresponding to the octave to which the note
belongs and chroma or pitch class indicating the relation of
the note with the other notes among an octave. For example
the note A4 (440 Hz) is decomposed into an octave number 4
and a chroma A. The features used in chord transcription may
differ from a method to another but are in most cases variants
of the Pitch Class Profiles introduced by Fujishima [1] whose
calculation is based on this notion of chroma. These features,
also called chroma vectors, are 12-dimensional vectors. Every
component represents the spectral energy of a semi-tone on
the chromatic scale regardless of the octave. These features are
widely used both in chord recognition and tonality extraction.
The calculation is based either on the Constant Q Transform
(CQT) [2] or on the Short Time Fourier Transform (STFT)
and is performed either on fixed-length frames or variable-
length frames (depending for example on the tempo, etc.). The
succession of these chroma vectors over time is often called
chromagram and gives a good representation of the musical
content of a piece.
The structure of a chord being entirely defined by its root
note and type, it is easy to create 12-dimensional chord
templates which reflect this structure by giving a particular
amplitude to every chroma. The simplest model for chords,
widely used in chord recognition [1],[3], has a binary structure
giving an amplitude of 1 to the chromas constituting the chord
and 0 for the other chromas. Other models can be introduced
for example by taking into account the harmonics of the notes
played in the chord [4],[5].
The present paper focuses mainly on the second part of the
chord transcription process that is to say the chord labeling
of every chromagram frame. Our chord recognition system is
based on the intuitive idea that for a given 12-dimensional
chroma vector, the amplitudes of the chromas present in the
chord played should be larger than the ones of the non-played
chromas. By introducing chord templates for different chord
types and roots, the chord present on a frame should therefore
be the one whose template is the closest to the chroma vector
according to a specific measure of fit. A scale parameter is
introduced in order to account for amplitude variations and
finally the detected chord is the one minimizing the measure
of fit between the rescaled chroma vector and the chord
templates.
Section II provides a review of the state-of-the-art methods
2
for the chord recognition. Section III gives a description of
our recognition system: the chord templates, the measures of
fit and some post-processing filtering methods exploiting time-
persistence. Section IV describes the evaluation protocol for
our method. Section V presents a qualitative and quantitative
analysis of the results on a data corpus formed by the 13
Beatles albums and a comparison with the state-of-the-art.
Section VI gives results on another corpus composed of audio
files synthesized from MIDI and investigates the influence
of the genre, percussive noise and beat-synchronous chord
detection.
II. STATE OF THE ART
The chord recognition task consists in outputting a chord
label from a specific music-related feature. Most chord recog-
nition systems use a chromagram (or assimilate) as an input
to the system and output a chord label for each chromagram
frame. Machine-learning methods such as Hidden Markov
Models (HMMs) have been widely used for this task especially
in the last years but templates-fitting techniques have also been
used for this labeling process.
A Hidden Markov Model is constituted by a number of
hidden states with an initial state distribution, a state transition
probability distribution which gives the probability of switch-
ing from a state to another and an observation probability
distribution which gives the likelihood of a particular state for
a particular observation data. In the typical HMM-based chord
recognition systems every chord is represented by a hidden
state and the observations are the chromagram frames. Given
the parameters of the model, the chord recognition consists in
finding the most likely sequence of hidden states (chords) that
could have generated a given output sequence (chromagram).
The parameters of these HMMs (initial state distribution, state
transition probability distribution and observation probability
distributions) are either based on musical theory, learned on
real data or a combination of these two approaches.
The first HMM used in chord recognition [6] is composed of
147 hidden states each representing a chord and corresponding
to 7 types of chords (major, minor, dominant seventh, major
seventh, minor seventh, augmented and diminished) and 21
root notes (12 semi-tones with the distinction between ♭ and
♯). All the HMM parameters are learned by a semi-supervised
training with an EM algorithm. This model is then improved
in [7] by a complete re-building of the HMM. The number of
hidden states is reduced from 147 to 24 by only considering
major and minor chords ; this enables to have sufficient data
for the training process. The initializations for the HMMs
parameters are inspired by musical and cognitive theory which
naturally introduced musical knowledge into the model. The
state transition probability distribution and the initial state
distribution are still updated by an unsupervised training with
an EM algorithm but the observation probability distributions
are fixed, giving to each chord a clear and predetermined
structure. The introduction of tempo-based features also en-
hances the recognition performances. Some other methods
[5],[8] also use a 24 states HMM considering only major and
minor chords but try different sets of input features, HMM
parameters or training approaches. Symbolic data can be used
for the training process with a system based on 24 tonality-
dependent HMMs [9] in order to give a joint key extraction
and chord transcription.
Yet, the first chord recognition system based on chroma
representation proposed by Fujishima [1] is not using HMM
but chord dictionaries composed of 12-dimensional templates
constituted by 1 (for the chromas present in the chord) and
0 (for the other chromas). 27 types of chords are tested and
the transcription is done either by minimizing the Euclidean
distance between Pitch Class Profiles and chord templates or
by maximizing a weighted dot product. Fujishima’s system
is improved [3] by calculating a more elaborate chromagram
including notably a tuning algorithm and by reducing the num-
ber of chords types from 27 to 4 (major, minor, augmented,
diminished). Chord transcription is then realized by retaining
the chord with higher dot product between the chord templates
and the chromagram frames. Chord transcription can also be
done by maximizing the correlation between enhanced variants
of the Pitch Class Profiles and chord templates [10]. These
chord templates are also used on MIDI data for the joint tasks
of segmentation and chord recognition [11] by the calculation
of weights reflecting the similarity between the chord models
and the present notes in a segment.
III. OUR SYSTEM
A. General idea
Let C denote the chromagram, with dimensions M ×N (in
practice M = 12) composed of N successive chroma vectors
cn. Let pk be the 12-dimensional chord template defining
chord k. We want to find the chord k whose template pk is
the closest to the chromagram frame cn for a specific measure
of fit. We propose to measure the fit of chroma vector cn to
template pk up to a scale parameter hk,n. Given a measure
D ( . ; . ), a chroma vector cn and a chord template pk, the
scale parameter hk,n is calculated analytically to minimize the
measure between h cn and pk:
hk,n = argminh
D (h cn;pk) . (1)
In practice hk,n is calculated such that:
[
d D (h cn;pk)
dh
]
h=hk,n
= 0. (2)
We then define dk,n as:
dk,n = D (hk,n cn;pk) . (3)
The detected chord kn for frame n is then the one mini-
mizing the set {dk,n}k:
kn = argmink
dk,n. (4)
3
CC#DD#E F F#GG#A A#B0
0.2
0.4C major with 1 harmonic
CC#DD#E F F#GG#A A#B0
0.2
0.4C major with 4 harmonics
CC#DD#E F F#GG#A A#B0
0.2
0.4C major with 6 harmonics
CC#DD#E F F#GG#A A#B0
0.2
0.4C minor with 1 harmonic
CC#DD#E F F#GG#A A#B0
0.2
0.4C minor with 4 harmonics
CC#DD#E F F#GG#A A#B0
0.2
0.4C minor with 6 harmonics
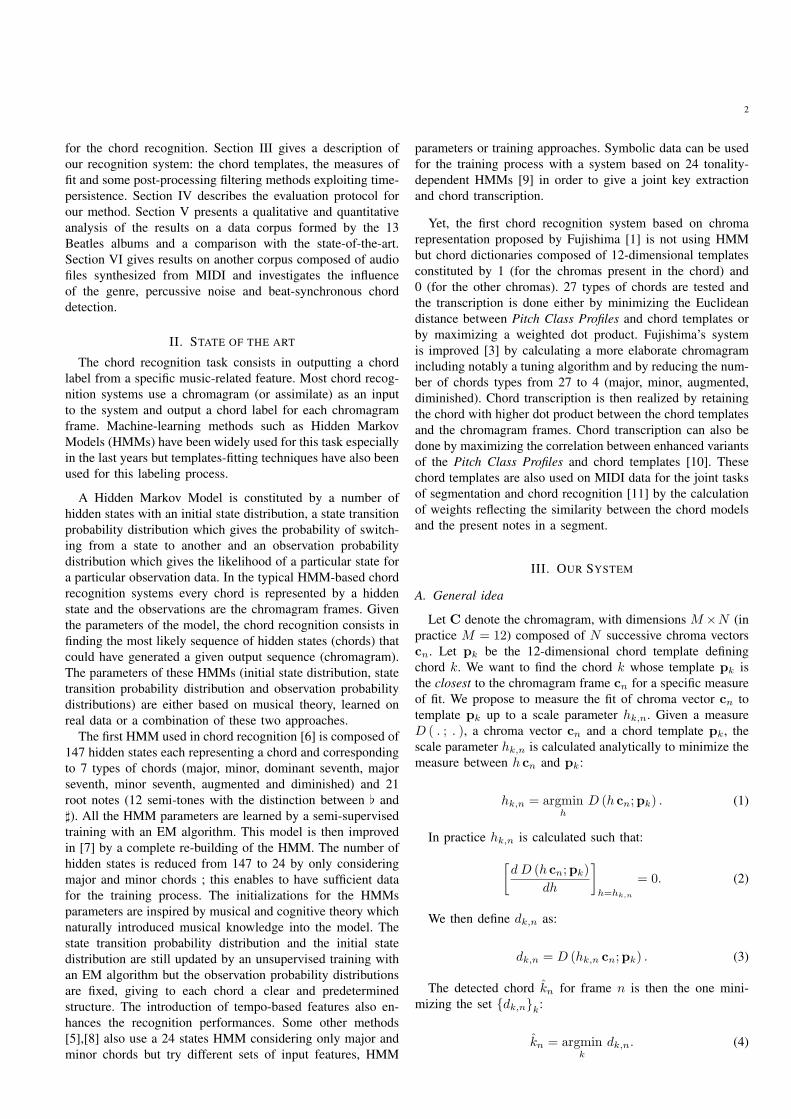
Figure 1. Chord templates for C major / C minor with 1, 4 or 6 harmonics.
B. Chord models
The chord templates are 12-dimensional vectors where
each component represents the theoretical amplitude of each
chroma in the chord. These chord templates can either be
learned on audio data [6], [8], [9] or predetermined [1],
[3], [5], [7], [10],[11]. However, Bello & Pickens [7] and
Papadopoulos & Peeters [5] have shown that using fixed and
musically inspired chord structures can give better results
for the chord detection task. Besides, the use of fixed chord
models allows to skip the time-consuming learning phase and
the need of annotated training data.
In our system three chord models are defined: examples for
C major and C minor chords are displayed on Figure 1.
The first chord model is a simple binary mask: an ampli-
tude of 1 is given to the chromas defining the chord and an
amplitude of 0 is given to the other chromas.1 For example
for a C major chord an amplitude of 1 is given to the chromas
C, E and G while the other chromas have an amplitude of 0.
The second chord model is inspired from the work of
Gomez [4] and Papadopoulos [5]. The information contained
in a chromagram or any other spectral representation of a
musical signal captures not only the intensity of every note
but a blend of intensities for the harmonics of every note. It
is therefore interesting and relevant to take into account the
harmonics for each note of the played chord. An exponentially
decreasing spectral profile is assumed for the amplitudes of the
partials and an amplitude of si−1 is added for the ith harmonic
of every note in the chord. The parameter s is empirically set
to 0.6. Our second chord model only takes into account the 4
first harmonics.
The third chord model is based on the same principle but
takes into account the first 6 harmonics for the notes of the
chord.
1In practice a small value is used instead of 0, to avoid numericalinstabilities that may arise with some measures of fit, see section III-C.
From these three chord models we can build chord templates
for all types of chords (major, minor, dominant seventh, dimin-
ished, augmented,...). By convention in our system, the chord
templates are normalized so that the sum of the amplitudes is
1 but any other normalization could be employed.
C. Measures of fit
1) Definitions: We consider for our recognition task several
measures of fit, popular in the field of signal processing. Table
I gives the expressions of these different measures, as well as
the scale parameter analytically calculated from (2) and the
final expression of the set of values dk,n.
The well-known Euclidean distance (EUC) defined by
DEUC (x|y) =
√
∑
m
(xm − ym)2
(5)
has already been used by Fujishima [1] for the chord recog-
nition task.
The Itakura-Saito divergence [12] defined by
DIS (x|y) =∑
m
xm
ym− log
(
xm
ym
)
− 1 (6)
was presented as a measure of the goodness of fit between two
spectra and became popular in the speech community during
the seventies. This is not a distance, since it is in particular
not symmetrical.2 It can therefore be calculated in two ways:
D (hk,n cn|pk) will define IS1, while D (pk|hk,n cn) will
define IS2.
The Kullback-Leibler divergence [13] measures the dis-
similarity between two probability distributions. It has been
widely used in particular in information theory and has given
rise to many variants. In the present paper we use the gener-
alized Kullback-Leibler divergence defined by
DKL (x|y) =∑
m
xm log
(
xm
ym
)
− xm + ym. (7)
Just like Itakura-Saito divergence [12], the generalized
Kullback-Leibler divergence is not symmetrical, so that we
can introduce two measures of fit: D (hk,n cn|pk) (KL1) and
D (pk|hk,n cn) (KL2).
While the Euclidean distance had already been used for the
chord recognition task, the use of Itakura-Saito and Kullback-
Leibler divergences is innovative. The non-symmetry of these
divergences allows to define two variants (IS1 & IS2 and KL1
& KL2). We shall now investigate the properties of these two
variants and interpret them in our chord recognition context.
Considering the variations of the functions of two variables
DIS(x|y) and DKL(x|y), we notice that the terms DIS(x|y)and DKL(x|y) take high values when x is large and y is close
to 0. The IS1 and KL1 measures of fit being just sums of 12
of these terms, we can deduce that a high value of IS1 or KL1
would be obtained if, for at least one of the chromas, the first
term hk,n cm,n is larger that the pm,k term. That is to say if the
2Symmetrized versions of Itakura-Saito and Kullback-Leibler were firstconsidered but since they prevented any analytical calculation of hk,n, wepreferred to avoid the numerical optimization that would become necessaryand possibly lengthy.
4
Table IPRESENTATION OF THE MEASURES OF FIT (THE EXPRESSIONS ASSUME ‖pk‖1 = 1)
Expression of D(
hk,n cn;pk
)
Scale parameter hk,n Minimization criteria dk,n
EUC
√
∑
m
(hk,n cm,n − pm,k)2
∑
m
cm,n pm,k
∑
m
c2m,n
√
√
√
√
√
√
∑
m
p2m,k
−
(
∑
m
cm,n pm,k
)
2
∑
m
c2m,n
IS1∑
m
hk,n cm,n
pm,k− log
(
hk,n cm,n
pm,k
)
− 1 M∑
m
cm,n
pm,k
M log
(
1
M
∑
m
cm,n
pm,k
)
−
∑
m
log(
cm,n
pm,k
)
IS2∑
m
pm,k
hk,n cm,n− log
(
pm,k
hk,n cm,n
)
− 1 1
M
∑
m
pm,k
cm,nM log
(
1
M
∑
m
pm,k
cm,n
)
−
∑
m
log(
pm,k
cm,n
)
KL1∑
m
hk,n cm,n log(
hk,n cm,n
pm,k
)
− hk,n cm,n + pm,k e
−∑
m
c′m,n log
(
cm,n
pm,k
)
1− e
−∑
m
c′m,n log
(
c′m,n
pm,k
)
with c′m,n =cm,n
‖cn‖1
with c′m,n =cm,n
‖cn‖1
KL2∑
m
pm,k log(
pm,k
hk,n cm,n
)
− pm,k + hk,n cm,n1
∑
m
cm,n
∑
m
pm,k log(
pm,k
c′m,n
)
− pm,k + c′m,n
with c′m,n =cm,n
‖cn‖1
chroma does not belong to the chord template but is present
in the chromagram frame. This means that the IS1 and KL1
measures of fit reject in priority chords whose null chromas
are nevertheless present in the chroma vector.
On the contrary, the terms DIS(y|x) and DKL(y|x) take
high values when x is close to 0 and y is large. Therefore, a
high value of IS2 or KL2 is obtained when, for at least one
of the chromas, hk,n cm,n is lower that pm,k. That is to say
if the chroma is present in the chord template but not in the
chromagram frame. This means that the IS2 and KL2 measures
of fit reject in priority chords whose notes are not all present
in the chroma vector.
2) Toy examples: Let us check these assumptions on a very
simple toy example. Let us suppose that we want to find a C
major chord in a chromagram frame x. The chord template
can be written y = [1, ǫ, ǫ, ǫ, 1, ǫ, ǫ, 1, ǫ, ǫ, ǫ, ǫ] with ǫ being a
very small value used to avoid numerical instabilities.
• Case 1 (extra note): The chromagram frame is a C major
chord, with an extra D
x = [1, ǫ, 1, ǫ, 1, ǫ, ǫ, 1, ǫ, ǫ, ǫ, ǫ]
• Case 2 (missing note): The chromagram frame is a C5
chord (only C and G)
x = [1, ǫ, ǫ, ǫ, ǫ, ǫ, ǫ, 1, ǫ, ǫ, ǫ, ǫ]
Table II shows the expressions of the measures of fit
calculated for each of these toy examples along with their
equivalent when ǫ → 0. We observe that in Case 1, for a very
small value of ǫ, the IS1 measure of fit tends to be very high,
IS2 and KL1 are finite3, and KL2 is close to 1. This indicates
that IS1 strongly reacts to the presence of parasite notes in
the chroma vector, while it does not make a big difference
for KL2. On the contrary, in Case 2, the IS2 measure of fit is
really sensitive to the fact that all the notes within the chord
3In practice we use ǫ = 10−16.
template can be found in the chroma vector, while KL1 is not
too affected.
D. Filtering methods
So far, our chord detection is performed frame-by-frame
without taking into account the results on adjacent frames.
In practice, it is rather unlikely for a chord to last only
one frame. Furthermore, the information contained in the
adjacent frames can help decision [14]: it is one of the main
advantages of the methods using HMM, where the introduc-
tion of transition probabilities naturally leads to a smoothing
effect. Nevertheless, HMM-based methods inherently assume
an exponentially temporal distribution, which does not suit
well the rhythmic structure of pop songs [15]. We therefore
propose, as a third block for our method, to use an ad
hoc filtering process which implicitly informs the system of
the expected chord duration. The post-processing filtering is
applied upstream to the calculated measures. Note that the use
of this ad hoc filtering process is innovative, since it had been
previously applied to chromagrams [1], [16], [7] or detected
chord sequences [7], but never to the recognition criterion
itself.
We introduce new criteria dk,n based on L successive values
centered on frame n (L is then odd). These dk,n are calculated
from the dk,n previously calculated on the L adjacent frames,
as shown below. In our system two types of filtering are tested.
The low pass filtering defined by
dk,n =1
L
n+L−1
2∑
n′=n−L−1
2
dk,n′ (8)
tends to smooth the output chord sequence and to reflect the
long-term trend in the chord change.
The median filtering defined by
dk,n = med {dk,n′}n−
L−1
2≤n′≤n+
L−1
2
(9)
5
Table IIEXPRESSIONS OF THE MEASURES OF FIT ON TOY EXAMPLES ALONG WITH THEIR EQUIVALENT WHEN ǫ → 0.
EUC IS1 IS2 KL1 KL2
Case 1 1− ǫ1ǫ+ log(ǫ)− 1 ǫ− log(ǫ)− 1 ǫ− log(ǫ)− 1 ǫ log(ǫ)− ǫ+ 1
∼ 1 ∼ 1ǫ
∼ − log ǫ ∼ − log ǫ ∼ 1
Case 2 1− ǫ ǫ− log(ǫ)− 1 1ǫ+ log(ǫ)− 1 ǫ log(ǫ)− ǫ+ 1 ǫ− log(ǫ)− 1
∼ 1 ∼ − log ǫ ∼ 1ǫ
∼ 1 ∼ − log ǫ
maj min 7 N others0
10
20
30
40
50
60
70
Perc
ent (%
)
Repartition on the MIDI corpus
maj min 7 N others0
10
20
30
40
50
60
70
Perc
ent (%
)
Repartition on the Beatles corpus
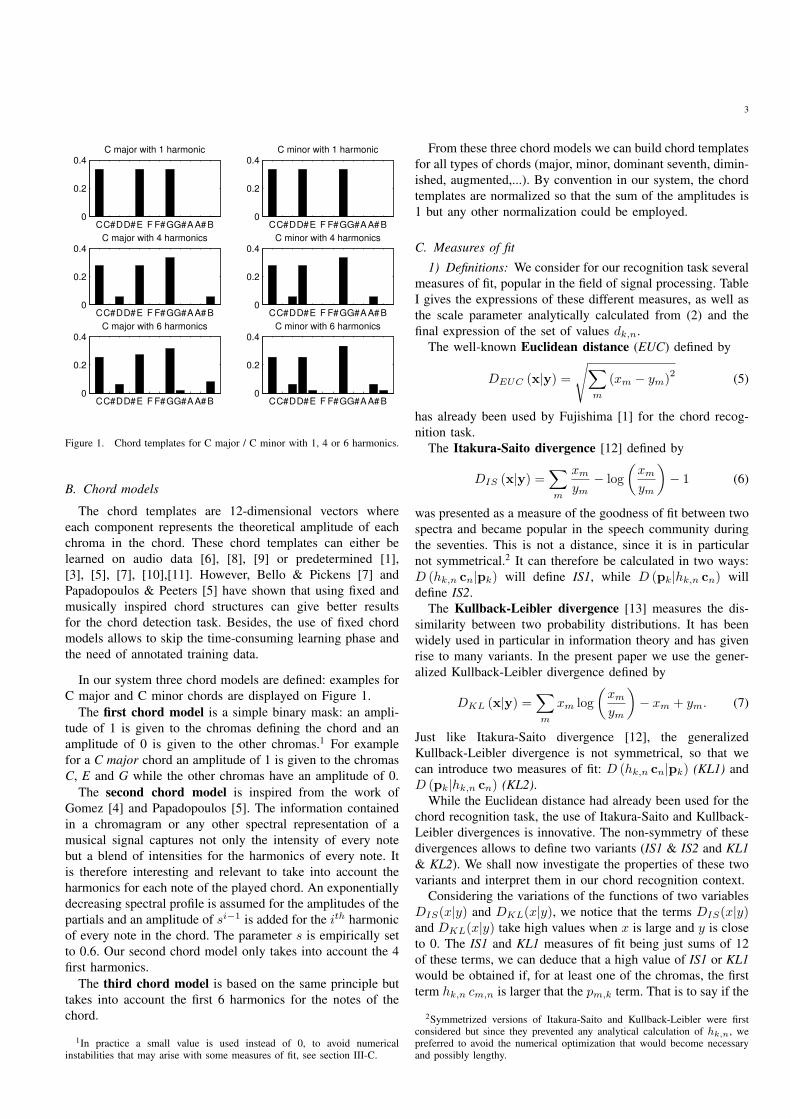
Figure 2. Statistics on the Beatles and the MIDI corpus: distribution of thechord types as percentage of the total duration.
has been widely used in image processing and is particularly
efficient to correct random errors. Furthermore, this filtering
has the property of respecting transitions.
In every case, the detected chord kn on frame n is the one
that minimizes the set of values{
dk,n
}
k:
kn = argmink
dk,n (10)
IV. EVALUATION AND CORPUS
A. Beatles corpus
Our first evaluation database is made of the 13 Beatles
albums (180 songs, PCM 44100 Hz, 16 bits, mono). This
database is in particular the one used in MIREX 08 for the
Audio Chord Detection task [17]. The evaluation is realized
thanks to the chord annotations of the 13 Beatles albums
kindly provided by Harte and Sandler [18]. In these annotation
files, 17 types of chords are present (maj, dim, aug, maj7, 7,
dim7, hdim7, maj6, 9, maj9, sus4, sus2, min, min7, minmaj7,
min6, min9) and one ‘no chord’ label (N) corresponding to
silences or untuned material. The alignment between annota-
tions and wave files are done with the algorithm provided by
Christopher Harte.
Figure 2 represents the distribution of the durations of the
different chord types on the Beatles corpus. The most common
chord types in the corpus are major, minor, dominant seventh,
ground truth :
transcription :
overlap :
Overlap Score = 3+4
10= 0.70
C major A minor
C major F major A minor
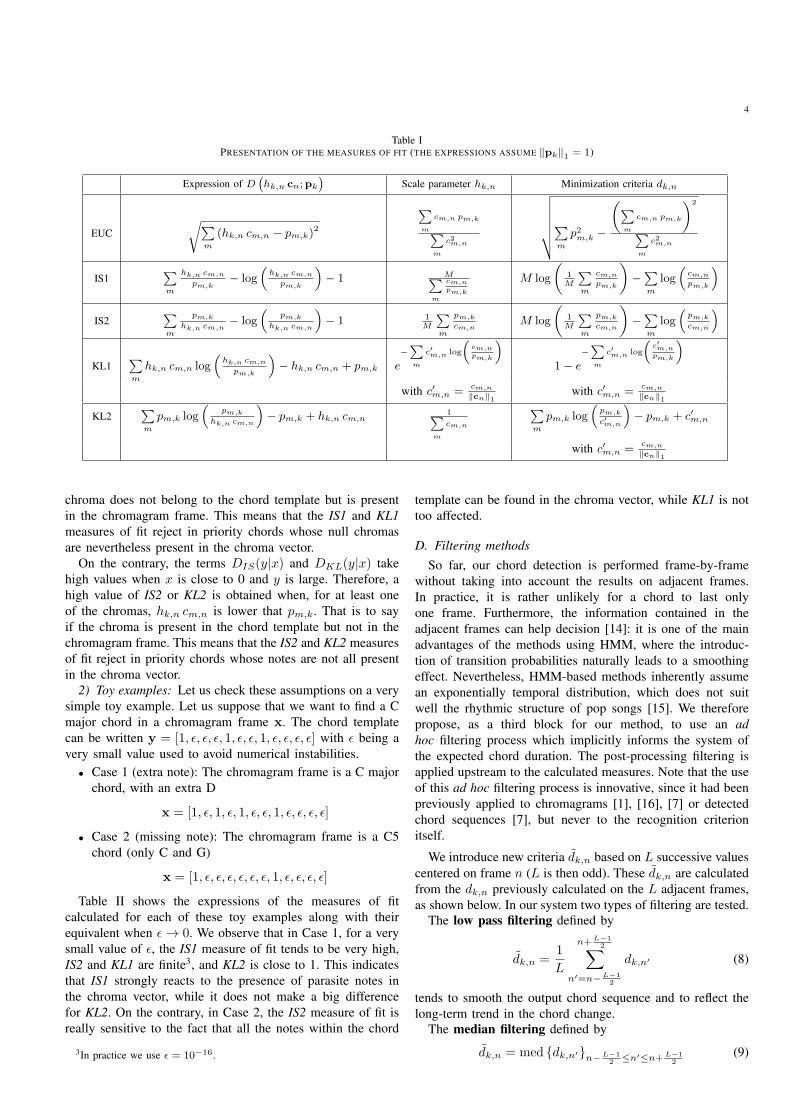
Figure 3. Example of calculation of an Overlap Score.
‘no chord’ states, minor seventh and ninth. Any other chord
type represents less than 1% of the total duration.
B. QUAERO corpus
The second corpus was provided to us within the QUAERO
project4. It consists of 20 real audio songs annotated by
IRCAM (PCM 22050 Hz, 16 bits, mono) from various artists
(Pink Floyd, Queen, Buenavista Social Club, Dusty Spring-
field, Aerosmith, Shack, UB40, Fall Out Boy, Nelly Furtado,
Justin Timberlake, Mariah Carey, Abba, Cher, Phil Collins,
Santa Esmeralda, Sweet, FR David and Enya) and various
genres (pop, rock, electro, salsa, disco,...). The corpus only
contains major (88%), minor (10.7%) and ‘no chord’ (1.3%)
labels.
C. MIDI corpus
Our third evaluation database is composed of 12 songs from
various artists in different genres (blues, country, pop and
rock). The audio files (PCM 44100 Hz, 16 bits, mono) are
synthesized from MIDI files5 using the free software Timidity
++.6 Timidity ++ is a software synthesizer which can generate
realistic audio data from MIDI files using a sample-based
synthesis method. We have manually annotated the songs: 5
types of chords are present (maj, min, 7, sus2, sus4) as well
as the ‘no chord’ label (N). The distribution of the durations
of the different chord types on the MIDI corpus is displayed
on Figure 2.
D. Evaluation method
The evaluation method used in this paper corresponds to the
one used in MIREX 08 for the Audio Chord Detection task.
This evaluation protocol only takes into account major and
minor chord types. The 17 types of chords present in the
4QUAERO project : http://www.quaero.org5The MIDI files were obtained on http://www.mididb.com6The software is freely downloadable on http://timidity.sourceforge.net

6
Chromagram of ’Eight days a week’
time (s)0 20 40 60 80 100 120 140 160
C
C#/Db
D
D#/Eb
E
F
F#/Gb
G
G#/Ab
A
A#/Bb
B
Chord transcription of ’Eight days a week’
time (s)0 20 40 60 80 100 120 140 160
CC#/Db
DD#/Eb
EF
F#/GbG
G#/AbA
A#/BbB
CmC#/Dbm
DmD#/Ebm
EmFm
F#/GbmGm
G#/AbmAm
A#/BbmBmN/A
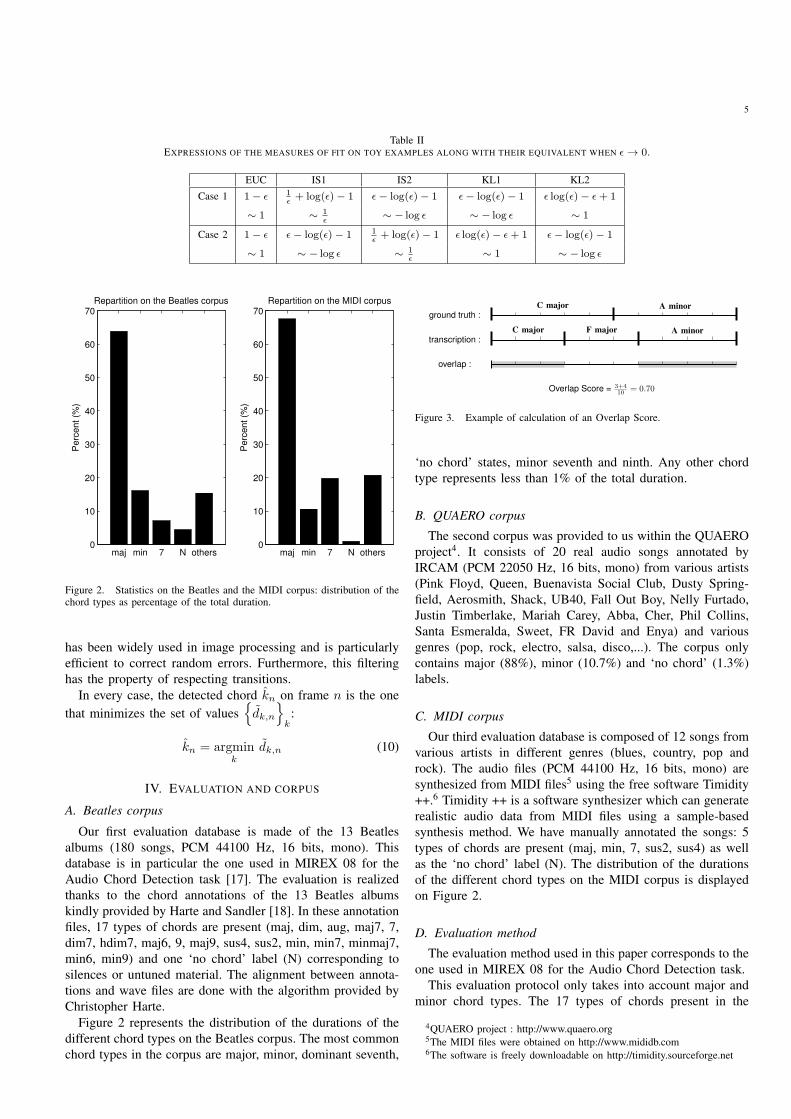
Figure 4. Chromagram and chord transcription for the song Eight days a week by The Beatles. At the bottom the estimated chord labels are in black whilethe ground-truth chord annotation is in gray.
annotation files are therefore first mapped into major and
minor types following these rules:
• major: maj, dim, aug, maj7, 7, dim7, hdim7, maj6, 9,
maj9, sus4, sus2
• minor: min, min7, minmaj7, min6, min9
For the systems detecting more chord types (dominant
seventh, diminished, etc.), once the chords have been detected
with their appropriate models, they are then mapped to the ma-
jor and minor following the same rules than for the annotation
files.
An Overlap Score (OS) is calculated for each song as the
ratio between the lengths of the correctly analyzed chords and
the total length of the song. We define for the Beatles corpus an
Average Overlap Score (AOS) which is obtained by averaging
the Overlap Scores of all the 180 songs of the corpus. An
example of calculation of an Overlap Score is presented on
Figure 3.
E. Input features
Based on preliminary experiments we chose among three
types of chromagram [7], [16], [19], the one proposed by Bello
& Pickens [7], which appeared to give the best results for our
chord transcription task. The Constant-Q Transform [2] allow-
ing a frequency analysis on bins centered on logarithmically
spaced frequencies is used. The center frequency fk of the kth
bin is indeed defined as:
fk = 2kb fmin, (11)
where b represents the number of bins per octave and fmin
the frequency where the analysis starts.
The signal is first downsampled to 5512.5 Hz and the CQ-
Transform is calculated with b = 36 (3 bins per semi-tone),
between frequencies 73.42 Hz (D2) and 587.36 Hz (D5).
These parameters lead to a window length of 4096 samples
and the hop size is set to 512 samples.
Thanks to the 36 bins per octave resolution, a tuning
algorithm [3] can be used. After a pick detection in the
chromagram, a correction factor is calculated so as to take into
account the detuning. A median filtering is finally applied in
order to eliminate too sharp transitions (8 frames).
Some details about the calculation of the chromagram can
be found in [7]. We used the code kindly provided by the
authors. The silence (‘no chord’) detection is done by an
empirically set threshold on the energy of the chroma vectors.
An example of chromagram and chord transcription is
displayed on Figure 4.
V. RESULTS ON THE AUDIO CORPUS
The previously described five measures of fit (EUC, IS1,
IS2, KL1 and KL2), three chord models (1, 4 or 6 harmon-
ics) and two filtering methods (low-pass and median) with
neighborhood sizes from L = 1 to L = 25 are tested. These
375 parameter sets can be seen as so many chord recognition
systems. We now investigate the systems giving the best results
on the Beatles corpus.
7
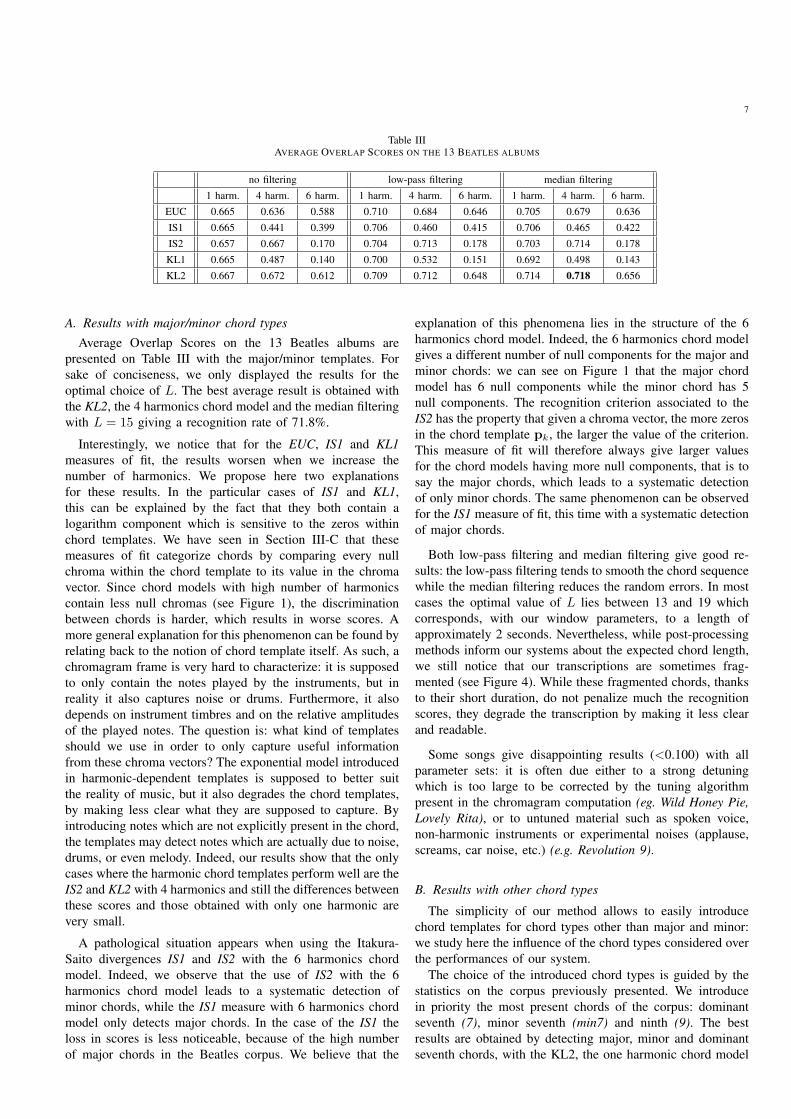
Table IIIAVERAGE OVERLAP SCORES ON THE 13 BEATLES ALBUMS
no filtering low-pass filtering median filtering
1 harm. 4 harm. 6 harm. 1 harm. 4 harm. 6 harm. 1 harm. 4 harm. 6 harm.
EUC 0.665 0.636 0.588 0.710 0.684 0.646 0.705 0.679 0.636
IS1 0.665 0.441 0.399 0.706 0.460 0.415 0.706 0.465 0.422
IS2 0.657 0.667 0.170 0.704 0.713 0.178 0.703 0.714 0.178
KL1 0.665 0.487 0.140 0.700 0.532 0.151 0.692 0.498 0.143
KL2 0.667 0.672 0.612 0.709 0.712 0.648 0.714 0.718 0.656
A. Results with major/minor chord types
Average Overlap Scores on the 13 Beatles albums are
presented on Table III with the major/minor templates. For
sake of conciseness, we only displayed the results for the
optimal choice of L. The best average result is obtained with
the KL2, the 4 harmonics chord model and the median filtering
with L = 15 giving a recognition rate of 71.8%.
Interestingly, we notice that for the EUC, IS1 and KL1
measures of fit, the results worsen when we increase the
number of harmonics. We propose here two explanations
for these results. In the particular cases of IS1 and KL1,
this can be explained by the fact that they both contain a
logarithm component which is sensitive to the zeros within
chord templates. We have seen in Section III-C that these
measures of fit categorize chords by comparing every null
chroma within the chord template to its value in the chroma
vector. Since chord models with high number of harmonics
contain less null chromas (see Figure 1), the discrimination
between chords is harder, which results in worse scores. A
more general explanation for this phenomenon can be found by
relating back to the notion of chord template itself. As such, a
chromagram frame is very hard to characterize: it is supposed
to only contain the notes played by the instruments, but in
reality it also captures noise or drums. Furthermore, it also
depends on instrument timbres and on the relative amplitudes
of the played notes. The question is: what kind of templates
should we use in order to only capture useful information
from these chroma vectors? The exponential model introduced
in harmonic-dependent templates is supposed to better suit
the reality of music, but it also degrades the chord templates,
by making less clear what they are supposed to capture. By
introducing notes which are not explicitly present in the chord,
the templates may detect notes which are actually due to noise,
drums, or even melody. Indeed, our results show that the only
cases where the harmonic chord templates perform well are the
IS2 and KL2 with 4 harmonics and still the differences between
these scores and those obtained with only one harmonic are
very small.
A pathological situation appears when using the Itakura-
Saito divergences IS1 and IS2 with the 6 harmonics chord
model. Indeed, we observe that the use of IS2 with the 6
harmonics chord model leads to a systematic detection of
minor chords, while the IS1 measure with 6 harmonics chord
model only detects major chords. In the case of the IS1 the
loss in scores is less noticeable, because of the high number
of major chords in the Beatles corpus. We believe that the
explanation of this phenomena lies in the structure of the 6
harmonics chord model. Indeed, the 6 harmonics chord model
gives a different number of null components for the major and
minor chords: we can see on Figure 1 that the major chord
model has 6 null components while the minor chord has 5
null components. The recognition criterion associated to the
IS2 has the property that given a chroma vector, the more zeros
in the chord template pk, the larger the value of the criterion.
This measure of fit will therefore always give larger values
for the chord models having more null components, that is to
say the major chords, which leads to a systematic detection
of only minor chords. The same phenomenon can be observed
for the IS1 measure of fit, this time with a systematic detection
of major chords.
Both low-pass filtering and median filtering give good re-
sults: the low-pass filtering tends to smooth the chord sequence
while the median filtering reduces the random errors. In most
cases the optimal value of L lies between 13 and 19 which
corresponds, with our window parameters, to a length of
approximately 2 seconds. Nevertheless, while post-processing
methods inform our systems about the expected chord length,
we still notice that our transcriptions are sometimes frag-
mented (see Figure 4). While these fragmented chords, thanks
to their short duration, do not penalize much the recognition
scores, they degrade the transcription by making it less clear
and readable.
Some songs give disappointing results (<0.100) with all
parameter sets: it is often due either to a strong detuning
which is too large to be corrected by the tuning algorithm
present in the chromagram computation (eg. Wild Honey Pie,
Lovely Rita), or to untuned material such as spoken voice,
non-harmonic instruments or experimental noises (applause,
screams, car noise, etc.) (e.g. Revolution 9).
B. Results with other chord types
The simplicity of our method allows to easily introduce
chord templates for chord types other than major and minor:
we study here the influence of the chord types considered over
the performances of our system.
The choice of the introduced chord types is guided by the
statistics on the corpus previously presented. We introduce
in priority the most present chords of the corpus: dominant
seventh (7), minor seventh (min7) and ninth (9). The best
results are obtained by detecting major, minor and dominant
seventh chords, with the KL2, the one harmonic chord model
8
and the median filtering with L = 17 giving a recognition
rate of 72.4%. The introduction of dominant seventh chords,
which are very present in the Beatles corpus, clearly enhances
the results. Yet, these results should be tempered: indeed, when
our Maj-Min-7 method detects a chord as dominant seventh,
it is right in only 9.2% of the cases. Most of the time (53.8%)
the ground-truth chord is in reality the associated major chord.
The dominant seventh template therefore helps the detection
of major chords. It means that often, when our Maj-Min-7
gives better results that our Maj-Min method, it is due to the
detection of major chords which would not have been detected
with the Maj-Min method.
The introduction of more chord types which are less present
(minor seventh, ninth) degrades the results (70.6% for Maj-
Min-7-Min7 and 70.6% for Maj-Min-7-Min7-9). Indeed, the
introduction of a model for a new chord type gives a better
detection for chords of this type but also leads to new errors
such as false detections. Therefore only frequent chord types
should be introduced, ensuring that the enhancement caused
by the better recognition of these chord types is larger than
the degradation of the results caused by the false detections.
C. Comparison with the state-of-the-art
Our method is now compared to the following methods that
entered MIREX 08.
Bello & Pickens (BP) [7] use 24-states HMM with musi-
cally inspired initializations, Gaussian observation probability
distributions and EM-training for the initial state distribution
and the state transition matrix.
Ryynanen & Klapuri (RK) [8] use 24-states HMM with
observation probability distributions computed by comparing
low and high-register profiles with some trained chord profiles.
EM-training is used for the initial state distribution and the
state transition matrix.
Khadkevich & Omologo (KO) [20] use 24 HMMs: one
for every chord. The observation probability distributions are
Gaussian mixtures and all the parameters are trained through
EM.
Pauwels, Verewyck & Martens (PVM) [21] use a proba-
bilistic framework derived from Lerdahl’s tonal distance metric
for the joint tasks of chords and key recognition.
These methods have been tested with their original imple-
mentations and evaluated with the same protocol (AOS). We
tested the methods on the Beatles and Quaero corpus. Results
of this comparison with the state-of-the-art are presented on
Table IV.
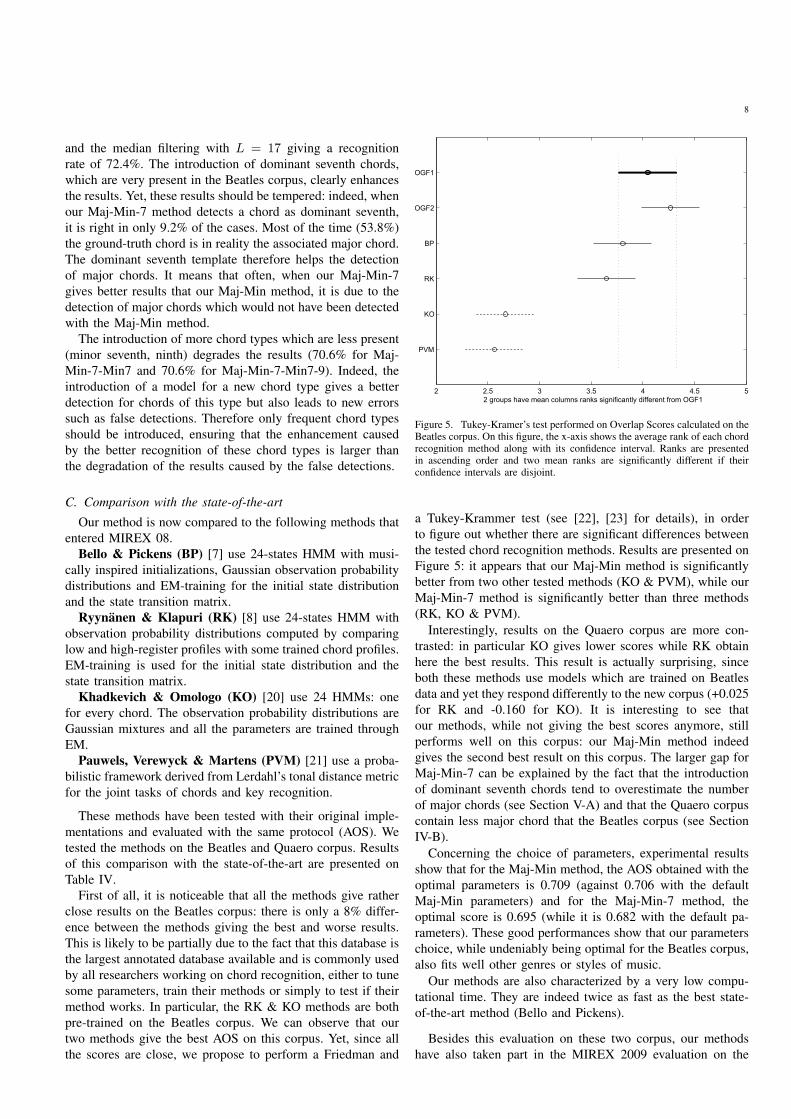
First of all, it is noticeable that all the methods give rather
close results on the Beatles corpus: there is only a 8% differ-
ence between the methods giving the best and worse results.
This is likely to be partially due to the fact that this database is
the largest annotated database available and is commonly used
by all researchers working on chord recognition, either to tune
some parameters, train their methods or simply to test if their
method works. In particular, the RK & KO methods are both
pre-trained on the Beatles corpus. We can observe that our
two methods give the best AOS on this corpus. Yet, since all
the scores are close, we propose to perform a Friedman and
Figure 5. Tukey-Kramer’s test performed on Overlap Scores calculated on theBeatles corpus. On this figure, the x-axis shows the average rank of each chordrecognition method along with its confidence interval. Ranks are presentedin ascending order and two mean ranks are significantly different if theirconfidence intervals are disjoint.
a Tukey-Krammer test (see [22], [23] for details), in order
to figure out whether there are significant differences between
the tested chord recognition methods. Results are presented on
Figure 5: it appears that our Maj-Min method is significantly
better from two other tested methods (KO & PVM), while our
Maj-Min-7 method is significantly better than three methods
(RK, KO & PVM).
Interestingly, results on the Quaero corpus are more con-
trasted: in particular KO gives lower scores while RK obtain
here the best results. This result is actually surprising, since
both these methods use models which are trained on Beatles
data and yet they respond differently to the new corpus (+0.025
for RK and -0.160 for KO). It is interesting to see that
our methods, while not giving the best scores anymore, still
performs well on this corpus: our Maj-Min method indeed
gives the second best result on this corpus. The larger gap for
Maj-Min-7 can be explained by the fact that the introduction
of dominant seventh chords tend to overestimate the number
of major chords (see Section V-A) and that the Quaero corpus
contain less major chord that the Beatles corpus (see Section
IV-B).
Concerning the choice of parameters, experimental results
show that for the Maj-Min method, the AOS obtained with the
optimal parameters is 0.709 (against 0.706 with the default
Maj-Min parameters) and for the Maj-Min-7 method, the
optimal score is 0.695 (while it is 0.682 with the default pa-
rameters). These good performances show that our parameters
choice, while undeniably being optimal for the Beatles corpus,
also fits well other genres or styles of music.
Our methods are also characterized by a very low compu-
tational time. They are indeed twice as fast as the best state-
of-the-art method (Bello and Pickens).
Besides this evaluation on these two corpus, our methods
have also taken part in the MIREX 2009 evaluation on the

9
Table IVCOMPARISON WITH THE STATE-OF-THE-ART
Beatles corpus Quaero corpus
AOS Time AOS Time
Our method (Maj-Min) 0.718 790s 0.706 95s
Our method (Maj-Min-7) 0.724 796s 0.682 97s
Bello & Pickens (BP) 0.707 1619s 0.699 261s
Ryynanen & Klapuri (RK) 0.705 2241s 0.730 350s
Khadkevich & Omologo (KO) 0.663 1668s 0.503 255s
Pauwels, Varewyck & Martens (PVM) 0.647 12402s 0.664 2684s
Audio Chord Detection task for the pre-trained systems [24].
The evaluation corpus was not only composed by the Beatles
songs but also 36 songs from Queen and Zweieck. While once
again the scores are very close, our Maj-Min-7 and Maj-Min
methods gave respectively the second and fourth best Average
Overlap Scores for the major-minor chord recognition task and
reached the first and second places for the root detection task.
The trained systems gave better scores that pre-trained systems
but also our Maj-Min-7 method gives the same score for the
root detection than the best trained system [25] (using SVM
classifiers): this shows that it is really hard to draw conclusions
on the influence of training.
D. Analysis of the errors
In most chord transcription systems, the errors are often
caused by the harmonic proximity or the structural similarity
(common notes) between the real chord and the wrongly
detected chord.
Harmonic proximity
Errors can be caused by the harmonic proximity between
the original and the detected chord, that is to say chords
which have a particular relationship involving harmony, key,
etc. Figure 6 pictures the doubly nested circle of fifths which
represents the major chords (capital letters), the minor chords
(lower-case letters) and their harmonic relationships. The
distance linking two chords on this doubly nested circle of
fifths is an indication of their harmonic proximity. Given a
major or minor chord, the 4 closest chords on this circle are
the relative (submediant), mediant, subdominant and dominant.
Structural similarity
Two chords are also likely to be mistaken one for another
when they look alike, that is to say, when they share notes
(especially in template-based systems). Given a major or minor
chord, there are 3 chords which have 2 notes in common with
this chord: the parallel minor/major, the relative minor/major
(or submediant) and the mediant chord. Note that these 2
last chords are also harmonically close to the original chord.
These types of errors are very likely to occur in template-
based methods, which does not extract harmonic structure
information from the music piece.
We have therefore brought out 5 potential sources of errors
among the 23 possible ones (i.e., the 23 other wrong can-
didates for one reference chord). Some of these errors seem
specific to the template-based systems, while the others seem
to apply to every chord recognition system. Examples of these
Figure 6. Doubly nested circle of fifths [7].
Table VPARTICULAR RELATIONSHIPS BETWEEN CHORDS AND POTENTIAL
SOURCES OF ERRORS: EXAMPLES FOR C MAJOR AND C MINOR CHORDS
Reference chord C Cm
parallel Cm C
relative (submediant) Am A♭
mediant Em E♭
subdominant F Fm
dominant G Gm
potential sources of errors for C major and C minor chords
are displayed on Table V.
Figure 7 displays the distribution of these error types as a
percentage of the total number of errors for every evaluated
method. Errors due to the bad detection of the ‘no chord’ states
are represented with the ‘no chord’ label.
The main sources of errors correspond to the situations
previously described and to the errors caused by silences (‘no
chord’). Actually, in most methods, the 5 types of errors
previously considered (over the 23 possible ones) represent
more than half of the errors.
As expected, our methods have the largest parallel errors
percentage (with the exception of the RK method), which is
probably due to the fact that we work with chord templates
and therefore do not detect any harmonic features such as
key, harmony, chord vocabulary, etc. Furthermore, for our
methods (and the RK method), the percentages of errors due
to structural similarity and harmonic proximity are the same,
while for all other tested methods, the proportion of harmonic
proximity errors is larger. This is actually very surprising that
the method proposed by Ryynanen & Klapuri has a error
distribution very close to our Maj-Min method, while being
based on training.

10
20%
12%
11%
8%12%
8%
29%
Measures minimization (maj−min)
21%
5%
7%
8%
14%9%
38%
Measures minimization (maj−min−7)
11%
17%
11%
8%15%
9%
29%
Bello & Pickens
21%
10%
14%
11%
10%
6%
27%
Ryynänen & Klapuri
10%
6%
8%
8%
9%
10%
50%
Khadkevich & Omologo
6%
8%
8%
11%
13%24%
30%
Pauwels, Varewyck & Martens
parallels
relatives
mediants
subdominants
dominants
no chord
others
Figure 7. Distribution of the errors as a percentage of the total number of errors.
Among interesting results, one can notice that the intro-
duction of the dominant seventh chords clearly reduces the
proportion of the errors due to relative (submediant) and
mediant (-11%).
Finally, Pauwels, Varewyck & Martens’ system is clearly
mostly penalized by the wrong detection of the ‘no chord’
states, when Khadkevich & Omologo’s method produces a
uniformly distributed range of errors.
VI. RESULTS ON THE MIDI CORPUS
We now use the two sets of parameters described in the
previous section for the Maj-Min (KL2, 4 harmonics, median
filtering with L = 15) and the Maj-Min-7 (KL2, 1 harmonic,
median filtering with L = 17) chord detection systems on the
MIDI corpus.
A. Influence of the music genre
Table VI shows the Overlap Scores for the 12 songs of
the MIDI corpus for the Maj-Min and the Maj-Min-7 chord
recognition methods. Besides the results obtained with the
default parameters, we also displayed the results with the
optimal parameters in order to evaluate the fitness of our
default parameters.
The first thing we can observe is that the scores obtained
with the default parameters are rather close to the best ones.
This shows that the parameters we deduced from the Beatles
corpus can be used in a more general context.
We can also see that the scores are all creditable. This
can surely be explained by the fact that we work here with
resynthesized wave files and not real audio. These audio
files are indeed generated with instrument patterns which
contain less noise and untuned material than real instrument
recordings.
Genre does not seem to have an influence on the scores.
Nevertheless, the scores obtained on country songs are partic-
ularly large, but it is probably due to the very simple chord
structures of these songs (mainly alternation of 3 chords).
B. Influence of the percussive noise
Our method strongly relies on the chromagram, that is to
say a harmonic representation of the music. It can therefore be
thought that inharmonic components of the music, for example
drums, tend to add noise to the chromagram, which can lead
to errors in the chord detection.
Working with audio data computed from MIDI files gives
us the chance to synthesize them without the percussive parts.
Indeed, the software Timidity ++ allows to mute one channel
(instrument) for the wave-synthesis of the MIDI file.
The same simulations have been performed with these
drum-free audio files. The removal of the percussions does not
improve significantly the Overlap Scores. Indeed, the average
score improvement is only 0.8% as well with the Maj-Min
system than with the Maj-Min-7. We believe that the noise
contained in the chromagram, which lead to errors, is not only
due to drums but also, for example, to the melody itself, since
it does not only play notes contained in the chord pattern.
C. Beat synchronous chord detection
The filtering process we have been using so far has a
fixed length predetermined by the system parameters. It seems
interesting to introduce beat information either in the chroma-
gram computation or in the recognition criteria. For our tests
we used the beat-detection algorithm provided by Davies &
Plumbley [26].
The first way to take into account the beat information
is to compute a beat-synchronous chromagram, that is to

11
Table VIOVERLAP SCORE FOR THE 12 SONGS OF THE MIDI CORPUS
Maj-Min Maj-Min-7
Song title Default Optimal Default Optimal
Country
Ring of fire (Johnny Cash) 0.844 0.918 0.848 0.924
Tennessee waltz (Roy Acuff) 0.941 0.955 0.949 0.955
Stand by your man (Tammy Wynette) 0.895 0.909 0.902 0.911
Pop
Dancing queen (ABBA) 0.786 0.804 0.728 0.782
I drove all night (Cyndi Lauper) 0.870 0.891 0.856 0.889
Born to make you happy (Britney Spears) 0.867 0.892 0.861 0.892
Blues
Blues stay away from me (The Delmore Brothers) 0.630 0.791 0.854 0.912
Boom, boom, boom (John Lee Hooker) 0.839 0.903 0.876 0.913
Keep it to yourself (Sonny Boy Williamson) 0.771 0.909 0.907 0.928
Rock
Twist and shout (The Beatles) 0.827 0.892 0.850 0.901
Let it be (The Beatles) 0.835 0.876 0.876 0.880
Help ! (The Beatles) 0.918 0.920 0.899 0.918
say averaging the chromagram over the number of frames
representing a beat time. This process has already been used
by Bello & Pickens [7]. Yet this does not improve the results:
comparing the best results obtained with the usual chromagram
and those obtained with the beat-synchronous one, it appears
that the average degradation is -6% for the Maj-Min and -7%
for the Maj-Min-7 system.
The second way to integrate this information is to filter the
recognition criteria (either with the low-pass or the median
filtering method) with a neighborhood size equal to the beat
time. Even if the degradation is lower than with the beat-
synchronous chromagram, the results are also penalized: the
average degradation is -2% for the Maj-Min and the -4% for
the Maj-Min-7 system.
We believe that these disappointing results are probably
due to the fact that the beat detection does not take into
account the distinction between on-beats and off-beats. Indeed,
the chord change tend to occur mainly on the on-beats and
not on every beat. Averaging either the chromagram or the
recognition criteria on every beat does not really capture the
rhythmic information.
VII. CONCLUSION
In this paper we have presented a fast and efficient chord
recognition method. The main innovative idea is the joint use
of popular measures which had never been considered for this
task and filtering methods taking advantage of time persis-
tence. The decoupling of various stages of the chord template
matching process enables to achieve high effectiveness in less
time. Our system also offers a novel perspective about chord
detection, which distinguishes from the predominant HMM-
based approaches.
Since our method is only based on the chromagram no
information about style, rhythm or instruments is needed so
that our recognition system would work with any type of
music. Furthermore we do not require any training on any
database, which enables the computation time to be kept really
low.
ACKNOWLEDGMENT
The authors would like to thank J. Bello, M. Khadkevich, J.
Pauwels, M. Ryynanen and M. Davies for making their code
available. We also wish to thank C. Harte for his very useful
annotation files.
This work was partly supported by the Quaero Programme,
funded by OSEO, French State agency for innovation.
REFERENCES
[1] T. Fujishima, “Realtime chord recognition of musical sound: a systemusing Common Lisp Music,” in Proceedings of the International Com-
puter Music Conference (ICMC), Beijing, China, 1999, pp. 464–467.
[2] J. Brown, “Calculation of a constant Q spectral transform,” Journal of
the Acoustical Society of America, vol. 89, no. 1, pp. 425–434, 1991.
[3] C. Harte and M. Sandler, “Automatic chord identification using a quan-tised chromagram,” in Proceedings of the Audio Engineering Society
Convention, Barcelona, Spain, 2005.
[4] E. Gomez, “Tonal description of polyphonic audio for music contentprocessing,” INFORMS Journal on Computing, vol. 18, no. 3, pp. 294–304, 2006.
[5] H. Papadopoulos and G. Peeters, “Large-scale study of chord estimationalgorithms based on chroma representation and HMM,” in Proceedings
of the International Workshop on Content-Based Multimedia Indexing,Bordeaux, France, 2007, pp. 53–60.
[6] A. Sheh and D. Ellis, “Chord segmentation and recognition using EM-trained hidden Markov models,” in Proceedings of the International
Conference on Music Information Retrieval (ISMIR), Baltimore, MD,2003, pp. 185–191.
[7] J. Bello and J. Pickens, “A robust mid-level representation for harmoniccontent in music signals,” in Proceedings of the International Conference
on Music Information Retrieval (ISMIR), London, UK, 2005, pp. 304–311.
[8] M. Ryynanen and A. Klapuri, “Automatic transcription of melody, bassline, and chords in polyphonic music,” Computer Music Journal, vol. 32,no. 3, pp. 72–86, 2008.
[9] K. Lee and M. Slaney, “Acoustic chord transcription and key extractionfrom audio using key-dependent HMMs trained on synthesized audio,”IEEE Transactions on Audio, Speech and Language Processing, vol. 16,no. 2, pp. 291–301, 2008.
[10] K. Lee, “Automatic chord recognition from audio using enhanced pitchclass profile,” in Proceedings of the International Computer Music
Conference (ICMC), New Orleans, USA, 2006.
[11] B. Pardo and W. Birmingham, “Algorithms for chordal analysis,” Com-
puter Music Journal, vol. 26, no. 2, pp. 27–49, 2002.
[12] F. Itakura and S. Saito, “Analysis synthesis telephony based on themaximum likelihood method,” in Proceedings of the International
Congress on Acoustics, Tokyo, Japan, 1968, pp. 17–20.
[13] S. Kullback and R. Leibler, “On information and sufficiency,” Annals of
Mathematical Statistics, vol. 22, no. 1, pp. 79–86, 1951.

12
[14] A. Shenoy, R. Mohapatra, and Y. Wang, “Key determination of acousticmusical signals,” in Proceedings of the IEEE International Conference
on Multimedia and Expo (ICME), Taipei, Taiwan, 2004, pp. 1771–1774.[15] M. Mauch and S. Dixon, “A discrete mixture model for chord labelling,”
in Proceedings of the International Conference on Music Information
Retrieval (ISMIR), Philadelphia, USA, 2008, pp. 45–50.[16] G. Peeters, “Musical key estimation of audio signal based on hidden
Markov modeling of chroma vectors,” in Proceedings of the Interna-
tional Conference on Digital Audio Effects (DAFx), Montreal, Canada,2006, pp. 127–131.
[17] http://www.music-ir.org/mirex/wiki/2008:Audio Chord Detection.[18] C. Harte, M. Sandler, S. Abdallah, and E. Gomez, “Symbolic repre-
sentation of musical chords: A proposed syntax for text annotations,”in Proceedings of the International Conference on Music Information
Retrieval (ISMIR), London, UK, 2005, pp. 66–71.[19] Y. Zhu, M. Kankanhalli, and S. Gao, “Music key detection for musical
audio,” in Proceedings of the International Conference on Multimedia
Modeling (MMM), Melbourne, Australia, 2005, pp. 30–37.[20] M. Khadkevich and M. Omologo, “Mirex audio chord de-
tection,” Abstract of the Music Information Retrieval Evalua-tion Exchange, 2008, http://www.music-ir.org/mirex/abstracts/2008/khadkevich omologo final.pdf.
[21] J. Pauwels, M. Varewyck, and J.-P. Martens, “Audio chordextraction using a probabilistic model,” Abstract of theMusic Information Retrieval Evaluation Exchange, 2008,http://www.music-ir.org/mirex/abstracts/2008/mirex2008-audio chorddetection-ghent university-johan pauwels.pdf.
[22] J. Tukey, “The problem of multiple comparisons,” In the CollectedWorks of John W. Tukey VIII. Multiple comparisons: 1948-1983 1-300.Chapmall and Hall, New York., 1953, unpublished manuscript.
[23] C. Kramer, “Extension of multiple range tests to group means withunequal number of replications,” Biometrics, vol. 12, no. 3, pp. 307–310, 1956.
[24] http://www.music-ir.org/mirex/wiki/2009:Audio Chord Detection.[25] A. Weller, D. Ellis, and T. Jebara, “Structured prediction models for
chord transcriptino of music audio,” Abstract of the Music InformationRetrieval Evaluation Exchange, 2009, http://www.music-ir.org/mirex/abstracts/2009/WEJ.pdf.
[26] M. Davies and M. Plumbley, “Context-dependent beat tracking ofmusical audio,” IEEE Transactions on Audio, Speech and Language
Processing, vol. 15, no. 3, pp. 1009–1020, 2007.
Laurent Oudre (M’10) was born in France in 1985.He graduated from Supelec, Gif-sur-Yvette, Francein 2007 and received the M.Sc. degree in Commu-nications and Signal Processing at Imperial CollegeLondon, UK in 2007. He received his Ph.D. degreein Signal Processing at TELECOM ParisTech, Paris,France in 2010. Since November 2010, he is apost-doctoral researcher in statistics at TELECOMParisTech, Paris, France.
His research interests forcus on signal processingand its applications (sound and image).
Cedric Fevotte (M’09) obtained the State Engi-neering degree and the MSc degree in Control andComputer Science from Ecole Centrale de Nantes(France) in 2000, and then the PhD degree fromEcole Centrale de Nantes in 2003. As a PhD studenthe was with the Signal Processing Group at Institutde Recherche en Communication et Cybernetiquede Nantes where he worked on time-frequency ap-proaches to blind source separation. From 2003 to2006 he was a research associate with the SignalProcessing Laboratory at University of Cambridge
(Engineering Dept) where he got acquainted with Bayesian approaches toaudio signal processing tasks such as audio source separation and denoising.He was then a research engineer with the start-up company Mist-Technologies(now Audionamix) in Paris, working on mono/stereo to 5.1 surround soundupmix solutions. In Mar. 2007, he joined TELECOM ParisTech, first as aresearch associate and then as a CNRS tenured research scientist in Nov.2007.
His research interests generally concern statistical signal processing andunsupervised machine learning with audio applications.
Yves Grenier (M’81) Yves Grenier was born inHam, Somme, France, in 1950. He received theIngenieur degree from Ecole Centrale de Paris,in 1972, the Docteur-Ingenieur degree from EcoleNationale Superieure des Telecommunications (nowcalled Telecom ParisTech), Paris, in 1977, and theDoctorat d’Etat es Sciences Physiques, from Univer-sity of Paris-Sud in 1984.
He has been with Telecom ParisTech since 1977,as Assistant Professor, and since 1984 as Professor.He has been Head of the Signal and Image Process-
ing Department since january 2005.From 1974 to 1979, his interests have been in speech recognition, speaker
identification and speaker adaptation of recognition systems. Between 1979and 1988, he has been working on signal modeling, spectral analysis of noisysignals, with applications to speech recognition and synthesis, estimation ofnonstationary models, time frequency representations. He created ARMALIB,a signal processing software library that has been incorporated in SIMPA, thesignal processing software proposed by GDR-PRC CNRS ISIS.
Since 1988, his research has been devoted to multichannel signal process-ing: beamforming, source localisation, source separation. He concentrated inparticular on applications to audio and acoustics, and to microphone arrays.During this period, he has been involved in European ESPRIT projects (2101ARS from 1989 to 1992, 6166 FREETEL from 1992 to 1994).
Since 1996, he has been interested in audio signal processing (acousticecho cancellation, noise reduction, signal separation, microphone arrays,loudspeaker arrays) and in music information retrieval (multi-pitch estimation,chord recognition). He participated to the European project K-Space. He isnow participating to: the European NoE 3D-Life, the French-German Quaeroproject, and the French project Romeo, among others.
He has been co-chairman of the ”10th International workshop on acousticecho and noise control” IWAENC 2006. He has been technical co-chair ofthe ”2010 IEEE International Workshop on Multimedia Signal Processing”MMSP 2010.