christianna s. williams group presentation… · christianna s. williams abt associates inc,...
TRANSCRIPT

An Applied IntroductionChristianna S. Williams
Abt Associates Inc, Durham, NC
Paper reprise presented at eSUG spring conference 2014
by
Niosha GunasekaraHealth Analytics Branch
Alberta Health23rd April 2014

Overview
• Introduction
• Define Survival Time and Censoring
• Example:
- Define Variables in SAS
- Apply a Univariate Survival Method:
Kaplan-Meier Analysis
- Apply a Multivariate method:
Cox Regression (a brief introduction)
• References

What is Survival Analysis?
Commonly used to evaluate time-to-event data in randomized clinical trials or cohort studies
Examples:
• How long will cancer patients survive after a specific treatment?
• How long will it take graduate students to finish their degrees?
• What factors influence when children reach developmentalmilestones?
Source: http://www.zeigler-hill.com/uploads/7/7/3/2/7732402/psy_512_survival_analysis.pdf
Survival analysis is a family of statistical methods designed to analyze duration data (i.e., time until the occurrence of any well-defined event)

Survival time: a variable that measures the time from a particular starting Point to a particular endpoint of interest
• Start of treatment Time of death
• Start of treatment Development of functional ability
• Time of marriage Birth of first child
Define Survival Time

Define Survival DATA
Sources: http://www.vosesoftware.com/ModelRiskHelp/index.htm#Analysing_and_using_data/Fitting_distributions/Censored_data.htm
• Survival Data rarely normally distributed (skewed most of the time)
Complete data value of each
sample unit is observed or
known.
Censored data time to the event of interest may not be observed or the exact time is not known.
know only the
maximum value
Interval Censored
lie between a certain
minimum and maximum
know only the
minimum value

Define CensoringCensor if the exact time at which the event occurs is not observed
Censor if a participant drop out or die

Example: Lachs & Williams et al. (1997)
• Research Question: Were mistreated older adults more likely to be
admitted to a Nursing Home (or admitted sooner) compared to
those who were not mistreated?
• Notes: Adult mistreatment in this study was treated as time
dependent covariates and defined based on exposure to either of
the following conditions
i) External cause of elder abuse
ii) Self neglect

Example• Used two survival methods:
1) Kaplan Meier analysis to compute the probability of NH admission as a function of time and compare differences in survival probabilities for gender and marital status
2) Cox regression analysis to examine the effect of many variables including time-dependent covariates on hazard function
Cohort: 2800 patients >65 yrs lived in New Haven, CN –
enrolled in a large study of aging in Feb 1982 – followed up
until Dec 1995

Example: Variables
• Study enrollment (basedate) : 1982-02-28 to 1982-12-31
• Study end date (endfwpdate) : 1995-12-31
• NH Admit indicator (nhadmit) : 0 or 1 indicator of whether the person had a NH admission during the follow up
• NH Admit date (nhpdate) : Date first admitted to a NH
• Death indicator (died) : 0 or 1 indicator of death during follow up
• Date of Death (deathdate) : Date that the person died
• Date Censored (censdate) : Date that an observation is censored
• Survival Time (eventdys) = (censdate) – (basedate)

Study enrollment (basedate) : 1982-12-31
Study end date (endfwpdate) : 1995-12-31
Admitted to a NH within the follow up period Censor=0censedate=nhdate
Patient died during the follow up Censor=1censdate= deathdate
Patient survived beyond follow up Censor=2censdate= endfwpdt
1 - Define Variables
Failed(censor=0)
Censored (censor=1 or 2)

2 – Create Variables using SAS
endfwpdate = MDY(12,31,1995);Study enrollment (basedate) : 1982-12-31
Study end date (endfwpdate) : 1995-12-31
Event Occurs Admitted to a NH within the follow up periodCensor=0censedate=nhdate
IF (nhadmit = 1) AND (basedate LE nhdate LE endfwpdt) THEN DO;censor = 0;censdate = nhdate ;END;
Patient died during the follow up Censor=1censdate= deathdate
ELSE IF (died = 1) AND (basedate LE deathdate LE endfwpdt) THEN DO;censor = 1;censdate = deathdate ;END;
Patient survived beyond follow up Censor=2censdate= endfwpdt
ELSE IF (died NE 1) OR (deathdate GT endfwpdt) then do;censor = 2;censdate = endfwpdt ;END;
** time on study -- baseline to nh admit/death/end of study ;eventdys = censdate - basedate ;

Kaplan-Meier survival curves
• Also known as product-limit formula and accounts for censoring
• Totally nonparametric. No assumptions about the underlying true distribution of failure times.
• Does not account for confounding or effect modification by other covariates
• Survival estimates can be unreliable toward the end of a study, when there are small numbers of subjects at risk of having an event
Peduzzi et al. Epidemiol Rev Vol. 24, No. 1, 2002

An example to show censored observations in a KM plot
Source: http://cancerguide.org/scurve_km.html
Events

3 – Plot Kaplan Meier Survival Curves
Syntax:
PROC LIFETEST DATA = em_nh1 METHOD=KM PLOTS=S CS=none;TIME eventdys*censor(1,2) ;TITLE1 FONT="Arial 10pt" HEIGHT=1 BOLD 'Kaplan-Meier Curve --overall';RUN;
PROC LIFETESTPlots the survival distribution function, using the Kaplan-Meier method.
tells SAS to create the Kaplanestimate survival plots
Specify data Tells SAS which method to use for life test procedure
tells SAS which values are censored
tells SAS the Survival time (event time) variable
Censor Symbol

3 – Examine KM Survival CurveSu
rviv
al P
rob
abili
ty D
istr
ibu
tio
n
Days from baseline to NH admission/Death/end-of-follow-up
The study didn’t last until the median survival time (i.e. fewer than half had been placed in a nursing home by the end of the study).

3 – SAS Output: Kaplan Meier Analysis
time = 0 days,
everyone is surviving.
Proportion surviving without an event
time = 4978 days, probability
of survival = 0.5256
* Censored observations
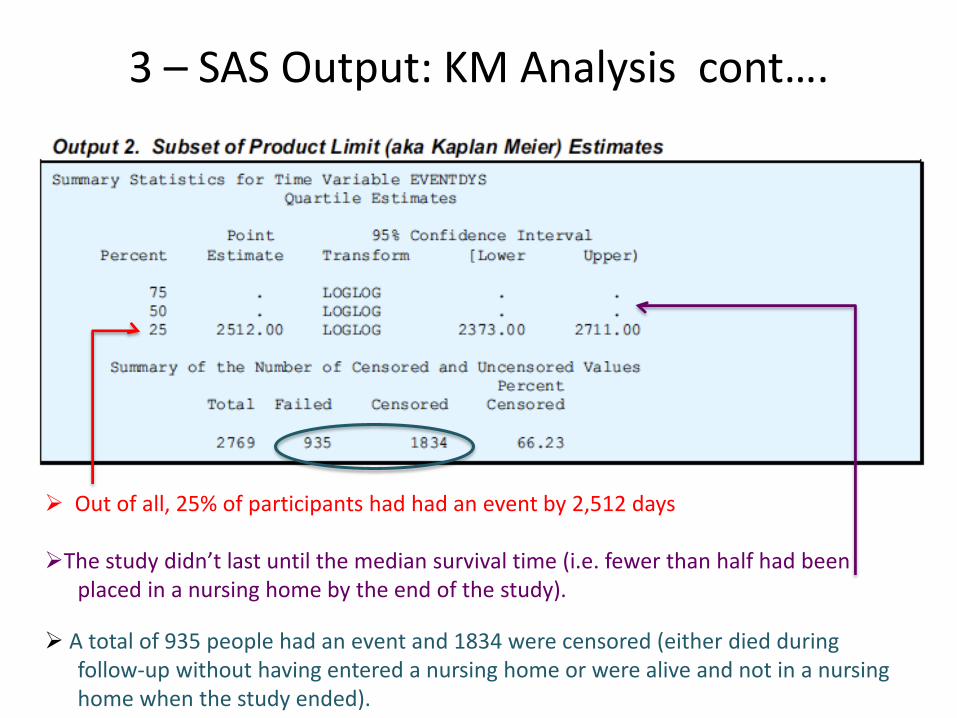
3 – SAS Output: KM Analysis cont….
Out of all, 25% of participants had had an event by 2,512 days
The study didn’t last until the median survival time (i.e. fewer than half had beenplaced in a nursing home by the end of the study).
A total of 935 people had an event and 1834 were censored (either died during follow-up without having entered a nursing home or were alive and not in a nursing home when the study ended).

4 – Add Strata to KM Analysis
Syntax:
PROC LIFETEST DATA = em_nh1 METHOD=KM PLOTS=S CS=NONE;TIME eventdys*censor(1,2) ;STRATA maried82 ;SYMBOL1 V=none COLOR=blue LINE=1;SYMBOL2 V=none COLOR=red LINE=2;RUN;
Formats Strata
Allow comparing survival probabilities for two groups (Married and Unmarried)

4 – Strata for a single dichotomous variableSu
rviv
al P
rob
abili
ty D
istr
ibu
tio
n
Days from baseline to NH admission/Death/end-of-follow-up

4 - Test of Equality over Strata
• Hypotheses:
Ho=> the risk of the groups are equal
Ha=> the risk of the groups are not equal
• The Wilcoxon test - more powerful in detecting differences earlier in follow up
• The Log-Rank test - more powerful in detecting differences later in follow up

5 – Cox Regression
PROC PHREG DATA = em_nh1 ;CLASS gender ;MODEL eventdys*censor(1,2) = gender age82 maried82 bmi82 cesd82 /RL;RUN;
Multivariate survival technique for time-to-event
data based on hazard function
Produces multivariate-adjusted hazard ratios
Can be used to account for time-dependent covariates if proportional hazard requirement is violated

5 – Coding and Testing for Time Dependent covariates using Cox Regression

5 – Coding and Testing for Time Dependent covariates
PROC PHREG DATA = em_nh1 ;CLASS GENDER ;MODEL eventdys*censor(1,2) = vems vsn gender age82 maried82 bmi82 cesd82 /RL TIES=EFRON;
Vems = Verified case of elder mistreatmentVsn = Verified case of self-neglect
SDED
Eventdays
vems = 1 (vsn=0
Vems = 0
Eventdays
1
2
Eventdays
3
Vsn = 1 (vesm=0)
4
Eventdays
IF (0 LE vemsdays LE eventdys) THEN DO;vems = 1;vsn = 0;END;ELSE vems = 0;
IF vems NE 1 THEN DO;IF (0 LE vslfdays LE eventdys) THEN vsn = 1;ELSE vsn = 0;END;RUN;
Vsn = 0

5 –Output : Time Dependent covariates

References• Allison, Paul D., Survival Analysis Using the SAS® System: A Practical Guide, Cary, NC:
SAS Institute Inc., 1995. 292 pp.
• Foley, D. J., A. M. Ostfeld, et al. (1992). "The risk of nursing home admission in three communities." JAging Health 4(2): 155-73.
• Gharibvand, L., Fernandez, G. (2008) "Advanced Statistical and Graphical features of SAS® PHREG” SAS Global Forum 2008 Proceedings http://www2.sas.com/proceedings/forum2008/375-2008.pdf
• Lachs, M. S., C. Williams, et al. (1997). "Risk factors for reported elder abuse and neglect: a nine-year observational cohort study." Gerontologist 37(4): 469-74.
• Lachs, M. S., C. S. Williams, et al. (2002). "Adult protective service use and nursing home placement.” Gerontologist 42(6): 734-9.
• Lachs, M. S., C. S. Williams, et al. (1998). "The mortality of elder mistreatment." JAMA 280(5): 428-32.
• SAS Institute Inc. SAS/STAT 9.2 Users’ Guide. Chapter 64: The PHREG Procedure Cary, NC: SAS Institute Inc.
• SAS Institute Inc. SAS/STAT 9.2 Users’ Guide. Chapter 49: The LIFETEST Procedure Cary, NC: SAS Institute Inc.

Thanks! Q & A