christopher jencks does inequality matter? 10 .1 10 10.3 13.6 11.4 figure 1 changes in the percent...
TRANSCRIPT
The economic gap between rich andpoor has grown dramatically in the Unit-ed States over the past generation and isnow considerably wider than in anyother affluent nation. This increase ineconomic inequality has no recentprecedent, at least in America. The dis-tribution of family income was remark-ably stable from 1947 to 1980. We do nothave good data on family incomes before1947, but the wage gap between skilledand unskilled workers narrowed dramat-ically between 1910 and 1947, whichprobably means that family incomes alsobecame more equal. The last protractedincrease in economic inequality occur-red between 1870 and 1910.
The gap between the rich and the restof America has widened steadily since1979. The Census Bureau, which isAmerica’s principal source of data on
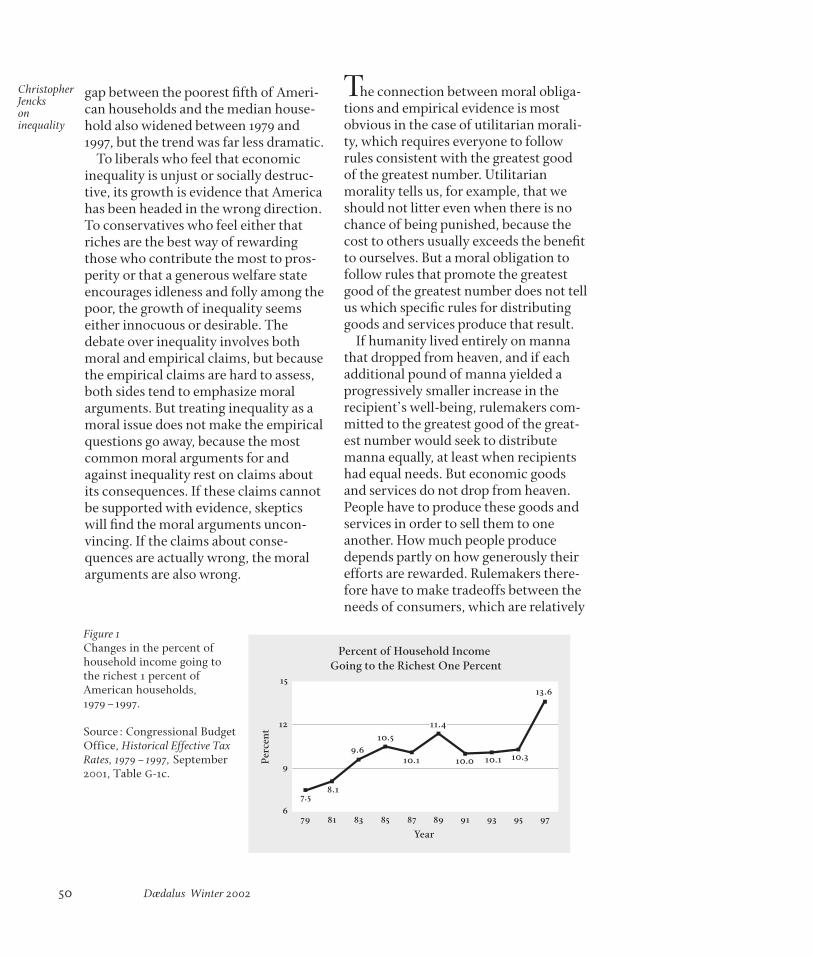
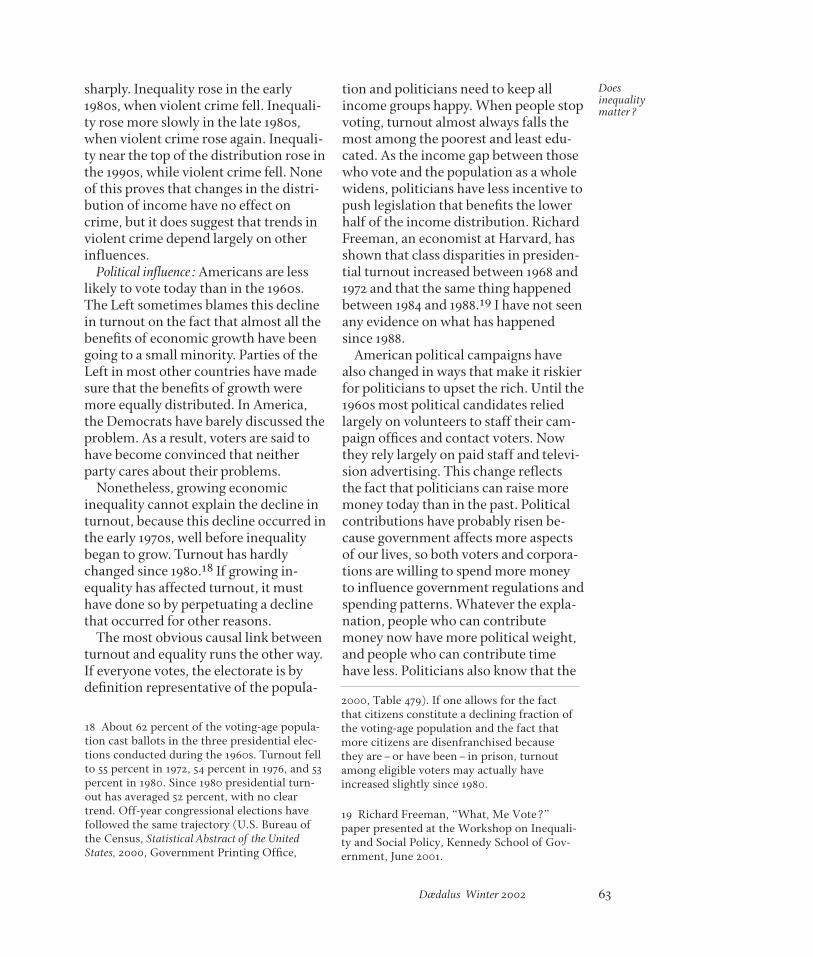
household incomes, does not collectgood data from the rich, but the Con-gressional Budget Of½ce (cbo) hasrecently combined census data with taxrecords to track income trends near thetop of the distribution. Figure 1 showsthat the share of after-tax income goingto the top 1 percent of American house-holds almost doubled between 1979 and1997. The top 1 percent included allhouseholds with after-tax incomesabove $246,000 in 1997. The estimatedpurchasing power of the top 1 percentrose by 157 percent between 1979 and1997, while the median household’s pur-chasing power rose only 10 percent.1 The
Dædalus Winter 2002 49
Christopher Jencks
Does inequality matter?
Christopher Jencks, Malcolm Wiener Professor ofSocial Policy at the Kennedy School at HarvardUniversity, has been a Fellow of the AmericanAcademy since 1992. The author of several classicworks, including “Inequality: A Reassessment ofthe Effect of Family and Schooling in America”(1972), Jencks is currently completing a new studyof inequality in America under the auspices of theRussell Sage Foundation.
1 Estimates of the absolute change in purchas-ing power should be treated with extreme cau-tion. The Consumer Price Index suggests, forexample, that the purchasing power of the bot-tom quintile did not change between 1979 and1997, yet data on food expenditures suggest thatthe poorest quintile felt it had more discre-tionary income (see Bruce Hamilton, “UsingEngel’s Law to Estimate cpi Bias,” AmericanEconomic Review 91 [June 2001]: 619–630) anddirect measures of housing conditions andother amenities suggest that the poorest quin-tile’s material standard of living rose (see SusanMayer and Christopher Jencks, “Do Of½cialPoverty Rates Provide Useful Informationabout Trends in Children’s Economic Wel-fare?” Levy Institute, Bard College, June 2001,available at <http://www.jcpr.org>). © 2002 by Christopher Jencks
gap between the poorest ½fth of Ameri-can households and the median house-hold also widened between 1979 and1997, but the trend was far less dramatic.
To liberals who feel that economicinequality is unjust or socially destruc-tive, its growth is evidence that Americahas been headed in the wrong direction.To conservatives who feel either thatriches are the best way of rewardingthose who contribute the most to pros-perity or that a generous welfare stateencourages idleness and folly among thepoor, the growth of inequality seemseither innocuous or desirable. Thedebate over inequality involves bothmoral and empirical claims, but becausethe empirical claims are hard to assess,both sides tend to emphasize moralarguments. But treating inequality as amoral issue does not make the empiricalquestions go away, because the mostcommon moral arguments for andagainst inequality rest on claims aboutits consequences. If these claims cannotbe supported with evidence, skepticswill ½nd the moral arguments uncon-vincing. If the claims about conse-quences are actually wrong, the moralarguments are also wrong.
The connection between moral obliga-tions and empirical evidence is mostobvious in the case of utilitarian morali-ty, which requires everyone to followrules consistent with the greatest goodof the greatest number. Utilitarianmorality tells us, for example, that weshould not litter even when there is nochance of being punished, because thecost to others usually exceeds the bene½tto ourselves. But a moral obligation tofollow rules that promote the greatestgood of the greatest number does not tellus which speci½c rules for distributinggoods and services produce that result.
If humanity lived entirely on mannathat dropped from heaven, and if eachadditional pound of manna yielded aprogressively smaller increase in therecipient’s well-being, rulemakers com-mitted to the greatest good of the great-est number would seek to distributemanna equally, at least when recipientshad equal needs. But economic goodsand services do not drop from heaven.People have to produce these goods andservices in order to sell them to oneanother. How much people producedepends partly on how generously theirefforts are rewarded. Rulemakers there-fore have to make tradeoffs between theneeds of consumers, which are relatively
50 Dædalus Winter 2002
ChristopherJencks oninequality
Percent of Household Income Going to the Richest One Percent
Year
6
9
12
15
97959391898785838179
Perc
ent
7.58.1
9.610.5
10.1 10.0 10.1 10.3
13.6
11.4
Figure 1Changes in the percent ofhousehold income going tothe richest 1 percent ofAmerican households,1979–1997.
Source: Congressional BudgetOffice, Historical Effective TaxRates, 1979–1997, September2001, Table G-1c.

equal, and the motives of producers,who usually produce more when extraeffort leads to higher rewards.
The most widely discussed alternativeto the utilitarian theory of justice is thetheory proposed by John Rawls.2 Rawlsclaimed that when uncertainty is greatand downside risks are high, peopleare–or should be–absolutely riskaverse. This assumption led Rawls tobelieve that if people did not know whatposition they would occupy in a societythey would want to organize the societyso as to maximize the well-being of thesociety’s least advantaged members. Ifthis claim is correct, utilitarian logic alsoimplies that society should maximize thewell-being of the least advantaged. Evenif most people are not as risk averse asRawls claimed, they may be suf½cientlyrisk averse to feel that maximizing theposition of the least advantaged shouldbe given very high priority in a just soci-ety.
But most thoughtful liberals, includingRawls, also recognize that rewardingpeople for producing more goods andservices will often improve the absolutewell-being of the least advantaged. Iden-tifying the best strategy for improvingthe position of the least advantagedtherefore requires complex empiricalcalculations that turn out to be rathersimilar to the calculations required toachieve the greatest good of the greatestnumber. The rest of this article assessesvarious empirical claims about how eco-nomic inequality affects both the meanlevel of well-being and the position ofthe least advantaged.
Some of the potential costs and bene-½ts of inequality emerge when we con-trast the United States with other rich
democracies. One simple way todescribe income inequality in differentcountries is to compute what is calledthe “90/10 ratio.” To calculate this ratiowe rank households from richest topoorest. Then we divide the income ofthe household at the ninetieth percentileby the income of the household at thetenth percentile. (Comparing the nineti-eth percentile to the tenth percentile isbetter than, say, comparing the ninety-ninth percentile to the ½rst percentile,because few countries collect reliabledata on the incomes of either the veryrich or the very poor.)
The Luxembourg Income Study (lis),which is the best current source of dataon economic inequality in differentcountries, has calculated 90/10 ratios forfourteen rich democracies in the mid-1990s. Table 1 shows the results.3 Tokeep differences between these fourteencountries in perspective I have alsoincluded data on two poorer and lessdemocratic countries, Mexico and Rus-sia. If we set aside Mexico and Russia,the big English-speaking democraciesare the most unequal, the Scandinaviandemocracies are the most equal, andWestern European democracies fall inthe middle. (Italy looks more unequalthan the other continental democracies,but the Italian data is somewhat sus-pect.) Within the English-speakingworld the United States is the most un-
Dædalus Winter 2002 51
Doesinequalitymatter?
2 John Rawls, A Theory of Justice (Cambridge,Mass.: Harvard University Press, 1971).
3 lis adjusts household incomes for size-relat-ed differences in households’ economic needsusing a scale in which, for example, a house-hold of four needs twice as much as a house-hold of one, and a household of nine needsthree times as much as a household of one.This scale probably underestimates the addi-tional income needed to maintain a constantlevel of material well-being and probably over-estimates the additional income needed tomaintain a constant level of subjective well-being when household size rises.

Table 1Income inequality and economic output invarious countries during the 1990s
Scandinaviad 2.8 75 77.2Sweden (1995) 2.6 68 78.9Finland (1995) 2.7 68 76.6Norway (1995) 2.8 85 77.8Denmark (1992) 2.9 79 75.4
Western Europe 3.6 73 77.5Nether. (1994) 3.2 75 77.5Germany (1994) 3.2 71 76.6Belgium (1996) 3.2 74 76.4France (1994) 3.5 66 78.4Switz. (1992) 3.6 84 78.5Italy (1995) 4.8 67 77.6
Brit. Com. 4.3 73 77.7Canada (1994) 4.0 78 78.2Australia (1994) 4.3 75 78.0U.K. (1995) 4.6 67 77.0
e
U.S. (1997) 5.6 100 75.7
Middle-income LIS nationsRussia (1995) 9.4 21 (?) 65.0Mexico (1998) 11.6 25 na
a From <http://lisweb.ceps.lu/key/½gures/ineqtable.htm> (8/13/01).
b From U.S. Bureau of the Census, Statistical Ab-stract of the United States, 2000, GovernmentPrinting Of½ce, Table 1365. GDP is converted to$U.S. using purchasing power parity.
c National Center for Health Statistics, Health,United States, 2000, Government Printing Of½ce,2000, Table 27.
d All area averages are unweighted arithmeticmeans.
e England and Wales.
equal of all. The 90/10 ratio in the Unit-ed States is twice that in Scandinavia.But even the United States is nothinglike as unequal as Russia, Mexico, or
many other Latin American countries.America’s unusually high level of
inequality is not attributable to itsunusually diverse labor force. Years ofschooling are more equally distributedin the United States than in the Euro-pean countries for which we have com-parable data (Sweden, the Netherlands,and Germany). Adult test scores aremore unequally distributed in the Unit-ed States than Europe, partly becauseAmerican immigrants score so poorly ontests given in English. But disparities incognitive skills turn out to play a tinyrole in explaining cross-national differ-ences in the distribution of earnings. Ifone compares American workers withthe same test scores and the sameamount of schooling, the Americans’wages vary more than the wages of allSwedish, Dutch, or German workers.4
Almost everyone who studies the caus-es of economic inequality agrees that byfar the most important reason for thedifferences between rich democracies isthat their governments adopt differenteconomic policies. There is no agree-ment about which policies are crucial, butthere is a fairly standard list of suspects.A number of rich countries have central-ized wage bargaining, which almostalways compresses the distribution ofearnings. Many rich democracies alsomake unionization easy, which alsotends to compress the wage distribution.Some rich democracies transfer a lot ofmoney to people who are retired, unem-ployed, sick, or permanently disabled,
52 Dædalus Winter 2002
ChristopherJencks oninequality
4 Francine Blau and Lawrence Kahn, “Do Cog-nitive Test Scores Explain Higher U.S. WageInequality?” Cambridge: National Bureau ofEconomic Research, April 2001; and DanDevroye and Richard Freeman, “Does Inequali-ty in Skills Explain Inequality in EarningsAcross Advanced Countries?” Cambridge:National Bureau of Economic Research, Febru-ary 2001.
Country (and year of the ninetieth tothe tenth percentile)
Ratio ofholdhold income atthe 90th to10th per-centile a
GDP
per capita as a percent ofu.s. level in 1998 b
Life expec-tancy atbirth(1995est.) c
while others are far less generous. TheUnited States is unusually unequal part-ly because it makes little effort to limitwage inequality: the minimum wage islow, and American law makes unioniza-tion relatively dif½cult. In addition, theUnited States transfers less money tothose who are not working than mostother rich democracies.
The fact that the American govern-ment makes so little effort to reduceeconomic inequality may seem surpris-ing in a country where social equality isso important. American politicians pres-ent themselves to the public as beingjust like everyone else, and once theystep outside their of½ces, Americans allwear jeans. The way Americans talk andthe music they listen to are also affectedby egalitarian impulses. But while thetenor of American culture may be demo-cratic, Americans are also far more hos-tile to government than the citizens ofother rich democracies. Since egalitari-an economic policies require govern-mental action, they win far less supportin the United States than in most otherrich democracies.
Conservatives have argued for cen-turies that trying to limit economicinequality inevitably reduces both theincentive to work and the ef½ciencywith which work is organized. As aresult, they think egalitarian societieshave fewer goods and services to distrib-ute than societies that allow the marketto determine household incomes. Onesimple way to test the claim is to askwhether countries that tolerate a highlevel of inequality really do enjoy a high-er standard of living.
Measuring a country’s standard of liv-ing is not easy. The most widely usedmeasure is probably per capita GrossDomestic Product (gdp), converted toAmerican dollars using what is knownas “purchasing power parity”–a system
designed to measure what different cur-rencies actually buy in the countrieswhere they are used. Column 2 of Table 1shows gdp per capita for the fourteenrich democracies on which lis providesdistributional data. At ½rst glance thedata seem to support the conservativecase, because the most unequal country,the United States, also has the highestgdp per capita. That fact makes a strongimpression on most Americans. But ifyou compare the other thirteen richdemocracies in Table 1 you will ½nd nosystematic relationship between in-equality and per capita gdp. Britain andItaly, for example, rank just below theUnited States in terms of inequality, buttheir gdp per capita is lower than anyother country but France. The fact thategalitarian economic policies have noobvious correlation with per capita gdpwithin Europe or the Commonwealthmakes a strong impression on egalitari-ans in those countries. It also suggeststhat America’s high output per capitamay be traceable to something otherthan our tolerance for economic in-equality.
Notice, too, that no rich democracy isas unequal as Mexico or Russia. Somethink this is because the combination ofaffluence and democracy always leadscountries to adopt somewhat egalitarianeconomic policies. Others think thecausal arrow runs the other way, andthat extreme inequality retards econom-ic growth. This debate is unlikely to besettled soon, because it requires histori-cal evidence that is hard to ½nd in poorcountries.
If inequality does not account forAmerica’s high gdp per capita, whatdoes? A ½rst step toward answering thisquestion is to decompose economic out-put into two components: the numberof hours worked in different countries(“effort”) and the value of the goods and
Dædalus Winter 2002 53
Doesinequalitymatter?

services that workers produce per hour(“ef½ciency”). Table 2 shows such statis-tics for the United States and six otherrich democracies. Americans are morelikely to have paid jobs than people inthe other six countries, but except in thecase of France the difference is fairlysmall. American workers also seem toput in more hours per year than workerselsewhere, although data on hoursworked is not collected in the same wayin all countries, so the numbers must betreated gingerly. Still, the estimates ofoutput per hour suggest that while theUnited States is considerably more ef½-cient than Canada, Australia, GreatBritain, and Sweden, it is slightly lessef½cient than France and Germany.
One obvious objection to this compar-ison is that unemployment is higher inFrance and Germany than in the UnitedStates. One way to correct for this wasteof human resources is to divide econom-ic output by what Table 2 labels “avail-
able” hours–the number of hours actu-ally worked plus the estimated numberof hours that those looking for jobs in agiven week wanted to work. The last rowof Table 2 shows the results of this calcu-lation. After this adjustment is made, theUnited States, France, and Germanylook about equally ef½cient. If we set theUnited States to one side, moreover,there is again no obvious correlationbetween inequality and ef½ciency in theother six countries.
Another objection to the calculationsin Table 2 is that they take no account ofcross-national differences in the stock ofphysical and human capital. This is true,but since one major rationale for tolerat-ing a high level of inequality is that thissupposedly encourages capital accumu-lation and investment, holding Ameri-ca’s advantages in these domains con-stant would bias the results in favor ofequality. The calculations in Table 2 alsoignore national differences in natural
54 Dædalus Winter 2002
ChristopherJencks oninequality
Table 2Estimates of economic inequality, output, effort, & ef½ciency in seven rich democracies for 1998
U.S. U.K. Australia Canada France Germany Sweden
Inequality (1994–1997)line 1: 90/10 ratio 5.6 4.6 4.3 4.0 3.5 3.2 2.6
Output (1998)line 2: GDP per capita $32,184 $21,673 $24,192 $25,179 $21,132 $23,010 $21,799
Effort (1998)line 3: % of pop. employed 48.6 45.9 45.8 46.6 38.1 43.5 45.1line 4: Hrs per worker per yr. 1864 1731 1860 1779 1567 1510 1629
Ef½ciency (1998)line 5: GDP per worker $60,106 $44,280 $47,558 $49,007 $55,714 $50,616 $44,000line 6: GDP per hr. $32.25 $25.58 $25.57 $27.55 $35.55 $33.52 $27.01line 7: GDP per “available” hr. $30.81 $23.95 $23.51 $25.26 $31.38 $30.38 $24.77
Source by line: Lines 1 and 2: see Table 1. Line 3: see Statistical Abstract 2000, Table 1376. Line 4: see Organiza-tion for Economic Cooperation and Development, OECD Employment Outlook, Statistical Annex, 2001, 225.Line 5 = line 3/line 4. Line 6 = line 5/line 4. Line 7 = line 6 adjusted to include hours available from those notworking but seeking work, assuming that they wanted to work the same number of hours as those actuallyemployed.

resources, but such an adjustmentwould almost surely make America lookworse, not better. Perhaps the most fun-damental objection of all is that statis-tics on gdp take little account of differ-ences in the quality of the services indifferent countries, since these differ-ences are almost impossible to measure.If America’s service sector producesmore satis½ed customers than the serv-ice sector in France or Germany, Table 2may understate the bene½ts of inequali-ty.
If American managers had organizedthe economy in an unusually ef½cientway, so that American workers wereproducing signi½cantly more (or better)goods and services per hour than theircounterparts in other rich democracies,it would be fairly easy to argue that theydeserved their fabulous salaries. Table 2is obviously not the last word on thisissue, but it does not suggest that Ameri-can workers are producing signi½cantlymore per hour than their counterparts inother rich countries. Comparisons thatadjust for the stock of physical andhuman capital show the same thing.5America’s high standard of living seemsto depend as much on long hours asclever management or clever workers.
The fact that Americans spend somuch time working is rather surprisingfor an affluent nation with a reputationfor hedonism. Workers in Germany,France, Japan, and Britain have cut theirhours substantially since 1980. Ameri-cans cut their hours earlier in the twen-tieth century but have not done so since1980. Americans tell pollsters that theywould like to work fewer hours, butwhen they have a choice between short-
er hours and more consumer goods,they mostly seem to opt for consumergoods rather than family time or leisure.This is a legitimate choice, but it hasnothing to do with economic ef½ciency.
Until fairly recently the United Stateswas so much richer than other countriesthat even the poor lived better in Ameri-ca than elsewhere, leading conservativesto argue that laissez-faire policies bene-½ted everyone in the long run. Today,however, the American poor are nolonger the world’s most affluent. TimSmeeding, who directs the lis, and LeeRainwater, a Harvard sociologist, havecompared the purchasing power ofhouseholds at the tenth percentile of theincome distribution in thirteen richdemocracies covered by the lis. Thesecomparisons provide a pretty good indi-cation of how the poor fare in differentcountries. Table 3, which is based ontheir work, shows that the Americanpoor are better off than the poor inBritain or Australia but marginallyworse off than the poor in Sweden,Canada, and Finland, and substantiallyworse off than the poor in WesternEurope.
Conservatives often blame Americanpoverty on the existence of an “under-class” that rejects mainstream socialnorms, does little paid work, and haschildren whom neither parent can sup-port. It is certainly true that poor Ameri-can households include fewer workingadults than affluent American house-holds. This is true in every rich countryfor which we have data. But when LarsOsberg, an economist at Dalhousie Uni-versity, compared poor households inthe United States, Canada, Britain, Swe-den, France, and Germany, he foundthat the poor American householdsworked far more hours per year thantheir counterparts in the other ½ve
Dædalus Winter 2002 55
Doesinequalitymatter?
5 Robert Hall and Charles Jones, “Why DoSome Countries Produce So Much More Out-put per Worker than Others,” Quarterly Journalof Economics 114 (1999): 83–116.

Table 3Purchasing power of households at the 10thand 90th percentiles of each nation’s distribu-tion relative to households at the same per-centile in the United States in the same year,1992–1997
Country Purchasing power as a percent of(and year) the U.S. level in the same year
1oth 90th Averagepercentile percentile of all
percentiles
Scandinavia 112 57 77Sweden (1995) 103 49 67Finland (1995) 105 53 73Norway (1995) 128 68 88Denmark (1995) 110 59 80
Western Europe 119 73 88Neth. (1994) 110 64 76Germany (1994) 113 67 82Belgium (1996) 121 73 80France (1994) 110 71 84Switz. (1992) 141 89 116
Commonwealth 94 73 80Canada (1994) 105 80 92U.K. (1995) 85 68 72Australia (1994) 87 71 76
U.S. (1997) 100 100 100
Source: Columns 1 and 2 are from Timothy Smeedingand Lee Rainwater, “Comparing Living StandardsAcross Countries: Real Incomes at the Top, the Bot-tom, and the Middle” (paper prepared for a confer-ence on “What Has Happened to the Quality of Lifein America and Other Advanced Industrial Nations?”Levy Institute, Bard College, Annandale-on-Hudson,N.Y., June 2001). Local currencies were converted todollars using their estimated purchasing power pari-ty. Area averages are unweighted arithmetic means.Column 3 is calculated from the national means ofthe logarithms of after-tax household income, usingdata provided by Rainwater.
countries.6 This ½nding suggests thatwhat distinguishes the United Statesfrom the other rich democracies is notthe idleness of the American poor butthe anger that idleness inspires in moreaffluent Americans, which helps explainthe stinginess of the American welfarestate.
If Rawls is right, disinterested rulemak-ers in all societies should be trying tomaximize the well-being of the leastadvantaged. If you accept that claim,Table 3 suggests that Western Europeancountries are doing a better job than theUnited States and that Western Euro-pean countries are more just. But if youare a utilitarian whose goal is to maxi-mize the average level of well-being, thesituation is not so clear. If you want tocompare the average level of well-beingin countries with different distributionsof income, you need some way of com-paring the value people at differentpoints in the income distribution assignto additional after-tax income. Table 3suggests, for example, that poor Canadi-ans have 5 percent more purchasingpower than their American counter-parts, while affluent Americans have 25percent more purchasing power thanaffluent Canadians. If your goal is toachieve “the greatest good of the great-est number,” you need some way ofdeciding whether the 25 percent advan-tage of affluent Americans over affluentCanadians should count for more or lessthan the 5 percent advantage of poorCanadians over poor Americans.
When employers want to reward allmembers of a hierarchical work groupequally, they usually raise every mem-ber’s wage by the same percentage.
56 Dædalus Winter 2002
ChristopherJencks oninequality
6 Lars Osberg, “Labour Supply and InequalityTrends in the U.S.A. and Elsewhere,” availableat <http://is.dal.ca/~osberg/home.html>.

When social scientists measure econom-ic inequality, they too assume thatinequality has not changed if everyone’sincome has risen by the same percent-age. Such practices suggest that manypeople think a 1 percent increase inincome is equally valuable to the richand the poor, even though a 1 percentincrease represents a much largerabsolute increase for the rich. In whatfollows I will refer to the assumptionthat a 1 percent gain is equally valuableat all income levels as the “One PercentIs Always The Same” rule, or the opiatsrule for short.
The opiats rule implies that if myincome is $100,000 and I give $20,000of it to the poor, my well-being falls by a½fth. If I divide my $20,000 equallybetween ten people with incomes of$10,000, ten people’s well-being will riseby a ½fth. The gains from this gift willthus exceed the losses by a factor of ten.The utilitarian case for governmentalredistribution almost always reflects thislogic: taxing the rich won’t do themmuch harm, and helping the poor willdo them a lot of good. If you look at theactual relationship between income andoutcomes like health and happiness, theopiats rule seldom describes the rela-tionship perfectly, but it comes far closerthan a “One Dollar Is Always The Same”rule, which is the only rule under whichincome inequality does not affect healthor happiness.
If we apply the opiats rule to thetenth and ninetieth percentiles in Table3, the percentage gains accruing to thoseat the ninetieth percentile from living inthe United States almost always exceedthe percentage gains accruing to those atthe tenth percentile from living in West-ern Europe or Canada. Switzerland is anotable exception. Americans near thebottom of the distribution would havegained far more from living in Switzer-
land in 1992 than Americans near thetop would have lost. Column 3 of Table 3generalizes this logic by comparinghouseholds at every point in each coun-try’s income distribution to those at thesame point in other countries and aver-aging the percentage differences.7 Aver-aging across the entire income distribu-tion, Switzerland again does substantial-ly better than the United States in 1992,but all the other rich democracies inTable 3 do somewhat worse than theUnited States.
Up to this point I have been focusingexclusively on what people can afford tobuy. While economic goods and servicesare obviously important, many peoplebelieve that inequality also affectshuman welfare in ways that are inde-pendent of any given household’s pur-chasing power. Even if my family in-come remains constant, the distributionof income in my neighborhood or mynation may influence my children’s edu-cational opportunities, my life expectan-cy, my chance of being robbed, the prob-ability that I will vote, and perhaps evenmy overall happiness. The remainder ofthis article tries to summarize what weknow about such effects.
Educational opportunities: Increases ineconomic inequality have raised thevalue of a college degree in the UnitedStates. If all else had remained equal,making a college degree more valuableshould increase both teenagers’ interestin attending college and their parents’willingness to pay for college. But thegrowth of economic inequality in Amer-ica has been accompanied by a change in
Dædalus Winter 2002 57
Doesinequalitymatter?
7 Column 3 is calculated from the differencesbetween national means for the logarithm ofafter-tax household income adjusted for house-hold size. Comparing medians in differentcountries yields almost the same results.

the way we ½nance public higher educa-tion. Tax subsidies play a smaller rolethan they once did, and tuition plays alarger role. Since 1979 tuition at Ameri-ca’s public colleges and universities hasrisen faster than most parents’ income.
If American high-school graduateswere as well informed and farsighted aseconomic theory assumes, they wouldhave realized that the monetary value ofa college degree was rising even fasterthan tuition. College attendance wouldhave risen both among children whoseparents offered to pay the bills andamong children who cover their owncosts, who would either have borrowedmore or worked longer hours to earn adegree.
But while some students clearlyrespond to changes in the long-termpayoff of a college degree, many do not.Indeed, the reason affluent parents offerto pay their children’s college expensesrather than just giving their childrencash is that parents fear that if the chil-dren got the cash they might spend it onsomething with more short-term payoff,like a flashy car or a trip around theworld. If affluent parents are right inthinking that their seventeen-year-oldshave short time horizons, the same isprobably true for less affluent high-school graduates whose parents cannotpay their college expenses. Such studentsare likely to be far more sensitive tochanges in tuition than to a change inthe hypothetical lifetime value of a BA.Tuition is easily observed and has to bepaid now. The lifetime value of a BA isalways uncertain and cannot be realizedfor a long time. Among students whopay their own bills, higher tuition couldeasily reduce college attendance evenwhen the long-run returns of a collegedegree are rising.
Table 4 is taken from work by twoeconomists, David Ellwood at Harvard
Table 4Percent of high-school graduates enrolling in a4-year college or some other form of postsec-ondary education within 20 months of gradua-tion, by income quartile: 1980–1982 and 1992
Income Entered a Entered some otherquartile 4-year form of post-
college secondary education
1980 1992 Change 1980 1992 Change–82 –82
Lowest 29 28 –1 28 32 4
Second 33 38 5 30 32 2
Third 39 48 9 33 32 –1
Highest 55 66 11 26 24 –2
All 39 45 6 29 30 1
Source: David Ellwood and Thomas Kane, “Who IsGetting a College Education? Family Background andthe Growing Gaps in Enrollment,” in SheldonDanziger and Jane Waldfogel, eds., Securing the Future(New York: Russell Sage, 2000).
and Thomas Kane at ucla. It showschanges between 1980–1982 and 1992 inthe fraction of high-school graduatesfrom different economic backgroundsentering four-year colleges. Among stu-dents from the most affluent families,the proportion entering a four-year col-lege rose substantially. Among studentsfrom middle-income families, whosefamilies often help with children’s col-lege expenses but seldom pay the wholebill, attendance rose more modestly. Stu-dents from the poorest quartile were nomore likely to attend a four-year collegein 1992 than in 1980–1982. This pattern,in which enrollment rises more at thetop than at the bottom, is just what wewould expect if parents respond tochanges in the long-term bene½ts of col-lege while students respond to changesin short-term costs. It is important toemphasize, however, that the poorestquartile’s chances of attending college
58 Dædalus Winter 2002
ChristopherJencks oninequality

did not fall appreciably; they just failedto rise. The poorest quartile was worseoff only insofar as higher education con-stitutes a “positional” good, whose valuedepends not just on how much you havebut how much others have. That re-mains a contested issue.
If rising economic inequality ex-plained the trends in Table 4, the corre-lation between parental income and col-lege attendance should have grownfastest in those states where economicinequality grew fastest. Susan Mayer, asociologist at the University of Chicago,has shown that that is exactly what hap-pened during the 1970s and 1980s.8Overall, growing economic inequality ina state raised college attendance, partlybecause it was accompanied by in-creased spending on all levels of publiceducation. The positive effects of grow-ing inequality on college attendance per-sisted even when Mayer took account ofchanges in the payoff of schooling in thestudent’s home state. But in the stateswhere inequality grew the most, theeffect of parental income on educationalattainment also grew.
Mayer has also shown that theincrease in economic inequality between1970 and 1990 led to greater economicsegregation between neighborhoods.9When the rich got richer they evidentlymoved to affluent suburbs where otherrich people were also moving. Incomedisparities within neighborhoods hardlychanged. Economic segregation is likely
to be important, because a school’s abili-ty to attract effective teachers turns outto depend largely on its socioeconomicmix. Even when districts with a lot ofpoor children pay better than nearbydistricts, as they sometimes do, they sel-dom attract teachers who are good atraising children’s test scores. Increasingeconomic segregation is therefore likelyto reduce the chances that low-incomestudents will get good teachers.
Life expectancy: People live longer inrich countries than in poor countries,but the relationship flattens out as na-tional income rises. Indeed, the statisticsin Table 1 show that life expectancy andgdp per capita are not strongly relatedin rich democracies. In particular, lifeexpectancy is lower in the United Statesthan in almost any other rich democra-cy.
Within any given country people withhigher incomes also live longer. This re-lationship flattens out near the top ofthe income distribution, but the gap be-tween richer and poorer families doesnot seem to narrow when everyone’sstandard of living rises. Despite both ris-ing incomes and the introduction of Me-dicare and Medicaid, for example, theeffects of both income and education onmortality increased in the United Statesbetween 1960 and 1986.10 Class differ-ences in mortality also widened in Eng-land between 1930 and 1960, eventhough the overall standard of livingrose and the National Health Service
Dædalus Winter 2002 59
Doesinequalitymatter?
10 See Harriet Orcutt Duleep, “MeasuringSocioeconomic Mortality Differentials overTime,” Demography 26 (May 1989): 345–351,and G. Pappas, S. Queen, W. Hadden, and G.Fisher, “The Increasing Disparity in Mortalitybetween Socioeconomic Groups in the UnitedStates, 1960 and 1986,” New England Journal ofMedicine 329 (1993): 103–109.
8 Susan E. Mayer, “How Did the Increase inEconomic Inequality between 1970 and 1990Affect Children’s Educational Attainment?”American Journal of Sociology, forthcoming.
9 Susan Mayer, “How the Growth in IncomeInequality Increased Economic Segregation,”Irving Harris Graduate School of Public PolicyStudies, University of Chicago, 2001, availableat <http://www.jcpr.org>.

equalized access to medical care.11 Suchfacts suggest that the linkage betweenincome and health involves more thanmaterial deprivation. Otherwise, dou-bling everyone’s purchasing powerwould narrow the gap between the topand the bottom.
One reason for the persistent correla-tion between income and health is thatpoor health lowers people’s earningpower. In addition, big medical bills candeplete a family’s savings, lowering itsunearned income in later years. Butwhile poor health clearly affects income,studies that follow the same individualsover time suggest that income, occupa-tional position, and education also affectpeople’s health. One reason is that mem-bers of affluent households are morelikely to follow the medical profession’sadvice. Affluent Americans now smokefar less than poor Americans, for exam-ple. Affluent Americans also get a bitmore exercise than the poor and are lesslikely to be overweight. But even whenwe take these differences into account,much of the correlation between in-come and life expectancy remains unex-plained. Experimental studies that mani-pulate a monkey’s rank in the hierarchyof its troop suggest that rank affectshealth, and the same is pretty clearlytrue for humans. But we do not knowhow much of the association betweenincome and health can be explained inthis way.
In 1992 Richard Wilkinson wrote aninfluential article arguing that a moreequal distribution of income improvedlife expectancy in rich countries.12 Sub-
sequent work showed that mortality wasalso lower in American states and metro-politan areas where incomes were moreequal. One explanation for this phenom-enon is the opiats rule. A 1 percentincrease in income lowers the odds ofdying before the age of sixty-½ve byroughly the same amount, regardless ofwhat your initial income is. This meansthat adding $1,000 to the income of amillion poor families while subtracting$1,000 from the incomes of a million ri-cher families should lower overall mor-tality. It follows that countries, states,or cities with the same mean incomeshould have lower death rates when thisincome is more equally distributed. Butif this were the only way in which in-come inequality affected life expectancy,the difference between the United Statesand Sweden would be quite small.
Wilkinson and his followers believethat inequality also lowers life expectan-cy independent of its effect on any givenhousehold’s income, because it changesthe social context in which people live.According to Wilkinson, inequalityerodes the social bonds that make peo-ple care about one another and accentu-ates feelings of relative deprivation (thesocial-science term for what people usedto call envy). Other epidemiologists takewhat they call a “materialist” position,arguing that inequality kills because itaffects public policy, altering the distri-bution of education, health care, envi-ronmental protection, and other materi-al resources. Either way, if we comparepeople with the same income–say$50,000 a year–those who live in placeswhere incomes are more unequal shoulddie younger.
Recent research has raised seriousdoubts about such claims. As data onmore countries and more time periodshave become available, the cross-nation-al correlation between economic in-
60 Dædalus Winter 2002
ChristopherJencks oninequality
11 See Elsie Pamuk, “Social Class Inequality inMortality from 1921 to 1972 in England andWales,” Population Studies 39 (1985): 17–31.
12 Wilkinson summarized his thinking on thisissue in Unhealthy Societies: The Afflictions ofInequality (London: Routledge, 1996).
equality and life expectancy has fallenperilously close to zero. If you look atTable 1 and simply contrast Americawith other rich democracies, the ideathat inequality kills seems to makesense. But if you compare the other richdemocracies with one another, you ½ndno consistent association between in-equality and life expectancy. Incomesare far more unequal in Canada, Aus-tralia, and Great Britain than in Scandi-navia, for example, but life expectancy isabout the same in these two groups ofcountries.
Recent work has also raised doubtsabout the causal link between inequalityand life expectancy in American statesand cities. In America, both economicinequality and life expectancy are corre-lated with the percentage of AfricanAmericans in a state or city. Blacks dieyounger than whites no matter wherethey live, so states with large black pop-ulations have above-average mortalityrates no matter how their residents’income is distributed. American whitesalso die younger when they live in a stateor a metropolitan area with a large Afri-can American population. Once onetakes the effects of race into account, thecorrelation between economic inequali-ty and mortality tends to disappear.13
If we want to know whether egalitari-an policies would improve people’shealth, however, we need to ask whetherchanges in economic inequality at thenational, state, or local level are associ-ated with changes in life expectancy. Theanswer to this question is “sometimes.”When Andrew Clarkwest and I analyzedchanges in economic inequality withinAmerican states during the 1980s, wefound that white mortality rates fellleast in the states where inequality in-
creased fastest. That ½nding was consis-tent with the Wilkinson hypothesis,although the effect could have been dueto chance. But when we extended ouranalysis back to 1970, the relationshipwas reversed. That relationship couldalso have been due to chance.
When Clarkwest and I looked atchanges in economic inequality withinthe rich democracies that participate inthe Luxembourg Income Study (lis), wefound that life expectancy had riseneverywhere, but it has risen less rapidlyin those countries where economic in-equality was rising fastest.14 This wasconsistent with the Wilkinson hypothe-sis, and in this case the relationship wastoo large to blame on chance, at leastusing conventional statistical standards.Nonetheless, the relationship was weak.Economic inequality in the UnitedStates rose by about a sixth between1979 and 1997.15 Life expectancy in theUnited States rose by three years duringthis period. Had inequality not in-creased, the lis data implied that lifeexpectancy in the United States wouldhave risen by an additional 0.3 years. Tokeep this number in perspective, it helpsto remember that Americans in the top 5percent of the income distribution canexpect to live about nine years longerthan those in the bottom 10 percent.16
Dædalus Winter 2002 61
Doesinequalitymatter?
13 See also Angus Deaton and Darren Lubot-sky, “Mortality, Inequality, and Race in Ameri-can Cities and States,” Cambridge: NationalBureau of Economic Research, June 2000.
14 See Andrew Clarkwest, “Notes on Cross-National Analysis of the Relationship betweenMortality and Income Inequality,” MalcolmWiener Center for Social Policy, Harvard Uni-versity, 2000, available at <http://www.ksg.harvard.edu/socpol/MWCstdntresearch.htm>.
15 This estimate assumes that the apparentincrease in inequality between 1992 and 1993was a methodological artifact caused largely bychanges in the Census Bureau’s data collectionand coding procedures.
16 This calculation is based on an analysis ofthe National Longitudinal Mortality Survey by

The apparent effect of even a fairly largechange in a nation’s income distributionpales by comparison.
We also need to bear in mind that thecross-national correlation betweenchanges in economic inequality andchanges in life expectancy may not becausal. Countries that restrained thegrowth of economic inequality after1980 were dominated by political partiesthat felt either politically or morallyobligated to protect the interests of theirless affluent citizens. Such countries mayhave done all sorts of other things thatmade people live longer, like reducingthe work week or ensuring that morepeople got the health care they needed.
Happiness: The relationship betweenincome and happiness is much like therelationship between income and health,except that it is easier to tell whethersomeone has died than whether they areunhappy. Almost every year since 1972the General Social Survey (gss) hasasked national samples of Americanadults the following question:
Taken all together, how would you saythings are these days? Would you say thatyou are very happy, pretty happy, or nottoo happy?
Those with higher incomes tend to saythey are happier than those with lowerincomes. This relationship flattens outnear the top of the distribution, but notenough to suggest that making theAmerican distribution of income like
Sweden’s would have a big effect on hap-piness. Just as with health, equalizingthe distribution of income is only likelyto have large effects on happiness if itchanges the social context in which peo-ple live. If equality strengthens socialties or reduces envy, for example, thatcould reduce unhappiness signi½cantly.
Empirical evidence for a correlationbetween equality and happiness remainsthin. Michael Hagerty, a social psycholo-gist at the University of California, Da-vis, has shown that Americans are lesslikely to say they are happy when theylive in cities where incomes are moreunequal, but his analysis does not takeaccount of the correlation between eco-nomic inequality and racial mix. A teamof economists at Harvard and the Lon-don School of Economics has shownthat Europeans become less satis½edwith their lot when their country’s in-come distribution becomes more un-equal, but this effect is con½ned torespondents who identify with the polit-ical Left.17 All this evidence is sugges-tive, but hardly de½nitive.
Crime: Several studies have found thatviolent crime is higher in American met-ropolitan areas where the distribution ofincome is more unequal. But these stud-ies have not looked at whether increasesin inequality are associated with increasesin crime. For the United States as awhole, trends in economic inequality donot match trends in violent crime at allclosely. Inequality hardly changed dur-ing the 1960s, when violent crime rose
62 Dædalus Winter 2002
ChristopherJencks oninequality
17 See Michael Hagerty, “Social Comparisonsof Income in One’s Community: Evidencefrom National Surveys of Income and Happi-ness,” Journal of Personality and Social Psychology78 (2000): 764–771, and Alberto Alesina,Rafael Di Tella, and Robert MacCulloch,“Inequality and Happiness: Are Europeans andAmericans Different?” Cambridge: NationalBureau of Economic Research, April 2001.
Angus Deaton, which shows that men in thehighest income group have death rates compa-rable to men twelve years younger in the low-est income group, and that women in the high-est income group have death rates comparableto women six years younger in the lowestincome group. My use of Deaton’s results toinfer overall disparities in life expectancyrequires several assumptions that are unlikelyto be exactly correct.
sharply. Inequality rose in the early1980s, when violent crime fell. Inequali-ty rose more slowly in the late 1980s,when violent crime rose again. Inequali-ty near the top of the distribution rose inthe 1990s, while violent crime fell. Noneof this proves that changes in the distri-bution of income have no effect oncrime, but it does suggest that trends inviolent crime depend largely on otherinfluences.
Political influence: Americans are lesslikely to vote today than in the 1960s.The Left sometimes blames this declinein turnout on the fact that almost all thebene½ts of economic growth have beengoing to a small minority. Parties of theLeft in most other countries have madesure that the bene½ts of growth weremore equally distributed. In America,the Democrats have barely discussed theproblem. As a result, voters are said tohave become convinced that neitherparty cares about their problems.
Nonetheless, growing economicinequality cannot explain the decline inturnout, because this decline occurred inthe early 1970s, well before inequalitybegan to grow. Turnout has hardlychanged since 1980.18 If growing in-equality has affected turnout, it musthave done so by perpetuating a declinethat occurred for other reasons.
The most obvious causal link betweenturnout and equality runs the other way.If everyone votes, the electorate is byde½nition representative of the popula-
tion and politicians need to keep allincome groups happy. When people stopvoting, turnout almost always falls themost among the poorest and least edu-cated. As the income gap between thosewho vote and the population as a wholewidens, politicians have less incentive topush legislation that bene½ts the lowerhalf of the income distribution. RichardFreeman, an economist at Harvard, hasshown that class disparities in presiden-tial turnout increased between 1968 and1972 and that the same thing happenedbetween 1984 and 1988.19 I have not seenany evidence on what has happenedsince 1988.
American political campaigns havealso changed in ways that make it riskierfor politicians to upset the rich. Until the1960s most political candidates reliedlargely on volunteers to staff their cam-paign of½ces and contact voters. Nowthey rely largely on paid staff and televi-sion advertising. This change reflectsthe fact that politicians can raise moremoney today than in the past. Politicalcontributions have probably risen be-cause government affects more aspectsof our lives, so both voters and corpora-tions are willing to spend more moneyto influence government regulations andspending patterns. Whatever the expla-nation, people who can contributemoney now have more political weight,and people who can contribute timehave less. Politicians also know that the
Dædalus Winter 2002 63
Doesinequalitymatter?
18 About 62 percent of the voting-age popula-tion cast ballots in the three presidential elec-tions conducted during the 1960s. Turnout fellto 55 percent in 1972, 54 percent in 1976, and 53percent in 1980. Since 1980 presidential turn-out has averaged 52 percent, with no cleartrend. Off-year congressional elections havefollowed the same trajectory (U.S. Bureau ofthe Census, Statistical Abstract of the UnitedStates, 2000, Government Printing Of½ce,
2000, Table 479). If one allows for the factthat citizens constitute a declining fraction ofthe voting-age population and the fact thatmore citizens are disenfranchised becausethey are–or have been–in prison, turnoutamong eligible voters may actually haveincreased slightly since 1980.
19 Richard Freeman, “What, Me Vote?”paper presented at the Workshop on Inequali-ty and Social Policy, Kennedy School of Gov-ernment, June 2001.

easiest way to raise the money they needis to court affluent contributors. Whenthe share of income going to the top 1percent rises, politicians have more in-centive to raise money from this group.If politicians had to rely exclusively oncontributions of less than $100, theywould also have to rely more on volun-teers to do a lot of their campaign work.
I began this inquiry by arguing thatAmerica does less than almost any otherrich democracy to limit economicinequality. As a result, the rich can buy alot more in America than in other afflu-ent democracies, while the poor can buya little less. If you evaluate this situationby Rawlsian standards, America’s poli-cies are clearly inferior to those of mostrich European countries. If you evaluatethe same situation using a utilitarian cal-culus, you are likely to conclude thatmost American consumers do betterthan their counterparts in other largedemocracies. Much of this advantage isdue to the fact that Americans spendmore time working than Europeans do,but that may not be the whole story.
I also looked at evidence on whethereconomic inequality affects people’slives independent of its effects on theirmaterial standard of living. At least inthe United States, the growth of inequal-ity appears to have made more peopleattend college but also made educationalopportunities more unequal. Growinginequality may also have lowered lifeexpectancy, but the evidence for such aneffect is weak and the effect, if there wasone, was probably small. There is someevidence that changes in inequality af-fect happiness in Europe, but not muchevidence that this is the case in the Unit-ed States. If inequality affects violentcrime, these effects are swamped byother factors. There is no evidence thatchanges in economic inequality affect
political participation, but decliningpolitical participation among the lessaffluent may help explain why Americanpoliticians remained so passive wheninequality began to grow after 1980.
My bottom line is that the social con-sequences of economic inequality aresometimes negative, sometimes neutral,but seldom–as far as I can discover –positive.20 The case for inequality seemsto rest entirely on the claim that it pro-motes ef½ciency, and the evidence forthat claim is thin. All these judgmentsare very tentative, however, and they arelikely to change as more work is done.Still, it is worthwhile to ask what theywould imply about the wisdom of tryingto limit economic inequality if theywere, in fact, correct.
Readers’ answers to that questionshould, I think, depend on four valuejudgments. First, readers need to decidehow much weight they assign to improv-ing the lot of the least advantaged com-pared with improving the average levelof well-being. Second, they need todecide how much weight they assign toincreasing material well-being comparedwith increasing “family time” or“leisure.” Third, they need to decidehow much weight they assign to equaliz-ing opportunities for the young asagainst maximizing the welfare ofadults. Fourth, they need to decide howmuch value they assign to admittingmore people from poor countries such asMexico to the United States, since thisalmost inevitably makes the distributionof income more unequal.
If you are a hard-core Rawlsian whothinks that society’s sole economic goal
64 Dædalus Winter 2002
ChristopherJencks oninequality
20 Mayer’s ½nding that inequality raises edu-cational attainment among the affluent is apartial exception, since the increase among theaffluent is larger than the decline among thepoor, making the net effect on educationalattainment positive.

should be to improve the position of theleast advantaged, European experiencesuggests that limiting inequality canbene½t the poor. If you are a hard-coreutilitarian, European experience sug-gests–though it certainly does notprove–that limiting inequality lowersconsumption. But European experiencealso suggests that lowering inequalityreduces consumption partly by encour-aging people to work fewer hours, whichmany Europeans see as a good thing. Ifyou care more about equal opportunityfor children than about consumptionamong adults, limiting economicinequality among parents probablyreduces disparities in the opportunitiesopen to their children.
All things considered, the case for lim-iting inequality seems to me strong butnot overwhelming. That is one reason
why most rich societies are deeply divid-ed about the issue. Yet given the central-ity of redistribution in modern politics,it is remarkable how little effort richsocieties have made to assemble thekinds of evidence they would need toassess the costs and bene½ts of limitinginequality. Even societies that redistrib-ute a far larger fraction of their gdpthan the United States spend almostnothing on answering questions of thiskind. Answering such questions wouldrequire collecting better evidence,which costs real money. It would alsorequire politicians to run the risk ofbeing proven wrong. Nonetheless, moralsentiments uninformed by evidencehave done incalculable damage over thepast few centuries, and their maligninfluence shows no sign of abating. Richdemocracies can do better if they try.
Dædalus Winter 2002 65
Doesinequalitymatter?