chromatic mechanisms in striate cortex of macaque - cnbctai/readings/color/lennie.pdf · macaca...
TRANSCRIPT

The Journal of Neuroscience, February 1990, 70(2): 649-669
Chromatic Mechanisms in Striate Cortex of Macaque
Peter Lennie, John Krauskopf,” and Gary Sclar
Center for Visual Science and Department of Psychology, University of Rochester, Rochester, New York 14627
We measured the responses of 305 neurons in striate cortex to moving sinusoidal gratings modulated in chromaticity and luminance about a fixed white point. Stimuli were repre- sented in a 3-dimensional color space defined by 2 chro- matic axes and a third along which luminance varied. With rare exceptions the chromatic properties of cortical neurons were well described by a linear model in which the response of a cell is proportional to the sum (for complex cells, the rectified sum) of the signals from the 3 classes of cones. For each cell there is a vector passing through the white point along which modulation gives rise to a maximal re- sponse. The elevation (0,) and azimuth (4,) of this vector fully describe the chromatic properties of the cell. The linear model also describes neurons in 1.g.n. (Derrington et al., 1984), so most neurons in striate cortex have the same chro- matic selectivity as do neurons in 1.g.n. However, the distri- butions of preferred vectors differed in cortex and 1.g.n.: Most cortical neurons preferred modulation along vectors lying close to the achromatic axis and those showing overt chromatic opponency did not fall into the clearly defined chromatic groups seen in 1.g.n. The neurons most responsive to chromatic modulation (found mainly in layers IVA, IVCP, and VI) had poor orientation selectivity, and responded to chromatic modulation of a spatially uniform field at least as well as they did to any grating. We encountered neurons with band-pass spatial selectivity for chromatically modu- lated stimuli in layers ll/lll and VI. Most had complex recep- tive fields. Neurons in layer ll/lll did not fall into distinct groups according to their chromatic sensitivities, and the chromatic properties of neurons known to lie within regions rich in cytochrome oxidase appeared no different from those of neurons in the interstices. Six neurons, all of which re- sembled simple cells, showed unusually sharp chromatic selectivity.
The principal aim of this paper is to provide a quantitative account of the chromatic properties of neurons in striate cortex of macaque and to show how these neurons transform the signals from the lateral geniculate nucleus (1.g.n.). Several earlier studies have examined the chromatic properties of neurons in striate cortex, either by measurement of their spectral sensitivities (Dow, 1974; Gouras, 1974; Michael, 1978a-c; Vautin and Dow, 1985) or by measurement of their responses to isoluminant chromatic
Received June 12, 1989; revised Sept. 25, 1989; accepted Sept. 28, 1989. This work was supported by NIH grants EY 04440 to P.L., EY 01319 to the
Center for Visual Science, and EY 06638 to J.K. J.K. was also supported by AFOSR-86-0334. G.S. held a National Research Service award.
Correspondence should be addressed to Peter Lennie at the above address. aPresent address: Department of Psychology and Center for Neural Science,
New York University, New York, NY 10003. Copyright 0 1990 Society for Neuroscience 0270-6474/90/100649-21$02.00/O
stimuli (Livingstone and Hubel, 1984; Thorell et al., 1984). Although responses to particular stimuli have been well char- acterized, this work has not given rise to a general account from which one can predict the responses of neurons to arbitrary chromatic stimuli, nor has it provided a quantitative account of how neurons combine signals from the 3 classes of cone. Derrington and colleagues (1984) showed that the response of a neuron in 1.g.n. to any stimulus could be predicted from a simple model that assumed linear combination of signals from the 3 classes of cone. Here, we provide a similar analysis of the behavior of cortical neurons.
Our second purpose is to understand the relationship between the psychophysics of color vision and the properties of cortical neurons. Our earlier work on 1.g.n. (Derrington et al., 1984) did not reveal 3 postreceptoral mechanisms of the kinds postulated on psychophysical grounds (an achromatic mechanism having high spatial acuity and 2 chromatically opponent ones of lower resolving power). Instead, we found 2 classes of parvocellular neurons (P-cells), one in which signals from long-wavelength- sensitive (R) cones were opposed to signals from the middle- wavelength-sensitive (G) cones and another in which signals from the short-wavelength-sensitive (B) cones were opposed to some combined signal from R and G cones. The R-G neurons were overwhelmingly preponderant. Magnocellular neurons (M-cells) showed little chromatic opponency but, because they sample the image sparsely, are an improbable substrate of the putative achromatic mechanism. For virtually all P-cells the chromatically opponent mechanisms were segregated in center and surround of the receptive field. This attribute results in the chromatic properties of the neuron varying with the spatial properties of the stimulus (Wiesel and Hubel, 1966; DeValois et al., 1977; Ingling and Martinez-Uriegas, 1983), such that a preference for chromatically modulated stimuli at low spatial frequencies gives way to a preference for achromatic stimuli as spatial frequency is raised. Such neurons provide ambiguous information about the chromatic content of stimuli, although the ambiguity can be resolved by higher mechanisms that derive their inputs from the appropriate sets of neurons in 1.g.n. (D’Zmura and Lennie, 1986). In the present work we tried to establish whether such mechanisms exist in striate cortex.
Materials and Methods
Preparation and recording. These experiments were undertaken on 17 Macaca fascicularis that weighed between 2.5 and 4.5 kg. Each animal was anesthetized initially with an injection of ketamine hydrochloride (Vetalar, 10 mg/kg, i.m.) or (in some experiments) an injection of su- fentanil citrate (Sufenta, lo-12 pg/kg, i.m.). Cannulae were inserted in the saphenous veins, and surgery was continued under sodium pento- barbital (Nembutal) or Sufenta anesthesia. In anesthetic doses Sufenta often produced severe respiratory depression, and animals required ar- tificial respiration during surgery. Despite this, Sufenta appeared to be
650 Lennie et al. * Chromatic Mechanisms in Striate Cortex of Macaque
Achromatic AXIS
constant R,G Axis
I ’ ” ’ ’ ” ’ I
0.8
0.6
0.4
0.2
0 0 0.2 0.4 0.6 0.8
X
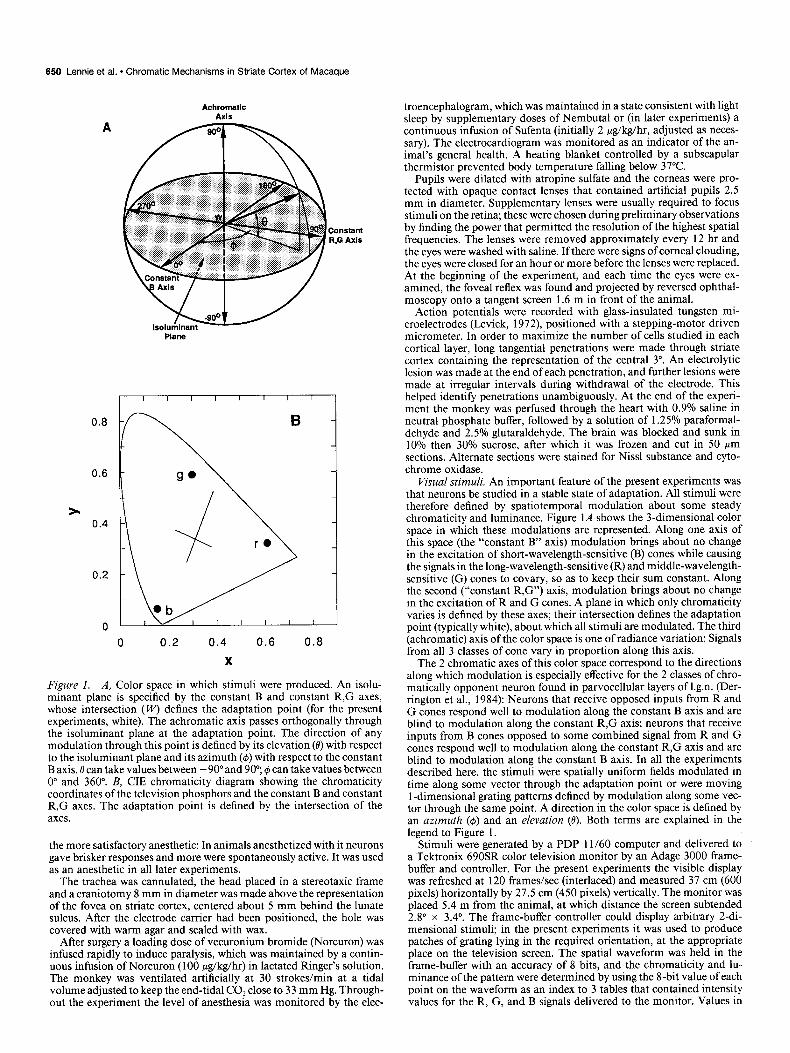
Figure 1. A, Color space in which stimuli were produced. An isolu- minant plane is specified by the constant B and constant R,G axes, whose intersection (I+‘) defines the adaptation point (for the present experiments, white). The achromatic axis passes orthogonally through the isoluminant plane at the adaptation point. The direction of any modulation through this point is defined by its elevation (0) with respect to the isoluminant plane and its azimuth (4) with respect to the constant B axis. 8 can take values between - 90” and 90”; #J can take values between 0” and 360”. B, CIE chromaticity diagram showing the chromaticity coordinates of the television phosphors and the constant B and constant R,G axes. The adaptation point is defined by the intersection of the axes.
the more satisfactory anesthetic: In animals anesthetized with it neurons gave brisker responses and more were spontaneously active. It was used as an anesthetic in all later experiments.
The trachea was cannulated, the head placed in a stereotaxic frame and a craniotomy 8 mm in diameter was made above the representation of the fovea on striate cortex, centered about 5 mm behind the lunate sulcus. After the electrode carrier had been positioned, the hole was covered with warm agar and sealed with wax.
troencephalogram, which was maintained in a state consistent with light sleep by supplementary doses of Nembutal or (in later experiments) a continuous infusion of Sufenta (initially 2 hg/kg/hr, adjusted as neces- sary). The electrocardiogram was monitored as an indicator of the an- imal’s general health. A heating blanket controlled by a subscapular thermistor prevented body temperature falling below 37°C.
Pupils were dilated with atropine sulfate and the corneas were pro- tected with opaque contact lenses that contained artificial pupils 2.5 mm in diameter. Supplementary lenses were usually required to focus stimuli on the retina; these were chosen during preliminary observations by finding the power that permitted the resolution of the highest spatial frequencies. The lenses were removed approximately every 12 hr and the eyes were washed with saline. If there were signs of cornea1 clouding, the eyes were closed for an hour or more before the lenses were replaced. At the beginning of the experiment, and each time the eyes were ex- amined, the fovea1 reflex was found and projected by reversed ophthal- moscopy onto a tangent screen 1.6 m in front of the animal.
Action potentials were recorded with glass-insulated tungsten mi- croelectrodes (Levick, 1972) positioned with a stepping-motor driven micrometer. In order to maximize the number of cells studied in each cortical layer, long tangential penetrations were made through striate cortex containing the representation of the central 3”. An electrolytic lesion was made at the end of each penetration, and further lesions were made at irregular intervals during withdrawal of the electrode. This helped identify penetrations unambiguously. At the end of the experi- ment the monkey was perfused through the heart with 0.9% saline in neutral phosphate buffer, followed by a solution of 1.25% paraformal- dehyde and 2.5% glutaraldehyde. The brain was blocked and sunk in 10% then 30% sucrose, after which it was frozen and cut in 50 Km sections. Alternate sections were stained for Nissl substance and cyto- chrome oxidase.
Visual stimuli. An important feature of the present experiments was that neurons be studied in a stable state of adaptation. All stimuli were therefore defined by spatiotemporal modulation about some steady chromaticity and luminance. Figure 1A shows the 3-dimensional color space in which these modulations are represented. Along one axis of this space (the “constant B” axis) modulation brings about no change in the excitation of short-wavelength-sensitive (B) cones while causing the signals in the long-wavelength-sensitive(R) and middle-wavelength- sensitive (G) cones to covary, so as to keep their sum constant. Along the second (“constant R,G”) axis, modulation brings about no change in the excitation of R and G cones. A plane in which only chromaticity varies is defined by these axes; their intersection defines the adaptation point (typically white), about which all stimuli are modulated. The third (achromatic) axis of the color space is one of radiance variation: Signals from all 3 classes of cone vary in proportion along this axis.
The 2 chromatic axes of this color space correspond to the directions along which modulation is especially effective for the 2 classes of chro- matically opponent neuron found in parvocellular layers of 1.g.n. (Der- rington et al., 1984): Neurons that receive opposed inputs from R and G cones respond well to modulation along the constant B axis and are blind to modulation along the constant R,G axis; neurons that receive inputs from B cones opposed to some combined signal from R and G cones respond well to modulation along the constant R,G axis and are blind to modulation along the constant B axis. In all the experiments described here, the stimuli were spatially uniform fields modulated in time along some vector through the adaptation point or were moving 1 -dimensional grating patterns defined by modulation along some vec- tor through the same point. A direction in the color space is defined by an azimuth (6) and an elevation (0). Both terms are explained in the legend to Figure 1.
Stimuli were generated by a PDP 1 l/60 computer and delivered to a Tektronix 690SR color television monitor by an Adage 3000 frame- buffer and controller. For the present experiments the visible display was refreshed at 120 frames/set (interlaced) and measured 37 cm (600 pixels) horizontally by 27.5 cm (450 pixels) vertically. The monitor was placed 5.4 m from the animal, at which distance the screen subtended 2.8” x 3.4”. The frame-buffer controller could display arbitrary 2-di- mensional stimuli; in the present experiments it was used to produce
After surgery a loading dose of vecuronium bromide (Norcuron) was patches of grating lying in the required orientation, at the appropriate infused rapidly to induce paralysis, which was maintained by a contin- place on the television screen. The spatial waveform was held in the uous infusion of Norcuron (100 &kg/hr) in lactated Ringer’s solution. frame-buffer with an accuracy of 8 bits, and the chromaticity and lu- The monkey was ventilated artificially at 30 strokes/min at a tidal minance of the pattern were determined by using the I-bit value of each volume adjusted to keep the end-tidal CO, close to 33 mm Hg. Through- point on the waveform as an index to 3 tables that contained intensity out the experiment the level of anesthesia was monitored by the elec- values for the R, G, and B signals delivered to the monitor. Values in
The Journal of Neuroscience, February 1990, IO(2) 651
these tables, which were held to an accuracy of 10 bits, could be rewritten during the time taken for frame fly-back on the monitor, so chromaticity and luminance could be modulated at 60 Hz. The nonlinear relation- ships between applied voltages and phosphor luminances were corrected by compensating nonlinearities in the 3 tables.
The projections of the constant B and constant R,G axes are drawn on the chromaticity diagram shown in Figure 1B; their intersection (X = 0.311, y = 0.336) defines the adaptation point. This was chosen to be close to equal energy white, without unduly restricting the maximum luminance available from each phosphor. The projection of a true con- stant B axis should intersect the chromaticity diagram at x = 1 .O, y = 0. However, it was computationally convenient to use an axis along which only the R and G primaries were modulated. This resulted in our constant B axis passing through the coordinates x = 1.10, y = 0, and in the color space of Figure 1A lying 0.4” from its correct position. In the remainder of this paper, we ignore the mislocation of the axis. The constant R,G axis (a tritanopic confusion line) is defined by a line connecting the adaptation point and the tritanopic copunctal point (Wal- raven, 1974). The space-time average luminance was 120 cd/m*.
Unit modulation along the luminance axis produced a Michelson contrast of 1 .O. There is no agreed means of calculating the modulation of a heterochromatic grating. The maximum attainable modulation along the constant B axis through the adaptation point gave rise to Michelson contrasts of 0.074 to the R cones, 0.140 to the G cones, and 0.018 to the B cones; the maximum attainable modulation of chromaticity along the constant R,G axis gave rise to the following modulations of quantum catches: R, 0.00; G, 0.00; B, 0.84. As a practical device for calculating 0 and 4, unit modulation along the constant R,G axis was defined as the maximum attainable; unit modulation along the constant B axis was 0.32 of the maximum attainable.
Examination of receptive fields. All receptive fields lay within 3” of the center of the fovea. When a neuron was first isolated, the receptive field of the dominant eye was marked on the tangent screen (the non- dominant eye was covered). The position of the receptive field was then marked by a laser beam reflected off a coverslip placed just below the eye; this beam was subsequently reflected off a front surface mirror on to the center of the television screen.
Since cortical neurons are often selective for several attributes of a stimulus, and since most cortical neurons respond to achromatic stimuli, our strategy was to characterize the receptive field with achromatic stimuli and then, with stimuli of the favored configuration, vary the chromatic properties for best response. A preliminary examination was made with a small patch of achromatic grating, whose spatial frequency, orientation, length, width, and position could be continuously varied. If the preliminary exploration of the receptive field indicated that a neuron was selective for the spatial frequency or orientation of an ach- romatic grating, the spatial-frequency selectivity and orientational se- lectivity were examined quantitatively. To measure spatial selectivity, the neuron was driven by gratings of the (estimated) optimal orientation at a range of spatial frequencies covering the frequency estimated to be optimal. We were particularly interested in responses to low and middle spatial frequencies, so our measurements seldom explored the highest frequencies to which cells responded. The optimal orientation was then found using gratings of the preferred spatial frequency at a range of orientations centered on the one thought to be optimal. Some neurons responded so poorly to achromatic stimuli that their receptive fields could not be characterized adequately. In such cases, the initial explo- ration of the receptive field was made with colored stimuli to which the neuron did respond.
After the optimal spatial configuration had been established, the op- timal chromatic stimulus was sought by systematic examination of re- sponses to stimuli ofthis configuration modulated in different directions about the adaptation point. Such an approach allows us very quickly to restrict the domain to be explored, but a potential weakness is that if the spatial and chromatic properties of the receptive field are not separable (i.e., the preferred spatial frequency depends upon the chro- matic properties of the stimulus), we may be unable to find the optimal
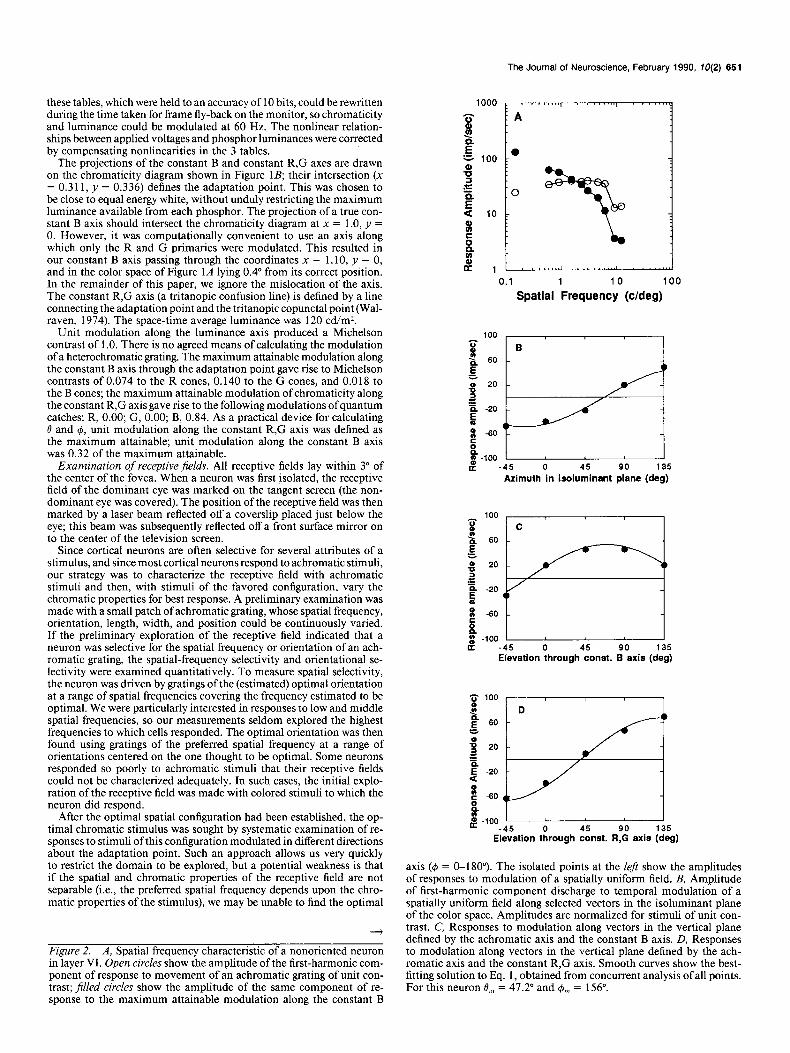
Figure 2. A, Spatial frequency characteristic of a nonoriented neuron in layer VI. Open circles show the amplitude of the first-harmonic com- ponent of response to movement of an achromatic grating of unit con- trast; filled circles show the amplitude of the same component of re- sponse to the maximum attainable modulation along the constant B
I . . . . . .*
100
e 60
3 % 20
a = 0 E
-20
m
0.1 1 IO 100
Spatial Frequency (cldeg)
1 I -45 0 45 90 135
Azimuth in ieoluminant plane (deg)
C
ii
-4.5 0 45 90 135 Elevation through conet. B axis (deg)
Elevation through const. R,G axis (deg)
axis (I#J = o-180”). The isolated points at the left show the amplitudes of responses to modulation of a spatially uniform field. B, Amplitude of first-harmonic component discharge to temporal modulation of a spatially uniform field along selected vectors in the isoluminant plane of the color space. Amplitudes are normalized for stimuli of unit con- trast. C, Responses to modulation along vectors in the vertical plane defined by the achromatic axis and the constant B axis. D, Responses to modulation along vectors in the vertical plane defined by the ach- romatic axis and the constant R,G axis. Smooth curves show the best- fitting solution to Eq. 1, obtained from concurrent analysis of all points. For this neuron B,,, = 47.2” and $,,, = 156”.

652 Lennie et al. - Chromatic Mechanisms in Striate Cortex of Macaque
45"
-45"
0 315" 45" 135"
Figure 3. Histograms showing, for the cell of Figure 2, the pattern of average discharge to a spatially uniform field modulated at 1.68 Hz along different vectors in the 3 principal planes of the color space. Rows contain histograms of responses to modulation along vectors of constant elevation (the long row for 0 = o”, the isoluminant plane) and columns contain histograms of responses to modulation along vectors of constant azimuth. The amplitude of modulation was fixed at 0.5, except for gratings modulated along vectors in the isoluminant plane, where it was set to the maximum attainable. Each histogram contains the response to 20 presentations of the stimulus. Calibration: ordinate, 100 imp/set; abscissa, 0.5 sec. Bin width 8.4 msec.
stimulus. If the preferred direction of modulation lay far from the ach- romatic axis, the spatial and orientational selectivities were usually examined again using gratings modulated in the preferred direction.
In all experiments, stimuli were modulated sinusoidally in time at 1.86 Hz or moved steadily across the receptive field at the same rate. The different stimuli required in a single experiment (e.g., to measure orientational selectivity) were each presented for 2.28 set (4.25 cycles), and were randomly interleaved. A blank interval of 1 set was inserted between successive stimuli. In most experiments, each stimulus was presented 20 times.
Classijication of cells. During the preliminary examination of its re- ceptive field an orientation-selective neuron was classified as “nonori- ented,” “simple,” or “complex.” This distinction was later drawn more firmly by analysis of the responses of neurons to moving sinusoidal gratings. Following DeValois et al. (1982), we called cells “simple” when the ratio of amplitudes of the fundamental component of response to that of the unmodulated component was greater than 1. Later in this paper, we analyze the chromatic properties of cells in 2 different ways, depending upon whether the neurons summed signals from cones lin- early. All simple cells and nearly all nonoriented cells were subjected to the linear analysis, complex cells, and the few nonoriented cells that gave second harmonic responses, to the nonlinear one.
Analysis of response. Action potentials were amplified and used to trigger rectangular pulses that were recorded by the computer. Pulse counts were accumulated in an array of bins (each 8.4 msec wide) indexed by the phase of the stimulus. The amplitudes and phases of component responses at different temporal frequencies were extracted by taking the Fourier transform of the array. Each sample contained the response to at least 4 cycles of stimulus modulation, and to avoid contamination by transients, the early part of the response was excluded from the analysis. A histogram showing average discharge rate against time was also constructed from the recorded action potentials.
Results Our goals were to characterize the chromatic sensitivities of neurons and to establish how they transform signals from 1.g.n. The methods introduced in our earlier work (Derrington et al., 1984) permit a full description of the chromatic properties of neurons, but only if cells sum their inputs linearly. We begin by showing that these methods adequately characterize the chro- matic properties of simple cells and cells that are not orientation- selective, then show how an extension of them copes with the behavior of complex cells.
Quantitative observations were made on 305 neurons in striate cortex; 2 penetrations extended into V2, in which 6 neurons were studied. We observed a wide range of properties in the population examined and have illustrated this with examples.
Neurons that sum signals linearly Nonoriented cells The macaque’s striate cortex contains many neurons that have linearly summing receptive fields, are monocularly driven, lack orientation specificity, and generally respond well to gratings of low spatial frequency. Hubel and Wiesel(1968) found cells like this to be common in layer IV, and we often encountered them; indeed, in several experiments we sought them because many have chromatically interesting properties. Although we have no evidence that these “nonoriented” cells differ qualitatively from

The Journal of Neuroscience, February 1990, fO(2) 653
0.1 1 10
Spatial Frequency (cldeg)
100 , I I , , , , , ,
60 80 100 120 140
Orientation (deg)
z 100 1 -c 60 E =
% 20 -
2 - l = Q -20 -
4
5
8 -60 -
E
:: al -'oo-45
u 0 45 90 135 Azimuth in isoluminant plane (deg)
23 100
I D h 60 - E =
E -60 -
:: al -100 L K -45 0 45 135
Elevation through const. 89ixis (deg)
z 100 Figure 4. A, Spatial frequency char-
t E acteristic of a linearly summing neuron
'n 60 - lying in a cytochrome oxidase blob in
E layer II/III. Open circles, achromatic c. grating$lled circles, grating modulated
in the isoluminant plane along the con- stant R,G axis (4 = 90”-270”). B, Ori- entation selectivity for achromaticgrat-
2
ings of optimal spatial frequency. C-E, -60 - Amplitude of first-harmonic compo-
z nent of discharge to gratings modulated $ -100 along selected vectors in the 3 principal a -45 45 90 135
Elevation thorough const. R,G axis (deg) planes of the color space. Conventions as for Figure 2.0,,, = - 73.7”, &,, = 279”.
orientation-selective simple cells, we have followed Hubel and Wiesel in distinguishing them informally.
The open circles in Figure 2A show, for a monocularly driven cell in layer VI, the spatial selectivity measured with moving achromatic gratings. The optimum direction of modulation in color space was then sought by measuring responses to gratings (of the spatial frequency found to be optimal for achromatic gratings) modulated along vectors spaced 45” apart in the 3 principal planes of the color space (i.e., planes defined by the intersection of 2 cardinal axes). Figure 3 shows, for the cell whose spatial properties are illustrated in Figure 2A, how the response to the grating varied with direction of modulation in the 3 principal planes passing through the adaptation point. The am- plitude of the modulated response varied regularly with vector rotation in each plane, and underwent a reversal in phase at some point. Figure 2, B-D, shows, for each of these planes, how the amplitude of the Fourier component of response at the fre- quency of stimulus modulation varied with the direction of modulation. In this and subsequent figures, positive and neg- ative amplitudes are used to represent responses of opposite phases.
If a cell combines cone signals linearly, and responds linearly to the sum of these signals, it can be shown (Derrington et al., 1984) that there will be one plane (the “null” plane) containing the adaptation point within which modulation brings about no
response from the cell, and orthogonal to this an axis passing through the adaptation point along which modulation maxi- mally excites the cell. The amplitude R of the response to mod- ulation along a vector of elevation 0 and azimuth 4 is given by the dot product of the stimulus vector and a vector in the di- rection of best response, namely,
R = K[sin 0 sin 0, + cos 0 cos B,cos(+ - &)I, (1)
where K is a scale factor, 0,, the elevation of the vector of max- imal response, and 4, the azimuth of the vector of maximal response. Equation 1 simply reflects the fact that the response to any stimulus is proportional to its projection along the di- rection of maximal response (0,, +,,). R therefore varies sinu- soidally with vector rotation in any plane that contains the adaptation point; in the null plane, R is zero. For a cell whose behavior is described by Eq. 1, K, 0,,, and 4, completely char- acterize its chromatic properties for the particular spatial and temporal conditions of the measurement. Derrington et al. (1984) took the parameters of the orthogonal null plane as the chro- matic signature, but that signature does not express the direction of the vector of maximal response.
The minimizing routine STEPIT was applied to the data to derive a single set of values of K, O,, and 6, that best fitted the responses to stimuli modulated in all 3 planes. For the points plotted in Figure 2, B-D, this procedure yields values of 47.2”,

654 Lennie et al. * Chromatic Mechanisms in Striate Cortex of Macaaue
Spatial Frequency (cldeg)
Figure 5. A, Spatial frequency char- acteristic of a simple cell in an unknown layer. Measurements were made with an achromatic grating. The isolated point at the left shows the amplitude of response to modulation of a spatially uniform field. The cell did not respond to chromatically modulated gratings. B, Measurements of orientation selectiv- ity for achromatic gratings of optimal
g 5 20 -
ii 5 io- %
2 0 200 220 240 260 260
Orientation (deg) spatial frequency. C-E, Amplitude of first-harmonic component of discharge to gratings of 1.4 c/deg modulated along selected vectors in the 3 principal planes of the color space. Conventions as for Figure 2. b’,,, = -87.2”, #,,, = 116.7”.
156”, and 69.4 for 8,,, d,, and K, respectively, from which the for a cell in an unknown layer, how the amplitude of response solid lines in the figure are computed. The good fit ofthe sinusoid varied with the spatial frequency and orientation of an achro- validates our assumption of linearity. The relationship between matic grating; Figure 5, C-E, shows how the amplitude of re- contrast and amplitude of response was measured directly for sponse to a stimulus of optimal spatial frequency varied with most cells. For many, the response varied linearly with contrast direction of modulation about the adaptation point. The pre- at low amplitudes but saturated at high amplitudes, and this ferred direction of modulation, calculated from the best-fitting can be seen in some following figures (e.g., Fig. 7); for some solution to Eq. 1, was 0, = -87.2” and 4, = 116.7”. Figure 6 cells, the relationship was clearly nonlinear over its whole range shows the results of similar measurements made on a simple (see Sclar et al., 1990), and the fit of Eq. 1 could have been cell that lay in layer IVA. This cell responded well to chromat- improved by making allowance for this. ically modulated gratings of low spatial frequency.
The open circles in Figure 4A show the spatial selectivity (measured with achromatic gratings) of a unit in a cytochrome- oxidase “blob” in layer II/III. This cell was weakly orientation selective (Fig. 4B), and because it responded well to gratings of low spatial frequency, its chromatic preferences were examined using a grating of 1.4 c/deg modulated in different directions through the adaptation point. Figure 4, C-E shows how the amplitude of response varied with vector rotation in the 3 prin- cipal planes of the color space. The fit of the linear model is indicated by the solid lines; the best-fitting values of 8, and 4, were 73.7” and 279”, respectively.
The neurons whose behaviors are shown in Figures 2-6 had 8,, spanning the range of possible values: The simple cell in Figure 5 was most sensitive to modulation along a vector lying close to the achromatic axis, while the unit of Figure 6 was most sensitive to stimuli modulated along a vector lying close to the isoluminant plane. These chromatic properties depended some- what upon the spatial frequency of the grating used in the mea- surement, a point to which we return later.
Simple cells The chromatic properties of simple cells were also well char- acterized by Eq. 1: the open circles in Figure 5, A and B, shows,
Neurons that sum signals nonlinearly
Equation 1 characterizes the chromatic properties of cells that sum signals linearly, but it does not adequately describe the behavior of 2 sorts of nonlinear cell distinguished in the present work.
Azimuth in isoluminant plane (deg)
3 100
8 h E 60
e;
: 20 z a E -20
Elevatlon through const. B axis (deg)
8 s
-60
r
B 0 I
II: -100
-45 0 45 90 135 Elevation through const. R,G axis (deg)
The Journal of Neuroscience, February 1990, fO(2) 656
0.1 1 10
Spatial Frequency (Meg)
a” 0 1 I I I I
30 50 70 90 110
Orientation (deg)
3 100
8 h 60 E C
3 z”
s = E -20 a
c 100
x
p 60 =
g j 20
E
g -20
8 c -60
8
g -100 K
Azimuth in isoluminant plane (deg)
Elevation through const. B axis (deg)
3 x -20 - E B
i -60 _
ii
2 d -100 -45 45 90 135
Elevatlon thorough const. R,G axis (deg)
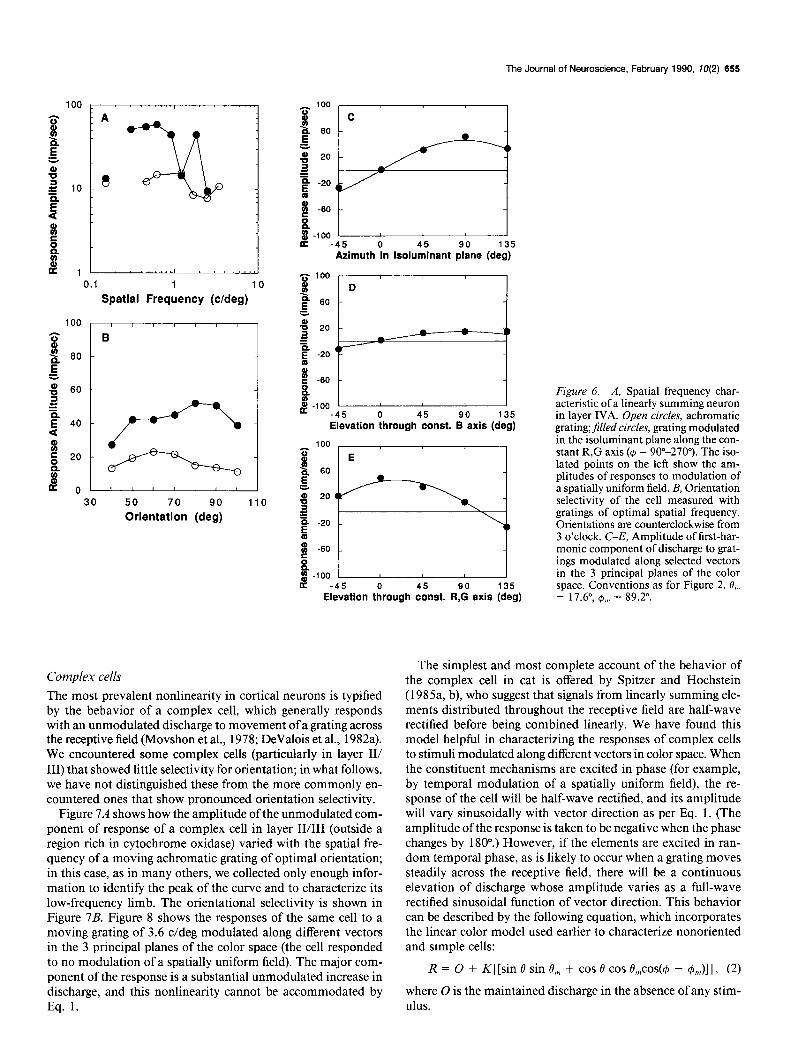
Complex cells
The most prevalent nonlinearity in cortical neurons is typified by the behavior of a complex cell, which generally responds with an unmodulated discharge to movement of a grating across the receptive field (Movshon et al., 1978; DeValois et al., 1982a). We encountered some complex cells (particularly in layer II/ III) that showed little selectivity for orientation; in what follows, we have not distinguished these from the more commonly en- countered ones that show pronounced orientation selectivity.
Figure 7A shows how the amplitude of the unmodulated com- ponent of response of a complex cell in layer II/III (outside a region rich in cytochrome oxidase) varied with the spatial fre- quency of a moving achromatic grating of optimal orientation; in this case, as in many others, we collected only enough infor- mation to identify the peak of the curve and to characterize its low-frequency limb. The orientational selectivity is shown in Figure 7B. Figure 8 shows the responses of the same cell to a moving grating of 3.6 c/deg modulated along different vectors in the 3 principal planes of the color space (the cell responded to no modulation of a spatially uniform field). The major com- ponent of the response is a substantial unmodulated increase in discharge, and this nonlinearity cannot be accommodated by Eq. 1.
Figure 6. A, Spatial frequency char- acteristic of a linearly summing neuron in layer IVA. Open circles, achromatic grating;jilled circles, grating modulated in the isoluminant plane along the con- stant R,G axis (4 = 90”-270’). The iso- lated points on the left show the am- plitudes of responses to modulation of a spatially uniform field. B, Orientation selectivity of the cell measured with gratings of optimal spatial frequency. Orientations are counterclockwise from 3 o’clock. C-E, Amplitude of first-har- monic component of discharge to grat- ings modulated along selected vectors in the 3 principal planes of the color space. Conventions as for Figure 2. 0,, = 17.6”, I$,,, = 89.2”.
The simplest and most complete account of the behavior of the complex cell in cat is offered by Spitzer and Hochstein (1985a, b), who suggest that signals from linearly summing ele- ments distributed throughout the receptive field are half-wave rectified before being combined linearly. We have found this model helpful in characterizing the responses of complex cells to stimuli modulated along different vectors in color space. When the constituent mechanisms are excited in phase (for example, by temporal modulation of a spatially uniform field), the re- sponse of the cell will be half-wave rectified, and its amplitude will vary sinusoidally with vector direction as per Eq. 1. (The amplitude of the response is taken to be negative when the phase changes by 180”.) However, if the elements are excited in ran- dom temporal phase, as is likely to occur when a grating moves steadily across the receptive field, there will be a continuous elevation of discharge whose amplitude varies as a full-wave rectified sinusoidal function of vector direction. This behavior can be described by the following equation, which incorporates the linear color model used earlier to characterize nonoriented and simple cells:
R = 0 + KI [sin fl sin 0,, + cos 8 cos 0,cos(+ - $,)I 1, (2)
where 0 is the maintained discharge in the absence of any stim- ulus.
656 Lennie et al. - Chromatic Mechanisms in Striate Cortex of Macaque
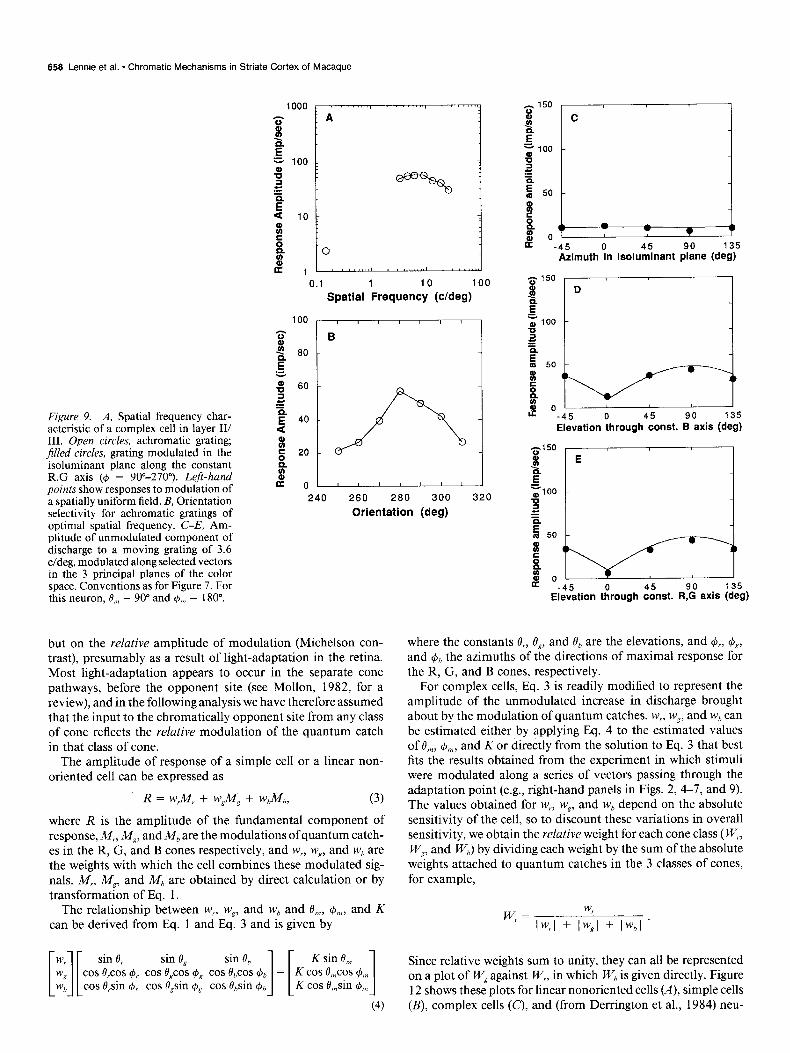
Figure 7. A, Spatial frequency char- acteristic of a complex cell in layer II/ III. Measurements made with achro- matic gratings. B, Orientation selectiv- ity for achromatic gratings of optimal spatial frequency. C, Amplitude of un- modulated component of discharge to a moving grating of 3.6 c/deg, modu- lated along selected vectors in the iso- luminant plane of the color space. Amplitudes are normalized for stimuli of unit contrast. D, Responses to mod- ulation along vectors in the vertical plane defined by the achromatic axis and the constant B axis. E, Responses to modulation along vectors in the ver- tical plane defined by the achromatic axis and the constant R,G axis. Smooth curves show best-fitting solution to Eq. 2. For this neuron, 8,,, = 87.2” and $I,,, = 360”.
0.1 1 IO
Spatial Frequency (cldeg)
60 60 100 120 140
Orientation (deg)
The 3 panels in Figure 7, C-E, show, for the responses de- picted in Figure 8, how the average discharge rate varied with the direction in color space along which the grating was mod- ulated. The solid lines show the best-fitting solution to Eq. 2 obtained by the minimizing routine STEPIT. As before, a single solution was computed from the responses to modulation in all 3 planes. This neuron responded best to stimulus modulation along the achromatic axis.
Figure 9, A and B, shows, respectively, the spatial and ori- entational selectivities of a second complex cell that lay within layer II/III, and Figure 9, C-E, shows, for a grating of the op- timal spatial frequency and orientation, how the amplitude of the unmodulated component of discharge varied with the di- rection in color space along which the grating was modulated. Like the neuron whose behavior is shown in Figures 7 and 8, it responded to no modulation of a spatially uniform field. The solid lines show the solution to Eq. 2, which evidently provides a useful means of characterizing the chromatic preferences of complex cells.
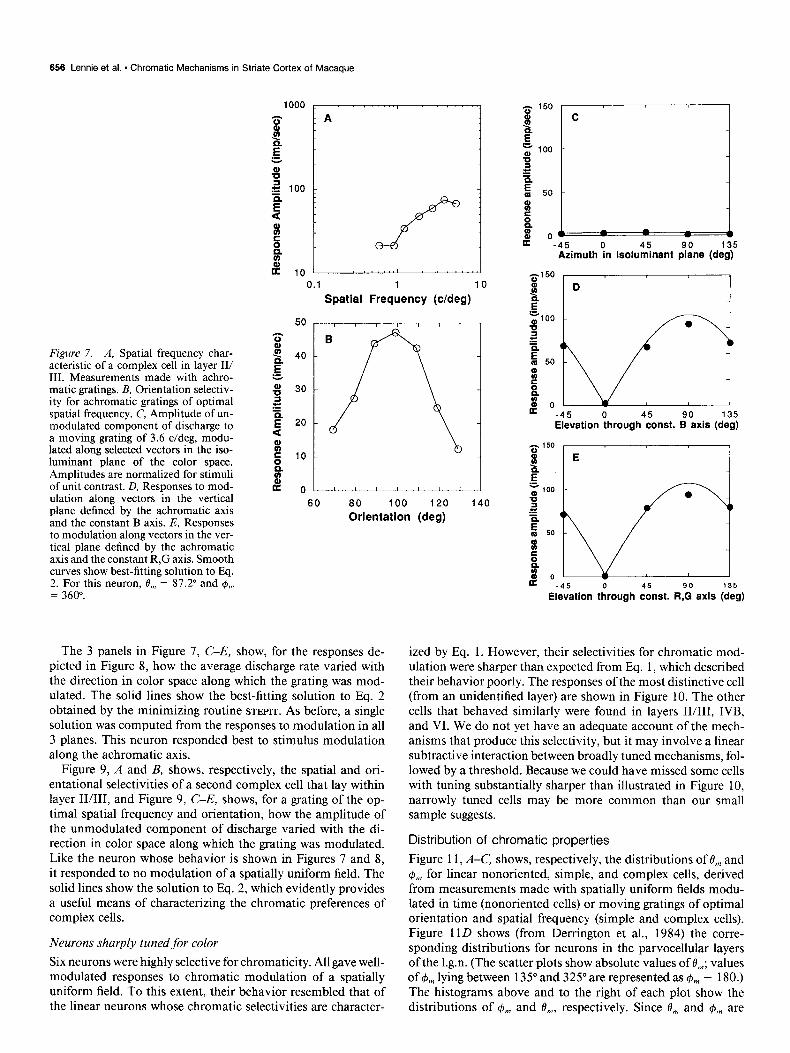
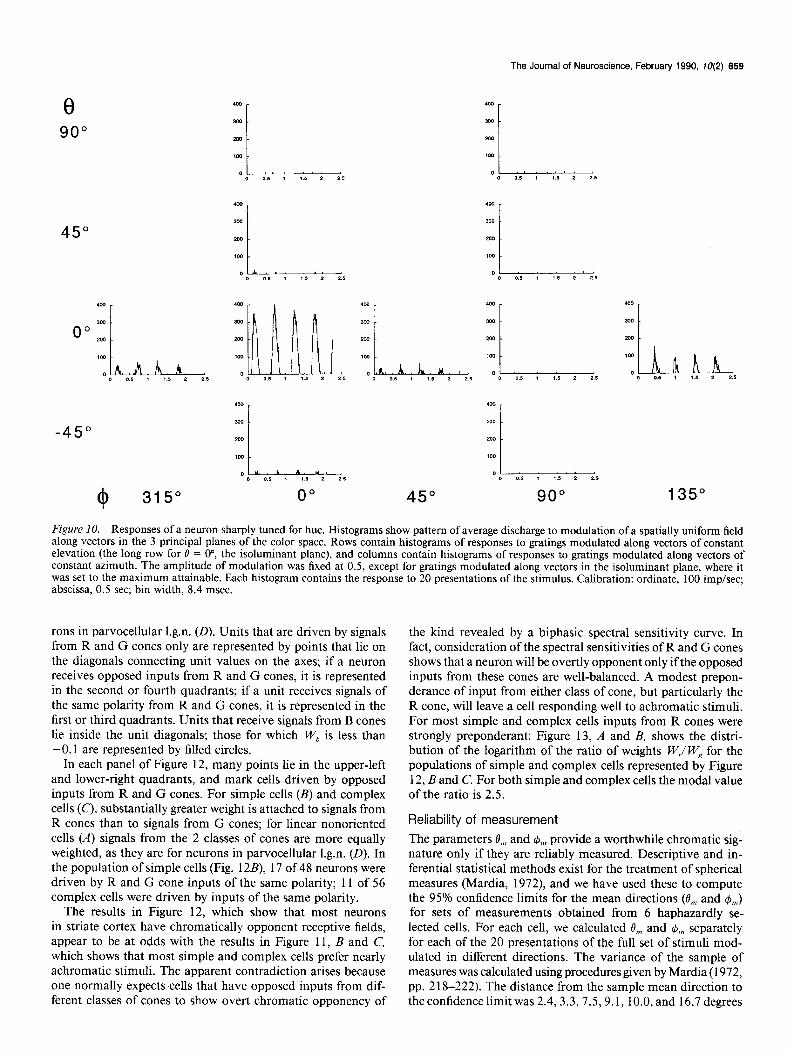
Neurons sharply tuned for color Six neurons were highly selective for chromaticity. All gave well- modulated responses to chromatic modulation of a spatially uniform field. To this extent, their behavior resembled that of the linear neurons whose chromatic selectivities are character-
ized by Eq. 1. However, their selectivities for chromatic mod- ulation were sharper than expected from Eq. 1, which described their behavior poorly. The responses of the most distinctive cell (from an unidentified layer) are shown in Figure 10. The other cells that behaved similarly were found in layers II/III, IVB, and VI. We do not yet have an adequate account of the mech- anisms that produce this selectivity, but it may involve a linear subtractive interaction between broadly tuned mechanisms, fol- lowed by a threshold. Because we could have missed some cells with tuning substantially sharper than illustrated in Figure 10, narrowly tuned cells may be more common than our small sample suggests.
Distribution of chromatic properties
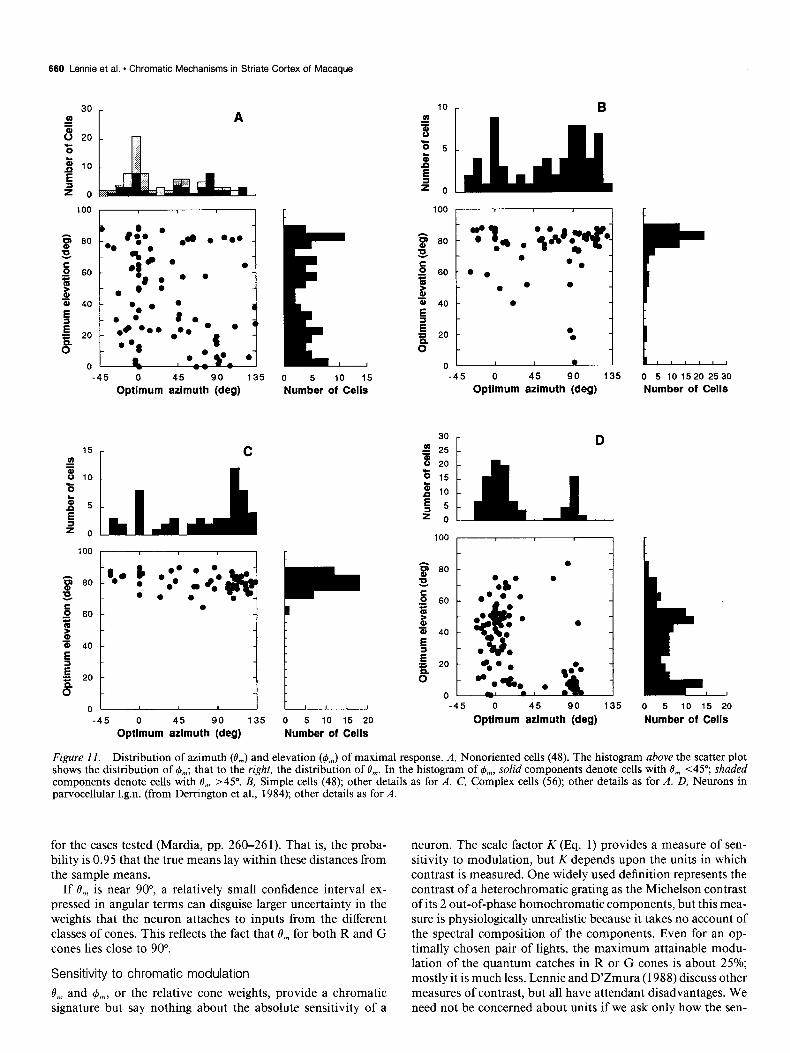
Figure 11, A-C, shows, respectively, the distributions of 0, and rb,, for linear nonoriented, simple, and complex cells, derived from measurements made with spatially uniform fields modu- lated in time (nonoriented cells) or moving gratings of optimal orientation and spatial frequency (simple and complex cells). Figure 11D shows (from Derrington et al., 1984) the corre- sponding distributions for neurons in the parvocellular layers of the 1.g.n. (The scatter plots show absolute values of 0,; values of 4, lying between 135” and 325” are represented as 4, - 180.) The histograms above and to the right of each plot show the distributions of I$,,, and 0,,,, respectively. Since 0, and @,, are

The Journal of Neuroscience, February 1990, lO(2) 657
0 90”
45"
-45"
0 315" 135"
Figure 8. Histograms showing, for the neuron of Figure 7, the pattern of average discharge to moving gratings modulated along vectors in the 3 principal planes of the color space. Rows contain histograms of responses to gratings modulated along vectors of constant elevation (the long row for 8 = o”, the isoluminant plane), and columns contain histograms of responses to gratings modulated along vectors of constant azimuth. The amplitude of modulation was fixed at 0.5, except for gratings modulated along vectors in the isoluminant plane, where it was set to the maximum attainable. Histogram at lower right-hand comer shows discharge in the absence of any modulation. Each histogram contains the response to 20 presentations of the stimulus. Calibration: ordinate, 100 imp/set; abscissa, 0.5 set; bin width, 8.4 msec.
represented in what is essentially a Mercator projection, 4, be- comes undefined as 0,, approaches 90” (the achromatic axis). Cells with B,,, near 0” respond best to stimuli that are purely chromatically modulated.
The population of linear nonoriented cells (Fig. 11A) con- tained many manifestly color-opponent neurons that preferred modulation along vectors close to the isoluminant plane, but the group as a whole was heterogeneous and had no clear R-G and B-R&G subgroups of the kind found in parvocellular 1.g.n. (Fig. 11D). If we consider only those nonoriented cells with 0, < 45”, the distribution of 4,, becomes bimodal (solid bars in Fig. 1 lA), though the modes are less sharply defined than for neurons in 1.g.n.
Figure 11, B and C, shows that both simple and complex cells prefer stimuli modulated along vectors close to, but generally not along, the achromatic axis. It should be borne in mind that the chromatic properties of these neurons were established with gratings, so chromatic aberration will have acted to inflate the responses of cells to chromatically modulated gratings, and will thus have tended to lower 0,. We deal with this issue in the Discussion.
Interpretation of 8, and 6, 0,,, and 4, provide a functional description of the stimulus to which a neuron responds best: They provide an indication of what the preferred stimuli would look like and allow us to dis-
tern classes of neurons that have distinct chromatic properties, if such exist. However, 0, and 4, depend on the units in which one calculates chromatic contrast, and this can be measured in different ways (our units are defined in Materials and Methods). It would therefore be helpful to have some more fundamental expression of the chromatic properties of neurons. A useful one is provided by the proportions in which a cell adds signals from the different classes of cones.
Weights assigned to cone inputs The spectral sensitivities of the cones of Macaca fascicularis are now known precisely from the work of Baylor et al. (1987); those of R and G cones are indistinguishable from their human counterparts (Schnapf et al., 1987). If we assume that prerecep- toral losses are the same for macaque and human, we can use Smith and Pokorny’s (1975) fundamental sensitivities to cal- culate the quanta absorbed from any light by each class of cone.
When neurons in 1.g.n. and striate cortex are studied in a stable state of adaptation, the significant activity appears to be the change in discharge (modulated for linear nonoriented and simple cells, unmodulated for complex cells) brought about by modulating the stimulus. The average discharge rate appears to be unrelated to the level of illumination (the mean quantum catch in the cones)-indeed many cortical neurons have no maintained discharge at all-and the response of a neuron de- pends not on the absolute amplitude of stimulus modulation
658 Lennie et al. * Chromatic Mechanisms in Striate Cortex of Macaque
Figure 9. A, Spatial frequency char- acteristic of a complex cell in layer II/ III. Open circles, achromatic grating; filled circles, grating modulated in the isoluminant plane along the constant R,G axis (@ = 90”-270”). Left-hand points show responses to modulation of a spatially uniform field. B, Orientation selectivity for achromatic gratings of optimal spatial frequency. C-E, Am- plitude of unmodulated component of discharge to a moving grating of 3.6 c/deg, modulated along selected vectors in the 3 principal planes of the color space. Conventions as for Figure 7. For this neuron, O,,, = 90” and $J,,, = 180”.
0.1 1 10 100
Spatial Frequency (cldeg)
100 , , , , , , I I ,
240 260 280 300 320
Orientation (deg)
but on the relative amplitude of modulation (Michelson con- trast), presumably as a result of light-adaptation in the retina. Most light-adaptation appears to occur in the separate cone pathways, before the opponent site (see Mollon, 1982, for a review), and in the following analysis we have therefore assumed that the input to the chromatically opponent site from any class of cone reflects the relative modulation of the quantum catch in that class of cone.
The amplitude of response of a simple cell or a linear non- oriented cell can be expressed as
R = w&f, + w$lil, + wbMb> (3)
where R is the amplitude of the fundamental component of response, M,, M,, andM, are the modulations ofquantum catch- es in the R, G, and B cones respectively, and w,, wg, and w, are the weights with which the cell combines these modulated sig- nals. M,, M,, and Mb are obtained by direct calculation or by transformation of Eq. 1.
The relationship between w,, wZ, and w, and O,,, @,,,, and K can be derived from Eq. 1 and Eq. 3 and is given by
0 -45 0 45 90 135 Elevation through const. B axis (deg)
Elevation tkough
where the constants O,, OS, and 0, are the elevations, and &, +,, and & the azimuths of the directions of maximal response for the R, G, and B cones, respectively.
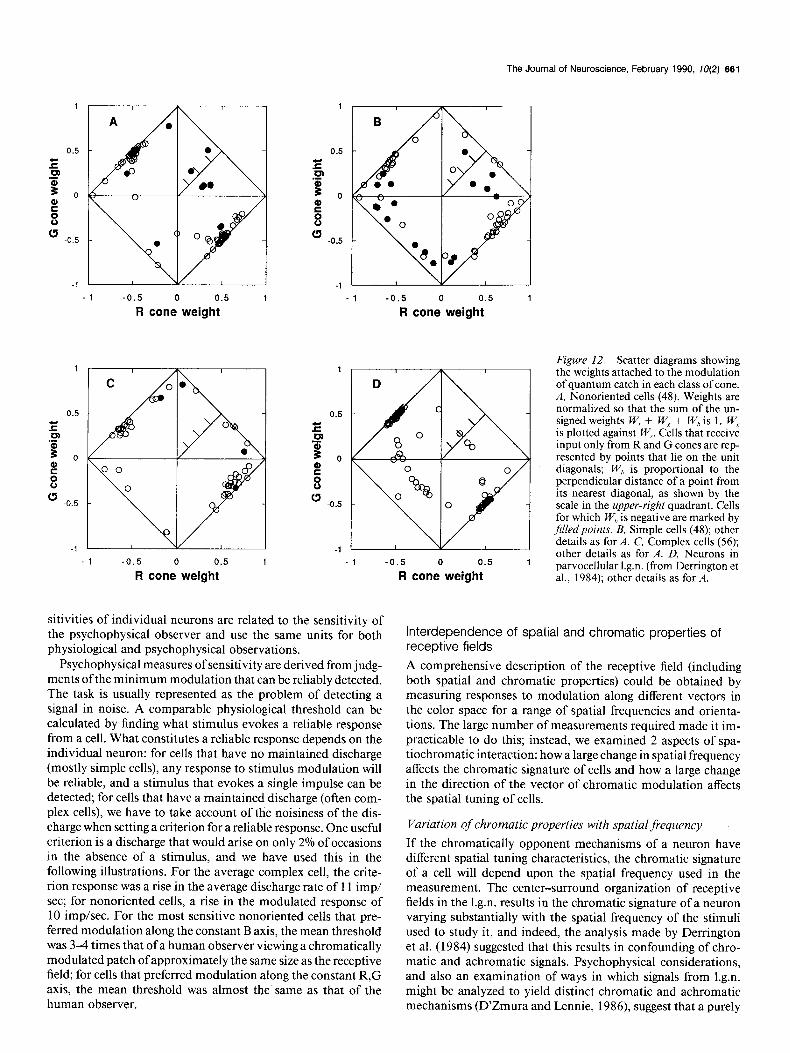
For complex cells, Eq. 3 is readily modified to represent the amplitude of the unmodulated increase in discharge brought about by the modulation of quantum catches. w,, wp, and w, can be estimated either by applying Eq. 4 to the estimated values of O,,, $,,, and K or directly from the solution to Eq. 3 that best fits the results obtained from the experiment in which stimuli were modulated along a series of vectors passing through the adaptation point (e.g., right-hand panels in Figs. 2, 4-7, and 9). The values obtained for w,, wp, and w, depend on the absolute sensitivity of the cell, so to discount these variations in overall sensitivity, we obtain the relative weight for each cone class ( W,, W,, and WJ by dividing each weight by the sum of the absolute weights attached to quantum catches in the 3 classes of cones, for example,
wr= Iw,l + ,I;, + Iw,l .
Since relative weights sum to unity, they can all be represented on a plot of W, against W,, in which W, is given directly. Figure 12 shows these plots for linear nonoriented cells (A), simple cells (B), complex cells (CJ, and (from Derrington et al., 1984) neu-
8
90”
The Journal of Neuroscience. February 1990, 1~72) 659
45”
hh. 0.5 1 1.5 2 2.5
135”
Figure IO. Responses of a neuron sharply tuned for hue. Histograms show pattern of average discharge to modulation of a spatially uniform field along vectors in the 3 principal planes of the color space. Rows contain histograms of responses to gratings modulated along vectors of constant elevation (the long row for 0 = o”, the isoluminant plane), and columns contain histograms of responses to gratings modulated along vectors of constant azimuth. The amplitude of modulation was fixed at 0.5, except for gratings modulated along vectors in the isoluminant plane, where it was set to the maximum attainable. Each histogram contains the response to 20 presentations of the stimulus. Calibration: ordinate, 100 imp/set; abscissa, 0.5 set; bin width, 8.4 msec.
rons in parvocellular 1.g.n. (D). Units that are driven by signals from R and G cones only are represented by points that lie on the diagonals connecting unit values on the axes; if a neuron receives opposed inputs from R and G cones, it is represented in the second or fourth quadrants; if a unit receives signals of the same polarity from R and G cones, it is represented in the first or third quadrants. Units that receive signals from B cones lie inside the unit diagonals; those for which W, is less than -0.1 are represented by filled circles.
In each panel of Figure 12, many points lie in the upper-left and lower-right quadrants, and mark cells driven by opposed inputs from R and G cones. For simple cells (B) and complex cells (C), substantially greater weight is attached to signals from R cones than to signals from G cones; for linear nonoriented cells (A) signals from the 2 classes of cones are more equally weighted, as they are for neurons in parvocellular 1.g.n. (0). In the population of simple cells (Fig. 12B), 17 of 48 neurons were driven by R and G cone inputs of the same polarity; 11 of 56 complex cells were driven by inputs of the same polarity.
The results in Figure 12, which show that most neurons in striate cortex have chromatically opponent receptive fields, appear to be at odds with the results in Figure 11, B and C, which shows that most simple and complex cells prefer nearly achromatic stimuli. The apparent contradiction arises because one normally expects cells that have opposed inputs from dif- ferent classes of cones to show overt chromatic opponency of
the kind revealed by a biphasic spectral sensitivity curve. In fact, consideration of the spectral sensitivities of R and G cones shows that a neuron will be overtly opponent only if the opposed inputs from these cones are well-balanced. A modest prepon- derance of input from either class of cone, but particularly the R cone, will leave a cell responding well to achromatic stimuli. For most simple and complex cells inputs from R cones were strongly preponderant: Figure 13, A and B, shows the distri- bution of the logarithm of the ratio of weights W,l W, for the populations of simple and complex cells represented by Figure 12, B and C. For both simple and complex cells the modal value of the ratio is 2.5.
Reliability of measurement
The parameters 0,, and $,, provide a worthwhile chromatic sig- nature only if they are reliably measured. Descriptive and in- ferential statistical methods exist for the treatment of spherical measures (Mardia, 1972), and we have used these to compute the 95% confidence limits for the mean directions (0, and 4,) for sets of measurements obtained from 6 haphazardly se- lected cells. For each cell, we calculated 0,, and $,, separately for each of the 20 presentations of the full set of stimuli mod- ulated in different directions. The variance of the sample of measures was calculated using procedures given by Mardia (1972, pp. 2 18-222). The distance from the sample mean direction to theconfidence limitwas 2.4,3.3,7.5,9.1, 10.0, and 16.7 degrees
660 Lennie et al. * Chromatic Mechanisms in Striate Cortex of Macaque
10 B = ii
6
5 5
2
z’ 0 llL&
A
F 100 , I
2 80 3
.*
I l
l
; 60-O. CE &
l l
3 40 - l
. l *a -
l 0
d’
l
l 5 =
60
!z 0, al 40
5
% 20
0” A-l 14 l
l l
0 5 10 1520 2530 Number of Cells
0- -45 0 45 90 135
Optimum azimuth (deg)
0 -45 0 45 90 135 0 5 10 15
Optimum azimuth (deg) Number of Cells
30
8 25
8 20
6 15 f n ‘0 E z’ 5
0
t
5 Ii
60 -
5 Q) 40 - E
g 20-
8
0 5 10 15 20
Number of Cells
-45 0 45 90 135 0 5 10 15 20
Optimum azimuth (deg) Number of Cells 0 ’ I
-45 0 45 90 135
Optimum azimuth (deg)
Figure 11. Distribution of azimuth (0,) and elevation ($J,.) of maximal response. A, Nonoriented cells (48). The histogram above the scatter plot shows the distribution of &,; that to the right, the distribution of O,,. In the histogram of &J,, solid components denote cells with 8, ~45”; shaded components denote cells with 0, >45”. B, Simple cells (48); other details as for A. C, Complex cells (56); other details as for A. D, Neurons in parvocellular 1.g.n. (from Derrington et al., 1984); other details as for A.
for the cases tested (Mardia, pp. 260-261). That is, the proba- bility is 0.95 that the true means lay within these distances from the sample means.
If 0,, is near 90”, a relatively small confidence interval ex- pressed in angular terms can disguise larger uncertainty in the weights that the neuron attaches to inputs from the different classes of cones. This reflects the fact that 0, for both R and G cones lies close to 90”.
Sensitivity to chromatic modulation 0,,, and d,,,, or the relative cone weights, provide a chromatic signature but say nothing about the absolute sensitivity of a
neuron. The scale factor K (Eq. 1) provides a measure of sen- sitivity to modulation, but K depends upon the units in which contrast is measured. One widely used definition represents the contrast of a heterochromatic grating as the Michelson contrast of its 2 out-of-phase homochromatic components, but this mea- sure is physiologically unrealistic because it takes no account of the spectral composition of the components. Even for an op- timally chosen pair of lights, the maximum attainable modu- lation of the quantum catches in R or G cones is about 25%; mostly it is much less. Lennie and D’Zmura (1988) discuss other measures of contrast, but all have attendant disadvantages. We need not be concerned about units if we ask only how the sen-
The Journal of Neuroscience, February 1990, IO(2) 661
- I -0.5 0 0.5 1 -1 -0.5 0 0.5 1
R cone weight R cone weight
. 1 -0.5 0 0.5 1
R cone weight
1
0.5
E F
t 0
z
8
(3 -0.5
-1
Figure 12. Scatter diagrams showing the weights attached to the modulation of quantum catch in each class of cone. A, Nonoriented cells (48). Weights are normalized so that the sum of the un- signed weights W, + W, + W,, is 1. W, is plotted against W,. Cells that receive input only from R and G cones are rep- resented by points that lie on the unit diagonals; W,, is proportional to the perpendicular distance of a point from its nearest diagonal, as shown by the scale in the upper-right quadrant. Cells for which W,> is negative are marked by filled points. B, Simple cells (48); other details as for A. C, Complex cells (56); -
-1 -0.5 0 0.5 1 other details as for A. D, Neurons in
R cone weight parvocellular 1.g.n. (from Derrington et al., 1984); other details as for A.
sitivities of individual neurons are related to the sensitivity of the psychophysical observer and use the same units for both physiological and psychophysical observations.
Psychophysical measures of sensitivity are derived from judg- ments of the minimum modulation that can be reliably detected. The task is usually represented as the problem of detecting a signal in noise. A comparable physiological threshold can be calculated by finding what stimulus evokes a reliable response from a cell. What constitutes a reliable response depends on the individual neuron: for cells that have no maintained discharge (mostly simple cells), any response to stimulus modulation will be reliable, and a stimulus that evokes a single impulse can be detected; for cells that have a maintained discharge (often com- plex cells), we have to take account of the noisiness of the dis- charge when setting a criterion for a reliable response. One useful criterion is a discharge that would arise on only 2% of occasions in the absence of a stimulus, and we have used this in the following illustrations. For the average complex cell, the crite- rion response was a rise in the average discharge rate of 11 imp/ set; for nonoriented cells, a rise in the modulated response of 10 imp/set. For the most sensitive nonoriented cells that pre- ferred modulation along the constant B axis, the mean threshold was 3-4 times that of a human observer viewing a chromatically modulated patch of approximately the same size as the receptive field; for cells that preferred modulation along the constant R,G axis, the mean threshold was almost the same as that of the human observer.
Interdependence of spatial and chromatic properties of receptive fields
A comprehensive description of the receptive field (including both spatial and chromatic properties) could be obtained by measuring responses to modulation along different vectors in the color space for a range of spatial frequencies and orienta- tions. The large number of measurements required made it im- practicable to do this; instead, we examined 2 aspects of spa- tiochromatic interaction: how a large change in spatial frequency affects the chromatic signature of cells and how a large change in the direction of the vector of chromatic modulation affects the spatial tuning of cells.
Variation of chromatic properties with spatial frequency
If the chromatically opponent mechanisms of a neuron have different spatial tuning characteristics, the chromatic signature of a cell will depend upon the spatial frequency used in the measurement. The center-surround organization of receptive fields in the 1.g.n. results in the chromatic signature of a neuron varying substantially with the spatial frequency of the stimuli used to study it, and indeed, the analysis made by Derrington et al. (1984) suggested that this results in confounding of chro- matic and achromatic signals. Psychophysical considerations, and also an examination of ways in which signals from 1.g.n. might be analyzed to yield distinct chromatic and achromatic mechanisms (D’Zmura and Lennie, 1986), suggest that a purely

662 Lennie et al. f Chromatic Mechanisms in Striate Cortex of Macaque
B 16 -
fn z fJ 12 -
6
ki a- e
z’ 4-
0- 14 -1 -0.5 0.5
Log Pwr/wg, 1
Figure 13. Distribution of the ratio of unsigned weights attached to the modulation of the quantum catches in R and G cones for simple (A) and complex (B) cells. Histograms show the logarithm of the ratio 1 W,/W,l . The median R:G ratio of sensitivities is 1.6 (mean, 3.8) for both types of cell.
achromatic mechanism will be relatively insensitive to low spa- tial frequencies, while a purely chromatic one will be most sen- sitive to low spatial frequencies, and that the chromatic prop- erties of both mechanisms will be stable to variations in the spatial characteristics of the stimulus.
Since most simple and complex cells respond to relatively narrow ranges of spatial frequency, their chromatic properties must be relatively unaffected by changes in the spatial properties of stimuli. Some simple cells and many linear nonoriented cells responded well to both moving gratings and temporally mod- ulated uniform fields. Figure 14, A and B, shows, for nonoriented and simple cells whose chromatic properties were examined both with spatially uniform fields and with gratings, how 8, was altered by the change of spatial frequency. For both groups of cells (though more so for the nonoriented), 0, was generally lower when measured with a spatially uniform field. This be- havior resembles that of neurons in parvocellular 1.g.n. (cf. Der- rington et al., 1984, Fig. 8) and implies that one of the chro- matically opponent mechanisms in the receptive field resolved higher spatial frequencies than the other. However, it should be borne in mind that at middle spatial frequencies, uncorrected chromatic aberration may manifest itself as chromatic oppo- nency in neurons that are not at all chromatically opponent and may lead to overestimates of the spatial opponency in neurons that have nearly coextensive chromatically opponent mecha- nisms (Flitcroft, 1989). We return to this question in the Dis- cussion. The relation between cone weights and 8, is nonlinear (Eq. 4). Thus, in interpreting Figure 14 it should also be borne in mind that B,,, if small, will be substantially altered by a small change in the relative weights that a neuron attaches to signals from the different classes of cone.
0 45 90 Elevation with spatially uniform field
0 45 90 Elevation with spatially uniform field
Figure 14. Effect of spatial frequency on the chromatic properties of nonoriented cells (A) and simple cells (B). For those neurons whose chromatic properties could be characterized using both gratings and spatially uniform fields, O,,, estimated from responses to gratings of the optimal spatial frequency is plotted against O,,, estimated from responses to a spatially uniform field modulated along the same vectors. O,,, is generally lower when measured with uniform fields.
Variation of spatial properties with chromaticity of modulation
If the chromatically opponent mechanisms in a receptive field have different spatial properties, the spatial selectivity of the neuron should depend upon the chromatic composition of the stimulus. This is well-established for neurons in parvocellular l.g.n., where the center-surround arrangement ofmost receptive fields results in the spatial selectivity being band-pass for ach- romatic stimuli and low-pass for heterochromatic ones (De- Valois et al., 1977; Derrington et al., 1984).
For those cortical neurons that could be driven by both ach- romatically modulated stimuli and chromatically modulated ones, we measured the spatial selectivity with an achromatic stimulus and with a chromatic one modulated along the vector 8 = 0, I#) = lp,,.
Linear nonoriented cells Figures 2A and 4A show the spatial selectivities of 2 nonoriented cells whose other properties were described earlier. Figure 15 shows the selectivities of 4 other cells.
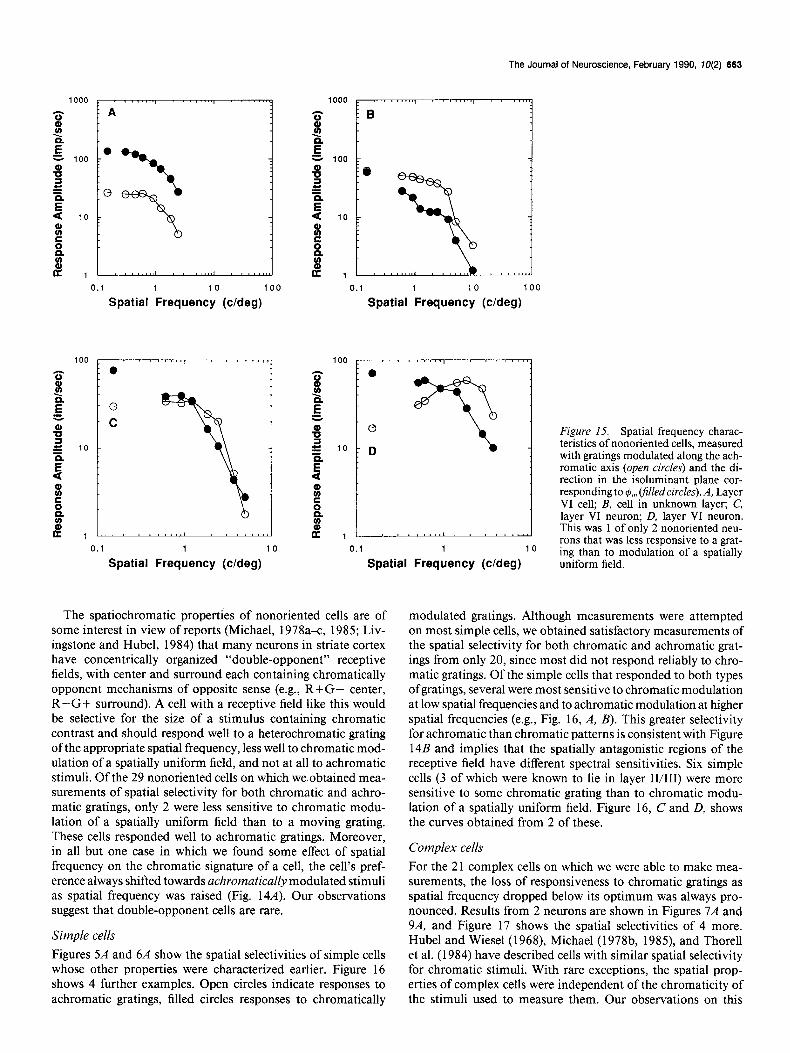
The Journal of Neuroscience, February 1990, 10(2) 663
0.1 1 10 100
Spatial Frequency (cldeg)
0.1 1 10
Spatial Frequency (cldeg)
0.1 1 10 100
Spatial Frequency (cldeg)
100 t . I...-.,
% .o
c
E" e
3 0 Figure 15. Spatial frequency charac-
s lo - D teristics of nonoriented cells, measured
%
; T; with gratings modulated along the ach- romatic axis (open circles) and the di-
si rection in the isoluminant plane cor-
E responding to @,,, (filled circles). A, Layer VI cell; B, cell in unknown layer; C,
$ layer VI neuron; D, layer VI neuron.
$1 I This was 1 of only 2 nonoriented neu-
0.1 1 10 rons that was less responsive to a grat- ing than to modulation of a spatially
Spatial Frequency (c/deg) uniform field.
The spatiochromatic properties of nonoriented cells are of some interest in view of reports (Michael, 1978a-c 1985; Liv- ingstone and Hubel, 1984) that many neurons in striate cortex have concentrically organized “double-opponent” receptive fields, with center and surround each containing chromatically opponent mechanisms of opposite sense (e.g., R+G- center, R-G+ surround). A cell with a receptive field like this would be selective for the size of a stimulus containing chromatic contrast and should respond well to a heterochromatic grating of the appropriate spatial frequency, less well to chromatic mod- ulation of a spatially uniform field, and not at all to achromatic stimuli. Of the 29 nonoriented cells on which we obtained mea- surements of spatial selectivity for both chromatic and achro- matic gratings, only 2 were less sensitive to chromatic modu- lation of a spatially uniform field than to a moving grating. These cells responded well to achromatic gratings. Moreover, in all but one case in which we found some effect of spatial frequency on the chromatic signature of a cell, the cell’s pref- erence always shifted towards achromatically modulated stimuli as spatial frequency was raised (Fig. 14A). Our observations suggest that double-opponent cells are rare.
Simple cells Figures 5A and 6A show the spatial selectivities of simple cells whose other properties were characterized earlier. Figure 16 shows 4 further examples. Open circles indicate responses to achromatic gratings, filled circles responses to chromatically
modulated gratings. Although measurements were attempted on most simple cells, we obtained satisfactory measurements of the spatial selectivity for both chromatic and achromatic grat- ings from only 20, since most did not respond reliably to chro- matic gratings. Of the simple cells that responded to both types of gratings, several were most sensitive to chromatic modulation at low spatial frequencies and to achromatic modulation at higher spatial frequencies (e.g., Fig. 16, A, B). This greater selectivity for achromatic than chromatic patterns is consistent with Figure 14B and implies that the spatially antagonistic regions of the receptive field have different spectral sensitivities. Six simple cells (3 of which were known to lie in layer II/III) were more sensitive to some chromatic grating than to chromatic modu- lation of a spatially uniform field. Figure 16, C and D, shows the curves obtained from 2 of these.
Complex cells For the 21 complex cells on which we were able to make mea- surements, the loss of responsiveness to chromatic gratings as spatial frequency dropped below its optimum was always pro- nounced. Results from 2 neurons are shown in Figures 7A and 9A, and Figure 17 shows the spatial selectivities of 4 more. Hubel and Wiesel (1968) Michael (1978b, 1985), and Thorell et al. (1984) have described cells with similar spatial selectivity for chromatic stimuli. With rare exceptions, the spatial prop- erties of complex cells were independent of the chromaticity of the stimuli used to measure them. Our observations on this

664 Lennie et al. - Chromatic Mechanisms in Striate Cortex of Macaque
Figure 16. Spatial frequency charac- teristics of simple cells. Selectivity for spatial frequency was measured with gratings modulated along the achro- matic axis (open circles) and the direc- tion in the isoluminant plane corre- sponding to $,,, @led circles). A, Cell in unknown layer; B, cell in unknown lay- er; C, cell in layer II/III, outside a region of dense cytochrome oxidase; D, neu- ron in unknown layer.
0.1 1 10 100
Spatial Frequency (Meg)
0.1 1 10 100
Spatial Frequency (Meg)
point agree with those of Thorell et al. (1984). The properties of these complex cells are most simply explained by supposing that the receptive field is comprised of linearly summing sub- units of the kind postulated by Spitzer and Hochstein (1985b) and that these subunits are spatially selective, with the same chromatic sensitivities in their opponent parts.
Distribution of neurons in cortex For a variety of reasons (such as dimpling of cortex or failure unambiguously to pinpoint a lesion), laminar positions are known certainly for only 198 cells (1 in layer I, 75 in layer II/III, 2 1 in layer IVA, 16 in layer IVB, 17 in layer IV&, 19 in layer IVC/?, 12 in layer V, and 37 in layer VI).
Sensitivity to chromatic modulation is apparently closely al- lied with sensitivity to low spatial frequencies. Layers IVC/3 and IVA contained a relatively large concentration of neurons that responded well to modulation of spatially uniform fields (2 1 of 39). Of these, 10 had 0,, of less than 45”. Neurons that responded well to spatially uniform fields were also relatively common in layer VI (26 of 40) and of these 10 had 0,, less than 45”. In other layers, very few cells responded to modulation of uniform fields.
Outside layer IV, striate cortex contains regularly spaced re- gions (“blobs”) that in histological sections stain densely for the mitochondrial enzyme cytochrome oxidase (Horton and Hubel, 198 1; Humphrey and Hendrickson, 1983; Livingstone and Hu- bel, 1984). Where possible, we distinguished cells lying within
0.1 1 10 100
Spatial Frequency (Meg)
0.1 1 10 100
Spatial Frequency (c/deg)
and between blobs, but in several animals the cytochrome re- action in the region of cortex underlying the craniotomy was substantially weaker than in adjacent cortex, and in these ani- mals it was not possible unequivocally to assign cells to blobs or to the interstices.
Neurons in layer II/III are of special interest in view of reports (Livingstone and Hubel, 1984; Ts’o and Gilbert, 1988) that blobs are particularly rich in chromatically opponent neurons. Figure 18 shows the distribution of 0,, and +,, for all the neurons known to be in layer II/III. If the measurement was made at more than one spatial frequency, the parameters were estimated from the one to which the cell was most sensitive. In no case did a neuron respond most strongly to modulation of a spatially uniform field. Neurons positively identified as lying in blobs are marked by filled circles, and those known to be in the interstices are marked by open circles. Of the other neurons, those that were not orientation-selective (and therefore more likely to lie in blobs) are marked by filled squares, and those that were orientation-selective are marked by open squares. In this sam- ple, there is evidently no clustering of chromatic properties that can be easily tied to a cell’s presence in a region rich in cyto- chrome oxidase. Six of the neurons encountered had 8, less than 45”, but there was no indication of a population of cells specially sensitive to chromatically modulated stimuli. Indeed, the most distinctive characteristic of the population of neurons in layer II/III was the paucity of cells that showed strong preferences for chromatically modulated stimuli. We consider in the Discussion how our findings are related to earlier work.

The Journal of Neuroscience, February 1990, IO(2) 665
I I . ,,.- 0.1 1 10 100
Spatial Frequency (cldeg)
0.1 1 10 100
Spatial Frequency (cldeg)
Spatial Frequency (c/deg)
D
;“r Figure 17. Spatial frequency charac- teristics of complex cells, measured with gratings modulated along the achro- matic axis (open circles) and the direc- tion in the isoluminant plane corre-
I- 1 sponding to q$,, (filled circles). The horizontal line on each plot marks the
0.1 1 10 100 maintained discharge to the adaptation Spatial Frequency (cldeg) point.
Discussion Transformation of signals from 1.g.n. With rare exceptions, the behavior of neurons in all layers of striate cortex is described well by a model in which a cell re- sponds to the weighted sum of signals from the 3 classes of cones (Eq. 1) or to the rectified sum of these signals (Eq. 2). For a particular spatial configuration, our model provides a succinct and complete description of the chromatic properties of neurons and can be used to predict the response of a neuron to stimuli of any chromaticity and luminance. Moreover, we can deduce the weights with which the neuron combines signals from the 3 classes of cone. The completeness of description and the sen- sitivity of measurements on cells in a neutral state of adaptation are the principal advantages of our technique over others (e.g., the measurement of spectra1 sensitivity) that are often used to characterize the chromatic properties of neurons.
Chromatic selectivity
The fact that Eq. 1 satisfactorily describes the behavior of neu- rons in 1.g.n. and linear (simple and nonoriented) neurons in striate cortex means that the cortical neurons are no more sharp- ly tuned for chromaticity than are neurons in the 1.g.n. More- over, since the behavior of most complex cells is well described by Eq. 2, these too must have the same selectivity as linear cortical neurons and neurons in 1.g.n. On this point our obser- vations agree with those of DeMonasterio and Schein (1982)
but differ from those of Thorell et al. (1984) who found simple cells to be more selective. Thorell et al. may have encountered (and treated as simple cells) narrowly tuned cells that we dis- tinguished from simple cells. We found 6 neurons that showed sharp selectivity for chromatic modulation along vectors on, or close to, the constant B axis; we know too little to develop an adequate account of their behavior. We could have overlooked some neurons that had even sharper selectivity, since in most experiments responses to chromatic modulation were sampled at 45” intervals.
Chromatic preferences
Although the chromatic selectivities of most cortical neurons are the same as those of neurons in l.g.n., cortical neurons generally have distinctively different chromatic preferences. This is evi- dent from the distributions of B,, and c$,, (Fig. 11) and from the distributions of cone weights (Fig. 12).
Although almost all neurons in striate cortex show some de- gree of chromatic opponency, only in the population of linear nonoriented cells was this pronounced, and even here the dis- tribution of c#I,, (the azimuth of preferred modulation) showed little of the crisp bimodality seen for parvocellular 1.g.n. (Fig. 11). Some neurons clearly preferred modulation along vectors that lay neither along the constant B axis nor along the constant R,G axis. Thorell et al. (1984) also found a broad but bimodal distribution of chromatic preferences in their population of sim-

666 Lennie et al. * Chromatic Mechanisms in Striate Cortex of Macaque
100 *I
0 0 8 80 n - 0 r9’0 m
E %D- % . moo
.‘c n 60 - o”
ti ii 0
Q) 40 - 0 n
E n
z ‘i; 20 0 El
0”
06 -45 0 45 90 135
Optimum azimuth (deg)
Figure 18. Distribution of 8,, and $,,, for all neurons known to be in layer II/III. These parameters were estimated using stimuli of the op- timal spatial configuration-for some cells, a spatially uniform field, for most, a grating. Filled circles, units lying within regions rich in cyto- chrome oxidase; open circles, neurons known to lie outside regions rich in cytochrome oxidase; jilled squares, units whose positions in relation to cytochrome oxidase blobs are unknown but which were orientation selective; open squares, units whose positions in relation to cytochrome oxidase blobs were unknown but which lacked orientation selectivity.
ple cells, which included linear nonoriented cells of the kind encountered here.
The weak chromatic opponency shown by most simple and complex cells distinguished them from nonoriented cells and from neurons in 1.g.n. Moreover, the chromatic properties of most simple and complex cells were stable to changes in spatial frequency. The fact that virtually all neurons in striate cortex are chromatically opponent revives the question (raised earlier by our work on 1.g.n.) of whether chromatic opponency per se is of any functional significance. The chromatic opponency found in almost all neurons in 1.g.n. is not taken to imply that their exclusive or principal role is to convey chromatic signals. Sim- ilarly, the prevalence of chromatic opponency in cortex em- phasizes that mere possession of the property is poor evidence for a role in color vision, and the weak opponency found in most simple and complex cells may have little significance. To evaluate a cell’s probable contribution to color vision, it is ob- viously necessary to characterize its chromatic properties fully and to consider these in relation to its other visual attributes.
Construction of receptive fields
The analysis of the weights with which cortical cells combine signals from different classes of cone (Figs. 12, 13) suggests that they receive simple combinations of signals from cones. Within a single R-G neuron in 1.g.n. (the class that must provide the dominant input to cortical cells), the signals from R and G cones are well balanced, yet simple and complex cells receive a pre- ponderant input from R cones. The question therefore arises as to how this imbalance is produced in cortex.
D’Zmura and Lennie (1986) described how canonical “chro- matic” and “achromatic” mechanisms could be created simply by the addition of signals from 2 neurons in 1.g.n. that had chromatically opponent receptive fields in the same place. Sim-
ple combination rules also can give rise to cells that are driven predominantly by one class of cone. We need to assume that R and G cones do not occur in equal numbers and that the im- balance of weights in a cortical cell reflects an imbalance in the numbers of ganglion cells and 1.g.n. cells with centers driven by the 2 types of cones. There is good reason to believe that in and close to the fovea each cone drives 2 midget ganglion cells (one plausibly on-center, the other off-center) and that the center of the receptive field of each ganglion cell is driven by a single cone (Schein, 1988). Suppose further that R cones are twice as nu- merous as G cones, an idea for which there is considerable psychophysical evidence (Cicerone and Nerger, 1989; Vimal et al., 1989). In the fovea there will be twice as many midget ganglion cells with receptive field centers driven by R cones as there are cells with centers driven by G cones. We presume (from the known close match between the number of optic nerve fibers and the number of relay cells in the 1.g.n.) that each midget ganglion cell drives a single neuron in parvocellular 1.g.n. This scheme forbids overlap of receptive field centers of ganglion cells or parvocellular neurons (except for an on/off center pair), so cortical cells that combine signals from parvocellular neurons must have receptive fields larger than those of the cells that drive them. Addition of signals from 1.g.n. neurons whose re- ceptive field centers lie along a line will produce a receptive field that has an elongated strip of high sensitivity driven by R and G cones in whatever proportions they occur along that line; a 2: 1 ratio of R to G cones will give rise to correspondingly weight- ed signals.
Consequences of chromatic aberration The focal length of the eye varies monotonically with wave- length, with the result that if the eye is in focus for one wave- length, it will be out of focus for all others. The differential defocus brought about by this longitudinal chromatic aberration may be as large as 3 diopters and will, for example, introduce achromatic contrast in a nominally isoluminant heterochro- matic grating. We therefore need to understand the effect of chromatic aberration in interpreting the responses to hetero- chromatic gratings.
Flitcroft (1989) has examined the effects of chromatic aber- ration on model neurons with receptive fields that have chro- matically opponent mechanisms that are spatially coextensive and has shown that for a model eye and grating patterns of the kind used in our experiments, the effects of chromatic aberration are negligible if neurons receive inputs from only R and G cones. For neurons that receive inputs from B cones opposed to some combined input from R and G cones, Flitcroft’s analysis shows that as a result of chromatic aberration 0, will rise as spatial frequency is raised, even though the receptive field is not spa- tially opponent. This effect may have contributed to the spatial- frequency dependent change in 0, for 1 or 2 of the nonoriented cells shown in Figure 14A, but for the simple cells characterized in Figure 14B, it is securely ruled out by the band-pass form of the spatial-frequency characteristic measured with achromatic gratings.
Laminar distribution of sensitivity to chromatic modulation
The neurons most sensitive to chromatic modulation lay mainly in layers IVA, IVCP, and VI and were least frequently seen in layers II/III and layer V. Other workers have also found chro- matically opponent neurons to be relatively common in the

The Journal of Neuroscience, February 1990, W(2) 667
subdivisions of layer IV, particularly layers IVA and IVCP: Gouras (1974) found them more often in layer IVCP (his layer 4B) than elsewhere; Livingstone and Hubel (1984) found that more than half the neurons studied in layer IVCP were color opponent; Dow (1974) and Dow and Gouras (1973) found color- opponent units most often in the region of layer IVA (their 3B); Vautin and Dow (1985) found “primary color” cells most often in layers IVCa and IVA. Michael (1985) concluded that most cells in layers IVA and IVCa were “color coded,” with double- opponent receptive fields. We saw no such cells in layer IV; we have no explanation for the disagreement. Our most surprising finding was the relatively high frequency with which we en- countered strongly opponent neurons in layer VI. No other phys- iological study has reported either a concentration of chromat- ically sensitive neurons or a concentration of neurons that lacked orientation selectivity, but in anatomical studies Tootell et al. (1988) have drawn attention to the fact that in layers V and VI there is strong patchy uptake of [YJ]2-deoxy-d-glucose when the macaque is exposed to a spatially uniform field flickering between red and an isoluminant gray.
Cells in layer II/III
Livingstone and Hubel (1984), and Ts’o and Gilbert (1988) found in layer II/III an abundance of chromatically opponent units in the blobs and a dearth of them in the interstices. Both groups reported that in the blobs about 70% of neurons with “nonoriented” receptive fields were chromatically opponent. Our results are consistent with the observation that neurons in blobs are chromatically opponent, but they challenge the ob- servation that chromatically opponent units are largely confined to the blobs: nearly all neurons encountered in our experiments gave discernible responses to isoluminant chromatic modula- tion, and these responses would have been a little stronger had we used saturated lights of the kind used in the other studies. By a U test, there is no significant difference (at the 5% level) between the preferred elevations of the cells in blobs and outside them. It is not clear that different workers use the same criteria to demarcate blobs. Moreover, we studied only 74 neurons in layer II/III, and as a consequence we might not have encoun- tered the full range of properties observed in the other studies. Nevertheless, we might have expected to see signs of the major groups identified by others.
One important difference between our experiments and the earlier ones is that our measurements provide a comprehensive description of the chromatic properties of neurons. In contrast, a simple division of cells into chromatically opponent and non- opponent classes provides little information about the kinds of stimuli to which the cells are most responsive and may lead one to divide the population where no objective boundary exists. Classification of cells into “opponent” and “nonopponent” groups may also obscure important differences in sensitivity to chromatically modulated stimuli. For example, although our units with strong chromatic opponency tended to have nonori- ented receptive fields, few of the nonoriented neurons in layer II/III had values of 0,, as low as those commonly found in nonoriented cells in layers IV and VI (cf. Figs. 18 and 11A).
Double-opponent cells Since these were first described in goldfish (Daw, 1968) they have occupied a prominent place in the physiology of color vision because they have been thought to play a role in the
perceptual phenomena of simultaneous color contrast and color constancy (Daw, 1984). We did not see linearly summing neu- rons that had classical double-opponent receptive fields, al- though some linearly summing units (mostly simple cells-see Fig. 16 and accompanying text) and some complex cells (see Fig. 17) responded better to chromatically modulated gratings than to chromatic modulation of spatially uniform fields. How- ever, such cells showed little preference for chromatically versus achromatically modulated stimuli (in only 2 cases was 0, less than 45”). Similar cells have been described before by Thorell et al. (1984). Complex cells would seem to provide a particularly poor substrate for a chromatic pathway since the nonlinearity of signal summation, which causes an unmodulated response to a moving grating, gives rise to indistinguishable responses to complementary excursions in chromaticity from the adaptation point.
Livingstone and Hubel (1984) identified many neurons in blobs as double-opponent, because chromatically opponent re- sponses to small stimuli were diminished as the stimuli were enlarged. This procedure admits as “double opponent” cells with a variety of receptive field organizations, including those in which the surround simply suppresses any activity evoked by stimulation of the chromatically opponent center-cells re- cently described by Hubel and Livingstone (1987) and Ts’o and Gilbert (1988). It is not clear what role such cells might have in color vision, since they respond poorly to chromatic mod- ulation of a spatially uniform field-the stimulus to which chro- matic mechanisms isolated in psychophysical experiments are most sensitive.
Flow of chromatic information from striate cortex One puzzling feature of our observations is that layer II/III, which appears to provide the most substantial projection to extrastriate cortex, contains few neurons with pronounced chro- matic opponency. Of those layers that contained neurons with strong chromatic opponency, only layer VI sends known pro- jections to V2 (Kennedy and Bullier, 1985). Perhaps this pro- jection provides a major conduit for chromatic signals.
Relationship to psychophysical work
A great deal of work (reviewed by Lennie and D’Zmura, 1988) points to the existence of 3 postreceptoral mechanisms that represent the light-dark, red-green, and yellow-blue dimensions of color experience. Several studies have attempted to measure the spatiotemporal properties of postreceptoral chromatic mechanisms by using isoluminant chromatic gratings that are presumed to excite only the red-green or blue-yellow mecha- nisms (Van der Horst and Bouman, 1969; Mullen, 1985). This work shows that the putative red-green and yellow-blue mech- anisms are most sensitive to very low spatial frequencies and have poor spatial resolution. Bradley et al. (1988) have used the same technique to show that chromatic mechanisms have rel- atively poor orientation sensitivity. Other work (e.g., Robson, 1966) suggests that the achromatic mechanism has a band-pass spatial sensitivity. We might therefore expect the major part of the chromatic signal to be carried by mechanisms that have low- pass spatial contrast sensitivity functions. These considerations implicate nonoriented cells, which are the most sensitive to chromatic modulation at low spatial frequencies, in the detec- tion of chromatic modulations, and they implicate simple and complex cells in the detection of achromatic patterns. However,
666 Lennie et al. * Chromatic Mechanisms in Striate Cortex of Macaque
few cells in striate cortex have the properties expected of the canonical chromatic mechanisms.
Because Derrington et al. (1984) found only 2 classes of par- vocellular neuron in 1.g.n. (one of which appeared to transmit information about the yellow-blue chromatic dimension, while the other apparently confounded the red-green and the achro- matic signals), we had expected to find that cortex would give rise to recognizable substrates of the chromatic and achromatic mechanisms identified in psychophysical experiments. The properties of many simple and complex cells come close to those expected ofan “achromatic” mechanism, and although the very sharp chromatic tuning of a small number of nonoriented cells (all with 0,, close to 0” and d, close to 0” or 180”) strongly implicates them in the analysis of chromatic signals, few others behaved as would the putative “red-green” or “blue-yellow” mechanisms: 0, rarely lay in the isoluminant plane, and al- though the modal values of $,, lay along the constant B axis and constant R,G axis, as might be expected from the psychophysical work of Krauskopf et al. (1982), for many neurons +,, lay neither along one of these axes nor along axes corresponding to the unique hues. Moreover, the chromatic properties of most neu- rons that responded to low spatial frequencies varied with the spatial frequency of the stimulus, though not to the degree seen in our earlier work on 1.g.n.
We also examined whether the responses of nonoriented cells could become depressed by prolonged exposure to chromatic modulation but found no clear evidence of habituation of the sort observed in analogous psychophysical experiments (Kraus- kopf et al., 1982).
Thus, while the putative achromatic mechanism seems to be reasonably well developed in striate cortex, there are only mod- est signs of the red-green and yellow-blue mechanisms whose existence is so firmly established by psychophysics. For these we apparently must look to regions beyond striate cortex.
References Baylor, D. A., B. J. Nunn, and J. L. Schnapf (1987) Spectral sensitivity
of cones of the monkey Macaca fascicularis. J. Physiol. (Lond.) 390: 145-160.
Bradley, A., E. Switkes, and K. K. DeValois (1988) Orientation and spatial frequency selectivity of adaptation to color and luminance gratings. Vision Res. 28: 841-856.
Cicerone, C. M., and J. L. Nerger (1989) The relative numbers of long- wavelength-sensitive to middle-wavelength-sensitive cones in the hu- man fovea centralis. Vision Res. 29: 115-128.
Daw, N. W. (1968) Color-coded ganglion cells in the goldfish retina: Extension of their receptive fields by means of new stimuli. J. Physiol. (Lond.) 197: 567-592.
Daw, N. W. (1984) The psychology and physiology of colour vision. Trends Neurosci. 7: 330-335.
DeMonasterio, F. M., and S. J. Schein (1982) Spectral bandwidths of color-opponent cells ofgeniculocortical pathway ofmacaque monkey. J. Neurophysiol. 47: 214-224.
Derrington, A. M., J. Krauskopf, and P. Lennie (1984) Chromatic mechanisms in lateral geniculate nucleus of macaque. J. Physiol. (Lond.) 357: 241-265.
DeValois, R. L., D. M. Snodderly, Jr., E. W. Yund, and N. K. Hepler (1977) Responses of macaque lateral geniculate cells to luminance and color figures. Sens. Proc. 1: 244-259.
DeValois, R. L., D. G. Albrecht, and L. G. Thorell (1982a) Spatial frequency selectivity of cells in macaque visual cortex. Vision Res. 22: 545-560.
DeValois, R. L., E. W. Yund, and N. K. Hepler (1982b) The orien- tation and direction selectivity of cells in macaque visual cortex. Vision Res. 22: 53 l-544.
Dow, B. M. (1974) Functional classes of cells and their laminar dis- tribution in monkey visual cortex. J. Neurophysiol. 37: 927-946.
Dow, B. M., and P. Gouras (1973) Color and spatial specificity of single units in rhesus monkey fovea1 striate cortex. J. Neurophysiol. 36: 79-100.
D’Zmura, M., and P. Lcnnie (1986) Mechanisms of color constancy. J. Opt. Sot. Am. A 3: 1662-1672.
Flitcroft, D. I. (1989) The interactions between chromatic aberration, defocus and stimulus chromaticity: Implications for visual physiology and calorimetry. Vision Res. 29: 349-360.
Gouras, P. (1974) Opponent-colour cells in different layers of fovea1 striate cortex. J. Physiol. (Lond.) 238: 583-602.
Horton, J. C., and D. H. Hubel (198 1) Regular patchy distribution of cytochrome oxidase staining in primary visual cortex of macaque monkey. Nature 292: 762-764.
Hubel, D. H., and M. S. Livingstone (1987) Segregation of form, color, and stereopsis in primate area 18. J. Neurosci. 7: 3378-34 15.
Hubel, D. H., and T. N. Wiesel (1968) Receptive fields and functional architecture of monkey striate cortex. J. Physiol. (Lond.) 195: 2 15- 243.
Humphrey, A. L., and A. E. Hendrickson (1983) Background and stimulus-induced patterns of high metabolic activity in the visual cortex (area 17) of the squirrel and macaque monkey. J. Neurosci. 3: 345-358.
Ingling, C. R., Jr., and E. Martinez-Uriegas (1983) The relationship between spectral sensitivity and spatial sensitivity for the primate r-g X-channel. Vision Res. 23; 1495-l 500.
Kennedy, H., and J. Bullier (1985) A double-labeling investigation of the afferent connectivity to cortical areas Vl and V2 of the macaque monkey. J. Neurosci. 5: 28 15-2830.
Krauskopf, J., D. R. Williams, and D. W. Heeley (1982) Cardinal directions of color mace. Vision Res. 22: 1123-l 13 1.
Lennie, P., and M. D’Zmura (1988) Mechanisms ofcolor vision. CRC Crit. Rev. Neurobiol. 3: 333-400.
Levick. W. R. (1972) Another tunnsten microelectrode. Med. Biol. Engin. IO: 5 1 d-5 15:
Livingstone, M. S., and D. H. Hubel (1984) Anatomy and physiology of a color system in primate primary visual cortex. J. Neurosci. 4: 309-356.
Mardia, K. V. (1972) Statistics of Directional Data, Academic Press, New York.
Michael, C. R. (1978a) Color vision mechanisms in monkey striate cortex: Dual-opponent cells with concentric receptive fields. J. Neu- rophysiol. 41: 572-588.
Michael, C. R. (1978b) Color vision mechanisms in monkey striate cortex: Simple cells with dual opponent-color receptive fields. J. Neu- rophysiol. 41: 1233-1249.
Michael, C. R. (1978~) Color-sensitive complex cells in monkey striate cortex. J. Neurophysiol. 41: 1250-1266.
Michael, C. R. (1985) Laminar segregation of color cells in the mon- key’s striate cortex. Vision Res. 25: 415-423.
Mollon, J. D. (1982) Color vision. Annu. Rev. Psychol. 33: 41-85. Movshon, J. A., I. D. Thompson, and D. J. Tolhurst (1978) Receptive
field organization ofcomplex cells in the cat’s striate cortex. J. Physiol. (Lond.) 283: 79-99.
Mullen; K. T. (1985) The contrast sensitivity of human colour vision to red-green and blue-yellow chromatic gratings. J. Physiol. (Lond.) 359: 38 l-400.
Robson, J. G. (1966) Spatial and temporal contrast sensitivity func- tions of the visual system. J. Opt. Sot. Am. 56: 1141-l 142.
Schnapf, J. L., T. W. Kraft, and D. A. Baylor (1987) Spectral sensitivity of human cone photoreceptors. Nature 325: 439-44 1.
Schein, S. J. (1988) Anatomy of macaque fovea and spatial densities of neurons in fovea1 representation. J. Comp. Neurol. 269: 479-505.
Sclar, G., J. H. R. Maunsell, and P. Lennie (1990) Coding of image contrast in central visual pathways of macaque. Vision Res. 30 (in press).
Smith, V. C., and J. Pokomy (1975) Spectral sensitivity of the fovea1 cone photopigments between 400 and 500 nm. Vision Res. 1.5; 16 l- 171.
Spitzer, H., and S. Hochstein (1985a) Simple- and complex-cell re- sponse dependences on stimulation parameters. J. Neurophysiol. 53: 1244-1265.
Spitzer, H., and S. Hochstein (1985b) A complex-cell receptive field model. J. Neurophysiol. 53: 1266-1286.
Thorell, L. G., R. L. DeValois, and D. G. Albrecht (1984) Spatial mapping of monkey Vl cells with pure color and luminance stimuli. Vision Res. 24: 75 l-769.
The Journal of Neuroscience, February 1990, 70(2) 669
Tootell, R. B. H., M. S. Silverman, S. L. Hamilton, R. L. DeValois, and E. Switkes (1988) Functional anatomy of macaque striate cor- tex. III. Color. J. Neurosci. 8: 1569-l 593.
Ts’o, D. Y., and C. D. Gilbert (1988) The organization of chromatic and spatial interactions in the primate striate cortex. J. Neurosci. 8: 1712-1727.
Van der Horst, G. J. C., and M. A. Bouman (1969) Spatiotemporal chromaticity discrimination. J. Opt. Sot. Am. 59: 1482-1488.
Vimal, R. L. P., J. Pokorny, V. C. Smith, and S. K. Shevell (1989) Fovea1 cone thresholds. Vision Res. 29: 6 l-78.
Walraven, P. L. (1974) A closer look at the tritanopic convergence point. Vision Res. 14: 1339-1343.
Wiesel, T. N., and D. H. Hubel (1966) Spatial and chromatic inter- actions in the lateral geniculate body of the rhesus monkey. J. Neu- rophysiol. 29: 1115-l 156.
Vautin, R. G., and B. M. Dow (1985) Color cell groups in fovea1 striate cortex of the behaving macaque. J. Neurophysiol. 54: 273-292.