chronic condition management model project · · 2017-07-03chronic conditions management model...
TRANSCRIPT
Chronic Conditions Management Model
‘Closing the Gap’ through innovative data use
AHHA Data & Innovation Meeting
Darwin, July 26, 2016
Paul Burgess – Top End Health Service

Gary Sinclair
Mark Ramjan
Patrick Coffey
Christine Connors
Leonie Katekar
Primary Health Care teams in 49 health centers
Aboriginal community workers & drivers
Nurses
Doctors
Visiting support staff
Acknowledgements
Background
CCMM Functional Reporting
Monthly recall list
Quarterly traffic light report
Quarterly management report
Next steps
Outline

Clinical context – tough job
• 34,000 mobile patients over 1.4 million Km2
• Triple whammy: IFD/Low SES/Chronic diseases
• Nurse led primary care + Aboriginal workers
• High staff turnover (non-Aboriginal)
• Language/Cultural barriers
• Evolving IT
• Distance!
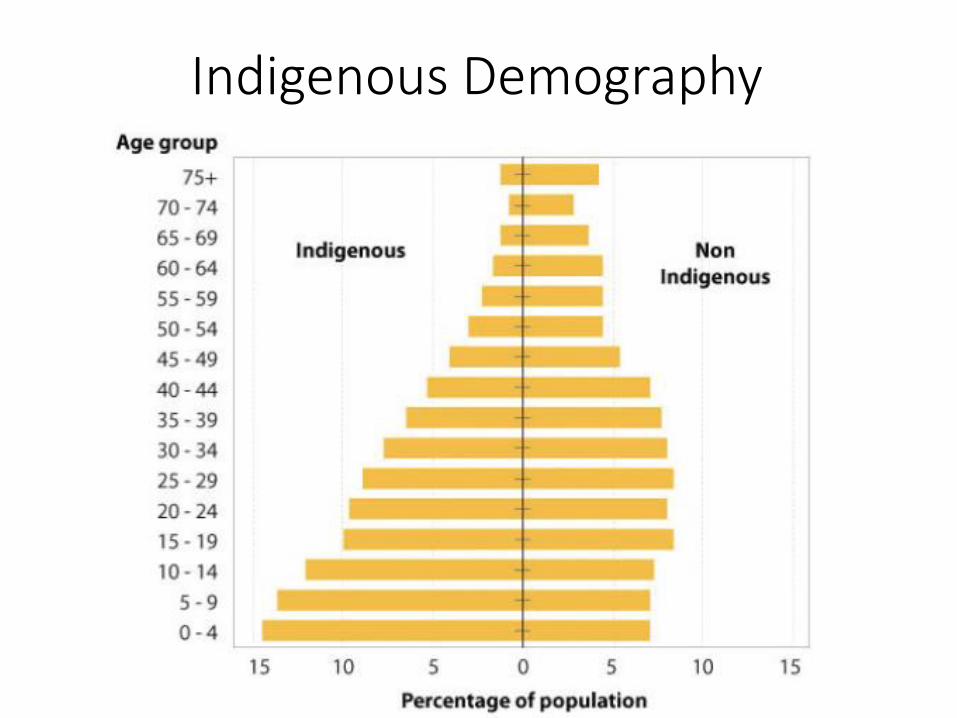
Indigenous Demography

Social Determinants of Health dominate

NT Trends in avoidable hospitalisation1998-2006
NT Indigenous
0
2000
4000
6000
8000
10000
12000
14000
16000
18000
Hospitalseparationsper 100 000
NT non-Indigenous
0
2000
4000
6000
8000
10000
12000
14000
16000
18000
Hospitalseparations per 100 000
Vaccine Vaccine
Acute Acute
ChronicChronic
Li SQ et al. (2009) Avoidable Hospitalisation in Aboriginal and non-Aboriginal people in
the Northern Territory MJA

Organisation of Care
• Strong leadership
• Strategic policy work
• Collaborations
• Teaching
• Data driven improvements• AHKPIs
• CQI
• CCMM: Functional reporting
• Data linkage/Research
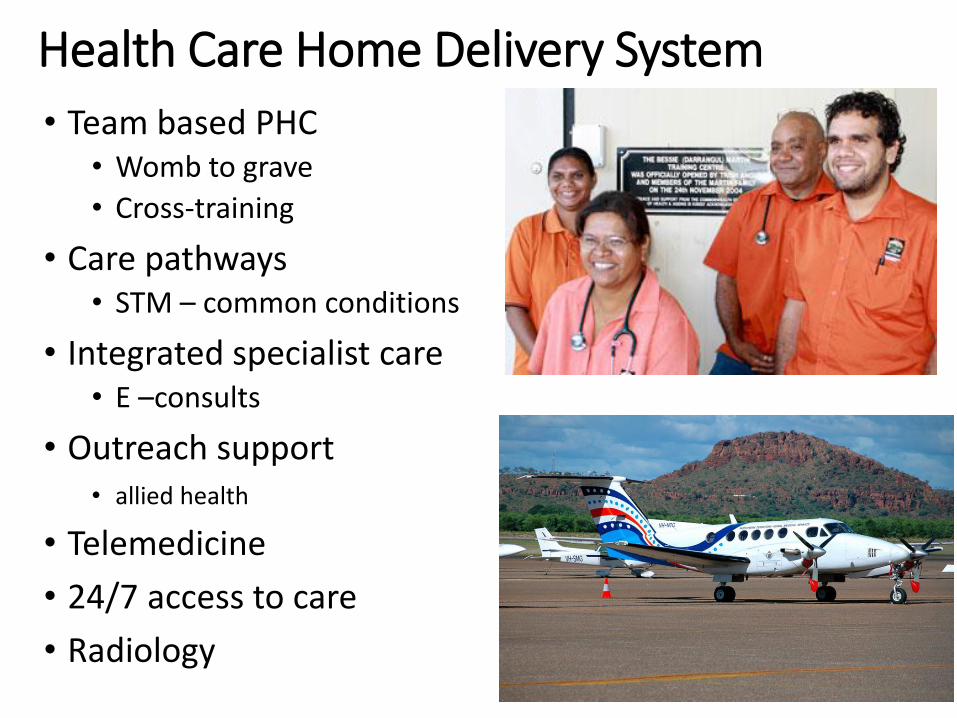
Health Care Home Delivery System
• Team based PHC• Womb to grave
• Cross-training
• Care pathways• STM – common conditions
• Integrated specialist care• E –consults
• Outreach support • allied health
• Telemedicine
• 24/7 access to care
• Radiology

Significant Health Improvements
Figure A.6 Death rates per 100 000 standard population, 1998–2031, Northern Territory
Source: ABS and AIHW—see Appendix D.
0
500
1000
1500
2000
2500
19
98
19
99
20
00
20
01
20
02
20
03
20
04
20
05
20
06
20
07
20
08
20
09
20
10
20
11
20
12
20
13
20
14
20
15
20
16
20
17
20
18
20
19
20
20
20
21
20
22
20
23
20
24
20
25
20
26
20
27
20
28
20
29
20
30
20
31
Rate
per 100 0
00
Actual Indigenous
Projected Indigenous rate
Indigenous variability bands
Actual non-Indigenous
Projected non-Indigenous rate
Indigenous trend 2006-2011
Indigenous trend 1998-2011

10 year history of CQI with noted limitations:
Sample size, manual audit, time delay, patient identification
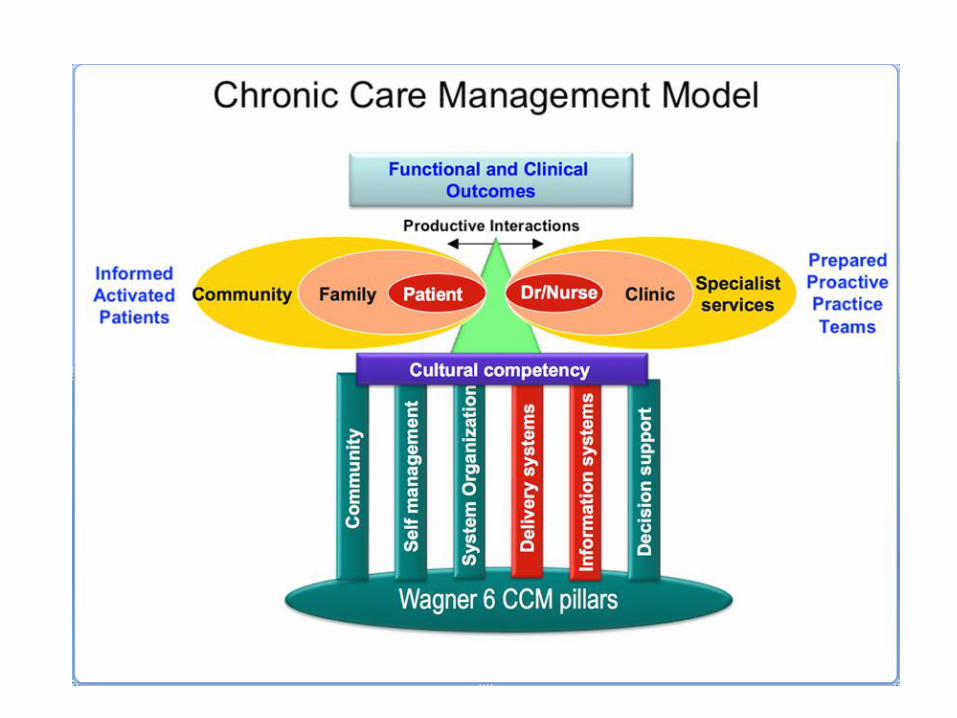
Functional reporting commenced August 2012
Based on Chronic Care Model (Wagner et al.)
“Chronic Conditions Management Model”
November 2012 - commenced NT-wide distribution of functional reporting to NT government primary care services (N=49)
CCMM Background

Primary Care EHR

Primary Care EHR functions
• Decision support• Structured care plans based on diagnostic groups
• Annual cycle of care delegated to team members
• Electronic prescribing
• Electronic billing (fee for service)
• 5Y Cardiovascular risk calculation (Framingham + 5%)
• Coordination of care• Secure messaging, Lab/Radiology and discharge summaries
• Electronic referrals

Inputs – one project manager, part-time data analyst
Orientation and training, project governance, quality assurance
Report production
Outputs – ‘functional’ reporting
Monthly patient recall lists
3-Monthly service-level report
3-Monthly management report
Chronic Conditions Management Model

Monthly Recall Reports Recall list for chronic disease tasks due in 3 month period
List of clients due to see the doctor
Reports circulated to: 49 health centres across the NT
27 communities in southern NT
22 communities in northern NT
Medical practitioners, Nurse managers
CQI Facilitators
Health Development Team (chronic conditions coordinators)
Alice Springs Prison
Darwin Prison
Monthly Reports

Empowerment tool for frontline primary health care teams
Includes all clients, diagnoses, meds, labs
Key components
Program goals & NT Key Performance Indicators
Management journey for T2DM and CVD
Medication reports (safe prescribing)
Workload management
3 Monthly Traffic Light Reports

Program goals

Management journey

Medication Reports
Medication Exception Reports No. Patients
On ACE and ARB : 1 Review and ? STOP either ACE or ARB
CVD : NO aspirin : 17
Diab & High CVR: NO aspirin : 21
Metformin with eGFR ≤ 50 : 3 Review and ? Reduce Dose
Metformin with eGFR ≤ 30 : 0
Medication safety

Workload planning
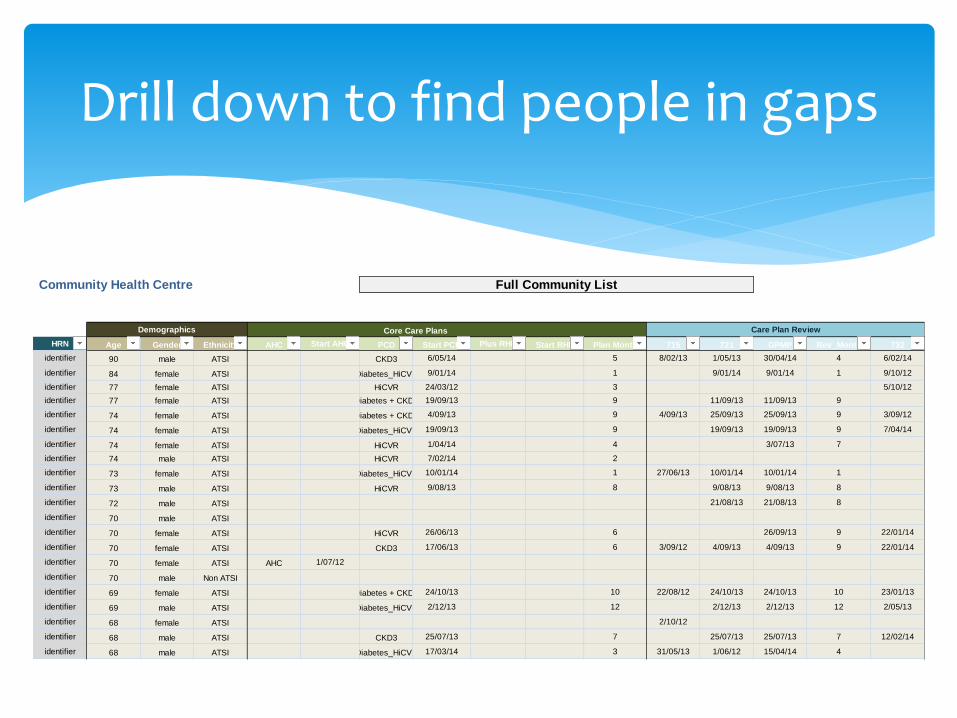
Community Health Centre
HRN Age Gender Ethnicity AHC Start AHC PCD Start PCD Plus RHD Start RHD Plan Month 715 721 GPMP Rev_Month 732
identifier 90 male ATSI CKD3 6/05/14 5 8/02/13 1/05/13 30/04/14 4 6/02/14
identifier 84 female ATSI Diabetes_HiCVR 9/01/14 1 9/01/14 9/01/14 1 9/10/12
identifier 77 female ATSI HiCVR 24/03/12 3 5/10/12
identifier 77 female ATSI Diabetes + CKD3 19/09/13 9 11/09/13 11/09/13 9
identifier 74 female ATSI Diabetes + CKD3 4/09/13 9 4/09/13 25/09/13 25/09/13 9 3/09/12
identifier 74 female ATSI Diabetes_HiCVR 19/09/13 9 19/09/13 19/09/13 9 7/04/14
identifier 74 female ATSI HiCVR 1/04/14 4 3/07/13 7
identifier 74 male ATSI HiCVR 7/02/14 2
identifier 73 female ATSI Diabetes_HiCVR 10/01/14 1 27/06/13 10/01/14 10/01/14 1
identifier 73 male ATSI HiCVR 9/08/13 8 9/08/13 9/08/13 8
identifier 72 male ATSI 21/08/13 21/08/13 8
identifier 70 male ATSI
identifier 70 female ATSI HiCVR 26/06/13 6 26/09/13 9 22/01/14
identifier 70 female ATSI CKD3 17/06/13 6 3/09/12 4/09/13 4/09/13 9 22/01/14
identifier 70 female ATSI AHC 1/07/12
identifier 70 male Non ATSI
identifier 69 female ATSI Diabetes + CKD3 24/10/13 10 22/08/12 24/10/13 24/10/13 10 23/01/13
identifier 69 male ATSI Diabetes_HiCVR 2/12/13 12 2/12/13 2/12/13 12 2/05/13
identifier 68 female ATSI 2/10/12
identifier 68 male ATSI CKD3 25/07/13 7 25/07/13 25/07/13 7 12/02/14
identifier 68 male ATSI Diabetes_HiCVR 17/03/14 3 31/05/13 1/06/12 15/04/14 4
Full Community List
Demographics Core Care Plans Care Plan Review
Drill down to find people in gaps

Management tool
Identify high and low performers
Trend data
Regional comparisons
Trend reports

Population wide data
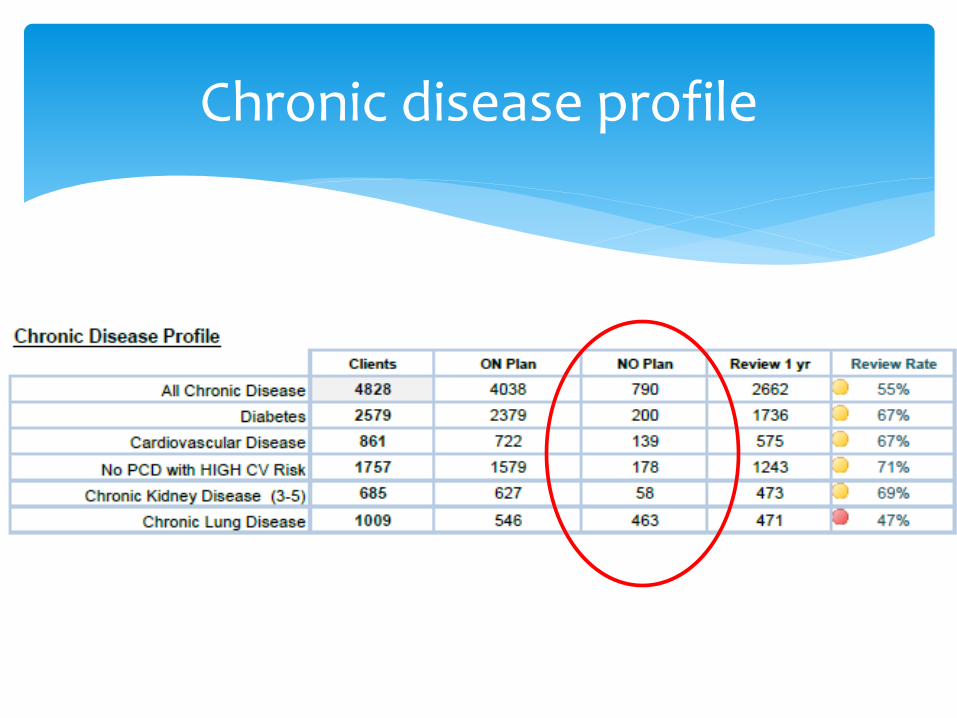
Chronic disease profile

Chronic conditions care

Cardiovascular disease risk (CVR)

Population outcomes
30%
35%
40%
45%
50%
55%
60%
Jun-
12
Oct
-12
Dec
-12
Feb
-13
May
-13
Aug
-13
Nov
-13
Feb
-14
May
-14
Aug
-14
Nov
-14
Feb
-15
Aug
-15
Aug
-15
Nov
-15
Feb
-16
Proportion Diabetics with HbA1c ≤ 8%
Central Australia Top End NT

Chronic condition care improved through:
Better coordination of care
Alignment and integration of care providers using data
Pro-active outreach to close evidence-practice gaps
Medication safety
Regular reporting to stimulate innovation and learning
Management for quality not targets
Identified benefits of the CCMM

KISS principle
Reports need to be ‘actionable’ (identify patients in care gaps) to engage busy frontline providers
‘Creative commons’ enabled by good quality data
Leverage of internal motivations of care providers
CCMM Lessons

Extension of functional reporting to children < 5Y program
More robust reporting format and ‘real-time’ reporting
Expand reporting to include medication dispensing
More technical assistance: service re-design (clinical microsystems)
Collaboratives
Capacity to respond to variations in practice
Next steps

Questions?
Thank You