church & dwight
TRANSCRIPT

CHURCH & DWIGHT BARCLAYS BACK TO SCHOOL CONFERENCE SEPTEMBER 2015

SAFE HARBOR STATEMENT

AGENDA
WHO WE ARE
TRENDS
HOW WE DELIVER
CHURCH & DWIGHT EVERGREEN MODEL
FINANCIALS
Q&A

AGENDA
WHO WE ARE
TRENDS
HOW WE DELIVER
CHURCH & DWIGHT EVERGREEN MODEL
FINANCIALS
Q&A

Who is Church & Dwight?
Founded in 1846

Started with Arm & Hammer Baking Soda

“TRUSTED AND LOVED BY GENERATIONS”
armandhammer.com
play commercial


9 Brands Drive Our Results

NET SALES PROFIT
Power Brands Represent 80% of Sales and Profits
CHD’s 4 Mega Brands

Mega Brands Represent 60% of Sales & Profits
20%Power Brands
60%Mega
Brands20%Other

YEAR ACQUIRED
Arm & Hammer $1 Billion Brand ---
Trojan #1 Condom Brand 2001
XTRA #1 Extreme Value Laundry
Detergent 2001
First Response #1 Pregnancy Kit Brand 2001
Nair #1 Depilatory Brand 2001
Spinbrush #1 Battery Powered
Toothbrush Brand 2005
OxiClean #1 Laundry Additive Brand 2006
Orajel #1 Oral Care Pain Relief Brand 2008
Avid #1 Adult & Kids Gummy
Vitamin 2012
We Are a Serial Acquirer

We Are Primarily a U.S. Company
2015
INTERNATIONAL
19%

Our Portfolio Is Balanced A Well-balanced Portfolio Of Household And Personal Care

Land Of The Giants 2014 Net Sales ($ billions)
P&G Unilever KimberlyClark
Colgate Reckitt Clorox C&D
$83.1
$48.4
$19.7 $17.3 $13.3
$5.6 $3.3
Source: 2014 SEC Filings

Outstanding Returns to Our Shareholders
10 YEAR: 5 YEAR: 3 YEAR: 1 YEAR: YTD:*
*YTD as of 8/28/2015
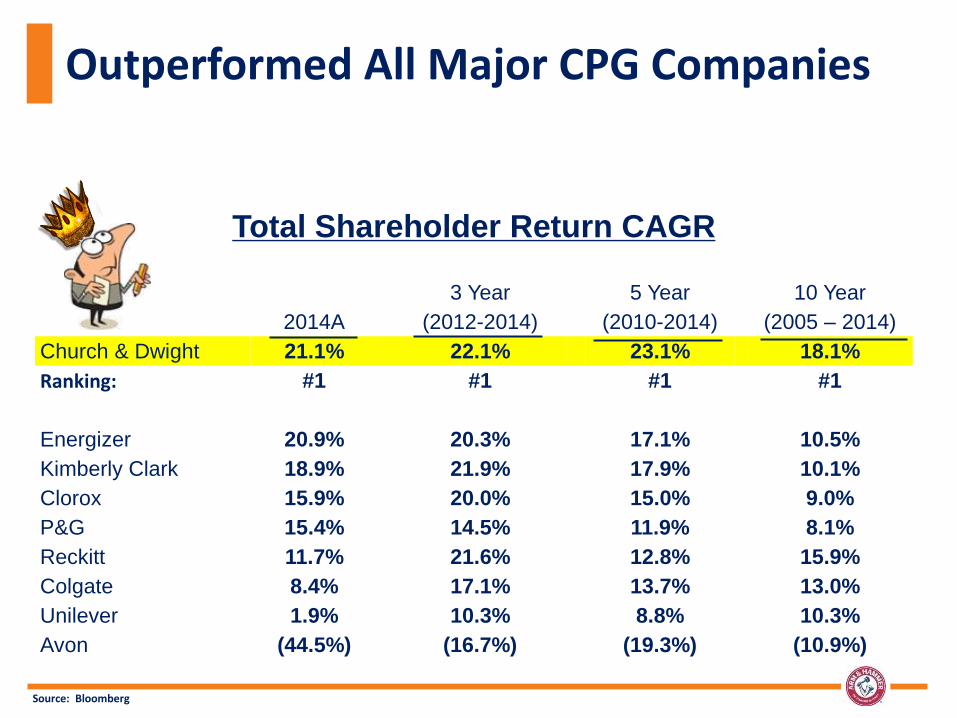
Total Shareholder Return CAGR
2014A
3 Year
(2012-2014)
5 Year
(2010-2014)
10 Year
(2005 – 2014)
Church & Dwight 21.1% 22.1% 23.1% 18.1%
Ranking: #1 #1 #1 #1
Energizer 20.9% 20.3% 17.1% 10.5%
Kimberly Clark 18.9% 21.9% 17.9% 10.1%
Clorox 15.9% 20.0% 15.0% 9.0%
P&G 15.4% 14.5% 11.9% 8.1%
Reckitt 11.7% 21.6% 12.8% 15.9%
Colgate 8.4% 17.1% 13.7% 13.0%
Unilever 1.9% 10.3% 8.8% 10.3%
Avon (44.5%) (16.7%) (19.3%) (10.9%)
Outperformed All Major CPG Companies
Source: Bloomberg

AGENDA
WHO WE ARE
TRENDS
HOW WE DELIVER
CHURCH & DWIGHT EVERGREEN MODEL
FINANCIALS
Q&A

1.5%
$51,939
Millennials (85 million ages 18 to 39)
U.S. Demographics “Demographics is destiny.” – Bill Clinton
Population Growth:
Median Household Income:
Largest US Population Segment:
Fastest Growing Ethnicity:
Percentage of Asian Immigrant Arrivals:
Hispanics 22% of population by 2040
35% 30% for Hispanics

80%
27%
Texas & California
U.S. Demographics
Life Expectancy at Birth:
65 or Older:
What Percentage of the Population Lives in Urban Areas?
What Percentage of Households are Single?
55% of Hispanics Live Where?
79
13% 19% by 2030

World Population is Growing Exponentially
Number of people living worldwide since 1700 in billions

Amazon first pure-play eRetailer to enter top-10 US retail sales list (#9)
Target reports 30% growth in US e-commerce
Walmart takes aim at Amazon, launching Shipping Pass ($50), and offering features similar to Amazon Prime ($99), for lower cost
On-line COT is Growing Rapidly
Source: Forrester Research, Online Sales Forecast, 2014

TOP FIVE ONLINE VIDEO DESTINATIONS
UNIQUE VIEWERS PER MONTH (millions)
TIME SPENT PER PERSON PER MONTH (hours:mins)
13.9 15.4 18.3
27.3
46.3
14:09
8:40 8:19
6:04
3:31
Source: Comscore, A18-34 Video Metrix Key Measures Report, February 2015
YouTube Dominates For Size Of Audience; Netflix Dominates In Time Spent On a Channel

Key Trend Implication
Value is driving purchase interest (a function of price and performance)
• Price points • Smaller pack sizes • Do It Yourself (DIY) • Focus on “Convenience” • Coupons
Media consumption shifts • TV remains the mass reach medium • On-line ratings are a trusted source • Targeted print remains viable • Radio influential among all segments -- and hyper-local • Hispanic media growth (bi/trilingual packaging)
Retailing shifts and shopping behavior • E-commerce • “Omni-channel” availability of our products
Pets as “Children” • Pet Personal Care • Pet Household Products
Focus on Personal Health • Self-care • Elder-care • Products for issues related to weight, nutrition, and allergies
Implications to CHD

AGENDA
WHO WE ARE
TRENDS
HOW WE DELIVER
CHURCH & DWIGHT EVERGREEN MODEL
FINANCIALS
Q&A

1. Recession Resistant Product Portfolio
2. Build Power Brand Shares
3. Ferociously Defend Our Brands
4. Driving International Growth
5. Focus on Gross Margin
6. Growth Through Acquisitions
7. “Best in Class” Free Cash Flow Conversion
8. Superior Overhead Management
9. Expert Management Team
10. TSR Junkies
Top 10 TSR Drivers
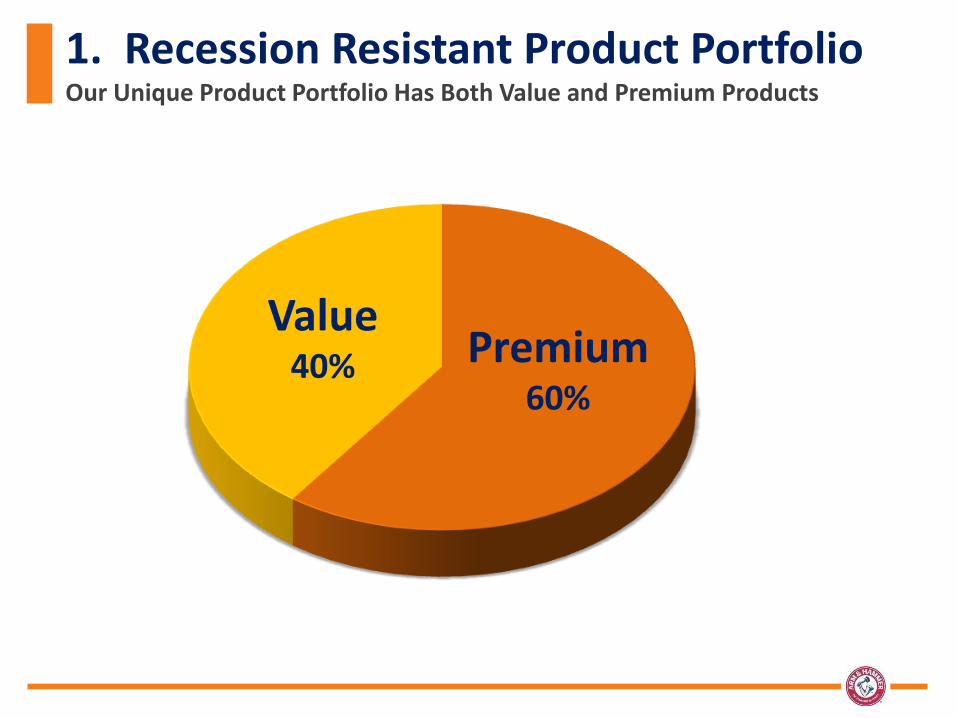
1. Recession Resistant Product Portfolio Our Unique Product Portfolio Has Both Value and Premium Products
Premium 60%
Value 40%

CHD’s Value Products Offer Meaningful $ Savings vs. Competitors Premium Brands

Recessionary Pressures Have Driven the Shift From Premium / Mid-Tier to Value Brands
-18.8
-18.9%
-0.3%
+12.5%
Premium Mid Value Extreme Value
Source: Nielsen Homescan Panel 52 Weeks Ending 6/28/08 vs. 52 Weeks Ending 12/27/14.
Pre-2008 Recession vs. 52 Weeks Ending Dec 2014

The Value Laundry Tier Has Now Passed the Mid-Priced Tier to Become the #2 Price Tier
% Laundry Detergent $ Share
Price Tiers 2009 2014
Premium 41.1% 42.0%
Mid-Priced 28.9% 26.6%
Value 26.6% 28.7%
Private Label 3.5% 2.7%
Source: C&D Custom Nielsen Scanning CY 2009 vs 52 wks end 12/27/14

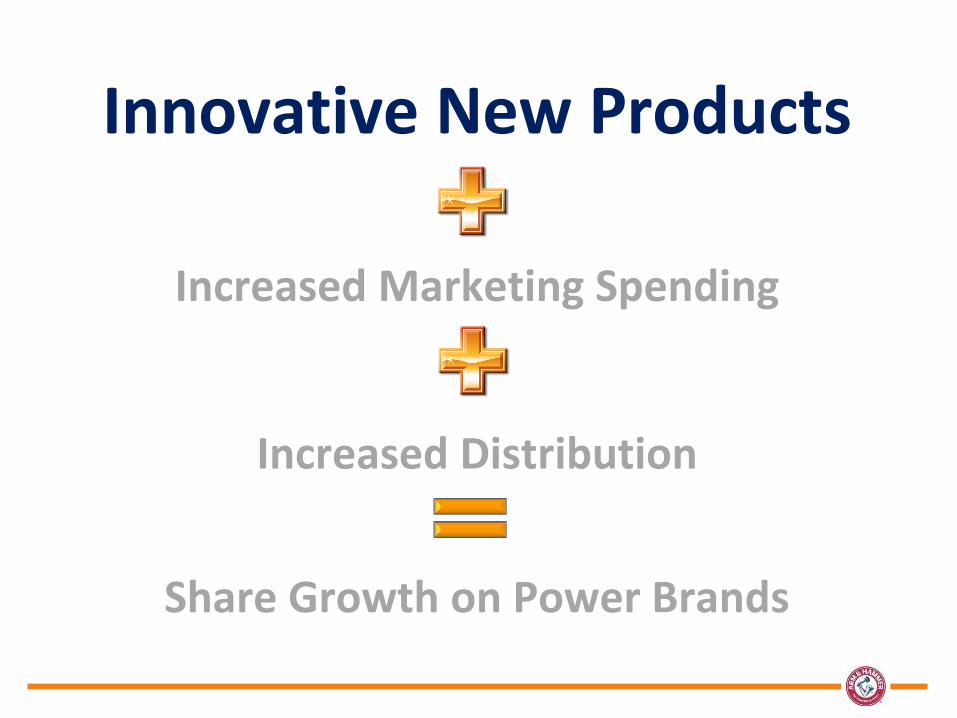
2. Build Power Brand Shares Consistent Share Growth Formula
Innovative New Products
Increased Marketing Spending
Increased Distribution
Share Growth on Power Brands
Innovative New Products
Increased Marketing Spending
Increased Distribution
Share Growth on Power Brands

2011 2012 2013 2014 2015E
Retail Sales
C&D is an Innovation Leader in Cat Litter Driven by Consumer Insights, Attributes Drive “News”, Easy to Read Architecture
Source: Neilson Retail Sales for 2011 -2014, Retail Sales for 2015 based on estimate

ARM & HAMMER Clump & Seal Drive Premium Litter Offerings Across All Growth Segments
2014 Results:
• Clump & Seal was the most
successful Litter new product launch
• Major contributor to category growth
of 8%
2015:
• Extending premium line of Clump &
Seal to both Lightweight and
Naturals

armandhammer.com

2015 ARM & HAMMER Launches Expanding the Clean Scentsations Platform in Fast-Growing Scent Booster Category
Unique Proposition
Builds on Successful
2014 Launch: • New entry in $290MM Scent
Booster category
• Long-lasting, vibrant scents
inspired by nature’s wonders!
• The only scent booster with
the freshening power of Pure
ARM & HAMMER Baking
Soda
Powerfully Clean. Vibrantly Fresh.
New for 2015
Arm & Hammer Clean Scentsations Liquid
Detergents
In-Wash Freshness Boosters

2015 OXICLEAN Launches Increase Shelf Presence in Bleach; Expand into Detergent
Unique Proposition Builds on
Successful 2014 Launch:
• Revives dingy whites
• Safe for colors; none of
the perceived damaging
effects of chlorine bleach
• No harsh chemical smell
or fumes
Bleach-like whitening without the risk of chlorine damage!
Liquid Additive Stain Remover
Powder & Paks
New for 2015
Laundry Detergent

2015 VITAMIN Launches
Vitafusion
Extra Strength Line
First Response
Reproductive Health

2015 TROJAN Launches
TROJAN H20 Closer & Sensitive Lubricant
TROJAN H20 Closer & Sensitive Lubricant
TROJAN Studded Bareskin Condom
TROJAN Magnum Bareskin Condom
TROJAN Vibrating
Bullet

Innovative New Products
Increased Marketing Spending
Increased Distribution
Share Growth on Power Brands

CHD is 13th Largest U.S. Advertiser
13. Church & Dwight
14. Coca-Cola
17. Campbell Soup
18. Clorox
20. Kimberly-Clark
22. GlaxoSmith Kline
26. S.C. Johnson
27. Colgate-Palmolive
Source: Syndicated Media Research (Dec. 2012 – Nov. 2014)

Consistent Marketing % of Net Revenue Marketing support over recent years has been constant
2011 2012 2013 2014 2015E
12.9% 12.2% 12.5% 12.6% ~12.5%

Stronger Digital Presence
• 70% Television
• 10% Print
• 20% Digital

Innovative New Products
Increased Marketing Spending
Increased Distribution
Share Growth on Power Brands

New Products Increased Marketing Increased Distribution
Change in All Distribution Channels
2009 Index
2014 Change
vs. 2009 Index
A&H Liquid Detergent 100 196
A&H Clumping Litter 100 184
Trojan Condoms 100 118
First Response Diag. 100 112
XTRA Liquid Detergent 100 135
Nair Dep/Wax/Bleach 100 103
Spinbrush Toothbrushes 100 148
OxiClean Stainfighter 100 154
Source: Nielsen AOC 52 Weeks Ending 12/27/14 vs. 12/26/09 Total ACV Points

Innovative New Products
Increased Marketing Spending
Increased Distribution
Share Growth on Power Brands

CHD Consistent Share Growth Formula Worked!
2008 2009 2010 2011 2012 2013 2014
CHD CHD CHD CHD CHD CHD CHD
A&H
XTRA
OxiClean
First Response (PTK)
Nair
Trojan
Spinbrush
Orajel (Toothache)
Vitamins N/A N/A N/A N/A
Source: Nielsen All Outlet YE 2007, 2008, 2009, 2010, 2011 2012, 2013, 2014 All Outlet
Power Brands Met or Exceeded Category Growth 75% of Time Over Last 7 Years

3. Ferociously Defend Our Brands

In 2014, the #1 Laundry Brand Attacked the Value Laundry Detergent Category With a
Major New Product Launch

CHD Ferociously Defended With Innovative New Products

+ 5%
Increase in
Ad & Trade
Spending

CHD Grew Its Share of Total Laundry Detergent to 14.2% - a Strong #2 Position
Total Laundry Detergent Market Share
2013 2014 Change
P&G 59.3 59.8 +0.5
CHD 14.0 14.2 +0.2
Sun 12.8 12.5 -0.3
Henkel 6.6 6.3 -0.3
Total Laundry Detergent Market Share
2013 2014 Change
P&G 59.3 59.8 +0.5
CHD 14.0 14.2 +0.2
Sun 12.8 12.5 -0.3
Henkel 6.6 6.3 -0.3
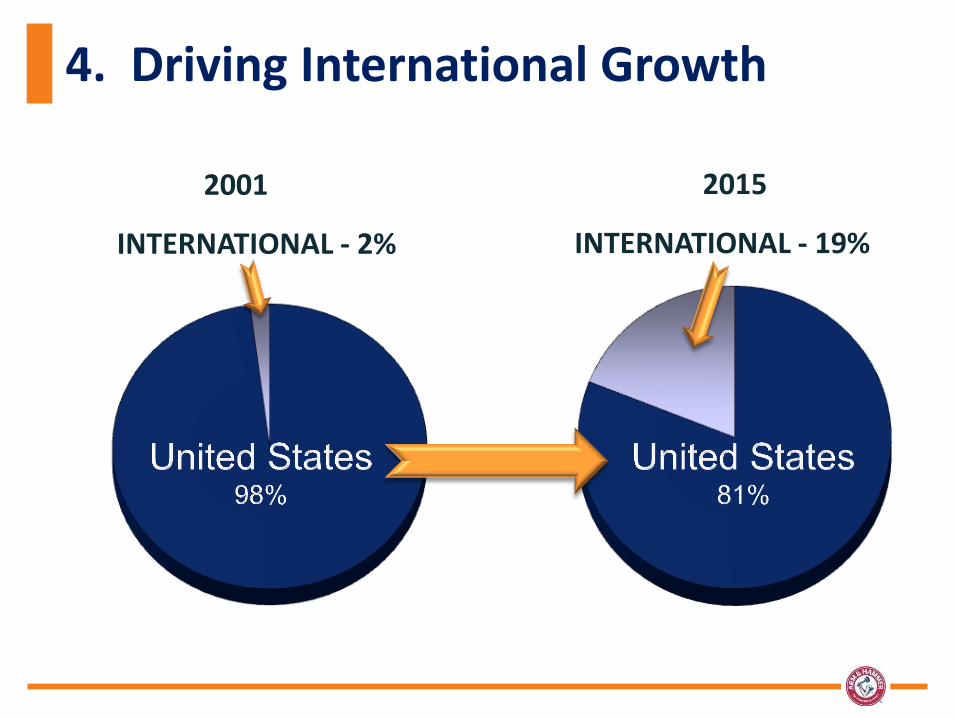
INTERNATIONAL - 2%
2001
4. Driving International Growth
INTERNATIONAL - 19%
2015

International Net Revenues in 2014 Were >$500 Million With 95%* in 6 Countries
* Includes exports from these subsidiaries to over 100 countries.
Canada 35%
UK 21%
France 15%
Australia 10%
Mexico 10%
Brazil 4%
Other 5%

5 Out of 6 Subsidiaries Have Good Long-Term Net Sales Growth Records
2007 vs. 2014 CAGR
Australia +9%
England +8%
Mexico +7%
Canada +6%
Brazil +6%
France +1%

5. Focus on Gross Margin
2007 2009 2011 2013 2015E
39.1%
43.7% 44.2% 45.0% ~44.4%
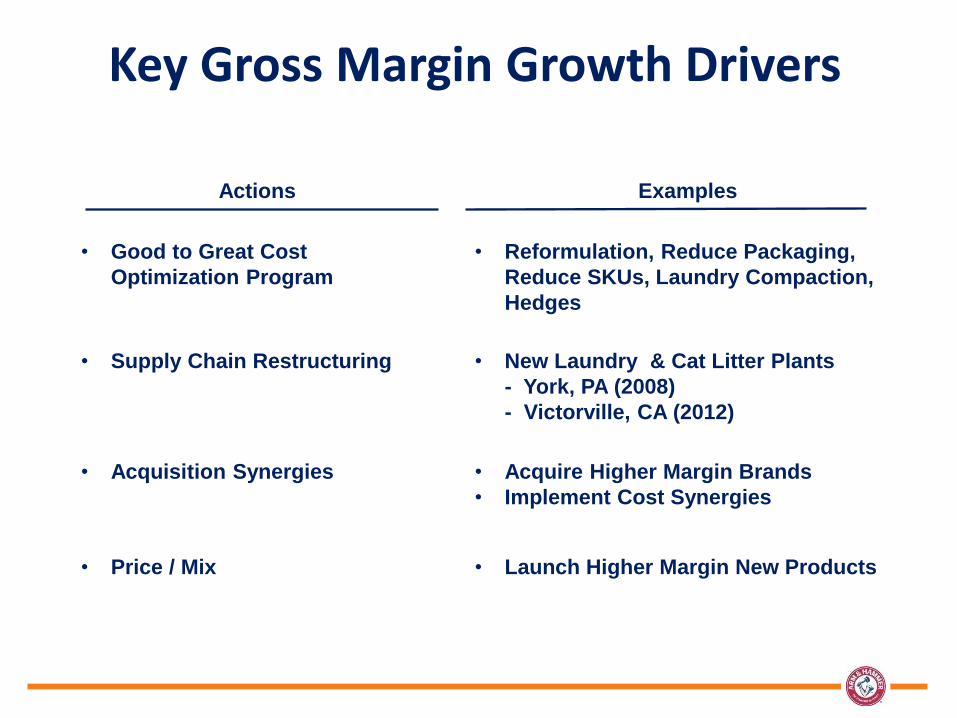
Key Gross Margin Growth Drivers
Actions
Examples
• Good to Great Cost
Optimization Program
• Reformulation, Reduce Packaging,
Reduce SKUs, Laundry Compaction,
Hedges
• Supply Chain Restructuring • New Laundry & Cat Litter Plants
- York, PA (2008)
- Victorville, CA (2012)
• Acquisition Synergies • Acquire Higher Margin Brands
• Implement Cost Synergies
• Price / Mix • Launch Higher Margin New Products

All CHD Employees Focus on Gross Margin

6. Growth Through Acquisitions CHD Has Clear Acquisition Guidelines to Ensure Accretive Acquisitions
Criteria:
• Primarily #1 or #2 Share Brands
• Higher Growth, Higher Margin Brands
• Asset Light
• Leverage CHD Capital Base in Manufacturing, Logistics and Purchasing
• Deliver Sustainable Competitive Advantage

$1,462 $1,737
$1,946 $2,221
$2,422 $2,521 $2,589 $2,749
$2,922 $3,194 $3,298
2004 2005 2006 2007 2008 2009 2010 2011 2012 2013 2014 2015E
Long History of Growth Through Acquisitions
$ in millions 61

CHD is an
Acquirer
Operational
efficiencies
Integration track
record
Access to capital
Leverage salesforce across COTs
Versatile manufacturing and R&D
capabilities (liquids, powders,
aerosols, gels, devices, …)
Still under-levered (1.1x)
BBB+ rated
Acquired 8 of 9
power brands
Stellar record in achieving cost
synergies
Strength in Processes and Functions
Revenue Growth Marketing expertise
NPD process is ingrained
Expand shares of acquired brands

Year
Acquired
Pre-Acquisition
Share
1H 2015
Share
Trojan 2001 68.9% 76.5%
XTRA 2001 5.1% 5.8%
First Response 2001 12.0% 30.5%
Nair 2001 22.8% 57.3%
Spinbrush 2005 30.1% 35.7%
OxiClean 2006 26.1% 44.5%
VMS 2012 2.7% 3.7%
Nielsen All Outlet Scanning Share for 2012
1H Share: 52 we 06/20/15
Nielsen FDMx Share for 2005 and Later
IRI FDMx Share prior to 2005
Post-Acquisition Share Growth

Allocation of Capital $275MM Cash Flow Available for Acquisitions “Annually”
CFO $570+
Capex (70)
FCF 500+
Dividends (175)
Stock Options 50
Share Creep (100)
Available for Acquisitions $275+

118%
102%
100%
99%
98%
98%
89%
88%
86%
80%
49%
0.0% 20.0% 40.0% 60.0% 80.0% 100.0% 120.0% 140.0%
Church & Dwight
Clorox
Kraft
Colgate
Consumer Staples Average
P&G
Pepsi
Coca-Cola
Kellogg
Campbell's
Avon
Source : Bloomberg
7. “Best in Class” Free Cash Flow Conversion Year Average 2007-2014

8. Superior “SG&A” Management Sales Growth Sustains SG&A Trend
2007 2009 2011 2013 2015E
13.8% 14.1%
13.4% 13.0%
~12.0%
Note: 2015 adjusted for a pension settlement

Source: 2014 SEC Filings
Employees
Revenue ($MM)
Revenue Per Employee
Church & Dwight (Total) 4,150 $3,298 $794,700
Clorox 7,700 $5,591 $726,100
Procter & Gamble 118,000 $83,062 $703,900
Colgate 37,700 $17,277 $458,300
Kimberly Clark 43,000 $19,724 $458,700
Avon 33,200 $8,616 $259,500
Heinz 24,500 $10,922 $445,800
InBev 155,000 $47,063 $303,600
Highest Revenue Per Employee in CPG

9. Expert Management Team
Fabric Care
Home Care
Oral Care
Sexual Health
Women’s Health
VMS
Canada
Australia
Mexico
United Kingdom
France
China
Domestic International Specialty Products
Animal Nutrition
Performance Products
Average experience: 24 years
Average experience: 27 years
Average experience: 25 years

10. TSR Junkies CHD Has Delivered Consistent Outstanding Returns to Our Shareholders
10 YEAR: 5 YEAR: 3 YEAR: 1 YEAR: YTD:*
*YTD as of 8/28/2015
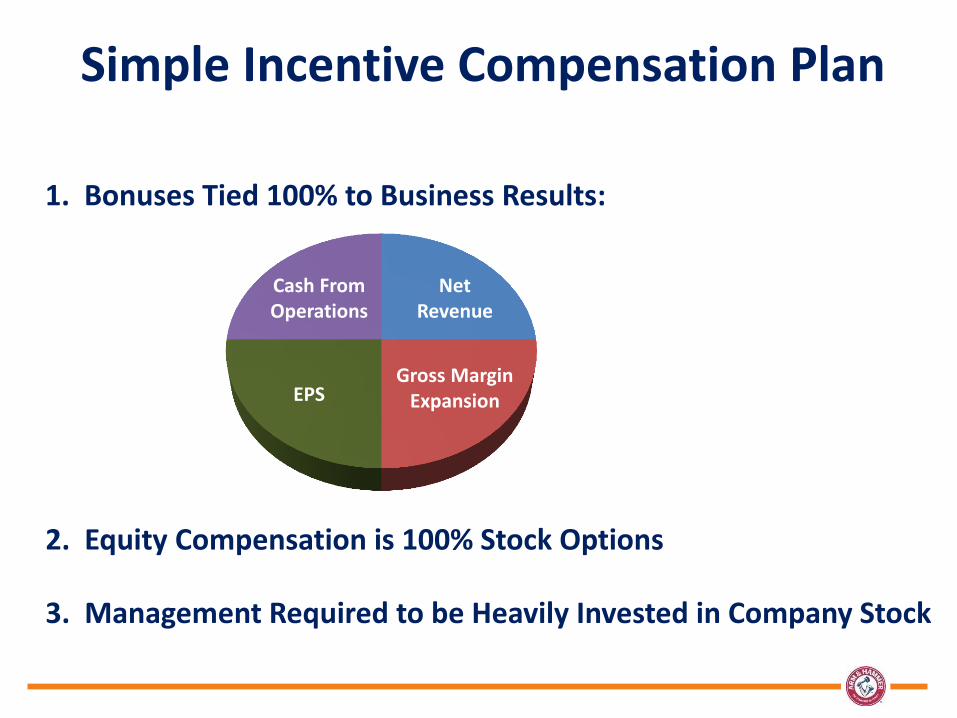
1. Bonuses Tied 100% to Business Results:
Simple Incentive Compensation Plan
EPS
2. Equity Compensation is 100% Stock Options
3. Management Required to be Heavily Invested in Company Stock
Gross Margin Expansion
Net Revenue
Cash From Operations

AGENDA
WHO WE ARE
TRENDS
HOW WE DELIVER
CHURCH & DWIGHT EVERGREEN MODEL
FINANCIALS
Q&A

Evergreen Model
TSR
Model
Organic Net Sales Growth +3.0%
Gross Margin +25 bps
Marketing @ 12.5% Flat
SG&A -25 bps
Op Margin ∆ +50 bps
EPS Growth 8%

We Have 3 Operating Principles
Highly Productive Employees
Asset Light
Leverage People
Leverage Assets
Leverage Acquisitions
GOOD shareholder returns become GREAT shareholder returns

GEOGRAPHIC FOCUS
EVERGREEN ANNUAL BUSINESS MODEL
ACQUISITION GUIDELINES
ALLOCATION OF CAPITAL
• North America • 3% Organic NR Growth
• Primarily #1 or #2 Share Brands
• TSR Accretive M&A
• Secondarily: -Europe -Asia
• +25 bps GM • Higher Growth Rate • New Product Development
• OP Margin +50 bps • Higher Gross Margin
• Capex For Organic Growth & G2G
• Operating Income Growth 6%
• Asset Light • Return Of Cash to Shareholders – 40% payout
• EPS Growth 8% • Deliver Sustainable Competitive Advantage
• Debt Reduction
• TSR 10%
We Have an Explicit Operating System Our Business is Governed By 4 Key Strategies:

AGENDA
WHO WE ARE
TRENDS
HOW WE DELIVER
CHURCH & DWIGHT EVERGREEN MODEL
FINANCIALS
Q&A

Consistent Strong Adjusted EPS Growth
2006 2007 2008 2009 2010 2011 2012 2013 2014 2015E
$1.04 $1.23
$1.43
$1.74 $1.98
$2.21 $2.45
$2.79 $3.01
~$3.25
+22%
+13% +18%
+16%
+14%
+7-9%
+12% +11%
+14%
+8%
2015 adjusted for a pension settlement and an impairment charge

CHD Consistent Solid Organic Growth
4.9%
7.3%
4.7%
3.0%
4.1%
5.2%
1.9%
3.5%
~3.0%
0.0%
3.0%
6.0%
2007 2008 2009 2010 2011 2012 2013 2014 2015E

U.S. Organic Growth
3.4%
6.6%
7.2%
2.0%
4.0%
6.0%
1.9% 2.0%
2-3%
0.0%
3.0%
6.0%
2007 2008 2009 2010 2011 2012 2013 2014 2015E

International Organic Growth Has Been Steady
3.1%
4.6% 5.2%
7.2%
4.1% 3.4% 3.7% 3.3%
~6%
0.0%
3.0%
6.0%
9.0%
12.0%
2007 2008 2009 2010 2011 2012 2013 2014 2015E

SPD Organic Growth Has Been Cyclical
17.2% 15.5%
-11.0%
3.7%
7.4%
0.7%
-1.8%
19.5%
0.0%
-12.0%
-9.0%
-6.0%
-3.0%
0.0%
3.0%
6.0%
9.0%
12.0%
15.0%
18.0%
21.0%
2007 2008 2009 2010 2011 2012 2013 2014 2015E
FLAT

Focus on Gross Margin
2007 2008 2009 2010 2011 2012 2013 2014 2015E
39.1% 40.1%
43.7% 44.7% 44.2% 44.2% 45.0%
44.1% ~44.4%

Superior “SG&A” Management Sales Growth Sustains SG&A Trend
2007 2008 2009 2010 2011 2012 2013 2014 2015E
13.8% 13.9% 14.1%
14.5%
13.4% 13.3% 13.0%
12.1% ~12.0%
2015 adjusted for a pension settlement

Operating Profit % of Net Revenue Operating Profit Expansion driven by SG&A control and focus on Gross Margin
2007 2008 2009 2010 2011 2012 2013 2014 2015E
13.7% 14.0%
16.4% 17.2%
17.9% 18.7%
19.5% 19.4% ~20.0%
2015 is adjusted for pension settlement and asset impairment
*

EBITDA Margin % Steady EBITDA Margin growth driven by proven recipe
2007 2008 2009 2010 2011 2012 2013 2014 2015E
17.2% 17.7%
20.7% 20.3%
21.4% 22.3% 22.8%
22.9% ~23.5%
EBITDA margin is a non-GAAP measure defined as Net Income + (Interest, Taxes, Depreciation, Amortization and non-cash compensation and charges)

118%
102%
100%
99%
98%
98%
89%
88%
86%
80%
49%
0.0% 20.0% 40.0% 60.0% 80.0% 100.0% 120.0% 140.0%
Church & Dwight
Clorox
Kraft
Colgate
Consumer Staples Average
P&G
Pepsi
Coca-Cola
Kellogg
Campbell's
Avon
“Best in Class” FCF Conversion Year Average 2007-2014
Source : Bloomberg

Cash Conversion Cycle Tight Control of Working Capital drives CCC improvement
51
42 40 40
32 34 36 32
2007 2008 2009 2010 2011 2012 2013 2014
CCC (days)

Growth Through Acquisitions
$1,462 $1,737
$1,946 $2,221
$2,422 $2,521 $2,589 $2,749
$2,922 $3,194 $3,298
2004 2005 2006 2007 2008 2009 2010 2011 2012 2013 2014 2015
$ in millions 87

$1,100
$2,400
$200
Current Debt
ACQUISITION POWER
Leverage Capacity
Cash and Cash Equivalents on Hand
$2.6B
2015 TTM Q2 Bank EBITDA = $789M Leverage capacity to 3.50x EBITDA Acquisition EBITDA multiple of 12x
Credit Rating BBB+/Baa1
Significant Financial Capacity As of Q2 2015 (in $millions)
2009 2010 2011 2012 2013 2014 2015E
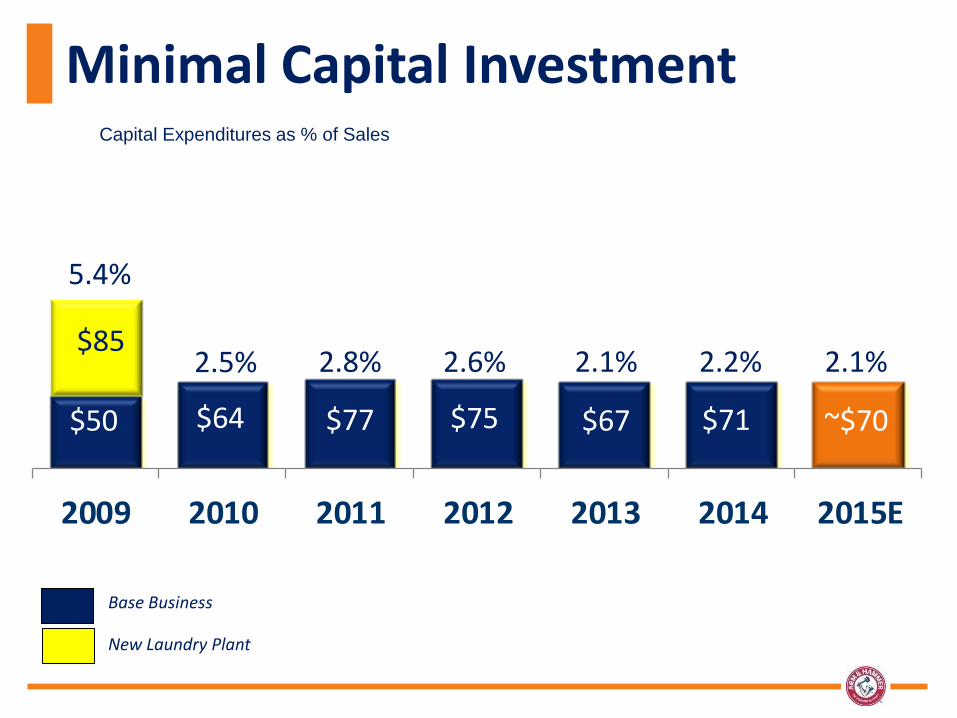
Capital Expenditures as % of Sales
5.4%
$50 $64
2.5%
$77
2.8%
$75
2.6%
Base Business
New Laundry Plant
$67
2.1% $85
Minimal Capital Investment
$71
2.2%
~$70
2.1%

Prioritized Uses of Free Cash Flow
1. TSR-Accretive M&A
5. New Product Development
Capex For Organic Growth & G2G
Return Of Cash To Shareholders
Debt Reduction

Prioritized Uses of Free Cash Flow
1. TSR-Accretive M&A
2. New Product Development
3. Capex For Organic Growth & G2G
4. Return Of Cash To Shareholders
5. Debt Reduction

2015 Outlook
2015 Outlook
Feb August
Organic Sales +2-3% +3%
Gross Margin +25 bps +25-35 bps
Marketing ~12.5% ~12.5%
SG&A leverage leverage
Operating Margin +50 bps +50-60 bps
Adjusted EPS +7-9% +7-9%
Outlook as of August 4, 2015

AGENDA
TRENDS
WHO WE ARE
HOW WE DELIVER
CHURCH & DWIGHT EVERGREEN MODEL
FINANCIALS
Q&A

CHURCH & DWIGHT BARCLAYS BACK TO SCHOOL CONFERENCE SEPTEMBER 2015

Appendix

Reconciliations
The following pages address the non-GAAP measures used in this presentation and reconciliations of non-GAAP measures to the most directly comparable GAAP measures:
Non-GAAP measures: Organic Sales Growth.

Organic Sales Reconciliation
Organic Sales Growth
The presentation provides information regarding organic sales growth, namely net sales growth excluding the effect of acquisitions, divestitures, the change in customer shipping arrangements, foreign exchange rate changes, the impact of an information systems upgrade, a discontinued product line and the change in the fiscal calendar for three foreign subsidiaries, from year-over-year comparisons. Management believes that the presentation of organic sales growth is useful to investors because it enables them to assess, on a consistent basis, sales trends related to products that were marketed by the Company during the entirety of relevant periods excluding the change in customer shipping arrangements and the SAP Conversion, without the effect of the change in the fiscal calendar and foreign exchange rate changes that are out of the control of, and do not reflect the performance of, management.
System Calendar/ Shipping
Year Reported FX Acq/Div Disc. Ops. Upgrade Other Terms Organic
Q215 4.8 2.7 -2.4 0.0 0.0 0.0 0.0 5.1
Q115 3.9 2.2 -2.5 0.0 0.0 0.0 0.0 3.6
2014 5.2 1.2 -1.2 0.0 0.0 0.0 0.0 5.2
2013 9.3 0.5 -7.6 0.0 -0.3 0.0 0.0 1.9
2012 6.3 0.8 -3.1 0.0 0.6 0.6 0.0 5.2
2011 6.2 -1.0 -1.2 0.8 -0.3 -0.6 0.2 4.1
2010 2.7 -1.1 0.5 0.0 0.0 0.0 0.9 3.0
2009 4.1 2.0 -1.2 0.0 0.0 -0.2 0.0 4.7

2014 2013 2012 2011 2010 2009
Net Sales NA NA NA NA 2,589.2 2,520.9
Rpt Gross Margin NA NA NA NA NA 43.7%
Adjustment NA NA NA NA NA -28.4
Adj Gross Margin NA NA NA NA NA 44.8%
Rpt SG&A Rpt Patent Settlement
NA NA NA NA 374.8 20.0
Adjustment Adj SG&A Adj Patent Settlement
NA NA NA NA -24.3* 350.5
-20.0
0.0
Reported Op Margin Adj Op Margin
NA NA NA NA 17.2% 18.1%
16.4% 16.7%
Rpt Taxes Adjustment Adj Taxes
NA NA NA 185.0 -12.8 172.2
NA NA
Effective Tax Rate Adjusted Tax Rate
NA NA NA 37.4% 34.8%
NA NA
Rpt EPS EPS YOY Change
$3.01 8%
$2.79 14%
$2.45 16%
$2.12 13%
$1.87 10%
$1.70 23%
Adj EPS ADJ EPS YOY Change
$3.01 8%
$2.79 14%
$2.45 11%
$2.21 12%
$1.98 14%
$1.74 22%
*2010 Pension Plan Termination
Reconciling Item 2009-2014

The presentation provides information regarding the Company’s earnings per share and gross margin adjusted to exclude restructuring charges related to plant closing expenses, proceeds of the litigation settlement, and the pension settlement charge. Management believes that the presentation of adjusted earnings per share and gross margin is useful to investors because it enables them to assess the Company’s historical performance exclusive of extraordinary events that do not reflect the Company’s day-to-day operations. This presentation provides information regarding the Company’s free cash flow. Free cash flow is net cash from operating activities less capital expenditures. Free cash flow is used by the Company's management, and management believes it is useful to investors, to help assess funds available for investing activities, such as acquisitions and financing activities, including debt payments, dividend payments and share repurchases. Free cash flow also is one of the measures used in determining management's annual incentive award. Free cash flow does not represent cash available only for discretionary expenditures, since the Company has mandatory debt service requirements and other contractual and non-discretionary expenditures.
Reconciling Item 2009-2014