ci segregated · pdf file2005 annual report ci segregated funds as at december 31, 2005...
TRANSCRIPT

2005 Annual Report
CI Segregated Funds
as at December 31, 2005
managed by CI Investments Inc. issued by Unity Life of Canada

A look inside
A Message From The Presidents ..........................................................................................1
A Message From
Altrinsic Global Advisors, LLC.....................................................................................................2
Harbour Advisors.........................................................................................................................3
Signature Advisors ......................................................................................................................4
Synergy Asset Management.......................................................................................................5
Trilogy Advisors, LLC ...................................................................................................................6
Equity Funds
CI Global Segregated Fund ............................................................................................................7
CI Global Value Segregated Fund................................................................................................10
CI Harbour Segregated Fund........................................................................................................13
CI Harbour Growth & Income Segregated Fund..........................................................................16
CI Synergy American Segregated Fund.......................................................................................19
Fixed Income
CI Money Market Segregated Fund ............................................................................................22
Notes to the Financial Statements .......................................................................................25
Management and Audit Reports ...........................................................................................26

– 1 –
A Message from the President
2005 Annual Report as at December 31, 2005
issued by Unity Life of Canadamanaged by CI Investments Inc.
Dear Policyholder,
The past year was generally positive for investors, with most financial markets making gains. The resource-rich Canadian stock
market was especially buoyant in 2005, led by strong demand for energy, metals and other commodities. Healthy global economic
activity helped to boost the U.S. and many overseas equity markets, although for Canadian investors the rewards from these regions
were somewhat muted by the continued strength of the Canadian dollar.
As a CI Segregated Fund investor, you benefit from market gains with the security of knowing that your investment is guaranteed at
maturity or death. Among their many advantages, the guarantees of the CI Segregated Funds are backed by Unity Life of Canada.
CI Investments manages the CI Segregated Funds, including selecting and monitoring the portfolio managers. CI Investments is a
subsidiary of CI Financial Inc., one of Canada’s largest wealth management companies with $71.7 billion in fee-earning assets.
If you have any questions about these financial statements or your policy, please contact your financial advisor or CI Client Services
at 1-800-563-5181 or [email protected].
Thank you for investing with us.
Sincerely,
Peter W. AndersonPresident and Chief Executive OfficerCI Investments [email protected]
December 31, 2005
– 2 –
A Message from Altrinsic Global Advisors, LLC
2005 Annual Report as at December 31, 2005
Global equity markets delivered strong performance during 2005,
resulting from growing optimism in Japan, as well as abundant global
liquidity, healthy corporate earnings and strong mergers and
acquisitions activity.
In 2005, our research team met with over 850 company management
teams in 17 countries. The result of this effort is portfolios with emphasis
on Japanese financial stocks, U.S. health-care stocks, insurance
stocks in North America and Europe, multinational consumer staples
domiciled in Europe and, increasingly, telecommunications stocks
in Europe.
In financials, our Japanese holdings have delivered strong performance
in recent months. Restructuring efforts are providing a supportive
backdrop that in many ways resembles the progress of North
American financial stocks following the U.S. savings and loan crisis.
We have sold some positions as they reached our target prices, but we
continue to be optimistic about the longer-term prospects for our
holdings. The situation is more mixed in North America and Europe,
where financial stocks are trading at loftier valuations and no longer
have the support of steep yield curves. Credit conditions have been
benign, though we are concerned about the massive amounts of debt
in the system and the fragility of consumer confidence based on the
wealth effect derived from buoyant property prices.
We continue to have meaningful positions in North American
insurance stocks, including Ambac and Torchmark, but we have
become increasingly drawn to the opportunities among European
insurers. One example is Allianz of Germany, where restructuring
has strengthened the balance sheet, shed non-core assets, and boosted
the underlying return on equity. However, there remains meaningful
underlying value to be released in Allianz’s operations and in holdings
in other listed companies and real estate.
We also have significant exposure to consumer stocks, with more
emphasis on consumer staples over cyclicals. Our largest positions
are in a handful of high-quality multinationals, including Diageo,
Heineken and Nestlé. Among cyclical names, we have modest
positions primarily in U.K. advertising and retail stocks.
Our Japanese property holdings have had very strong runs as 15 years
of property deflation came to end. One of our larger holdings, Daiwa
House, is one of Japan’s largest homebuilders. Consumers have excess
cash, mortgage rates are low, prices for homes in major metropolitan
areas are stabilizing, and young buyers have pent-up demand.
Health-care stocks generally lagged the overall market again in 2005.
An inability of “big pharma” to sufficiently develop innovative new
drugs to drive revenue growth has weighed on the sector. Sub-sectors
such as medical devices and biotechnology have been more
rewarding. We see opportunity among the unloved drug stocks and
have meaningful positions in Wyeth and GlaxoSmithKline, which
has a pipeline that is vastly undervalued by the market. A $400-billion
US Medicare plan to pay for seniors’ drugs also begins in 2006.
Elsewhere in the sector we have positions in Healthsouth, Tenet
Healthcare, and ImClone Systems.
Telecommunications stocks performed miserably in 2005 because of
increased mobile competition and higher capital spending. Our
holdings are concentrated in special situations in France, such as
Bouygues and Vivendi. The French mobile market is attractive
because just three players control the market. We also hold
SprintNextel of the U.S.
Industrial and materials stocks continued to deliver strong
performance during the fourth quarter, supported by expectations for
continuing strong demand growth from China. However, we believe
most stocks in these sectors have priced in peak margin and demand
conditions. We acquired shares in Lafarge, the world’s largest cement
producer, because of its exposure to North American and European
markets, where limited supply has come on stream over the past
decade. Our exposure to the energy sector is slightly underweight, as
stock prices are discounting underlying commodity prices that may
be difficult to sustain.
We believe that the environment for global investing is favourable,
but investors should be prepared for greater uncertainty and volatility
in 2006.
ALTRINSIC GLOBAL ADVISORS, LLC
John Hock
John DeVita
Andrew Waight
December 31, 2005

– 3 –
A Message from Harbour Advisors
2005 Annual Report as at December 31, 2005
Harbour Fund and Harbour Growth & Income Fund
At year-end 2005, Harbour Fund had roughly 85% of its assets
invested in common stocks (Canadian common, 62.8% and foreign
common, 22.3%), while the fund’s cash and equivalent position
amounted to 14.9%, down roughly seven percentage points from one
year ago. The number of companies held in the portfolio has risen to
37 from 33 at year-end 2004. In the case of Harbour Growth &
Income Fund, 67.4% was invested in common stocks (Canadian
common, 50.7% and foreign common, 16.7%), 5.9% in Government
of Canada bonds, while cash and equivalents represented 26.7%.
The past year was another highly successful one, with both funds
earning strong returns. Specific companies that contributed to the
two funds’ strong results over the past year were chiefly found within
the natural resource sector and include names such as Cameco,
Falconbridge, Goldcorp, Canadian Oil Sands, EnCana, Ensign Energy
Services, Petro-Canada, Suncor and Talisman. Notable non-resource
companies that performed strongly include IPSCO, Royal Bank,
Toronto-Dominion Bank and Yellow Pages Income Fund. Portfolio
holdings that fared poorly last year include Alcan, Jones Apparel,
Potash Corporation and TJX Cos.
Significant, but fairly brief, market weakness in the latter part of the
year created a number of attractive buying opportunities, which
resulted in us boosting equity positions meaningfully in both portfolios.
We continue to be comfortable with our holdings in stocks such as
those cited previously that recorded healthy gains over the past year,
since their fundamentals remain favourable and we believe that their
valuations are still attractive. For similar reasons, we have purchased
additional shares in the four companies cited that performed poorly
in 2005. Also, we are currently doing intensive research on a handful
of new companies that we are hoping to see fit to add to our
portfolios. At this juncture, we envision that most of the new names
will be companies domiciled outside Canada.
In contrast to the strong performance recorded within the equity
sphere, as we expected the bond market continued to produce lacklustre
returns over the past year. This is shown by the fact that benchmark
10-year Government of Canada bonds yielded 3.97% as at December
31, 2005, versus 4.08% at year-end 2004 – virtually unchanged. At the
4% level, investors continue to be poorly compensated for growing
inflation risks; hence, we expect to continue to maintain minimal
bond positions in the period ahead. Simply put, we expect to earn
more favourable returns in carefully selected equities.
Harbour Foreign Equity Corporate Class and Harbour Foreign
Growth & Income Corporate Class
The equity weighting of our two foreign portfolios continued to
increase as we moved into the final quarter of the year. Broad market
weakness provided opportunities to add to many of our existing
holdings during October. At year-end, Harbour Foreign Equity
Corporate Class had 87.6% of its assets invested in foreign equities,
while the remaining 12.4% of assets were held in Government of
Canada T-bills or cash. Geographically, the fund ended the year with
50.5% of its assets in Europe (26.9% Continental Europe, 23.6%
U.K. and Ireland.), 27.6% in the U.S., and 9.5% in the Asia Pacific
region. In the case of the Harbour Foreign Growth & Income
Corporate Class, the year-end asset mix was as follows: 70% in foreign
equities, 7% in foreign bonds, and 23% in Government of Canada
T-bills or cash.
In terms of portfolio activity, we took advantage of some short-term
price weakness early in the quarter to further build our position in
Alcoa, which is now a meaningful holding within the portfolio. Other
positions that were bolstered during the quarter include Citigroup,
Australia-based Macarthur Coal, and U.K. companies Travis Perkins
and Signet Group.
Outlook
As we enter a new year, we are optimistic about the outlook for the
Habour portfolios. For 2005, it was clearly a year where there was a
definite premium on both sector and individual stock selection –
if you were invested in the right stocks, you earned very handsome
returns, and 2006 may well bring more of the same. Indications are
that the economic and financial market backdrop will remain
favourable as we move through the New Year and we feel confident
about the way that our portfolios are currently structured.
CI INVESTMENTS INC.
HARBOUR ADVISORS
Gerald Coleman
Stephen Jenkins
December 31, 2005

– 4 –
A Message from Signature Advisors
2005 Annual Report as at December 31, 2005
To varying degrees, global equity markets benefited from the continued
economic expansion and relatively low interest rate environment
of the past 12 months. For investors in Canadian markets, 2005 was
a particularly rewarding year, as financial, energy, and materials stocks
led the S&P/TSX Composite Index to a 24% advance. The continued
strength of the Canadian dollar, however, dampened returns from
U.S. and other international investments.
The dominance of commodities in the Canadian market started early
in the year and continued in the fourth quarter, with oil, some base
metals and gold all posting record highs. Higher unit prices have
refocused the global energy sector on higher-cost projects such as
oil sands, as well as alternative energy sources such as thermal coal,
nuclear and hydro (all sectors in which we have invested).
Within the oil industry, we see more upside in the capacity-constrained
drilling and service companies that are in a position to raise prices
further. Within the metals and mining sector, continued strong
demand from developing countries and tight capacity will likely keep
prices high. Many companies are in very strong positions with healthy
balance sheets, and we expect consolidation in this industry to intensify.
Inflows for income trusts remained robust through the first half of
the year, but investors were roused from complacency over the summer
months as tax uncertainty dragged the asset class down markedly.
This was a valuable lesson for investors who believed trusts are less
risky than stocks, and brought some temporary sobriety to the market.
That wore off quickly, however, when the tax cloud was lifted and
trusts were included in the S&P/TSX Composite Index in the fourth
quarter. Trusts were bid back up to their previously heady levels
by year-end.
In the fixed-income markets, interest rates rose several times in the
U.S. and Canada in 2005, but the U.S. Federal Reserve now appears
to be very close to the end of its tightening cycle. We expect rates
to peak sometime toward mid-2006. We have been increasing holdings
of investment-grade corporate bonds where the outlook has been
favourable. Bond market turbulence through last April and May also
represented opportunity to buy high-yield bonds and we added to
our positions throughout that period in several funds.
The fundamental outlook for the economy remains fairly good.
Company earnings and balance sheets remain very healthy, even
with the slowdown in earnings growth. Given the extraordinary
availability of capital at unprecedentedly low rates, mergers and
acquisition activity gathered pace both at home and abroad over 2005,
and is likely to continue into 2006. Many large Canadian companies
such as Dofasco, Placer Dome and Falconbridge were the subject
of takeover bids in 2005, narrowing the breadth of the Canadian
marketplace.
While we maintain confidence in many segments of the Canadian
market, we expect to make greater investments in global markets
over the coming quarters. Signature’s strength across capital markets
allows us to use the knowledge of our existing positions to make strategic
investments in global companies. For example, our investment in a
number of Japanese banks are already beginning to bear fruit, and
we are expanding our main investment themes to include companies
in the U.S., South America and Europe.
As we head into 2006, we remain positive on equities, which we still
believe offer better value than fixed-income investments. At the same
time, we are growing more cautious in the face of higher energy prices,
rising interest rates and somewhat slower economic growth.
CI INVESTMENTS INC.
SIGNATURE ADVISORS
Eric Bushell
Robert Lyon
James Dutkiewicz
Matt Shandro
December 31, 2005
– 5 –
A Message from Synergy Asset Management
2005 Annual Report as at December 31, 2005
Despite various shocks to the economic system, the year 2005 proved
to be a surprisingly positive year for equity markets. Rising interest
rates, a 45% rise in oil prices and unprecedented disasters such as
Hurricane Katrina could not hold stocks back and most major markets
finished higher. The Canadian stock market was especially strong
with the S&P/TSX Composite Index generating a total return of
24.1%. This outpaced almost every other country’s major composite
index, in Canadian dollar terms. The large majority of our Synergy
funds finished in the first or second quartile in their respective
categories.
We have been bullish on the outlook for equity markets for some
time now due to their low valuations relative to interest rates, high
levels of corporate profitability and the generally negative investor
sentiment that existed towards stocks following the collapse of the
Internet/technology bubble. We felt the catalyst for a “Goldilocks”
rally in this cycle would be a growing sense that the U.S. Federal
Reserve was nearing the end of its interest rate tightening cycle.
Given the strong markets in the fourth quarter, it appears that
investors are embracing this scenario to some degree.
As we enter the fourth year of this bull market cycle, we remain
cautiously optimistic that 2006 will be another profitable year for
equity investors. On a free cash flow and earnings basis, markets seem
to have priced in a significant slowdown. Profit growth, especially in
the U.S., has exceeded stock market appreciation for a number of
years now, leaving price/earnings ratios attractive in the context of low
long-term interest rates. These relatively low expectations lend us
confidence in solid stock market returns when the interest rate
tightening cycle ends. At this point, the economy seems to be settling
into a “Goldilocks” trajectory (not too hot and not too cold, but just
right), suggesting that the end of the Fed interest rate tightening cycle
is near and stocks will climb again this year.
However, we are keenly aware that as time passes and further interest
rate increases occur, the weight of history starts to weigh against our
bullish stance and we have to be prepared to become more
conservative in our outlook for equity prices around the world.
We are not monetary policy experts or Fed watchers, but history
has told us that you need to be more careful when the Fed is hiking
rates. There can really only be two results from tighter monetary
policy: a recession or a “soft landing” for the economy. The first is bad
for stock markets, while the second is usually good.
Through 2005, we felt the perception of a soft landing occurring
would be positive for equities. The rally in November and December
suggests the market is now beginning to adapt this mindset.
Therefore, we believe 2006 will be about whether the perception of a
soft landing occurring can actually become reality. In other words,
the markets will likely come under pressure if U.S. interest rate hikes
continue beyond the next quarter and/or the economy begins to
weaken considerably. We will be vigilant in monitoring both of these
trends and adjusting our portfolios’ bullish positioning if necessary.
Within our earnings momentum based portfolios, we have begun to
slowly transition them away from more cyclical sectors such as energy
and consumer-discretionary into areas that show steadier growth.
Our rationale is that in the backdrop of a decelerating environment,
companies that exhibit positive fundamental change and/or that are
better able to sustain their earnings growth will command a scarcity
premium. We remain overweight materials stocks, but much less so
than this time last year. In spite of our long-term belief in energy
prices, we have reduced our energy weightings as well. Sectors where
we are increasing weightings include health care and financials.
SYNERGY ASSET MANAGEMENT
David Picton
Michael Mahoney
December 31, 2005

– 6 –
A Message from Trilogy Advisors, LLC
2005 Annual Report as at December 31, 2005
Global equity markets were a mixed picture in 2005, with the U.S.
market posting a lacklustre gain of only 3.8% in U.S. dollars, while
many other markets posted strong double-digit gains in local currency
terms. That said, higher interest rates in the U.S. and Canada
triggered strength in both the U.S. and Canadian dollars that muted
the impact of foreign stock price increases for North American
investors. As a result, the MSCI World Index posted a gain for the
year of only 7.6% in U.S. dollars and 4.9% in Canadian dollars.
For Canadian investors, 2005 turned out to be another year best spent
at home. In Canadian dollars, Canada’s equity market provided the
best returns among all the developed markets with a 24.1% return.
Other areas that provided exciting returns were the emerging markets
and Japan, which were up 27.0% and 21.0% in Canadian dollar
terms. Remarkable strength in energy and other commodity markets
turned out to be a major plus for both Canada and the emerging
markets in 2005.
Looking ahead, we anticipate another year of global economic
growth, which should create a constructive backdrop for equity
markets – even as the composition of growth and relative market
performance is likely to shift. The U.S. continues to be a good news-
bad news story. The good news is that the Federal Reserve may be
getting close to the end of its monetary tightening cycle, and markets
have historically done well after the Fed stops tightening. The bad
news is that the yield curve is now extremely flat (and inverted across
some maturities), which suggests that earnings growth could turn out
to be more disappointing than many company analysts now expect.
We would not be surprised to see foreign markets continue to outpace
the U.S. market in 2006. Valuations remain more attractive in many
foreign markets compared to the U.S. And even thought interest rates
may rise this year in Europe and Japan, monetary policy in those
regions is likely to remain more accommodative than in the U.S. for
some time to come, since growth has been more subdued. There is
also a good chance, in our opinion, that U.S. dollar weakness may
resume if the Fed stops tightening and currency markets refocus on
the need for a weaker dollar to correct large U.S. trade and current
account imbalances.
Equity valuations remain quite reasonable, with the MSCI World
Index trading at about 14.5 times next year’s estimated earnings.
Markets in Europe and non-Japan Asia are trading at around 12 to 13
times, while many emerging market stocks still trade on single-digit
multiples. With government bond yields still quite low in most
nations, comparisons of bond yields to equity earnings yields still
suggest that equities on average are still more than 40% undervalued
relative to bonds. Accordingly, we continue to favour equities in
CI International Balanced Fund, which maintains a target of 70%
equities/30% fixed income.
In our global equity portfolios, we currently have exposure of
approximately 44% to the U.S., 29% to Europe, 15% to Japan, and
8% to emerging markets and non-Japan Asian markets. Our strongest
sector tilts are toward the consumer discretionary and technology
sectors, which should benefit from continued global growth and an
end to Fed tightening. We are tilted away from highly defensive
sectors like consumer staples and utilities, as well as away from energy
and materials, which we believe may be vulnerable to a downshift in
U.S. growth. We are not currently employing any currency hedges,
although we may consider hedging U.S. dollar exposure if interest
rate differentials begin to provide less support for the U.S. currency.
TRILOGY ADVISORS, LLC
William Sterling
Greg Gigliotti
Robert Beckwitt
André Desautels
Richard Gluck
François Campeau
Bradley Wilds
Pablo Salas
December 31, 2005

– 7 –
CI Global Segregated FundUnderlying Fund Information (Unaudited)
CIG - 025
Top 25 Holdings of Underlying Fund
No. of Shares/ Average MarketFace Amount Investment Cost ($) Value ($)
1,188,600 Microsoft Corp. 45,137,701 36,137,531 686,800 General Electric Co. 35,863,477 27,987,839 795,646 Comcast Corp., Class A 27,856,626 23,977,612 200,900 Everest Re Group Ltd. 22,053,079 23,439,501 842,815 Pfizer Inc. 32,018,226 22,851,350 402,099 Citigroup Inc. 25,928,010 22,687,902
1,135,200 Cisco Systems Inc. 23,835,807 22,595,773 334,000 Exxon Mobil Corp. 23,634,747 21,812,324 877,400 Continental Airlines Inc., Class B 13,608,211 21,728,427
1,060,400 News Corp Inc., B-shares 20,233,058 20,478,135 267,700 Lockheed Martin Corp. 18,601,690 19,804,384
2,128,116 Liberty Media Corp., Class A 28,795,997 19,472,472 1,054,700 AES Corp. 14,547,669 19,411,581
293,600 Morgan Stanley 22,384,014 19,368,520 50,200 Samsung Electronics Co. Ltd., GDR 9,447,891 19,231,368
581,350 IAC/InterActive Corp. 19,459,235 19,135,006 1,127,300 Diageo PLC 18,841,757 18,998,425
320,171 Credit Suisse Group 14,536,819 18,980,735 501,100 AXA SA 15,954,773 18,803,235
7,467,176 Vodafone Group PLC 26,251,238 18,745,986 1,175 Mitsubishi Tokyo Financial Group Inc. 12,731,567 18,542,520
256,400 Fisher Scientific International Inc. 18,532,322 18,440,767 964,300 Saipem SpA 12,658,106 18,397,453
1,982 Mizuho Financial Group Inc. 12,475,851 18,297,444 510,800 Commerzbank AG 15,406,654 18,295,340
Underlying Portfolio Exposure
Country Allocation (%)
Long Positions:U.S.A. . . . . . . . . . . . . . . . . . . . . . . . . . . . . . . . . . . . . . . . . . . . . . . . . . . . . . . . . . . . . . . . . . . 37.0Japan . . . . . . . . . . . . . . . . . . . . . . . . . . . . . . . . . . . . . . . . . . . . . . . . . . . . . . . . . . . . . . . . . . 15.3U.K. . . . . . . . . . . . . . . . . . . . . . . . . . . . . . . . . . . . . . . . . . . . . . . . . . . . . . . . . . . . . . . . . . . . . 5.8Germany . . . . . . . . . . . . . . . . . . . . . . . . . . . . . . . . . . . . . . . . . . . . . . . . . . . . . . . . . . . . . . . . 5.4France . . . . . . . . . . . . . . . . . . . . . . . . . . . . . . . . . . . . . . . . . . . . . . . . . . . . . . . . . . . . . . . . . . 5.3Switzerland . . . . . . . . . . . . . . . . . . . . . . . . . . . . . . . . . . . . . . . . . . . . . . . . . . . . . . . . . . . . . . 4.6Cash & Equivalents . . . . . . . . . . . . . . . . . . . . . . . . . . . . . . . . . . . . . . . . . . . . . . . . . . . . . . . . 4.4Bermuda . . . . . . . . . . . . . . . . . . . . . . . . . . . . . . . . . . . . . . . . . . . . . . . . . . . . . . . . . . . . . . . . 3.7Italy . . . . . . . . . . . . . . . . . . . . . . . . . . . . . . . . . . . . . . . . . . . . . . . . . . . . . . . . . . . . . . . . . . . . 2.6Norway . . . . . . . . . . . . . . . . . . . . . . . . . . . . . . . . . . . . . . . . . . . . . . . . . . . . . . . . . . . . . . . . . 2.4South Korea . . . . . . . . . . . . . . . . . . . . . . . . . . . . . . . . . . . . . . . . . . . . . . . . . . . . . . . . . . . . . 1.8Singapore . . . . . . . . . . . . . . . . . . . . . . . . . . . . . . . . . . . . . . . . . . . . . . . . . . . . . . . . . . . . . . . 1.8Hong Kong . . . . . . . . . . . . . . . . . . . . . . . . . . . . . . . . . . . . . . . . . . . . . . . . . . . . . . . . . . . . . . 1.6Taiwan . . . . . . . . . . . . . . . . . . . . . . . . . . . . . . . . . . . . . . . . . . . . . . . . . . . . . . . . . . . . . . . . . 1.1Indonesia . . . . . . . . . . . . . . . . . . . . . . . . . . . . . . . . . . . . . . . . . . . . . . . . . . . . . . . . . . . . . . . 1.0Denmark . . . . . . . . . . . . . . . . . . . . . . . . . . . . . . . . . . . . . . . . . . . . . . . . . . . . . . . . . . . . . . . . 1.0Ireland . . . . . . . . . . . . . . . . . . . . . . . . . . . . . . . . . . . . . . . . . . . . . . . . . . . . . . . . . . . . . . . . . . 0.9Thailand . . . . . . . . . . . . . . . . . . . . . . . . . . . . . . . . . . . . . . . . . . . . . . . . . . . . . . . . . . . . . . . . 0.9Liberia . . . . . . . . . . . . . . . . . . . . . . . . . . . . . . . . . . . . . . . . . . . . . . . . . . . . . . . . . . . . . . . . . . 0.7Sweden . . . . . . . . . . . . . . . . . . . . . . . . . . . . . . . . . . . . . . . . . . . . . . . . . . . . . . . . . . . . . . . . . 0.7Brazil . . . . . . . . . . . . . . . . . . . . . . . . . . . . . . . . . . . . . . . . . . . . . . . . . . . . . . . . . . . . . . . . . . . 0.6Greece . . . . . . . . . . . . . . . . . . . . . . . . . . . . . . . . . . . . . . . . . . . . . . . . . . . . . . . . . . . . . . . . . 0.6Malaysia . . . . . . . . . . . . . . . . . . . . . . . . . . . . . . . . . . . . . . . . . . . . . . . . . . . . . . . . . . . . . . . . 0.4Belgium . . . . . . . . . . . . . . . . . . . . . . . . . . . . . . . . . . . . . . . . . . . . . . . . . . . . . . . . . . . . . . . . . 0.1Russia . . . . . . . . . . . . . . . . . . . . . . . . . . . . . . . . . . . . . . . . . . . . . . . . . . . . . . . . . . . . . . . . . . 0.1Israel . . . . . . . . . . . . . . . . . . . . . . . . . . . . . . . . . . . . . . . . . . . . . . . . . . . . . . . . . . . . . . . . . . . 0.1Argentina . . . . . . . . . . . . . . . . . . . . . . . . . . . . . . . . . . . . . . . . . . . . . . . . . . . . . . . . . . . . . . . 0.1Peru . . . . . . . . . . . . . . . . . . . . . . . . . . . . . . . . . . . . . . . . . . . . . . . . . . . . . . . . . . . . . . . . . . . 0.1
Short Positions:U.S.A. . . . . . . . . . . . . . . . . . . . . . . . . . . . . . . . . . . . . . . . . . . . . . . . . . . . . . . . . . . . . . . . . . . -0.1
2005 Annual Report as at December 31, 2005

– 8 –
IncomeInterestIncome distribution from investments
Expenses (Management expense ratios – Schedule 3)Management fees (Note 4)Administrative (Note 4)CustodyLegalAuditGoods and services tax
Net income (loss) for the year
Realized and unrealized gain (loss) on investments Realized gain (loss) on investments (a)Capital gain distribution from investmentsChange in unrealized appreciation
(depreciation) of investmentsNet gain (loss) on investmentsIncrease (decrease)
in net assets from operations(Earnings per unit – Schedule 4)
(a) Realized gain (loss) on investmentsProceeds from sale of investments Investments at cost, beginning of yearInvestments purchased
Investments at cost, end of yearCost of investments soldRealized gain (loss) on investments
CI Global Segregated FundFinancial Statements
AssetsInvestments at market valueCashReceivable for unit subscriptionsReceivable for securities soldDividends and accrued interest receivable
LiabilitiesPayable for securities purchased Payable for unit redemptions
Net assets and unitholders’ equity
Net asset value per unit – Schedule 1
Number of units outstanding (Unit transactions – Schedule 2)
Statements of Operations for the years ended December 31 ($000’s)
2005 2004
11,379 13,88817 22
- -- 37- -
11,396 13,947
- 292 -2 29
11,394 13,918
12.55 11.81
907,927 1,178,612
Statements of Net Assets as at December 31 (in $000’s except for per unitamounts and units outstanding)
Statements of Changes in Net Assets for the years ended December 31 ($000’s)
2005 2004
1 1- -1 1
9 11114 138
- 1- -- -1 1
124 151(123) (150)
(348) (372)- -
1,185 1,112837 740
714 590
3,356 2,38815,657 18,352
9 6515,666 18,41711,962 15,6573,704 2,760(348) (372)
Net assets, beginning of year
Capital transactionsProceeds from units issued Amounts paid for units redeemed
Increase (decrease) in net assetsfrom operations
Net assets, end of year
2005 2004
13,918 15,529
402 384(3,640) (2,585)(3,238) (2,201)
714 59011,394 13,918
Investment Portfolio as at December 31, 2005
No. of Average MarketUnits/Shares Investment Cost ($) Value ($)
893,841 CI Global Fund (Class A) 11,962,359 11,378,593
Total Investments (99.9%) 11,962,359 11,378,593
Other Assets (net) (0.1%) 15,061
Total Net Assets (100.0%) 11,393,654
The accompanying notes are an integral part of these financial statements. Percentages shown in brackets relate investments at market value to total net assets of the fund.
2005 Annual Report as at December 31, 2005

– 9 –
CI Global Segregated FundFinancial Statements – Supplementary Schedules (for the years ended December 31)
2005 Annual Report as at December 31, 2005
Schedule 1
Net asset value per unit, end of year ($)
Schedule 2
Unit transactions Balance, beginning of yearUnits issued for cash Units redeemedBalance, end of year
Schedule 3
Management expense ratios 1, 2 (%)Management and operating expensesGoods and services tax expensesTotal management expense ratio
Schedule 4
Earnings per unit 3 ($)
2005 2004 2003 2002 2001
3.34 3.29 3.40 3.37 3.420.17 0.23 0.18 0.17 0.183.51 3.52 3.58 3.54 3.60
2005 2004
1,178,612 1,369,86533,709 33,068
(304,394) (224,321)907,927 1,178,612
2005 2004 2003 2002 2001
12.55 11.81 11.34 9.51 11.93
2005 2004
0.69 0.45
1 Management expense information is calculated based on expenses charged directly to the fund plus, if applicable, expenses of the underlying funds, calculated on a weighted average basis on the percentageweighting of underlying fund and is expressed as an annualized percentage of average net assets for the year.
2 The fiscal year end of the underlying funds changed from December 31 to March 31. As a result, the MER of the underlying fund is based on the most recent audited MER at December 31, 2004. It is expectedthat the MER of the underlying funds at December 31, 2005 would be slightly less than the prior year MER due to a decline in fees that occurred in September 2005.
3 Earnings per unit is calculated by dividing the increase (decrease) in net assets from operations of the fund by the weighted average number of units outstanding during the year.
For inception date for the fund, please refer to note 1 in the Notes to the Financial Statements. The accompanying notes are an integral part of these financial statements.

– 10 –
CI Global Value Segregated FundUnderlying Fund Information (Unaudited)
CIG - 024
Top 25 Holdings of Underlying Fund
No. of Shares/ Average MarketFace Amount Investment Cost ($) Value ($)
116,600 ImClone Systems Inc. 5,661,714 4,641,767 370,810 Sumitomo Trust & Banking Co. Ltd. 2,851,825 4,407,064 73,430 Wyeth 3,898,219 3,933,171 42,900 AMBAC Financial Group Inc. 3,540,436 3,843,593 76,600 Noble Energy Inc. 3,240,732 3,589,094
268,100 Daiwa Securities Group Inc. 2,197,502 3,535,405 105,020 Tyco International Ltd. 3,484,600 3,523,866 73,400 J.P. Morgan Chase & Co. 3,497,320 3,387,102
113,900 GlaxoSmithKline PLC 3,179,065 3,346,984 32,800 Sanofi-Aventis 3,004,144 3,341,088 87,150 Heineken NV 3,546,674 3,212,627 79,634 ING Groep NV 2,881,449 3,211,800 49,600 Torchmark Corp. 2,642,778 3,206,325 29,500 Lafarge SA 3,349,746 3,086,156
111,800 Bristol-Myers Squibb Co. 4,186,256 2,987,053 8,590 Nestle SA, Registered Shares 2,882,054 2,987,046
85,000 Royal Bank of Scotland Group PLC 2,952,777 2,984,037 608,439 Kingfisher PLC 3,724,149 2,887,563 168,519 Diageo PLC 2,968,491 2,840,056 77,400 Vivendi Universal SA 2,186,954 2,819,117 31,200 Altria Group Inc. 1,717,258 2,710,457 34,410 Molson Coors Brewing Co. (USD) 2,604,442 2,680,067 97,900 Sprint Corp., FON Group 2,448,079 2,658,928
134,300 ATI Technologies Inc. (USD) 2,045,097 2,652,897 207,900 WPP Group PLC 2,698,375 2,615,853
Underlying Portfolio Exposure
Country Allocation (%)
U.S.A. . . . . . . . . . . . . . . . . . . . . . . . . . . . . . . . . . . . . . . . . . . . . . . . . . . . . . . . . . . . . . . . . . . 35.8Japan . . . . . . . . . . . . . . . . . . . . . . . . . . . . . . . . . . . . . . . . . . . . . . . . . . . . . . . . . . . . . . . . . . 14.4U.K. . . . . . . . . . . . . . . . . . . . . . . . . . . . . . . . . . . . . . . . . . . . . . . . . . . . . . . . . . . . . . . . . . . . . 10.9France . . . . . . . . . . . . . . . . . . . . . . . . . . . . . . . . . . . . . . . . . . . . . . . . . . . . . . . . . . . . . . . . . . 7.0Germany . . . . . . . . . . . . . . . . . . . . . . . . . . . . . . . . . . . . . . . . . . . . . . . . . . . . . . . . . . . . . . . . 6.2Italy . . . . . . . . . . . . . . . . . . . . . . . . . . . . . . . . . . . . . . . . . . . . . . . . . . . . . . . . . . . . . . . . . . . . 6.0Netherlands . . . . . . . . . . . . . . . . . . . . . . . . . . . . . . . . . . . . . . . . . . . . . . . . . . . . . . . . . . . . . 4.5Switzerland . . . . . . . . . . . . . . . . . . . . . . . . . . . . . . . . . . . . . . . . . . . . . . . . . . . . . . . . . . . . . . 2.4South Korea . . . . . . . . . . . . . . . . . . . . . . . . . . . . . . . . . . . . . . . . . . . . . . . . . . . . . . . . . . . . . 2.1Bermuda . . . . . . . . . . . . . . . . . . . . . . . . . . . . . . . . . . . . . . . . . . . . . . . . . . . . . . . . . . . . . . . . 1.8Cash & Equivalents . . . . . . . . . . . . . . . . . . . . . . . . . . . . . . . . . . . . . . . . . . . . . . . . . . . . . . . . 1.8Canada . . . . . . . . . . . . . . . . . . . . . . . . . . . . . . . . . . . . . . . . . . . . . . . . . . . . . . . . . . . . . . . . . 1.4Hong Kong . . . . . . . . . . . . . . . . . . . . . . . . . . . . . . . . . . . . . . . . . . . . . . . . . . . . . . . . . . . . . . 1.0Sweden . . . . . . . . . . . . . . . . . . . . . . . . . . . . . . . . . . . . . . . . . . . . . . . . . . . . . . . . . . . . . . . . . 0.8Finland . . . . . . . . . . . . . . . . . . . . . . . . . . . . . . . . . . . . . . . . . . . . . . . . . . . . . . . . . . . . . . . . . 0.7Taiwan . . . . . . . . . . . . . . . . . . . . . . . . . . . . . . . . . . . . . . . . . . . . . . . . . . . . . . . . . . . . . . . . . 0.7Mexico . . . . . . . . . . . . . . . . . . . . . . . . . . . . . . . . . . . . . . . . . . . . . . . . . . . . . . . . . . . . . . . . . 0.7Thailand . . . . . . . . . . . . . . . . . . . . . . . . . . . . . . . . . . . . . . . . . . . . . . . . . . . . . . . . . . . . . . . . 0.6Singapore . . . . . . . . . . . . . . . . . . . . . . . . . . . . . . . . . . . . . . . . . . . . . . . . . . . . . . . . . . . . . . . 0.5Cayman Islands . . . . . . . . . . . . . . . . . . . . . . . . . . . . . . . . . . . . . . . . . . . . . . . . . . . . . . . . . . . 0.4Croatia . . . . . . . . . . . . . . . . . . . . . . . . . . . . . . . . . . . . . . . . . . . . . . . . . . . . . . . . . . . . . . . . . 0.3
2005 Annual Report as at December 31, 2005

– 11 –
IncomeInterestIncome distribution from investments
Expenses (Management expense ratios – Schedule 3)Management fees (Note 4)Administrative (Note 4)CustodyLegalAuditGoods and services tax
Net income (loss) for the year
Realized and unrealized gain (loss) on investments Realized gain (loss) on investments (a)Capital gain distribution from investmentsChange in unrealized appreciation
(depreciation) of investmentsNet gain (loss) on investmentsIncrease (decrease)
in net assets from operations(Earnings per unit – Schedule 4)
(a) Realized gain (loss) on investmentsProceeds from sale of investments Investments at cost, beginning of yearInvestments purchased
Investments at cost, end of yearCost of investments soldRealized gain (loss) on investments
CI Global Value Segregated FundFinancial Statements
AssetsInvestments at market valueCashReceivable for unit subscriptionsReceivable for securities soldDividends and accrued interest receivable
LiabilitiesPayable for securities purchased Payable for unit redemptions
Net assets and unitholders’ equity
Net asset value per unit – Schedule 1
Number of units outstanding (Unit transactions – Schedule 2)
Statements of Operations for the years ended December 31 ($000’s)
2005 2004
3,098 4,71930 38
- -- -- -
3,128 4,757
- 2231 -31 22
3,097 4,735
11.16 10.98
277,567 431,364
Statements of Net Assets as at December 31 (in $000’s except for per unitamounts and units outstanding)
Statements of Changes in Net Assets for the years ended December 31 ($000’s)
2005 2004
1 -21 -22 -
3 436 47
- 1- -- -- 1
39 53(17) (53)
175 90- -
(129) 31446 404
29 351
1,694 9474,218 4,844
26 2314,244 5,0752,725 4,2181,519 857
175 90
Net assets, beginning of year
Capital transactionsProceeds from units issued Amounts paid for units redeemed
Increase (decrease) in net assetsfrom operations
Net assets, end of year
2005 2004
4,735 5,041
165 383(1,832) (1,040)(1,667) (657)
29 3513,097 4,735
Investment Portfolio as at December 31, 2005
No. of Average MarketUnits/Shares Investment Cost ($) Value ($)
244,491 CI Global Value Fund (Class A) 2,725,173 3,097,702
Total Investments (100.1%) 2,725,173 3,097,702
Other Assets (net) (-0.1%) (1,110)
Total Net Assets (100.0%) 3,096,592
The accompanying notes are an integral part of these financial statements. Percentages shown in brackets relate investments at market value to total net assets of the fund.
2005 Annual Report as at December 31, 2005

– 12 –
CI Global Value Segregated FundFinancial Statements – Supplementary Schedules (for the years ended December 31)
2005 Annual Report as at December 31, 2005
Schedule 1
Net asset value per unit, end of year ($)
Schedule 2
Unit transactions Balance, beginning of yearUnits issued for cash Units redeemedBalance, end of year
Schedule 3
Management expense ratios 1, 2 (%)Management and operating expensesGoods and services tax expensesTotal management expense ratio
Schedule 4
Earnings per unit 3 ($)
2005 2004 2003 2002 2001
3.34 3.30 3.42 3.41 3.440.17 0.23 0.18 0.17 0.183.51 3.53 3.60 3.58 3.62
2005 2004
431,364 491,81115,286 36,229
(169,083) (96,676)277,567 431,364
2005 2004 2003 2002 2001
11.16 10.98 10.25 8.82 10.58
2005 2004
0.08 0.75
1 Management expense information is calculated based on expenses charged directly to the fund plus, if applicable, expenses of the underlying funds, calculated on a weighted average basis on the percentageweighting of underlying fund and is expressed as an annualized percentage of average net assets for the year.
2 The fiscal year end of the underlying funds changed from December 31 to March 31. As a result, the MER of the underlying fund is based on the most recent audited MER at December 31, 2004. It is expectedthat the MER of the underlying funds at December 31, 2005 would be slightly less than the prior year MER due to a decline in fees that occurred in September 2005.
3 Earnings per unit is calculated by dividing the increase (decrease) in net assets from operations of the fund by the weighted average number of units outstanding during the year.
For inception date for the fund, please refer to note 1 in the Notes to the Financial Statements. The accompanying notes are an integral part of these financial statements.

– 13 –
CI Harbour Segregated FundUnderlying Fund Information (Unaudited)
CIG - 021
Top 25 Holdings of Underlying Fund
No. of Shares/ Average MarketFace Amount Investment Cost ($) Value ($)
3,100,000 Suncor Energy Inc. 65,715,748 227,292,000 2,800,000 Talisman Energy Inc. 45,675,803 172,480,000 1,800,000 Royal Bank of Canada 80,146,085 163,458,000 2,500,000 Toronto-Dominion Bank 98,525,308 152,825,000 3,300,000 Bank of Nova Scotia 81,072,330 152,262,000 7,500,000 BHP Billiton Ltd. 127,283,085 145,480,202 3,000,000 Alcan Inc. 125,319,141 143,280,000 1,500,000 Canadian National Railway Co. 65,638,767 139,710,000 4,000,000 Falconbridge Ltd. 82,815,185 138,000,000 2,500,000 EnCana Corp. 64,736,730 131,400,000 2,600,000 Ensign Energy Services Inc. 35,393,270 121,992,000 2,000,000 Citigroup Inc. 116,983,262 112,847,343 2,300,000 Petro-Canada 38,246,725 107,295,000 1,150,000 Potash Corp. of Saskatchewan 60,804,184 107,065,000 1,400,000 Canadian Imperial Bank of Commerce 75,851,815 106,974,000 1,000,000 IPSCO Inc. 25,351,183 96,710,000 5,600,000 Yellow Pages Income Fund 77,778,624 91,280,000 1,200,000 Cameco Corp. (USD) 17,350,544 88,548,000
680,000 Canadian Oil Sands Trust 27,411,252 85,680,000 2,200,000 Ross Stores Inc. 65,069,260 73,921,637
500,000 Total SA, ADR 61,572,963 73,479,828 4,200,000 Diageo PLC 66,764,417 70,782,741 2,600,000 TJX Co. Inc. 68,943,599 70,222,067 1,000,000 Morgan Stanley 68,292,951 65,969,073
260,000 Air Liquide 48,665,622 58,157,942
Underlying Portfolio Exposure
Sector Allocation (%)
Energy . . . . . . . . . . . . . . . . . . . . . . . . . . . . . . . . . . . . . . . . . . . . . . . . . . . . . . . . . . . . . . . . . . 26.5Materials . . . . . . . . . . . . . . . . . . . . . . . . . . . . . . . . . . . . . . . . . . . . . . . . . . . . . . . . . . . . . . . . 23.7Financials . . . . . . . . . . . . . . . . . . . . . . . . . . . . . . . . . . . . . . . . . . . . . . . . . . . . . . . . . . . . . . . . 20.8Cash & Equivalents . . . . . . . . . . . . . . . . . . . . . . . . . . . . . . . . . . . . . . . . . . . . . . . . . . . . . . . . 15.0Consumer Discretionary . . . . . . . . . . . . . . . . . . . . . . . . . . . . . . . . . . . . . . . . . . . . . . . . . . . . . 6.7Industrials . . . . . . . . . . . . . . . . . . . . . . . . . . . . . . . . . . . . . . . . . . . . . . . . . . . . . . . . . . . . . . . 3.6Consumer Staples . . . . . . . . . . . . . . . . . . . . . . . . . . . . . . . . . . . . . . . . . . . . . . . . . . . . . . . . . 3.5Health Care . . . . . . . . . . . . . . . . . . . . . . . . . . . . . . . . . . . . . . . . . . . . . . . . . . . . . . . . . . . . . . 0.1Warrants . . . . . . . . . . . . . . . . . . . . . . . . . . . . . . . . . . . . . . . . . . . . . . . . . . . . . . . . . . . . . . . . 0.1
2005 Annual Report as at December 31, 2005

– 14 –
IncomeInterestIncome distribution from investments
Expenses (Management expense ratios – Schedule 3)Management fees (Note 4)Administrative (Note 4)CustodyLegalAuditGoods and services tax
Net income (loss) for the year
Realized and unrealized gain (loss) on investments Realized gain (loss) on investments (a)Capital gain distribution from investmentsChange in unrealized appreciation
(depreciation) of investmentsNet gain (loss) on investmentsIncrease (decrease)
in net assets from operations(Earnings per unit – Schedule 4)
(a) Realized gain (loss) on investmentsProceeds from sale of investments Investments at cost, beginning of yearInvestments purchased
Investments at cost, end of yearCost of investments soldRealized gain (loss) on investments
CI Harbour Segregated FundFinancial Statements
AssetsInvestments at market valueCashReceivable for unit subscriptionsReceivable for securities soldDividends and accrued interest receivable
LiabilitiesPayable for securities purchased Payable for unit redemptions
Net assets and unitholders’ equity
Net asset value per unit – Schedule 1
Number of units outstanding (Unit transactions – Schedule 2)
Statements of Operations for the years ended December 31 ($000’s)
2005 2004
29,671 28,75919 60
- -- -- -
29,690 28,819
- 101 101 20
29,689 28,799
21.84 17.84
1,359,338 1,614,547
Statements of Net Assets as at December 31 (in $000’s except for per unitamounts and units outstanding)
Statements of Changes in Net Assets for the years ended December 31 ($000’s)
2005 2004
2 2- -2 2
22 21230 225
- 11 -1 13 3
257 251(255) (249)
2,207 1,216- -
3,949 2,9066,156 4,122
5,901 3,873
5,774 4,86718,755 22,099
530 30719,285 22,40615,718 18,7553,567 3,6512,207 1,216
Investment Portfolio as at December 31, 2005
No. of Average MarketUnits/Shares Investment Cost ($) Value ($)
1,570,723 Harbour Fund (Class A) 15,718,100 29,670,963
Total Investments (99.9%) 15,718,100 29,670,963
Other Assets (net) (0.1%) 18,528
Total Net Assets (100.0%) 29,689,491
Net assets, beginning of year
Capital transactionsProceeds from units issued Amounts paid for units redeemed
Increase (decrease) in net assetsfrom operations
Net assets, end of year
2005 2004
28,799 29,297
2,296 1,368(7,307) (5,739)(5,011) (4,371)
5,901 3,87329,689 28,799
The accompanying notes are an integral part of these financial statements. Percentages shown in brackets relate investments at market value to total net assets of the fund.
2005 Annual Report as at December 31, 2005
– 15 –
CI Harbour Segregated FundFinancial Statements – Supplementary Schedules (for the years ended December 31)
2005 Annual Report as at December 31, 2005
Schedule 1
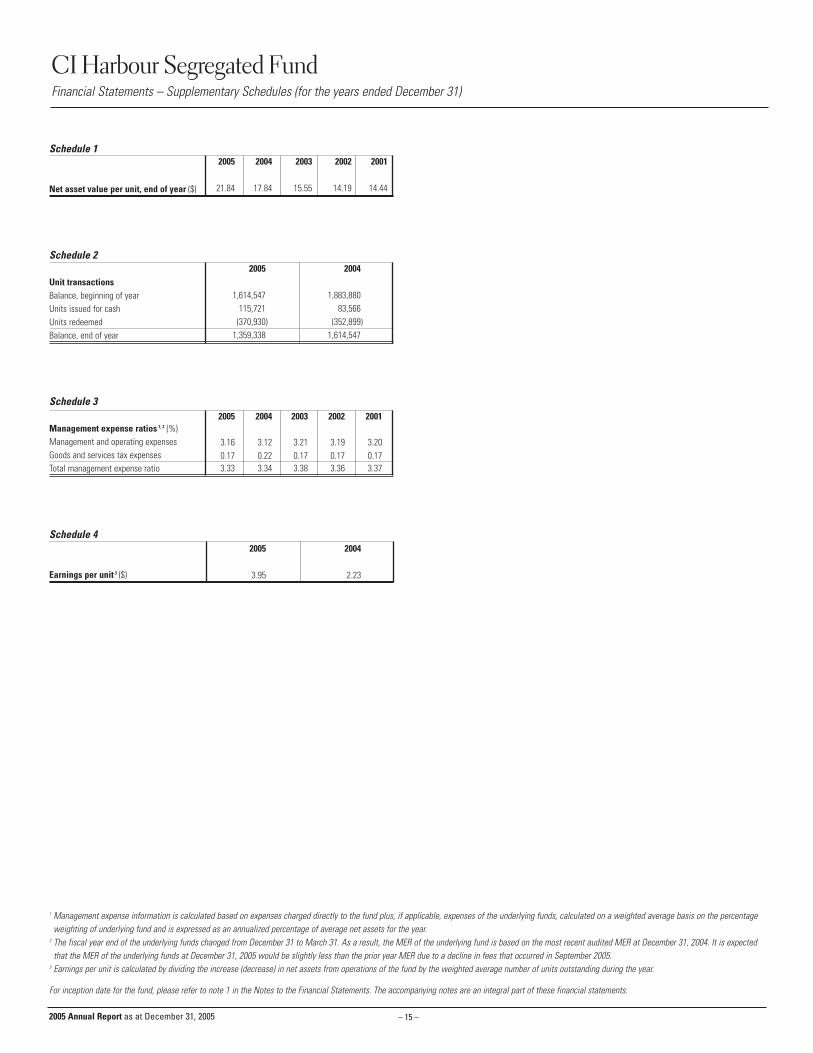
Net asset value per unit, end of year ($)
Schedule 2
Unit transactions Balance, beginning of yearUnits issued for cash Units redeemedBalance, end of year
Schedule 3
Management expense ratios 1, 2 (%)Management and operating expensesGoods and services tax expensesTotal management expense ratio
Schedule 4
Earnings per unit 3 ($)
2005 2004 2003 2002 2001
3.16 3.12 3.21 3.19 3.200.17 0.22 0.17 0.17 0.173.33 3.34 3.38 3.36 3.37
2005 2004
1,614,547 1,883,880115,721 83,566(370,930) (352,899)
1,359,338 1,614,547
2005 2004 2003 2002 2001
21.84 17.84 15.55 14.19 14.44
2005 2004
3.95 2.23
1 Management expense information is calculated based on expenses charged directly to the fund plus, if applicable, expenses of the underlying funds, calculated on a weighted average basis on the percentageweighting of underlying fund and is expressed as an annualized percentage of average net assets for the year.
2 The fiscal year end of the underlying funds changed from December 31 to March 31. As a result, the MER of the underlying fund is based on the most recent audited MER at December 31, 2004. It is expectedthat the MER of the underlying funds at December 31, 2005 would be slightly less than the prior year MER due to a decline in fees that occurred in September 2005.
3 Earnings per unit is calculated by dividing the increase (decrease) in net assets from operations of the fund by the weighted average number of units outstanding during the year.
For inception date for the fund, please refer to note 1 in the Notes to the Financial Statements. The accompanying notes are an integral part of these financial statements.
– 16 –
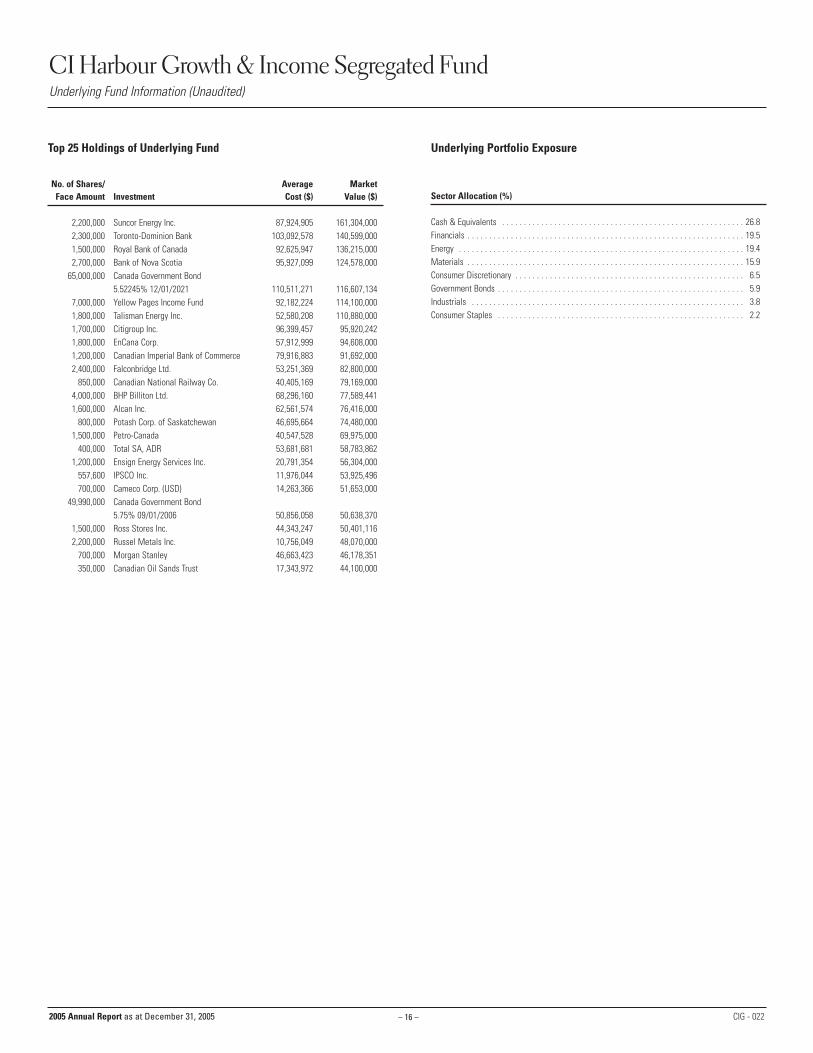
CI Harbour Growth & Income Segregated FundUnderlying Fund Information (Unaudited)
CIG - 022
Top 25 Holdings of Underlying Fund
No. of Shares/ Average MarketFace Amount Investment Cost ($) Value ($)
2,200,000 Suncor Energy Inc. 87,924,905 161,304,000 2,300,000 Toronto-Dominion Bank 103,092,578 140,599,000 1,500,000 Royal Bank of Canada 92,625,947 136,215,000 2,700,000 Bank of Nova Scotia 95,927,099 124,578,000
65,000,000 Canada Government Bond 5.52245% 12/01/2021 110,511,271 116,607,134
7,000,000 Yellow Pages Income Fund 92,182,224 114,100,000 1,800,000 Talisman Energy Inc. 52,580,208 110,880,000 1,700,000 Citigroup Inc. 96,399,457 95,920,242 1,800,000 EnCana Corp. 57,912,999 94,608,000 1,200,000 Canadian Imperial Bank of Commerce 79,916,883 91,692,000 2,400,000 Falconbridge Ltd. 53,251,369 82,800,000
850,000 Canadian National Railway Co. 40,405,169 79,169,000 4,000,000 BHP Billiton Ltd. 68,296,160 77,589,441 1,600,000 Alcan Inc. 62,561,574 76,416,000
800,000 Potash Corp. of Saskatchewan 46,695,664 74,480,000 1,500,000 Petro-Canada 40,547,528 69,975,000
400,000 Total SA, ADR 53,681,681 58,783,862 1,200,000 Ensign Energy Services Inc. 20,791,354 56,304,000
557,600 IPSCO Inc. 11,976,044 53,925,496 700,000 Cameco Corp. (USD) 14,263,366 51,653,000
49,990,000 Canada Government Bond 5.75% 09/01/2006 50,856,058 50,638,370
1,500,000 Ross Stores Inc. 44,343,247 50,401,116 2,200,000 Russel Metals Inc. 10,756,049 48,070,000
700,000 Morgan Stanley 46,663,423 46,178,351 350,000 Canadian Oil Sands Trust 17,343,972 44,100,000
Underlying Portfolio Exposure
Sector Allocation (%)
Cash & Equivalents . . . . . . . . . . . . . . . . . . . . . . . . . . . . . . . . . . . . . . . . . . . . . . . . . . . . . . . . 26.8Financials . . . . . . . . . . . . . . . . . . . . . . . . . . . . . . . . . . . . . . . . . . . . . . . . . . . . . . . . . . . . . . . . 19.5Energy . . . . . . . . . . . . . . . . . . . . . . . . . . . . . . . . . . . . . . . . . . . . . . . . . . . . . . . . . . . . . . . . . . 19.4Materials . . . . . . . . . . . . . . . . . . . . . . . . . . . . . . . . . . . . . . . . . . . . . . . . . . . . . . . . . . . . . . . . 15.9Consumer Discretionary . . . . . . . . . . . . . . . . . . . . . . . . . . . . . . . . . . . . . . . . . . . . . . . . . . . . . 6.5Government Bonds . . . . . . . . . . . . . . . . . . . . . . . . . . . . . . . . . . . . . . . . . . . . . . . . . . . . . . . . . 5.9Industrials . . . . . . . . . . . . . . . . . . . . . . . . . . . . . . . . . . . . . . . . . . . . . . . . . . . . . . . . . . . . . . . 3.8Consumer Staples . . . . . . . . . . . . . . . . . . . . . . . . . . . . . . . . . . . . . . . . . . . . . . . . . . . . . . . . . 2.2
2005 Annual Report as at December 31, 2005

– 17 –
IncomeInterestIncome distribution from investments
Expenses (Management expense ratios – Schedule 3)Management fees (Note 4)Administrative (Note 4)CustodyLegalAuditGoods and services tax
Net income (loss) for the year
Realized and unrealized gain (loss) on investments Realized gain (loss) on investments (a)Capital gain distribution from investmentsChange in unrealized appreciation
(depreciation) of investmentsNet gain (loss) on investmentsIncrease (decrease)
in net assets from operations(Earnings per unit – Schedule 4)
(a) Realized gain (loss) on investmentsProceeds from sale of investments Investments at cost, beginning of yearInvestments purchased
Investments at cost, end of yearCost of investments soldRealized gain (loss) on investments
CI Harbour Growth & Income Segregated FundFinancial Statements
AssetsInvestments at market valueCashReceivable for unit subscriptionsReceivable for securities soldDividends and accrued interest receivable
LiabilitiesPayable for securities purchased Payable for unit redemptions
Net assets and unitholders’ equity
Net asset value per unit – Schedule 1
Number of units outstanding (Unit transactions – Schedule 2)
Statements of Operations for the years ended December 31 ($000’s)
2005 2004
24,843 25,19159 60
- -- 6- -
24,902 25,257
13 1- 4
13 524,889 25,252
17.54 15.08
1,419,158 1,675,116
Statements of Net Assets as at December 31 (in $000’s except for per unitamounts and units outstanding)
Statements of Changes in Net Assets for the years ended December 31 ($000’s)
2005 2004
2 275 -77 2
19 19178 175
- 1- -- 12 2
199 198(122) (196)
1,776 95721 -
2,135 1,9123,932 2,869
3,810 2,673
5,091 3,94117,095 19,206
832 87317,927 20,07914,612 17,0953,315 2,9841,776 957
Investment Portfolio as at December 31, 2005
No. of Average MarketUnits/Shares Investment Cost ($) Value ($)
1,468,246 Harbour Growth & Income Fund (Class A) 14,612,291 24,842,714
Total Investments (99.8%) 14,612,291 24,842,714
Other Assets (net) (0.2%) 46,348
Total Net Assets (100.0%) 24,889,062
Net assets, beginning of year
Capital transactionsProceeds from units issued Amounts paid for units redeemed
Increase (decrease) in net assetsfrom operations
Net assets, end of year
2005 2004
25,252 25,354
2,928 1,743(7,101) (4,518)(4,173) (2,775)
3,810 2,67324,889 25,252
The accompanying notes are an integral part of these financial statements. Percentages shown in brackets relate investments at market value to total net assets of the fund.
2005 Annual Report as at December 31, 2005

– 18 –
CI Harbour Growth & Income Segregated FundFinancial Statements – Supplementary Schedules (for the years ended December 31)
2005 Annual Report as at December 31, 2005
Schedule 1
Net asset value per unit, end of year ($)
Schedule 2
Unit transactions Balance, beginning of yearUnits issued for cash Units redeemedBalance, end of year
Schedule 3
Management expense ratios 1, 2 (%)Management and operating expensesGoods and services tax expensesTotal management expense ratio
Schedule 4
Earnings per unit 3 ($)
2005 2004 2003 2002 2001
3.07 3.04 3.12 3.10 3.120.17 0.21 0.17 0.17 0.173.24 3.25 3.29 3.27 3.29
2005 2004
1,675,116 1,873,895179,010 123,548(434,968) (322,327)
1,419,158 1,675,116
2005 2004 2003 2002 2001
17.54 15.08 13.53 12.62 12.56
2005 2004
2.44 1.51
1 Management expense information is calculated based on expenses charged directly to the fund plus, if applicable, expenses of the underlying funds, calculated on a weighted average basis on the percentageweighting of underlying fund and is expressed as an annualized percentage of average net assets for the year.
2 The fiscal year end of the underlying funds changed from December 31 to March 31. As a result, the MER of the underlying fund is based on the most recent audited MER at December 31, 2004. It is expectedthat the MER of the underlying funds at December 31, 2005 would be slightly less than the prior year MER due to a decline in fees that occurred in September 2005.
3 Earnings per unit is calculated by dividing the increase (decrease) in net assets from operations of the fund by the weighted average number of units outstanding during the year.
For inception date for the fund, please refer to note 1 in the Notes to the Financial Statements. The accompanying notes are an integral part of these financial statements.

– 19 –
CI Synergy American Segregated FundUnderlying Fund Information (Unaudited)
CIG - 023
Top 25 Holdings of Underlying Fund
No. of Shares/ Average MarketFace Amount Investment Cost ($) Value ($)
107,500 Burlington Northern Santa Fe Corp. 5,992,117 8,851,471 71,000 Aetna Inc. 5,431,317 7,785,153
125,600 Bank of America Corp. 7,064,127 6,739,263 85,700 CB Richard Ellis Group Inc., Class A 3,200,851 5,863,789 59,300 Wells Fargo & Co. 4,438,503 4,331,844 68,700 Freeport-McMoRan Copper & Gold Inc., Class B 3,297,126 4,297,245 79,100 Advance Auto Parts Inc. 2,958,332 3,996,845
124,700 CVS Corp. 4,001,983 3,830,455 74,600 QUALCOMM Inc. 3,566,278 3,736,505 55,700 Medtronic Inc. 3,747,354 3,728,228
100,500 Chesapeake Energy Corp. 2,120,902 3,707,551 136,400 Sprint Corp., FON Group 3,774,355 3,704,574 44,000 Genzyme Corp. 3,221,695 3,620,881
102,300 Alcoa Inc. 3,370,229 3,517,046 75,300 J.P. Morgan Chase & Co. 3,212,224 3,474,779 89,500 Coach Inc. 2,685,255 3,469,283 44,000 Merrill Lynch & Co. Inc. 3,360,976 3,464,853
186,800 News Corp Inc., A-Shares 3,981,059 3,377,212 53,900 Teck Cominco Ltd., Class B 1,770,508 3,344,495 45,900 Devon Energy Corp. 2,314,666 3,337,503
128,300 MEMC Electronic Materials Inc. 2,146,714 3,307,070 97,700 Hewlett-Packard Co. 3,174,400 3,252,123
122,400 Motorola Inc. 2,624,495 3,214,761 51,100 Allstate Corp. 3,251,347 3,212,390 66,600 Cintas Corp. 3,505,502 3,184,813
Underlying Portfolio Exposure
Sector Allocation (%)
Consumer Discretionary . . . . . . . . . . . . . . . . . . . . . . . . . . . . . . . . . . . . . . . . . . . . . . . . . . . . . 17.7Financials . . . . . . . . . . . . . . . . . . . . . . . . . . . . . . . . . . . . . . . . . . . . . . . . . . . . . . . . . . . . . . . . 17.7Information Technology . . . . . . . . . . . . . . . . . . . . . . . . . . . . . . . . . . . . . . . . . . . . . . . . . . . . . 16.8Health Care . . . . . . . . . . . . . . . . . . . . . . . . . . . . . . . . . . . . . . . . . . . . . . . . . . . . . . . . . . . . . . 12.6Industrials . . . . . . . . . . . . . . . . . . . . . . . . . . . . . . . . . . . . . . . . . . . . . . . . . . . . . . . . . . . . . . . 10.4Energy . . . . . . . . . . . . . . . . . . . . . . . . . . . . . . . . . . . . . . . . . . . . . . . . . . . . . . . . . . . . . . . . . . 8.8Materials . . . . . . . . . . . . . . . . . . . . . . . . . . . . . . . . . . . . . . . . . . . . . . . . . . . . . . . . . . . . . . . . 8.7Consumer Staples . . . . . . . . . . . . . . . . . . . . . . . . . . . . . . . . . . . . . . . . . . . . . . . . . . . . . . . . . 3.1Cash & Equivalents . . . . . . . . . . . . . . . . . . . . . . . . . . . . . . . . . . . . . . . . . . . . . . . . . . . . . . . . 2.5Telecommunication Services . . . . . . . . . . . . . . . . . . . . . . . . . . . . . . . . . . . . . . . . . . . . . . . . . 1.7
2005 Annual Report as at December 31, 2005

– 20 –
IncomeInterestIncome distribution from investments
Expenses (Management expense ratios – Schedule 3)Management fees (Note 4)Administrative (Note 4)CustodyLegalAuditGoods and services tax
Net income (loss) for the year
Realized and unrealized gain (loss) on investments Realized gain (loss) on investments (a)Capital gain distribution from investmentsChange in unrealized appreciation
(depreciation) of investmentsNet gain (loss) on investmentsIncrease (decrease)
in net assets from operations(Earnings per unit – Schedule 4)
(a) Realized gain (loss) on investmentsProceeds from sale of investments Investments at cost, beginning of yearInvestments purchased
Investments at cost, end of yearCost of investments soldRealized gain (loss) on investments
CI Synergy American Segregated FundFinancial Statements
AssetsInvestments at market valueCashReceivable for unit subscriptionsReceivable for securities soldDividends and accrued interest receivable
LiabilitiesPayable for securities purchased Payable for unit redemptions
Net assets and unitholders’ equity
Net asset value per unit – Schedule 1
Number of units outstanding (Unit transactions – Schedule 2)
Statements of Operations for the years ended December 31 ($000’s)
2005 2004
3,443 4,75446 24
- -- -- -
3,489 4,778
- -29 829 8
3,460 4,770
10.56 10.19
327,624 468,049
Statements of Net Assets as at December 31 (in $000’s except for per unitamounts and units outstanding)
Statements of Changes in Net Assets for the years ended December 31 ($000’s)
2005 2004
1 -- -1 -
3 435 42
- 1- -- -- -
38 47(37) (47)
(621) (551)- -
792 839171 288
134 241
1,481 1,0026,853 8,337
- 696,853 8,4064,751 6,8532,102 1,553(621) (551)
Investment Portfolio as at December 31, 2005
No. of Average MarketUnits/Shares Investment Cost ($) Value ($)
279,730 Synergy American Fund (Class A) 4,751,200 3,443,479
Total Investments (99.5%) 4,751,200 3,443,479
Other Assets (net) (0.5%) 16,976
Total Net Assets (100.0%) 3,460,455
Net assets, beginning of year
Capital transactionsProceeds from units issued Amounts paid for units redeemed
Increase (decrease) in net assetsfrom operations
Net assets, end of year
2005 2004
4,770 5,407
123 296(1,567) (1,174)(1,444) (878)
134 2413,460 4,770
The accompanying notes are an integral part of these financial statements. Percentages shown in brackets relate investments at market value to total net assets of the fund.
2005 Annual Report as at December 31, 2005

– 21 –
CI Synergy American Segregated FundFinancial Statements – Supplementary Schedules (for the years ended December 31)
2005 Annual Report as at December 31, 2005
Schedule 1
Net asset value per unit, end of year ($)
Schedule 2
Unit transactions Balance, beginning of yearUnits issued for cash Units redeemedBalance, end of year
Schedule 3
Management expense ratios 1, 2 (%)Management and operating expensesGoods and services tax expensesTotal management expense ratio
Schedule 4
Earnings per unit 3 ($)
2005 2004 2003 2002 2001
3.23 3.20 3.30 3.27 3.340.17 0.22 0.17 0.17 0.183.40 3.42 3.47 3.44 3.52
2005 2004
468,049 560,26512,024 31,037
(152,449) (123,253)327,624 468,049
2005 2004 2003 2002 2001
10.56 10.19 9.65 8.41 12.21
2005 2004
0.33 0.46
1 Management expense information is calculated based on expenses charged directly to the fund plus, if applicable, expenses of the underlying funds, calculated on a weighted average basis on the percentageweighting of underlying fund and is expressed as an annualized percentage of average net assets for the year.
2 The fiscal year end of the underlying funds changed from December 31 to March 31. As a result, the MER of the underlying fund is based on the most recent audited MER at December 31, 2004. It is expectedthat the MER of the underlying funds at December 31, 2005 would be slightly less than the prior year MER due to a decline in fees that occurred in September 2005.
3 Earnings per unit is calculated by dividing the increase (decrease) in net assets from operations of the fund by the weighted average number of units outstanding during the year.
For inception date for the fund, please refer to note 1 in the Notes to the Financial Statements. The accompanying notes are an integral part of these financial statements.

– 22 –
CI Money Market Segregated FundUnderlying Fund Information (Unaudited)
CIG - 020
Top 25 Holdings of Underlying Fund
No. of Shares/ Average MarketFace Amount Investment Cost ($) Value ($)
47,800,000 Province of Ontario T-Bill 3.58% 06/02/2006 47,095,181 47,095,181 42,200,000 Province of Ontario 5.9% 03/08/2006 42,529,160 42,511,858 32,000,000 Government of Canada T-Bill
3.16% 01/03/2006 31,991,680 31,991,680 30,300,000 Royal Bank of Canada BA 3.2% 02/03/2006 30,210,452 30,210,452 29,551,000 Greater Toronto Airport Authority
3.52286% 05/18/2007 29,561,661 29,551,000 29,400,000 Province of Quebec T-Bill 3.34% 03/03/2006 29,234,464 29,234,464 28,100,000 Bank of Montreal BDN 3.39% 03/06/2006 27,931,923 27,931,923 27,800,000 Province of New Brunswick T-Bill
3.35% 03/06/2006 27,635,563 27,635,563 27,600,000 GE Capital Canada Funding Co.
3.29% 02/13/2006 27,491,386 27,491,386 27,400,000 Government of Canada T-Bill
3.21% 01/03/2006 27,392,783 27,392,783 27,200,000 ASIF II 3.58714% 06/15/2007 27,156,315 27,180,960 27,000,000 Deutschebank Canada TD 3.25% 01/03/2006 27,002,404 27,002,404 24,600,000 HSBC Bank Canada BDN 3.24% 02/08/2006 24,515,552 24,515,552 24,500,000 HSBC Bank Canada BDN 3.3% 02/14/2006 24,401,138 24,401,138 24,500,000 Province of Ontario T-Bill 3.33% 02/28/2006 24,369,024 24,369,024 23,400,000 Citibank N.A. 3.65% 06/01/2006 23,050,769 23,050,769 21,500,000 McCain Finance Canada Ltd.
3.34% 01/23/2006 21,454,877 21,454,877 21,100,000 Bank of Nova Scotia BDN 3.32% 02/15/2006 21,012,430 21,012,430 21,000,000 CIBC BA 3.41% 03/10/2006 20,865,851 20,865,851 19,100,000 Government of Canada T-Bill
3.24% 02/23/2006 19,009,279 19,009,279 19,100,000 Government of Canada T-Bill
3.42% 05/04/2006 18,881,487 18,881,487 18,600,000 Toronto Dominion Bank BDN
3.44% 03/14/2006 18,473,075 18,473,075 18,500,000 Government of Canada T-Bill
3.23% 04/06/2006 18,345,129 18,345,129 17,900,000 Province of Ontario 3.25% 01/20/2006 17,900,062 17,900,000 17,400,000 Bank of Montreal 3.39571% 09/14/2007 17,400,000 17,400,000
Underlying Portfolio Exposure
Allocation (%)
Short Term Notes . . . . . . . . . . . . . . . . . . . . . . . . . . . . . . . . . . . . . . . . . . . . . . . . . . . . . . . . . . 81.9Bonds . . . . . . . . . . . . . . . . . . . . . . . . . . . . . . . . . . . . . . . . . . . . . . . . . . . . . . . . . . . . . . . . . . . 17.8Cash & Equivalents . . . . . . . . . . . . . . . . . . . . . . . . . . . . . . . . . . . . . . . . . . . . . . . . . . . . . . . . 0.3
2005 Annual Report as at December 31, 2005

– 23 –
IncomeInterestIncome distribution from investments
Expenses (Management expense ratios – Schedule 3)Management fees (Note 4)Administrative (Note 4)CustodyLegalAuditGoods and services tax
Net income (loss) for the year
Realized and unrealized gain (loss) on investments Realized gain (loss) on investments (a)Capital gain distribution from investmentsChange in unrealized appreciation
(depreciation) of investmentsNet gain (loss) on investmentsIncrease (decrease)
in net assets from operations(Earnings per unit – Schedule 4)
(a) Realized gain (loss) on investmentsProceeds from sale of investments Investments at cost, beginning of yearInvestments purchased
Investments at cost, end of yearCost of investments soldRealized gain (loss) on investments
CI Money Market Segregated FundFinancial Statements
AssetsInvestments at market valueCashReceivable for unit subscriptionsReceivable for securities soldDividends and accrued interest receivable
LiabilitiesPayable for securities purchased Payable for unit redemptions
Net assets and unitholders’ equity
Net asset value per unit – Schedule 1
Number of units outstanding (Unit transactions – Schedule 2)
Statements of Operations for the years ended December 31 ($000’s)
2005 2004
2,141 2,5582 6- -- -5 2
2,148 2,566
- -- -- -
2,148 2,566
12.04 11.89
178,444 215,810
Statements of Net Assets as at December 31 (in $000’s except for per unitamounts and units outstanding)
Statements of Changes in Net Assets for the years ended December 31 ($000’s)
2005 2004
1 136 3937 40
2 27 10- 1- -- -- -9 13
28 27
- -- -
- -- -
28 27
2,504 2,1882,558 3,3242,087 1,4224,645 4,7462,141 2,5582,504 2,188
- -
Investment Portfolio as at December 31, 2005
No. of Average MarketUnits/Shares Investment Cost ($) Value ($)
214,140 CI Money Market Fund (Class A) 2,141,402 2,141,402
Total Investments (99.7%) 2,141,402 2,141,402
Other Assets (net) (0.3%) 6,425
Total Net Assets (100.0%) 2,147,827
Net assets, beginning of year
Capital transactionsProceeds from units issued Amounts paid for units redeemed
Increase (decrease) in net assetsfrom operations
Net assets, end of year
2005 2004
2,566 3,336
3,124 1,723(3,570) (2,520)
(446) (797)
28 272,148 2,566
The accompanying notes are an integral part of these financial statements. Percentages shown in brackets relate investments at market value to total net assets of the fund.
2005 Annual Report as at December 31, 2005
– 24 –
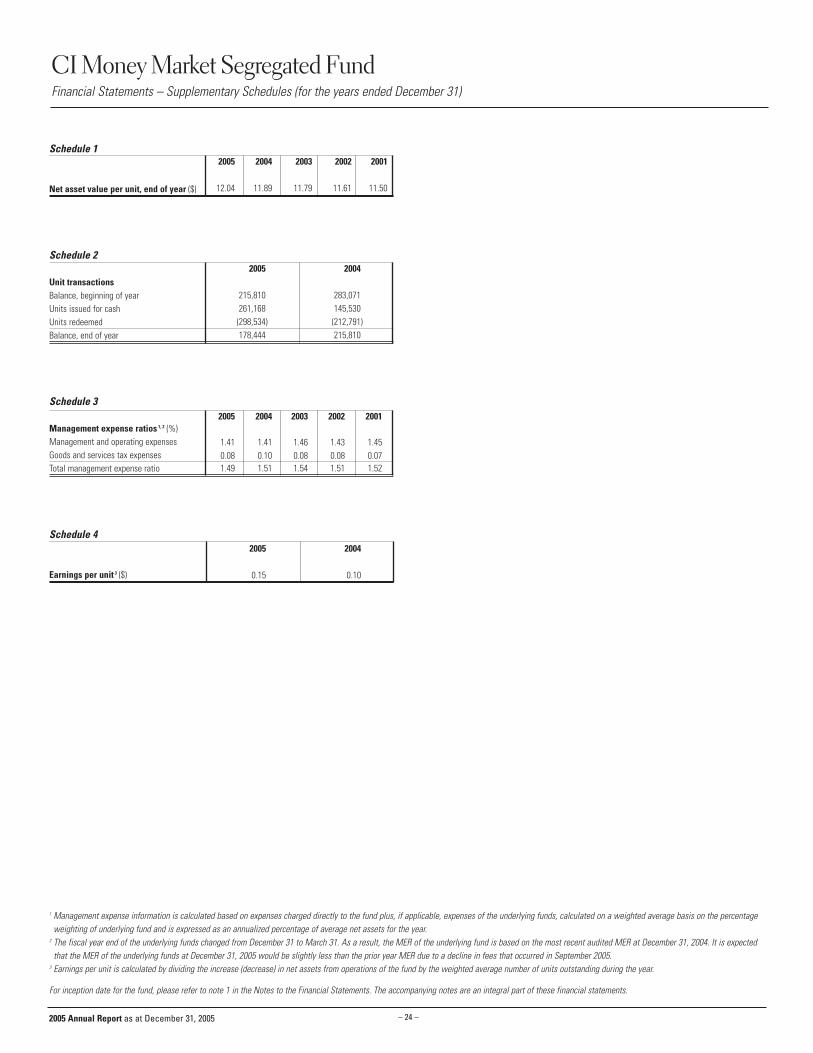
CI Money Market Segregated FundFinancial Statements – Supplementary Schedules (for the years ended December 31)
2005 Annual Report as at December 31, 2005
Schedule 1
Net asset value per unit, end of year ($)
Schedule 2
Unit transactions Balance, beginning of yearUnits issued for cash Units redeemedBalance, end of year
Schedule 3
Management expense ratios 1, 2 (%)Management and operating expensesGoods and services tax expensesTotal management expense ratio
Schedule 4
Earnings per unit 3 ($)
2005 2004 2003 2002 2001
1.41 1.41 1.46 1.43 1.450.08 0.10 0.08 0.08 0.071.49 1.51 1.54 1.51 1.52
2005 2004
215,810 283,071261,168 145,530(298,534) (212,791)178,444 215,810
2005 2004 2003 2002 2001
12.04 11.89 11.79 11.61 11.50
2005 2004
0.15 0.10
1 Management expense information is calculated based on expenses charged directly to the fund plus, if applicable, expenses of the underlying funds, calculated on a weighted average basis on the percentageweighting of underlying fund and is expressed as an annualized percentage of average net assets for the year.
2 The fiscal year end of the underlying funds changed from December 31 to March 31. As a result, the MER of the underlying fund is based on the most recent audited MER at December 31, 2004. It is expectedthat the MER of the underlying funds at December 31, 2005 would be slightly less than the prior year MER due to a decline in fees that occurred in September 2005.
3 Earnings per unit is calculated by dividing the increase (decrease) in net assets from operations of the fund by the weighted average number of units outstanding during the year.
For inception date for the fund, please refer to note 1 in the Notes to the Financial Statements. The accompanying notes are an integral part of these financial statements.

2005 Annual Report as at December 31, 2005 – 25 –
1. THE FUNDS
The following funds were created by board resolution of Unity Life of Canada.
Fund Names (the “Fund”) Dated
CI Global Segregated Fund October 28, 1997
CI Global Value Segregated Fund October 28, 1997
CI Harbour Segregated Fund October 28, 1997
CI Harbour Growth & Income Segregated Fund October 28, 1997
CI Synergy American Segregated Fund October 28, 1997
CI Money Market Segregated Fund October 28, 1997
Each Fund invests all of its net assets in a CI mutual fund (the “Underlying Funds”).
CI Investments Inc. is the manager of each Fund and Underlying Fund.
The Investment Portfolio for each Fund is shown as at December 31, 2005 and the Statements of
Net Assets are as at December 31, 2005 and 2004. The Statements of Operations and Changes
in Net Assets for each Fund are for the years ended December 31, 2005 and 2004. The
Supplementary Schedules on the Financial Statements for each Fund are for each of the most
recent five years for schedules 1 and 3, and two years for schedules 2 and 4 ended December 31.
Effective December 31, 2000, the Funds were closed to new or additional contributions.
2. SUMMARY OF SIGNIFICANT ACCOUNTING POLICIES
These financial statements have been prepared in accordance with Canadian generally
accepted accounting principles.
The following is a summary of significant accounting policies of the Funds:
(a) Valuation of Investments
Mutual funds are valued on each business date at their closing net asset value.
(b) Foreign Exchange
Foreign currency amounts are translated into Canadian dollars as follows: market value of
investments, forward currency contracts, other assets and liabilities at the closing rate of
exchange on each business day; income, expenses and purchases, sales and settlements of
investments at the rate of exchange prevailing on the respective dates of such transactions.
(c) Investment Transactions and Income Recognition
Investment transactions are accounted for on the trade date and any realized gains and
losses from such transactions are calculated on an average cost basis. Distributions from
Underlying Funds are recorded on the ex-distribution date and interest income is accrued on
a daily basis.
(d) Net Asset Value Per Unit
Net asset value per unit is calculated at the end of each day on which the Toronto Stock
Exchange is open for business by dividing the net assets of each Fund by its outstanding units.
(e) Use of Estimates
The preparation of financial statements in accordance with Canadian generally accepted
accounting principles requires management to make estimates and assumptions that
affect the reported amounts of assets and liabilities at the reporting date and the reported
amounts of income and expenses during the reporting period. Actual results could differ
from those estimates.
3. INCOME TAXES
The Funds are deemed to be inter-vivos trusts under the provisions of the Income Tax Act
(Canada) and are deemed to have allocated their income to the beneficiaries. Each Fund’s net
capital gains (losses) are deemed to be those of the beneficiaries. Accordingly, the Funds are
not subject to income tax on their net income, including net realized capital gains for the year.
A Fund may elect to realize capital gains (losses) for the previous taxation year, where necessary
to allocate capital gains (losses) to redeeming beneficiaries.
4. MANAGEMENT FEES AND OTHER EXPENSES
Unity Life of Canada charges the Funds an annual management fee. The management fee is
calculated on the net assets of the Funds at the end of each business day and is paid at the
end of each month.
CI Investments Inc. is the Manager of the Funds and the Underlying Funds, and in
consideration of management fees received, provides management services required in the
day-to-day operations of the Funds and the Underlying Funds including the management of the
investment portfolios of the Underlying Funds.
In addition to the management fee payable, the Funds also bear all operating and administrative
expenses including audit and legal fees, registry and transfer agency fees, insurance costs,
custody fees, expenses relating to reporting and making distributions to unitholders, all other
costs and fees imposed by statute or regulation and expenses of all communications with
unitholders.
Management Expense Ratio (MER) information appears in the Supplementary Schedules to the
Financial Statements.
5. UNITS ISSUED AND OUTSTANDING
Unit Transactions information appears in the Supplementary Schedules to the Financial
Statements.
Notes to the Financial Statements - CI Segregated Funds

2005 Annual Report as at December 31, 2005 – 26 –
MANAGEMENT’S RESPONSIBILITY
FOR FINANCIAL REPORTING
The accompanying financial statements have been prepared by management of the Funds, and
approved by the Board of Directors of Unity Life of Canada. Management is responsible for the
information and representations contained in these financial statements and other sections of
the Annual Report.
CI Investments Inc. maintains appropriate processes to ensure that relevant and reliable
financial information is produced. The financial statements have been prepared in accordance
with accounting principles generally accepted in Canada and include certain amounts that are
based on estimates and judgments. The significant accounting policies which management
believes are appropriate for the Funds are described in Note 2 to the financial statements.
PricewaterhouseCoopers LLP are the external auditors of the Funds, appointed by Unity Life of
Canada. They have audited the financial statements in accordance with Canadian generally
accepted auditing standards to enable them to express to the unitholders their opinion on the
financial statements. Their report is set out at the right.
Chief Financial Officer
UNITY LIFE OF CANADA
Chief Executive Officer
UNITY LIFE OF CANADA
AUDITORS’ REPORT
To the Board of Directors of Unity Life of Canada and to the unitholders of the CI Segregated
Funds listed in Note 1 to the financial statements (the “Funds”)
We have audited the Statement of Investment Portfolio of each of the Funds as at
December 31, 2005, the Statements of Net Assets of each of the Funds as at December 31, 2005
and 2004 and the Statements of Operations and Changes in Net Assets for the years ended
December 31, 2005 and 2004. These financial statements are the responsibility of the Funds'
management. Our responsibility is to express an opinion on these financial statements based on
our audits.
We conducted our audits in accordance with Canadian generally accepted auditing standards.
Those standards require that we plan and perform an audit to obtain reasonable assurance
whether the financial statements are free of material misstatement. An audit includes examining,
on a test basis, evidence supporting the amounts and disclosures in the financial statements.
An audit also includes assessing the accounting principles used and significant estimates
made by management, as well as evaluating the overall financial statement presentation.
In our opinion, these financial statements present fairly, in all material respects, the financial
position of each of the Funds as at December 31, 2005 and 2004 and the results of each of their
operations and the changes in each of their net assets for the years ended December 31, 2005
and 2004 in accordance with generally accepted accounting principles.
Chartered Accountants
PRICEWATERHOUSECOOPERS LLP
Toronto, Ontario
February 24, 2006
Management and Audit Reports - CI Segregated Funds
NOTICE: Should you require additional copies of this Annual Report or have received more than one copy, please contact CI Investments Inc. or your financial adviser.
Unity Life of Canada has entered into an agreement with CI Investments Inc. pursuant to which CI is responsible for certain marketing and administrative services in relation to the CI Segregated Funds. Unity Lifeof Canada established the individual variable annuity contract providing for investment in the CI Segregated Funds. A complete description of the key features of the individual variable annuity contract is containedin the CI Segregated Funds Information Folder. SUBJECT TO THE APPLICABLE DEATH AND MATURITY GUARANTEES, ANY PART OF THE PREMIUM OR OTHER AMOUNT THAT IS ALLOCATED TO ACI SEGREGATED FUND IS INVESTED AT THE RISK OF THE CONTRACTHOLDER AND MAY INCREASE OR DECREASE IN VALUE ACCORDING TO THE FLUCTUATIONS IN THE MARKET VALUE OFTHE ASSETS OF THE RELEVANT CI SEGREGATED FUND.
TMCI Investments and the CI Investments design are trademarks of CI Investments Inc.

– 27 –
Notes
2005 Annual Report as at December 31, 2005

– 28 –
Notes
2005 Annual Report as at December 31, 2005

CISE
GAN
N_0
4/06
E
Head Office2 Queen Street East, Twentieth FloorToronto, Ontario M5C 3G7Tel: 416-364-1145Toll Free: 1-800-268-9374English Client Services Team: 1-800-563-5181French Client Services Team: 1-800-668-3528
Sales OfficesCalgary Tel: 403-205-4396 Toll Free: 1-800-776-9027Halifax Tel: 902-422-2444 Toll Free: 1-888-246-8887Montreal Tel: 514-875-0090 Toll Free: 1-800-268-1602Vancouver Tel: 604-681-3346 Toll Free: 1-800-665-6994CI Teleservice: 1-800-275-3672 Automated account informationE-mail: [email protected] • www.ci.com