ci-st-06-0234 civil aerospace in 21st century-covers
TRANSCRIPT

Civil aerospace in the 21st century
Business as usual… or a fresh start?

page 1
WelcomeThis is the second paper in our Aerospace and Defence series. In 2005, we stimulated a debate with our clients in pub-lishing our thoughts on the future of the Defence industry. The reaction was overwhelmingly enthusiastic and the major issues that we identified have certainly become more widely discussed. Some – those addressing transatlantic co-op-eration, for example – have been front page news. And the British Ministry of Defence is, at the start of 2006, developing a formal statement of Defence Industrial Strategy. This will provide guidance on how some of the issues might now be addressed from a national government perspective. The implications will extend beyond the British Isles.
In this paper, we look at Civil Aerospace and set out five issues for contractors. These could be interpreted as a template for value creation in the industry. An industry that has grown consistently since the 1920s but that has, as a whole, found value elusive. We discuss the evolution of civil aerospace since those pioneering early days, the trauma of events at the end of the 20th century and the factors that will shape the future.
Shifts in the current market environment suggest that the future will in fact be very different. This is reflected in our five issues for contractors. And since the investor community has already taken account of the current boom in deliveries and record new aircraft order levels, managing these issues will be critical in creating value. We look forward to debating them with you. And, as ever, to developing ideas and solutions with you… not just helping you implement what you have already decided to do.
Richard Hooke Global Aerospace and Defence Leader PricewaterhouseCoopers January 2006
For more information about the services offered by PricewaterhouseCoopers’ Global Aerospace and Defence practice, please visit our website at www.pwc.com/aerospaceanddefence or contact one of the regional professionals listed at the back of this report.
Contents
Overview 3Over 50 years of flight 5In search of open skies 9From props to jets 13Show me the money 1721st century turbulence 21 A fresh start 25 1 Asia-Pacific growth: strings attached 26 2 New customers - different needs 28 3 Regional jets: coming of age? 29 4 The polluter pays: how much? 31Implications for contractors 35 1 Managing a diverse customer base 36 2 Investing in a changing mix of capabilities 37 3 Managing supplier risk throughout the lifecycle 38 4 Achieving best value in manufacturing 39 5 Managing a transnational organisation 40
A fresh start. And a fresh perspective on value? 43Glossary 45Contacts 48
page 2 page 3
Air travel is an integral part of life in the 21st century. More people fly now than ever before and the industry has evolved such that the principles of competition have been applied to most of the services associated with flying. And the industry is attracting new entrants in various segments. From low cost airlines to low cost manufacturers. Yet there are increasing concerns about the environmental implications of air travel, the level of government intervention in the industry, its security and safety. And the financial wellbeing of an industry in which the world’s airlines reported aggregate losses of a massive $30 billion in 2001 and 2002.
So, following five years of trauma – from SARS to international terrorism and from soaring oil prices to conflict in the Middle East – we believe it timely to ask whether the civil aerospace industry is now, as many believe, simply returning to normal. Or is it, in fact, undergoing what we may regard in future as a fundamental, lasting change?
This paper reviews the three major factors that have shaped today’s industry since the pioneering days of the 1920s – the continuing growth of the world economy; the modernisation of the industry’s regulatory framework and the development of the airframe, engine and equipment supplier base. And yet,
although it has unarguably galvanised trade and economic growth, the air transport industry itself has consistently failed to create lasting value.
As this paper goes to press, the financial community perceives civil aerospace as a booming market. But, in our view, this is no reason for management teams to relax. On page 25, we identify four factors that promise significant change in future:
• Demand in the Asia-Pacific region will overtake the USA in leading the continuing growth in air travel
• New owners and operators are changing the way the market buys and uses civil aircraft
• The Regional Jet market is emerging as a clearly defined, robust segment
• Increasingly stringent environmental policies will affect the cost and nature of air travel.
These offer brand new challenges for management.
Now, with a number of new aircraft programmes coming through in the next decade, with major airlines facing painful cost surgery or bankruptcy as new, low cost airlines become established, and with the continuing development of traffic and industrial capacity in the Far East, more structural change appears
Overview
inevitable. So, whilst manufacturers may well be leaner, more resilient and more efficient, fresh challenges clearly lie ahead. And we believe that these require action from manufacturers in five areas:
1. Managing a diverse customer base
2. Investing in a changing mix of capabilities
3. Managing supplier risk throughout the lifecycle
4. Achieving best value in manufacturing
5. Managing a transnational organisation
The response to these issues will change the way this industry operates.
So, whilst industry commentators forecast the resumption of growth and hint at a return to business as usual, we think that we will in fact see something quite different.
A fresh start.
page 4 page 5Over 50 years of flight
Economic activity is the main driver of air traffic demand. And economic activity has grown consistently right around the world for the last 40 years. The link between economic activity and air travel is well understood by all those involved or associated with the air transport industry. Including governments.
Air transport has a fundamental influence on international trade, not only as a traded service in its own right but also as a means by which numerous goods and services are themselves traded. Studies have repeatedly demonstrated its impact on world trade, particularly in developing countries. It has been estimated that the economic impact of air transportation will reach $1.8 trillion per year by 2010, generating over 31 million jobs around the world.
Small wonder, then, that governments around the world have a long tradition of intervention in air transport – its infrastructure, its services, its service providers, its aircraft, engines and equipment and its manufacturing industry. Again, a wide range of government studies have addressed this area and we will look at the implications of changes in the regulatory environment later in this paper.
Essentially, however, regulation of the industry in its early years was, from the 1920s, primarily focused on providing acceptable levels of safety and service. And the system adopted in the USA was replicated in most parts of the world, whereby routes, prices and conditions for entry into the business were subjected to various controls. The outcome was an air transport network that featured a number of overlapping, direct flights between major cities, stopping off at smaller cities en route. As the industry enjoyed the growth in demand for air transport fuelled by economic progress, its priorities, and those of its regulators, remained safety and service.
Attention to efficiency, competitiveness and value would come later.
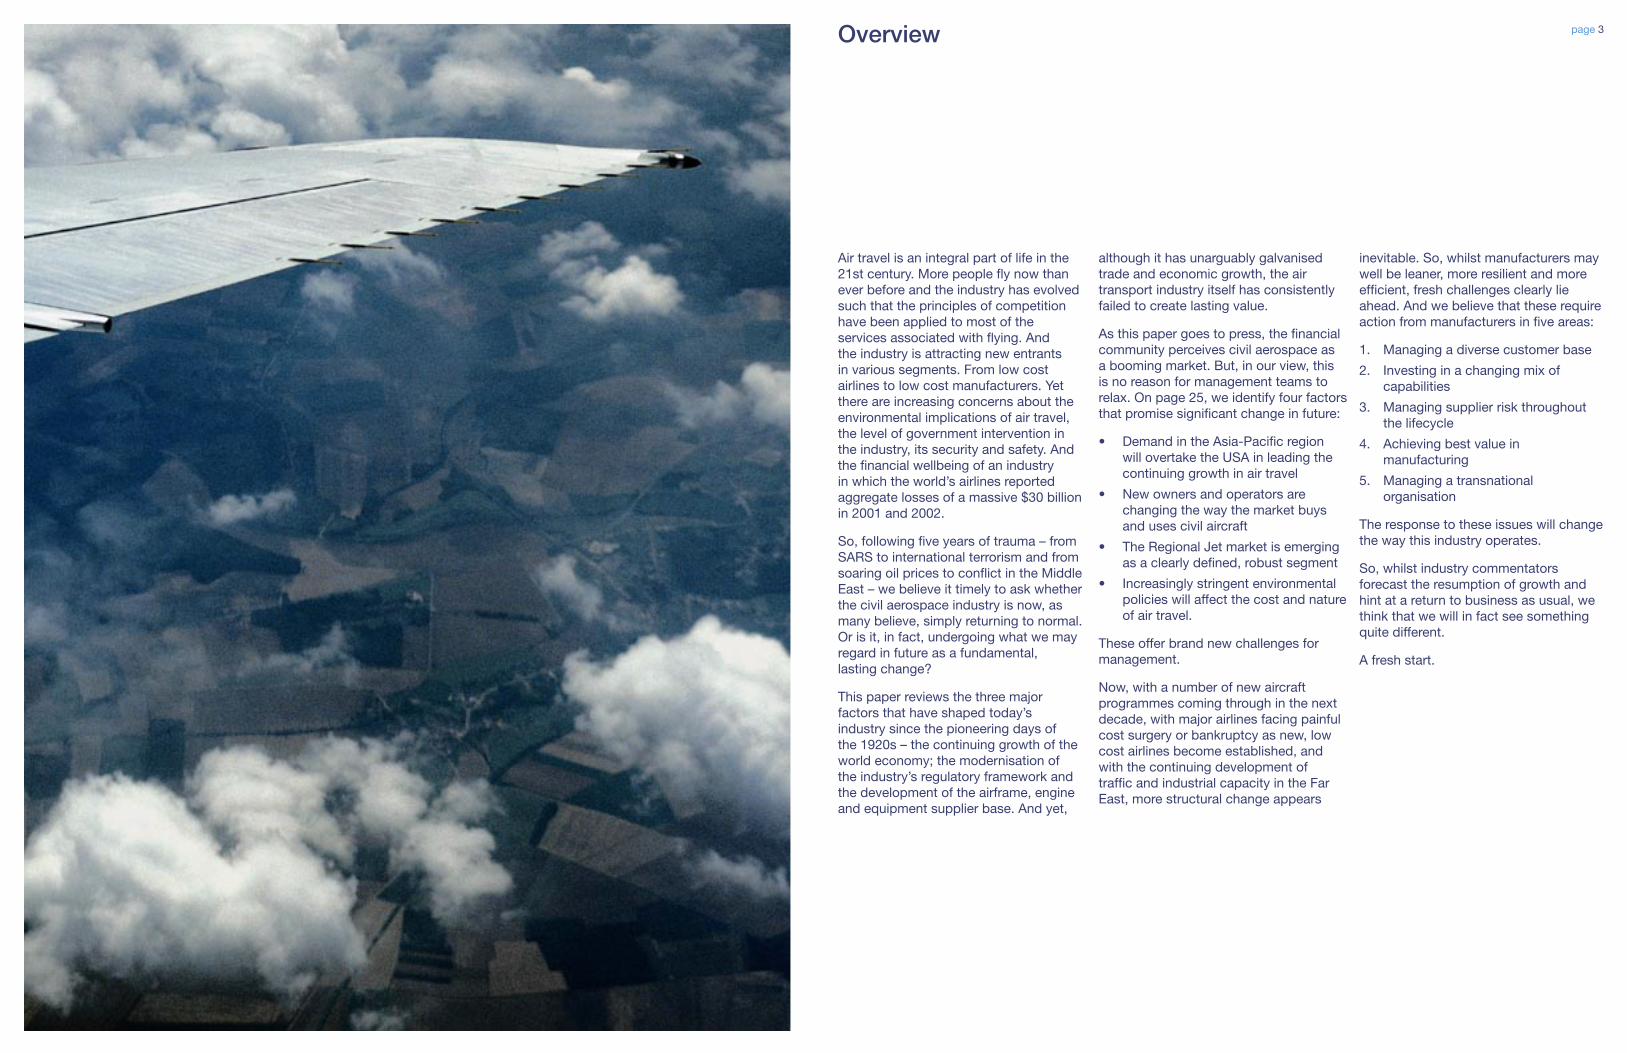
From 1970, worldwide Gross Domestic Product (“GDP”) has increased by an average of 2.9% per annum. Airbus calculates that this has generated an annual increase in passenger air travel of 4.8% and in cargo of 6.2%. This means that the volume of air travel has grown by 800% in the last 30 years. And, whilst more people and more freight is being transported by air, an increasing portion of this traffic is international. Just over 23% of the 1,138 million passengers carried in 1991 were on international flights. By 2002, nearly 34% of 1,617 million passengers were international. The growth in international freight is even more significant. In 1991, nearly half of 17.5 million tonnes of air cargo was international. This had grown to over 64% of 29.5 million tonnes by 2002.
“Increases in gross domestic product (GDP) explain most of air travel growth. The rest of the development of travel worldwide is derived from economic factors such as international trade and globalization, and industry trends such as declining fares, more direct service, and increased frequencies.”
Boeing Commercial Airplanes: Current Market Outlook 2005

page 6 page 7
Airlines are obviously interested in the number of passengers and the weight of freight to be carried. But they are even more interested in how far such cargo is to be transported. Since this defines their overall revenue opportunity. This is why international traffic is important and why it is now the most significant segment of the market. Whilst the pie is getting bigger – passenger kilometres flown increasing by around 60% and freight-tonne kilometres nearly doubling between 1991 and 2002 – international traffic is the biggest and most appetising slice. (See Figures 1 and 2)
Figure 1: Passenger traffic (scheduled airlines): 1991-2002
1991 2002
46.7% 58.9%
(A passenger-kilometre is the carriage of one passenger for one kilometre)
International Domestic
Figure 2: Freight volumes (scheduled airlines): 1991-2002
1991 2002
79.3% 86.2%
(A freight-tonne kilometre is the carriage of one tonne of freight for one kilometre)
International Domestic
Source: WTO 2005
This boom in international traffic is primarily the result of a number of structural and regulatory changes that took place within the industry throughout the 1990s. There were certainly changes in the mix, size and shape of its main protagonists – the airlines, the airframe manufacturers, the financiers, service providers and so on. But the last decade also saw governments taking notable action to deregulate and liberalise air transport. This reinforced the stimulus already provided by global GDP growth to prompt a surge in demand for international travel.
Unsurprisingly, the mature economies of western Europe and North America fuelled most of the growth in air transport in the 1970s and ‘80s but airlines and aircraft manufacturers are looking to the Asia Pacific region for substantial growth in future.
Three regions now dominate international air travel – North America, Europe and Asia Pacific. Over the last decade, Asia Pacific has experienced the largest growth in international traffic (measured in total tonne-kilometres – the combined total of passengers, freight and mail carried) from 19.5% of the world total in 1991 to 26.7% in 2002. Whilst declining over the same period from 41.2% to 36.8%, North America remains the largest market, with Europe, down from 29.9% to 26.2%, comprising just over a quarter of the total. The rest of the world – the Middle East, Latin America and Africa – accounted for the remaining 10.3% share of the 2002 world total (rising from 9.4% in 1991). If we consider that the market was in recession in 2002, then the underlying growth trend is undoubtedly higher.
page 8 page 9
As we have seen, government interest in regulating the industry was initially focused exclusively on safety and service. But times have changed, the industry has flourished globally and deregulation and liberalisation are now familiar terms.
We should examine these measures in the context of a market that, as we have seen, covers two distinct segments: national or regional traffic and international traffic. The evidence shows that domestic action stimulates regional and international measures. The airline industry has been characterised by nation states seeking to support their own domestic flag carriers and manufacturers whilst simultaneously, since its inception, being a force for economic globalisation. Finally, it is now on the brink of becoming global itself.
The US civil aviation industry was the first to experience the shift from government control to open competition. For over 50 years – the U.S. Department of Commerce from 1926, the Civil Aeronautics Authority from 1938 and the Civil Aeronautics Board (CAB) from 1940 – the state had controlled virtually every aspect of airline economics in the USA, including who entered the market, what routes airlines flew and what fares they charged. The 1978 US Airline Deregulation Act changed all this. The stimulus for change came in part from the removal of controls over intra state air travel by some of the larger US states – Texas and California, for instance – between the late 1960s
In search of open skies
and early 1970s. This initiative – made possible by the fact that the CAB had no jurisdiction over in-state flights – led to the birth of airlines such as Southwest in Texas who worked on the assumption that lower fares would attract new business.
They were right. Passenger demand jumped on the small number of cheaper routes, dispelling one of the main assumptions behind regulation: that demand for air transport is relatively inelastic – that is, relatively insensitive to price changes. Together with the arrival of a new, progressive head of the CAB, pressure from Congress and a whole raft of economic studies on the costs imposed by regulation, this evidence of consumer demand triggered the deregulation of the US air transport market.
The 1978 Act removed controls on market entry, exit and pricing policy, making it easier for new players to enter the market and encouraging competition. The aims were to reduce prices and improve service. But after some early success, the pursuit of these objectives ran into difficulty. Whilst 18 new carriers opened for business in the 1980s, providing a host of new routes at low prices, most did not last to see the next decade. The reasons are instructive.
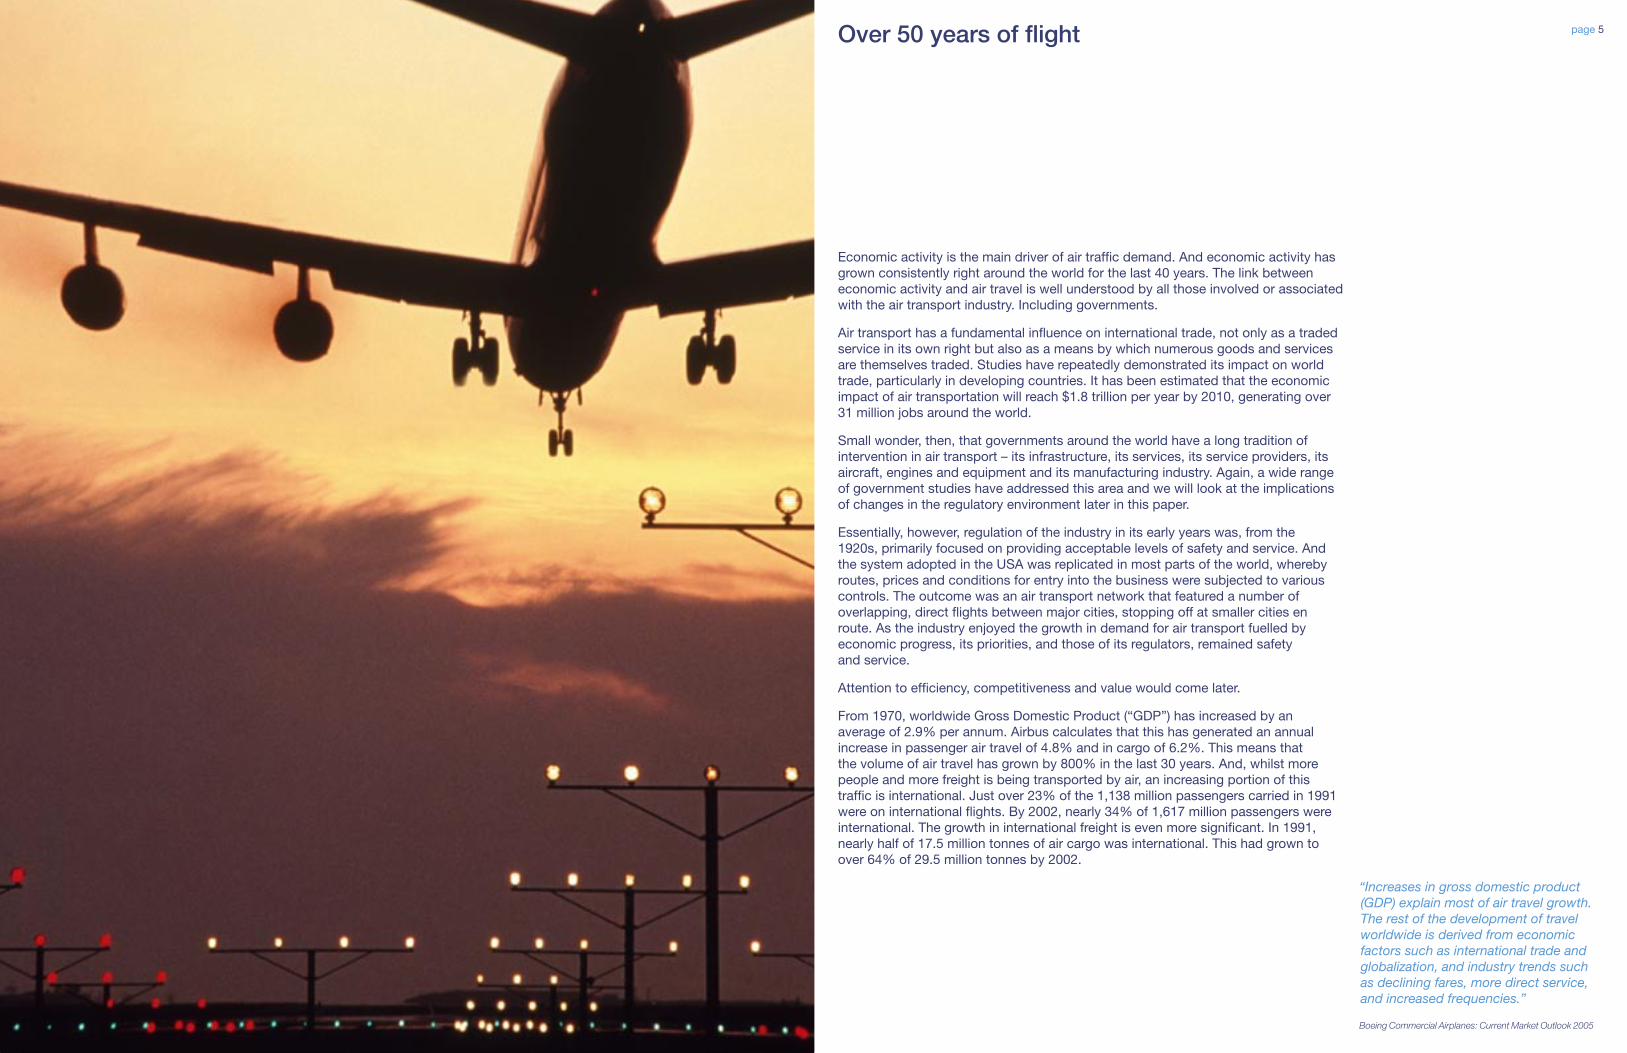
Established, pre-deregulation, airlines acted to head off their new competition by the easiest available means. Instead of competing directly on the terms set by the newcomers – price – they exploited
the strengths of an incumbent. They made their size count. And this created what we now call the “hub and spoke” network. It involved feeding hubs – major cities – with traffic from outlying spoke locations, enabling established carriers to consolidate passengers and freight and to achieve operational cost savings. So flights from spokes to hubs carried both national traffic as well as traffic en route to longer flights between major national hubs and between hubs and international destinations. Smaller local or regional new entrants were thus placed at a disadvantage against seasoned competitors with advantages of size and breadth of operations.
Figure 3: Evolving structure of the aviation market
1940s-1970sPoint-to-Point(City Pair Services)
Regulated Market
1980sHub-and-Spoke
Deregulated Market
Source: “Fettered Flight: Globalization and the Airline Industry”; Yergin, Vietorr, and Evans, 2000
The so-called “majors” also looked for efficiencies. We will look later at how airline cost structures have changed over time but it is clear that, during the period after deregulation, the US majors focused very effectively on revenue-
The European Deregulation Process 1987 - 1997
1987 • limitations on the right of governments to object to fare restrictions • airlines allowed to share seating capacity
1990 • increased flexibility in setting fares and sharing capacity • freedom to transport traffic between EU countries
1993 • additional freedom to provide services within the EU • *airlines from one state able to operate routes wholly within another member state • *any EU airline able to establish operations in any EU state • *all intra-EU routes available to all EU carriers • “fitness” rules harmonised covering safety, financial structure, liquidity, insurance, technical standards,
license duration, monitoring methods
Source: WTO, 2005
page 11
based or “top line” improvements. Their introduction of computerised travel reservation and yield management systems and of loyalty or frequent flyer programmes further stimulated a growth in demand during the 1980s. And growth in international traffic gave rise to an opportunity to increase further revenues through a concentration on the business or premium class passenger. With transatlantic traffic increasing significantly from around 1982, the post-deregulation US majors started to look much more competitive in the international market. For Europe’s carriers – over 100 of them – this complicated the challenge of maintaining transatlantic alliances to provide their passengers with comprehensive access to the USA.
With so many airlines serving an increasingly integrated consumer market, European air transport looked heavy on capacity and light on productivity. And this did not fit well with the imperative for growth stimulated by a wave of privatisations, starting with British Airways in 1982 and followed by Lufthansa and Air France – matched elsewhere by Qantas in Australia, by Air Canada and Japanese Airlines and by the national carriers in Singapore and Malaysia.
Change was ultimately prompted by the European Court in 1985. It took away the freedom of each member state to determine its own aviation policy by giving the European Union the right to rule on air fares. This effectively limited any government’s ability to protect its state-owned flag carrier from competition. The 1992 Single Market initiative gave further impetus to change by relaxing controls on pricing and market entry as the European Union’s deregulation policy evolved within three packages of measures introduced between 1987 and 1997.
Although any EU carrier can now set up and operate on any intra-EU route, one important restriction remains. An EU airline must be owned and controlled by EU member states or nationals. Nevertheless, Europe’s post deregulation experience has largely mirrored that of the US. By 2004, 60 new low cost entrants started up, with growth favouring city to city routes spanning different EU countries over domestic city pairs.
The World Trade Organisation (“WTO”) has singled out Africa as a major region ripe for deregulation but it reports that efforts to stimulate investment and infrastructure modernisation have yielded mixed results. Difficulties therefore remain in harnessing the stimulus to trade and economic growth afforded by air transport, although the US is reported to be taking steps to support increased airline safety in the region and the development of international routes.
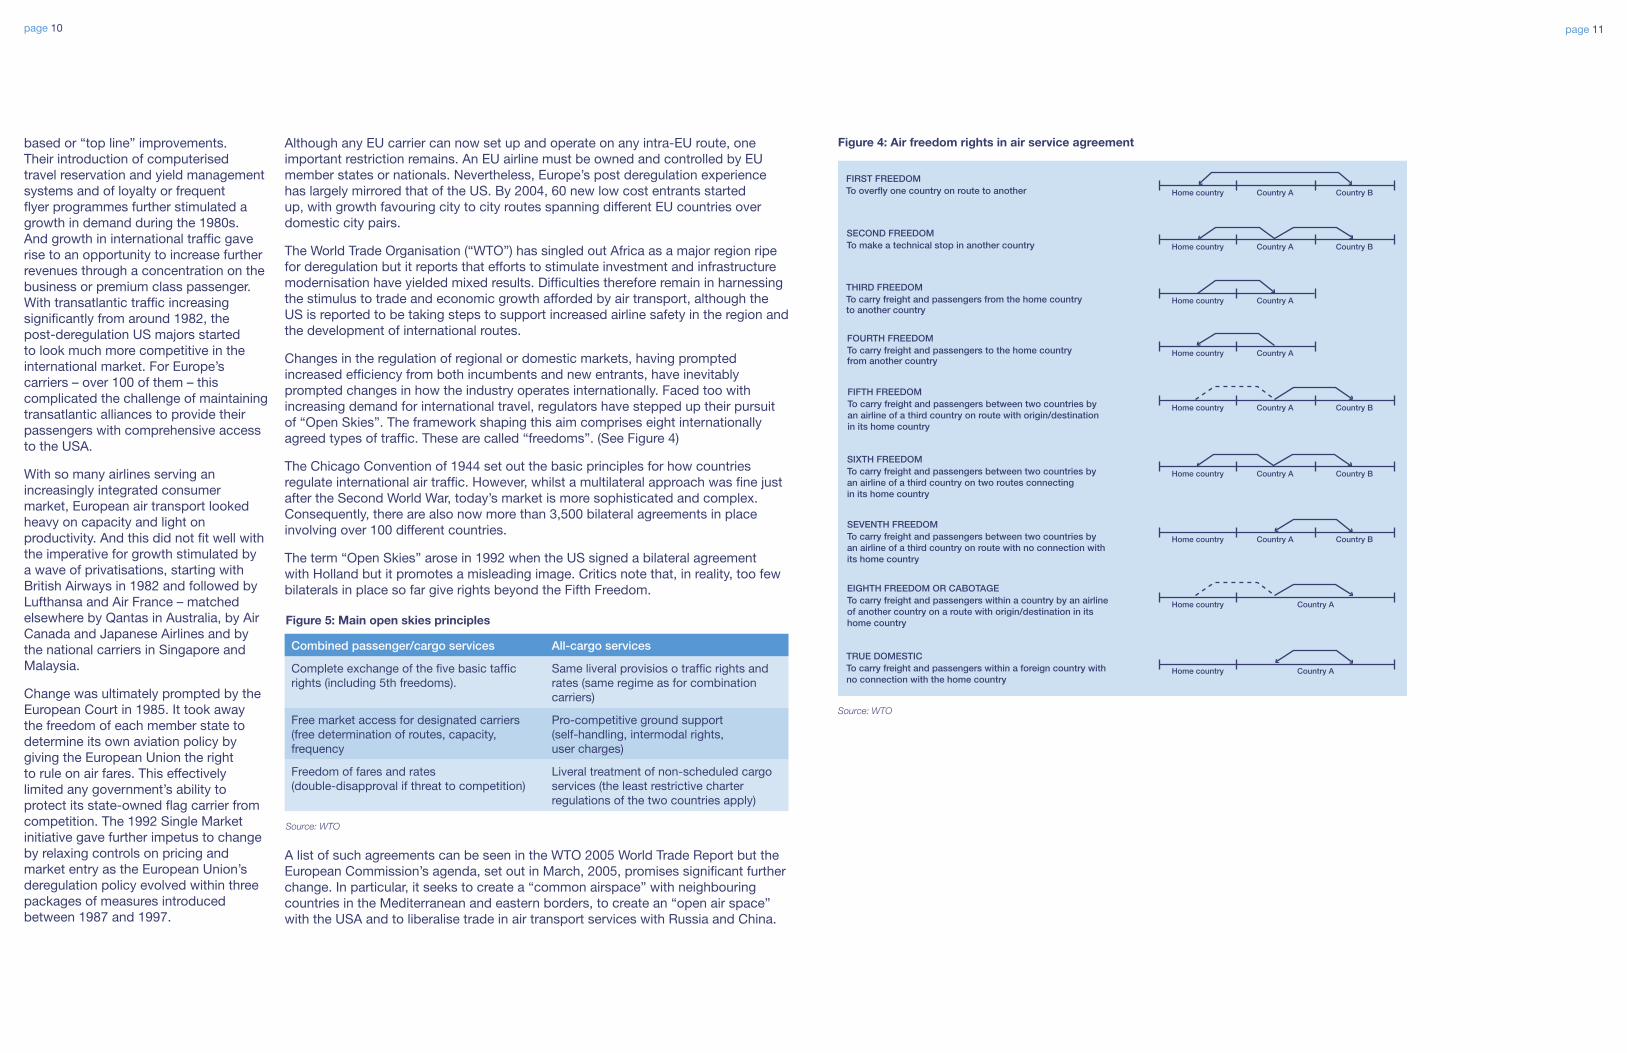
Changes in the regulation of regional or domestic markets, having prompted increased efficiency from both incumbents and new entrants, have inevitably prompted changes in how the industry operates internationally. Faced too with increasing demand for international travel, regulators have stepped up their pursuit of “Open Skies”. The framework shaping this aim comprises eight internationally agreed types of traffic. These are called “freedoms”. (See Figure 4)
The Chicago Convention of 1944 set out the basic principles for how countries regulate international air traffic. However, whilst a multilateral approach was fine just after the Second World War, today’s market is more sophisticated and complex. Consequently, there are also now more than 3,500 bilateral agreements in place involving over 100 different countries.
The term “Open Skies” arose in 1992 when the US signed a bilateral agreement with Holland but it promotes a misleading image. Critics note that, in reality, too few bilaterals in place so far give rights beyond the Fifth Freedom.
Combined passenger/cargo services All-cargo services
Complete exchange of the five basic taffic rights (including 5th freedoms).
Same liveral provisios o traffic rights and rates (same regime as for combination carriers)
Free market access for designated carriers (free determination of routes, capacity, frequency
Pro-competitive ground support (self-handling, intermodal rights, user charges)
Freedom of fares and rates (double-disapproval if threat to competition)
Liveral treatment of non-scheduled cargo services (the least restrictive charter regulations of the two countries apply)
Figure 5: Main open skies principles
Source: WTO
A list of such agreements can be seen in the WTO 2005 World Trade Report but the European Commission’s agenda, set out in March, 2005, promises significant further change. In particular, it seeks to create a “common airspace” with neighbouring countries in the Mediterranean and eastern borders, to create an “open air space” with the USA and to liberalise trade in air transport services with Russia and China.
page 10
Figure 4: Air freedom rights in air service agreement
Home country Country A Country B
Home country Country A Country B
Home country Country A Country B
Home country Country A Country B
Home country Country A Country B
Home country Country A
Home country Country A
Home country Country A
Home country Country A
FIRST FREEDOMTo overfly one country on route to another
SECOND FREEDOMTo make a technical stop in another country
THIRD FREEDOMTo carry freight and passengers from the home countryto another country
FOURTH FREEDOMTo carry freight and passengers to the home countryfrom another country
FIFTH FREEDOMTo carry freight and passengers between two countries byan airline of a third country on route with origin/destinationin its home country
SIXTH FREEDOMTo carry freight and passengers between two countries byan airline of a third country on two routes connectingin its home country
SEVENTH FREEDOMTo carry freight and passengers between two countries byan airline of a third country on route with no connection withits home country
EIGHTH FREEDOM OR CABOTAGETo carry freight and passengers within a country by an airlineof another country on a route with origin/destination in itshome country
TRUE DOMESTICTo carry freight and passengers within a foreign country withno connection with the home country
Source: WTO

page 12 page 13
An increasingly open air transport market has stimulated the demand for aircraft and a fleet of around 21,000 aircraft were being operated by the ICAO’s Contracting States in 2002 – about 40% more than in 1992. 80% (16,700) were jets. Jet aircraft have become the dominant flying machine in the air transport industry over the last 40 to 50 years. (See Figure 6)
Piston-engine aircraft have steadily declined in number and the growth in the number of turboprops has been modest indeed, although this segment rallied in 2004 with ATR and Bombardier recording their best order intake in four years.
The industry has become broadly segmented into two major aircraft types: Large Commercial Aircraft (“LCA”) and Regional Jets (“RJ”). Four manufacturers dominate the world’s output. (See Figure 7)
Nowadays, the large commercial aircraft market, generally described as aircraft with 100 seats or more, is served by just two major companies: Airbus SAS and The Boeing Company. Airbus, a subsidiary of the European Aeronautics Defence and Space Company N.V. (“EADS”), shares roughly half the market with Boeing, a US corporation. These two companies incorporate much of the history and experience developed over nearly one hundred years. From pioneers like William Boeing, Louis Breguet and Claude Dornier to civil aircraft builders like McDonnell, Douglas, De Havilland, Aerospatiale, Messerschmitt, Dornier, Hispano, Matra – and Hawker-Siddeley, the British Aircraft Corporation and their predecessor companies too – and many more. Until the collapse of the former Soviet Union, Russia also produced LCAs, delivering about 40 in 1990. However, production has now virtually stopped.
From props to jets
Regional aircraft Embraer BombardierCumulative orders to November, 2005*
Up to 50 seats ERJ 135; ERJ 145 CRJ 100; CRJ 200; CRJ 440; Dash 8 Q 100**; Dash 8 Q 200**
2,328
Over 50 seats E 170; E 175; E 190; E 195
CRJ 700; CRJ 900; Dash 8 Q 300**; Dash 8 Q 400**
1,180
Large commercial aircraft Airbus Boeing
Single aisle
100 seats A 318 B 717 *** 239
100 – 200 seats A 319; A 320; A 321
B 737 9,820
Twin aisle
200-300 Seats A 300; A 310; A 330
B 767; B 787 2,727
300-400 Seats A 340 B 777 1,213
Over 400 Seats A 380 B 747 1,577
Figure 7: Segmentation of the civil aircraft fleet 2005
* Embraer to September 2005 ** turboprops *** Boeing will cease production of 717 in 2006 Source: Airbus, Boeing, Bombardier, Embraer
Figure 6: Worldwide commercial aircraft fleet composition 1960-2002
0
2
4
6
8
10
12
14
16
18
20
Num
ber
ofai
rcra
ft(th
ousa
nds)
1960
1962
1964
1966
1968
1970
1972
1974
1976
1978
1980
1982
1984
1986
1988
1990
1992
1994
1996
1998
2000
2002
Jets
Turboprop
Piston
Note: from 2001, turboprop aircraft made in China and the Russian Federation are included Source: ICAO, BACK Aviation Associates
page 14 page 15
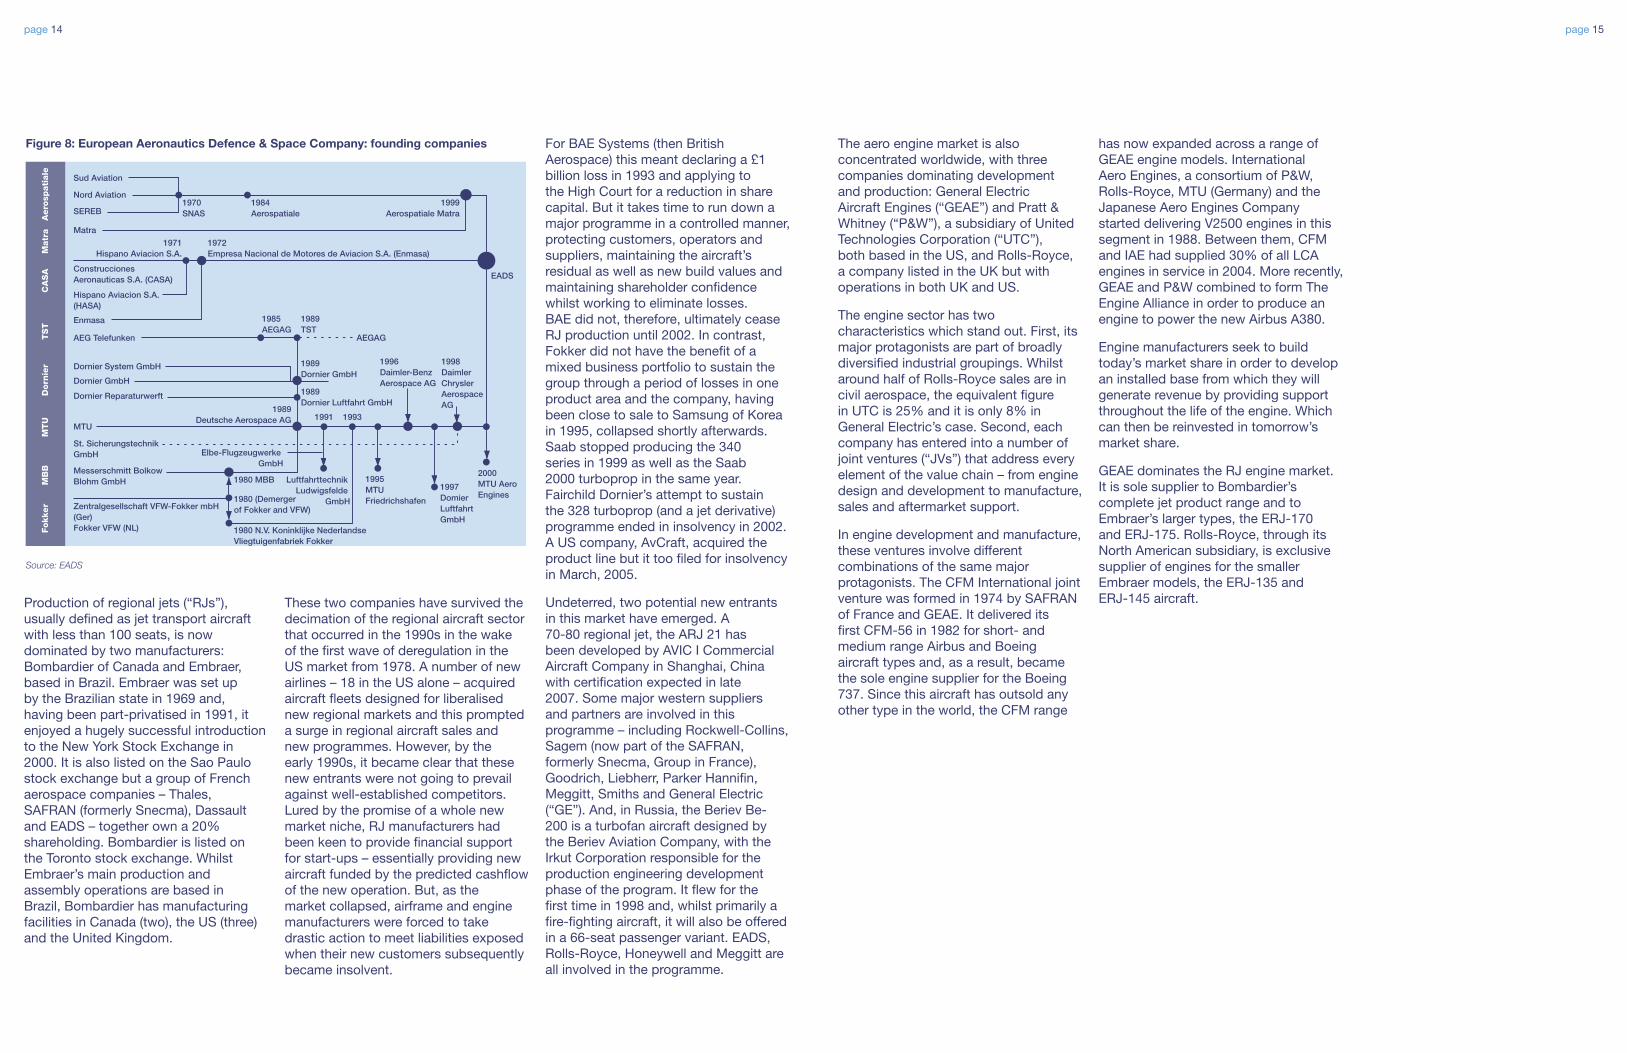
Production of regional jets (“RJs”), usually defined as jet transport aircraft with less than 100 seats, is now dominated by two manufacturers: Bombardier of Canada and Embraer, based in Brazil. Embraer was set up by the Brazilian state in 1969 and, having been part-privatised in 1991, it enjoyed a hugely successful introduction to the New York Stock Exchange in 2000. It is also listed on the Sao Paulo stock exchange but a group of French aerospace companies – Thales, SAFRAN (formerly Snecma), Dassault and EADS – together own a 20% shareholding. Bombardier is listed on the Toronto stock exchange. Whilst Embraer’s main production and assembly operations are based in Brazil, Bombardier has manufacturing facilities in Canada (two), the US (three) and the United Kingdom.
These two companies have survived the decimation of the regional aircraft sector that occurred in the 1990s in the wake of the first wave of deregulation in the US market from 1978. A number of new airlines – 18 in the US alone – acquired aircraft fleets designed for liberalised new regional markets and this prompted a surge in regional aircraft sales and new programmes. However, by the early 1990s, it became clear that these new entrants were not going to prevail against well-established competitors. Lured by the promise of a whole new market niche, RJ manufacturers had been keen to provide financial support for start-ups – essentially providing new aircraft funded by the predicted cashflow of the new operation. But, as the market collapsed, airframe and engine manufacturers were forced to take drastic action to meet liabilities exposed when their new customers subsequently became insolvent.
For BAE Systems (then British Aerospace) this meant declaring a £1 billion loss in 1993 and applying to the High Court for a reduction in share capital. But it takes time to run down a major programme in a controlled manner, protecting customers, operators and suppliers, maintaining the aircraft’s residual as well as new build values and maintaining shareholder confidence whilst working to eliminate losses. BAE did not, therefore, ultimately cease RJ production until 2002. In contrast, Fokker did not have the benefit of a mixed business portfolio to sustain the group through a period of losses in one product area and the company, having been close to sale to Samsung of Korea in 1995, collapsed shortly afterwards. Saab stopped producing the 340 series in 1999 as well as the Saab 2000 turboprop in the same year. Fairchild Dornier’s attempt to sustain the 328 turboprop (and a jet derivative) programme ended in insolvency in 2002. A US company, AvCraft, acquired the product line but it too filed for insolvency in March, 2005.
Undeterred, two potential new entrants in this market have emerged. A 70-80 regional jet, the ARJ 21 has been developed by AVIC I Commercial Aircraft Company in Shanghai, China with certification expected in late 2007. Some major western suppliers and partners are involved in this programme – including Rockwell-Collins, Sagem (now part of the SAFRAN, formerly Snecma, Group in France), Goodrich, Liebherr, Parker Hannifin, Meggitt, Smiths and General Electric (“GE”). And, in Russia, the Beriev Be-200 is a turbofan aircraft designed by the Beriev Aviation Company, with the Irkut Corporation responsible for the production engineering development phase of the program. It flew for the first time in 1998 and, whilst primarily a fire-fighting aircraft, it will also be offered in a 66-seat passenger variant. EADS, Rolls-Royce, Honeywell and Meggitt are all involved in the programme.
The aero engine market is also concentrated worldwide, with three companies dominating development and production: General Electric Aircraft Engines (“GEAE”) and Pratt & Whitney (“P&W”), a subsidiary of United Technologies Corporation (“UTC”), both based in the US, and Rolls-Royce, a company listed in the UK but with operations in both UK and US.
The engine sector has two characteristics which stand out. First, its major protagonists are part of broadly diversified industrial groupings. Whilst around half of Rolls-Royce sales are in civil aerospace, the equivalent figure in UTC is 25% and it is only 8% in General Electric’s case. Second, each company has entered into a number of joint ventures (“JVs”) that address every element of the value chain – from engine design and development to manufacture, sales and aftermarket support.
In engine development and manufacture, these ventures involve different combinations of the same major protagonists. The CFM International joint venture was formed in 1974 by SAFRAN of France and GEAE. It delivered its first CFM-56 in 1982 for short- and medium range Airbus and Boeing aircraft types and, as a result, became the sole engine supplier for the Boeing 737. Since this aircraft has outsold any other type in the world, the CFM range
has now expanded across a range of GEAE engine models. International Aero Engines, a consortium of P&W, Rolls-Royce, MTU (Germany) and the Japanese Aero Engines Company started delivering V2500 engines in this segment in 1988. Between them, CFM and IAE had supplied 30% of all LCA engines in service in 2004. More recently, GEAE and P&W combined to form The Engine Alliance in order to produce an engine to power the new Airbus A380.
Engine manufacturers seek to build today’s market share in order to develop an installed base from which they will generate revenue by providing support throughout the life of the engine. Which can then be reinvested in tomorrow’s market share.
GEAE dominates the RJ engine market. It is sole supplier to Bombardier’s complete jet product range and to Embraer’s larger types, the ERJ-170 and ERJ-175. Rolls-Royce, through its North American subsidiary, is exclusive supplier of engines for the smaller Embraer models, the ERJ-135 and ERJ-145 aircraft.
Figure 8: European Aeronautics Defence & Space Company: founding companies
1970SNAS
EADS
AEGAG
SEREB
Matra
ConstruccionesAeronauticas S.A. (CASA)
Hispano Aviacion S.A.(HASA)
Enmasa
AEG Telefunken
Dornier System GmbH
Dornier GmbH
Dornier Reparaturwerft
MTU
St. SicherungstechnikGmbH Elbe-Flugzeugwerke
GmbH
LuftfahrttechnikLudwigsfelde
GmbH
Messerschmitt BolkowBlohm GmbH
Zentralgesellschaft VFW-Fokker mbH(Ger)Fokker VFW (NL)
Sud Aviation
Fokker
MB
BM
TU
Dorn
ier
TS
TC
AS
AM
atr
aA
ero
spati
ale
Nord Aviation1984Aerospatiale
1971Hispano Aviacion S.A.
1972Empresa Nacional de Motores de Aviacion S.A. (Enmasa)
1999Aerospatiale Matra
1985AEGAG
1989TST
1989Dornier GmbH
1989Dornier Luftfahrt GmbH
1998DaimlerChryslerAerospaceAG
1996Daimler-BenzAerospace AG
1997DomierLuftfahrtGmbH
1995MTUFriedrichshafen
2000MTU AeroEngines
1989Deutsche Aerospace AG
1980 MBB
1980 (Demergerof Fokker and VFW)
1980 N.V. Koninklijke NederlandseVliegtuigenfabriek Fokker
19931991
Source: EADS
page 16 page 17
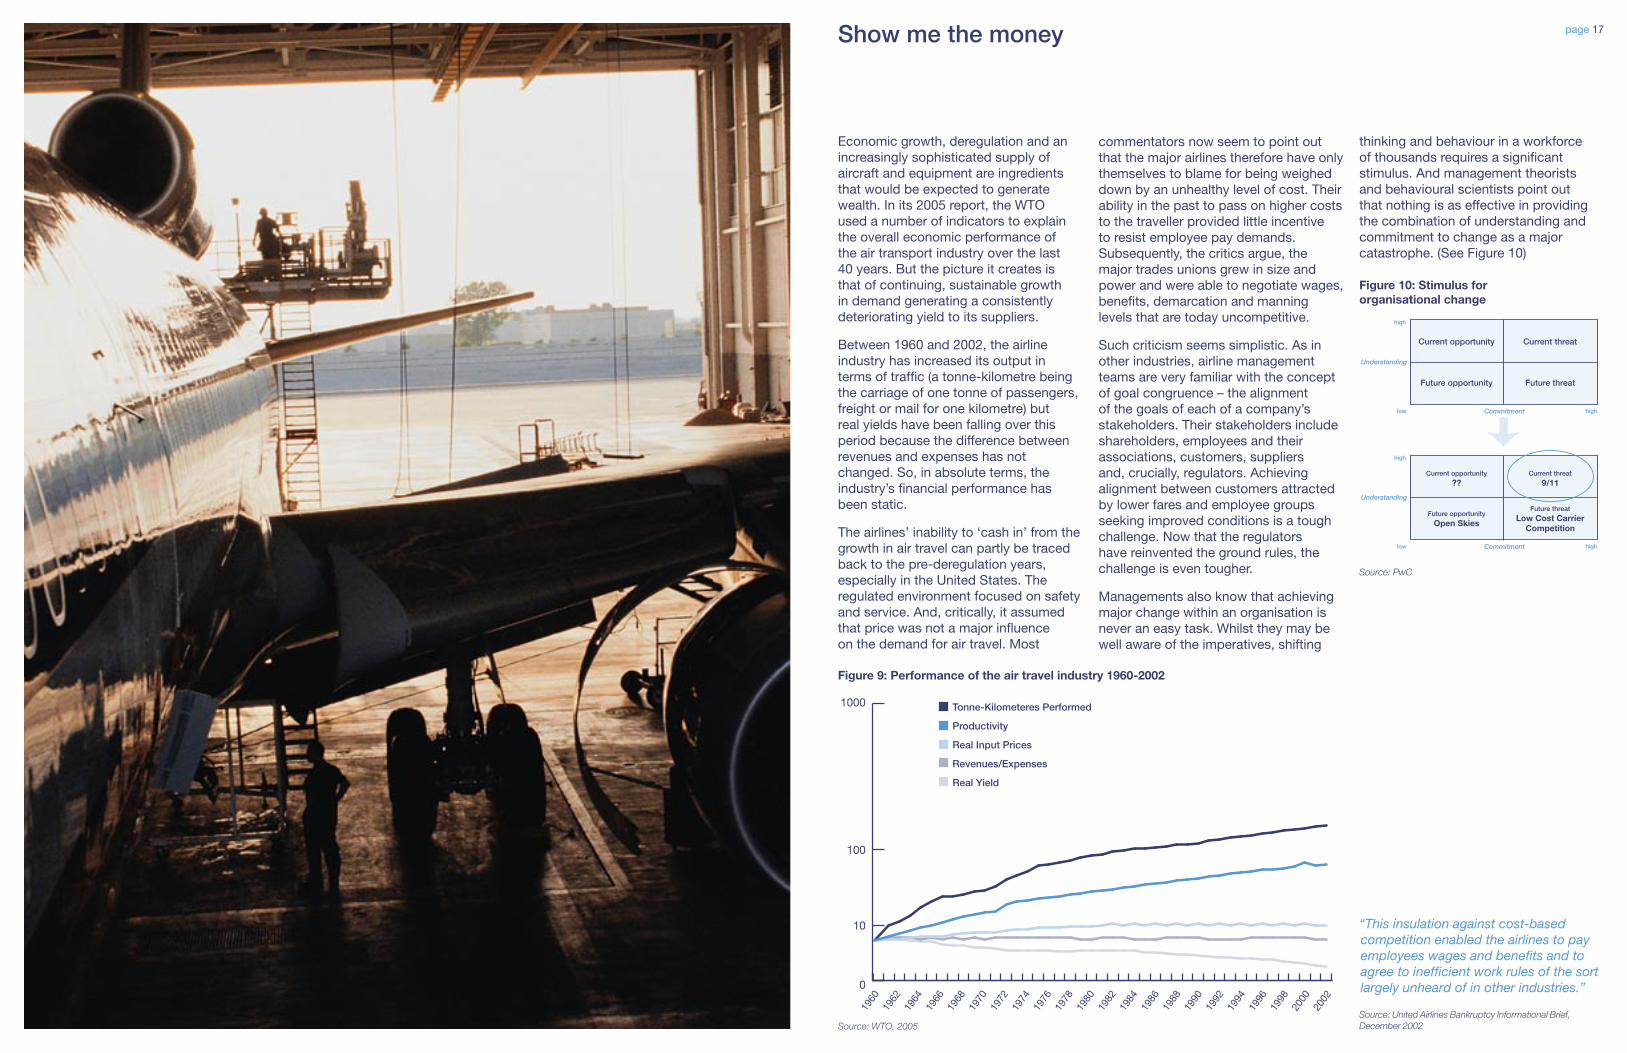
Economic growth, deregulation and an increasingly sophisticated supply of aircraft and equipment are ingredients that would be expected to generate wealth. In its 2005 report, the WTO used a number of indicators to explain the overall economic performance of the air transport industry over the last 40 years. But the picture it creates is that of continuing, sustainable growth in demand generating a consistently deteriorating yield to its suppliers.
Between 1960 and 2002, the airline industry has increased its output in terms of traffic (a tonne-kilometre being the carriage of one tonne of passengers, freight or mail for one kilometre) but real yields have been falling over this period because the difference between revenues and expenses has not changed. So, in absolute terms, the industry’s financial performance has been static.
The airlines’ inability to ‘cash in’ from the growth in air travel can partly be traced back to the pre-deregulation years, especially in the United States. The regulated environment focused on safety and service. And, critically, it assumed that price was not a major influence on the demand for air travel. Most
Show me the money
“This insulation against cost-based competition enabled the airlines to pay employees wages and benefits and to agree to inefficient work rules of the sort largely unheard of in other industries.”
Source: United Airlines Bankruptcy Informational Brief, December 2002
commentators now seem to point out that the major airlines therefore have only themselves to blame for being weighed down by an unhealthy level of cost. Their ability in the past to pass on higher costs to the traveller provided little incentive to resist employee pay demands. Subsequently, the critics argue, the major trades unions grew in size and power and were able to negotiate wages, benefits, demarcation and manning levels that are today uncompetitive.
Such criticism seems simplistic. As in other industries, airline management teams are very familiar with the concept of goal congruence – the alignment of the goals of each of a company’s stakeholders. Their stakeholders include shareholders, employees and their associations, customers, suppliers and, crucially, regulators. Achieving alignment between customers attracted by lower fares and employee groups seeking improved conditions is a tough challenge. Now that the regulators have reinvented the ground rules, the challenge is even tougher.
Managements also know that achieving major change within an organisation is never an easy task. Whilst they may be well aware of the imperatives, shifting
Figure 9: Performance of the air travel industry 1960-2002
0
10
100
1000
1960
1962
1964
1966
1968
1970
1972
1974
1976
1978
1980
1982
1984
1986
1988
1990
1992
1994
1996
1998
2000
2002
Tonne-Kilometeres Performed
Productivity
Real Input Prices
Revenues/Expenses
Real Yield
Source: WTO, 2005
thinking and behaviour in a workforce of thousands requires a significant stimulus. And management theorists and behavioural scientists point out that nothing is as effective in providing the combination of understanding and commitment to change as a major catastrophe. (See Figure 10)
Figure 10: Stimulus for organisational change
Current opportunity Current threat
Future opportunity Future threat
high
low high
Understanding
Commitment
Current opportunity
??Current threat
9/11
Future opportunity
Open Skies
Future threat
Low Cost CarrierCompetition
high
low high
Understanding
Commitment
Source: PwC
page 18 page 19
It is clear that the era of deregulation stimulated competition and encouraged new entrants but it did not serve as a catalyst for immediate major change among the established players. Whilst management teams looked at their costs and reached for the red pencil, their employee groups sought to protect what they had. And, during a period after deregulation of new, intense competition, who would risk a strike?
It needed a major, current threat to open the way for change. In both the USA and Europe, the horror of 9/11 and the ensuing economic downturn provided just that.
Management teams and employee groups may have considered the latest wave of new entrants as a repeat of the 1980s: a trend that would pass. Not so this time. Together with Southwest, a survivor of the 1980s, the present day Low Cost Carriers (“LCCs”) largely emerged in the early 1990s as global economic growth resumed and European regulations were relaxed. Their strategy is simple: to stimulate demand through low fares. The established carriers, set up within a regulatory regime that did not recognise price as decisive in shaping demand, generally targeted high yielding passengers to cover their high operating costs. But the post 2001 market, with a scramble for passengers as traffic fell, drove down fares and enabled a number of LCCs to become established.
The established carriers suffered most from the fall off in business travel in the post 2001 economic environment. This customer class either reduced air travel or sought cheaper flights. The impact of this on revenues was highlighted in the United Airlines bankruptcy brief which noted a fall in premium passenger revenue from 41% to 20% of domestic revenue in 1999 and 2002 respectively. Subsequently the operating performance at many of the established carriers suffered leading to a period of restructuring. For some airlines however this has not been sufficient to stave off bankruptcy, whilst others have been forced to merge.
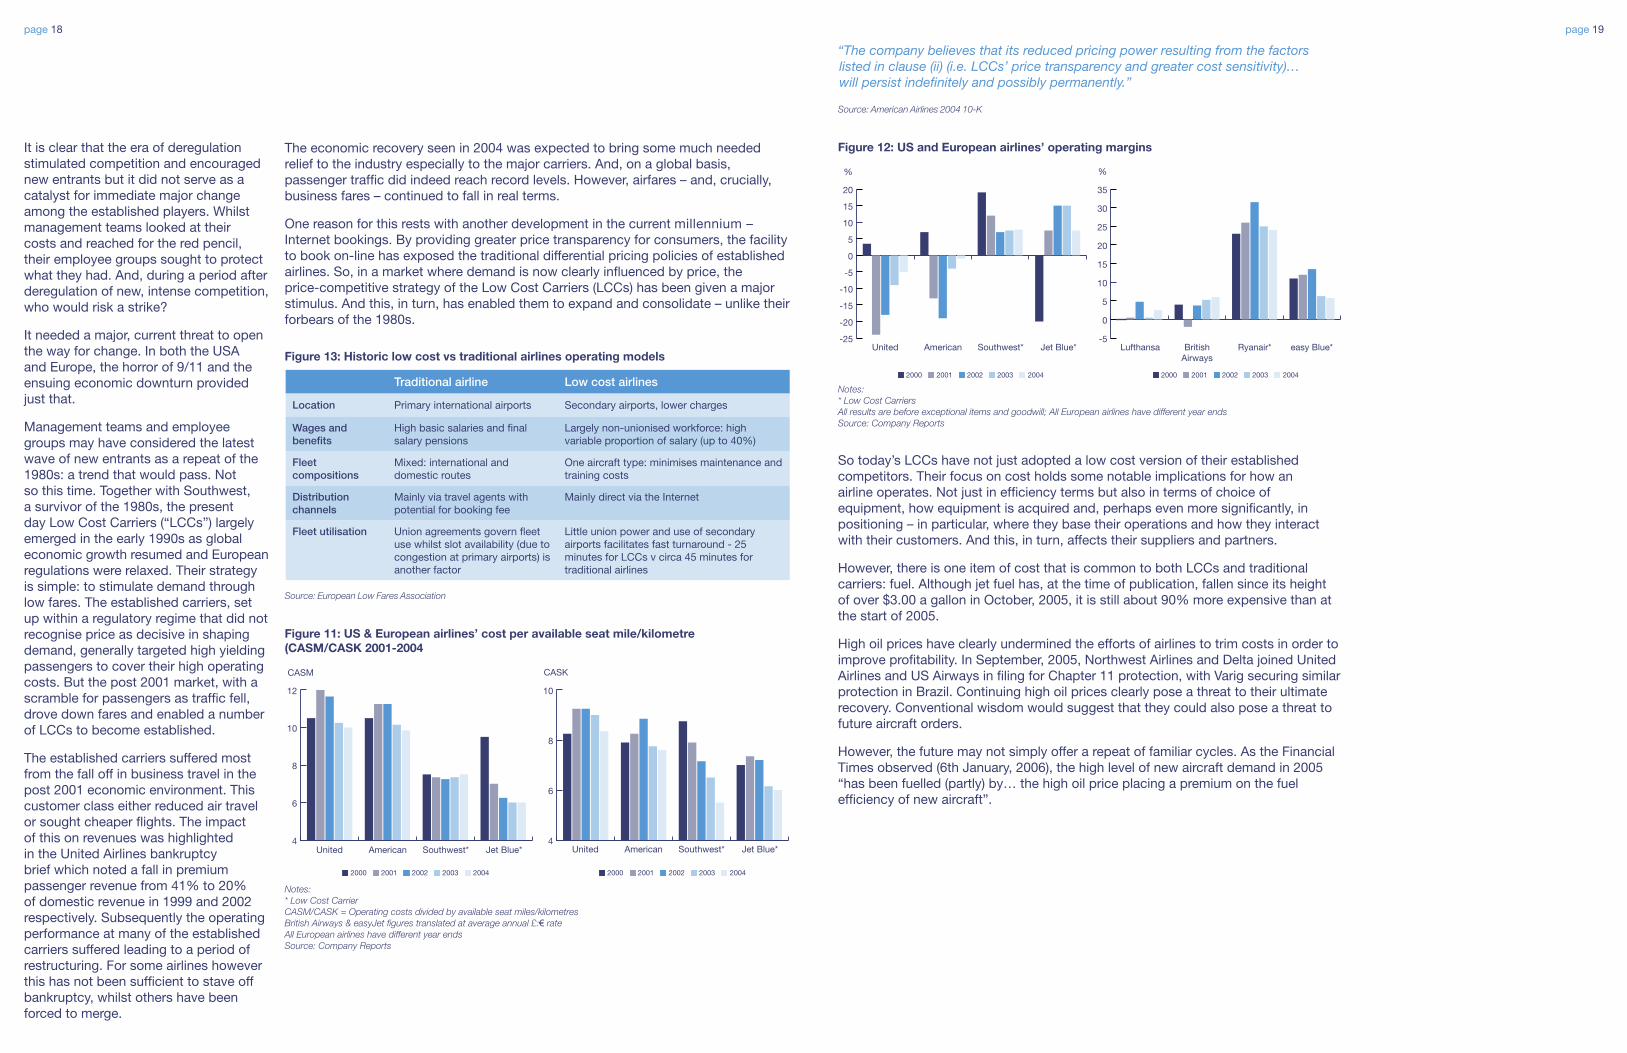
The economic recovery seen in 2004 was expected to bring some much needed relief to the industry especially to the major carriers. And, on a global basis, passenger traffic did indeed reach record levels. However, airfares – and, crucially, business fares – continued to fall in real terms.
One reason for this rests with another development in the current millennium – Internet bookings. By providing greater price transparency for consumers, the facility to book on-line has exposed the traditional differential pricing policies of established airlines. So, in a market where demand is now clearly influenced by price, the price-competitive strategy of the Low Cost Carriers (LCCs) has been given a major stimulus. And this, in turn, has enabled them to expand and consolidate – unlike their forbears of the 1980s.
Traditional airline Low cost airlines
Location Primary international airports Secondary airports, lower charges
Wages and benefits
High basic salaries and final salary pensions
Largely non-unionised workforce: high variable proportion of salary (up to 40%)
Fleet compositions
Mixed: international and domestic routes
One aircraft type: minimises maintenance and training costs
Distribution channels
Mainly via travel agents with potential for booking fee
Mainly direct via the Internet
Fleet utilisation Union agreements govern fleet use whilst slot availability (due to congestion at primary airports) is another factor
Little union power and use of secondary airports facilitates fast turnaround - 25 minutes for LCCs v circa 45 minutes for traditional airlines
Figure 13: Historic low cost vs traditional airlines operating models
Source: European Low Fares Association
So today’s LCCs have not just adopted a low cost version of their established competitors. Their focus on cost holds some notable implications for how an airline operates. Not just in efficiency terms but also in terms of choice of equipment, how equipment is acquired and, perhaps even more significantly, in positioning – in particular, where they base their operations and how they interact with their customers. And this, in turn, affects their suppliers and partners.
However, there is one item of cost that is common to both LCCs and traditional carriers: fuel. Although jet fuel has, at the time of publication, fallen since its height of over $3.00 a gallon in October, 2005, it is still about 90% more expensive than at the start of 2005.
High oil prices have clearly undermined the efforts of airlines to trim costs in order to improve profitability. In September, 2005, Northwest Airlines and Delta joined United Airlines and US Airways in filing for Chapter 11 protection, with Varig securing similar protection in Brazil. Continuing high oil prices clearly pose a threat to their ultimate recovery. Conventional wisdom would suggest that they could also pose a threat to future aircraft orders.
However, the future may not simply offer a repeat of familiar cycles. As the Financial Times observed (6th January, 2006), the high level of new aircraft demand in 2005 “has been fuelled (partly) by… the high oil price placing a premium on the fuel efficiency of new aircraft”.
“The company believes that its reduced pricing power resulting from the factors listed in clause (ii) (i.e. LCCs’ price transparency and greater cost sensitivity)… will persist indefinitely and possibly permanently.”
Source: American Airlines 2004 10-K
Figure 11: US & European airlines’ cost per available seat mile/kilometre (CASM/CASK 2001-2004
4
6
8
10
12
CASM
United American Southwest* Jet Blue*4
6
8
10
CASK
United American Southwest* Jet Blue*
2000 2001 2002 2003 2004 2000 2001 2002 2003 2004
Notes: * Low Cost Carrier CASM/CASK = Operating costs divided by available seat miles/kilometres British Airways & easyJet figures translated at average annual £:€ rate All European airlines have different year ends Source: Company Reports
Figure 12: US and European airlines’ operating margins
-25
-20
-15
-10
-5
0
5
10
15
20
%
United American Southwest* Jet Blue*-5
0
5
10
15
20
25
30
35
%
Lufthansa BritishAirways
Ryanair* easy Blue*
2000 2001 2002 2003 2004 2000 2001 2002 2003 2004 Notes: * Low Cost Carriers All results are before exceptional items and goodwill; All European airlines have different year ends Source: Company Reports
page 20
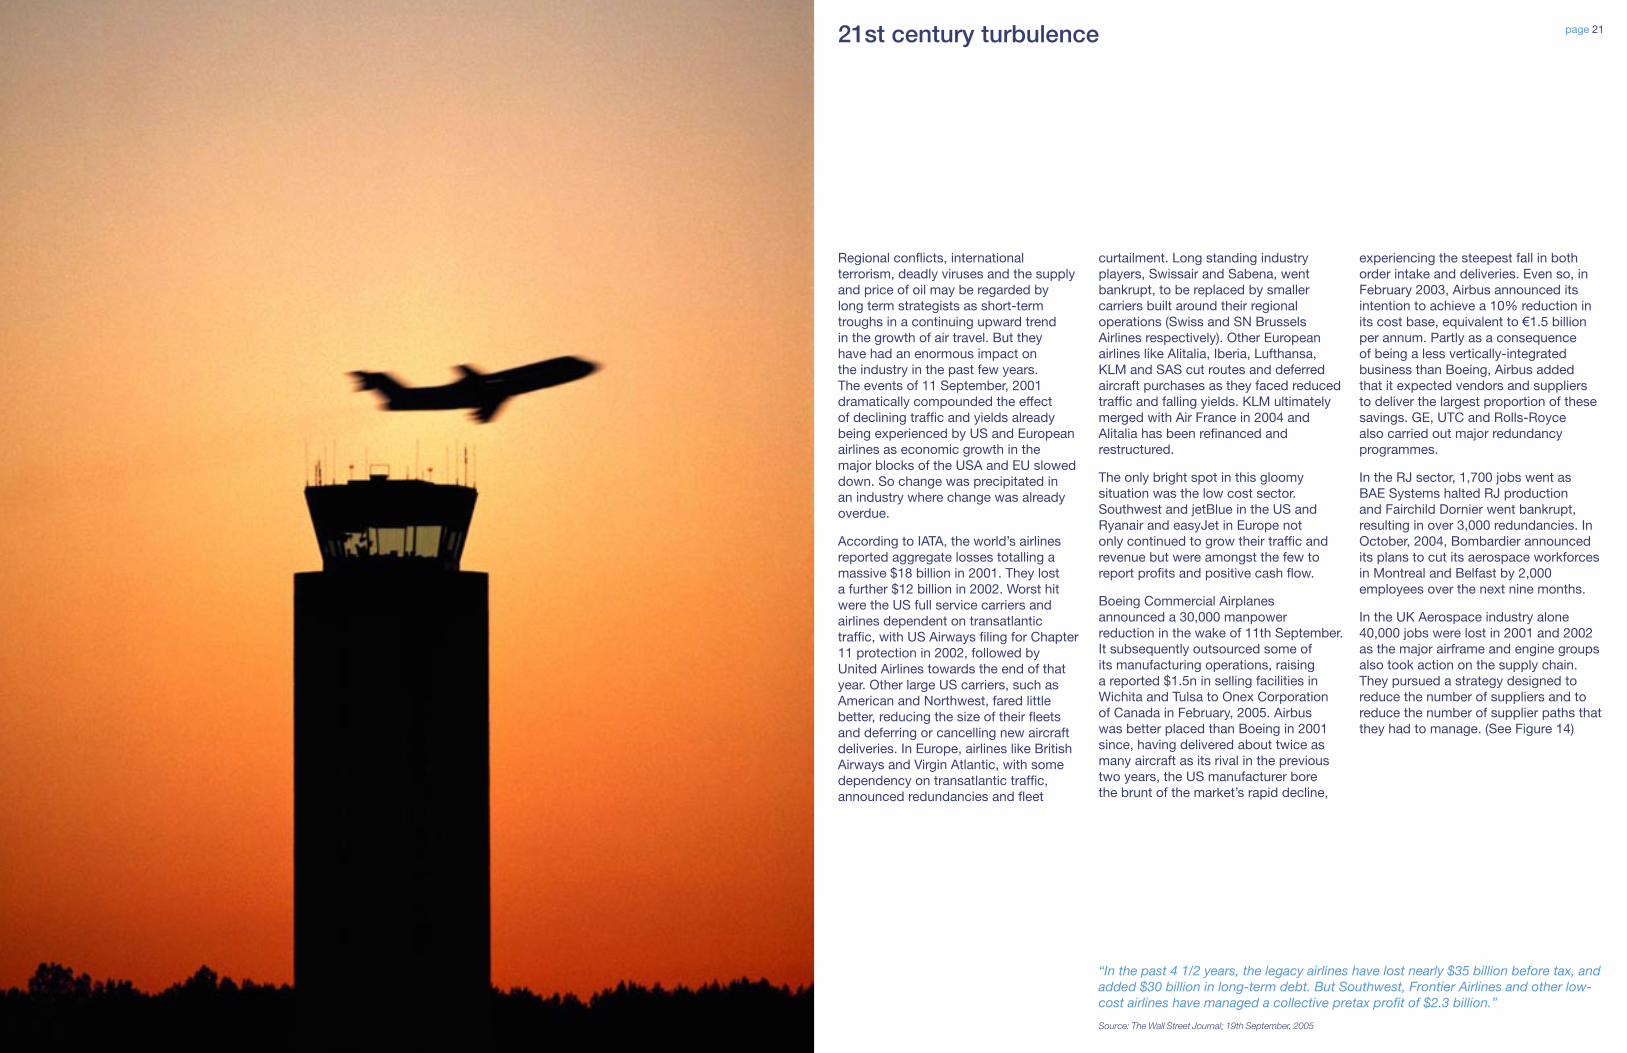
Regional conflicts, international terrorism, deadly viruses and the supply and price of oil may be regarded by long term strategists as short-term troughs in a continuing upward trend in the growth of air travel. But they have had an enormous impact on the industry in the past few years. The events of 11 September, 2001 dramatically compounded the effect of declining traffic and yields already being experienced by US and European airlines as economic growth in the major blocks of the USA and EU slowed down. So change was precipitated in an industry where change was already overdue.
According to IATA, the world’s airlines reported aggregate losses totalling a massive $18 billion in 2001. They lost a further $12 billion in 2002. Worst hit were the US full service carriers and airlines dependent on transatlantic traffic, with US Airways filing for Chapter 11 protection in 2002, followed by United Airlines towards the end of that year. Other large US carriers, such as American and Northwest, fared little better, reducing the size of their fleets and deferring or cancelling new aircraft deliveries. In Europe, airlines like British Airways and Virgin Atlantic, with some dependency on transatlantic traffic, announced redundancies and fleet
21st century turbulence
curtailment. Long standing industry players, Swissair and Sabena, went bankrupt, to be replaced by smaller carriers built around their regional operations (Swiss and SN Brussels Airlines respectively). Other European airlines like Alitalia, Iberia, Lufthansa, KLM and SAS cut routes and deferred aircraft purchases as they faced reduced traffic and falling yields. KLM ultimately merged with Air France in 2004 and Alitalia has been refinanced and restructured.
The only bright spot in this gloomy situation was the low cost sector. Southwest and jetBlue in the US and Ryanair and easyJet in Europe not only continued to grow their traffic and revenue but were amongst the few to report profits and positive cash flow.
Boeing Commercial Airplanes announced a 30,000 manpower reduction in the wake of 11th September. It subsequently outsourced some of its manufacturing operations, raising a reported $1.5n in selling facilities in Wichita and Tulsa to Onex Corporation of Canada in February, 2005. Airbus was better placed than Boeing in 2001 since, having delivered about twice as many aircraft as its rival in the previous two years, the US manufacturer bore the brunt of the market’s rapid decline,
page 21
“In the past 4 1/2 years, the legacy airlines have lost nearly $35 billion before tax, and added $30 billion in long-term debt. But Southwest, Frontier Airlines and other low-cost airlines have managed a collective pretax profit of $2.3 billion.”
Source: The Wall Street Journal; 19th September, 2005
experiencing the steepest fall in both order intake and deliveries. Even so, in February 2003, Airbus announced its intention to achieve a 10% reduction in its cost base, equivalent to €1.5 billion per annum. Partly as a consequence of being a less vertically-integrated business than Boeing, Airbus added that it expected vendors and suppliers to deliver the largest proportion of these savings. GE, UTC and Rolls-Royce also carried out major redundancy programmes.
In the RJ sector, 1,700 jobs went as BAE Systems halted RJ production and Fairchild Dornier went bankrupt, resulting in over 3,000 redundancies. In October, 2004, Bombardier announced its plans to cut its aerospace workforces in Montreal and Belfast by 2,000 employees over the next nine months.
In the UK Aerospace industry alone 40,000 jobs were lost in 2001 and 2002 as the major airframe and engine groups also took action on the supply chain. They pursued a strategy designed to reduce the number of suppliers and to reduce the number of supplier paths that they had to manage. (See Figure 14)

page 22 page 23
As a result, suppliers took on additional responsibilities – managing elements of the supply chain previously directed by their customers, funding certain development and engineering activities, committing to year-on-year cost reduction targets and entering into commercial agreements in which they shared the risks and rewards associated with programmes achieving forecast sales volumes.
This trend is sure to continue. The launch of any new programme will clearly mean that every supplier wanting to secure a position will have to take on a signifi cant level of risk, investing in non-recurring costs such as design, development and tooling and committing to continuing improvement in cost and performance. As an example, Embraer is now working with risk-sharing partners in the development and production of its 170/190 jet family.
The World Trade Organisation aircraft dispute
The USA makes the fi rst move…
“…the United States respectfully requests the Dispute Settlement Body to establish a panel… (and) is concerned that the launch aid provided by the EC and the member States to Airbus for the development of large civil aircraft… appear to be export subsidies inconsistent with Articles 3.1(a) and 3.2 of the SCM Agreement. The United States further is concerned that the measures of the EC and the member States that are the subject of this panel request appear to be causing adverse effects to its interests…”
European Communities and certain Member States – Measures Affecting Trade in Large Civil Aircraft – Request for the Establishment of a Panel by the United States; 31stMay, 2005
… and the EC respond within days
“The European Communities requests (sic) that a panel be established…This dispute concerns prohibited and actionable subsidies provided to and benefi ting the US producers of large civil aircraft (the “US LCA industry”), including, in particular, the Boeing Company (“Boeing”) and McDonnell Douglas Corporation prior to its merger with Boeing.”
United States – Measures Affecting Trade in Large Civil Aircraft – request for the establishment of a Panel by the European Communities; 3rd June, 2005
Source: WTO
Five US companies are primary risk sharing partners:
• GE – engines
• Honeywell – avionics systems
• Hamilton Sundstrand (UTC) – tail cone, auxiliary power unit, electrical systems, air management system
• C&D Aerospace (now Zodiac) – interior
• Grimes Aerospace – exterior and cockpit lighting
The restructuring of the civil aircraft supply chain has prompted a range of refi nancing, restructuring, mergers and acquisitions. Not surprisingly, this has attracted investors who sense an opportunity to create value from changing market conditions. These include private equity houses, who have become signifi cant players in the aerospace supply chain.
As the industry emerges from recession, a major dispute has resurfaced between the US and Europe. On 31st May, 2005, the WTO was called upon by the US to set up a Disputes Settlement Body to resolve an argument with the European Communities regarding “measures affecting the trade in large civil aircraft” – state aid to Airbus by the French, German, British and Spanish governments. Europe responded with a counter claim on 3rd June, 2005, citing examples where it believed US state aid affected trade. The debate has captured the attention of the news media on both sides of the Atlantic for over a year now – whilst the industry has been awaiting confi rmation that the market’s recovery is fi nally under way.
Figure 14: The evolution of the aerospace supply chain 2000+
Past Emerging
Large scale integration
Platform assembly
Small scale integration
Value-added partsand assemblies
Make-to-print partsand assemblies
• Primarily direct supply• Many direct suppliers• No real role for"integrators"
• Many "supplier paths"• Fewer, but still manydirect suppliers
• Limited role for"integrators"
• Larger role for value-adding suppliers
• Fewer "supplier paths"• Far fewer direct suppliers• Extensive role for"integrators"
• Still larger role forvalue-adding parts suppliers
Raw materials
OEMs SystemIntegrators
Future
SystemIntegrators
Source: The Society of British Aerospace Companies
page 24 page 25
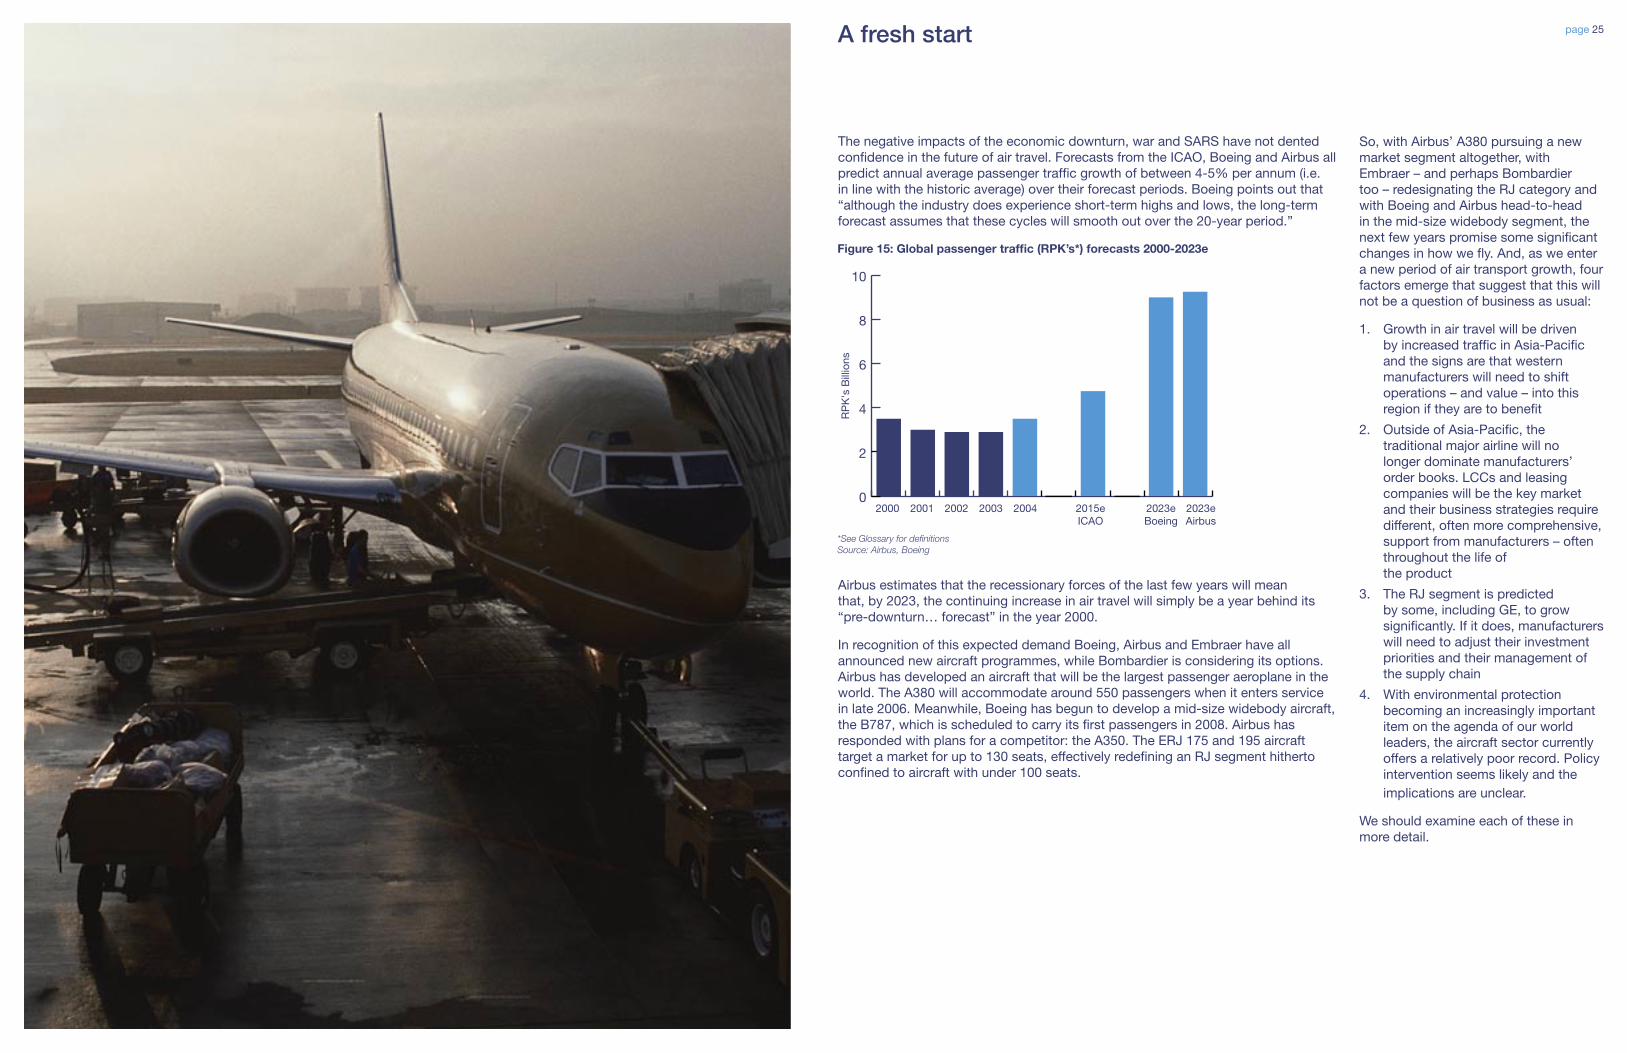
The negative impacts of the economic downturn, war and SARS have not dented confidence in the future of air travel. Forecasts from the ICAO, Boeing and Airbus all predict annual average passenger traffic growth of between 4-5% per annum (i.e. in line with the historic average) over their forecast periods. Boeing points out that “although the industry does experience short-term highs and lows, the long-term forecast assumes that these cycles will smooth out over the 20-year period.”
Airbus estimates that the recessionary forces of the last few years will mean that, by 2023, the continuing increase in air travel will simply be a year behind its “pre-downturn… forecast” in the year 2000.
In recognition of this expected demand Boeing, Airbus and Embraer have all announced new aircraft programmes, while Bombardier is considering its options. Airbus has developed an aircraft that will be the largest passenger aeroplane in the world. The A380 will accommodate around 550 passengers when it enters service in late 2006. Meanwhile, Boeing has begun to develop a mid-size widebody aircraft, the B787, which is scheduled to carry its first passengers in 2008. Airbus has responded with plans for a competitor: the A350. The ERJ 175 and 195 aircraft target a market for up to 130 seats, effectively redefining an RJ segment hitherto confined to aircraft with under 100 seats.
A fresh start
Figure 15: Global passenger traffic (RPK’s*) forecasts 2000-2023e
0
2
4
6
8
10
RP
K's
Bill
ions
2000 2001 2002 2003 2004 2015eICAO
2023eBoeing
2023eAirbus
*See Glossary for definitions Source: Airbus, Boeing
So, with Airbus’ A380 pursuing a new market segment altogether, with Embraer – and perhaps Bombardier too – redesignating the RJ category and with Boeing and Airbus head-to-head in the mid-size widebody segment, the next few years promise some significant changes in how we fly. And, as we enter a new period of air transport growth, four factors emerge that suggest that this will not be a question of business as usual:
1. Growth in air travel will be driven by increased traffic in Asia-Pacific and the signs are that western manufacturers will need to shift operations – and value – into this region if they are to benefit
2. Outside of Asia-Pacific, the traditional major airline will no longer dominate manufacturers’ order books. LCCs and leasing companies will be the key market and their business strategies require different, often more comprehensive, support from manufacturers – often throughout the life of the product
3. The RJ segment is predicted by some, including GE, to grow significantly. If it does, manufacturers will need to adjust their investment priorities and their management of the supply chain
4. With environmental protection becoming an increasingly important item on the agenda of our world leaders, the aircraft sector currently offers a relatively poor record. Policy intervention seems likely and the implications are unclear.
We should examine each of these in more detail.

page 26 page 27
1 Asia-Pacific growth: strings attached?
Growth in air travel in the Asia-Pacific region is the primary driver behind the expected increase in air travel over the next 20 years. Based on Airbus’ forecasts, this will lift the region’s share of global passenger traffic from 25% in 2003 to 31% in 2023. As a consequence, by 2023 the Asia-Pacific region will account for a larger share of passenger traffic than North America (26%) and only just be behind Europe (32%). Driving this performance is the continued economic development of China, where passenger traffic is expected to grow by an annual average rate of over 8% through to 2023 – compared with half that in the USA and just over 5% in Europe. (See Figure 16)
Not surprisingly, manufacturers see China and the Asia-Pacific region as a major market for new aircraft in future. Indeed, the economic development of the Asia-Pacific region was the major force behind the A380, A350 and B787 programmes. Aiding their optimism for the region is the relative financial health of the major carriers in a market where deregulation is at an early stage. And, of course, some governments in the region have, in turn, viewed the interest of the major airframe and engine suppliers (the Original Equipment Manufacturers or “OEMs”) as a way to procure work for and develop their indigenous aerospace industries.
Offset or countertrade is a well established process in many of the world’s major markets for defence equipment and services. And many examples of this process feature civil aircraft work packages offered to offset the value involved in acquiring military hardware. PricewaterhouseCoopers’ recent paper, “The Defence Industry in the 21st Century: thinking global or thinking American?” discusses this area in some detail. In today’s civil aircraft market, the forecast growth in traffic and the launch of new programmes provides governments in the region with a special opportunity. Governments prepared to support their industry in becoming risk sharing partners will not only acquire new aircraft to meet demand today but also develop the capabilities and intellectual property necessary to compete in the global aerospace industry of tomorrow.
A good example of this is the Boeing 787 structures work share programme. For the first time in the group’s history, this work will largely be outsourced, with Japan’s three major aerospace suppliers the largest beneficiaries. Together, they will acquire 35% of the platform work. Airbus asserts that the development costs incurred to meet these contracts are being met by the Japanese government at a cost of $1.6bn. If so, then taking on this investment will enable Japanese industry to secure long term contracts for a new platform which is on track to rival Boeing’s flagship 737 for orders before entry into service. In an aircraft that will make greater use of composite materials in its structure, the technical know-how gleaned from the project will place the Japanese aerospace industry in a strong position going forward. In return, Boeing secured launch customer support from Air Nippon Airways through their order for a mix of both variants (50 in total) of the new 787 (formerly known as the 7E7).
Figure 17: 7E7 structures work share
Boeing
Japan
Vought/Alenia
Other
35%
35%
26%
4%
Source: Boeing
Elsewhere within the region, the Chinese government is also keen for its suppliers to improve their manufacturing capabilities and diversify away from defence work. To meet this challenge, most OEMs have sought to position themselves in the Chinese market by procuring parts from domestic suppliers. China’s low cost advantage has heightened the attraction of this option. Embraer, however, has gone a step further. It has formed a JV with Harbin Aircraft Industry and Hafei Aviation Industry, subsidiaries of China Aviation Industry Corporations II (“AVIC II”) for the domestic manufacture, sale, and after-sale support of the ERJ 145 family. P&W has four ventures in China (as well as 13 in Russia and a wholly owned subsidiary in Canada) and it manufactures engines in partnership with companies in countries including Japan, China, and South Korea. We can expect Airbus to increase its supply base in China significantly too, following a record order for 150 A320s announced in December, 2005.
Consequently, whilst the Asia-Pacific region looks likely to be a major source of future aircraft demand – as illustrated by Figure 18 – receiving orders is likely to require a commitment from the OEMs to develop and support the indigenous aerospace industry.
CarrierEstimated future wide-body orders
Asia Pacific
JAL International 78
JAL Domestic 18
Cathay Pacific 25
Thai Airways 12
PIA 22
Qantas 21
North America
American Airlines 56
United 18
Delta Airlines 31
Air Canada 16
Europe
British Airways 35
Middle East
Iran Air 19
Saudi Arabian Airlines 32
Figure 18: Key carriers in need of capacity by 2010
Source: Morgan Stanley Research estimates using Airclaims raw data, 2005
Figure 16: Geographical traffic growth: 2003 and 2023
Share of 2003 global traffic(3.2 trillion RPKs)
Share of 2023 global traffic(9 trillion RPKs)
Middle East 3%Africa 3%
Latin America &Caribbean 4%
Asia Pacific25%
Europe32%
North America33%
Middle East 5%Africa 2%
Latin America &Caribbean 4%
Asia Pacific31%
Europe32%
North America26%
Source: Airbus 2004-2023 Global Market Forecast

page 28 page 29
2 New customers: different needs
As we have discussed, the major national airlines were the traditional major customers of the LCA and RJ manufacturers. This no longer seems to be the case. In particular, two very different customer groupings, LCCs and aircraft leasing companies, are now major customers. GE predicts that the LCCs will account for 30% of global capacity by 2015, whilst the leasing companies’ share of the world fleet is expected to have risen from 25% in 2003 to 30% by the end of 2005. An analysis of Airbus’ and Boeing’s October 2005 order backlog reveals that both groups are already as important as their traditional customers – the majors.
Figure 19: Boeing and Airbus outstanding orders customer profile
0
50
100
150
200
250
300
350
400
Uni
ts
Asia(ex China)
Boeing Airbus
China LegacyEurope
LegacyUS
USLow Cost
EuropeLow Cost
Leasing
361
224
54
111128
177 182161
213
125
68
193
241
373Outstanding ordersas of October 31, 2005
Boeing: 1,509Airbus: 1,680
Source: Airbus, Boeing
But simply being a LCC is not a panacea for success. Recent rises in fuel prices, plus cost cutting initiatives by the majors as they strive to compete has helped push some LCCs into bankruptcy on both sides of the Atlantic. It seems that economies of scale are important. Size matters.
The current importance of leasing companies reflects their increase in orders prior to 2001 and lower order deferral and cancellation rate relative to the airlines since then. Many, of course, provide funding for aircraft to the low cost segment. They now comprise a significant slice of aircraft makers’ order books. Again, size counts and, whilst many mid-sized companies, like Ansett Worldwide Aviation Services (WAS), were affected by the drop off in aircraft lease and valuation rates after 2001, the industry has consolidated too. Tyco Corporation acquired CIT, AIG backed ILFC, Morgan Stanley bought Ansett WAS and German bank WestLB acquired Bouillioun. Debis acquired AerFi to become debis AirFinance before itself being acquired by US private equity house, Cerberus Capital Management, in April, 2005.
Figure 20: Global aircraft financing breakdown
OperatingLeases
25%
AirlineCash Flows
25%
Debt50%
Source: Merrill Lynch
Looking ahead, the leasing industry looks well placed in the current airline industry climate. As traditional funding routes (ie: cash flow and secured debt) have been denied most airlines save the few profitable corporations, leasing companies have the scale and breadth of aircraft asset portfolios to offer commercial funding.
Figure 21: Aircraft debt instruments
*EETC’s were popular in the mid-1990s to 2001 and enabled airlines to raise finance by issuing securities backed by aircraft pools. Investors had different interest and default rankings and as a result the overall cost of issuance to the airline was lower than their credit rating. The subsequent downturn in 2001 resulted in many junior investors losing money and so the appeal of these schemes has waned. Source: PwC
Debt Instrument Comment
Commercial Banks
Falling credit ratings/bankruptcies across the industry has reduced the banks willingness to lend.
Secured Bonds New funding instruments such as Enhanced Equipment Trust Certificates (EETC)* have fallen from favour due to investor losses
3 Regional jets: coming of age?
GE predicts that, by 2015, LCCs and regional carriers will provide 50% of global seat capacity and RJs would be expected to be best placed to serve this segment. To date, RJ usage has largely been a US affair. All of the major airlines either own or are affiliated with regional carriers and the US domestic market is well established and offers scale – both in demand and in airspace. But this looks set to change. As European deregulation gathers pace, regional carriers are expected to develop the European market in the next decade.
A positive RJ outlook is primarily based on the relaxation of the so-called ‘scope clauses’ which have to date governed RJ size in the US market. Agreements with unions restricted the number and size of aircraft that could be operated. These arrangements, which meant that a typical RJ seated 50 people, ensured that airlines mainly operated larger aircraft which generally supported a larger workforce and higher salaries.
Now, in a post 9/11 environment that places a premium on efficiency and requires fleet versatility, such agreements are gradually being repealed. This has allowed airlines to consider ‘right-sizing’ some of their routes. And it may be that 70-110 seat RJs might be more appropriate than existing fleets of B737s or A320s. US Airways appeared to support this view when, in May, 2003, it ordered one hundred 70/75-seat RJs. More recently, jetBlue ordered one hundred Embraer 190 aircraft (seating 100 passengers). This shift towards larger RJs is highlighted by the fact that the majority of orders at both Bombardier and Embraer are for aircraft with 70 seats or more. This is why Bombardier has been pondering a possible launch of a 110/130-seat RJ known as the C-Series.
“…the decision by Air France’s regional subsidiary (Regional) to convert its former firm order of seven ERJ 145 jets into six firm orders of Embraer 190s… is not significant in financial terms… However, it has an important strategic implication, as Regional becomes the second European customer – after Flybe – to place an order for the Embraer 190 jet. Moreover, after the merger with KLM, Air-France became the largest airline in Europe, and it is a traditional customer for the Embraer regional jets.”
Source: Santander Investment, September, 2005
These developments clearly have the potential to affect the market for LCAs. Much depends upon how Embraer and Bombardier order books shape up in the year ahead. In the past, they have been heavily weighted towards the major US airlines, many of whom are in distress. In 2004, nearly 82% of its commercial division sales came from US airlines, followed by Europe with 11.8%. Looking at Embraer’s order intake during the first half of 2005, we can see that this pattern may be changing but Jetblue, Air Canada and US Airways still accounted for nearly half (47%) of its order backlog at the 2005 half year.
Figure 22: Global LLC & RJ traffic share growth (ASM billions)
0
1000
2000
3000
4000
'95 '00 '05 '10 '15
Major
LCC
RJ
9%13%
78%
12%
20%
68%
20%
50%
30%
Source: GE
“In the near term, the growing market presence of LCC’s likely will continue to be replicated in other countries outside the United States. LCC’s around the world will continue to dominate aircraft and related operating fleets with new aircraft.”
Source: US Department of Commerce
“In the current financing environment, in which secured and unsecured debt is getting increasingly scarce, we expect leasing to be even more important for airlines…”
Source: Citigroup, 4th November 2004
page 30 page 31
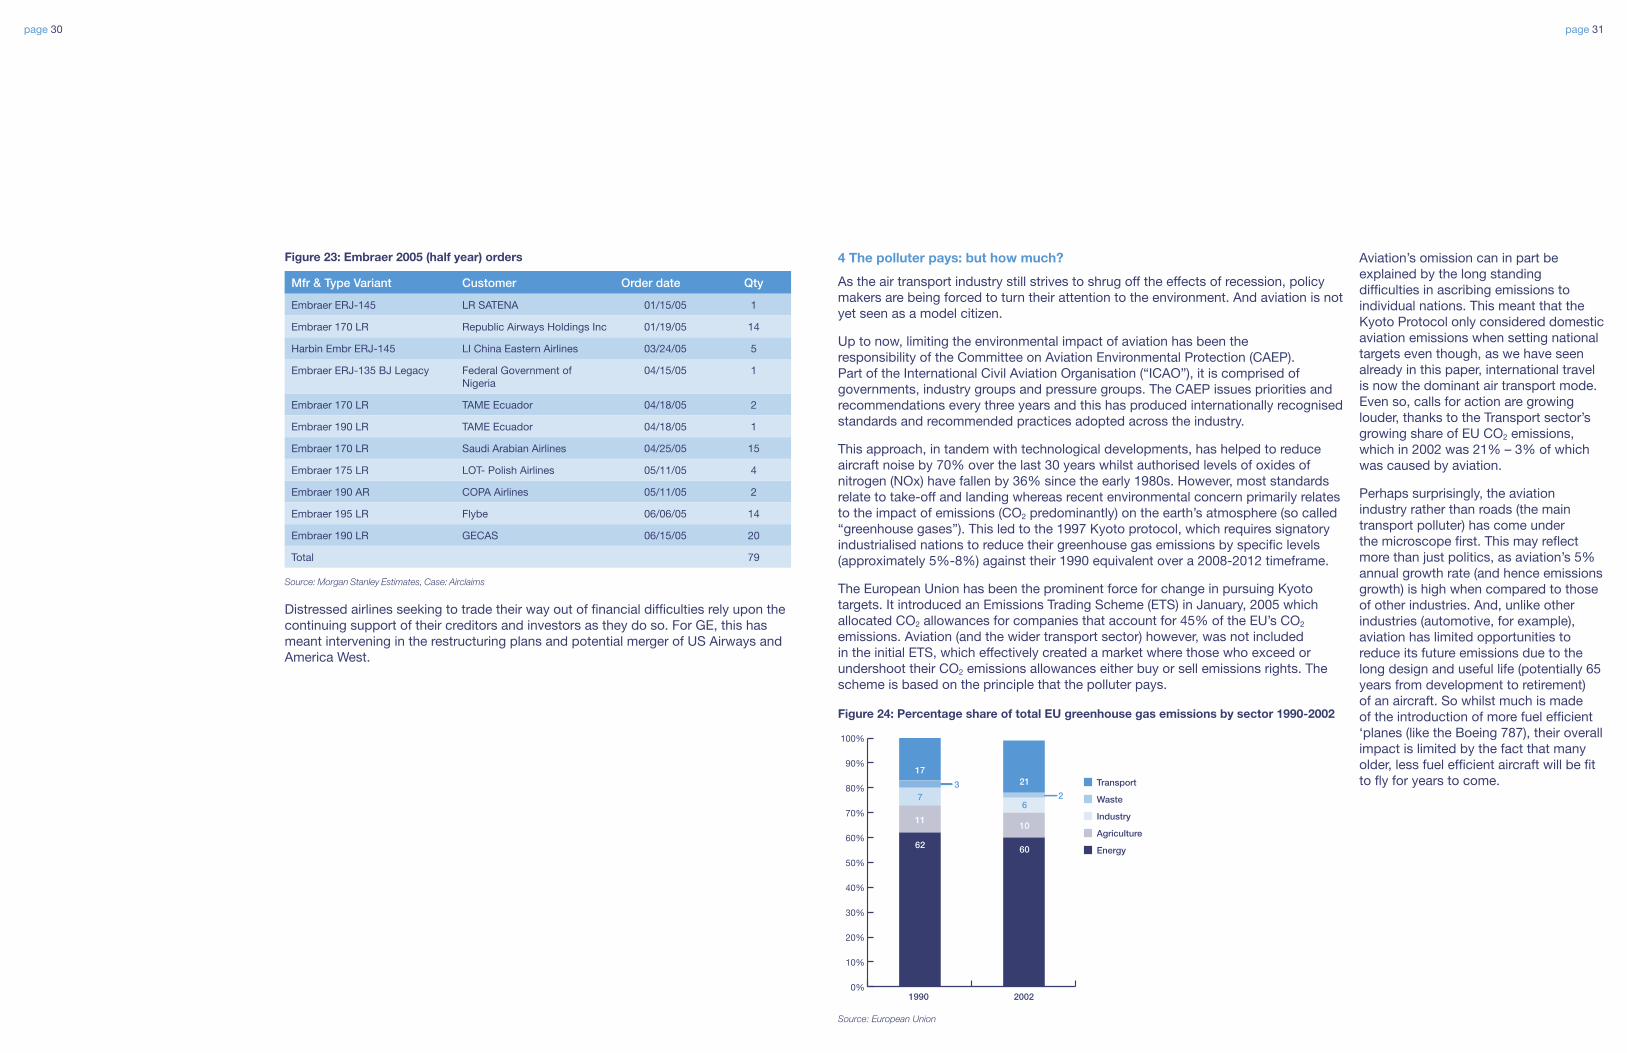
Mfr & Type Variant Customer Order date Qty
Embraer ERJ-145 LR SATENA 01/15/05 1
Embraer 170 LR Republic Airways Holdings Inc 01/19/05 14
Harbin Embr ERJ-145 LI China Eastern Airlines 03/24/05 5
Embraer ERJ-135 BJ Legacy Federal Government of Nigeria
04/15/05 1
Embraer 170 LR TAME Ecuador 04/18/05 2
Embraer 190 LR TAME Ecuador 04/18/05 1
Embraer 170 LR Saudi Arabian Airlines 04/25/05 15
Embraer 175 LR LOT- Polish Airlines 05/11/05 4
Embraer 190 AR COPA Airlines 05/11/05 2
Embraer 195 LR Flybe 06/06/05 14
Embraer 190 LR GECAS 06/15/05 20
Total 79
Figure 23: Embraer 2005 (half year) orders
Source: Morgan Stanley Estimates, Case: Airclaims
Distressed airlines seeking to trade their way out of financial difficulties rely upon the continuing support of their creditors and investors as they do so. For GE, this has meant intervening in the restructuring plans and potential merger of US Airways and America West.
4 The polluter pays: but how much?
As the air transport industry still strives to shrug off the effects of recession, policy makers are being forced to turn their attention to the environment. And aviation is not yet seen as a model citizen.
Up to now, limiting the environmental impact of aviation has been the responsibility of the Committee on Aviation Environmental Protection (CAEP). Part of the International Civil Aviation Organisation (“ICAO”), it is comprised of governments, industry groups and pressure groups. The CAEP issues priorities and recommendations every three years and this has produced internationally recognised standards and recommended practices adopted across the industry.
This approach, in tandem with technological developments, has helped to reduce aircraft noise by 70% over the last 30 years whilst authorised levels of oxides of nitrogen (NOx) have fallen by 36% since the early 1980s. However, most standards relate to take-off and landing whereas recent environmental concern primarily relates to the impact of emissions (CO2 predominantly) on the earth’s atmosphere (so called “greenhouse gases”). This led to the 1997 Kyoto protocol, which requires signatory industrialised nations to reduce their greenhouse gas emissions by specific levels (approximately 5%-8%) against their 1990 equivalent over a 2008-2012 timeframe.
The European Union has been the prominent force for change in pursuing Kyoto targets. It introduced an Emissions Trading Scheme (ETS) in January, 2005 which allocated CO2 allowances for companies that account for 45% of the EU’s CO2 emissions. Aviation (and the wider transport sector) however, was not included in the initial ETS, which effectively created a market where those who exceed or undershoot their CO2 emissions allowances either buy or sell emissions rights. The scheme is based on the principle that the polluter pays.
Aviation’s omission can in part be explained by the long standing difficulties in ascribing emissions to individual nations. This meant that the Kyoto Protocol only considered domestic aviation emissions when setting national targets even though, as we have seen already in this paper, international travel is now the dominant air transport mode. Even so, calls for action are growing louder, thanks to the Transport sector’s growing share of EU CO2 emissions, which in 2002 was 21% – 3% of which was caused by aviation.
Perhaps surprisingly, the aviation industry rather than roads (the main transport polluter) has come under the microscope first. This may reflect more than just politics, as aviation’s 5% annual growth rate (and hence emissions growth) is high when compared to those of other industries. And, unlike other industries (automotive, for example), aviation has limited opportunities to reduce its future emissions due to the long design and useful life (potentially 65 years from development to retirement) of an aircraft. So whilst much is made of the introduction of more fuel efficient ‘planes (like the Boeing 787), their overall impact is limited by the fact that many older, less fuel efficient aircraft will be fit to fly for years to come.
Figure 24: Percentage share of total EU greenhouse gas emissions by sector 1990-2002
0%
10%
20%
30%
40%
50%
60%
70%
80%
90%
100%
1990 2002
Transport
Waste
Industry
Agriculture
Energy62
11
7
17
60
10
6
2132
Source: European Union

page 32 page 33
In September 2005, after conducting some preliminary research the European Commission announced its intention to include aviation in the ETS. The timing of entry has yet to be decided but it could be 2008, and this has already sparked controversy. The intention to include all departing flights – by both EU and non-EU airlines – from EU territory in the scheme has led the US Federal Aviation Administration (FAA) to warn that it will challenge its legality. It sees no lawful reason to include US airlines in the ETS.
But what if the ETS proceeds as currently planned? Airline operating costs would rise due to the expected increase in future emissions. This would necessitate the purchase of emissions allowances whose cost depends on the prevailing price in the emissions trading market. Through 2005, prices in this market proved to be fairly volatile, starting the year at near €10 per tonne of CO2 and ending it at over €20. Much of this increase would appear to be linked to the price of oil and gas, which for power companies (the biggest ETS segment) is a key factor in determining their mix of energy sources and hence CO2 emissions.
Preliminary research conducted on behalf of the European Commission has estimated that the ETS would increase 2012 short haul operating costs by €23 and €70 per round trip at €10 and €30 per tonne of CO2 respectively. For 2012 long-haul trips operating costs would rise by €228 and €684 per round at €10 and €30 per tonne of CO2 respectively. One crucial assumption made in this research is that all costs will be passed on to customers. But we might speculate on the implications for competition by making some different assumptions. Clearly some LCCs are in a position to absorb these costs. They might therefore increase market share as others are forced to increase ticket prices. And the ability of non-EU airlines to spread their ETS liabilities across all of their routes worldwide would again offer the potential to increase market share on EU routes. One thing is certain though. The ETS is likely to force all airlines to take as many steps as possible to reduce their emissions liability. And this could boost orders for the aircraft manufacturers.
Looking further ahead, it is hard to avoid the conclusion that the industry faces tighter legislation in Europe at the very least. After all, the European Commission does not think that the ETS will apply the handbrake to air travel growth since it has gathered too much momentum. And the recent Montreal Climate Change Conference set up a working group to review and potentially strengthen post Kyoto commitments. Against this backdrop, the UK’s Tyndall Centre recently highlighted the stark contrast between a future where EU emissions are stable and a future of EU aviation emissions growth. The basis of the sustainable future is a United Nations assessment that the atmospheric concentration of CO2 should not exceed 550ppmv (parts per million by unit volume). More recent research by the Hadley Centre and elsewhere has suggested that CO2 atmospheric concentrations should not exceed 450ppmv. Either way, when these targets are set against predicted EU aviation emissions growth, the civil aerospace industry looks a very poor citizen. Left unchecked, the aviation industry would in future account for 40% and 80% of the permissible 550ppmv and 450ppmv emissions. Are these statistics going to be ignored? We think not.
Figure 25: EU permissible CO2 atmospheric concentrations & aviation contribution 2000-2050e
Carbon Emissions(MtC)
Year
550EU Total
450EU Total
EU TotalAviation Scenario
2010 2020 2030 2040 20500
200
400
600
800
1,000
1,200
Source: Tyndall Centre, Decarbonising the UK, September 2005
It depends on the option taken but aviation’s inclusion in the ETS could provoke a range of responses from European airlines. The principle of “polluter pays” could hasten fleet replacement with a focus on new aircraft. And, in relation to new aircraft, the ETS will increase an aircraft’s direct operating costs which may favour the purchase of larger planes to increase load factors. Airlines will, no doubt, also look at implementing operational measures such as changing flight paths to avoid EU airspace or reducing flight speed to reduce their emissions liability.
Watch this space.
“….the aviation industry is in the unenviable position of seeing the demand for its services grow at unprecedented rates, whilst at the same time being unable to achieve substantial levels of decarbonisation in the short to medium term.”
Decarbonising the UK, Tyndall Centre, September 2005
“EU emissions from international flights grew by 73% from 1990-2003. This increase could widen to 150% by 2012 unless action is taken. Such growth would cancel out more than a quarter of the 8% reduction in total greenhouse gas emissions that the Kyoto Protocol requires the EU-15 to achieve between 1990 and 2012. ”
European Commission, September 2005
page 34 page 35
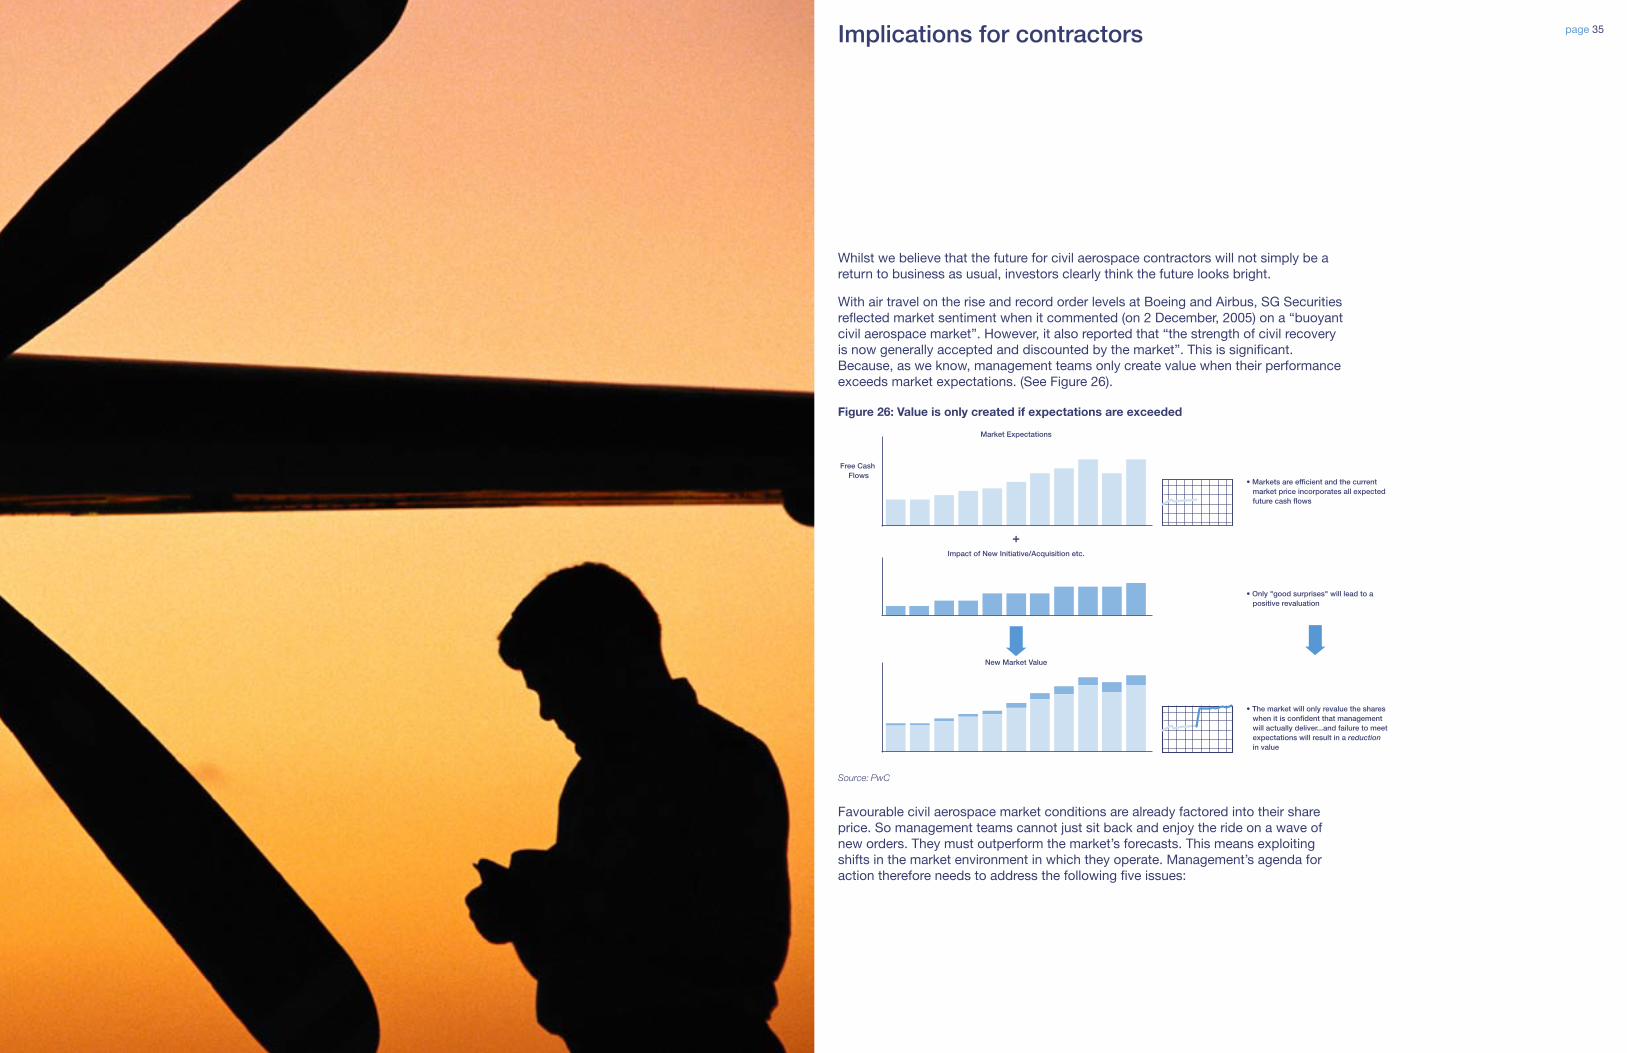
Whilst we believe that the future for civil aerospace contractors will not simply be a return to business as usual, investors clearly think the future looks bright.
With air travel on the rise and record order levels at Boeing and Airbus, SG Securities reflected market sentiment when it commented (on 2 December, 2005) on a “buoyant civil aerospace market”. However, it also reported that “the strength of civil recovery is now generally accepted and discounted by the market”. This is significant. Because, as we know, management teams only create value when their performance exceeds market expectations. (See Figure 26).
Favourable civil aerospace market conditions are already factored into their share price. So management teams cannot just sit back and enjoy the ride on a wave of new orders. They must outperform the market’s forecasts. This means exploiting shifts in the market environment in which they operate. Management’s agenda for action therefore needs to address the following five issues:
Implications for contractors
Figure 26: Value is only created if expectations are exceeded
Free CashFlows
Market Expectations
• Markets are efficient and the currentmarket price incorporates all expectedfuture cash flows
• Only "good surprises" will lead to apositive revaluation
• The market will only revalue the shareswhen it is confident that managementwill actually deliver...and failure to meetexpectations will result in a reductionin value
New Market Value
+Impact of New Initiative/Acquisition etc.
Source: PwC

page 36 page 37
1 Managing a diverse customer base
Four main customer groups have emerged and the products, services and support they require from suppliers are markedly different.
• Legacy Majors – such as Lufthansa, Varig, American Airlines, BA
• Asia Pacific – for example, China Airlines, JAL, All Nippon Airways
• Leasing Companies – ILFC, GECAS, debisAirfinance, for example
• Low Cost Carriers – like Southwest, Easyjet, JetBlue, Ryanair
When buying an aircraft and associated equipment, each group will share the same fundamental needs – safety, compliance with regulations, overall affordability – but the final package of product and service required will vary.
Value may primarily be associated with the characteristics of the aircraft and its systems but these can be interpreted entirely differently. For leasing companies, this would focus on securitisation potential – a more “commoditised” aircraft that can be used on several routes in several configurations by different operators and that will retain its resale value. For operators, an aircraft’s fuel consumption, its cabin layouts and, in future, its emissions efficiency, for example. (See Figure 27)
But there are also major issues for the package of services that accompany the aircraft and these could range from sales financing to through life support and, in Asia-Pacific, could also include the ability to establish and manage an effective supply chain in a major customer’s territory.
This holds implications for the selling process, for pricing, for the package of product and service offered and for the period over which the package is offered.
2 Investing in a changing mix of capabilities
Engine manufacturers have viewed providing through life engine support as an important source of revenue for many years. Indeed, in developing new engines, their aim is to develop an installed base that promises an annuity in earnings.
Boeing also identified the aftermarket as a major source of value. It believed that a market worth $150 billion would grow to be worth $3 trillion over the next 20 years. Hence, Saab has created a civil and military aftermarket support and service business called Saab Aerotech. And Northrop Grumman has brought together 10,000 employees to form Northrop Grumman Technical Services.
Similarly, Embraer’s strategy focuses upon diversifying its sources of revenue, prompting investments in maintenance, repair and overhaul facilities in the USA and Europe as it seeks to secure a share of the aftermarket business generated by the use of its aircraft.
But there is competition at each stage of the product lifecycle. Consequently, management teams need to be clear about the potential to create value when they decide in which stage their investment should be targeted.
“With the continued expansion of this important (product support) market, it is the right time for Northrop Grumman to capitalise on our embedded capabilities”
Ronald Sugar, Chairman and Chief Executive, Northrop Grumman, January, 2006
Figure 28: Indicative aerospace product lifecycle
-1,000
-500
0
500
1,000
1,500
2,000
Cumulativeprojectcash-flow
£m
Year
121 25
• Mix of operators,independents andOEMs• Power by hour vsbalance of power
MRO
• Pressures onmargin
Manufacturing
• Increasedinvestment risk
Research anddevelopment
• Financing
Selling
• Tension betweenengine reliabilityand profit potentialfrom spares• Challenge to typeapprovals?
Spares
Source: PwC
Figure 27: Customer differentiation
CustomerFocus
Service
Cost
Product
Legacy Majors
Asia Pacific
Leasing Companies
Low Cost Carriers
Differentiators
Collaborative Design
Fuel Efficiency
Reliability
Availability
Low (Total) Cost
Compliance
Affordability
Safety
(Illustrative only)
Commonality
Asset Liquidity
Through Life Support
Financing
Low Maintenance
High Serviceability
Product Development
Technology Transfer
Partnership
HygieneRequirements
FundamentalNeeds
Source: PwC
And equally clear about who they select as partners in sharing certain areas of investment. Faced with the mounting costs involved, engine manufacturers have pooled research and development investment in forming ventures like CFM International and International Aero Engines. This holds important implications for management’s ability to secure value in every subsequent stage of the engine lifecycle. Will it be derived from the manufacture and sale of original equipment? From providing sales finance? From maintenance, repair and overhaul services throughout the engine’s lifetime? From training, spares and other logistical support? Is it possible to invest and be competitive in all of these areas and does an alliance in the research and development phase constrain the options for value creation at subsequent stages in the cycle?

page 38 page 39
3 Managing supplier risk throughout the lifecycle
As the industry emerges from recession and new programmes compete for investment from risk-sharing partners, the resilience, capability and credibility of the supply chain will be crucial in ensuring orders are converted into value. Yet whilst risk can be contractually passed on to sub-tier suppliers, the supply chain is as strong as its weakest link and a failure will risk the collapse of an entire programme.
Most supplier evaluation procedures incorporate the principles of what is widely known as the Balanced Scorecard – in particular, the use of both quantitative and qualitative measures and of both forward-looking and historical performance indicators. Clearly it is important to use financial as well as operational and commercial inputs. Yet current financial data can be difficult to obtain – companies may not file accounts quickly – if, indeed, they can be obtained at all – say when a supplier is part of a major group of companies which consolidates its financial reports at a high level. It is even more difficult to review forecast or predictive data. Yet much of the supplier population now carries a significant proportion of a programme’s risk. How can we know whether such risk can be supported over the life of a programme which may run for 25 years or more?
Companies at the top of the supply chain are, as we know, predisposed to send their engineering teams to supplier premises in order to ensure on-time deliveries that meet the specification. And they intervene even if the focus for their attention is Buyer Furnished or Buyer Specified Equipment (where the supplier has been selected and perhaps contracted by the ultimate owner of the aircraft and not the aircraft manufacturer), where they have had limited input to the sourcing decision in the first place. Their overriding objective is to meet programme delivery dates – especially during a period of increasing orders. Like now.
There are two concerns here. First, the cost of providing this support may well be hard to identify or control in the overall build schedule. Is it accounted for within the bill of materials… or is it ongoing engineering support? Who controls or is accountable for it? Second, this intervention does not address the problem of potential supplier insolvency. And the implications here for a programme’s viability can be devastating. Regardless of whether the supplier is a risk-sharing partner or not.
In 2003, PricewaterhouseCoopers conducted an assessment of the financial health of a population of 53 aerospace suppliers with a turnover of $100m or less. Our research suggested that more than half were at risk, with over 30% in danger of insolvency. With the pressures on working capital mounting as the industry roars out of recession towards record delivery levels, does the supplier base look healthier now?
“Airbus has signalled aggressive plans to take up single-aisle production rates toward a… rate that is 40% above its historical peak. There is certainly a risk it pushes too hard too quick and runs into the same issues as Boeing in the late 1990s. In our view, the best strategy for both would be a gradual increase in rates to manage the supply chain better and increase price integrity. We are just not convinced that Airbus will act with as much caution given that ramping production is one of the ways it can capture increased Route ’06 cost savings to offset the negative hit from the roll-off of its strong USD hedges.”
Morgan Stanley Equity Research, 28, October, 2005
“Bank of America said… that Boeing orders could fall back sharply this year, and that “serious supply chain issues” could constrain its ability to meet higher demand.”
Financial Times, London, 2 December, 2005
Figure 29: Supplier evaluation matrix
Quality
FinancialViability
Delivery
Cost
Engineering & Support
Source: PwC
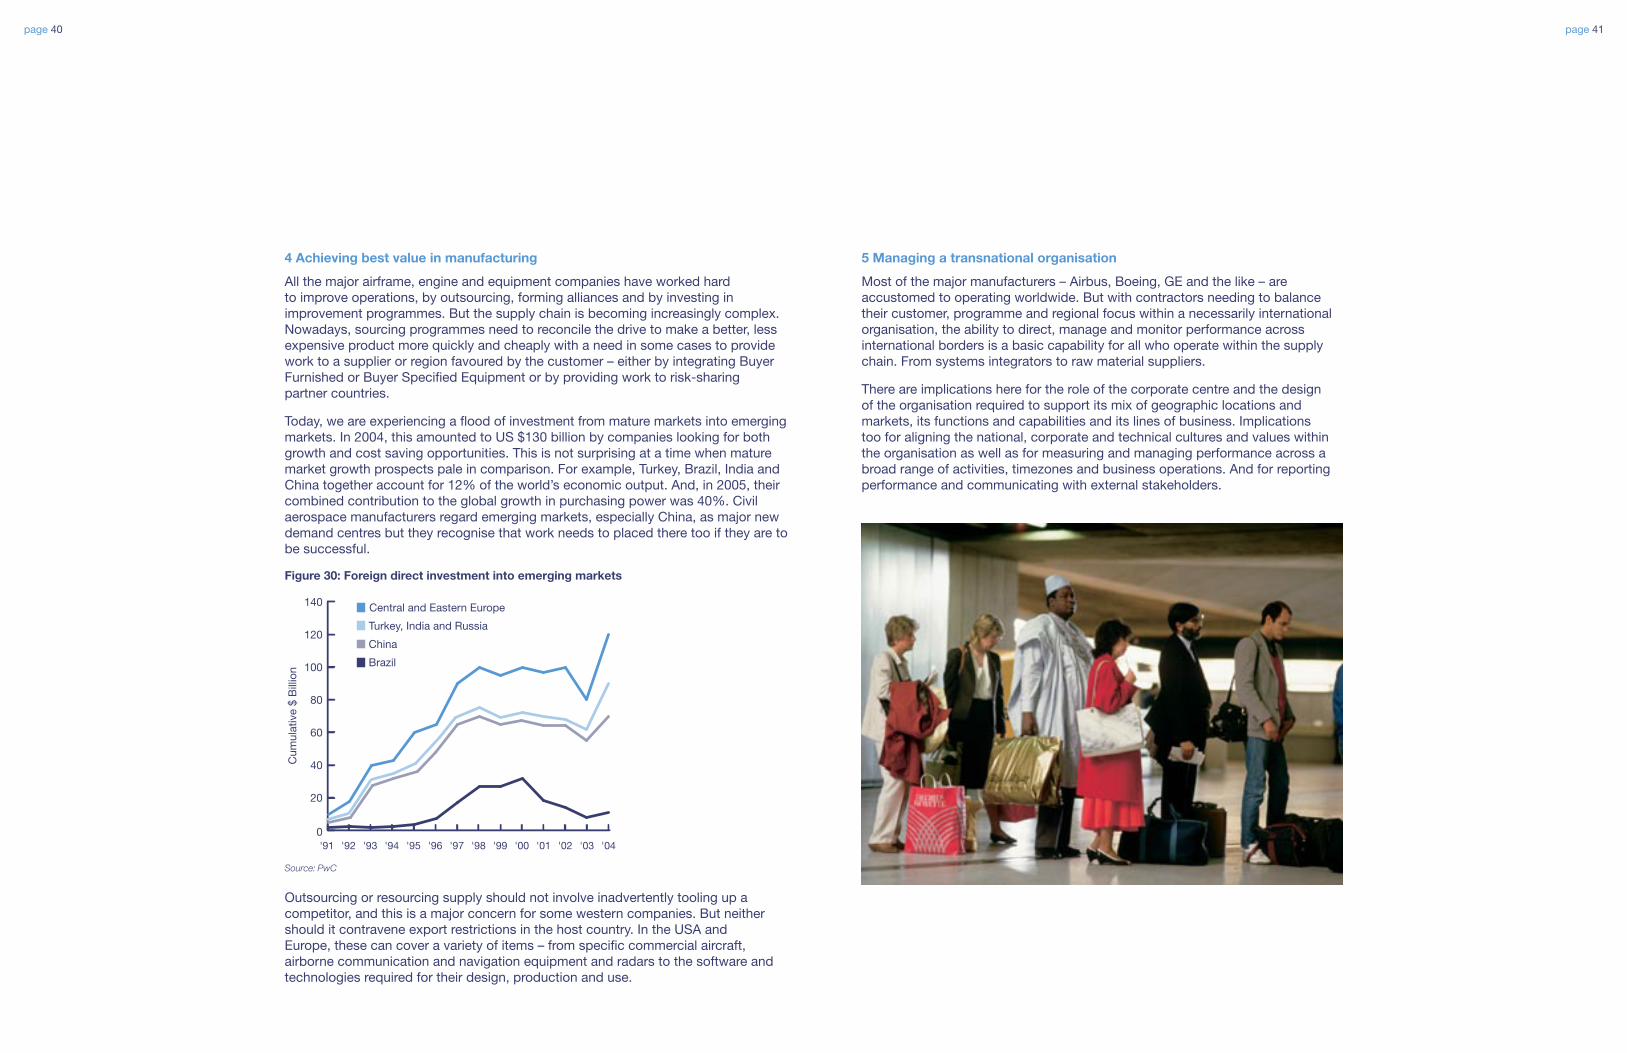
page 40 page 41
5 Managing a transnational organisation
Most of the major manufacturers – Airbus, Boeing, GE and the like – are accustomed to operating worldwide. But with contractors needing to balance their customer, programme and regional focus within a necessarily international organisation, the ability to direct, manage and monitor performance across international borders is a basic capability for all who operate within the supply chain. From systems integrators to raw material suppliers.
There are implications here for the role of the corporate centre and the design of the organisation required to support its mix of geographic locations and markets, its functions and capabilities and its lines of business. Implications too for aligning the national, corporate and technical cultures and values within the organisation as well as for measuring and managing performance across a broad range of activities, timezones and business operations. And for reporting performance and communicating with external stakeholders.
4 Achieving best value in manufacturing
All the major airframe, engine and equipment companies have worked hard to improve operations, by outsourcing, forming alliances and by investing in improvement programmes. But the supply chain is becoming increasingly complex. Nowadays, sourcing programmes need to reconcile the drive to make a better, less expensive product more quickly and cheaply with a need in some cases to provide work to a supplier or region favoured by the customer – either by integrating Buyer Furnished or Buyer Specified Equipment or by providing work to risk-sharing partner countries.
Today, we are experiencing a flood of investment from mature markets into emerging markets. In 2004, this amounted to US $130 billion by companies looking for both growth and cost saving opportunities. This is not surprising at a time when mature market growth prospects pale in comparison. For example, Turkey, Brazil, India and China together account for 12% of the world’s economic output. And, in 2005, their combined contribution to the global growth in purchasing power was 40%. Civil aerospace manufacturers regard emerging markets, especially China, as major new demand centres but they recognise that work needs to placed there too if they are to be successful.
Figure 30: Foreign direct investment into emerging markets
China
Turkey, India and Russia
Central and Eastern Europe
'910
20
40
60
80
100
120
140
Brazil
'96'95'94'93'92 '98'97 '99 '00 '02'01 '04'03
Cum
ulative$Billion
Source: PwC
Outsourcing or resourcing supply should not involve inadvertently tooling up a competitor, and this is a major concern for some western companies. But neither should it contravene export restrictions in the host country. In the USA and Europe, these can cover a variety of items – from specific commercial aircraft, airborne communication and navigation equipment and radars to the software and technologies required for their design, production and use.
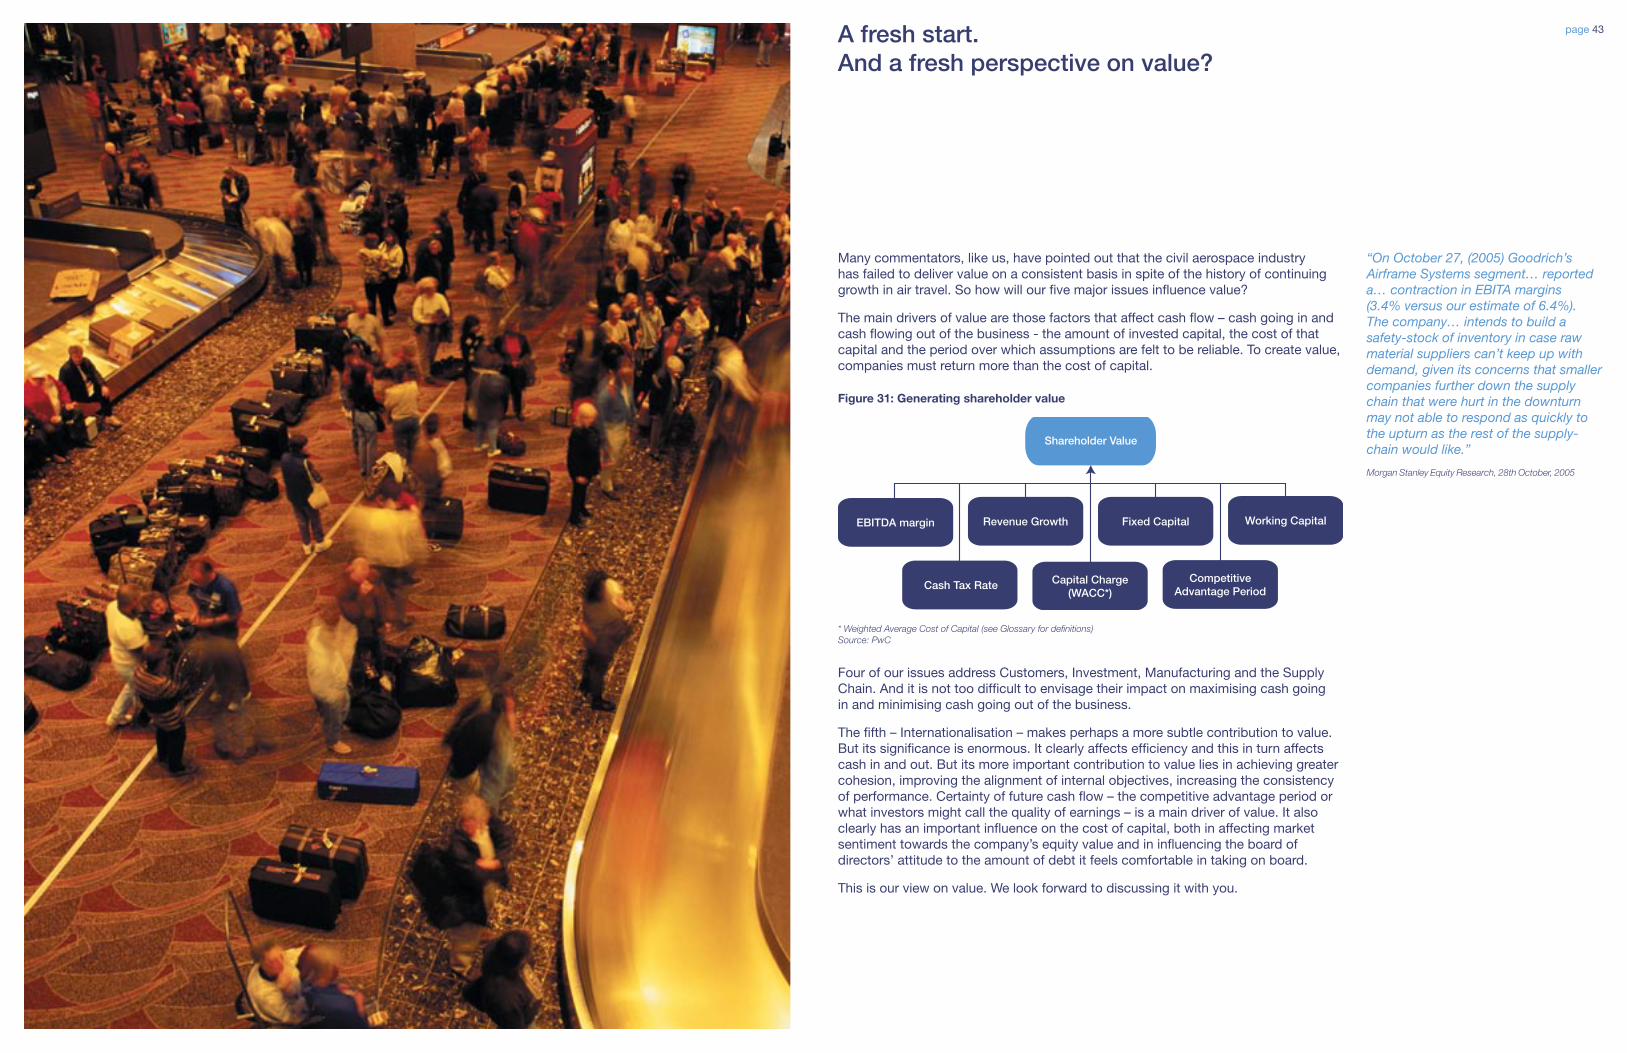
page 42 page 43
Many commentators, like us, have pointed out that the civil aerospace industry has failed to deliver value on a consistent basis in spite of the history of continuing growth in air travel. So how will our five major issues influence value?
The main drivers of value are those factors that affect cash flow – cash going in and cash flowing out of the business - the amount of invested capital, the cost of that capital and the period over which assumptions are felt to be reliable. To create value, companies must return more than the cost of capital.
Figure 31: Generating shareholder value
Shareholder Value
EBITDA margin
Cash Tax Rate
Revenue Growth Fixed Capital Working Capital
CompetitiveAdvantage Period
Capital Charge(WACC*)
* Weighted Average Cost of Capital (see Glossary for definitions) Source: PwC
Four of our issues address Customers, Investment, Manufacturing and the Supply Chain. And it is not too difficult to envisage their impact on maximising cash going in and minimising cash going out of the business.
The fifth – Internationalisation – makes perhaps a more subtle contribution to value. But its significance is enormous. It clearly affects efficiency and this in turn affects cash in and out. But its more important contribution to value lies in achieving greater cohesion, improving the alignment of internal objectives, increasing the consistency of performance. Certainty of future cash flow – the competitive advantage period or what investors might call the quality of earnings – is a main driver of value. It also clearly has an important influence on the cost of capital, both in affecting market sentiment towards the company’s equity value and in influencing the board of directors’ attitude to the amount of debt it feels comfortable in taking on board.
This is our view on value. We look forward to discussing it with you.
A fresh start. And a fresh perspective on value?
“On October 27, (2005) Goodrich’s Airframe Systems segment… reported a… contraction in EBITA margins (3.4% versus our estimate of 6.4%). The company… intends to build a safety-stock of inventory in case raw material suppliers can’t keep up with demand, given its concerns that smaller companies further down the supply chain that were hurt in the downturn may not able to respond as quickly to the upturn as the rest of the supply- chain would like.”
Morgan Stanley Equity Research, 28th October, 2005

page 44 page 45
AVIC China Aviation Industry Corporation
CAB Civil Aeronautics Board
CAEP Committee on Aviation Environmental Protection (within the ICAO)
CASM/CASK Cost per Available Seat Mile/Kilometre
Operating costs divided by available seat miles/ kilometres
EADS European Aeronautics, Defence and Space Company
ETS Emissions Trading Group
EU European Union
GA General Aviation
GDP Gross Domestic Product
GE General Electric
GEAE General Electric Aircraft Engines
IAE International Aero Engines
IATA International Air Traffic Association
ICAO International Civil Aviation Organization
JAL Japanese Airlines
Jet engine In which air is taken from the outside, compressed, heated (by combustion of fuel), expanded in a jet or turbine, and expelled from the jet at a much higher velocity than the intake velocity. The increase in velocity creates propulsive thrust
JV Joint Venture
LCA Large Commercial Aircraft
LCC Low Cost Carrier
OEM Original Equipment Manufacturer
Piston engine An internal combustion engine in which thermal energy is released when fuel is burned and converted into mechanical energy. A combustible mixture is compressed in a cylinder and ignited, thrusting down a piston that imparts a rotary motion to a crank shaft
ppmv Parts per million by unit volume
P&W Pratt & Whitney
RJ Regional Jet
RPM/RPK Revenue Passenger Miles/Kilometres
SARS Severe Acute Respiratory Syndrome
Glossary
page 46 page 47
Shareholder Value The net present value of forecast free cash flows discounted by the cost of capital (WACC)
TKP Tonne-Kilometres Performed
Tonne-kilometre Carriage of one tonne of passengers, freight or mail for one kilometre
Turboprop A gas turbine engine that employs a portion of its drive to rotate a propeller. Refers also to an aircraft with such an engine
UTC United Technologies Corporation
WACC Weighted Average Cost of Capital. The cost of capital is the expected return on a company’s assets. This can be estimated as a weighted average expected return on all sources of funding (ie: a mix of debt and equity finance)
WTO World Trade Organisation

PricewaterhouseCoopers Global Aerospace and Defense PracticeAt PricewaterhouseCoopers, we combine the outstanding technical skills that you expect from the world’s largest professional services with industry-leading specialists in Aerospace and Defence. Through working with clients around the world and by holding senior posts with the sector’s major companies, our people can help you deal with the challenges of today. And they understand the implications for tomorrow.
Please contact one of the following to find out how we can assist you or to engage in a more general conversation on the contents of this paper:
Global Aerospace & Defence LeaderRichard Hooke, London, UK, Tel: +44 (0) 20 7213 4206
North America Aerospace & Defence LeaderGregg Agens, Phoenix, Arizona, USA, Tel: +1 (602) 364 8290
UK Aerospace & Defence LeaderIan Chambers, London, UK, Tel: +44 (0) 20 7214 4711
France Aerospace & Defence LeaderPierre Chollet, Paris, France, Tel: +33 (0) 1 5 657 1218
Aerospace & Defence Senior AnalystJohnson Imode, London, UK, Tel: +44 (0) 20 7804 0658
Please visit our website at http://pwc.com/aerospaceanddefence

Special thanks to Richard Hooke and Johnson Imode who contributed to the writing and researching of this report and to Anthony White for editorial input and review. Thanks also go to the PwC Aerospace and Defence team who provided feedback and to Chris Schwend, Artemis Zarifopoulos Drueke, Laurie Webelhuth and Michelle Kassmann for their contributions to the design and publication of this document.
PricewaterhouseCoopers (www.pwc.com) provides industry-focused assurance, tax and advisory services for public and private clients. More than 120,000 people in 144 countries connect their thinking, experience and solutions to build public trust and enhance value for clients and their stakeholders.
© 2006 PricewaterhouseCoopers. All rights reserved. PricewaterhouseCoopers refers to the network of member firms of PricewaterhouseCoopers International Limited, each of which is a separate and independent legal entity.CI-ST-06-0234

page 4
www.pwc.com