ciaran phillip directed research thesis defense
TRANSCRIPT

Physical and Chemical
Characterization of Matchsticks
for Forensic Classification and
Commercial Brand
Determination
Ciaran F. A. Phillip

Matchsticks
Three functional classes
i. Safety – purpose built striking surface
ii. Strike anywhere – no purpose built striking surface
iii. Waterproof – water resistant
Many different commercial brand manufacturers
2

Matchstick Forensics
Stereomicroscopy SEM-EDS X-ray Diffraction
Visually
different?
Y/N
Chemically
different?
Y/N
Structurally
different?
Y/N
Qualitative similarity
assessment on Q vs. K
3

Matchstick Forensics
Stereomicroscopy SEM-EDS X-ray Diffraction
Visually
different?
Y/N
Chemically
different?
Y/N
Structurally
different?
Y/N
Qualitative similarity
assessment on Q vs. K
How can we improve
trace evidence analysis?
4

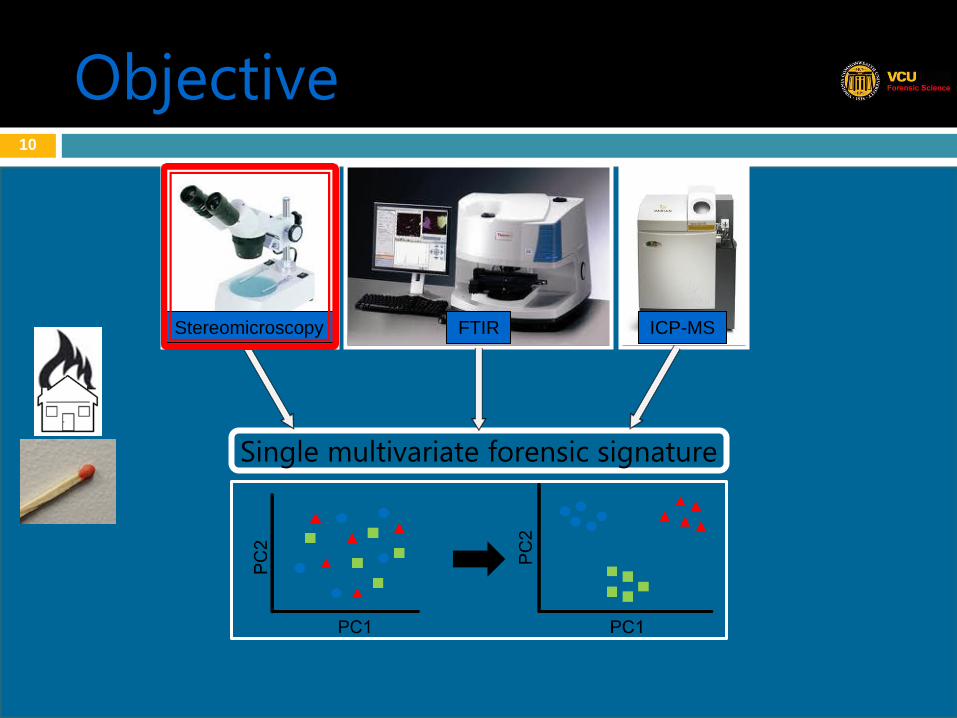
Objective
Single multivariate forensic signature
Stereomicroscopy FTIR ICP-MS
5

Objective
Single multivariate forensic signature
Stereomicroscopy FTIR ICP-MS
Investigative leads Strengthens associations
Functional Class and
Commercial Brand of Q
6

Samples
Four brands of safety match
Four brands of waterproof match
Two brands of strike anywhere match
7
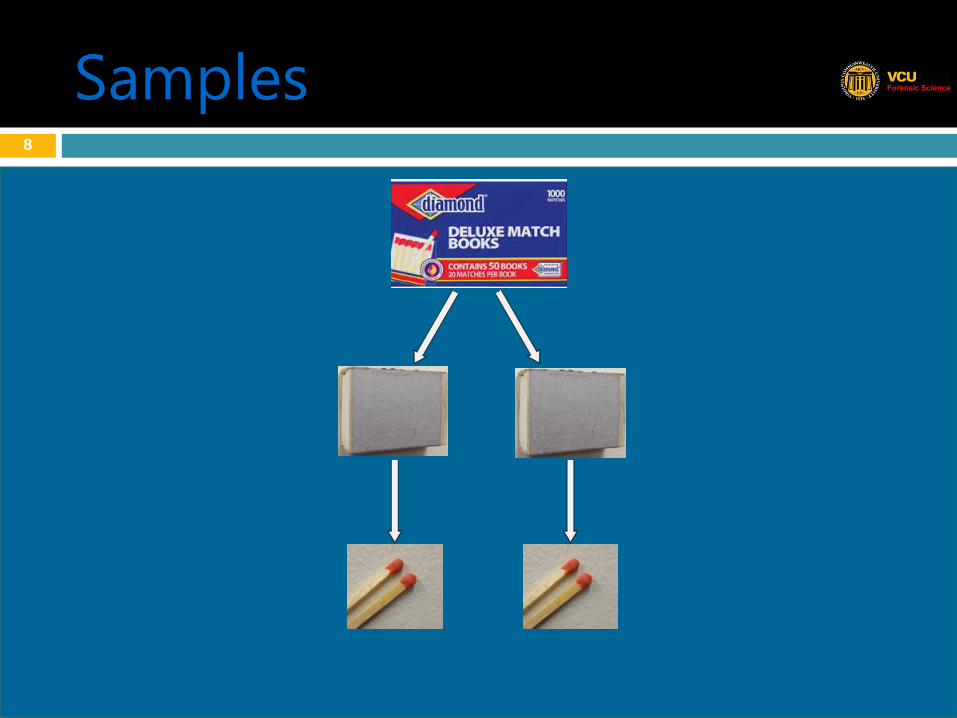
Samples
8

Samples
9
Objective
Single multivariate forensic signature
Stereomicroscopy FTIR ICP-MS
10

Stereomicroscopy
Safety
Diamond SB
Diamond MB
UCO & Fancy Fish
Waterproof
Coleman & Coghlan
REI
Proforce
Strike Anywhere
Redbird
Diamond SA
11

Stereomicroscopy
12

Objective
Single multivariate forensic signature
Stereomicroscopy FTIR ICP-MS
13

FTIR: Safety & Strike Anywhere
Diamond Deluxe Match Books
No polymer binder
1448.02 cm−1: CO32−
950.92 cm−1: PO43−
931.93 cm−1: ClO3−
14

FTIR: Waterproof
Shellac binder
1697.2cm−1: aromatic carbonyl
1454.2cm−1: azo
1375.2cm−1: aromatic C―N
1241.5cm−1: C―O
15

FTIR: Waterproof
Shellac binder
1697.2cm−1: aromatic carbonyl
1454.2cm−1: azo
1375.2cm−1: aromatic C―N
1241.5cm−1: C―O
REI
Alkyd binder
1715.4cm−1: carbonyl
1253.7cm−1: C―H
737.2cm−1: phenyl
16

FTIR: Waterproof
Shellac binder
1697.2cm−1: aromatic carbonyl
1454.2cm−1: azo
1375.2cm−1: aromatic C―N
1241.5cm−1: C―O
REI
Alkyd binder
1715.4cm−1: carbonyl
1253.7cm−1: C―H
737.2cm−1: phenyl
Coghlan &
Coleman
Nitrocellulose binder
1635.5cm−1: NO2
1268.6cm−1: C―N
17

Objective
Single multivariate forensic signature
Stereomicroscopy FTIR ICP-MS
18

ICP-MS Data
ICP-MS Metal Element Concentration Profiling Results [ppb·mg−1]
Brand B11 Mg25 Fe57 Zn (all) Zn70
Coleman 59.0843 138.6581 31.7377 3.4087 0.6359
Coleman 30.8953 90.0515 18.1351 2.0764 0.3827
Coleman 37.9094 98.9309 23.1432 2.3294 0.3956
Coleman 32.7572 95.0507 19.4906 2.3343 0.3967
ICP-MS Metal Element Concentration Profiling Results All Values Standardized by Maximum Value in each Variable
Brand B11 Mg25 Fe57 Zn (all) Zn70 Coleman 100.0000 100.0000 66.5726 1.2271 2.0766 Coleman 52.2902 64.9450 38.0400 0.7475 1.2497 Coleman 64.1615 71.3488 48.5449 0.8386 1.2918 Coleman 55.4415 68.5504 40.8833 0.8403 1.2954
ICP-MS Metal Element Concentration Profiling Results All Values Transformed by LN(X+1)
Brand B11 Mg25 Fe57 Zn (all) Zn70 Coleman 4.6151 4.6151 4.2132 0.8007 1.1238 Coleman 3.9758 4.1888 3.6646 0.5582 0.8108 Coleman 4.1769 4.2815 3.9029 0.6090 0.8294 Coleman 4.0332 4.2421 3.7349 0.6100 0.8309
How do we display this?
19

PCA
Linear combinations of all variables for each axis
Variable 1 = ln(11Bstd+1)
Variable 2 = ln(25Mgstd+1)
Variable 3 = ln(57Festd+1)
Variable 4 = ln(Znstd+1)
Variable 5 = ln(70Znstd+1)
Principal component 1 = cV1PC1(Variable 1)+cV2PC1(Variable 2)……
Principal component 2 = cV1PC2(Variable 1)+cV2PC2(Variable 2)……
Principal component 3 = cV1PC3(Variable 1)+cV2PC3(Variable 2)……
Principal component 4 = cV1PC4(Variable 1)+cV2PC4(Variable 2)……
Principal component 5 = cV1PC5(Variable 1)+cV2PC5(Variable 2)……
20

PCA
Account for maximum variation between samples
PC Percent
Variation Cumulative Percent
Variation
1 55.2 55.2
2 36.6 91.8
3 5.7 97.5
4 2.2 99.8
5 0.2 100.0
21

ICP-MS PCA
22

ICP-MS PCA
23

ANOSIM
PCA emphasises differences between sample groups
Are the emphasised differences statistically significant?
𝑅 =𝑟 𝐵 − 𝑟 𝑊𝑛(𝑛 − 1)/4
Test Statistic R
−1 ≤ R ≤ 1
R→1 Differences between
groups become more significant
24

ANOSIM
ANOSIM R values
W vs. S 0.163
W vs. SA 0.59
S vs. SA 0.171
25

Objective
Single multivariate forensic signature
Stereomicroscopy FTIR ICP-MS
26

Data Pretreatment
Matchstick Multivariate Data Set Incorporating Physical and Chemical Data
Brand B 11
Mg 25
Fe 57
Zn (all)
Zn 70
Binder P/A
NC Binder
Alkyd Binder
Shellac Binder
Head Structure
Paper Splint
REI 0.1 4.0 0.0 1.4 0.2 1 0 1 0 2 0 REI 0.1 3.9 0.0 1.3 0.1 1 0 1 0 2 0 REI 0.1 4.6 0.0 1.3 0.2 1 0 1 0 2 0 REI 0.0 4.2 0.0 1.2 0.1 1 0 1 0 2 0
Matchstick Multivariate Data Set Incorporating Physical and Chemical Data
All Variable Values Standardized by Maximum Value in each Variable
Brand B 11
Mg 25
Fe 57
Zn (all)
Zn 70
Binder P/A
NC Binder
Alkyd Binder
Shellac Binder
Head Structure
Paper Splint
REI 0.1 2.9 0.0 0.5 0.5 100 0 100 0 100 0 REI 0.1 2.8 0.0 0.5 0.5 100 0 100 0 100 0 REI 0.1 3.3 0.0 0.5 0.5 100 0 100 0 100 0 REI 0.1 3.1 0.0 0.4 0.5 100 0 100 0 100 0
Matchstick Multivariate Data Set Incorporating Physical and Chemical Data
All Variable Values Transformed by LN(X+1)
Brand B 11
Mg 25
Fe 57
Zn (all)
Zn 70
Binder P/A
NC Binder
Alkyd Binder
Shellac Binder
Head Structure
Paper Splint
REI 0.1 1.3 0.0 0.4 0.4 4.6 0.0 4.6 0.0 4.6 0 REI 0.1 1.3 0.0 0.4 0.4 4.6 0.0 4.6 0.0 4.6 0 REI 0.1 1.5 0.0 0.4 0.4 4.6 0.0 4.6 0.0 4.6 0 REI 0.1 1.4 0.0 0.4 0.4 4.6 0.0 4.6 0.0 4.6 0
27

Gower dissimilarity measure
Dissimilarity Analysis
|𝑦1𝑗 − 𝑦2𝑗 |
(𝑚𝑎𝑥𝑗 −𝑚𝑖𝑛𝑗 )
𝑝
𝑗=1
Assesses both discrete and
continuous variable
contributions to similarity
between samples
𝑤12𝑗 𝑠12𝑗𝑝𝑗=1
𝑤12𝑗𝑝𝑗=1
28

NMDS
Displays sample relationships in multivariate space
Based on calculated dissimilarities
MDS for metric dissimilarity measure
NMDS for non-metric dissimilarity measure
A B
C
D(A, B) ≥ 0
D(A, B) = 0 ⟷ A=B
D(A, B) = D(B, A)
D(B, C) ≥ [D(A, B) + D(C, A)]
29

Forensic Signature
ANOSIM R values
W vs. S 0.609
W vs. SA 0.981
S vs. SA 0.431
30

Forensic Signature
ANOSIM R values
W vs. S 0.609
W vs. SA 0.981
S vs. SA 0.431
ANOSIM R values
R=1 for all
Commercial Brand
pairwise comparisons
31

Forensic Signature
𝑅 =𝑟 𝐵 − 𝑟 𝑊𝑛(𝑛 − 1)/4
As n increases the robustness of R also increases
32
Summary
Combination of analyses excellent for classification and
brand determination
Multivariate statistical analysis confirms hypothesis
Very visual and intuitive final result
33

Discussion
How do we improve Trace Evidence Analysis?
Matchsticks are a good model
Branching out: fibers, paint, glass
Sufficient sample sizes
Automated statistical methods
34

Acknowledgements
Mr. Chad Schennum – Forensic Scientist1
Mr. Tomson Huynh – FTIR Assistant2
Mr. Spencer Nwogoku – Laboratory Assistant2
Dr. Joseph Turner – Director of Instrumentation2
Mr. Thomas Pugh – Introducing Presenter2
1VA Department of Forensic Science
2Virginia Commonwealth University
35

Questions/Comments 36