cibc whistler conf jan 2015 final
TRANSCRIPT
SOLID PORTFOLIO. SOLID FUTURE.
CIBC 18th Annual Whistler Institutional Investor Conference
Tony Jensen President and CEO January 2015
January 2015 2
Cautionary Statement This presentation contains certain forward‐looking statements within the meaning of the Private Securities Litigation Reform Act of 1995. Such forward‐looking statements involve known and unknown risks, uncertainties, and other factors that could cause actual results to differ materially from the projections and estimates contained herein and include, but are not limited to: production estimates from the operators of the Company’s properties; the ramp‐up and estimated metal recoveries of the Mt. Milligan mine; construction progress at the Phoenix project; development; anticipated growth in the volume of metals subject to the Company’s royalty interests; and statements or estimates regarding projected steady, increasing or decreasing production and estimates of timing of commencement of production from operators of properties where we have royalty interests, including operator estimates. Factors that could cause actual results to differ materially from these forward‐looking statements include, among others: the risks inherent in construction, development and operation of mining properties, including those specific to a new mine being developed and operated by a base metals company; changes in gold, silver, copper, nickel and other metals prices; performance of and production at the Company’s royalty properties; unexpected operating costs; decisions and activities of the Company’s management; decisions and activities of the operators of the Company’s royalty and stream properties; changes in operators’ mining and processing techniques or royalty calculation methodologies; resolution of regulatory and legal proceedings (including with Vale regarding Voisey’s Bay); unanticipated grade, geological, metallurgical, environmental, processing or other problems at the properties; inaccuracies in technical reports and reserve estimates; revisions by operators of reserves, mineralization or production estimates; changes in project parameters as plans of the operators are refined; the results of current or planned exploration activities; discontinuance of exploration activities by operators; economic and market conditions; operations on lands that are or may be subject to aboriginal interests; the ability of operators to bring non‐producing and not‐yet‐in development projects into production and operate in accordance with feasibility studies; challenges to the Company’s royalty interests, or title and other defects in the Company’s royalty properties; errors or disputes in calculating royalty payments, or payments not made in accordance with royalty agreements; future financial needs of the Company; the impact of future acquisitions and royalty and streaming financing transactions; adverse changes in applicable laws and regulations; litigation; and risks associated with conducting business in foreign countries, including application of foreign laws to contract and other disputes, environmental laws, enforcement and uncertain political and economic environments. These risks and other factors are discussed in more detail in the Company’s public filings with the Securities and Exchange Commission. Statements made herein are as of the date hereof and should not be relied upon as of any subsequent date. The Company’s past performance is not necessarily indicative of its future performance. The Company disclaims any obligation to update any forward‐looking statements. The Company and its affiliates, agents, directors and employees accept no liability whatsoever for any loss or damage of any kind arising out of the use of all or any part of this material. Endnotes located on page 13.
3
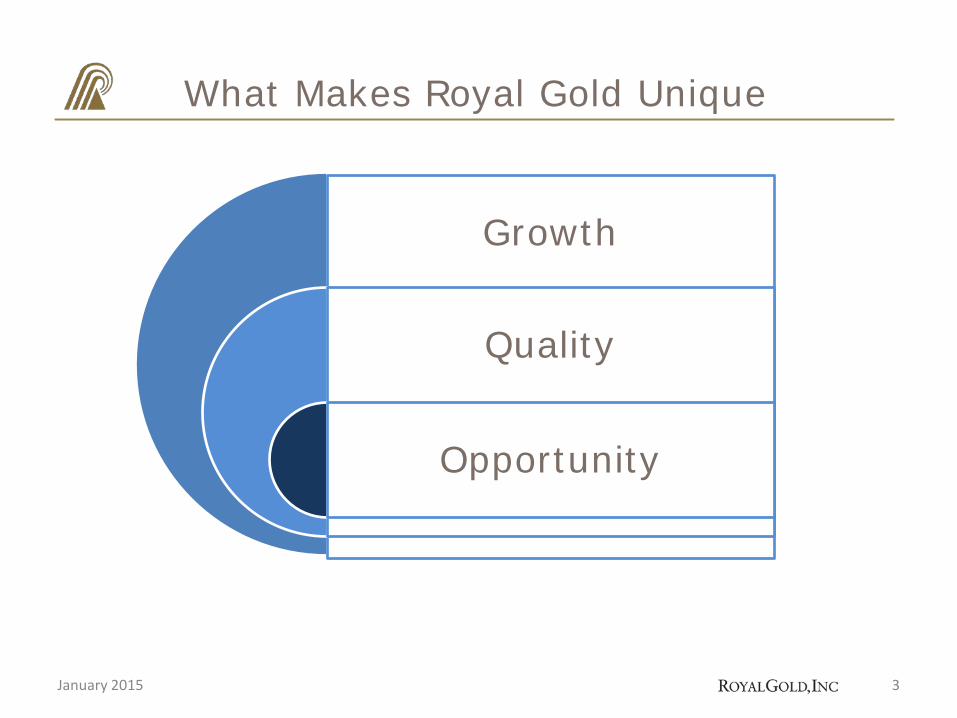
What Makes Royal Gold Unique
January 2015
Growth
Quality
Opportunity
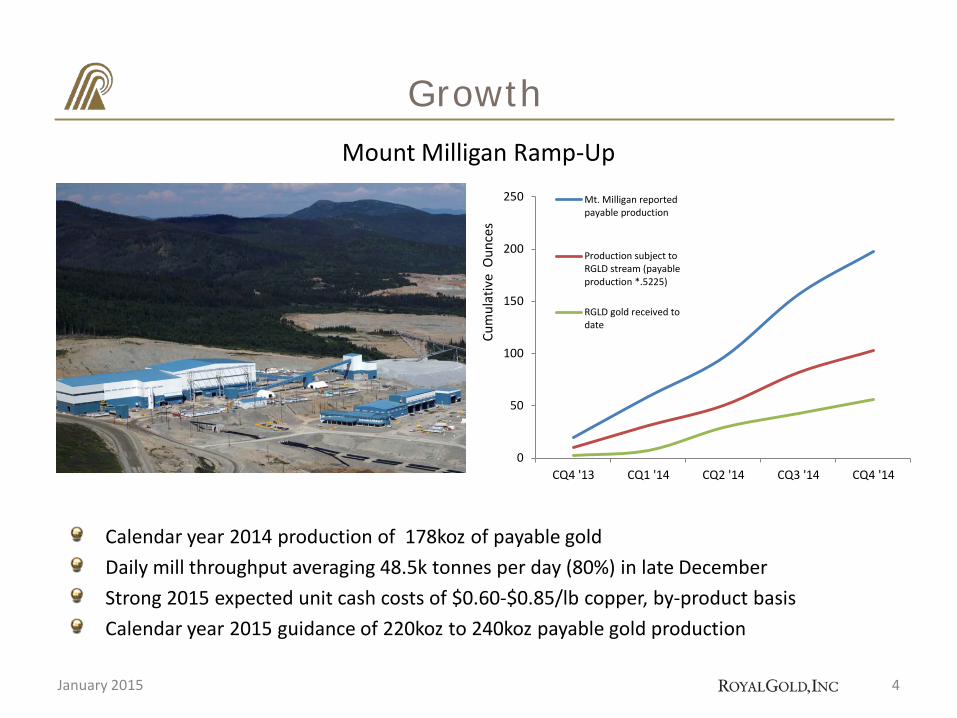
Calendar year 2014 production of 178koz of payable gold Daily mill throughput averaging 48.5k tonnes per day (80%) in late December Strong 2015 expected unit cash costs of $0.60‐$0.85/lb copper, by‐product basis Calendar year 2015 guidance of 220koz to 240koz payable gold production
4
Growth
January 2015
0
50
100
150
200
250
CQ4 '13 CQ1 '14 CQ2 '14 CQ3 '14 CQ4 '14
Mt. Milligan reportedpayable production
Production subject toRGLD stream (payableproduction *.5225)
RGLD gold received todate
Cum
ulat
ive
Oun
ces
Mount Milligan Ramp‐Up
5
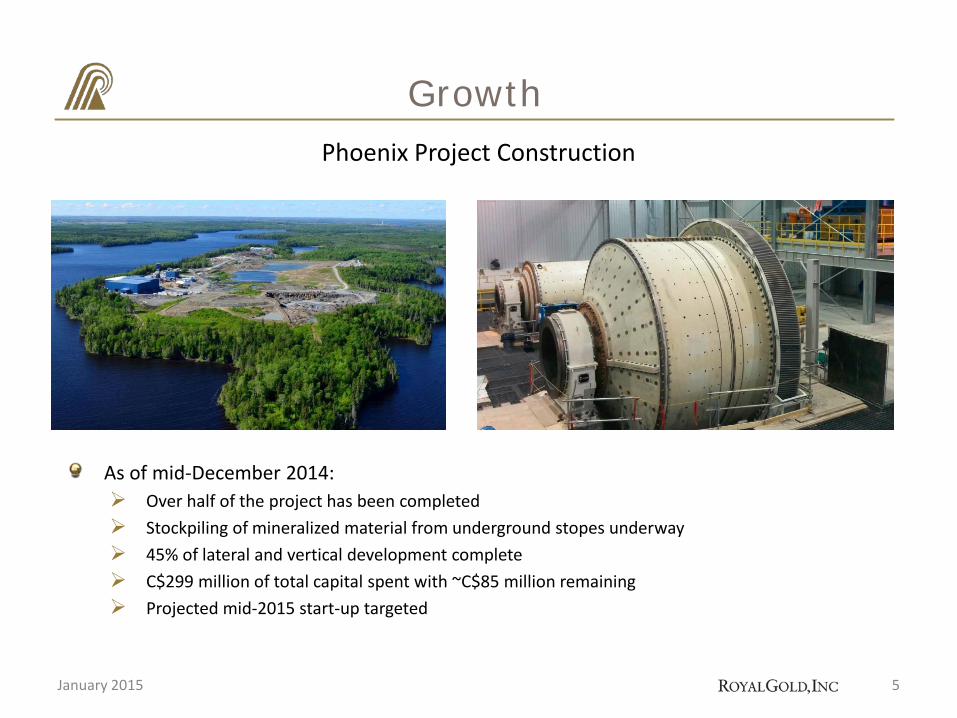
Growth
As of mid‐December 2014: Over half of the project has been completed Stockpiling of mineralized material from underground stopes underway 45% of lateral and vertical development complete C$299 million of total capital spent with ~C$85 million remaining Projected mid‐2015 start‐up targeted
Rubicon Minerals’ photo of Phoenix Project, Summer 2014
January 2015
Rubicon Minerals’ photo of SAG and Ball mill, December 2014
Phoenix Project Construction
6
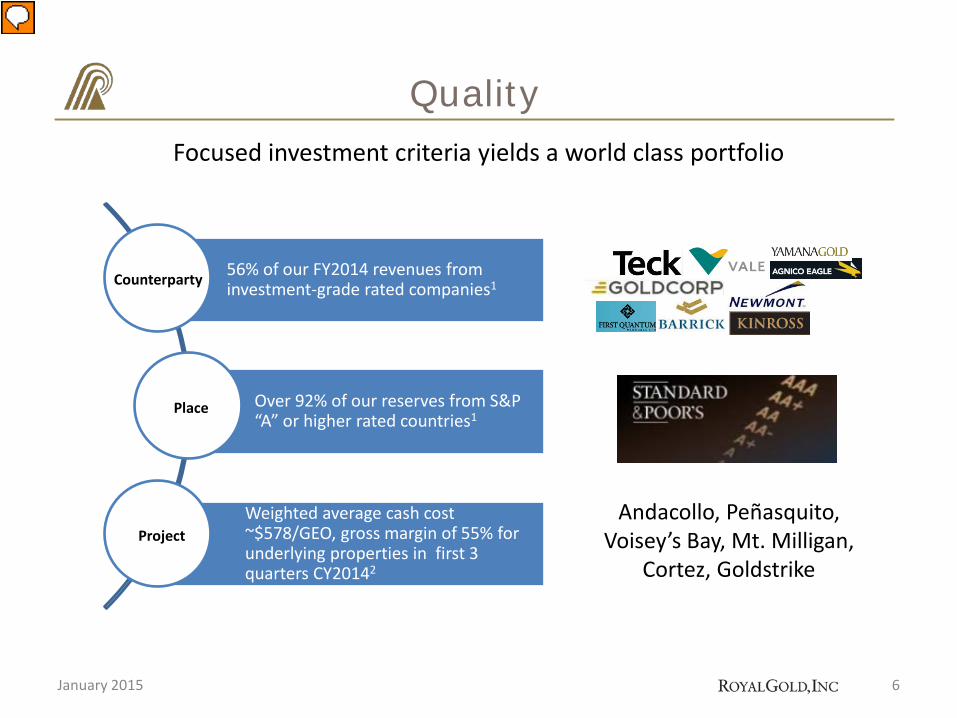
Quality
56% of our FY2014 revenues from investment‐grade rated companies1 Counterparty
Over 92% of our reserves from S&P “A” or higher rated countries1
Place
Weighted average cash cost ~$578/GEO, gross margin of 55% for underlying properties in first 3 quarters CY20142
Project
Focused investment criteria yields a world class portfolio
Andacollo, Peñasquito, Voisey’s Bay, Mt. Milligan,
Cortez, Goldstrike
January 2015
0%
10%
20%
30%
40%
50%
60%
70%
80%
90%
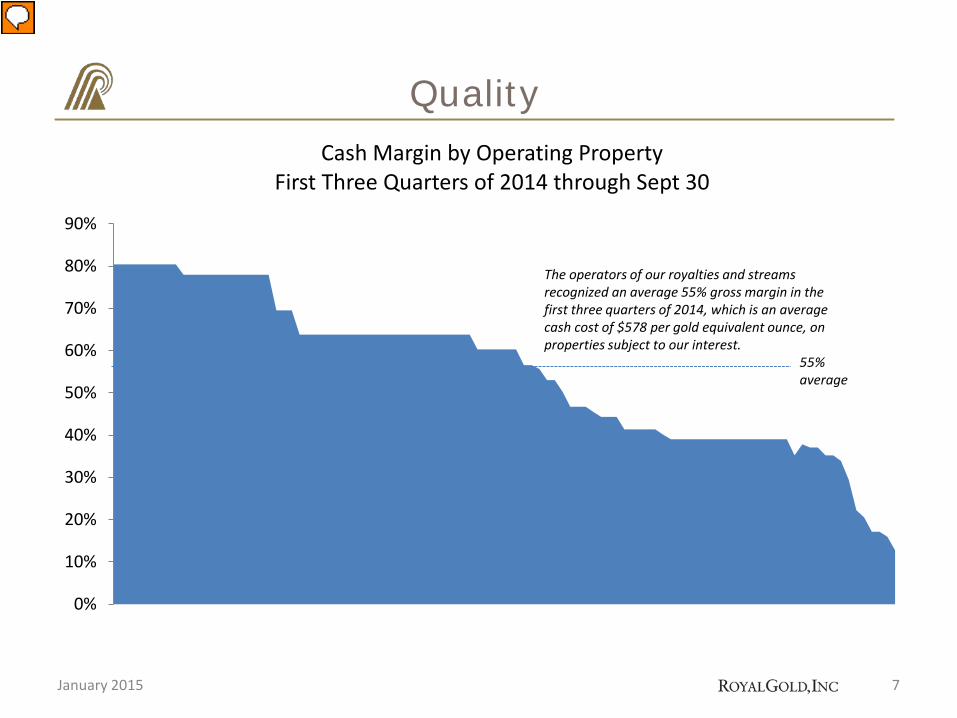
Cash Margin by Operating Property First Three Quarters of 2014 through Sept 30
7
Quality
The operators of our royalties and streams recognized an average 55% gross margin in the first three quarters of 2014, which is an average cash cost of $578 per gold equivalent ounce, on properties subject to our interest.
55% average
January 2015
8
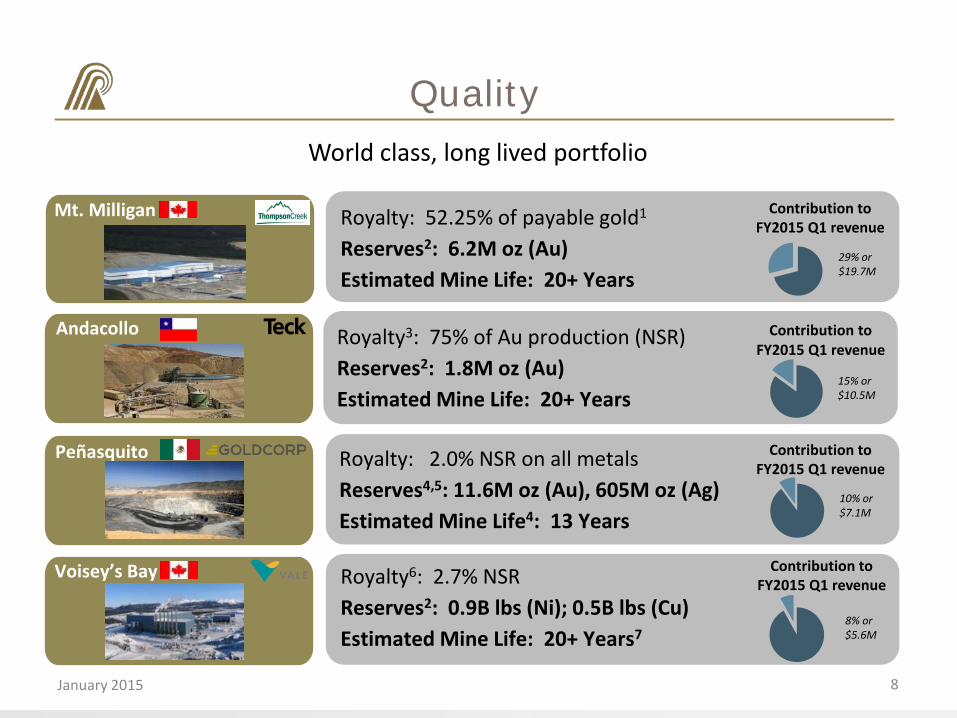
Royalty: 2.0% NSR on all metals Reserves4,5: 11.6M oz (Au), 605M oz (Ag) Estimated Mine Life4: 13 Years
Royalty3: 75% of Au production (NSR) Reserves2: 1.8M oz (Au) Estimated Mine Life: 20+ Years
Andacollo
15% or $10.5M
Contribution to FY2015 Q1 revenue
Peñasquito
10% or $7.1M
Contribution to FY2015 Q1 revenue
Voisey’s Bay
8% or $5.6M
Mt. Milligan Contribution to FY2015 Q1 revenue
29% or $19.7M
World class, long lived portfolio
Royalty6: 2.7% NSR Reserves2: 0.9B lbs (Ni); 0.5B lbs (Cu) Estimated Mine Life: 20+ Years7
Royalty: 52.25% of payable gold1
Reserves2: 6.2M oz (Au) Estimated Mine Life: 20+ Years
Contribution to FY2015 Q1 revenue
Quality
January 2015
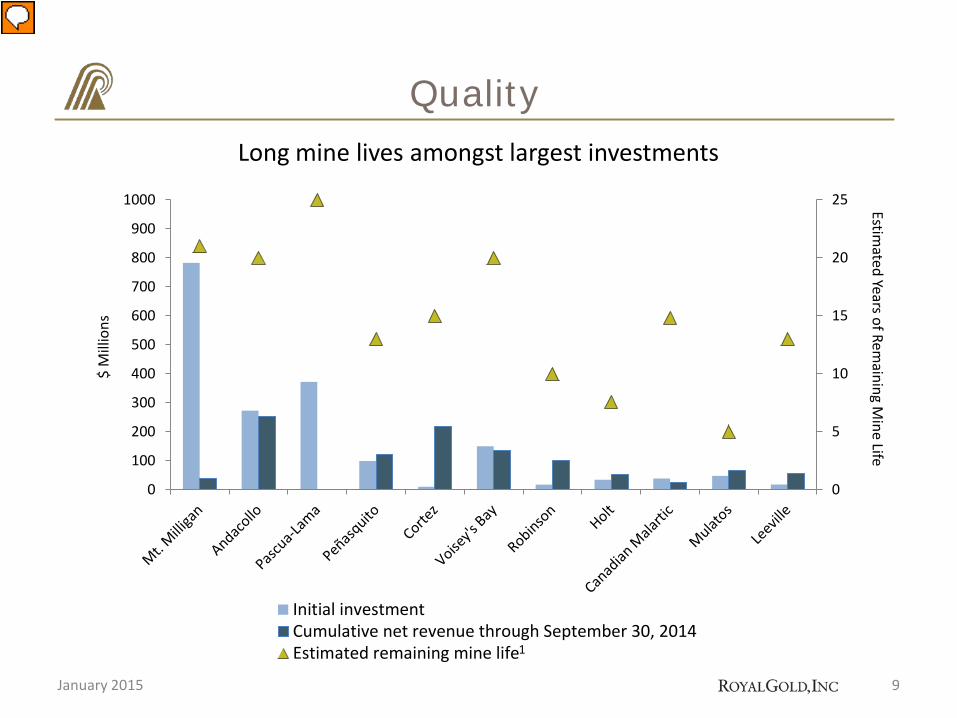
0
5
10
15
20
25
0
100
200
300
400
500
600
700
800
900
1000
$ M
illio
ns
Initial investmentCumulative net revenue through September 30, 2014Estimated remaining mine life
9
Quality Long mine lives amongst largest investments
Estimated Years of Rem
aining Mine Life
January 2015
1
10
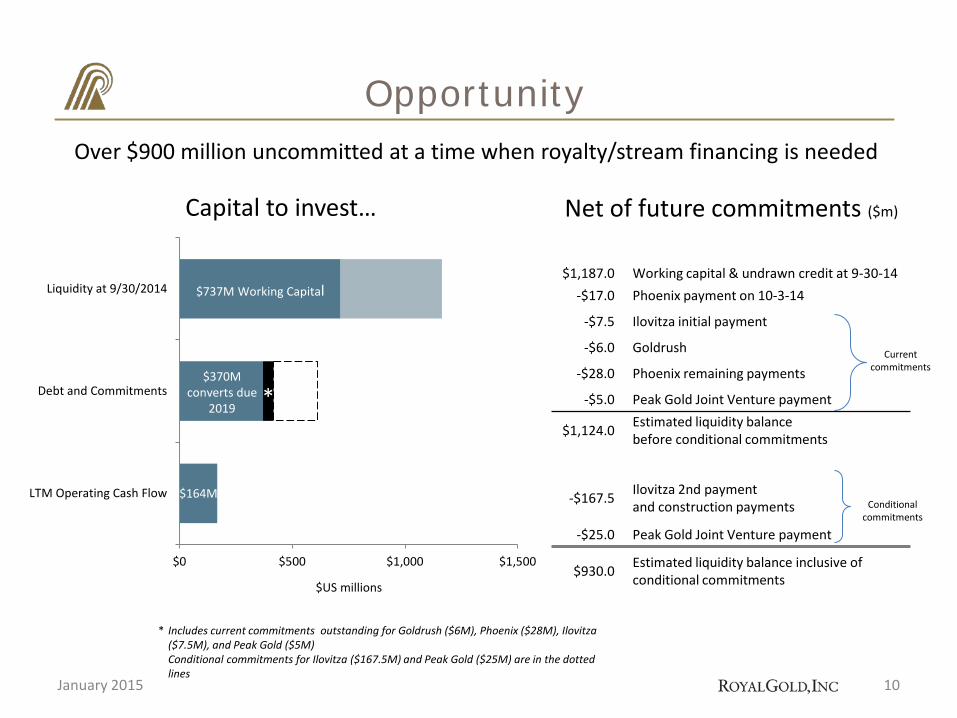
Capital to invest…
Over $900 million uncommitted at a time when royalty/stream financing is needed
* Includes current commitments outstanding for Goldrush ($6M), Phoenix ($28M), Ilovitza ($7.5M), and Peak Gold ($5M)
Conditional commitments for Ilovitza ($167.5M) and Peak Gold ($25M) are in the dotted lines
$US millions
$450M Undrawn Credit
$1,187.0 Working capital & undrawn credit at 9‐30‐14 ‐$17.0 Phoenix payment on 10‐3‐14
‐$7.5 Ilovitza initial payment
‐$6.0 Goldrush
‐$28.0 Phoenix remaining payments
‐$5.0 Peak Gold Joint Venture payment
$1,124.0 Estimated liquidity balance before conditional commitments
‐$167.5 Ilovitza 2nd payment and construction payments
‐$25.0 Peak Gold Joint Venture payment
$930.0 Estimated liquidity balance inclusive of conditional commitments
Net of future commitments ($m)
Current commitments
Conditional commitments
$0 $500 $1,000 $1,500
Liquidity at 9/30/2014
Debt and Commitments
LTM Operating Cash Flow $164M
$370M converts due
2019 *
$737M Working Capital
Opportunity
January 2015

11
What Makes Royal Gold Unique
January 2015
Growth
Quality
Opportunity
SOLID PORTFOLIO. SOLID FUTURE.
Endnotes

PAGE 6 QUALITY 1. Source is S&P CapitaliQ September 10, 2014 for credit ratings and sovereign ratings. 2. Gross margin calculated by subtracting the operators’ reported operating cost per unit of production from the relevant metals’ average price per unit during the first three calendar quarters of 2014. Only operators reporting operating costs are included. PAGE 8 QUALITY 1. This is a metal stream whereby the purchase price for gold ounces delivered is $435 per ounce, or the prevailing market price of gold, if lower; no inflation
adjustment. 2. Updated proven and probable reserves reported by Thompson Creek Metals on January 19, 2015. Thompson Creek reported that its Qualified Person, Robert
Clifford verified the data disclosed in their news release that pertain to the mineral reserve estimates. Royal Gold has not seen or reviewed the anticipated updated technical report.
3. 75% of payable gold until 910,000 payable ounces; 50% thereafter. There have been approximately 228,000 cumulative payable ounces produced as of September 30, 2014. Gold is produced as a by‐product of copper.
4. Updated reserves and mine life per Goldcorp’s technical report dated January 8, 2014. 5. Reserves also include 3.7 billion pounds of lead and 9.0 billion pounds of zinc. 6. Vale is commissioning its new Long Harbour Processing Plant with nickel matte from its Indonesian operations and intends to begin introducing nickel
concentrates from Voisey’s Bay in coming quarters. In anticipation of the transition from processing Voisey’s Bay nickel concentrates at Vale’s Sudbury and Thompson smelters to processing at the Long Harbour hydrometallurgical plant, the Company has engaged in discussions with Vale concerning calculation of the royalty once Voisey’s Bay nickel concentrates are processed at Long Harbour. Vale proposed a calculation of the royalty that the Company estimates could result in the substantial reduction of royalty payable to the Company on Voisey’s Bay nickel concentrates processed at Long Harbour. While the Company may continue to engage in discussions concerning calculation of the royalty on nickel concentrates processed at Long Harbour, there is no guaranty that the Company and Vale will reach agreement on the proper calculation under the terms of the royalty agreement. If no agreement is reached, the Company intends to vigorously pursue all legal remedies to ensure the appropriate calculation of the royalty and to enforce our royalty interests at Voisey’s Bay. For further information, see Royal Gold’s Annual Report on Form 10‐K, filed with the Securities and Exchange Commission on August 7, 2014.
7. Per BoAML 2008 Vale Inco EIS. PAGE 9 QUALITY 1. Royal Gold’s royalty on the Mulatos mine is capped at 2 million ounces, remaining mine life reflects estimated mine life until the cap is reached.
13
Endnotes Many of the matters in these endnotes and the accompanying slides constitute forward looking statements and are subject to numerous risks, which could cause actual results to differ. See complete Cautionary Statement on page 2.
January 2015
SOLID PORTFOLIO. SOLID FUTURE.
Appendix A Background
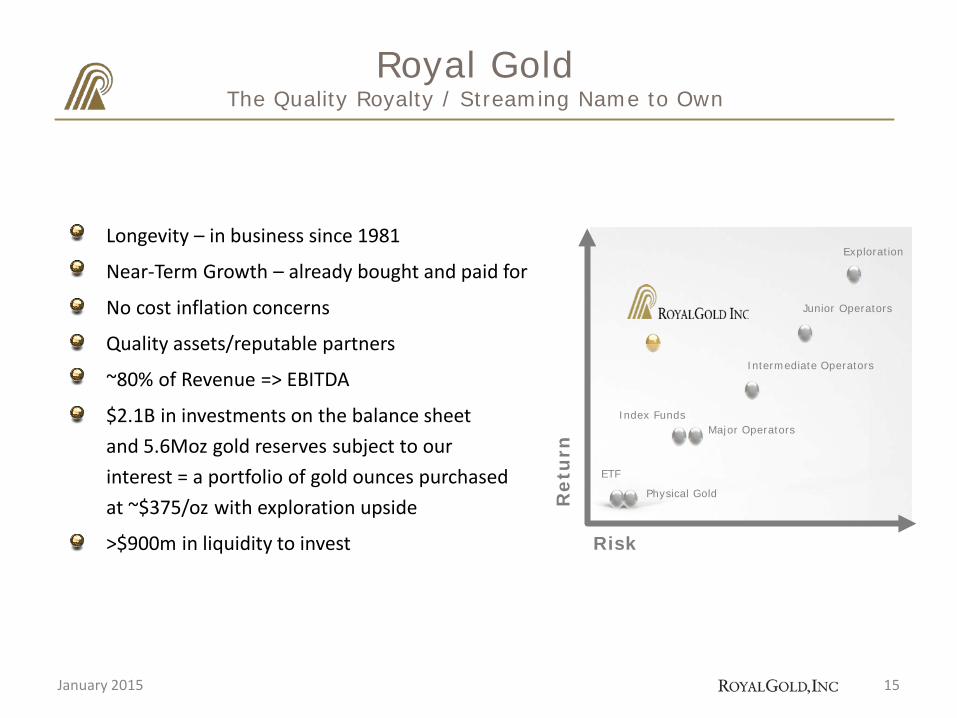
Longevity – in business since 1981
Near‐Term Growth – already bought and paid for
No cost inflation concerns
Quality assets/reputable partners
~80% of Revenue => EBITDA
$2.1B in investments on the balance sheet and 5.6Moz gold reserves subject to our interest = a portfolio of gold ounces purchased at ~$375/oz with exploration upside
>$900m in liquidity to invest
15
Royal Gold The Quality Royalty / Streaming Name to Own
Risk
Ret
urn
ETF
Physical Gold
Index Funds Major Operators
Intermediate Operators
Exploration
Junior Operators
January 2015
16
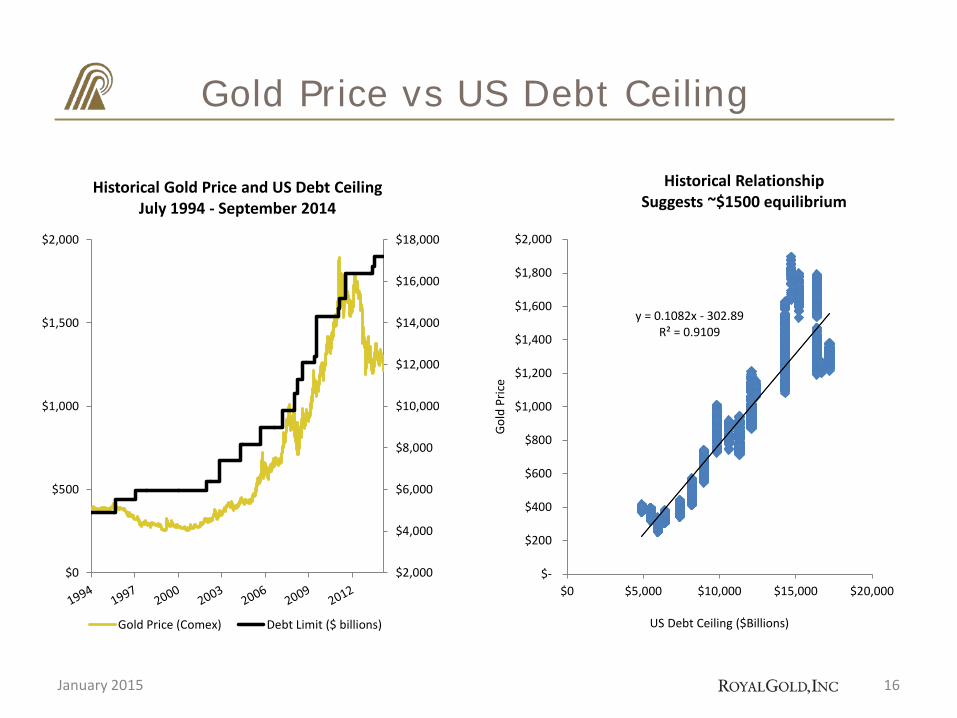
Gold Price vs US Debt Ceiling
$2,000
$4,000
$6,000
$8,000
$10,000
$12,000
$14,000
$16,000
$18,000
$0
$500
$1,000
$1,500
$2,000
Historical Gold Price and US Debt Ceiling July 1994 - September 2014
Gold Price (Comex) Debt Limit ($ billions)
y = 0.1082x ‐ 302.89 R² = 0.9109
$‐
$200
$400
$600
$800
$1,000
$1,200
$1,400
$1,600
$1,800
$2,000
$0 $5,000 $10,000 $15,000 $20,000
Gold
Pric
e
US Debt Ceiling ($Billions)
Historical Relationship Suggests ~$1500 equilibrium
January 2015
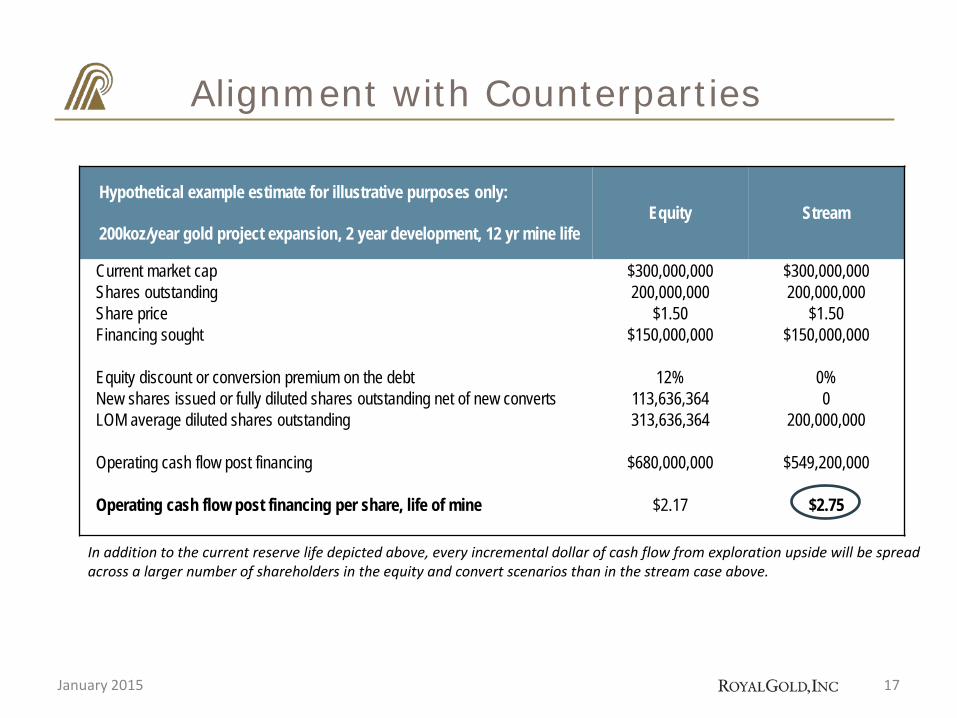
In addition to the current reserve life depicted above, every incremental dollar of cash flow from exploration upside will be spread across a larger number of shareholders in the equity and convert scenarios than in the stream case above.
17
Alignment with Counterparties
Hypothetical example estimate for illustrative purposes only: 200koz/year gold project expansion, 2 year development, 12 yr mine life
Equity Stream
Current market cap $300,000,000 $300,000,000 Shares outstanding 200,000,000 200,000,000 Share price $1.50 $1.50 Financing sought $150,000,000 $150,000,000 Equity discount or conversion premium on the debt 12% 0% New shares issued or fully diluted shares outstanding net of new converts 113,636,364 0 LOM average diluted shares outstanding 313,636,364 200,000,000 Operating cash flow post financing $680,000,000 $549,200,000
Operating cash flow post financing per share, life of mine $2.17 $2.75
January 2015
18
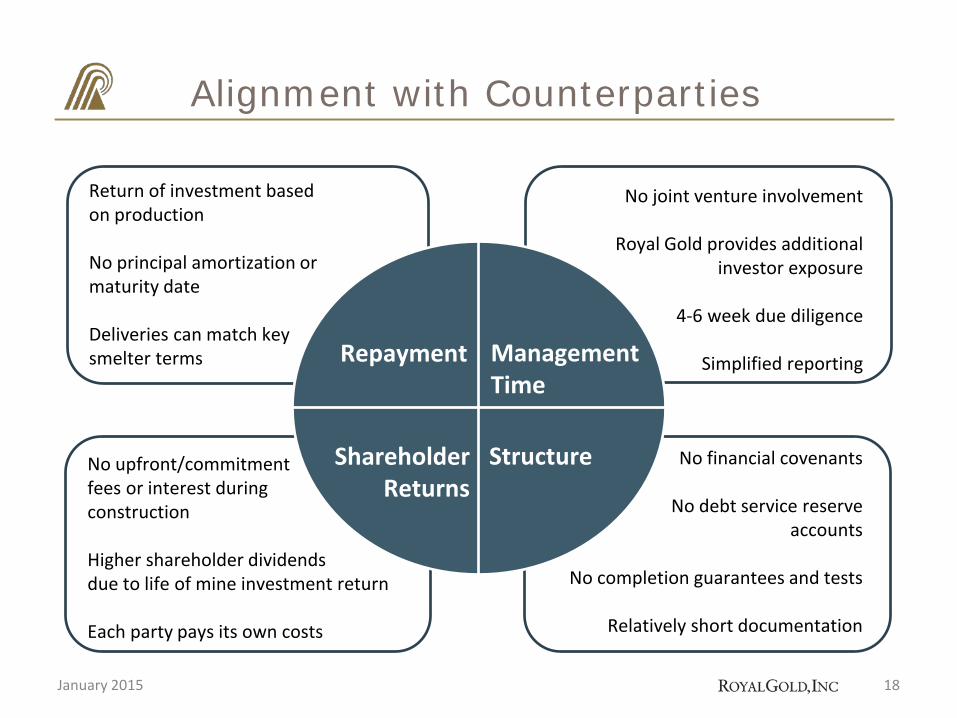
Alignment with Counterparties
Repayment Management Time
Structure Shareholder Returns
Repayment Management Time
Structure Shareholder Returns
Return of investment based on production No principal amortization or maturity date Deliveries can match key smelter terms
No upfront/commitment fees or interest during construction Higher shareholder dividends due to life of mine investment return Each party pays its own costs
No joint venture involvement
Royal Gold provides additional investor exposure
4‐6 week due diligence
Simplified reporting
No financial covenants
No debt service reserve accounts
No completion guarantees and tests
Relatively short documentation
January 2015
19
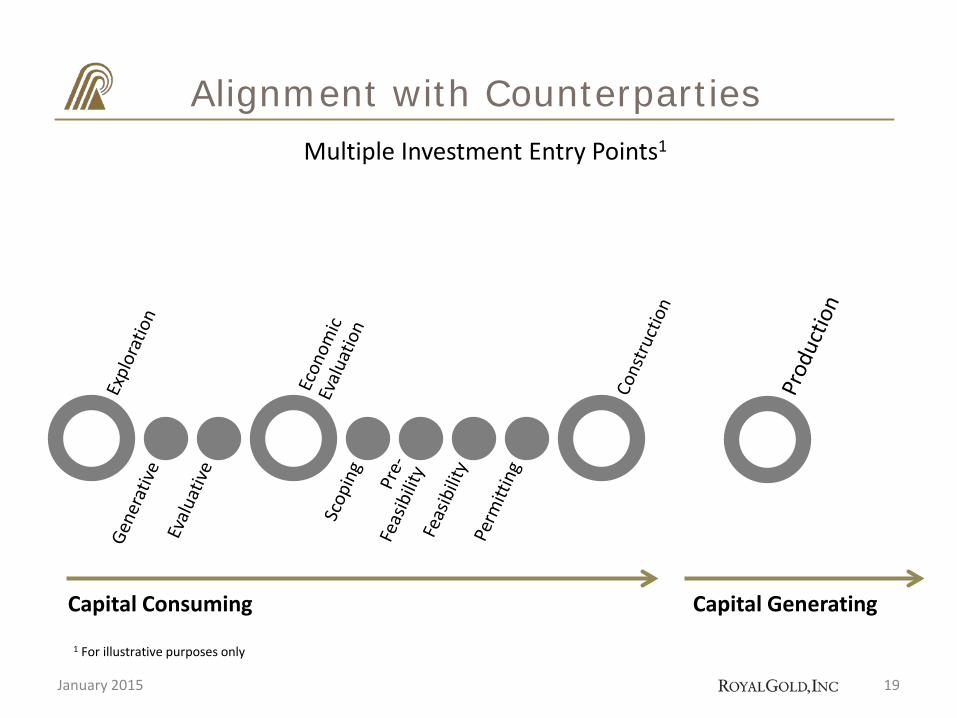
Alignment with Counterparties
Capital Consuming Capital Generating
Multiple Investment Entry Points1
1 For illustrative purposes only
January 2015
SOLID PORTFOLIO. SOLID FUTURE.
Appendix B: Property Portfolio
21
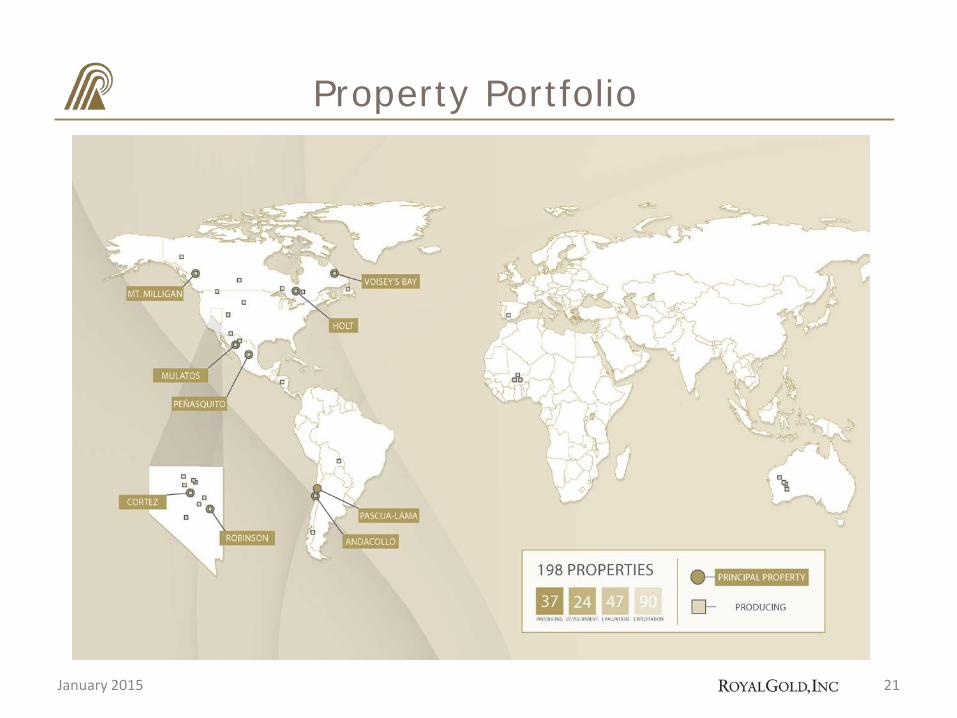
Property Portfolio
January 2015
1660 Wynkoop Street, #1000 Denver, CO 80202‐1132
303.573.1660 [email protected] www.royalgold.com
SOLID PORTFOLIO. SOLID FUTURE.